
Abstract
This review set out to identify data sets for airborne chemical pollutants measured in domestic dwellings within European Union (EU) countries from the literature published during 1995–2010. A total of 74 papers satisfied inclusion criteria, and from those papers data on country location, population sampled, sampling period, number of samples and summary statistics of concentrations measured were gathered. The chemical substances identified and included were grouped to aldehydes, radon, carbon dioxide (CO2), carbon monoxide (CO), nicotine, nitrogen dioxide (NO2), polycyclic aromatic hydrocarbons, volatile organic compounds and brominated flame retardants. The review showed that the availability of data between the EU countries is varying and more measured data are available for countries in northern Europe than in the southern parts. This review is part of the Integrated Exposure for Risk Assessment in Indoor Environments project which developed a full-chain modelling platform, incorporating tools and databases for indoor chemical source release, exposure and risk assessment with the ultimate aim of estimating the health impact of chemical exposures in the indoor environment.
Introduction
Exposure to chemicals at the indoor environments has a large contribution to people’s personal exposure given that people in developed economies tend to spend approximately 80–90% of their time within indoor spaces. 1 World Health Organization has recognized the importance of exposures in indoor environments by producing the guidelines for indoor air quality (IAQ) on the basis of the health effects associated to the exposures of various pollutants. 2 The health effects from indoor exposure are wide, ranging from local effects such as lung cancer from exposure to second-hand tobacco smoke, 3 through systemic effects such as generational reproductive effects from exposure to possible endocrine disrupting chemicals such as polybrominated diphenyl ethers (PBDEs). The routes of exposure include inhalation of contaminated air, skin contact with contaminated surfaces or ingestion of contaminated household dust. 4 Scientific interest in exposure to household pollutants has generated a substantial body of data on concentrations of many chemicals in a number of exposure compartments but there is a real need for an integrated framework to enable risk assessments to be made covering the full chain of chemical exposure from source to potential health effect. The Integrated Exposure for Risk Assessment in Indoor Environments (INTERA) project funded by the Long-range Research Initiative of the European Chemical Industry body seeks to establish such a framework.
This paper provides a review of published scientific data (from the period 1995 to 2010, the 1995 cut-off year defined by the ageing of the measured data and technical restrictions to access the journals) collated as part of the INTERA project and relates to chemical air pollutant concentrations in residential settings within the European Union (EU). Exposures to chemical pollutants will also be experienced in other indoor spaces including workplaces, schools, shopping malls, etc. but we have chosen to limit the scope of this review to home-life settings, because the exposures in home environments cover roughly two-thirds of the total exposures in indoor environments making it the most important single contributor. 5 In addition, the most vulnerable groups, i.e. children and elderly, usually spend even more of their time in home environments than people in general, making the domestic environments even more important contributor on their total exposure. Similarly we acknowledge that exposures will span the three main routes of inhalation, dermal and ingestion but this paper presents only the data we have collected relating to air pollutant levels and the inhalation exposure route. This review was targeted on peer-reviewed scientific journal articles and did not consider the ‘grey literature’ including various national reports. The spatial coverage of the review was defined by the general objectives of the INTERA project focusing on indoor exposures in European environments.
The main objective was to collect concentration data that can be used for exposure assessment as part of the risk assessment of chemicals in indoor environments. The further use of the collected information was taken into account by creating an online database, which was then linked with an online calculation tool providing means to evaluate exposures as internal doses. Use of the modelling tool and part of the collected concentration data were tested within the INTERA project in three case studies producing Europe wide exposure estimations (results not reported here).
Methods
Search strategy of literature on indoor air pollutant concentrations
The MEDLINE online database was searched via the Ovid system for studies published in the English language from 1995 through to September 2010. The search terms ‘Indoor air pollution’, ‘Homes’, ‘Houses’, ‘Dwellings’, ‘Domestic’ and ‘Determinants’ were used singularly and in combination with each other.
Our literature search identified and screened 217 publication titles. The inclusion criteria for a publication to be reviewed were defined as follows: (1) study done in a member country of EU in 2010, (2) actual monitoring (i.e. measured) data provided and (3) data provided for domestic indoor environments. The 161 publications that satisfied these were separated into three broad categories: 74 in ‘chemical’, 15 in ‘particulates’ and 72 in ‘biological’. The 87 identified publications classified as examining either biological or solely particulate exposure data (without chemical characterization of the particulate matter) were not included in the literature review. Thus, the review presented herein is based on the 74 publications addressing chemical exposure in the indoor environment. The following information was extracted on the review process: year of publication, country where the measurements were taken, study population, sample size/number of measurements, duration of the measurement, the type of domestic environment measured and any reported summary statistics of the concentrations of the air pollutant(s) measured.
Risk assessment methodology
On the basis of the concentration values collated through the literature review an integrated exposure assessment and risk characterization for the key chemicals identified in the indoor environment in homes in Europe was undertaken. The methodology followed is given below:
Exposure
The primary step of risk characterization process was the determination of exposure. Personal exposure is equal to the average concentration of a pollutant that a person is exposed to over a given period of time, e.g. 1 day, 1 month or 1 year. If over the given period of time,
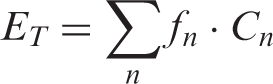
Different household microenvironments (kitchen, living rooms, bedrooms) were treated in different ways in terms of time spent within them. Time-weighted factors, based on the time-activity data of the EXPOLIS study enhanced with data from the Multinational Time Use Study (MTUS) database, were used. 7 The exposure factors used were cross-checked against the European Commission’s EXPOFACTS database. 8 Thus, to estimate exposure, we used information on actual detailed time activity patterns, linking the several types of activities and the respective duration, to specific indoor microenvironments. 9
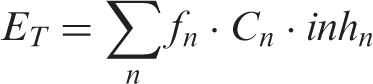
By using detailed activity patterns and linking them to specific microenvironments, we incorporate in our methodology an additional factor influencing the exposure-effect continuum, which is inhalation rate. Different types of activities demand different levels of effort, corresponding to different inhalation rates. For this purpose, based on the time-weighted contribution of the activities, the level of intensity and the corresponding inhalation rate, we derived adjustment factors for each activity performed in the respective location. As a result, exposure is given by the following formula
Risk
The selected compounds were divided in two sub-categories depending on whether they were considered carcinogens or not. Carcinogens comprised radon, benzene, formaldehyde, acetaldehyde and naphthalene; CO, NO2, toluene and xylenes are non-carcinogenic. However, for formaldehyde also non-cancer effects were taken into account.
The relevant metric used for assessing the risk posed by the carcinogenic compounds was the estimated lifetime cancer risk (

For the non-carcinogenic compounds, risk characterization was based on the
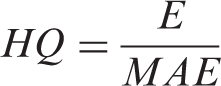
The
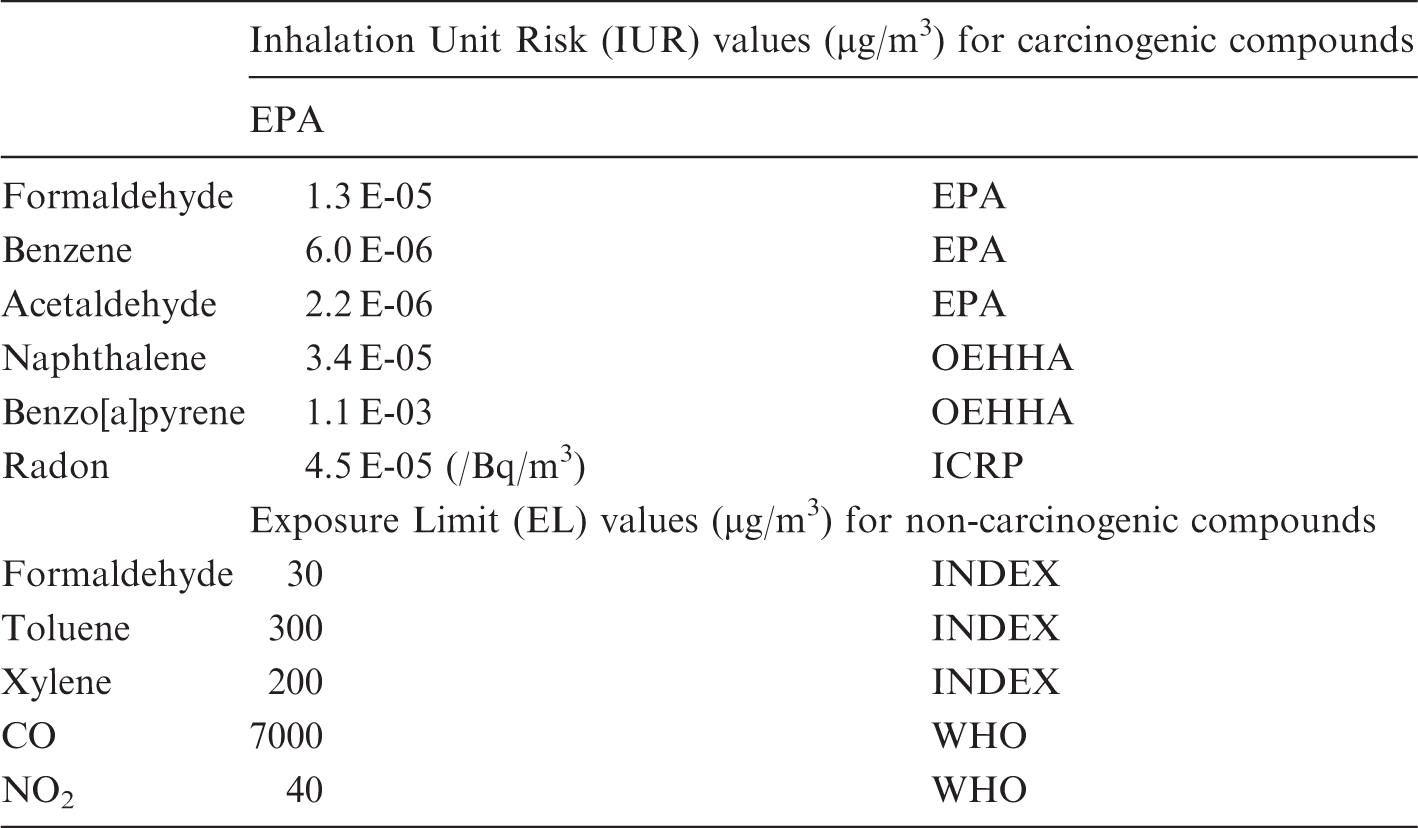
Inhalation unit risk and exposure limit values.
Risk characterization for each compound including all countries are presented in the sphere plots (Figures 1 to 11), where the horizontal axis describes the average exposure at country level, the vertical axis provides the relevant risk assessment metric and the size of the sphere represents the potential health impact as the product of the estimated risk multiplied by each country population. This gives a rapid, hence comprehensive overview of the relative risk due to the specific airborne indoor air chemicals in the different EU countries. For compounds such as naphthalene, xylenes and toluene, where no sufficient data were available, the database was enlarged by data retrieved from the extensive review of Sarigiannis et al.
12
Risk characterization for the mixtures of BFRs and phthalates was not carried out, because additional exposure pathways (dermal and non-dietary ingestion) and mixture assessment methodologies
13
were needed, far beyond the scope of this paper.
Indoor radon concentrations and the associated lung cancer risks.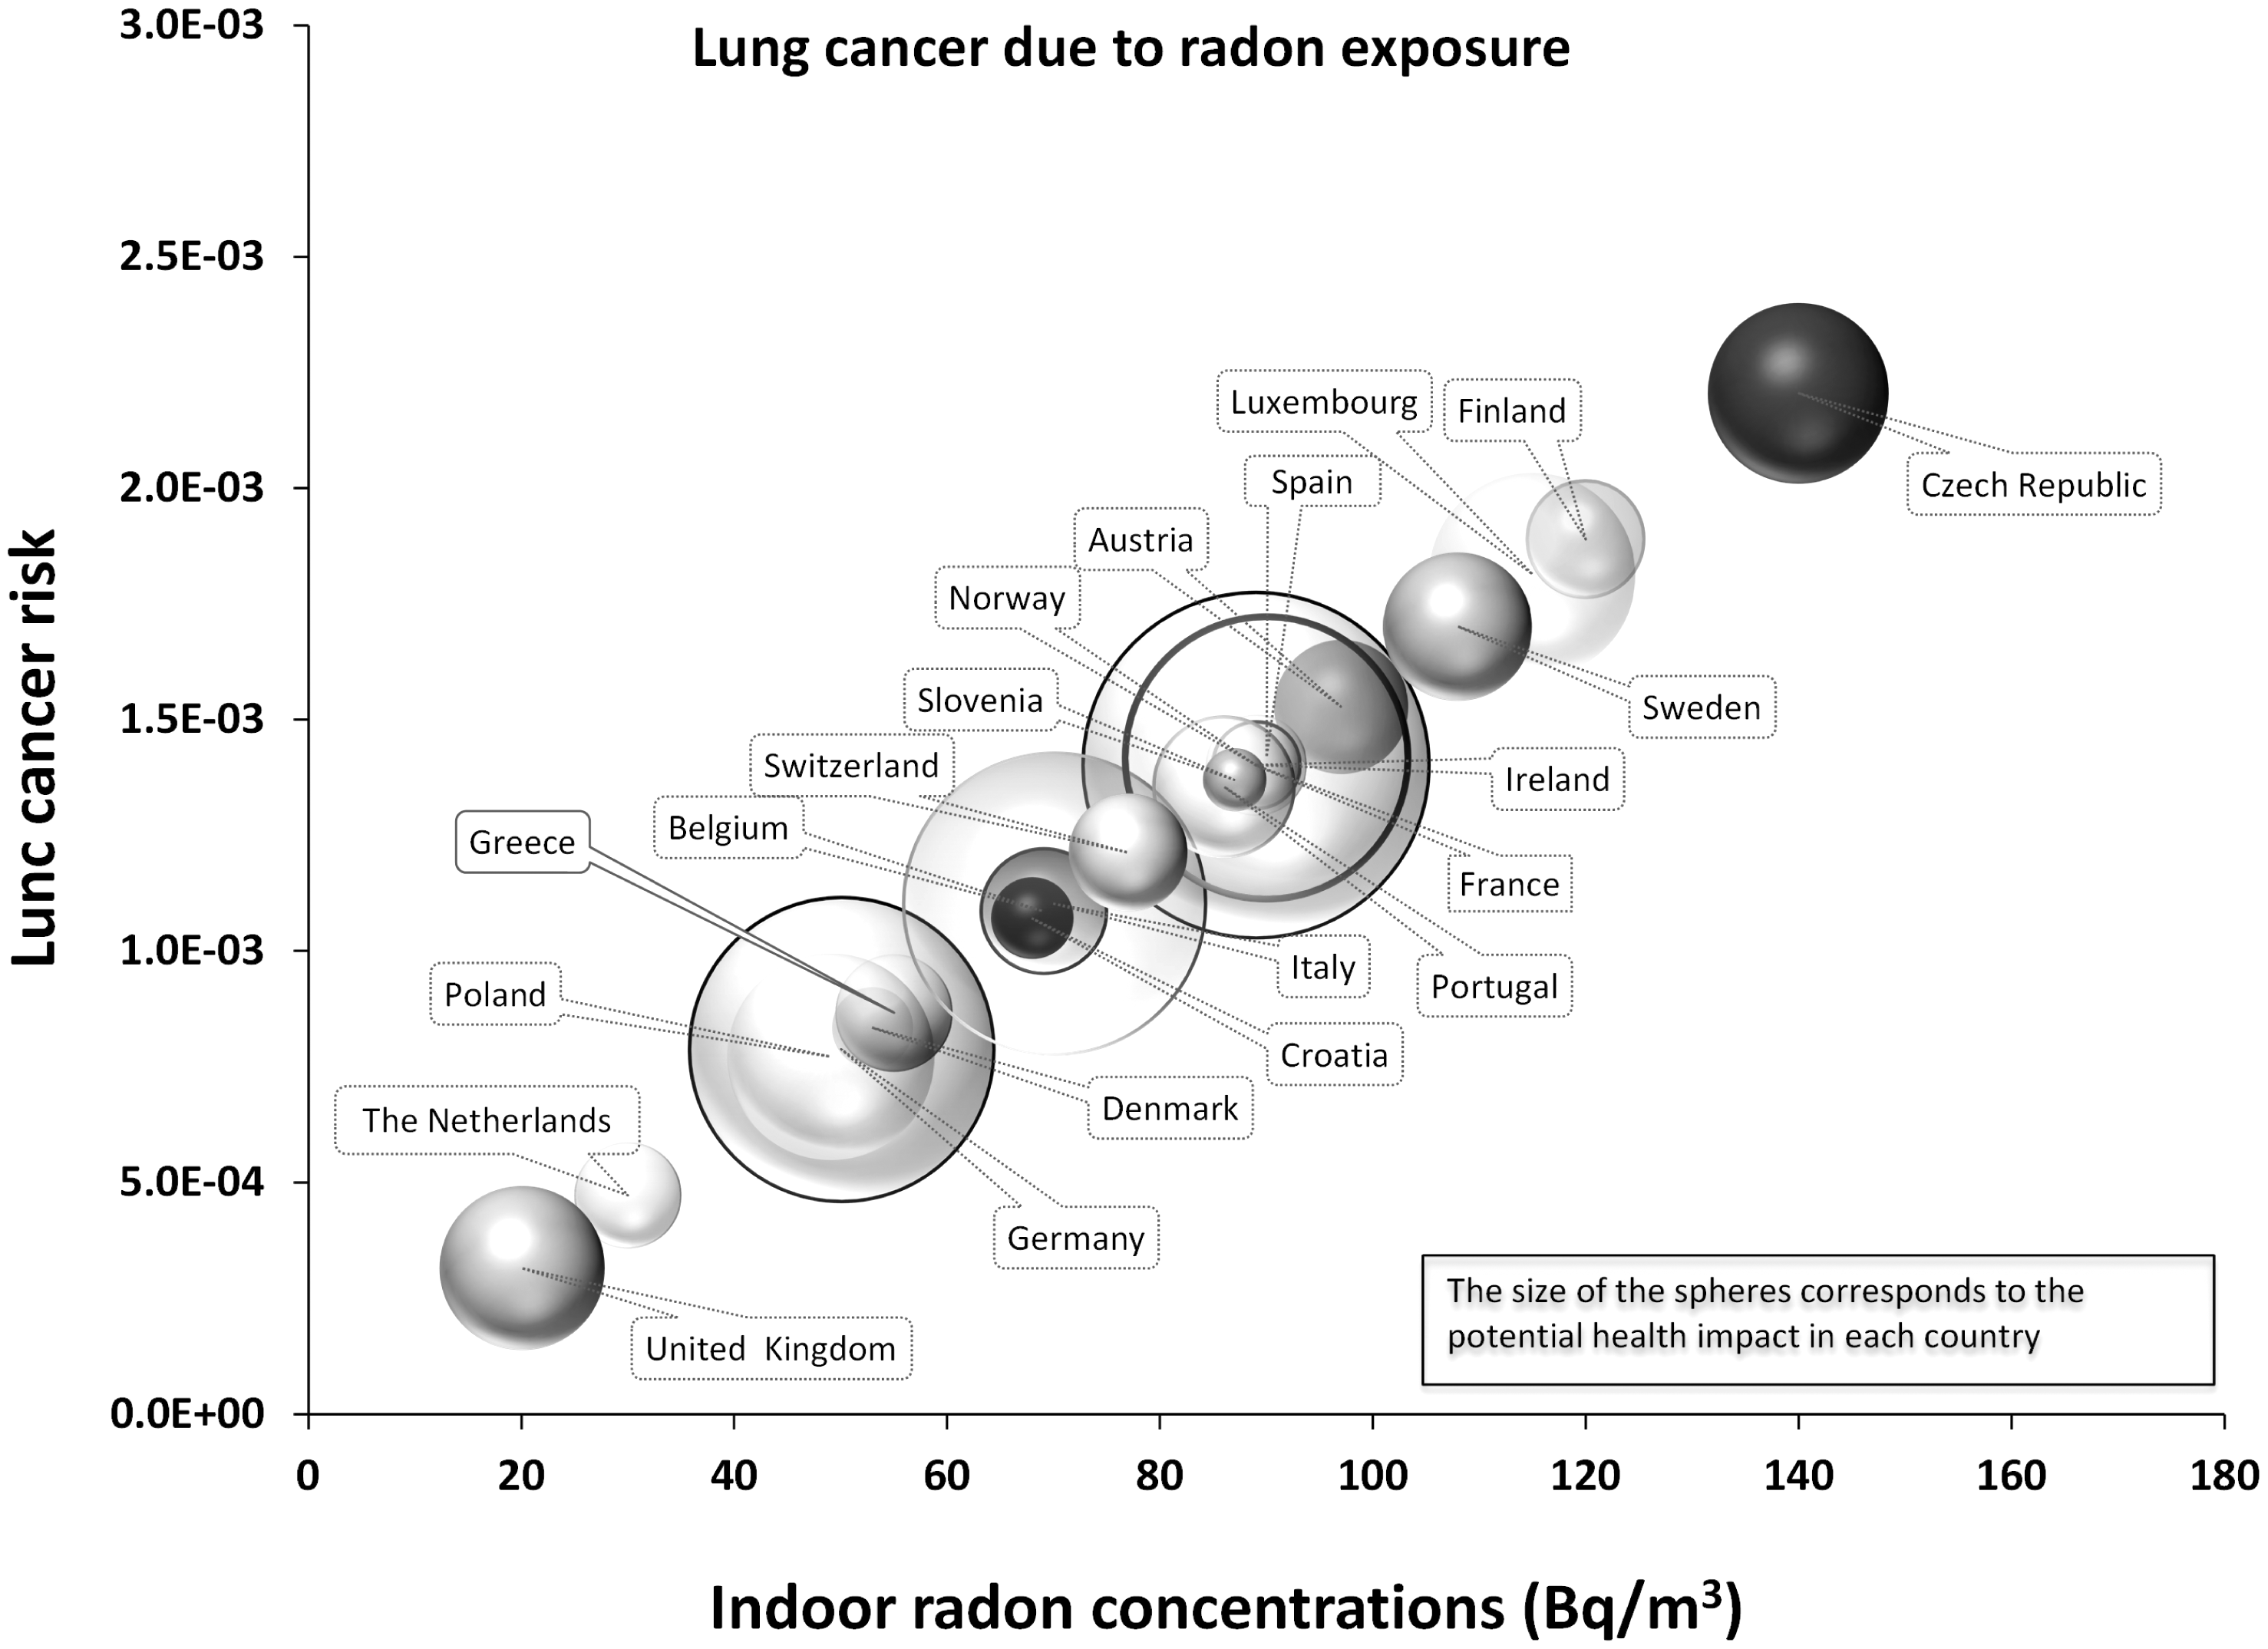
Results
The chemical substances identified and included in this review were grouped as follows: aldehydes, radon, carbon dioxide (CO2), carbon monoxide (CO), nicotine, nitrogen dioxide (NO2), polycyclic aromatic hydrocarbons (PAHs), volatile organic compounds (VOCs) and brominated flame retardants (BFRs).
Study characteristics.

Becquerels per cubic metre.
Parts per million.
From abstract only.
Micrograms per cubic metre.
Reported as no of cases/controls exposed to scale of levels of NO2.
Reported as no of cases/controls exposed to total aldehydes.
Results shown for first of four home visits.
Nanograms per cubic metre.
Median indoor level of Benzo(a)pyrene (BaP).
Picograms per cubic metre.
Total organophosphates.
Total brominated diphenyl ethers.
Total polychlorinated biphenyls.
Total hexabromocyclododecanes.
Tetrabromobisphenol-A.
Part of PIAMI study.
Data available for four other smoking levels in homes.
Limit of detection = 0.05 µg/m3.
Part of AIRALLERG study which was a nested case–control study within four ongoing birth cohort studies.
Limit of quantification was 0.24 µg/m3.
Measured at 1.2 m and other measurements available taken at varying heights.
10th–90th percentiles.
Radon
Our review identified a total of six studies reporting details of measurements of radon concentrations in homes within the EU. Four of these studies were carried out in the UK, one in Germany and one in Belgium. Additional data so as to provide a comprehensive comparative assessment of risks imposed by radon exposure were retrieved from the WHO study on environmental burden of disease associated with inadequate housing, 20 that includes data from national or regional indoor radon surveys, providing information on mean indoor radon concentrations. The data from Belgium 19 were gathered from voluntary requests by occupants in homes and were gathered over periods typically of 3–4 days. The study showed higher geometric mean (GM) concentrations in cellars (215 Bq/m3) and first-floor (65 Bq/m3) samples compared to second-floor (44 Bq/m3) measurements. This study demonstrated a close relationship between geological factors and measured concentrations in the homes.
The UK Childhood Cancer Study 16 measured radon concentrations in nearly 6000 homes using passive radon detectors in the main living area and in the child’s bedroom in the homes of 2226 children with cancer and 3773 control homes. The GM radon concentration found were 21.1 Bq/m3 for cancer cases and 25.5 Bq/m3 for controls with more than 70% of homes in either group having concentrations of 24 Bq/m3 or less. Concentrations tended to be lower in homes in deprived areas compared to more affluent areas (16 Bq/m3 versus 27.2 Bq/m3). Factors which affected mean concentrations of radon were type of house, floor level and the presence of double glazing and central heating.
Similar levels of indoor radon were found in a case–control study 14 carried out in Lower Saxony, Germany. The overall median level of radon was 27 Bq/m3 across more than 370 homes. A study based in the Isle of Man found indoor radon exposure at 48 Bq/m3 to be around twice that of the UK average. 15
Another study in Northampton, UK, reported data on radon concentrations in a home over an 18-day period and found an average hourly ground-floor radon concentration of 467 Bq/m3. 17 After applying time-activity modelling techniques, average hourly exposures ranged from around 250 to 340 Bq/m3. Another study in Northamptonshire, UK looked at radon levels measured before and after radon remediation measures (sub-slab depressurization) in a single home. 18 Hourly measurements were taken on two floors over a 5-week period. After remediation, levels in this typical house fell to 25% of those measured previously.
Based on the WHO data, 20 mean values range from high concentrations above 100 Bq/m3 in countries such as the Czech Republic and Finland to markedly lower values in the Netherlands and the United Kingdom, with many countries displaying values in the range of 50–90 Bq/m3.
Associated lung cancer risk due to radon exposure ranged between 3.2 × 10⁻⁴ (UK) and 2 × 10
Carbon monoxide
CO data were available from six studies, one from The Netherlands, one from Greece, one from the Republic of Ireland and three from the UK; additional data for Athens, Basle, Milan, Helsinki and Prague were retrieved from two papers from the EXPOLIS study. Henderson et al. 22 took continuous measurements of CO in 44 non-smoking homes in the UK to determine whether the WHO’s limits of 5.7 ppm over 24 h 2 were adhered to in domestic environments. They found the homes monitored did not exceed 1 ppm over the monitoring period while in an additional 20 homes with a resident smoker, values ranged from 0.1 to 21 ppm. A large study published by the UK Building Research Establishment 24 measured CO over a period of 2 weeks in 876 randomly selected homes. GM levels in bedrooms were 0.32 ppm while those in kitchens were slightly higher at 0.38 ppm.
As a part of a study to validate a model designed to measure the chance of accumulation of combustion products, real-time CO measurements were made in 74 homes in The Netherlands over a 1-week period. 21 This model included information on gas cooking, effectiveness of extractor fans, kitchen volume, air supply/ventilation in the kitchen and the presence of other sources of combustion. Mean weekly average concentrations of CO were 0.37 ppm and a maximum of 5.2 ppm in one home.
A study of 27 randomly selected Irish households reported an overall time-weighted average value of 0.76 ppm of CO with highest values in homes with an open fire, gas cooking and smoking residents. 23 A UK study on the effect of different types of residential heating on indoor CO levels 25 reported concentrations below the detection limit of 1 ppm in all homes, making it difficult to reach conclusions on the relationship between different heating types and CO concentrations in homes.
Measurements of IAQ in 50 dwellings have been performed in Athens, Greece by Santamouris et al. 26 during the period of December 2003–April 2004. Only in one case indoor CO concentration exceeded the threshold of 9 ppm set by US EPA for 8 h. The mean maximum concentration was close to 3.5 ppm. Almost 25% of the dwellings had a concentration below 1 ppm, 50% below 2.5 ppm and 80% below 6.3 ppm. A very clear correlation between the maximum indoor concentration of carbon monoxide and the calculated ventilation rate of the dwellings was found; this is probably due to the strong traffic component of the observed CO levels in the indoor air.
During the multi-centre European EXPOLIS study, personal exposure to CO was measured every minute for 48 h, of 401 randomly selected study participants (mainly non-smokers) in Athens, Basle, Helsinki, Milan and Prague. Due to the different sampling fraction of smokers and non-smokers in some cities, Georgoulis et al. 27 and Maroni et al. 28 only compares the exposure levels of non-smokers. In Milan, the 48-h personal exposures (GM) among non-smokers were highest (1.89 ppm), followed by Athens (1.47 ppm), Prague (1.31 ppm), Basle (0.72 ppm) and Helsinki (0.39 ppm).
An overview of indoor concentrations and the associated risks due to CO exposure is presented in Figure 2.
Indoor CO concentrations and associated cardiovascular morbidity risks.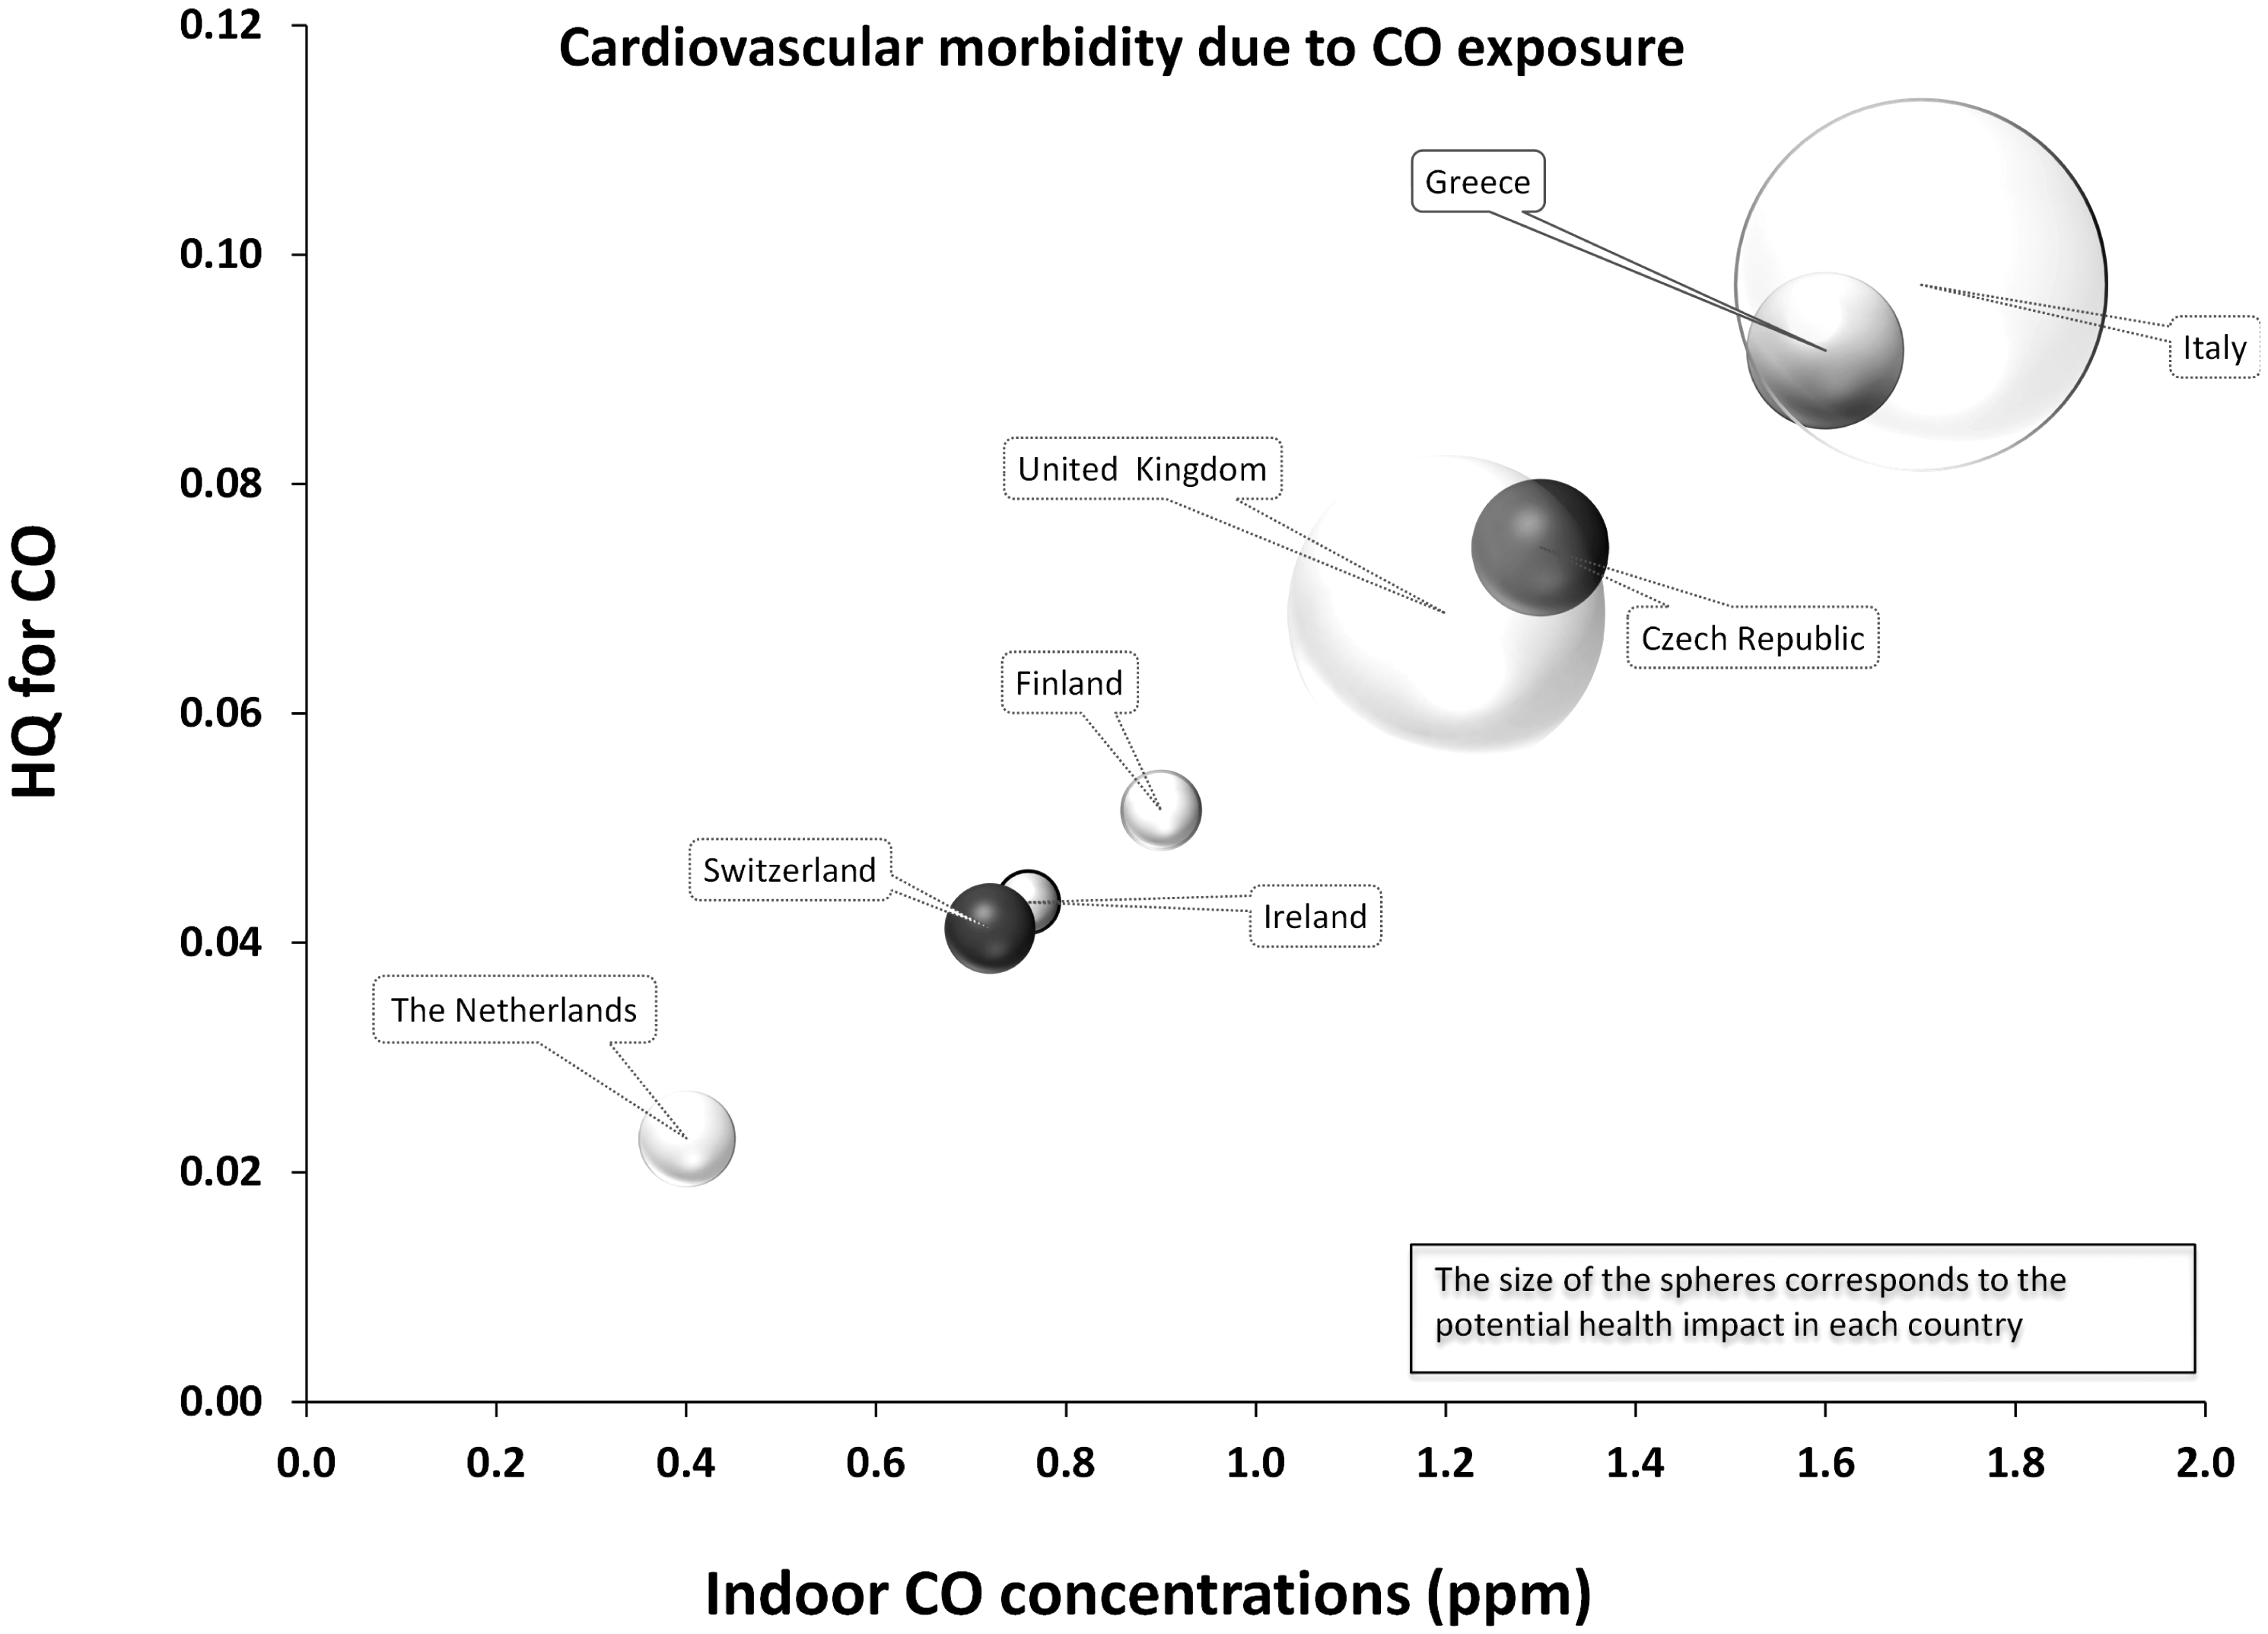
Carbon dioxide
Our review identified two papers that report measurement of CO2 in domestic settings. Willers et al. 21 measured CO2 levels in 69 homes in The Netherlands. Overall mean levels of 659 ppm were found. A significant difference in concentrations was found during actual cooking for gas versus electric cooking appliances (t = 2.32, p = 0.02), with concentrations higher in gas cooking homes.
Researchers from Sweden were interested in the relationship between indoor CO2 levels and asthma symptoms. 29 Subjects were a sub-sample of participants in a multi-centre study who had reported at least one respiratory symptom in the last 12 months, matched to randomly selected non-symptomatic individuals. Air monitoring of 88 homes was performed in both the living room and bedroom of the participants. The average concentrations of CO2 was significantly higher in homes of subjects who reported nocturnal chest tightness (1020 ppm versus 850 ppm), with concentrations of 1000 ppm exceeded in 26% of all homes measured.
Nitrogen dioxide
A total of 19 studies detailing measurements of NO2 in dwellings were identified. These studies are well distributed throughout the EU including Germany (n = 2), Sweden (n = 2), France (n = 3), The Netherlands (n = 1), the UK (n = 5), Spain (n = 4) and Belgium (n = 1). Additional data for the Czech Republic, the UK, Switzerland and Finland were retrieved from the EXPOLIS study.
In a three-centre study of homes in Ashford (UK), Menorca and Barcelona (Spain), it was found that cigarette smoking, season of measurement and the energy source were the main determinants of indoor concentrations of NO2. 37 NO2 was measured in living rooms in homes over 7–15 days with median levels found of 11.7 µg/m3 in Menorca, 46.2 µg/m3 in Barcelona and 11.2 µg/m3 in Ashford, respectively. All three centres showed increased levels when gas was used either for heating or cooking.
A study of 876 randomly selected homes in England measured NO2 concentrations over a sampling period of 2 weeks and reported GM levels in bedrooms of 1.9 µg/m3 and in kitchens of 21.8 µg/m3. 24
Willers et al. 21 collected passive measurements of NO2 in kitchens of 55 homes in The Netherlands over a 1-week sampling period. Values reported for 48-h average NO2 concentrations were 27 µg/m3 for gas cooking homes and 22 µg/m3 for homes that used electricity.
Valero et al. 46 found that personal exposure of pregnant women to NO2 was influenced both by outdoor and indoor levels in an area of Spain. Using passive samplers, 48-h concentrations were measured in the homes of 108 pregnant women. Median levels of 36 and 32 µg/m3 were found in Valencia and Sabadell, respectively. In a multiple regression model, 32% of indoor NO2 variability was explained by outdoor concentrations and the presence of gas appliances. Hagenbjork-Gustafsson et al. 30 studied 46 homes without gas appliances in Sweden and found higher concentrations in less urbanized control homes (8 µg/m3) than those in a nearby urban area (12 µg/m3). The researchers concluded that when no gas appliances are present, indoor concentrations reflect outdoor levels.
Sakai et al. 38 found a GM concentration of 6.7 µg/m3 in 27 homes in Uppsala, Sweden, 30 when measured over 24 h. The outdoor concentration was the same, indicating there were no important indoor sources impacting on NO2 levels. This finding was consistent with the reported absence of environmental tobacco smoke and lack of gas cooking among these homes.
One of the largest databases of NO2 measurements was developed and populated within the framework of the Swiss Study on Air Pollution and Lung Diseases in Adults. 31 Bedrooms in a sub-sample of 500 homes were measured over 1 week, as well as personal and outdoor measurements, to evaluate the relationship between personal levels with indoor and outdoor concentrations. Overall average indoor levels were 21 µg/m3. Levels were significantly higher in homes with gas cookers.
Residential exposures of 258 adults taking part in the EXPOLIS study were measured over 48 h in homes in Switzerland, Finland and the Czech Republic. 33 Average levels were 36, 27 and 30 µg/m3 in Basel, Helsinki and Prague, respectively.
The Indoor Factors and Genetics in Asthma (INGA) study performed repeated indoor NO2 measurements 6–13 months apart in 631 German homes. 36 Passive samplers were placed in living rooms and bedrooms for 1 week on each occasion. Average living-room measurements were 14.9 µg/m3 on visit one and 15.2 µg/m3 on the second visit. Within-home correlations, after adjusting for region and season, ranged between 0.24 and 0.55, and they concluded that a single measurement was not sufficient to take account of variability over time in a moderate climate like Germany. Also in Germany, indoor concentrations of NO2 were measured in living rooms and bedrooms in 204 homes in Erfurt and 201 homes in Hamburg. 32 The authors found living room concentrations to be 15 and 17 µg/m3 in each of the two cities and in bedrooms levels were 15 and 18 µg/m3, respectively. When a linear regression analysis was applied, including variables such as place of residence, season, location of home to busy roads and outdoor levels, the major determinants of living room concentrations remained gas cooking and the presence of smokers.
In Denmark, researchers looked at the impact of outdoor temperature on indoor NO2 levels and found significantly higher values during the cold season. 40 Median NO2 concentrations found in Copenhagen homes were 8.9 µg/m3 below 8℃ and 6.6 µg/m3 when the temperature was above this level.
Osman et al. 42 measured NO2 in the homes of 148 patients with chronic obstructive pulmonary disease and found concentrations over 1 week to be 15.8 µg/m3 in the living room and 14.4 µg/m3 in the bedroom.
In a study in Lille, France, passive samplers were used to gather exposure data from 46 volunteers across four micro-environments: home, other indoor places, transport and outdoors. 41 Mean NO2 concentrations for home environment differed between summer and winter and between weekdays and weekends, with subjects reporting spending between 62 and 88% of their time at home dependent on day of the week. Exposures were highest on winter weekend days (27 µg/m3), followed by winter weekdays (22 µg/m3), with lower levels in summer of 14 µg/m3 during weekdays and 15 µg/m3 at weekends.
In Stockholm (Sweden) the effect of air exchange rate and the presence of human activity on NO2 was measured by Wichmann et al. 43 during winter and summer indoors and outdoors at 18 homes of 18 children (6 tο 11 years old). Indoor environments were free of environmental tobacco smoke and gas appliances, as the aim was to assess to what extent NO2 infiltrate from outdoors to indoors. The mean and median indoor NO2 levels were 9.2 and 10.0 µg/m3, respectively.
In Antwerp (Belgium), a study was carried out to characterize the IAQ of population subgroups that took part in the European Community Respiratory Health Survey and the International Study of Asthma and Allergy in Childhood by Stranger et al. 44 In 18 residences, the mean NO2 concentration was found equal to 33 µg/m3.
Two case–control populations, composed of children living in the city (32 asthmatics and 31 controls) and in the countryside (24 asthmatics and 27 controls) were included in the study carried out by Hulin et al., 45 in order to compare the potential effect of home air pollutants on asthma in urban and rural houses in France. During 1 week, NO2 was assessed at homes. The results showed that the average NO2 concentration was equal to 10.5 µg/m3.
Esplugues et al. used passive samplers to measure indoor and outdoor NO2 levels for 2 weeks in the homes of 352 children in Valencia, Spain. The NO2 concentrations measured indoors averaged 19.7 µg/m3. 47
Two consecutive days of home indoor and home outdoor measurements of NO2 were carried out at the homes of adult participants on different dates and seasons during the sampling period in Basel (Switzerland), Helsinki (Finland), Oxford (UK) and Prague (Czech Republic) in the frame of EXPOLIS study. 48 The average NO2 concentrations in Prague, Oxford, Basel and Helsinki were 24.5, 22.6, 24.8 and 14.7 µg/m3, respectively.
An overview of indoor concentrations and the associated risks due to NO2 exposure is presented in Figure 3.
Indoor NO2 concentrations and associated respiratory morbidity risks.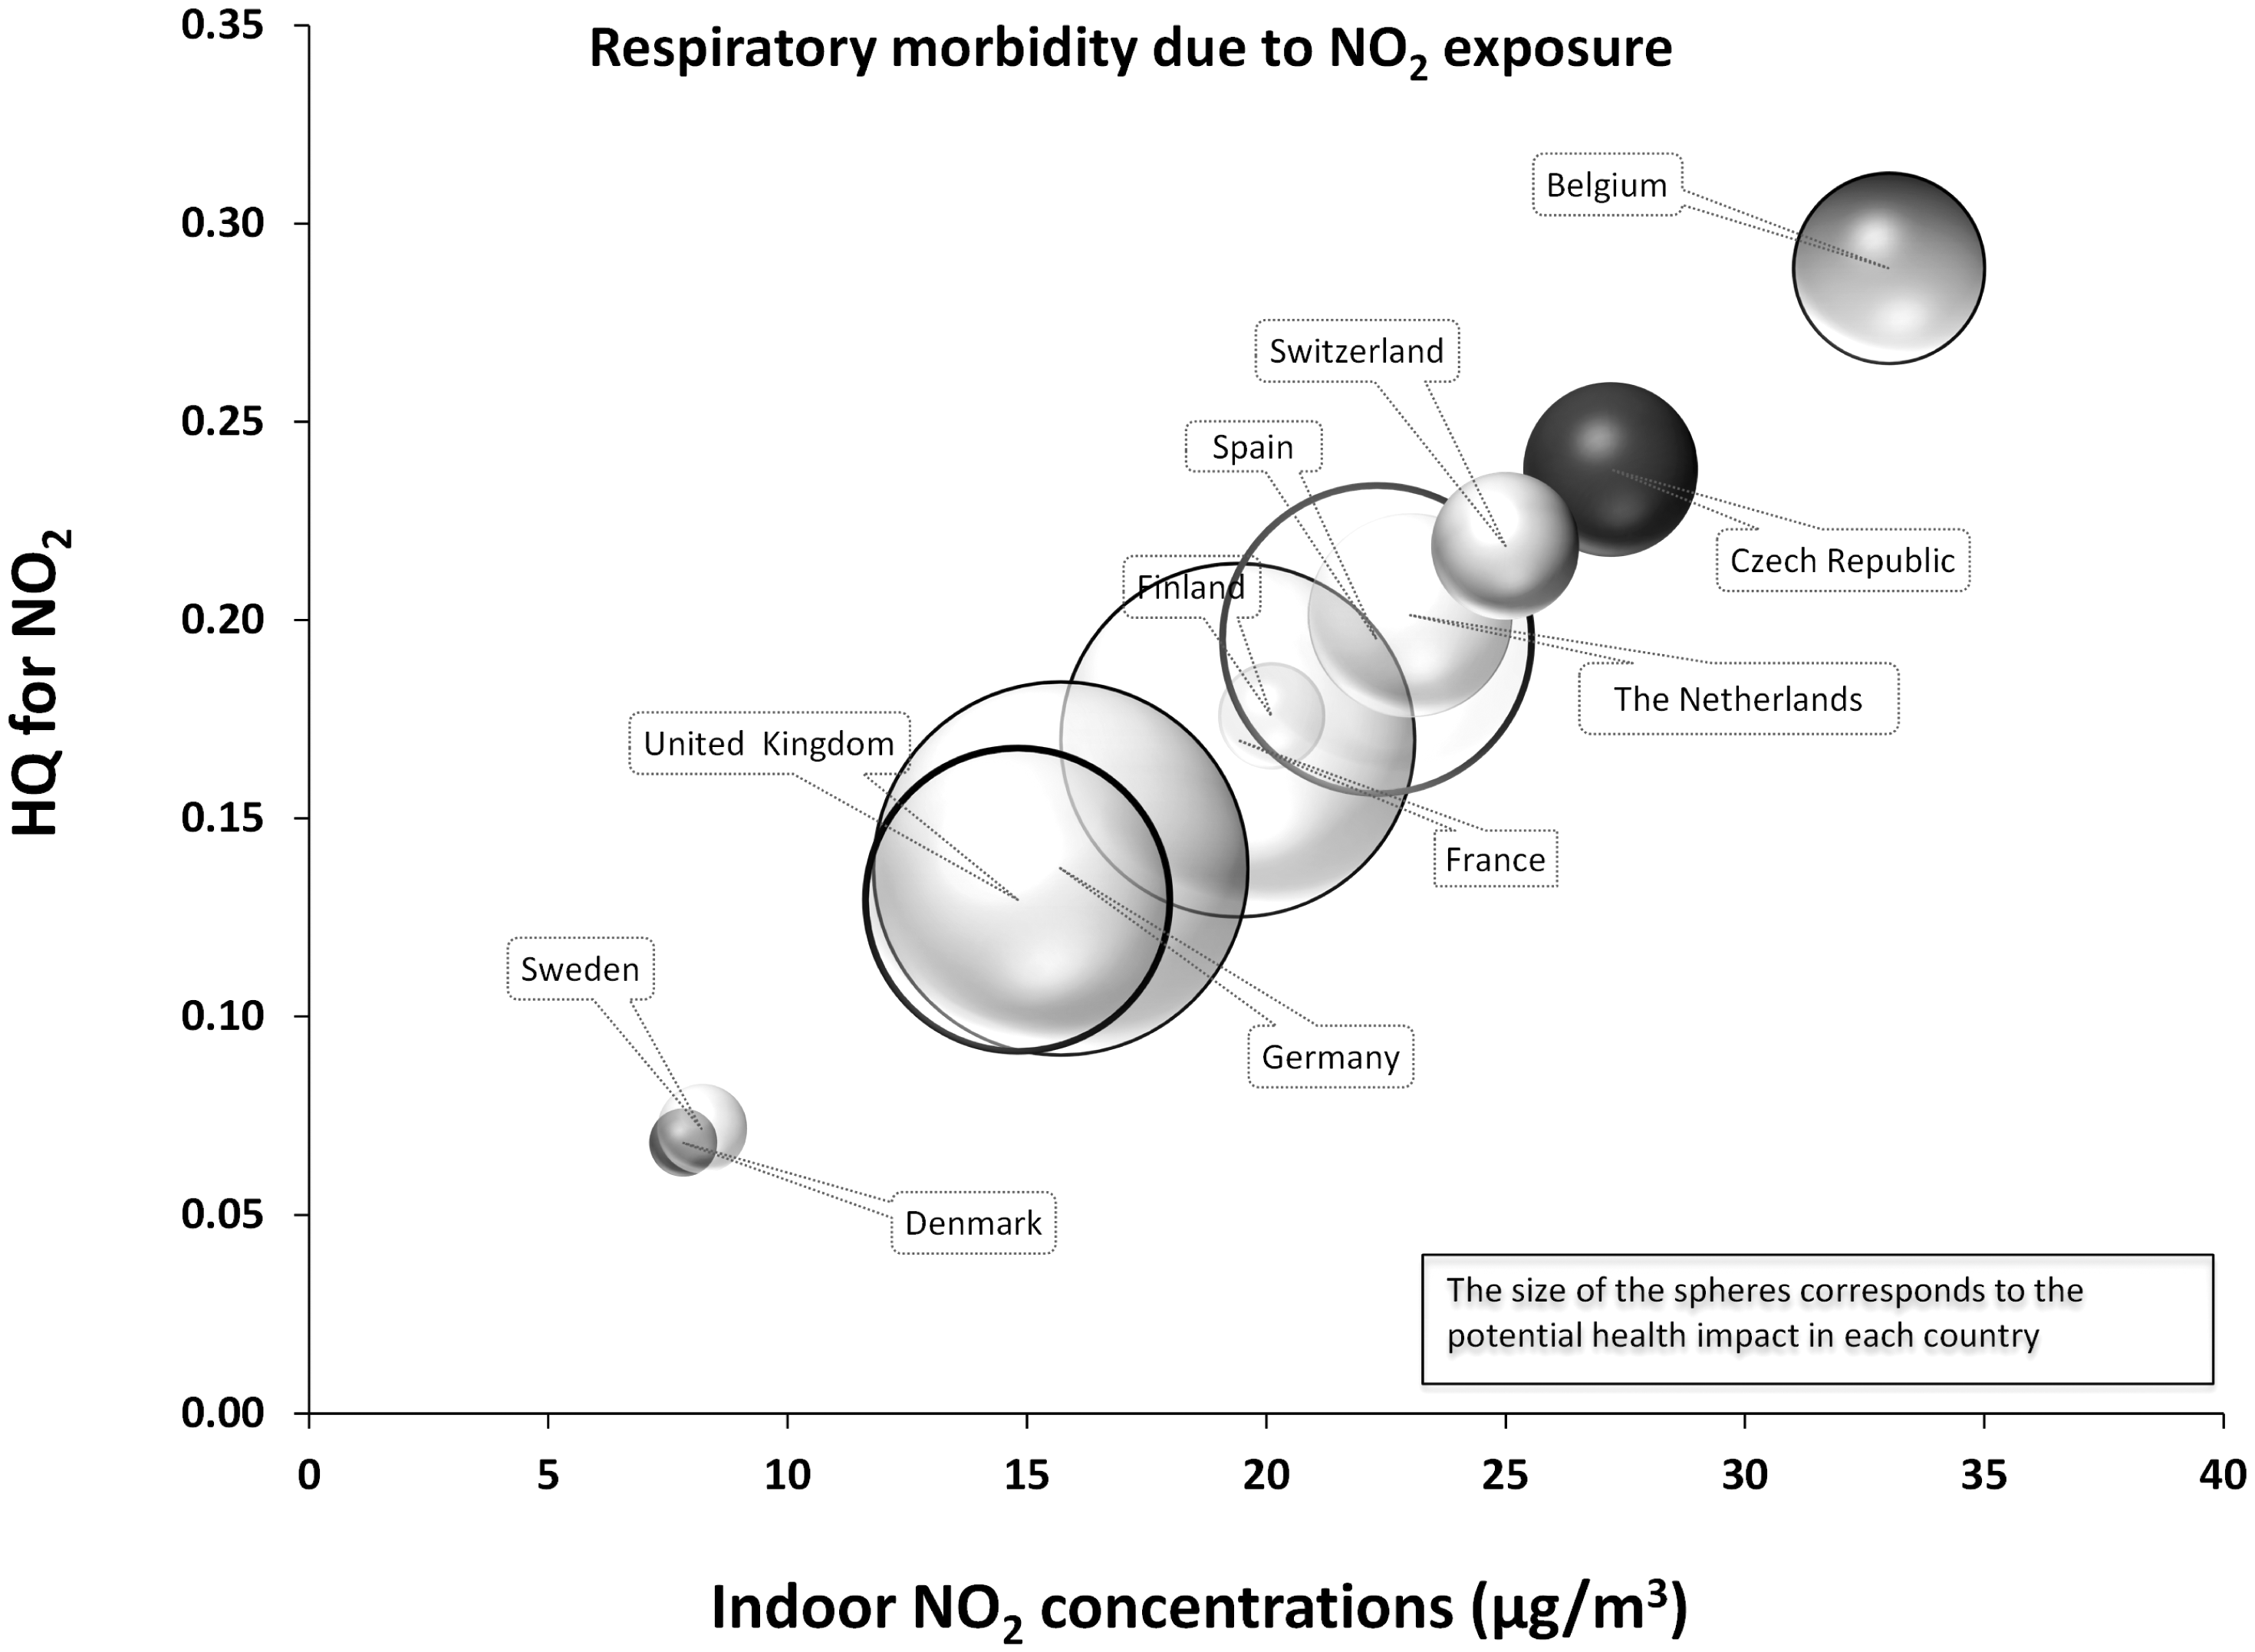
Aldehydes
Fourteen papers reporting measurements of aldehydes were identified for inclusion in our review. The majority of these studies are from northern areas of the EU including Sweden (4), France (4), Italy (3), the UK (2) and a single study in Germany.
The most commonly measured aldehydes for which data were identified are formaldehyde, acetaldehyde, pentanal and hexanal.24,50,53,54 Using passive samplers, Dassonville et al. 54 measured in Paris five aldehydes on several occasions over the course of 1 year in the bedrooms of 196 children randomly selected from a birth cohort study. The GM concentrations for the four main aldehydes were 19.4 µg/m3 for formaldehyde, 8.9 µg/m3 for acetaldehyde, 3.7 µg/m3 for pentanal and 25.3 µg/m3 for hexanal. The main sources were building materials including new coverings, smoking and the use of air fresheners. They also found seasonal variability with higher levels of formaldehyde observed in warmer months. Another study measured aldehydes in Paris apartments where refurbishment had taken place within the previous 3 years. 50 Measurements were carried out simultaneously in the living room, kitchen and bedroom over a 72-h period. Concentrations in bedrooms were slightly higher than those found by Dassonville et al., 54 but their findings concur with regard to the main sources, i.e. floor/wall covering, age, smoking and ambient parameters such as temperature and humidity. Clarisse et al. 50 found no difference between the concentrations in the different rooms measured and therefore concluded that only one 72-h sample was needed to assess indoor exposure.
Formaldehyde was measured over a 3-day period in a sample of 876 homes in England. 24 GM values were 22.2 µg/m3 with values ranging from 1 to 171 µg/m3. Concentrations tended to be higher in more recently constructed homes.
Formaldehyde was measured in the homes of a sub-sample of a large population study carried out in Germany in 1991–1992. 49 Mean indoor concentrations over a 48-h period were reported as being >70 µg/m3, although half the samples were above this and 14% exceeded the German indoor guideline for formaldehyde of 120 µg/m3. Marchand et al. 53 found mean concentrations 49 of 32.2, 14.3 and 8.6 µg/m3 for formaldehyde, acetaldehyde and hexanal, respectively, in 162 homes in Strasbourg which they regarded as similar to other studies in the United States and Australia. In living rooms the age of ceiling covering was found to be the main explanatory variable, while in bedrooms it was the age of the furniture. Around 7% of the homes in this study had formaldehyde concentrations >50 µg/m3.
A study from Bari, South Italy, conducted passive monitoring in 59 homes over a 24-h period, reported concentrations of 16 µg/m3 (formaldehyde) and 10.7 µg/m3 (acetaldehyde), in comparison to outdoor concentrations of 4.4 µg/m3 (formaldehyde) and 3.4 µg/m3 (acetaldehyde). 55 Levels were higher in the presence of new or newly restored furniture (p = 0.03) and levels were significantly higher in winter months likely reflecting lower air exchange rates during colder weather.
Levels of domestic formaldehyde concentrations in Sweden were found to be within the range of 12–60 µg/m3.29,51,52 In one study bedroom concentrations were measured in two campaigns: 24 h concentrations were 23 µg/m3 while 6-day sampling returned a mean of 29 µg/m3 which was slightly higher than personal exposure levels recorded in 24 and 40 subjects over the two sampling campaigns. 52 Another study by the same researchers looked at concentrations of formaldehyde and acetaldehyde over winter in 14 wood-burning and 10 control homes in a small Swedish town. 58 They found no significant difference between wood-burning and control homes for either aldehyde.
Sakai et al. 38 reported a GM concentration for formaldehyde of 8.3 µg/m3 measured over 24 h in 27 Swedish bedrooms in Uppsala which was significantly higher than the outdoor concentration (p < 0.01).
Indoor and outdoor formaldehyde and acetaldehyde levels were assessed to characterize dwellings pollution in the city and the Province of Bari, Italy also taking into account seasonal variability. 55 Passive environmental monitoring was performed, for 24 h, in the kitchen of 59 dwellings, as well as outdoors for 27 of them. During the period January–June 2008, formaldehyde and acetaldehyde levels were monitored monthly in 20 of the investigated dwellings inhabited only by non-smokers. Indoor formaldehyde and acetaldehyde concentrations were significantly higher (16.0 ± 8.0 and 10.7 ± 8.8 µg/m3) than outdoor concentrations (4.4 ± 1.7 and 3.4 ± 2.0 µg/m3), showing correlation between indoor levels of the two aldehydes (r = 0.41; p = 0.001).
In the study carried out by Hulin et al., 45 during 1 week, formaldehyde and acetaldehyde were assessed at home. Urban dwellings were found to be more polluted than rural ones. For the case of formaldehyde the median concentration in urban areas during summer was 20.6 µg/m3 whereas in rural areas 15.7 µg/m3. For the case of acetaldehyde the median concentration in urban areas during summer was 12.9 µg/m3 whereas in rural areas 12.8 µg/m3.
This study by Fuselli and Zanetti 98 presents the results of human exposure to formaldehyde, carried out in indoor and outdoor environments in Ferrara, a city in the North of Italy. Concentration values obtained by personal samplings (PE) were compared to both outdoor and indoor values, the latter including domestic and working environments. The results showed that there was a significant difference between formaldehyde concentrations outdoor and PE (p = 0.03 < α = 0.05), while a significant difference was not found between indoor and PE. Indoor values (values as average of 38 samples) were 19.5 µg/m3.
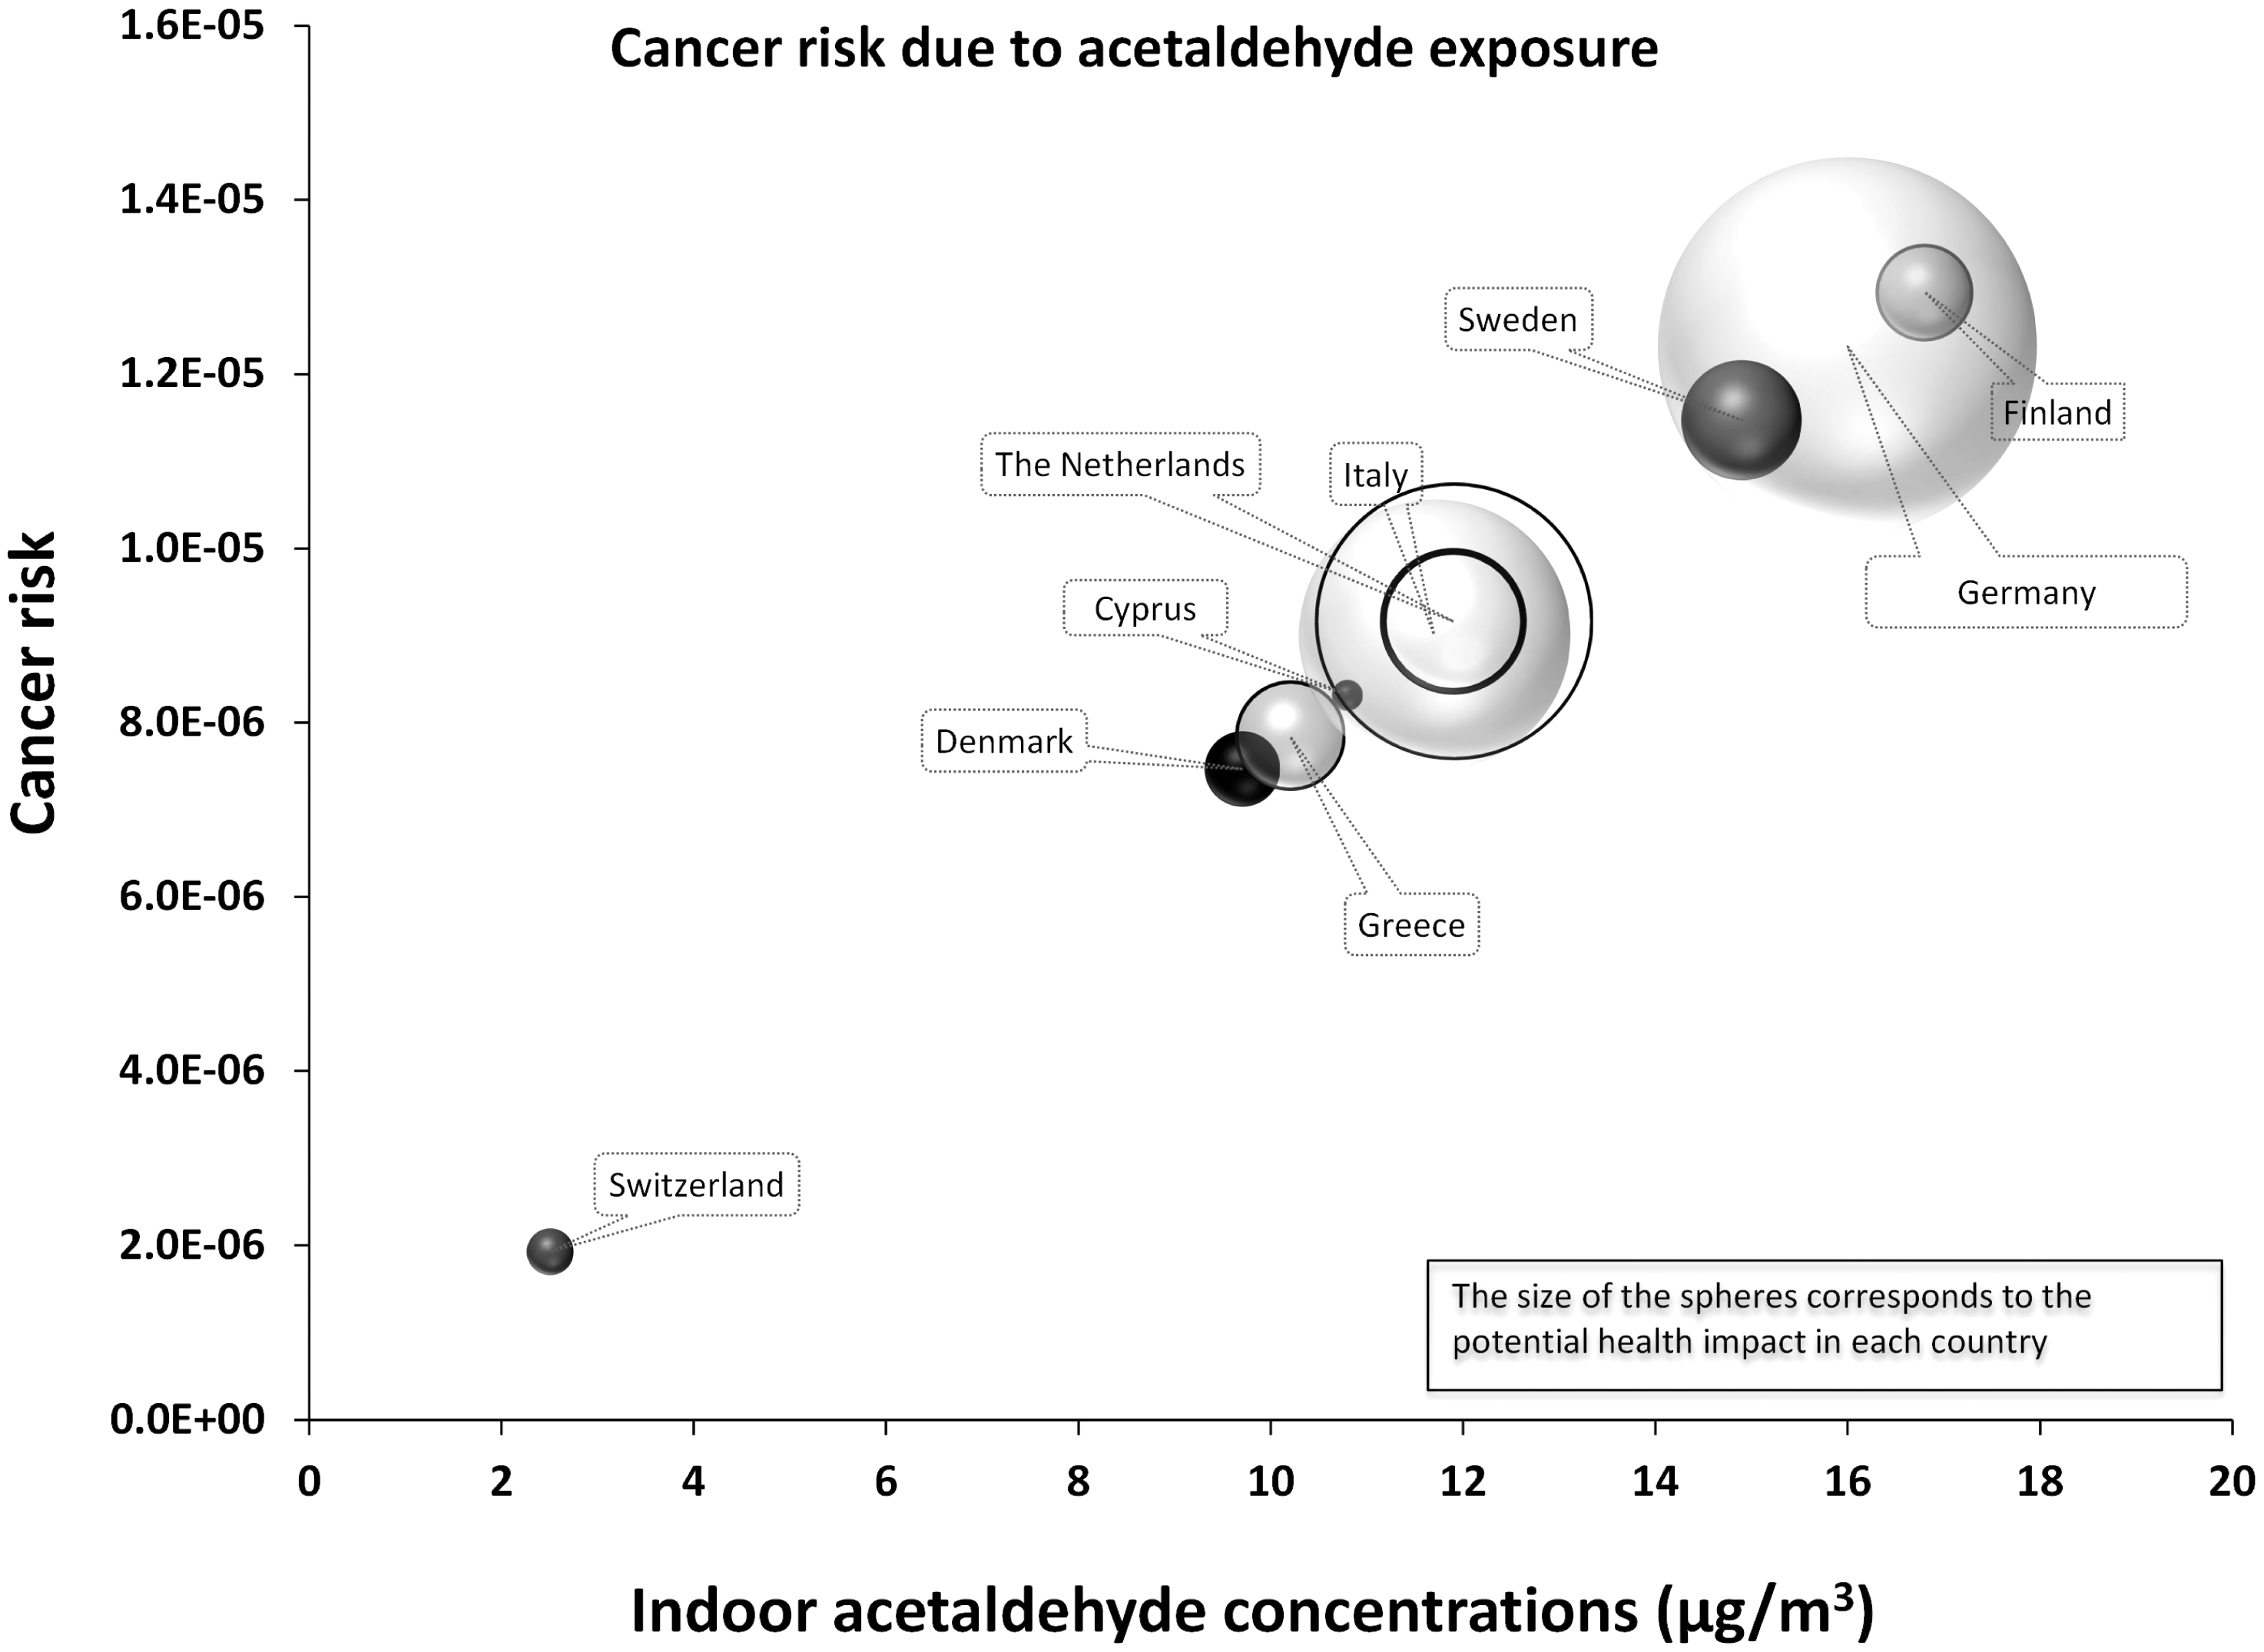
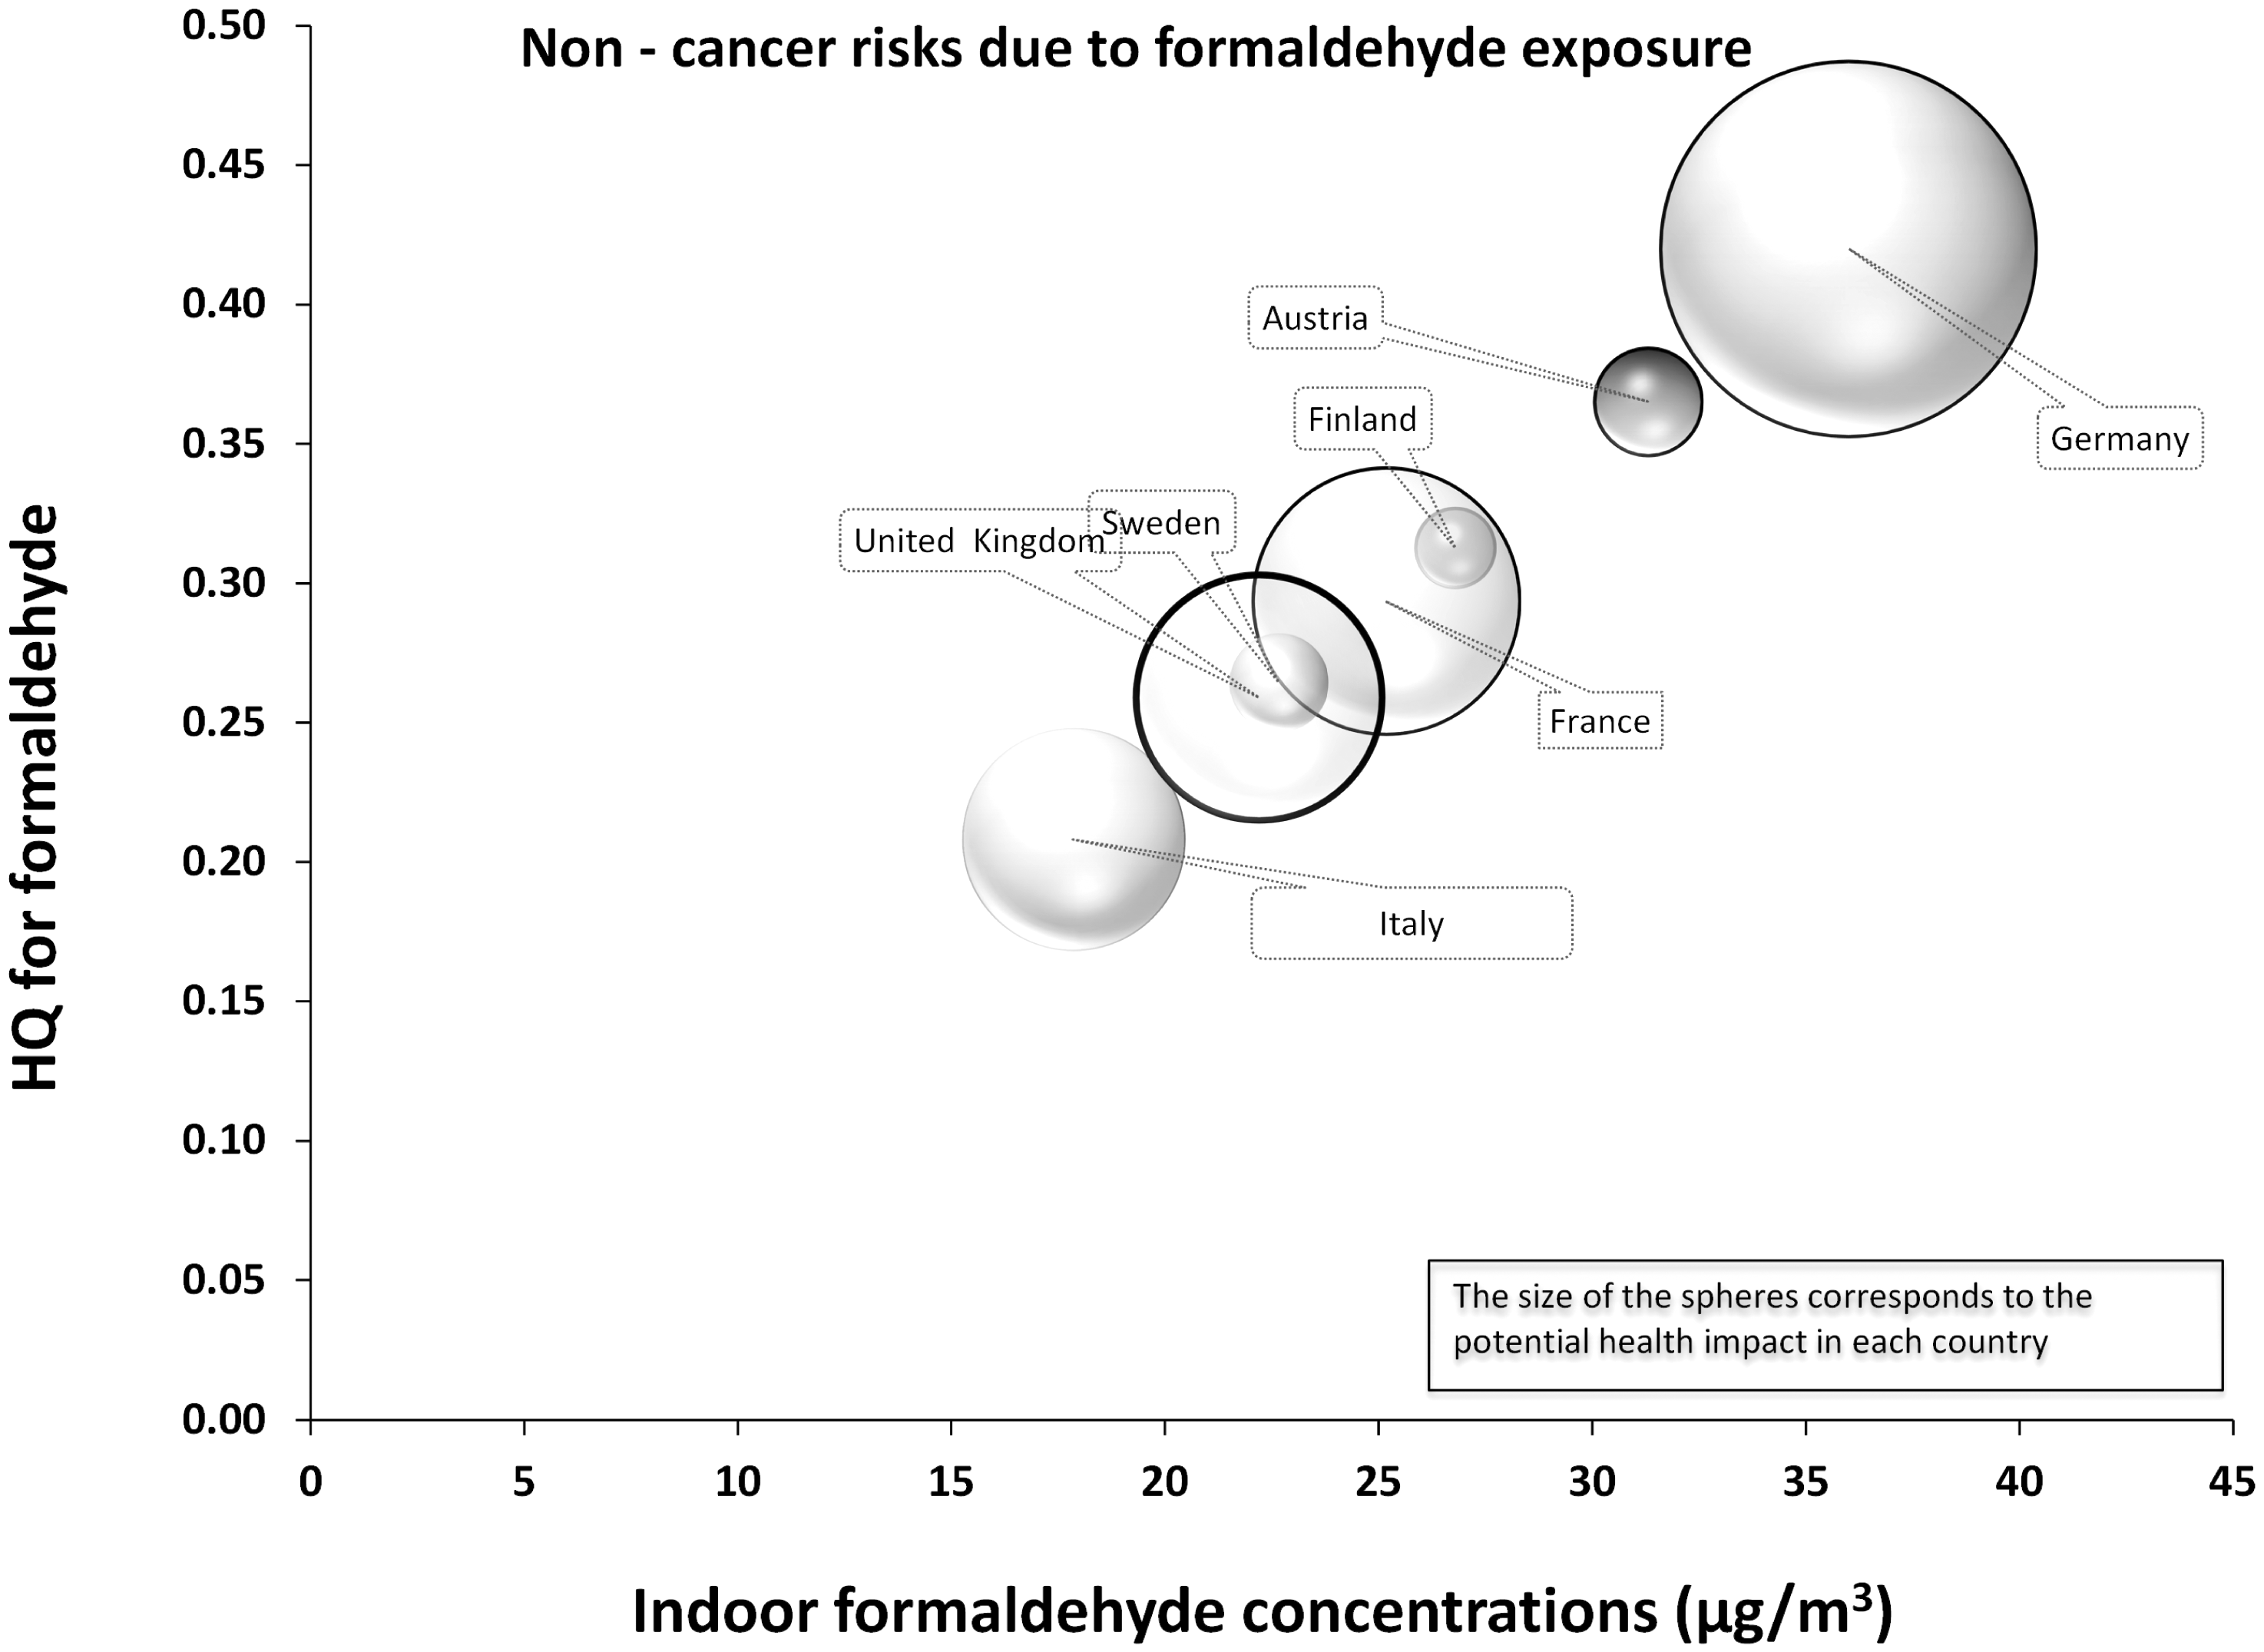
An overview of indoor concentrations and the associated cancer risks for formaldehyde and acetaldehyde are presented in Figures 4 and 5, respectively. Quantitative non-cancer risk estimates for formaldehyde are presented in Figure 6.
Indoor formaldehyde concentrations and the associated cancer risks. Indoor acetaldehyde concentrations and the associated cancer risks. Indoor formaldehyde concentrations and the associated non-cancer risks.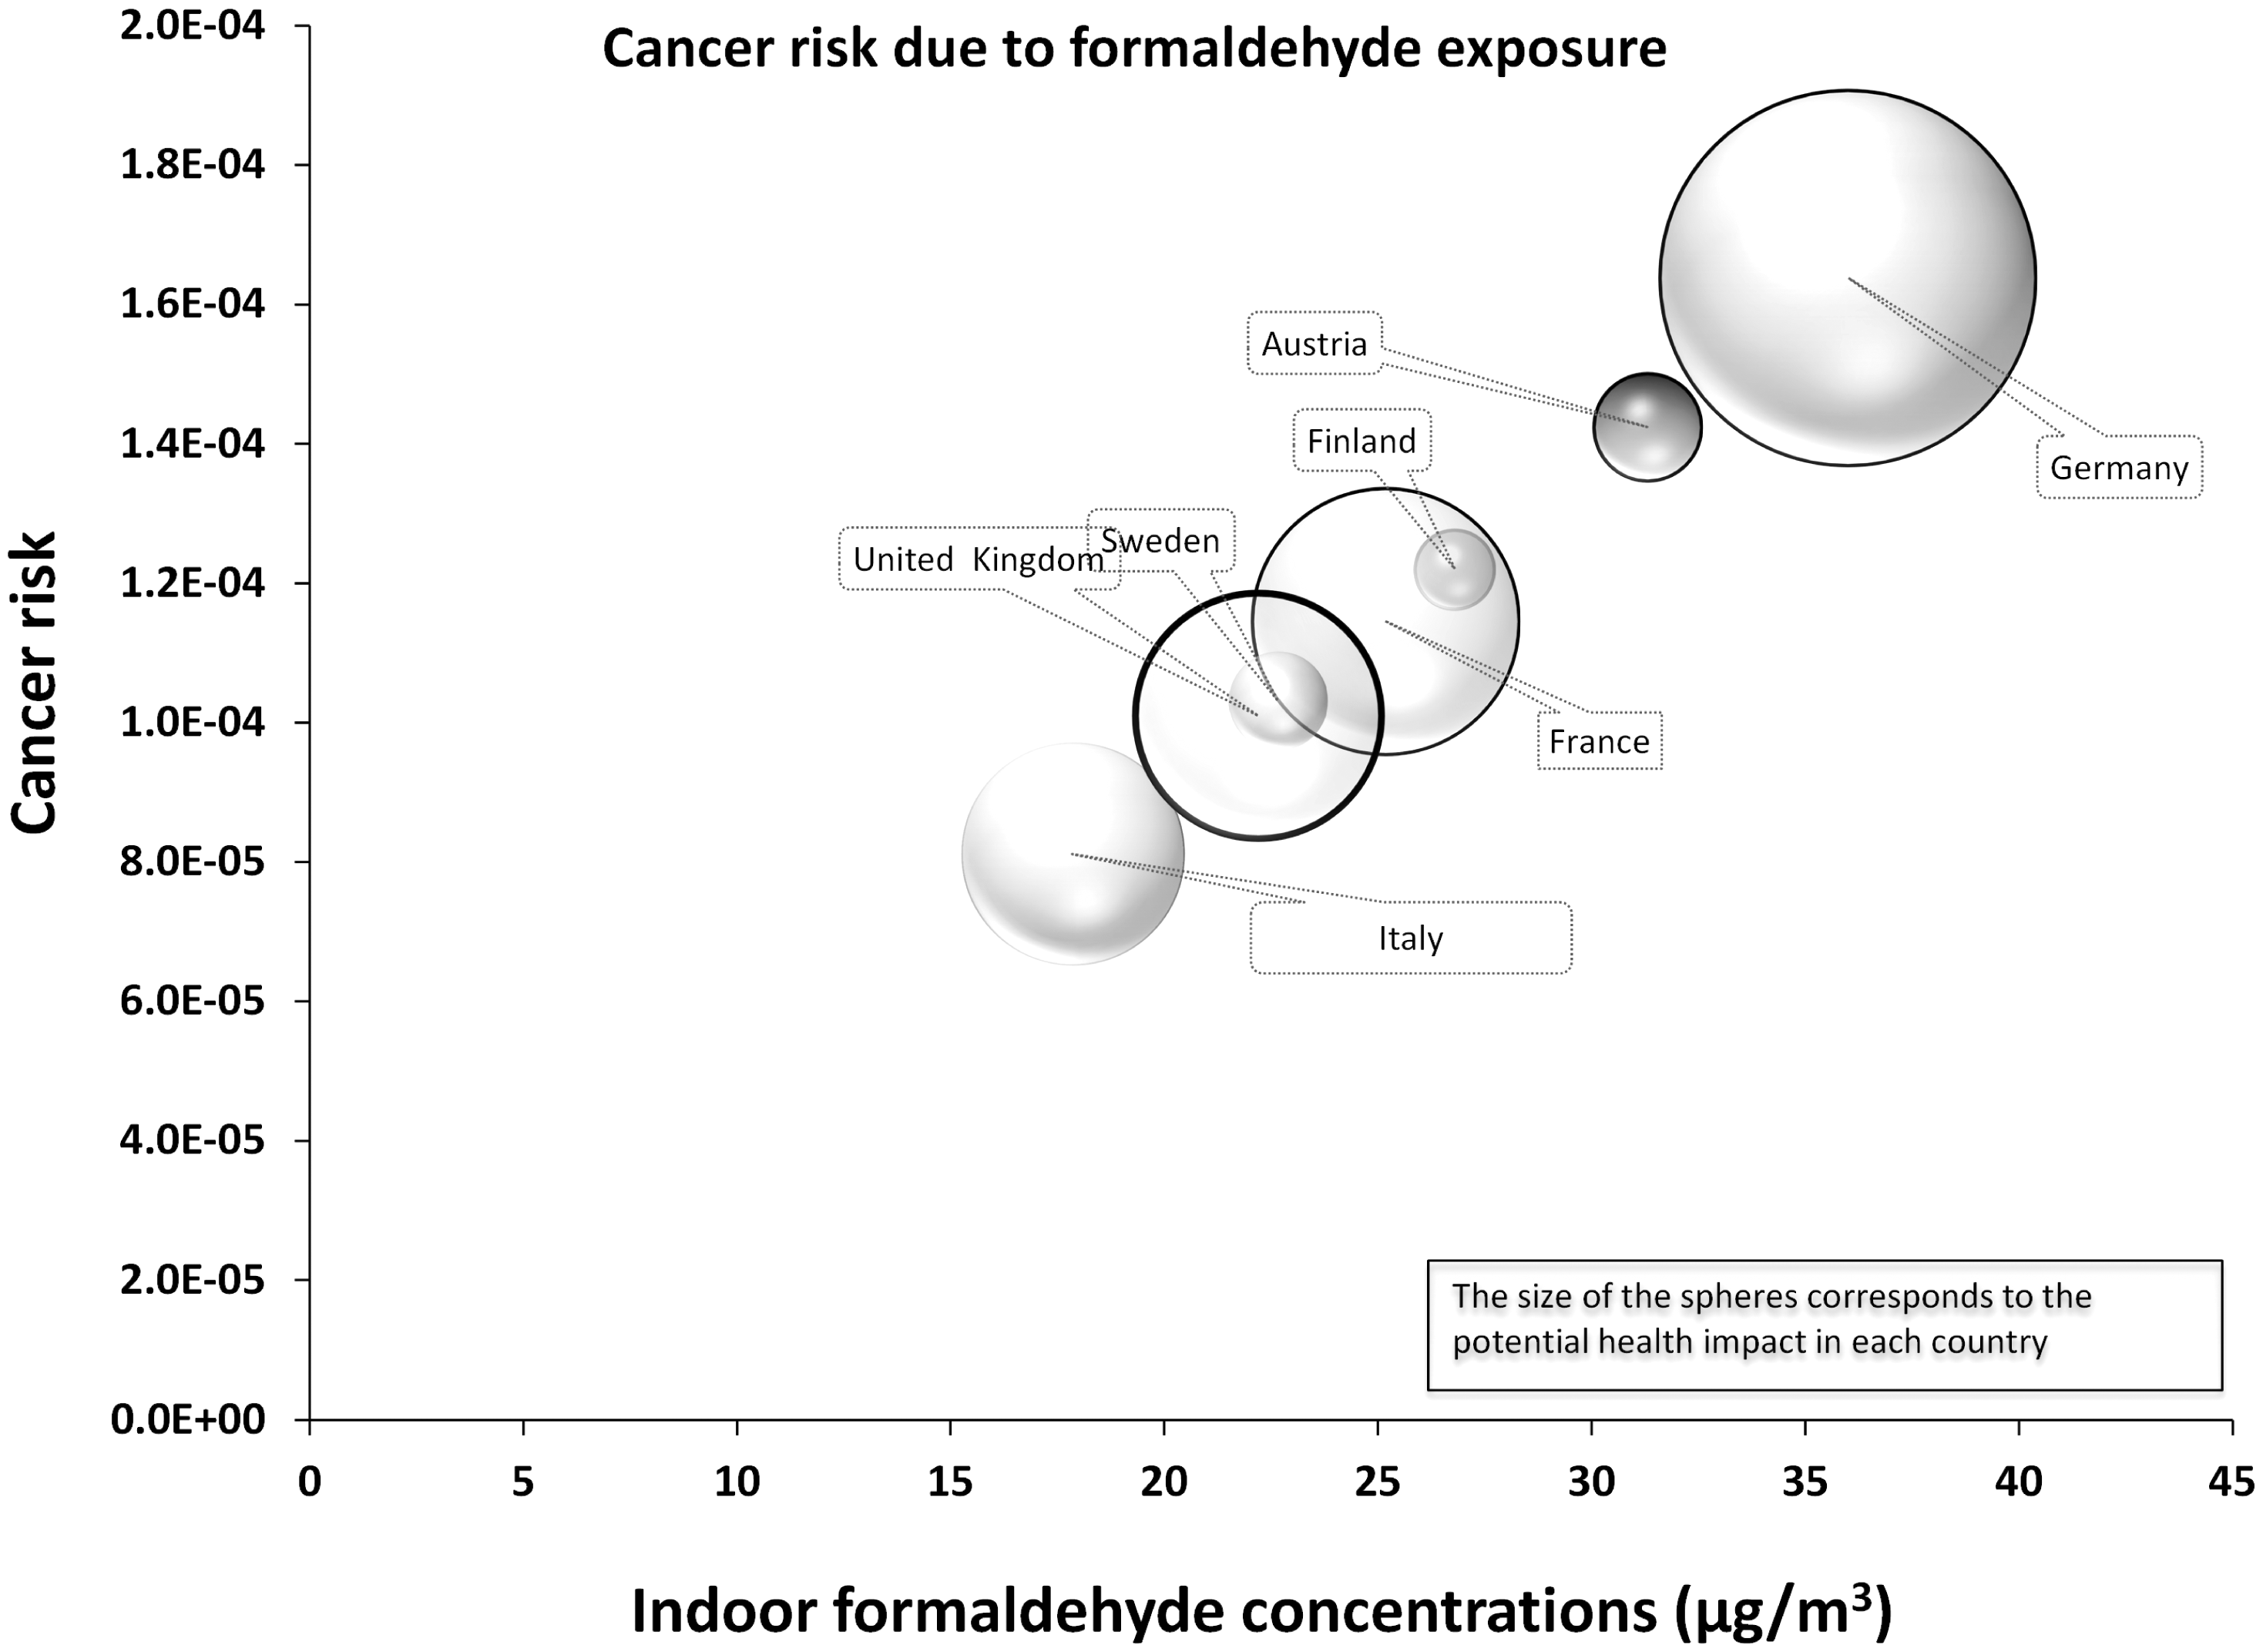
PAHs
Two papers that report levels of PAHs were included in the review. One small study was available from Sweden, with a larger study from Germany.
Fromme et al. 58 measured PAHs in street-side living rooms in 123 typical Berlin apartments over winter and summer. Participants were both smokers and non-smokers. Median levels of Benzo(a)pyrene (BaP) were 0.65 ng/m3 in winter and 0.27 ng/m3 in summer in smoking homes while for non-smoking homes the corresponding concentrations measured were 0.25 and 0.09 ng/m3. The authors concluded that 75% of the variance was caused by BaP concentrations in outside air, likely to be attributable to traffic emissions.
Gustafson et al. 99 studied the impact of domestic wood burning on indoor levels of 27 PAHs in 23 homes over winter in a small town in Sweden. Thirteen of these homes had wood-burning appliances and smoking was not permitted during the sampling period in the living rooms. They found that over 24 h, levels of PAHs measured were 3–5 times higher in the wood-burning homes. Median concentrations of BaP equivalents were 0.88 ng/m3 for wood, 0.23 ng/m3 for control homes and 0.74 ng/m3 for outdoors. Phenanthrene was the most abundant PAH measured across all homes. The total PAH cancer potency (sum of BaP equivalents) was almost four times higher in the wood burning homes compared with the control homes, while the indoor BaP level of 0.52 ng/m3 was five times higher than the Swedish guideline of 0.1 ng/m3.
The lung cancer risk calculated from these studies is presented in Figure 7.
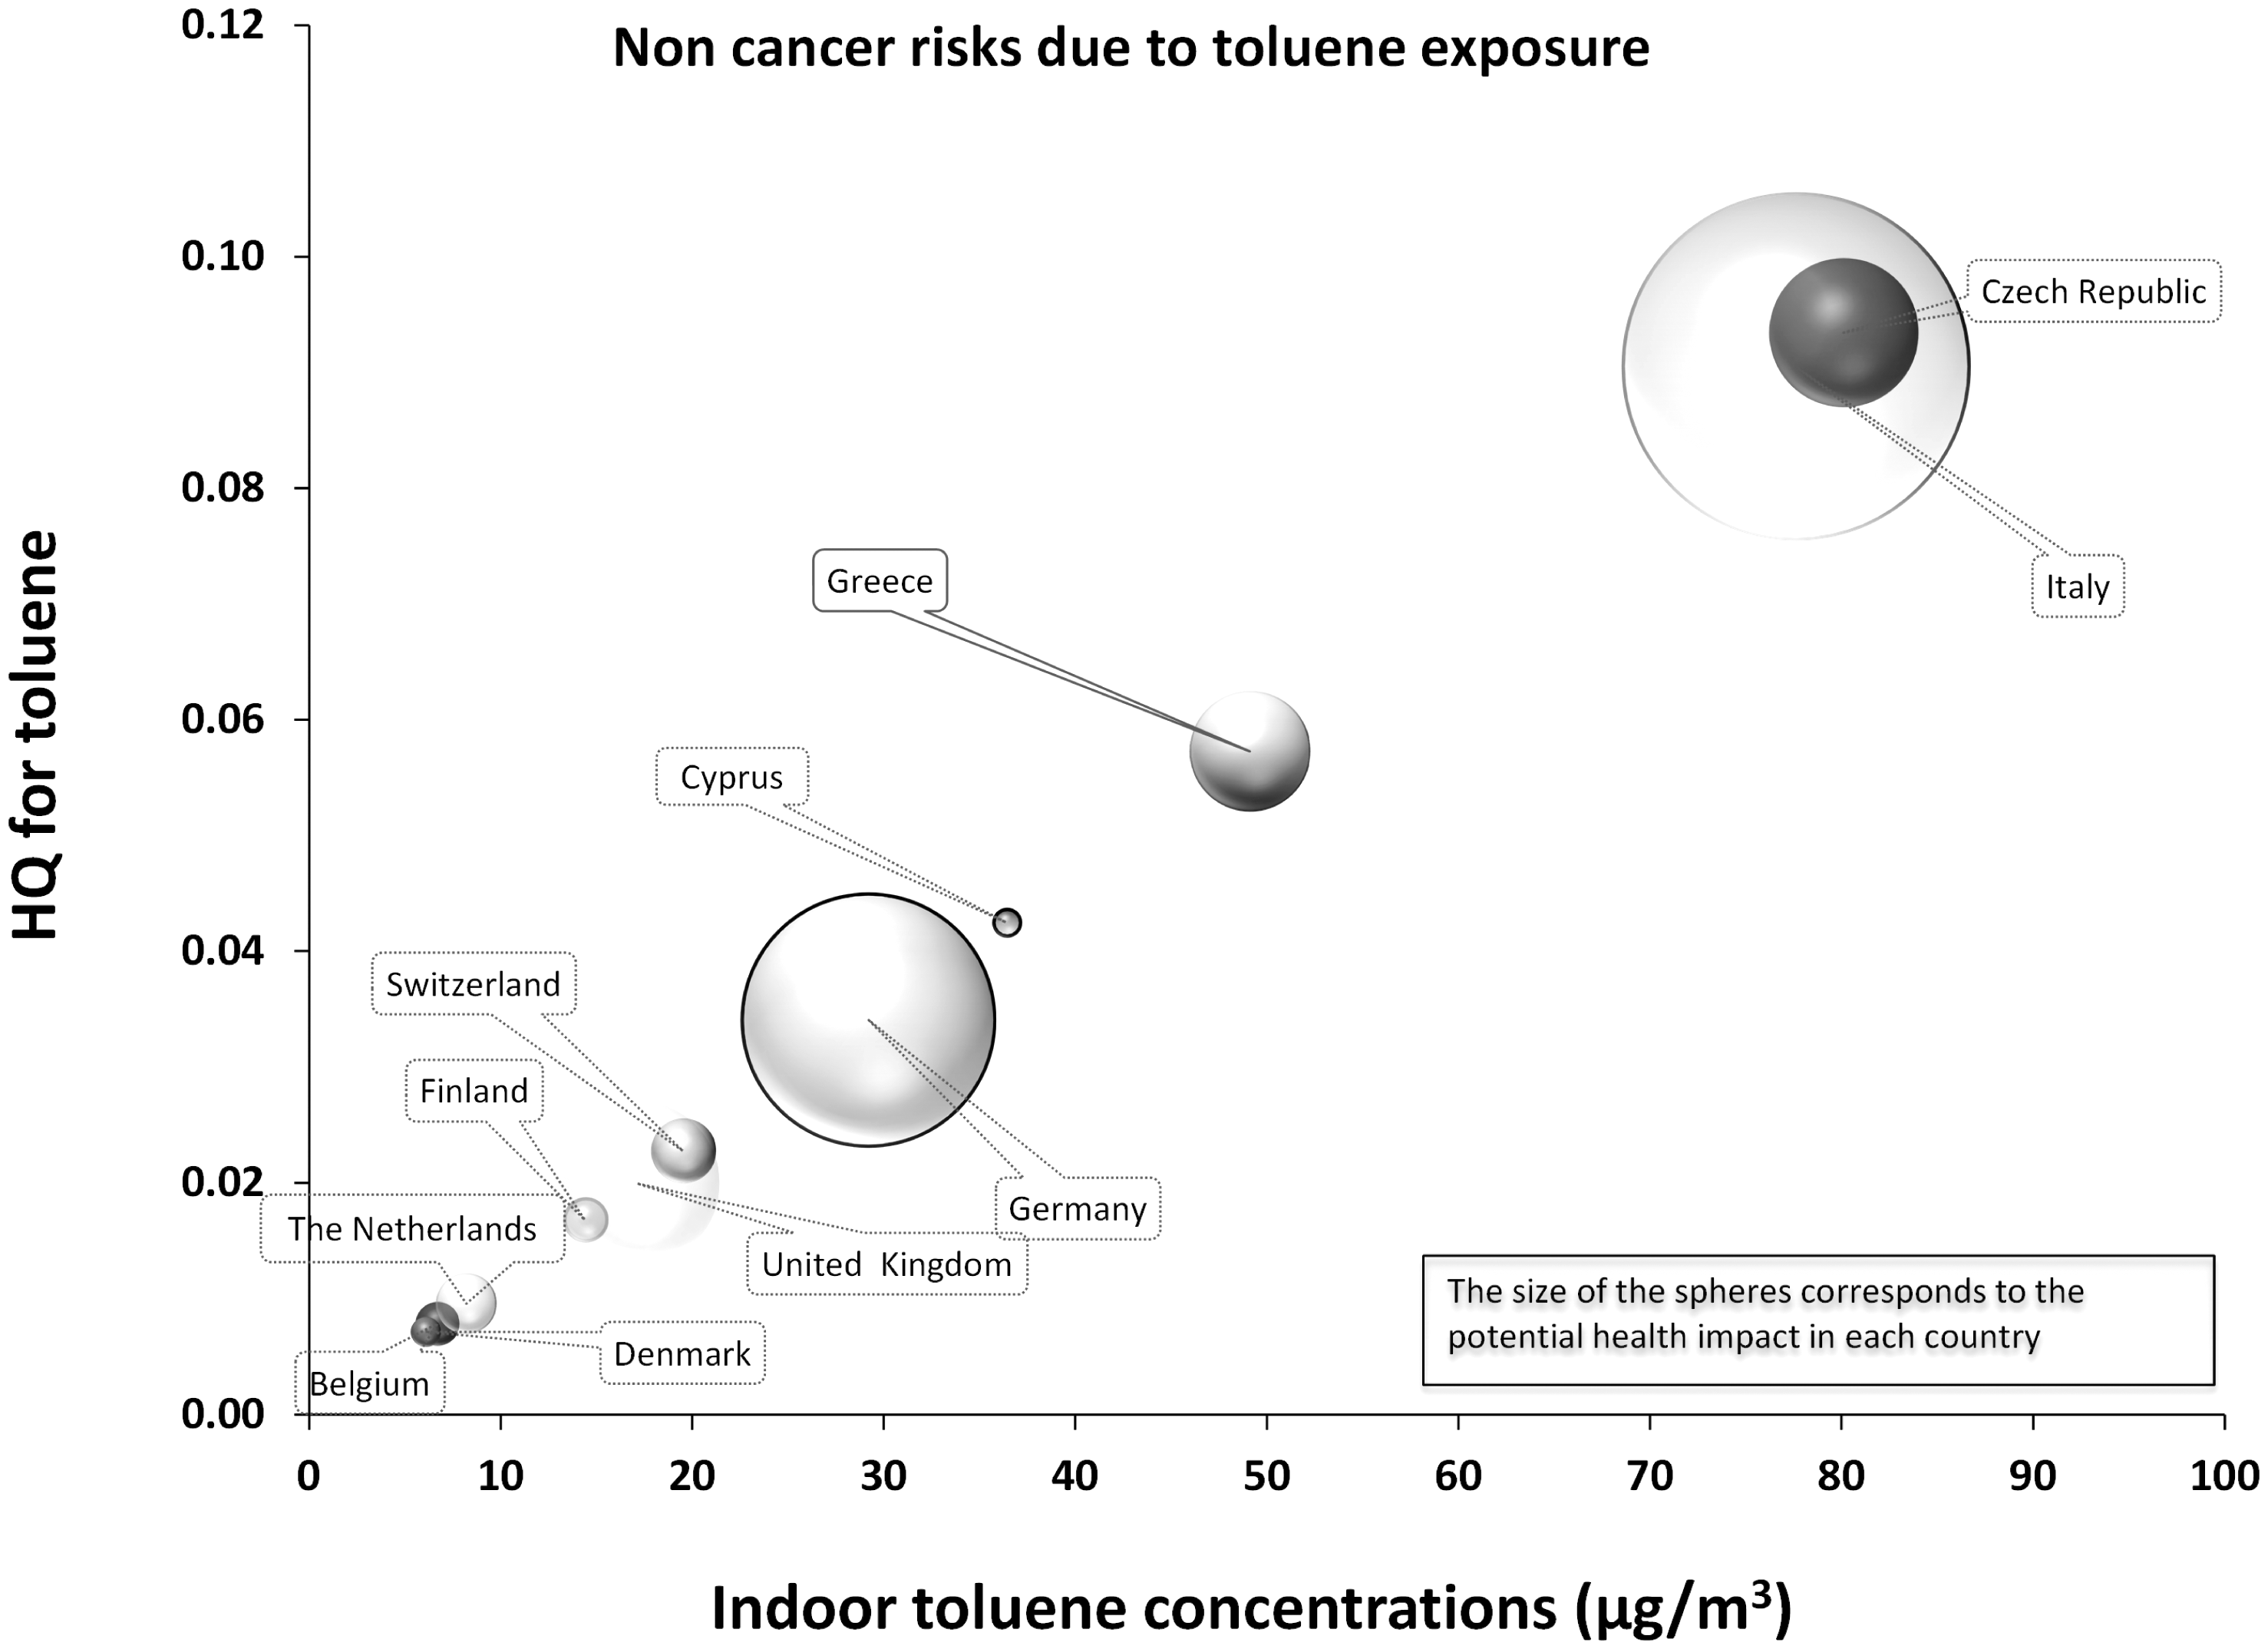
Indoor B[a]P concentrations and the associated lung cancer risks. Indoor benzene concentrations and the associated leukaemia risks. Indoor toluene concentrations and the associated non-cancer risks.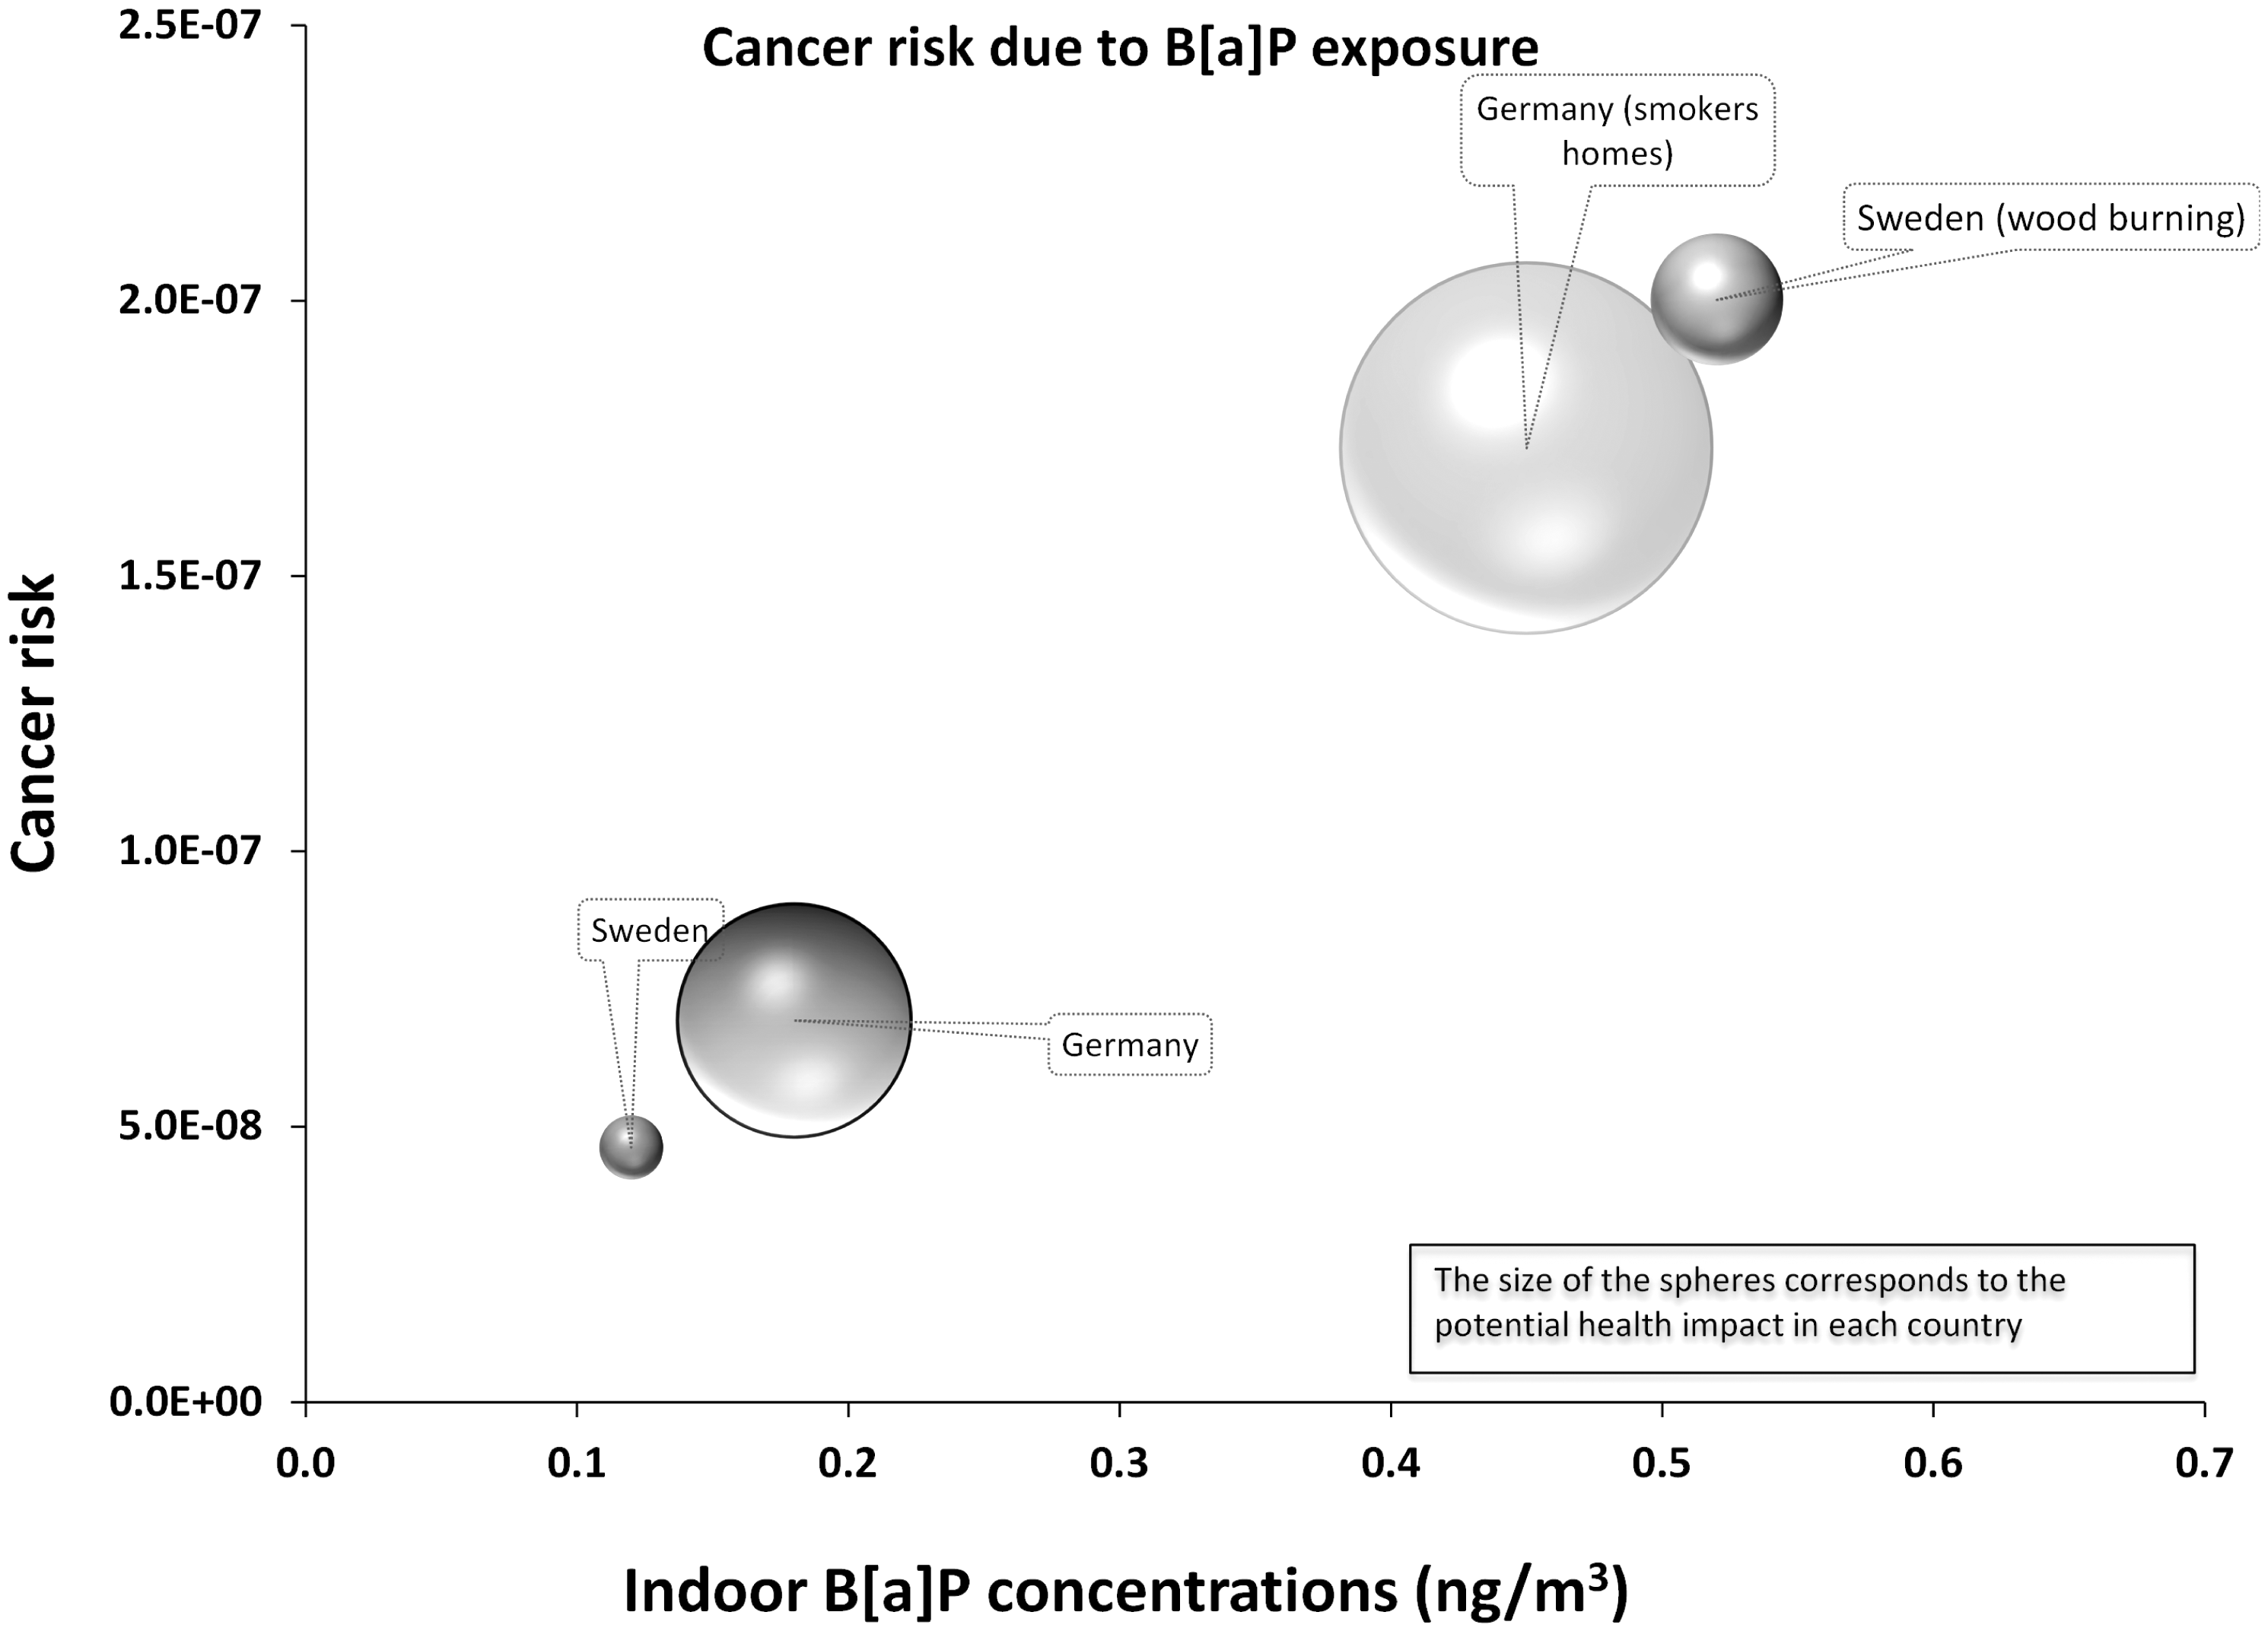
BFRs
Five recent studies from the UK (2), Sweden, Greece and Germany provide measurement data on PBDEs in homes.
In 2008, Mandalakis et al. 59 used passive samplers to conduct a study in Greece measuring airborne levels of PBDEs (19 congeners) in a number of microenvironments including five homes. The mean concentration found in the homes measured was 8 pg/m3, compared with outdoor concentrations of 18 pg/m3. They concluded that inhalation intake represented a small proportion (∼1%) of overall daily exposure. Their results yielded lower average concentrations of PBDEs than other studies of indoor environments. 61 PBDE concentrations were higher in UK offices compared to homes and they estimated exposure via inhalation and dust ingestion to be 9 and 37%, respectively, in adults and 2 and 69% in infants. 61 The results from the UK study are comparable with data from a study conducted in Germany 63 that found the mean concentration of PBDE congeners in indoor air in 34 residences to be 38.4 pg/m3 (and 73.1 pg/m3 when the congener BDE 183 was added).
Two widely used BFRs: tetrabromobisphenol A (TBBP-A) and hexabromocyclododecanes (HBCDs) were measured in indoor air (n = 33) and indoor dust (n = 45) in homes in Birmingham, UK, together with concentrations in outdoor air. 62 The indoor air samples yielded concentrations of 180 pg/m3 for HBCD and 15 pg/m3 for TBBP-A using passive samplers. No significant difference was found in air or dust for either compound from homes and offices.
Nicotine
Three studies of airborne concentrations of nicotine were identified in our review. These papers measured levels in residential settings in Sweden, The Netherlands and Germany. One multi-centre study used passive monitors over 2 weeks in living rooms in over 1000 homes. 66 The range of air nicotine concentrations were from <0.08 µg/m3 (limit of detection (LOD)) to 14.3 µg/m3 in Germany, from <LOD to 10.2 µg/m3 in The Netherlands, and from <LOD to 3.2 µg/m3 in Sweden. Another study of 190 non-smokers in Sweden during 199464 showed that median exposures to nicotine of non-smoking occupants living in smoking homes were 1.1 µg/m3 compared to < 0.05 µg/m3 for those living in non-smoking homes.
Brunekreef et al. 65 conducted a similar study in the homes of smokers and non-smokers as a part of the Prevention and Incidence of Asthma and Mite Allergy birth cohort study. They measured air nicotine in 90 homes for 2 weeks between November 1997 and March 1998. In homes where 11–15 cigarettes were smoked daily during the measurement period, the average nicotine concentration was 2.8 µg/m3 while for homes where >15 cigarettes were smoked, the mean concentration rose to 5.95 µg/m3.
VOCs
There is a substantial body of literature reporting concentrations of VOCs in residential settings. Our review identified 23 studies with details of measured levels of VOCs from homes across the EU including Sweden (3), Germany (7), Greece (3), the UK (5), Italy (2) and France (2), Spain, Belgium, Poland and Switzerland.
Palmiotto et al. 70 measured the concentrations of 10 aromatic amines in nine homes in Italy. In five non-smoking homes concentrations were between 5 and 11 ng/m3 but in the four smoking homes the levels increased to between 15 and 33 ng/m3.
A pilot for the German INGA study described earlier investigated the VOCs: benzene, toluene, ethyl benzene and xylene (BTEX) in 20 homes. 68 Passive samplers were set up at three heights in living rooms (0.7, 1.2 and 2 m) and at 2 m in bedrooms and kitchens over 7 days. They found no significant difference between median values of weekly average air concentrations of BTEX in the different height measurements. Also within the INGA study, BTEX were measured in 631 homes on two occasions in two regions of Germany over 1 week. 36 In living rooms, median values found were as follows: benzene 2 µg/m3 (maximum 91.7 µg/m3), ethyl benzene 1.5 µg/m3 (maximum 63.4 µg/m3) and toluene 35.7 µg/m3 (maximum 918.5 µg/m3).
In 2006 exposure levels were measured for toluene and xylene using passive air samplers in 50 homes in Athens. 73 Measurements collected six times throughout a 1-year period identified that factors influencing indoor concentrations were the type of floor covering, type of heating and recent painting. Annual average levels found were 36 µg/m3 for xylene and 39 µg/m3 for toluene.
Also in Athens, Chatzis et al. 100 measured average benzene levels over six 5-day sampling campaigns over a 1-year period. They found proximity to busy roads a factor influencing indoor levels, and in the 50 non-smoking homes they measured, they found an annual mean of 10.2 µg/m3 which is much lower than reported by Alexopoulos et al. 73 They suggested that climatic factors could influence the type of wall and floor coverings used and due to that, exposures in Greece may differ greatly to those in northern European locations.
In Rouen, France, benzene was measured on 5 consecutive days in the homes of 21 non-smoking parents with children aged 2–3 years. 71 This study assessed personal exposure of children to benzene by computing time weighted averages of exposures in bedroom, day care centre and outside, together with simultaneous collection of urine samples. The average concentration in children’s bedrooms was 10.9 µg/m3.
Gustafson et al. 51 study of homes in Sweden where wood is burned for fuel found increased levels of benzene in wood-burning homes when compared to control homes (3 µg/m3 versus 1.5 µg/m3). These levels were considerably lower than those found in Athens,71,73 although the Swedish study was based on only 24 homes. Wood-burning homes also had higher median levels of 1,3-butadiene at 0.23 µg/m3 compared to the control home levels of 0.11 µg/m3. In a linear regression model, type of stove, number of hours burning and number of times wood added were significant factors for indoor levels of 1,3-butadiene. Also in Sweden, Emenius et al. 67 measured total VOCs in 56 single-storey homes and found that homes with mechanical ventilation had significantly lower concentrations compared to naturally ventilated homes (149 µg/m3 versus 373 µg/m3, p < 0.0001).
Total VOCs were sampled over a 4-week period in the study of 867 randomly selected English homes. 24 The GM value was 210 µg/m3 with values ranging from 15 to 3360 µg/m3. Fifteen VOCs were measured in a number of varied microenvironments in 12 homes (six smoking, six non-smoking). 69 Daytime variations in concentrations were represented by three measurement periods over 24 h between November 1999 and February 2000 in Birmingham, UK. Higher mean concentrations indoors than outdoors for all VOCs measured were found, but no correlation was found between simultaneous measurements. In smoking homes, significantly higher concentrations of 1,3-butadiene were detected. A study of homes in Leipzig, Germany 74 reported concentrations of between 35 and 80 µg/m3 in domestic air samples analysed for 25 organic compounds over 1 week using passive samplers.
Personal exposures of 100 adult non-smokers living in the UK, as well as home concentrations of 15 VOCs were investigated in a study carried out by Delgado-Saborit et al. 87 For the case of benzene the mean concentration (µg/m3) ranged between 2.2 and 1.97 for personal exposure and home measurements, respectively.
Elke et al. 88 confirmed that passive batch samplers in combination with HS-SPME using a Carboxen–PDMS fibre are suitable for short-term measurements of BTEXs in indoor air at environmental concentrations. Compared to traditional passive sampling techniques, this results in a drastic gain in sensitivity and enables detection limits for BTEXs below 1 µg/m3 for 2 and 24-h sampling intervals. The results obtained using preconditioned samplers, which were exposed for 30 min in a smoker’s room, show that even such a short exposure time is sufficient for screening purposes. The mean concentration of benzene measured in the room was 10.6 µg/m3.
The study by Esplugues et al. 89 provides individual BTEX exposure levels of 1-year-old children from the general population in Spain. The levels measured inside the homes of these children were 2.5 times greater than the outdoor levels observed, with an important percentage of the indoor levels dependent on those found outside (65%). Passive VOC samplers were set up at 352 homes for a period of 15 days. The mean concentration of benzene indoors (living room) was 2.7 µg/m3.
In the study carried out by Field et al. 90 benzene concentrations were measured in the homes of 52 citizens of Brussels, Belgium. The median value of 6.3 µg/m3 was twice the value of the city background air. However, when indoor sources, including tobacco smoke were not present, the outdoor levels determined the measured concentrations at these locations.
A sample of 67 healthy non-smokers was monitored by passive samplers during two 4-week day campaigns in winter and late spring in the study by Fondelli et al. 91 Simultaneously, benzene measurements were also taken for a subset of participants, inside and outside their houses. The mean and median benzene concentration in the volunteers’ apartments was equal to 4.3 and 4.0 µg/m3.
In the study carried out by Hulin et al. 45 VOCs were assessed in urban residences, in Clermond-Ferrand, France, during 1 week of the summer. The average concentration of these compounds was found to be 1.6 µg/m3. A study was performed on 21 2–3-year-old children and their parents recruited on a voluntary basis among non-smokers from the three largest day-care centres of the town of Rouen in France by Kouniali et al. 71 Average benzene concentrations were measured over 5 consecutive days with diffusive samplers. The following simultaneous measurements were carried out: personal exposure of the parents, concentrations inside and outside the day care centres, and inside the volunteer’s bedrooms. The average benzene concentration was found to be 10 µg/m3.
Six aromatic hydrocarbons (benzene, toluene, ethylbenzene and the three isomeric xylenes) were monitored by Ilgen et al. 92 in the indoor and outdoor air of 115 private non-smoker homes about half of which were located in two city streets in Hannover (Northern Germany) with high traffic density, the other half in rural areas with hardly any traffic at all. In the city streets with high traffic density, an average benzene indoor concentration of 3.07 µg/m3 and in the rural areas, an average benzene concentration of 1.84 µg/m3 was found.
A study aimed at determining benzene, toluene, xylenes (BTX) concentration levels in two typical apartments in a suburban area of Athens was presented by Saraga et al. 93 Environmental tobacco smoke contribution was investigated, as smoking activity was the main factor which differentiated the air quality in the two apartments – one of the inhabitants of the second apartment was a smoker. The GM value for the non-smokers and smoker apartment was 5.6 µg/m3 with values ranging from 1.8 to 8.91 and 6.85 µg/m3, with values ranging from 1.8 to 8.91 µg/m3, respectively.
Schlink et al. 94 investigated the impact factors that are defined according to the current knowledge and the feasibility in an epidemiological study using questionnaires. All measurements are categorized as to the levels of these factors. They found strong evidence for factors of general impact on most VOC components, such as the season, flooring, the type of the room and the size of the apartment. They have assessed exposure explicitly by using 601 measurements based on renovation, furniture, flat size, smoking and education level of the occupants. Benzene concentrations were found in 40 flats with factors ‘smoking’ and ‘location next to a busy road’. The GM value was 1.68 µg/m3.
Zabiegala et al. 96 conducted an investigation of IAQ and fluctuations of concentration by measurements of selected VOCs in two newly erected and remodelled buildings in the Gdansk region. The GM was 2.6 µg/m3 with values ranging from 0.1 to 404 µg/m3.
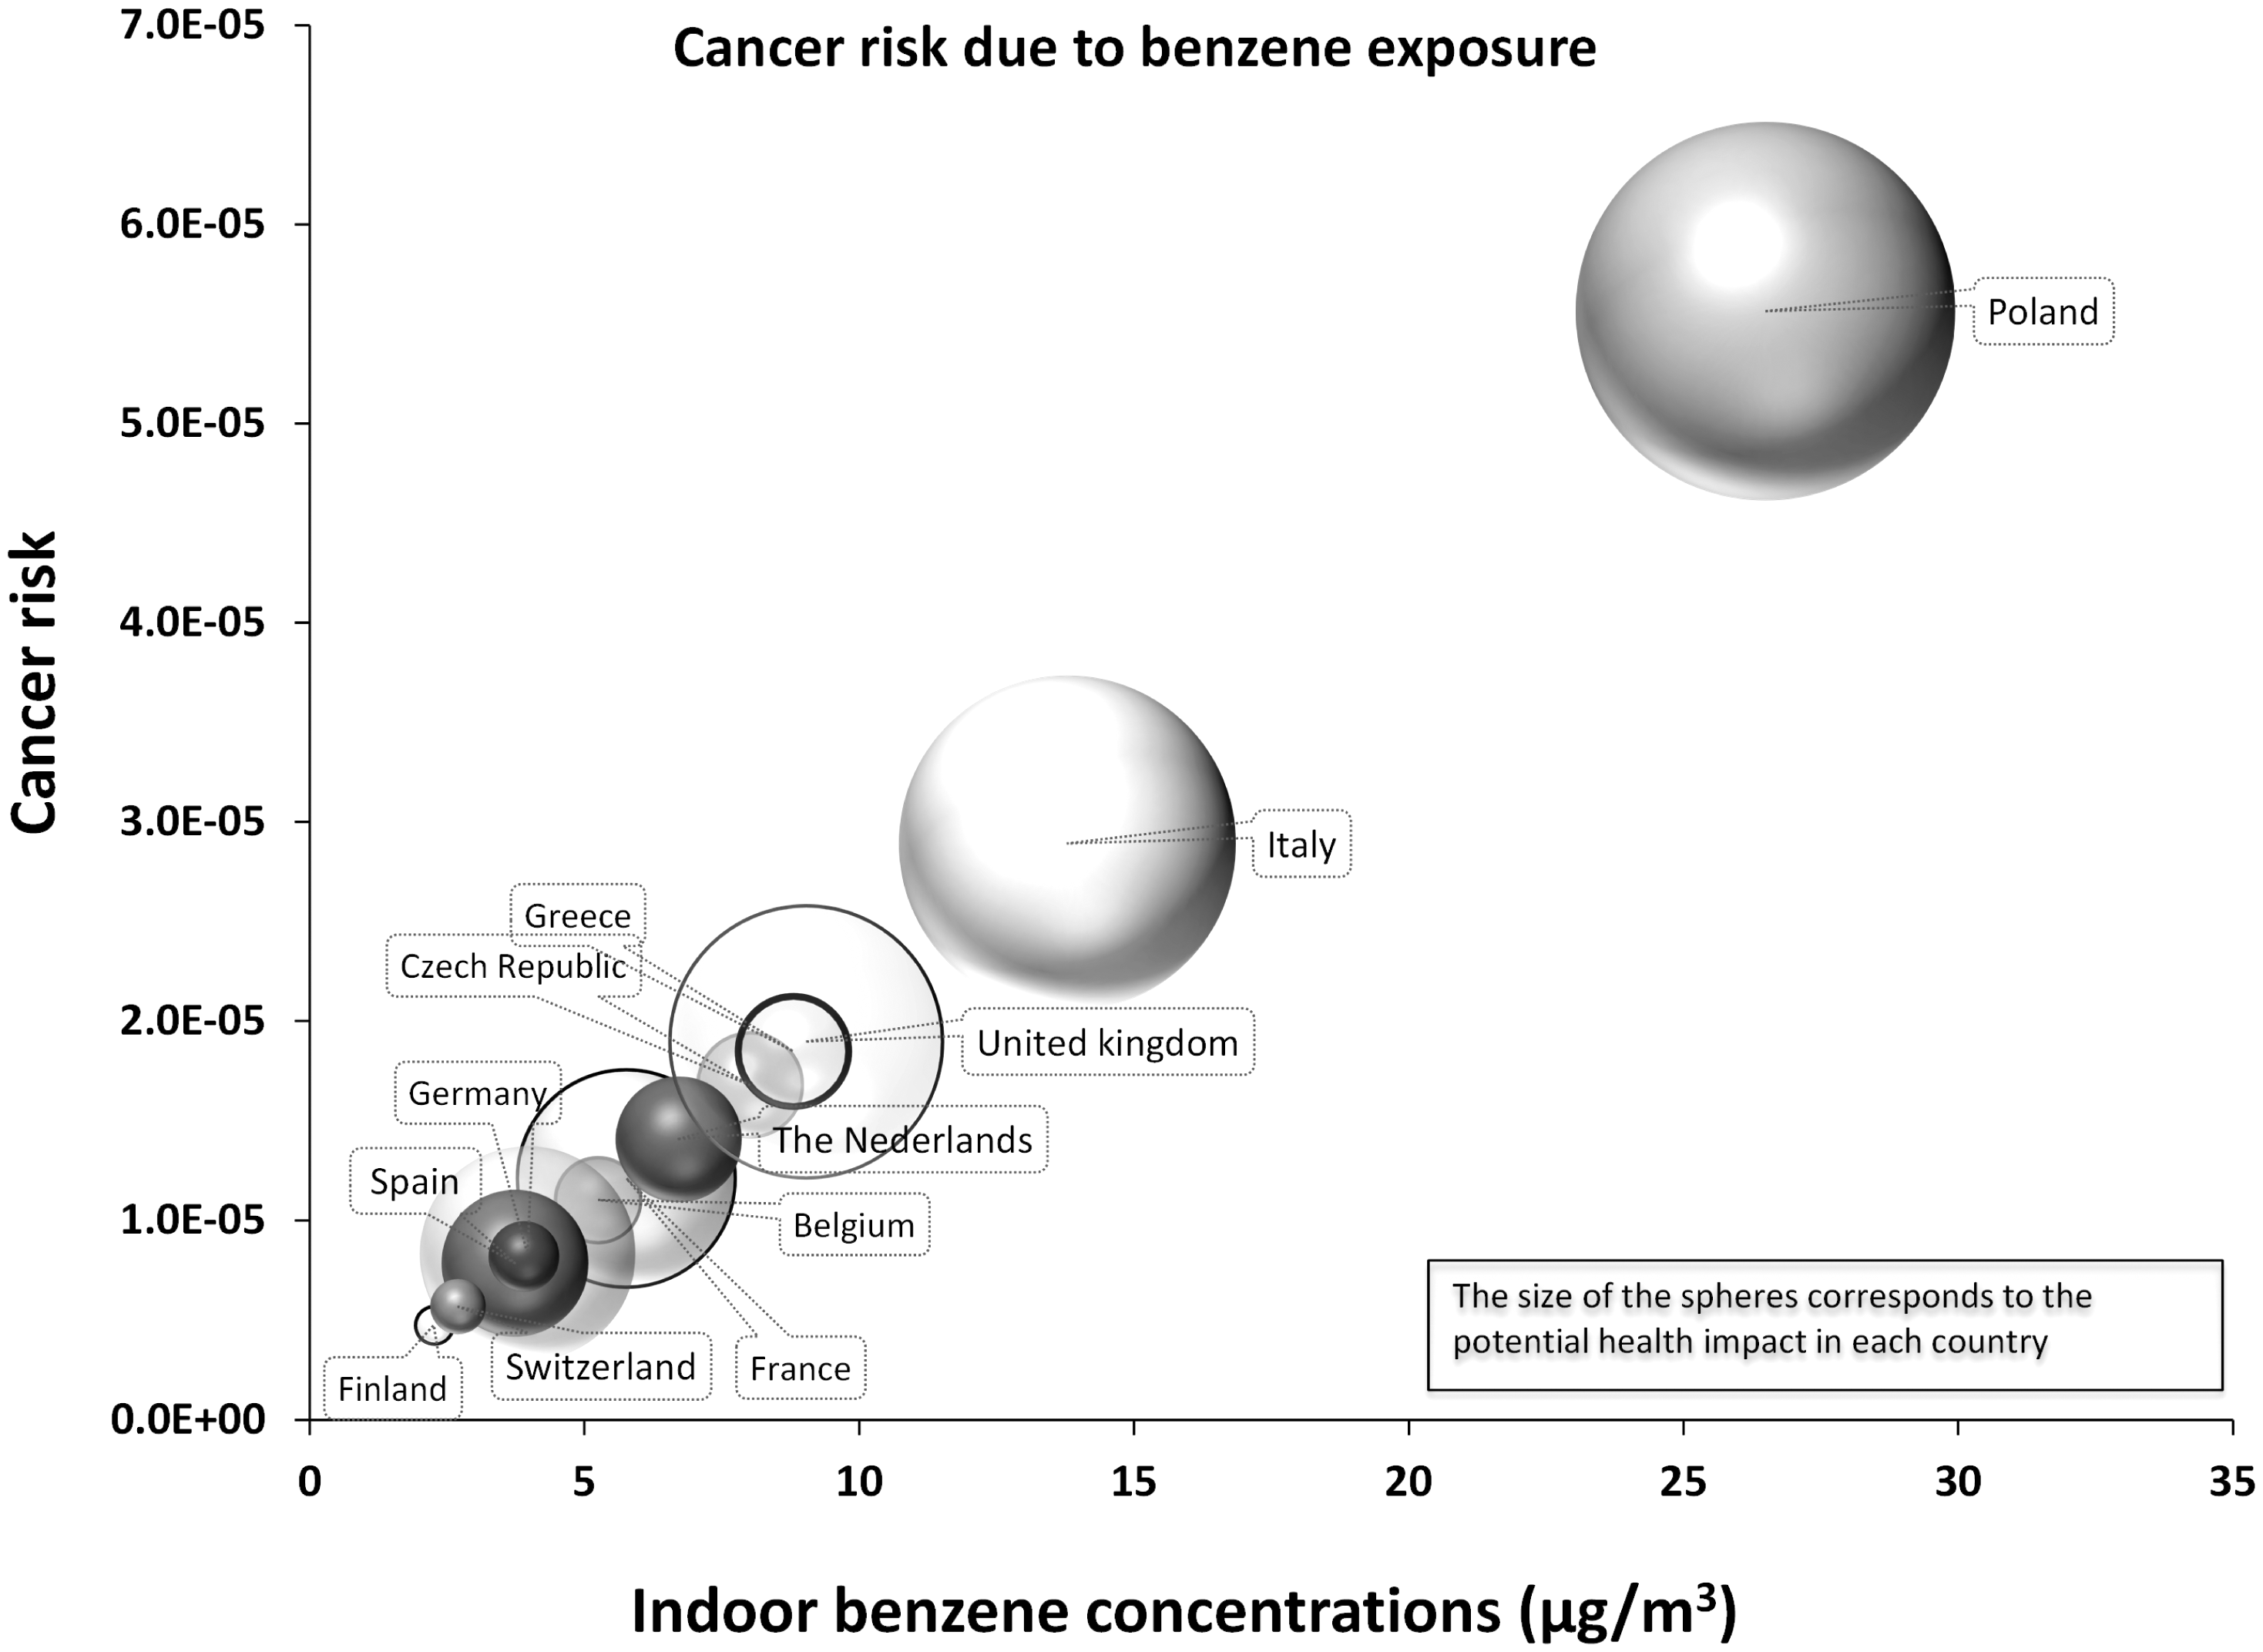
Indoor benzene concentrations and the associated cancer risks (leukaemia) are presented in Figure 8. Non-cancer risks due to toluene and xylenes exposure are presented in Figures 9 and 10, respectively.
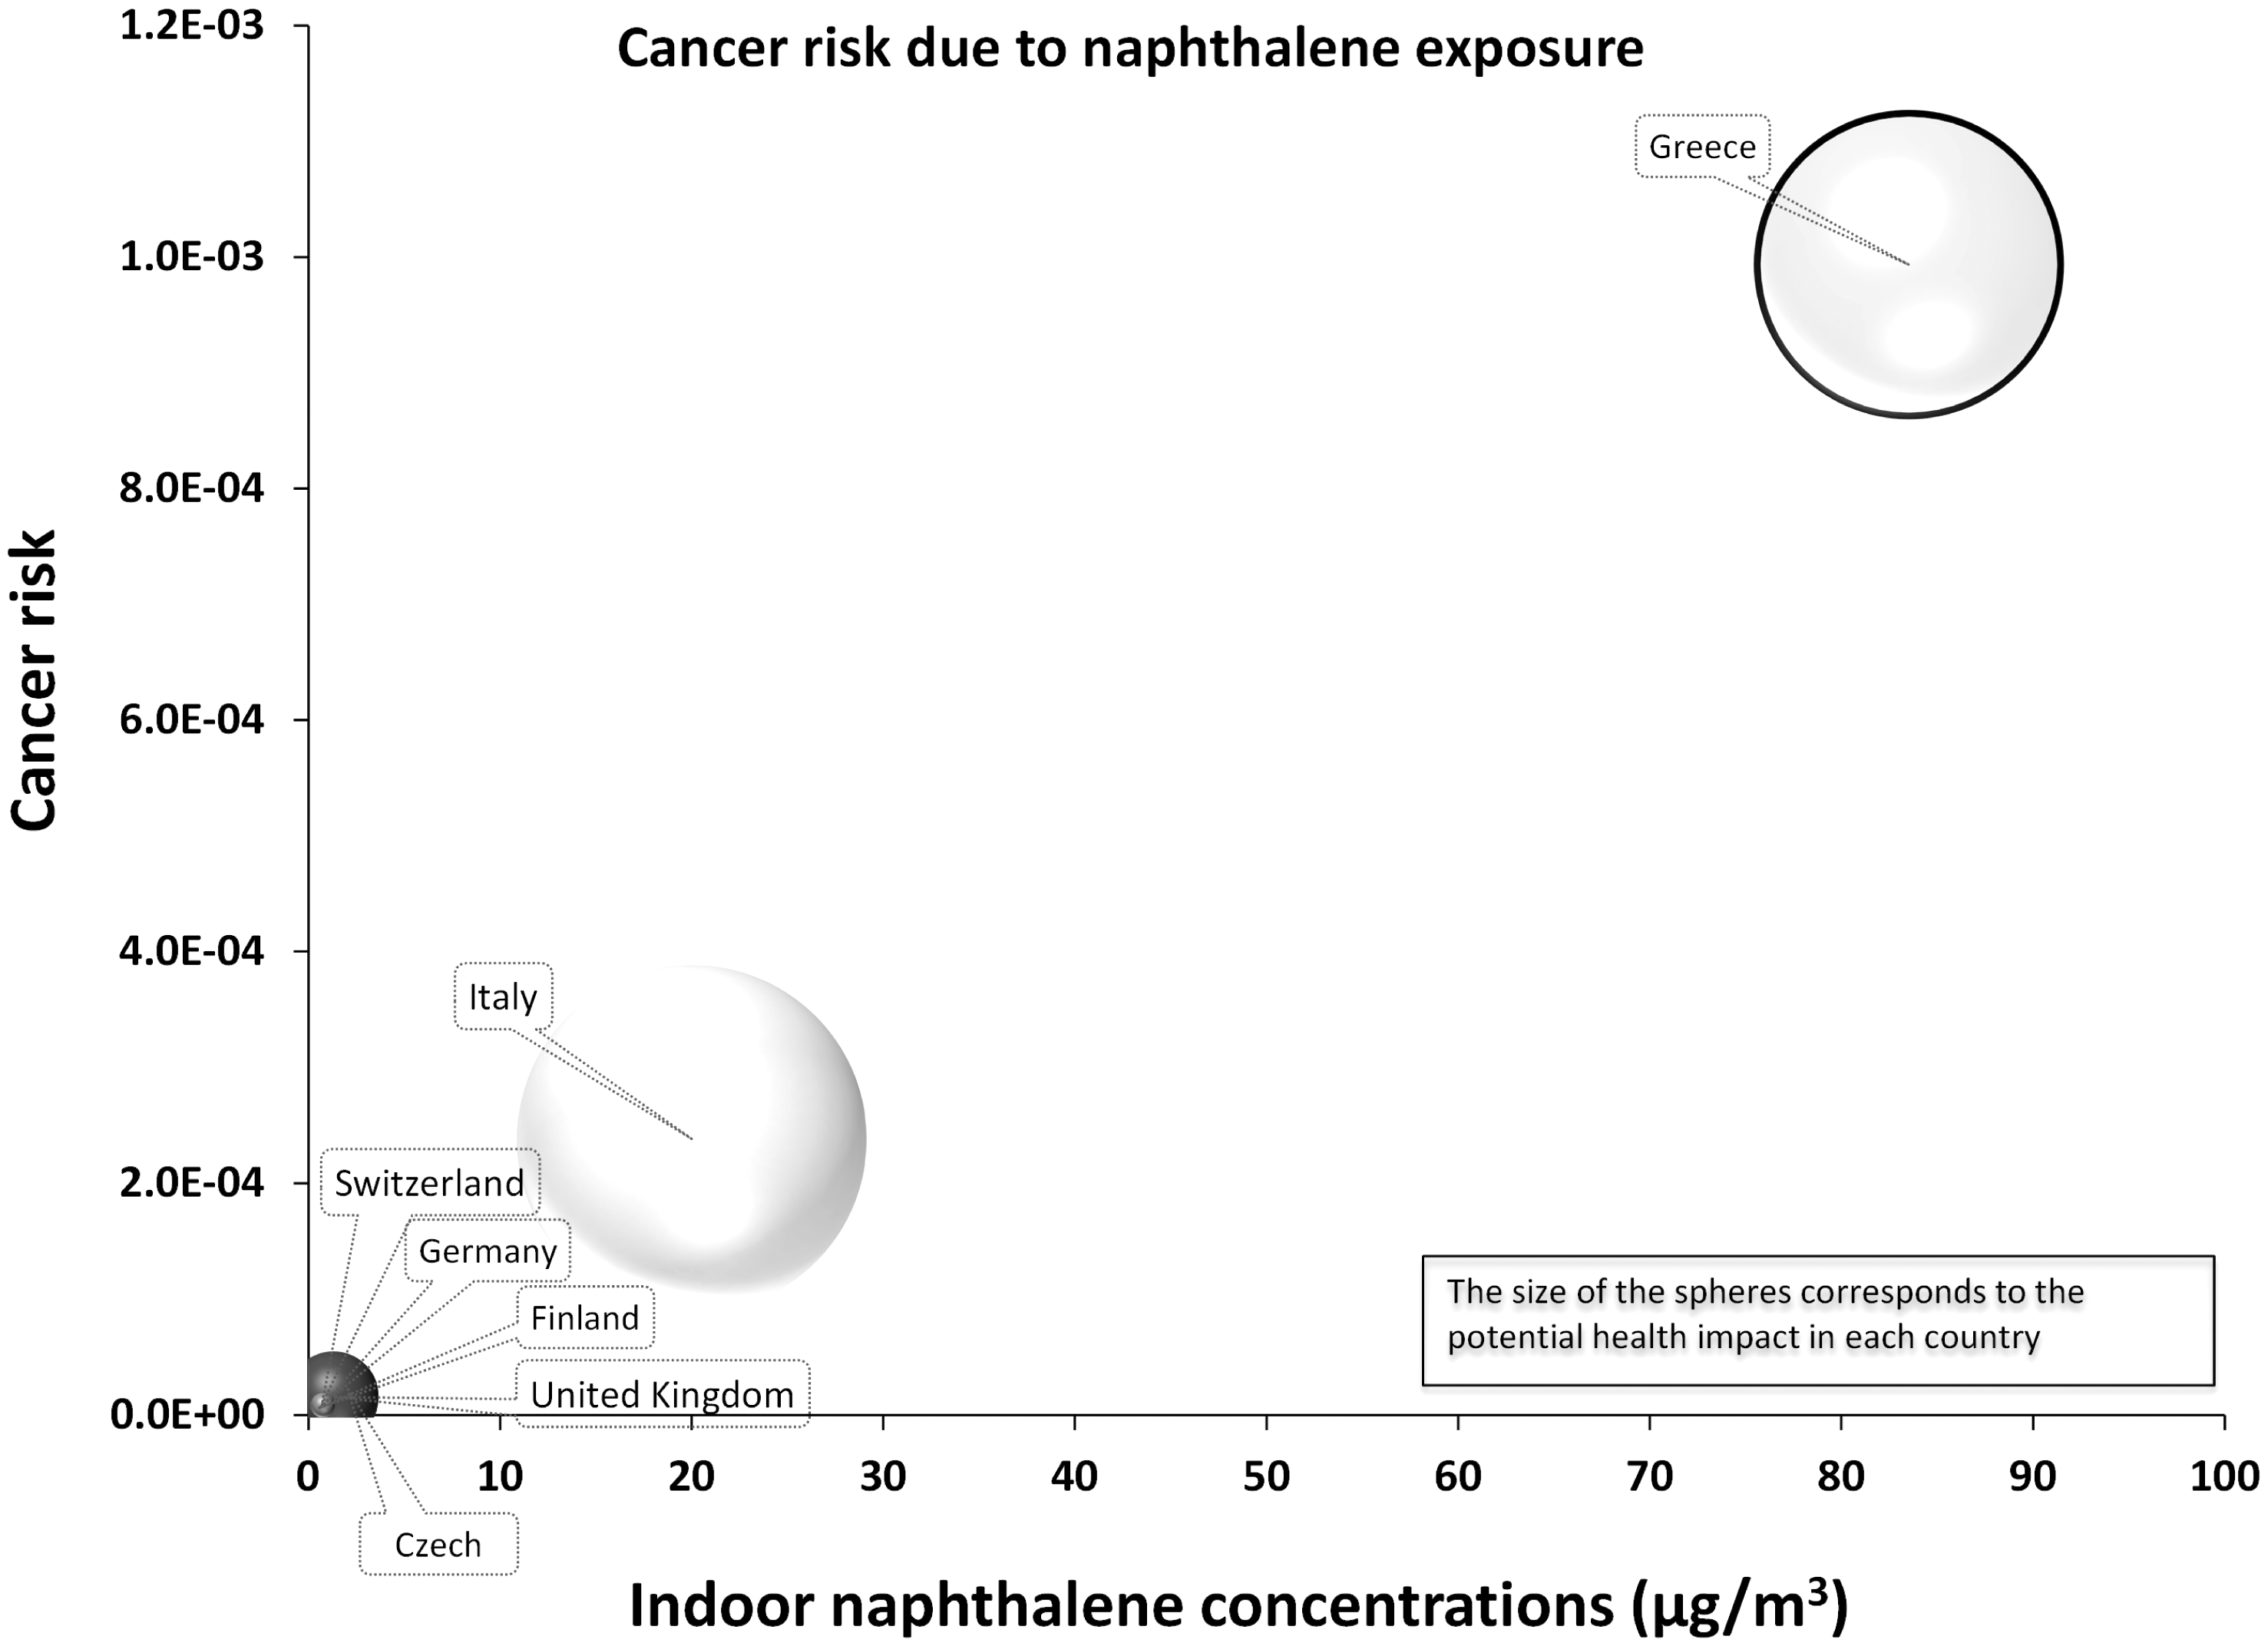
Indoor xylenes concentrations and the associated non-cancer risks. Indoor naphthalene concentrations and the associated cancer risks.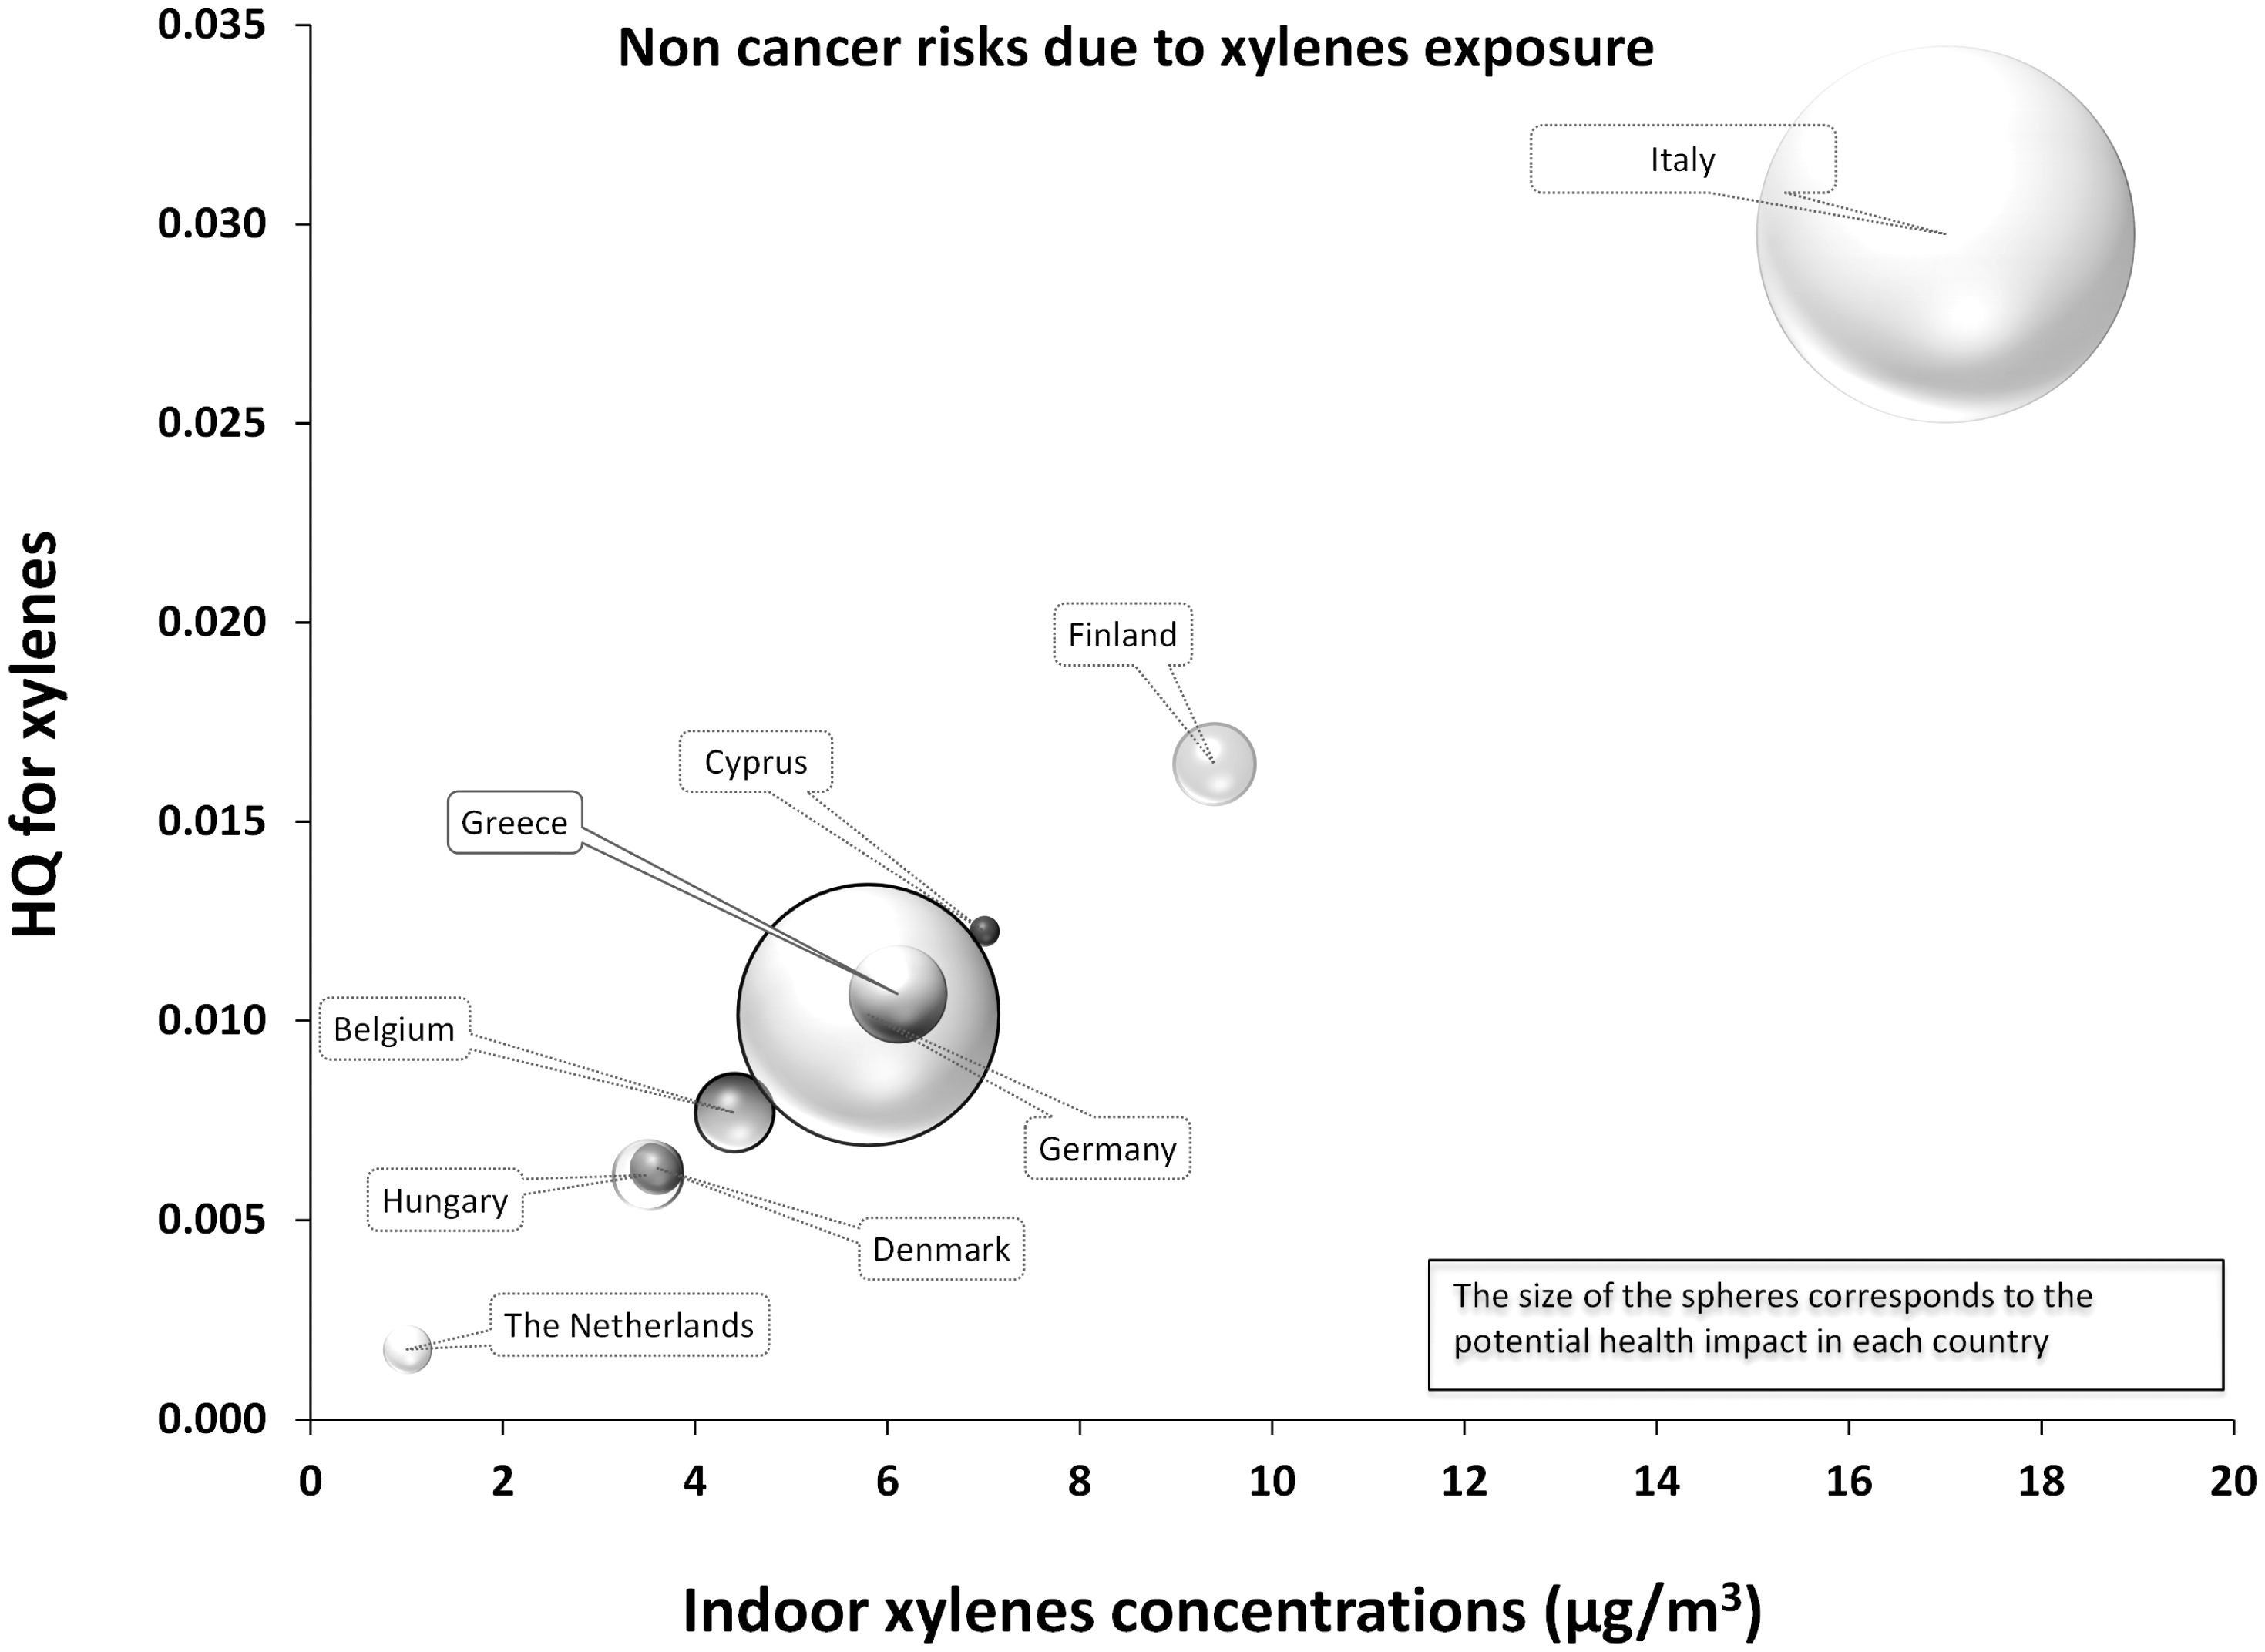
Discussion
The past decade has seen an increasing interest in the assessment of exposure to indoor air pollutants in homes. A number of studies examining the effect of different housing conditions (including presence of sources) likely to be linked to poorer or better IAQ have been carried out across both developed and developing world settings. Many studies examine the effects of IAQ on particular population groups such as those with pre-existing respiratory or cardiovascular disease and use surrogates of exposure (such as presence/absence of sources) or ventilation rates to infer relationships between IAQ and health. Sarigiannis et al. 12 carried out an extensive review on the occurrence of major organic compounds (benzene, toluene, xylenes, styrene, acetaldehyde, formaldehyde, naphthalene, limonene, α-pinene and ammonia, classified by the European Commission’s INDEX strategy report as the priority pollutants to be regulated) in dwellings and public buildings in EU countries. However, the current review extends across both organic and inorganic pollutants by bringing together the recent peer-reviewed literature published between 1995 and 2010, where measurement of chemical pollutants in gaseous phase has been performed in domestic or home-life settings within the EU.
We acknowledge that a substantial proportion, and perhaps the majority, of data on household IAQ exist in the ‘grey literature’, for example, in reports from councils, government bodies, regulatory agencies and consultancies. Furthermore, while our literature search was limited to results published from 1995 onwards it is inevitable that some relevant papers published just before 1995 would have been just as important as the ones published in 1995. However, it is justified to use a cut-off year in reviews such as reported here as the measured data become outdated and the usability of the older information is minimized. This is explained by the fact that significant changes in outdoor air quality are also reflected in indoor concentrations, especially for traffic originated compounds (e.g. benzene, NO2) in the absence of significant indoor combustion sources. However, in order to compare results among countries additional data for compounds such as naphthalene, xylenes and toluene were necessary. They were retrieved from the extensive review of Sarigiannis et al. 12
Much of the data presented in this review come from countries in the northern areas of the EU such as Sweden, the UK, Germany and the Netherlands. There appear to be much less IAQ measurement in southern countries. Concentrations of contaminants like benzene and CO are characterized strongly by outdoor levels and so the indoor/outdoor air interaction plays a more significant role in determining levels in homes in southern Europe compared to northern Europe, reflecting the differences in, for example, ventilation rate. The HQ for CO (Figure 2) is higher for southern countries (Italy and Greece), highlighting the influence of traffic component to IAQ, due to the higher indoor/outdoor air exchange rates, which are facilitated by the warmer climate conditions. 101 The influence of lower air exchange rates in northern countries is also reflected in the case of B[a]P; although B[a]P is a compound mostly related to traffic sources, the presence of indoor combustion sources such as smoking and wood burning results in significantly higher concentrations (and associated risks) up to five times (Figure 7).
The levels of formaldehyde and acetaldehyde in homes in northern Europe (Germany, Finland, Sweden) are higher than in the south, as a result of different household ventilation rates as well as the much more extended use of furniture and building materials emitting higher levels of formaldehyde. These differences are also highly reflected in the associated risks (Figures 4 to 6). Germany is a notable example.
From the above, it is obvious that IAQ and the associated risks result from a combination of outdoor influences and the presence of indoor sources. The latter is in turn influenced significantly by socioeconomic factors. The socioeconomic differences that affect both consumer product use and building materials/emission sources, together with climatic differences that affect the indoor–outdoor air exchange, are likely to result in a wide variation of measured concentrations of indoor air pollutants across the EU. Contaminants like naphthalene are exclusively linked to specific consumer products and behaviours and their use is often limited to specific regions of southern Europe (Greece, Italy) as shown in Figure 11. However, contextual information on household behaviours and possible determinants of exposure were rarely available in the papers included in this review. Such information is vital if we are to identify sources and particular activities that lead to increased exposures.
The complex array of factors differentiating exposures and risks associated to household indoor air across the EU result in different prioritization of policy interventions for risk management in different areas of Europe. Radon seems to be the highest indoor risk factor (due to its ubiquitous presence and its high carcinogenic potential), especially for countries like the Czech Republic, Finland and Sweden. On the contrary, for Germany, aldehydes risk is very high, comparable to the one due to radon exposure. From the other side, cancer risk due to benzene exposure in Germany is low, but in Italy and Greece benzene-associated risks are of major importance.
While we have grouped data by chemical type and listed information on sampling period we note that there is rarely a uniform sampling methodology employed across studies measuring the same pollutant and this may lead to systematic differences between studies. Differences in sampling media, location of samplers, analysis methods and how studies deal with values less than the LOD make it difficult to directly compare measurements. Our summary table (Table 2) includes columns for arithmetic and GM values, medians and minimum/maximum values and we note that most studies report arithmetic mean data despite the high likelihood that most data are log-normally distributed. A standard methodology for presenting IAQ measurement data would go a long way to allowing comparisons between studies and between countries. In spite of these deficiencies, we have assumed that all data are of sufficient quality given that it is published in the peer-reviewed scientific literature and we have not attempted to grade or assess the quality of the data presented in the papers.
This review confirmed the relative paucity in measured indoor concentrations in EU and the significant variability in the measurement protocols used and in the way in which the results are reported. Ideally the data would be for each EU country and would provide an even finer geographic and sociodemographic details to allow us understand better how exposures differ between areas and populations within each country. This, in particular, is a real problem with many of the studies identified in this review. The majority of the studies did not provide information on the surroundings (urban/rural, the type of the buildings) or the season of the measurements, even though they both affect the indoor concentration levels. Furthermore, much of the data are generated in case–control health studies or come from convenience samples of small groups of homes that have opted to take part in a research study; very few of the studies are large-scale studies including randomly sampled homes. Thus, even in cases where we have country-specific exposure data, the question of representatives of the collated data remains open.
Since there is no trans-EU or even national legislation prescribing monitoring and control programs for IAQ, no EU-wide systematic indoor air monitoring data exist. There is a clear need for harmonized criteria on monitoring requirements and measurement as noted also by Yu and Crump.
102
This would give an overview on what needs to be measured and how it should be measured, including: which pollutants should be measured in which settings; standardized measurement techniques; standardized analytical techniques; survey designs (including standardized time-activity data); period and frequency of measurements and importantly, standardized statistical tools for data evaluation and presentation. It’s clear that there is a real need for the scientific community dealing with IAQ issues to come together to discuss such issues and reach agreement on how best to harmonize measurement methods, sampling campaigns and presentation of exposure data. Any proposed sampling protocol framework towards harmonization in indoor air measurements across the EU should define the following requirements:
The number of samples should be representative of the population and sufficient to effectively support the exposure and risk assessment process. The distribution of samplers should take into consideration the spatial ‘density’ of the population with more samples gathered in more populated areas. The heterogeneity of the indoor spaces should be taken into account by taking large enough number of samples from variable indoor environments. Sampling should be carried out in both residential and non-residential locations. People spend one-third of their time in non-residential locations, thus a corresponding number of samples should be placed in non-residential locations. IAQ might be assessed either by passive or by active sampling. Although passive sampling is the dominant methodology (mainly due to simplicity and low cost reasons), the results obtained are time integrated and of low temporal resolution, a problem that does not exist when active sampling (which is much more expensive and complex method). However, in order to better access possible acute health effects (e.g. eye, lung or skin irritation) related to peak exposures and the determinants of IAQ, a greater temporal resolution is needed. Seasonal effects that might alter IAQ need to be captured. Sampling campaigns should try to span at least two seasons to gather data on the effect of changing weather conditions and weather-related behaviours.
This review was the first part of the INTERA project to enable characterization of human exposure to chemical pollutants in domestic indoor environments. Collating all recent existing concentration data was necessary in order to succeed in linking these levels and the associated risks to the specific exposure determinants such as specific consumer products use (naphthalene mobs, smoking) or prevalent socioeconomic/urbanization factors (proximity to busy roads). The review deals solely with data on airborne concentrations and therefore on exposure by the inhalation route. However, dermal uptake and oral ingestion are particularly relevant for many emerging pollutants such as phthalates (common plasticizers) and BFRs, rather than more traditional pollutants such as CO, NO2, benzene or formaldehyde. Phthalates and BFRs are characterized by high molecular weight and lipophilicity. As a result, a significant amount of the gas-phase released phthalates and BFRs (about 80%) tends to bind strongly to particulate matter and indoor dust, and thus become available for human contact via ingestion and dermal exposure pathways in a way that volatile and low molecular weight inorganic and organic contaminants are not. For indoor air pollutants there is therefore a need to take into account the environmental dynamics (gas to particles/dust partitioning) as well as the determinants of exposure including such as hand-to-mouth behaviour and house hygiene behaviours (e.g. dust removal/cleaning schedules).
Furthermore, a computational platform 103 for source-to-dose modelling was developed, allowing to estimate concentrations in air and household dust based on emissions and calculating exposures from various pathways/routes to estimate internal dose within different human tissues (e.g. bioaccumulation at adipose tissue) and concentration of metabolites. However, when measured concentrations are unavailable, more exposure determinants are needed to support calculations along the source–emission–concentration chain. In this case information on the assessed chemical (physicochemical parameters, amount of chemical in consumer products used indoors, emission factors of the chemical from indoor sources), frequency of emission (use habits of consumer products) and information defining the indoor environment (volume of space, ventilation rate) are needed. These additional data were out of scope of this review, but data on these parameters were actually collected during the INTERA project too. Access to this data is also provided through the online database to be used as default input data for user-defined exposure scenarios. Thus, the combination of modelling tool and database can be readily used for evaluating exposure and performing risk assessment of existing and new chemical products.
The concentration data presented in this review were integrated into the INTERA computational platform through an online database enabling calculation of exposure and dose estimates for user-defined scenarios. The dynamic environment of INTERA modelling platform allows the incorporation of several other determinants of exposure such as time-activity patterns and inhalation intensity based on activity levels. This allows the description of environmental exposure in an integrated framework and allows the identification of exposure (and eventually risk) differentiation under real life conditions. Figure 12 presents an illustration of the interest in capturing the dynamic interactions between exposure determinants. It describes the dynamics of typical concentrations and exposure variability of benzene in a Greek city.
104
External concentration variability is translated into indoor concentration variability taking into account building characteristics such as air exchange rate and building volume. Combined to time-activity dynamics of the residents, exposure and actual intake rate are also estimated in time, reflecting the actual effect that specific activities such as cooking or smoking and spending time in specific locations (e.g. kitchen or living room) have onto overall daily exposure. This is very important for exploiting the information gathered in this review to describe risks accurately and avoid unnecessary conservatism in risk assessment.
Outdoor, indoor and exposure benzene concentration daily variability.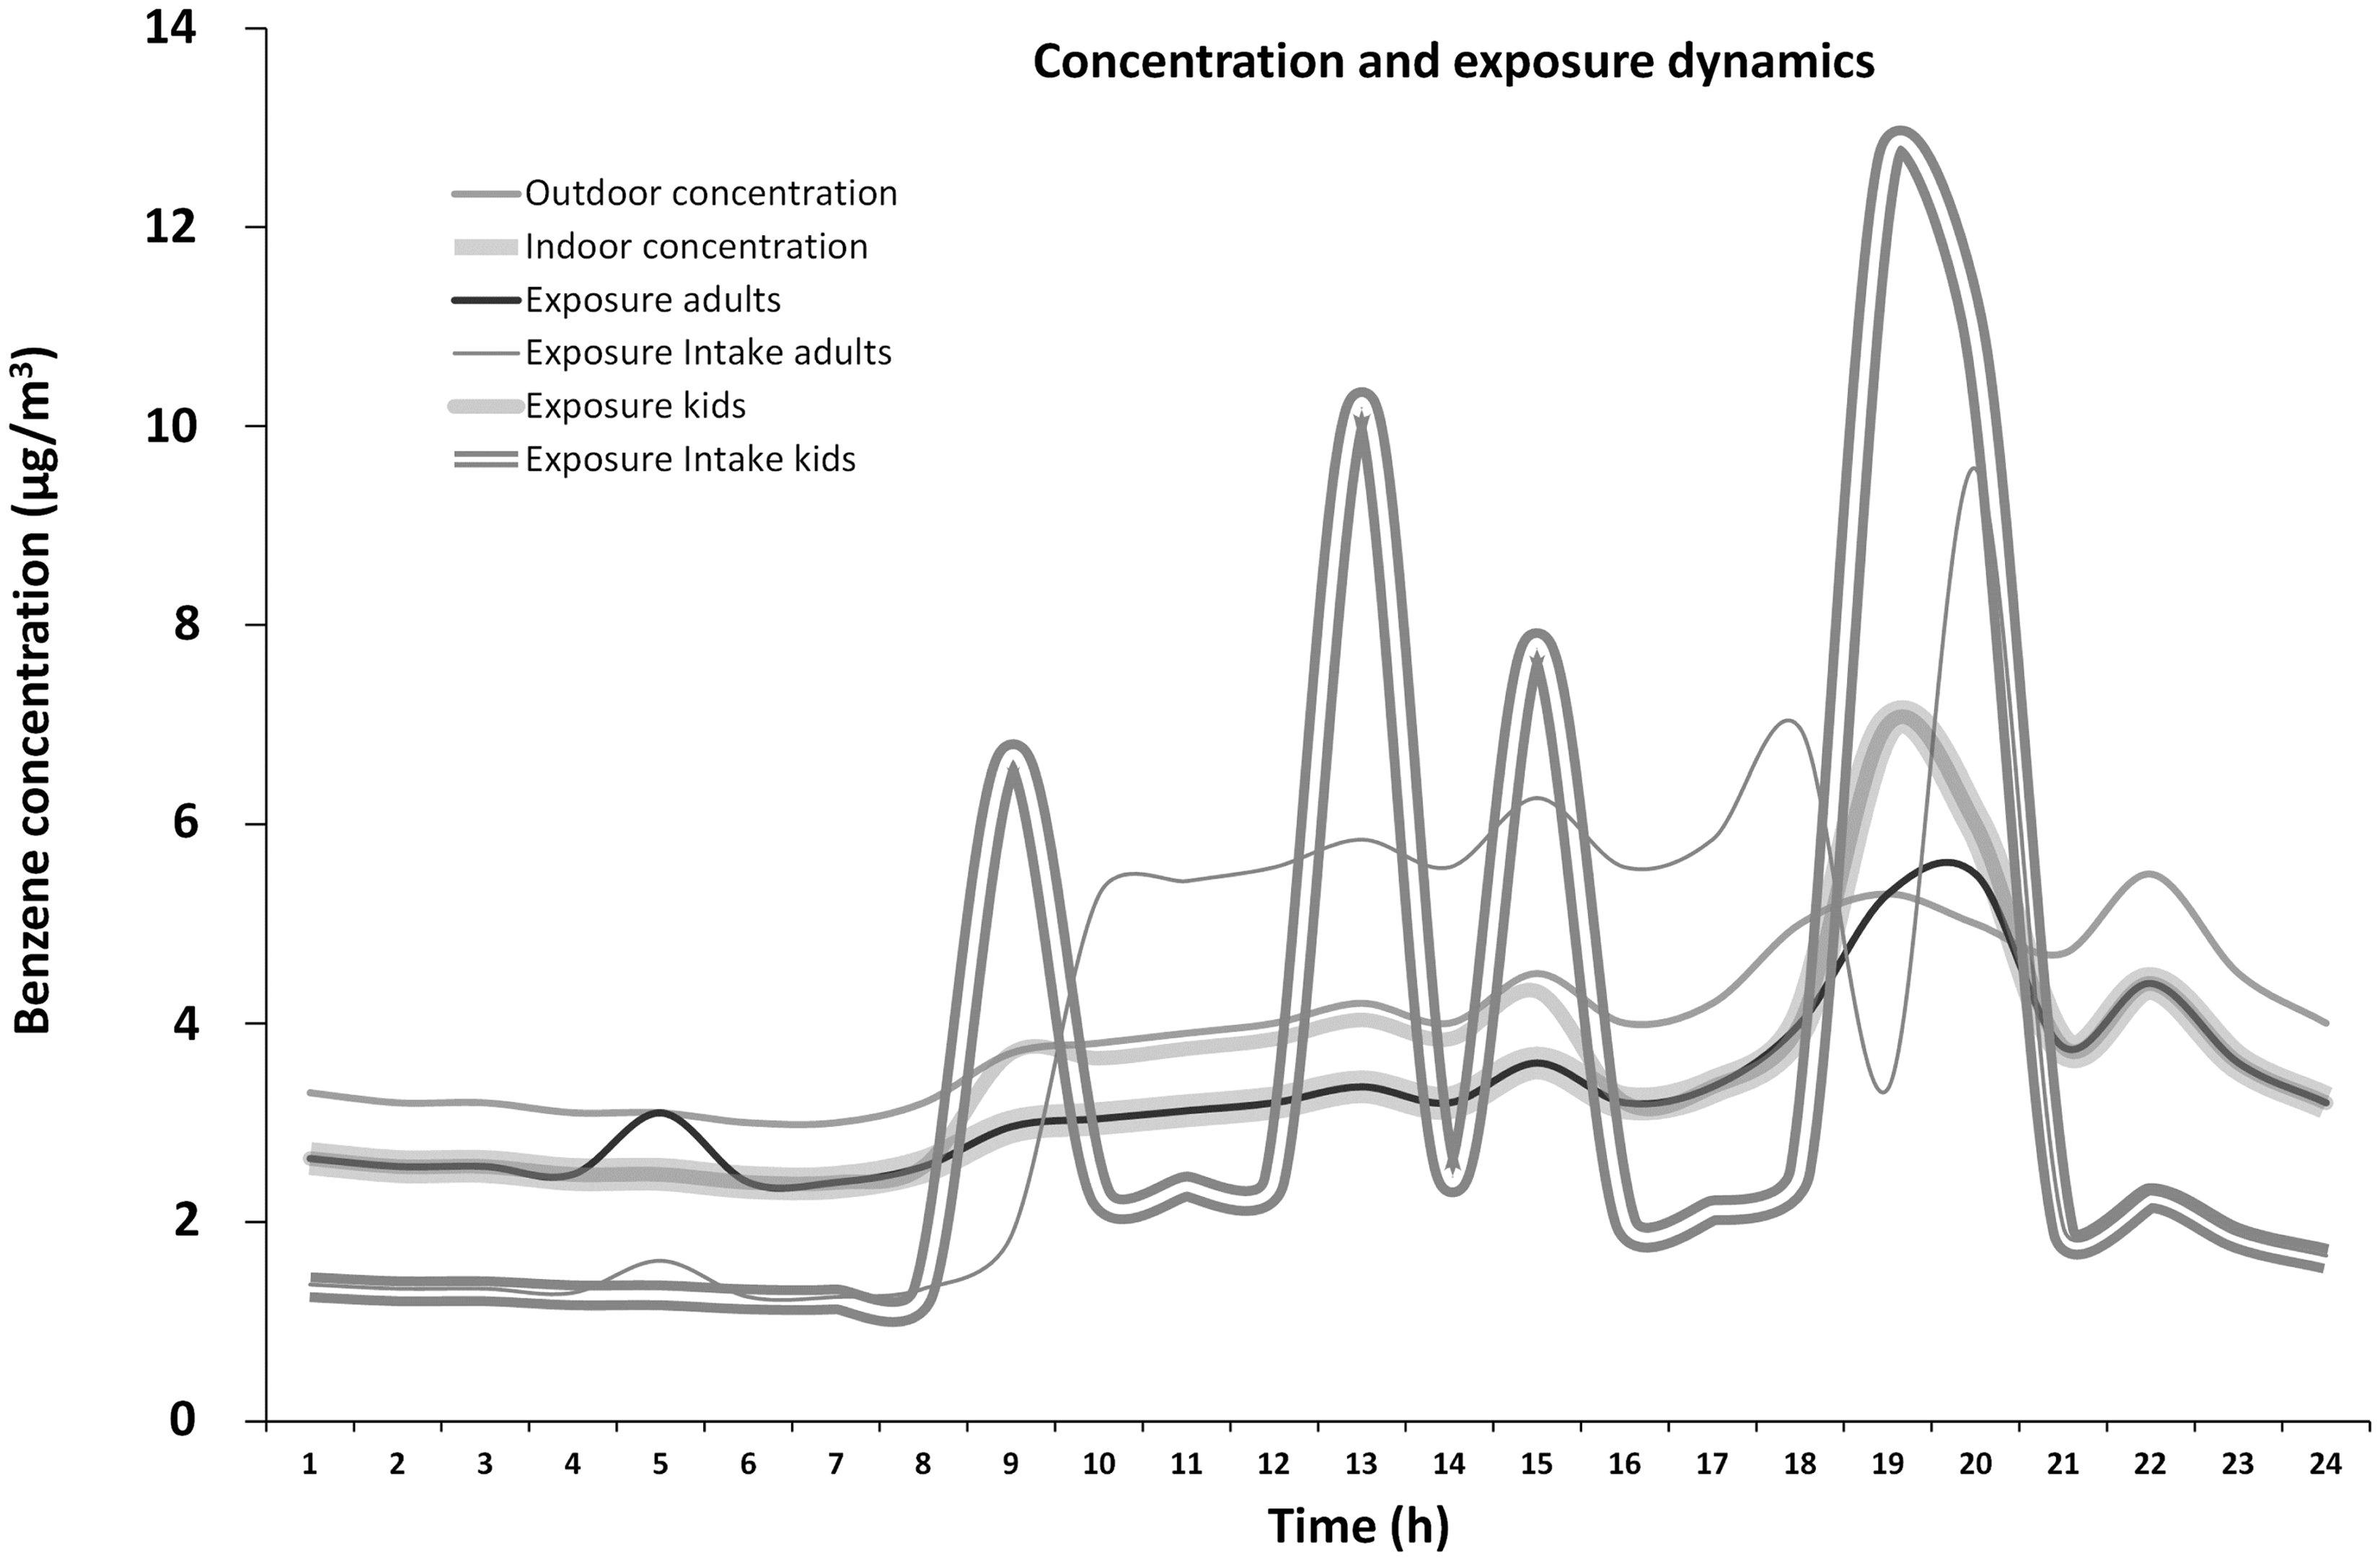
Conclusions
This review identifies the recent published peer-reviewed literature on airborne chemical pollutant concentrations in homes within EU countries associating them to the relevant risk as well as to potential health impacts. The number of studies describing measurements of chemical pollutants is not large with many of the papers describing small data sets. There is a major issue in finding data representative of typical households with a significant proportion of measurements being carried out for health studies using case–control designs; very few randomly selected cross-sectional studies exist. Data that does exist are difficult to compare between countries and between studies due to differences in measurement and analysis methods, primarily due to the differing aims and objectives of the reported studies and there is a real need for a standardized protocol for collection and presentation of indoor air pollution data in domestic settings. This should also include methods for assessment of the dermal and ingestion exposure routes and although the INTERA methodology/computational platform allows the assessment of exposure pathways beyond inhalation,9,105 this was beyond the scope of the current study. Many of these deficits are tackled when these data are used into a comprehensive modelling framework such as the one developed by INTERA; the latter allows the use of concentration data as a starting point of a comprehensive exposure and risk assessment framework, taking into account environmental (indoor/outdoor interactions, indoor/indoor interactions) as well as exposure (time activity patterns and inhalation intensity) dynamics.
Footnotes
Authors' contribution
All authors contributed equally in the preparation of this manuscript.
Acknowledgements
We gratefully acknowledge the help of Dr Lynsey Mills of the University of Aberdeen with formatting the manuscript.
Declaration of conflicting interests
The authors declared no potential conflicts of interest with respect to the research, authorship, and/or publication of this article.
Funding
The INTERA project was sponsored by the CEFIC LRI programme (grant number LRI B4 – THL).