
Abstract
This study investigated levels of airborne bacteria in 90 indoor sampling sites with no known complaints such as kindergartens, schools, homes and dorms over three seasons. Airborne bacteria samples were collected before and during the heating season in Çanakkale, Turkey. Also, a detailed occupant questionnaire was completed by one of the occupants (n = 90) in each sampling site. Total bacteria counts (TBCs) were found to be higher in the sampling sites where coal was used as a heating source and in kindergartens where the occupancy rate was highest (p < 0.05). Meteorological parameters were associated with outdoor TBC levels (p < 0.001). Associations were found (p = 0.05) for indoor TBC and other building factors (last floor covering/wall painting/renovation times, heating/cooking fuels and the age of the building). Indoor TBC levels together with the building-related factors (environmental tobacco smoke exposure, occupancy rate, distance to traffic, heating fuel, amount of carpet covering, and last wall painting time) and personal factors (gender and daily time spent indoors) were found to be associated with at least one group of the sick building syndrome (SBS) symptoms (p < 0.05). In particular, general SBS symptoms (headache, fatigue and dizziness) were observed more often in female participants (p < 0.05). In conclusion, there is a need to conduct more studies in larger populations to find the links between air pollutants and SBS symptoms.
Introduction
Airborne bacteria pose risks when the concentration is high enough to induce adverse health effects, 1 such as infections, allergies, toxic illness and asthma.2,3 Dose–response relationships and safe values for airborne bacteria for indoor environments have not been determined yet. Levels of airborne bacteria in indoor environments are related to microbial composition of outdoor air and the sources or activities done within the indoor environments. 4 When substantial indoor or outdoor airborne bacteria sources do not exist, the most significant factor that influences indoor bacteria levels is human presence.5–8
The scope of sick building syndrome (SBS) was first defined by the World Health Organization (WHO) based on earlier studies conducted in northern Europe and the USA indicating unspecified, combined, adverse health effects due to poor indoor air quality (IAQ). The most distinctive feature of SBS is a decrease in symptoms or their severity after leaving the ‘sick building’. The main symptoms of SBS, as defined by WHO, are: (i) eye, nose and throat irritation; (ii) sensation of dry mucous membranes and skin; (iii) erythema; (iv) mental fatigue; (v) headaches, high frequency of airway infections, and cough; (vi) hoarseness, wheezing, itching and unspecific hypersensitivity and (vii) nausea, dizziness. 9 Buildings are classified as ‘sick’ according to the complaint rate of the total occupants (e.g. 20%). 10 Studies have attempted to find the correlation between SBS and its potential causes. Passarelli 10 and Burge 11 pointed out the link between SBS and inadequate levels of maintenance. It was found that exposure to bioaerosols is associated with SBS and other hypersensitivity reactions.12–14 Moreover, the prevalence of SBS was found to be associated with reduced employee well-being, absentee rates and psychosocial factors.15,16 However, there are few studies that investigate the association between airborne bacteria levels and the prevalence of SBS symptoms, e.g.17,18
Heating activity can affect IAQ in two ways: (i) heating activity is mainly based on a combustion process, and several factors such as heater type, heating fuel and the heating conditions can result in both indoor and outdoor air pollution and (ii) the main aim of the heating activity, saving the heat by trapping relatively warmer air inside the building and keeping the relatively colder outdoor air outside the building, may not allow for the introduction of fresh air into the indoor environment. No studies have been conducted in Turkey to compare the influence of the type of heating fuel on IAQ.
Since the perception and public awareness of IAQ in Turkey is quite recent, studies conducted on this issue are limited so far. The aims of this study were (i) to investigate the variations of airborne bacteria levels in four types of indoor environments with no known complaints (schools, kindergartens, dorms and homes) before and during the heating season; (ii) to compare outdoor total bacteria count (TBC) levels with indoor TBC levels, (iii) to find the links between several environmental factors and TBC levels; (iv) to estimate the SBS symptoms among the occupants and (v) to find the associations between SBS symptoms and environmental factors. The results of this study will help to increase public awareness of the importance of providing better IAQ in developing countries such as Turkey.
Materials and methods
Study design
Airborne bacteria samples were collected from different types of indoor environments (n = 90) and their adjacent outside environments in Çanakkale. Sampling sites were located in the Barbaros, Esenler, Ismetpasa and Kepez districts. Esenler represented a semi-urban site, while others were designated as urban. Locations of the sampling sites are given in Figure 1. Throughout the study, three sampling campaigns were conducted at all sampling sites: the first one was in October, 2012 before heating season (autumn, n = 90); the second was from December, 2012 to January, 2013 during the early stages of the heating season (winter, n = 90) and the third was in March, 2013, the middle of the heating season (spring, n = 90). In general, the heating period starts in November and ends just before April in Canakkale.
Sampling locations (A: Ismetpasa; B: Kepez; C: Barbaros; D: Esenler).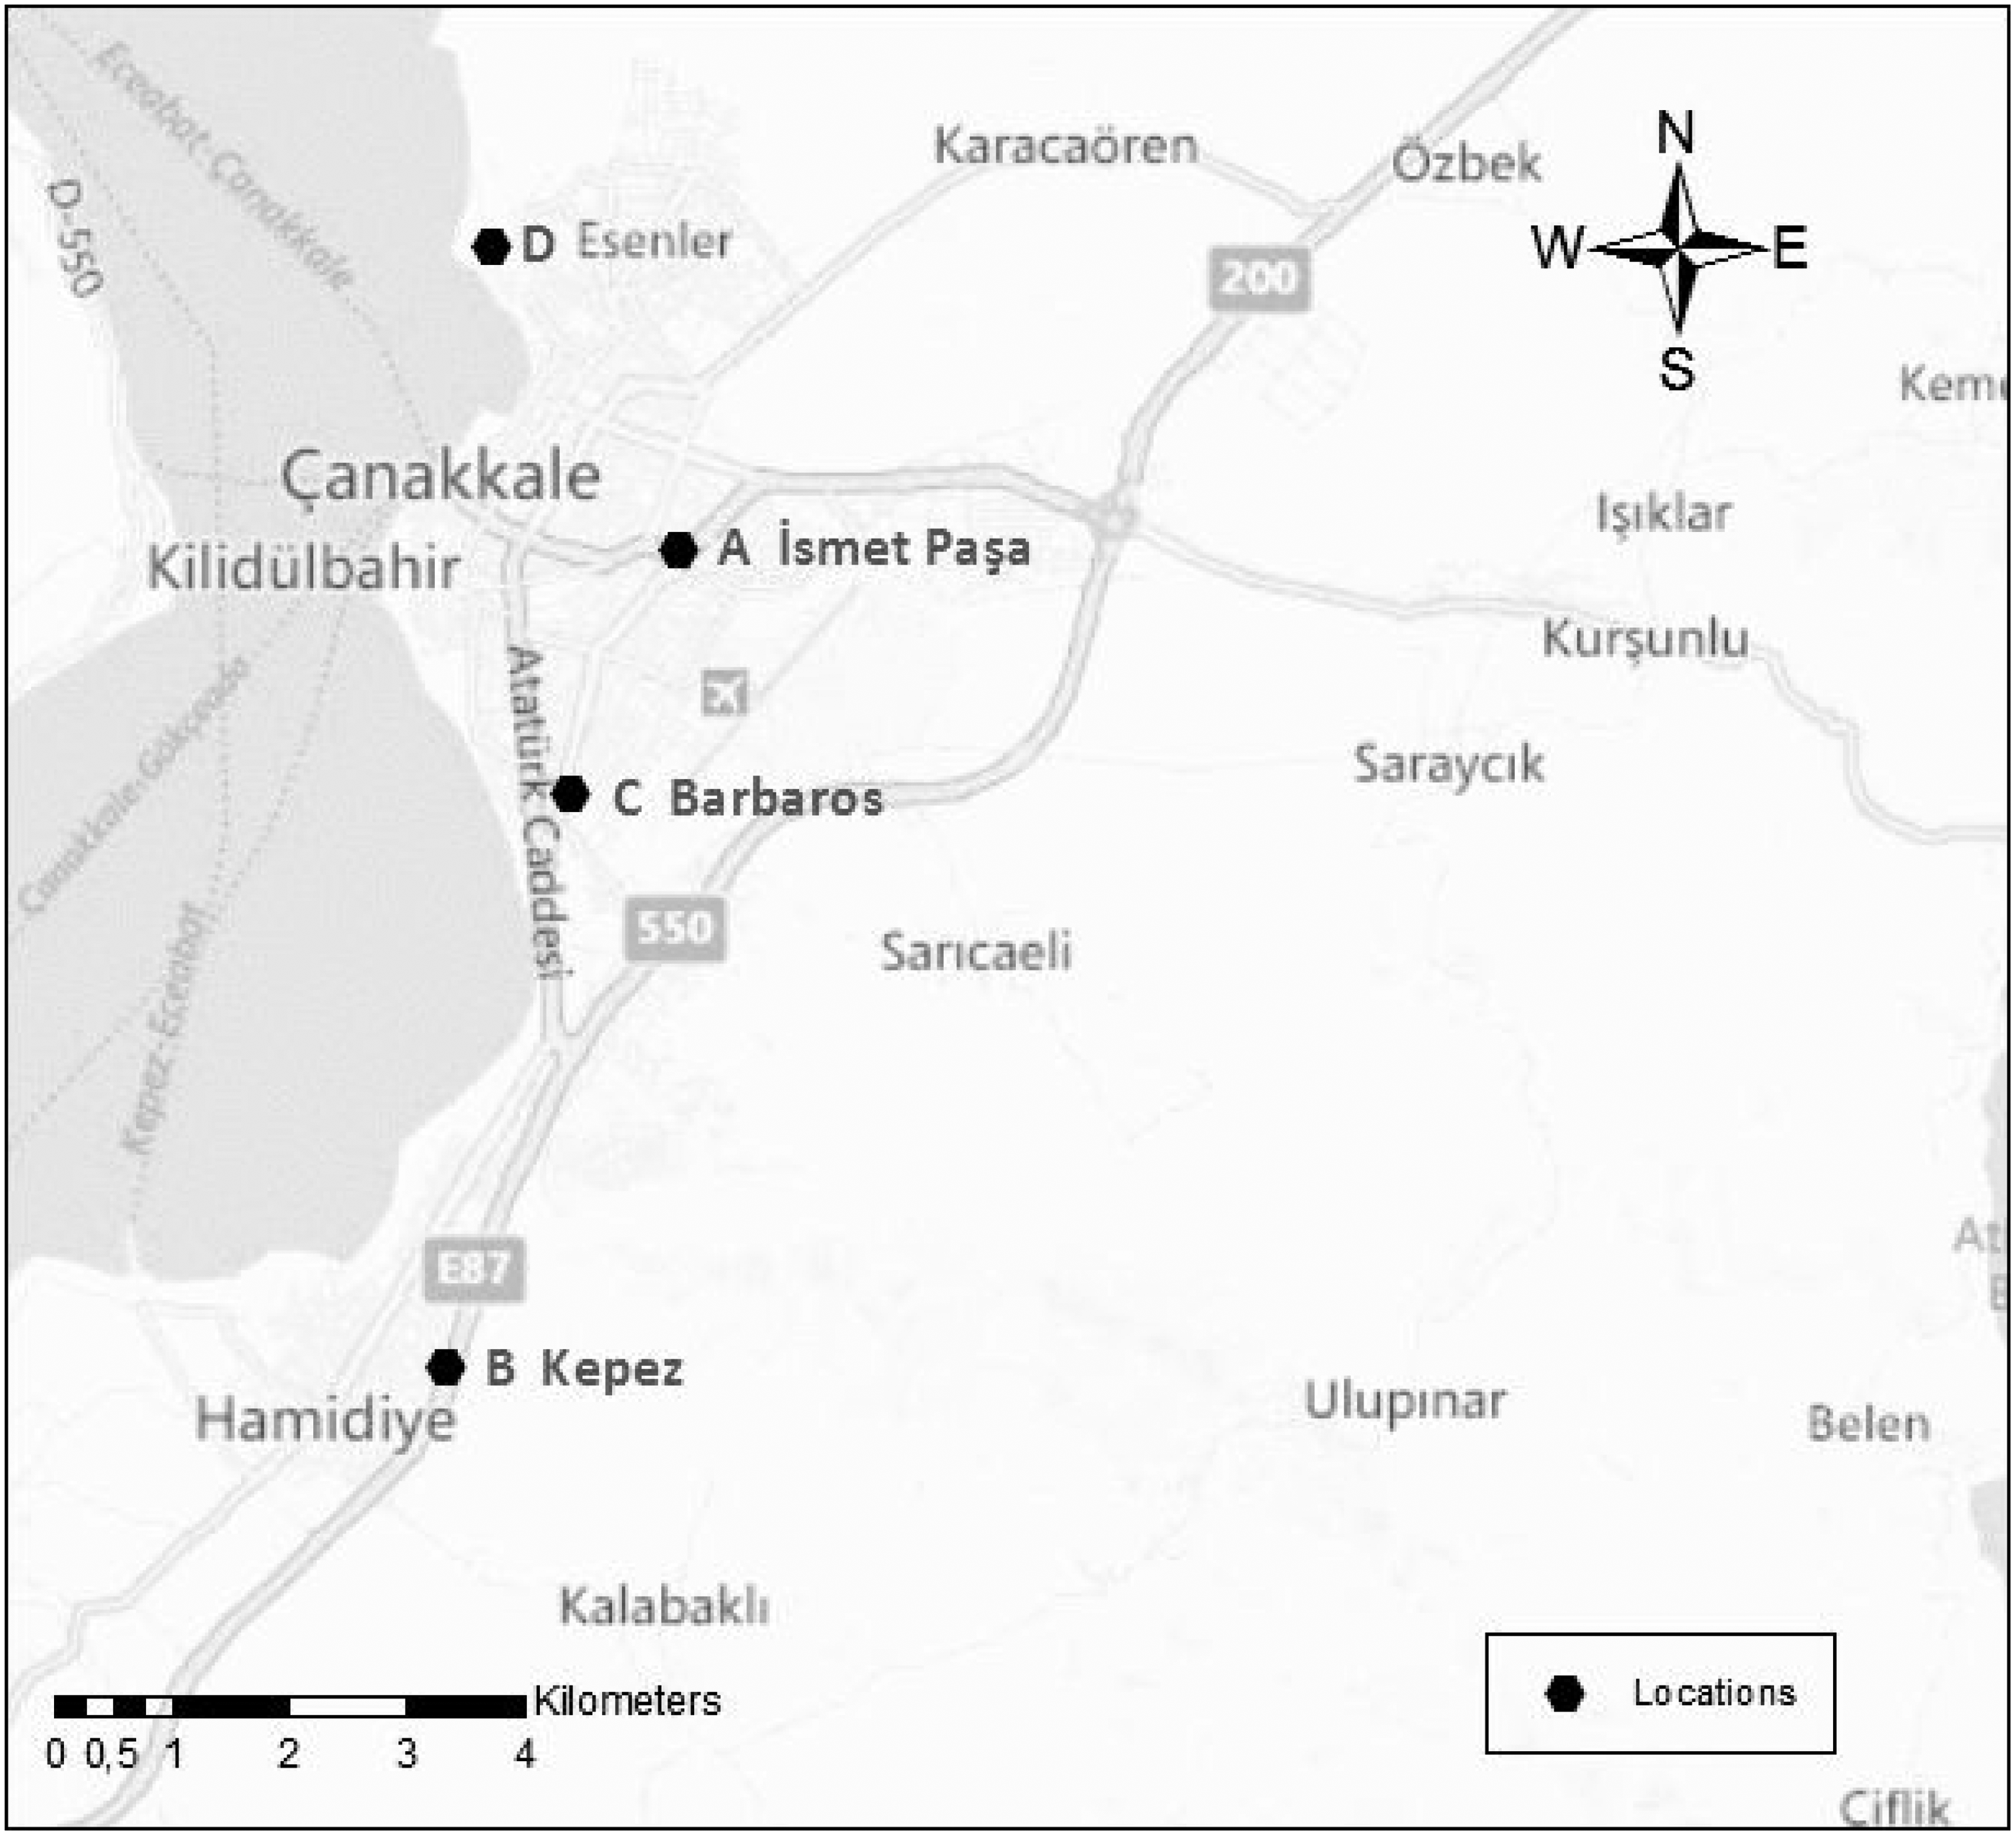
Çanakkale is a small city, located on the west coast of Turkey. Its climate has a transient character between the Mediterranean and Black Sea regions: snowy days are limited, whereas rainy days are more frequent. The main rainy season in Çanakkale is spring, especially the month of May. The most prominent characteristics of the meteorology of Çanakkale are relatively high wind speed (wind speed ≥ 7 m s−1 at 50 m above the sea level) and the annual number of windy days (average: 180 days year−1). The mean outdoor temperature values in Çanakkale were 19.3, 7.9 and 10.3℃ during October, December–January and March, respectively. Exact values of the meteorological parameters at the time of the samplings were gathered from Turkish Meteorological Institute.
Parallel indoor and outdoor samplings were conducted for each sampling site. The indoor sampling sites were categorized into four groups: (i) homes (n = 33), (ii) kindergartens (n = 10), (iii) dormitories (n = 37) and (iv) schools (n = 5 for university classes and n = 5 for third-grade classes). All indoor environments were selected randomly. Any known dampness in the sampling sites and essential complaints by the occupants were not recorded prior to the study. Our primary aim was to choose sampling sites that were representative of the extensive socioeconomic conditions of the city. The majority of the sampling sites were in different buildings, with the exceptions being mostly some of the dorms and classes. Since it is possible that outdoor air composition may show fluctuations, parallel duplicate outdoor samples were collected for each sampling site. The average of the duplicate measurements was considered as outdoor TBC level of the sampling site concerned (n = 90 for each season).
A detailed questionnaire (see Appendix) was distributed to an occupant of each sampling point (n = 90). First the sampled environments were selected randomly and then participants (age > 18) for the questionnaire were chosen. One participant per sampling site was chosen. As much as possible, participants were chosen from among the occupants who spend most of his or her time in this environment and most probably available throughout the three sampling campaigns. Questionnaires were given to the teacher in charge of the class for kindergarten and school sampling sites. Maximum two or three people were available at the home sampling sites at the time of the first sampling campaign. Among them, one or rarely two people mentioned that they spent most of their time in the home. Finally, one person available at home for the three sampling campaigns volunteered and was selected. There were one or two people at the dorms at the time of first sampling campaign (two to three person rooms). Among them, there was only one person who spent most of his or her time and would be available for three sampling campaigns, and answered the questionnaire. Since none of the potential participants were informed regarding the objective of the questionnaire before the first sampling campaign, the participant population did not include only those with SBS symptoms, which could have minimised the selection bias. The questionnaire was applied to the same participants three different times. The sampling dates were not mentioned to the participants in advance. After the airborne bacteria samplings, we gave limited information about the questionnaire and administered it as an interview to the participants. Additionally, descriptive information regarding the indoor environment of the sampling sites was gathered.
Airborne bacteria sampling and enumeration
Cultivable airborne bacteria samples were collected by means of a single-stage Andersen sampler (SKC Inc.) including 400 holes with a flow rate of 1.698 m3h−1.19–22 The air flow was adjusted and controlled by a digital calibrator (Defender, SKC Inc.) before each sampling, average relative standard deviation (SD) of flow readings was <3%. As recommended by several authors referenced subsequently, maximum number of colony formation on a petri dish was assumed to be 200 colonies to prevent masking effect.3,7,19,20,23–25 Sampling time was 5 min. Samples were collected during daytime from 1.5 m height at the centre of the room for indoor air samples and at least 2 m away from the building for outdoor samples. No outdoor air sampling was conducted in rainy or snowy weather.
Cultivable airborne bacteria samples were impacted onto plate count agar to count the total bacteria colonies. All agar plates were ready to use and sterile (Salubris Co., Turkey). Bacteria samples were incubated at 37℃ for two days. After the incubation period, enumeration of bacteria colonies’ growth onto a plate was done under a light source by using a semiautomatic colony counter. TBC was calculated as colony-forming unit per drawn air in m3 (CFU m−3). Although some of the TBC values exceeded 200 colonies per plate (nautumn = 4, nwinter = 14 and nspring = 17), indicating potential sources to propagate bacteria may exist (i.e. mostly in kindergartens, dorms and homes, respectively), remaining TBC values were lower than 1400 CFU m−3. Limit of detection (LOD) value for TBC was 7 CFU m−3; however, colony formation was not observed on a few sample plates (n = 5).
To minimise the fluctuations in bacteria levels or to better see the actual airborne bacteria levels in the sampling sites, occupants were informed beforehand that they should not change their daily routine (e.g. do not clean and do not additionally ventilate your home/dorm/class, etc.).
Questionnaire
The questionnaire contained questions on (i) the factors that may affect TBC, (ii) the characteristics of the environment, (iii) socioeconomic conditions of the occupants, (iv) the prevalence of SBS and (v) the factors that may affect SBS. The questionnaire was completed by the same person (≥18 years old) in each sampling period. The participants were not informed about the TBC levels measured in their indoor environments throughout the entire study. The questionnaire (see Appendix) is similar in some respects to earlier studies,11,26–29 but is primarily based on the revised version of Mentese et al. 30 The following topics–issues were addressed: (i) information regarding the environment (e.g. location, distance to traffic, age of the building, floor and wall covering, last renovation time, indoor pet/plant availability, stove type and heating/cooking fuel type); (ii) socioeconomic information (e.g. gender, age, education level, number of people living in the microenvironment, time spent indoors and smoking habits); (iii) general medical condition of the participant including the occurrence of SBS symptoms (general medical condition of the occupant, existence of any illness/illnesses related to SBS symptoms, if none; occurrence of SBS symptoms of fatigue, headache, coughing, eye irritation, sneezing, tickling in the throat, dizziness, dry skin and chest tightness) and (iv) concerns regarding the perceived indoor and ambient air quality. The answers to the first section of the questionnaire (i.e. indoor environmental aspects) were also cross checked by our visual inspection together with the participants at the time of surveying. If the visual inspection did not match with participants’ answers, the participants were asked if he or she was sure about the answer and then his or her final decision was accepted.
Statistical analyses
Statistical analyses were performed using either Statgraphics 3.0 software (free software) or Statistical Package for the Social Sciences 19.0. Airborne bacteria concentrations (TBC) were analysed as an independent variable; while sampling period (autumn, winter and spring), meteorological factors, individual SBS symptoms and sample type (indoor and outdoor) were analysed as dependent variables to relate the factors with airborne bacteria levels. TBC levels that were lower than LOD value were shifted with ½ LOD value for statistical analyses.
Distribution fitting of the TBC values was investigated with the Kolmogorov Smirnov test. Paired t-test and Wilcoxon signed rank test were applied to TBC pairs to test the statistically significant differences between the pairs in terms of their mean values and median values, respectively.
Several building-related environmental factors were taken into account statistically. Data from the measurements and environmental factors were analysed statistically by analysis of variance (ANOVA) tests, paired t-test and Spearman’s rank correlation. Bivariate regression analyses were applied to find the associations among the SBS symptoms, building/environmental-related factors and TBC levels (p < 0.2).
Logistic regression analyses were performed to find the associations between the observed SBS symptoms and the personal factors, building-related factors and TBC. SBS symptoms were categorized whether they were observed (yes = 1) or not (no = 0) among the healthy participants who had no related disease. Building related factors with p < 0.2, found from bivariate regression analyses, were included in the logistic regression models. All SBS symptoms in the survey, except chest tightness, were included in the regression models by classification of the SBS symptoms into three classes: (i) general symptoms (headache, fatigue and dizziness); (ii) dermal symptoms (dry skin) and (iii) mucosal symptoms (eye irritation, sneezing, tickly throat and coughing). Categorical variables in the data set were defined beforehand and coded logically according to their potential contribution to the factor or individual susceptibility from lower to higher (e.g. male: 0 and female: 1). Multiple logistic regression (enter mode) models were developed and odds ratios (ORs) and 95% confidence intervals (CIs) were used to evaluate risk factors associated with those three-symptom classes. Fitted regression models were presented in the table after removing the insignificant factors with p > 0.5 from the models. Finally, statistically significant models were obtained for general, mucosal, and dermal SBS symptoms for three seasons and only variables with p < 0.5 remained in the models.
Values with p < 0.05 were considered as statistically significant for all tests.
Results and discussion
Meteorological parameters
Meteorological parameters (M ± SD) measured during the study.
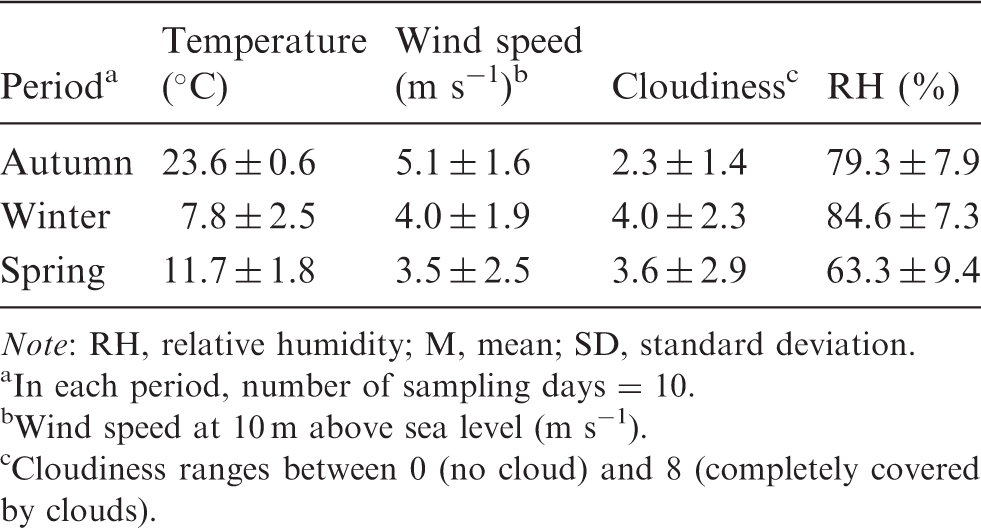
Note: RH, relative humidity; M, mean; SD, standard deviation.
In each period, number of sampling days = 10.
Wind speed at 10 m above sea level (m s−1).
Cloudiness ranges between 0 (no cloud) and 8 (completely covered by clouds).
Spearman’s rank correlations a among the meteorological parameters and indoor TBC levels.
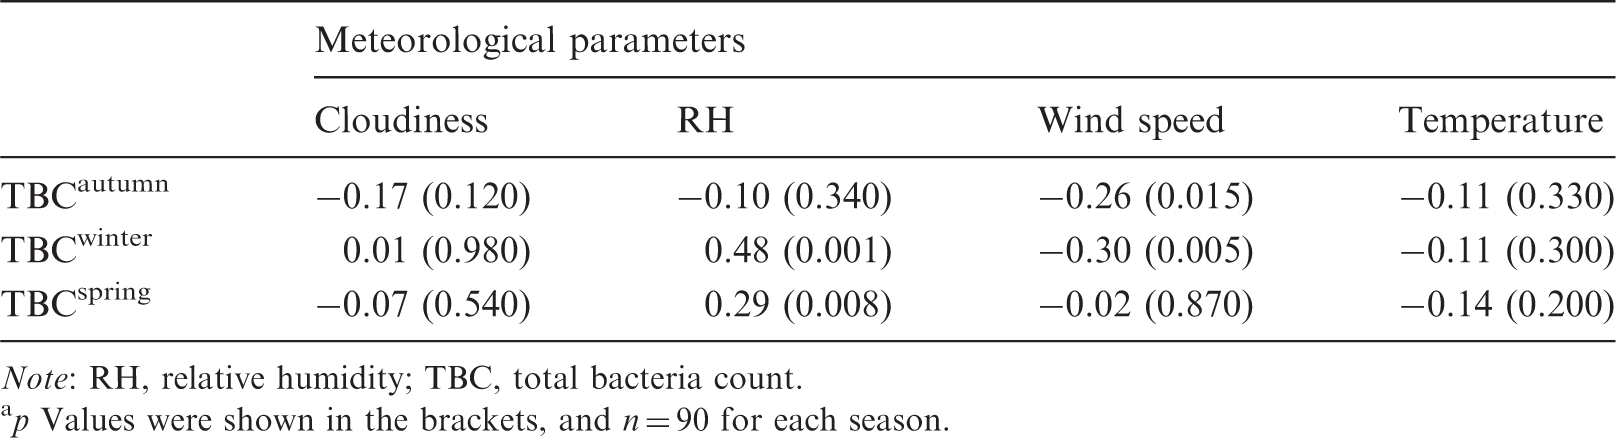
Note: RH, relative humidity; TBC, total bacteria count.
p Values were shown in the brackets, and n = 90 for each season.
Results of repeated-measure ANOVA test among the outdoor TBC levels and the meteorological factors. a
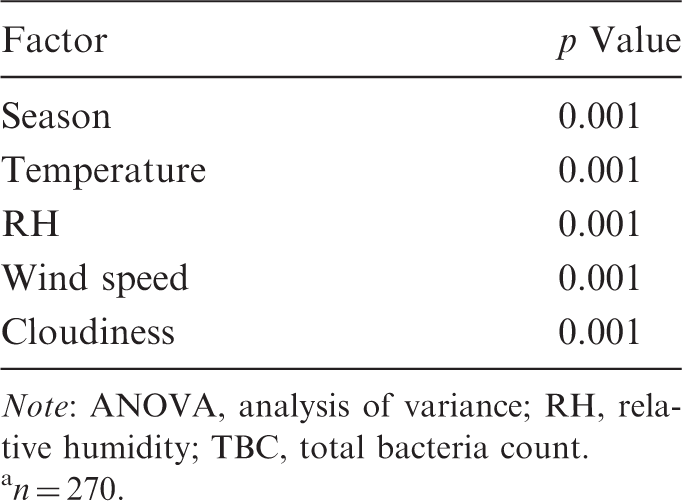
Note: ANOVA, analysis of variance; RH, relative humidity; TBC, total bacteria count.
n = 270.
Characteristics of the sampling sites
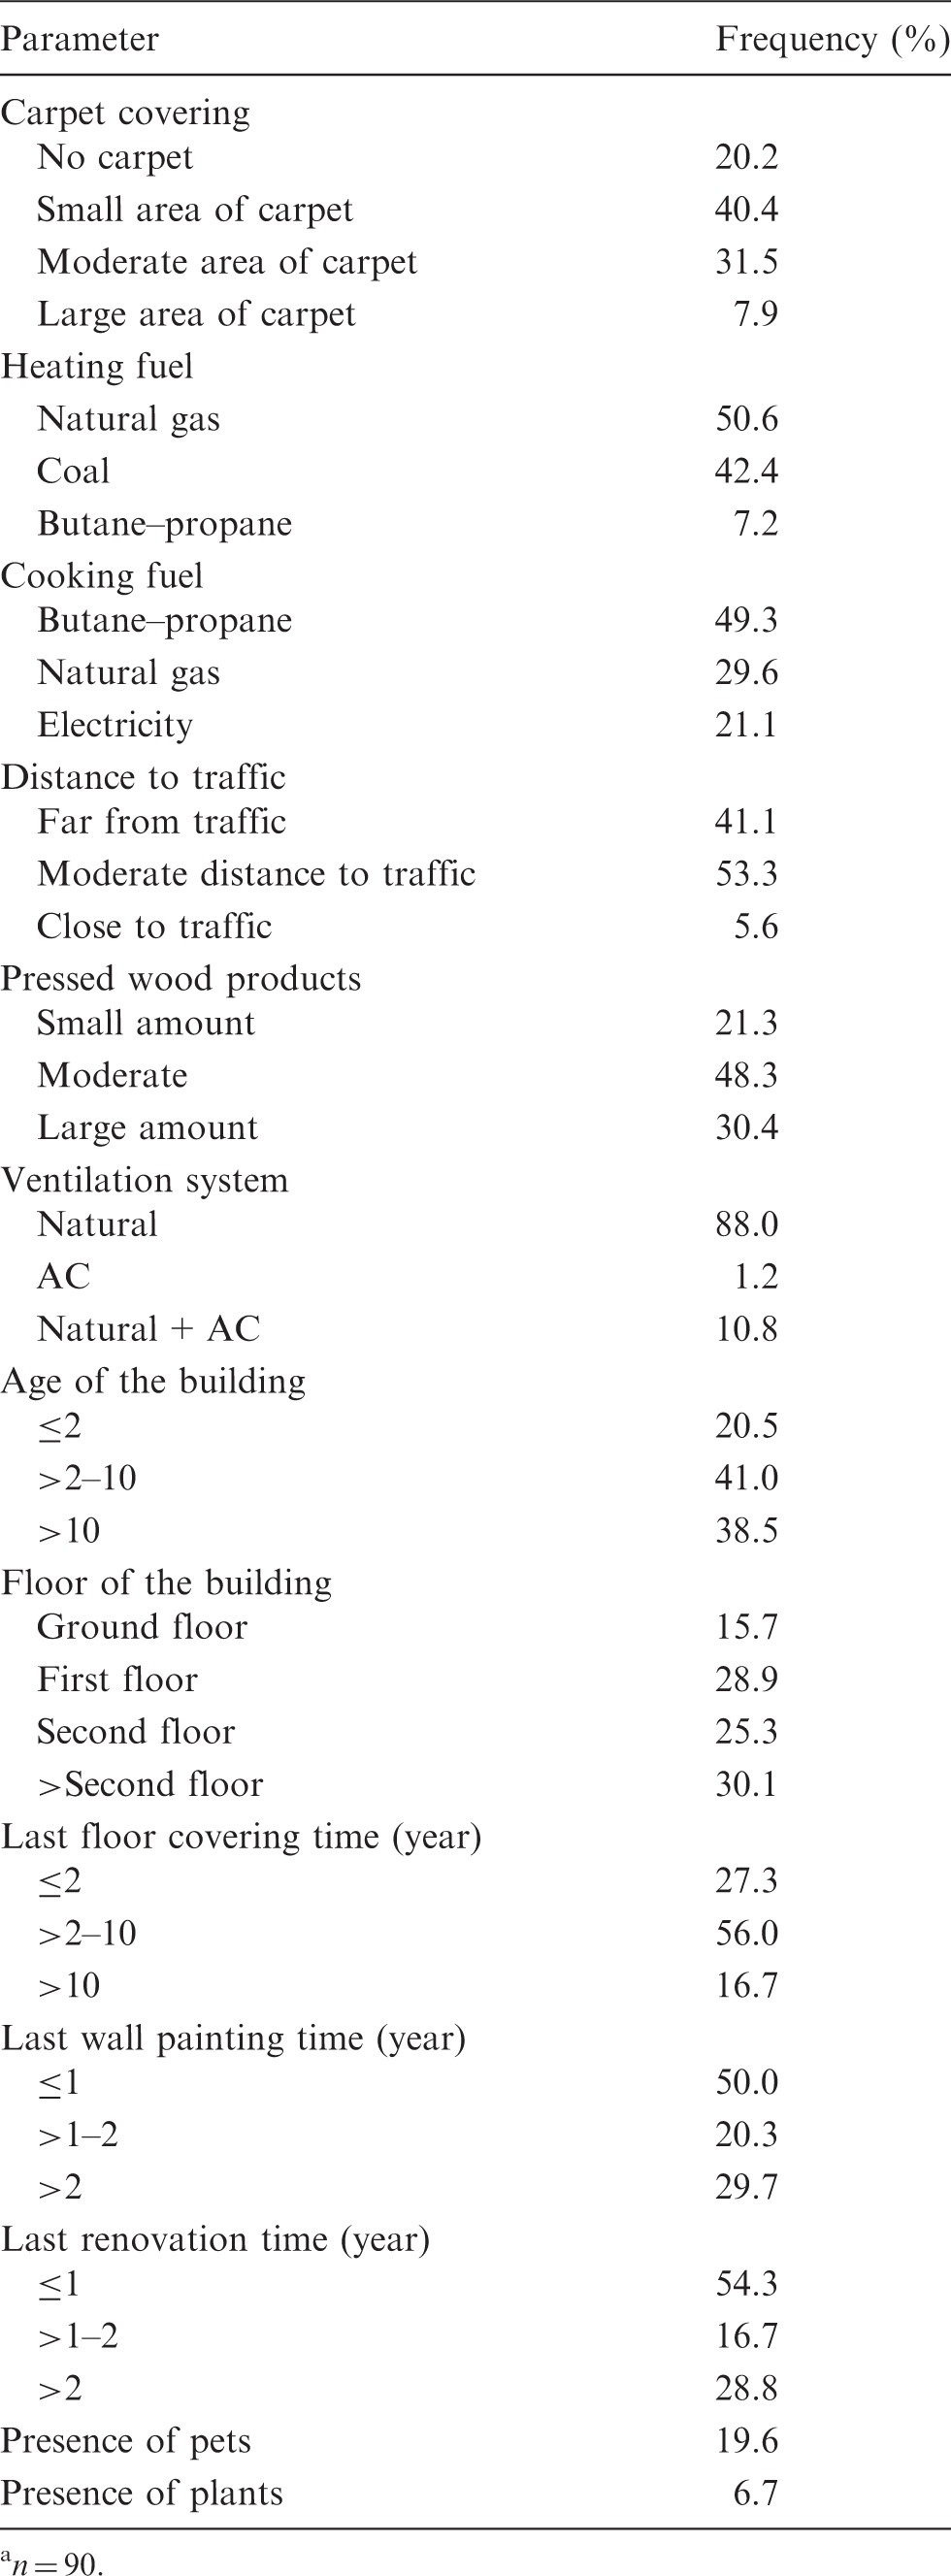
Descriptive information regarding the sampling sites was recorded during the measurements. Table 4 shows several environmental/building-related factors that may affect IAQ (i.e. heating/cooking fuels, distance to traffic and ventilation system) and potential airborne bacteria sources in indoor environments (i.e. presence of pets and plants, and densities of carpet and pressed wood products indoors). In brief, the environments shared the following characteristics: the most prevalent heating fuels were natural gas and coal; cooking fuel was butane–propane; traffic density was low or moderate; variable number of occupants indoors; low incidence of pets and pot plants indoors; variable carpet and pressed wood products; buildings mostly built >2 years ago; half of the sites were renovated within the last year and were generally naturally ventilated environments. Also, the frequency histogram of the number of occupants in the sampling sites is given in Figure 2.
Frequency histogram for the number of people (n = 90). Building factors of the sampling sites.
a
n = 90.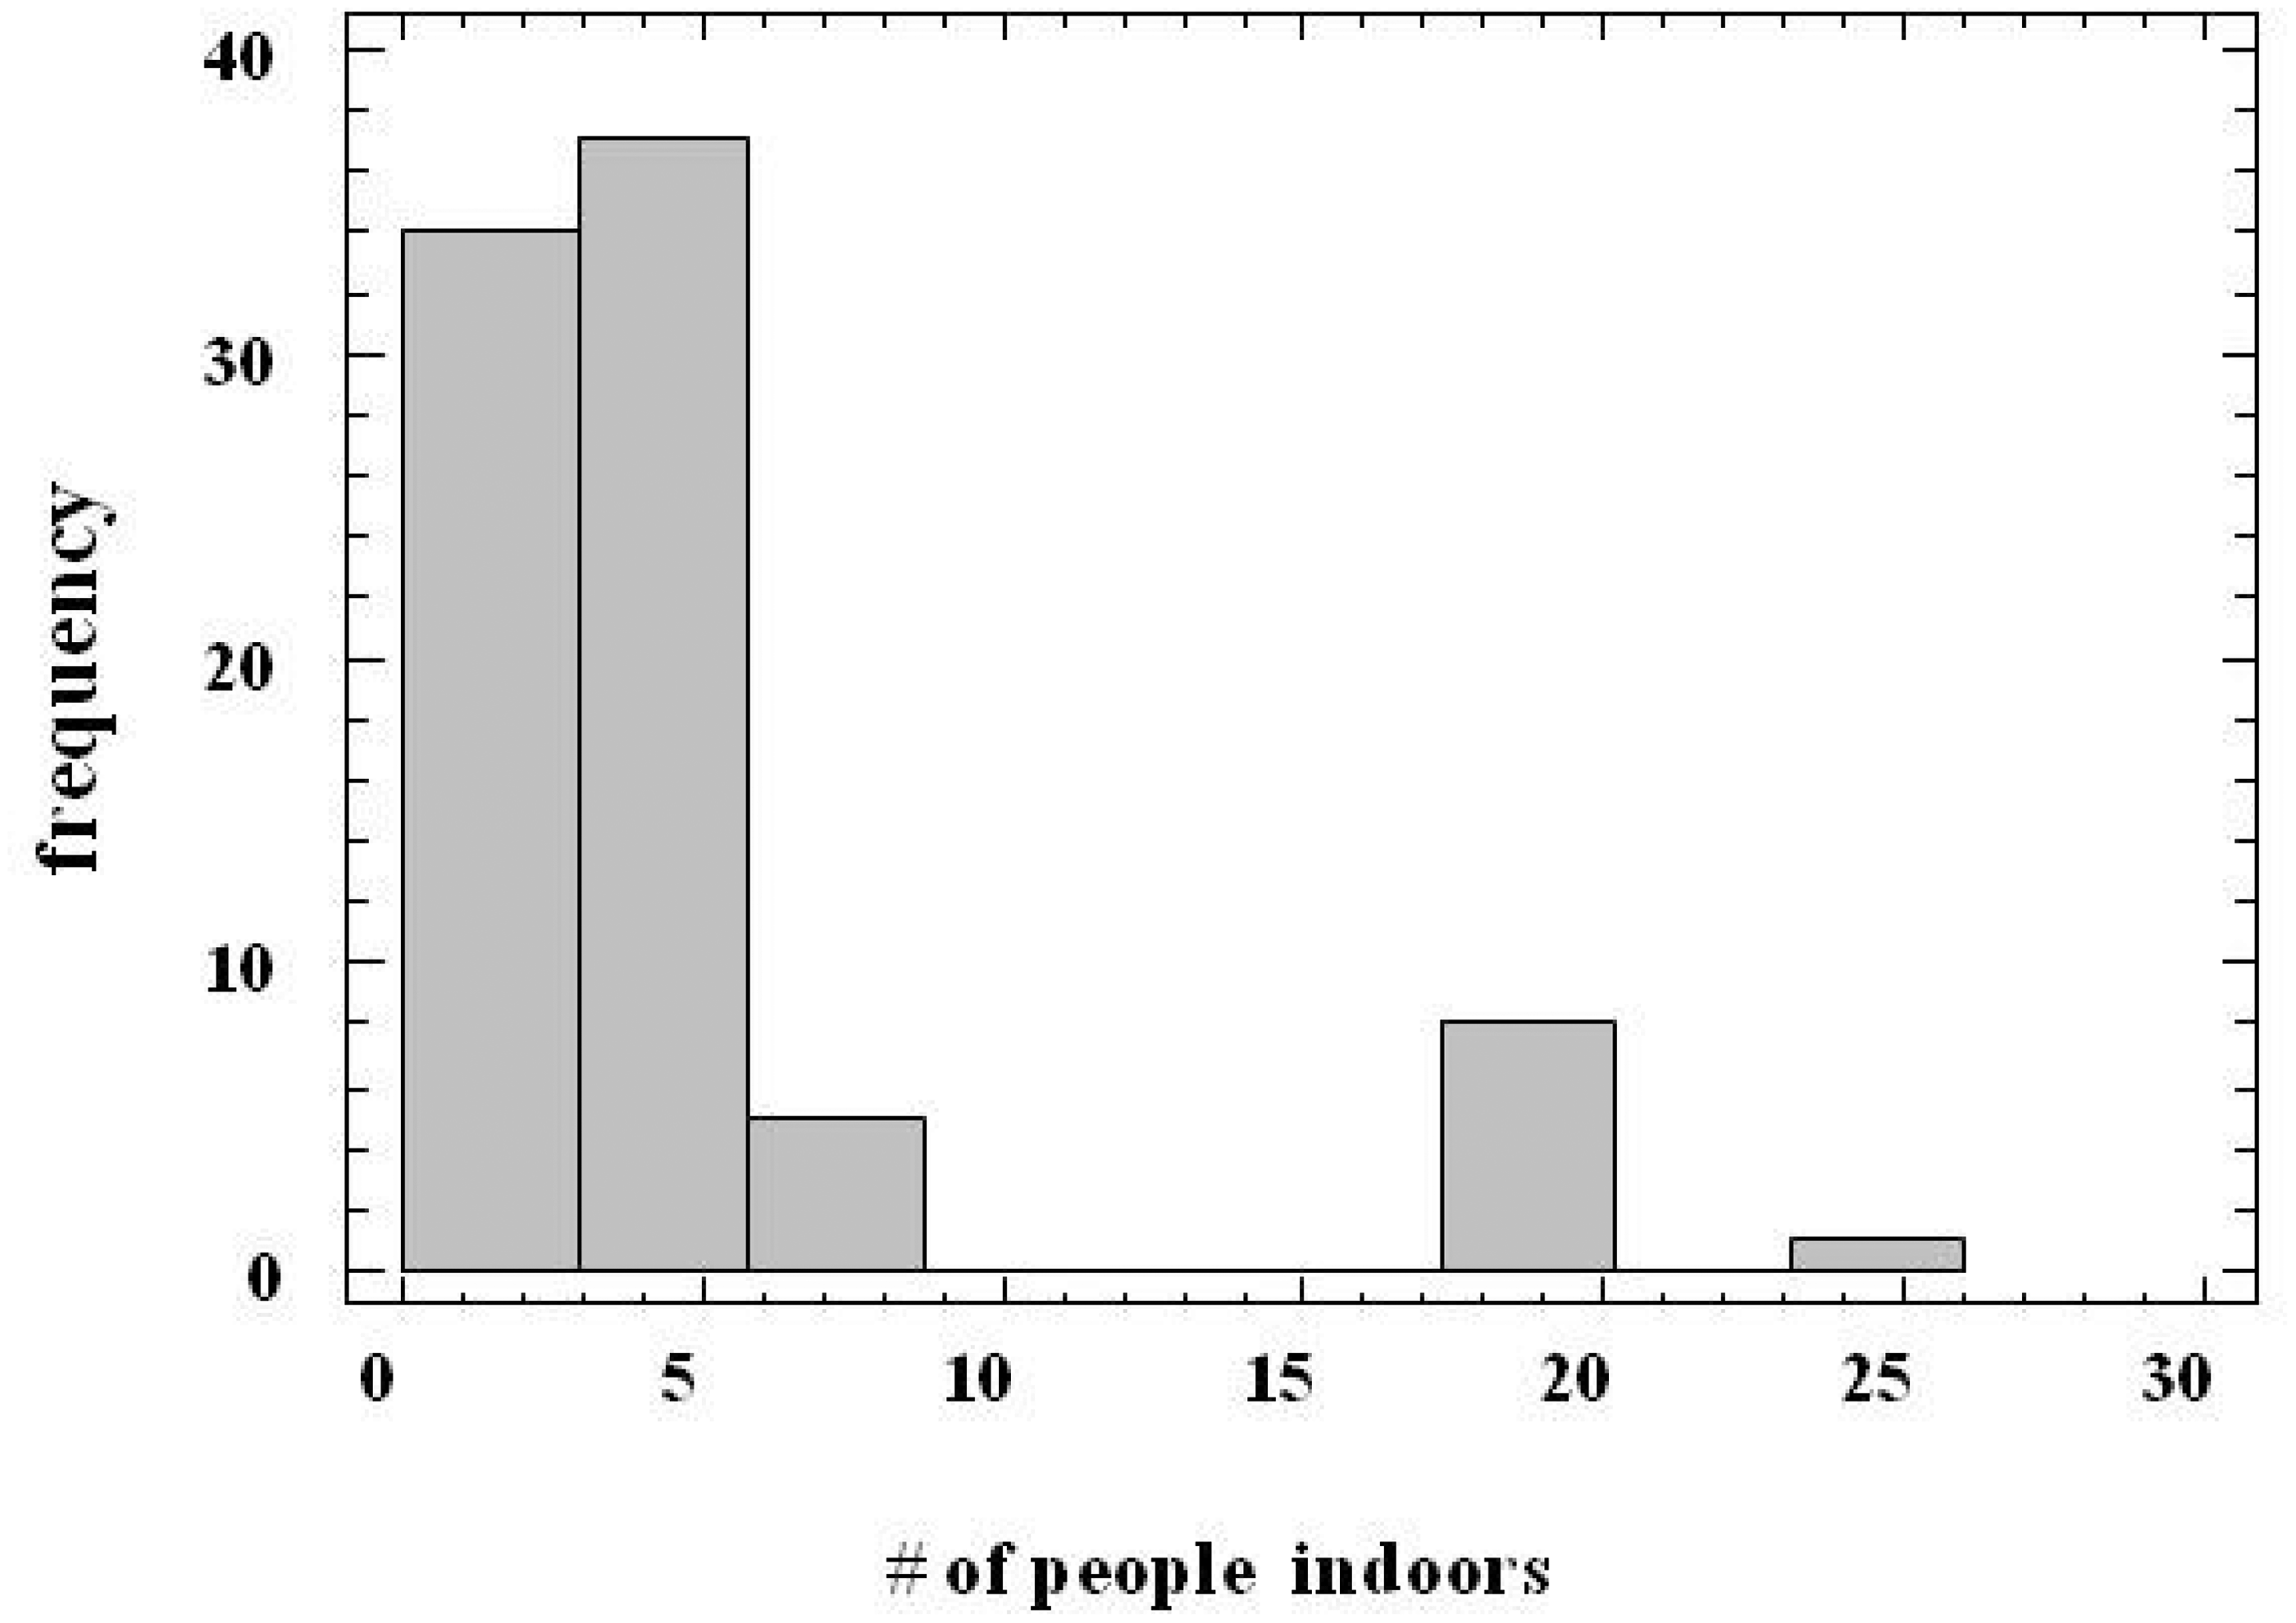
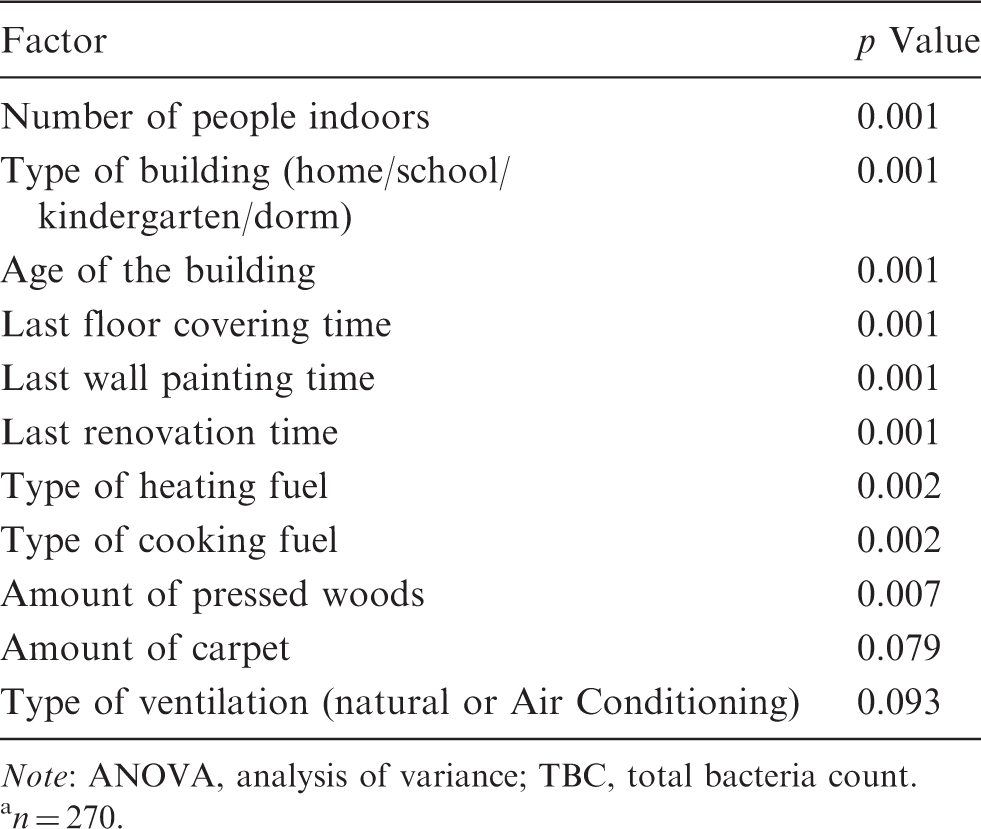
Statistically significant differences in TBC levels were found by the repeated ANOVA tests (see Table 5) for the number of people indoors, types of cooking and heating fuels, type and age of the building, and last floor covering, wall painting and renovation times (p < 0.05). In general, the lowest TBC levels were observed in sampling sites occupied by fewer people (i.e. ≤4 person), whereas the highest TBC levels were observed in densely occupied sites (e.g. kindergartens) throughout the heating periods (Figure 3). TBC levels increased and varied widely when the number of people indoors was above 4, regardless of the sampling period.
TBC levelsa (CFU/m3) vs. number of people indoors for (a) Autumn, (b) Winter and (c) Spring periods. aBoxes show 25th–75th percentiles, lower and upper bars show the ranges, lines inside the boxes show the median values, symbols of ‘+’ inside the boxes represent the mean values and ‘□’ designate the outliers. Results of repeated-measure ANOVA test among indoor TBC levels and the building-related factors.
a
Note: ANOVA, analysis of variance; TBC, total bacteria count. n = 270.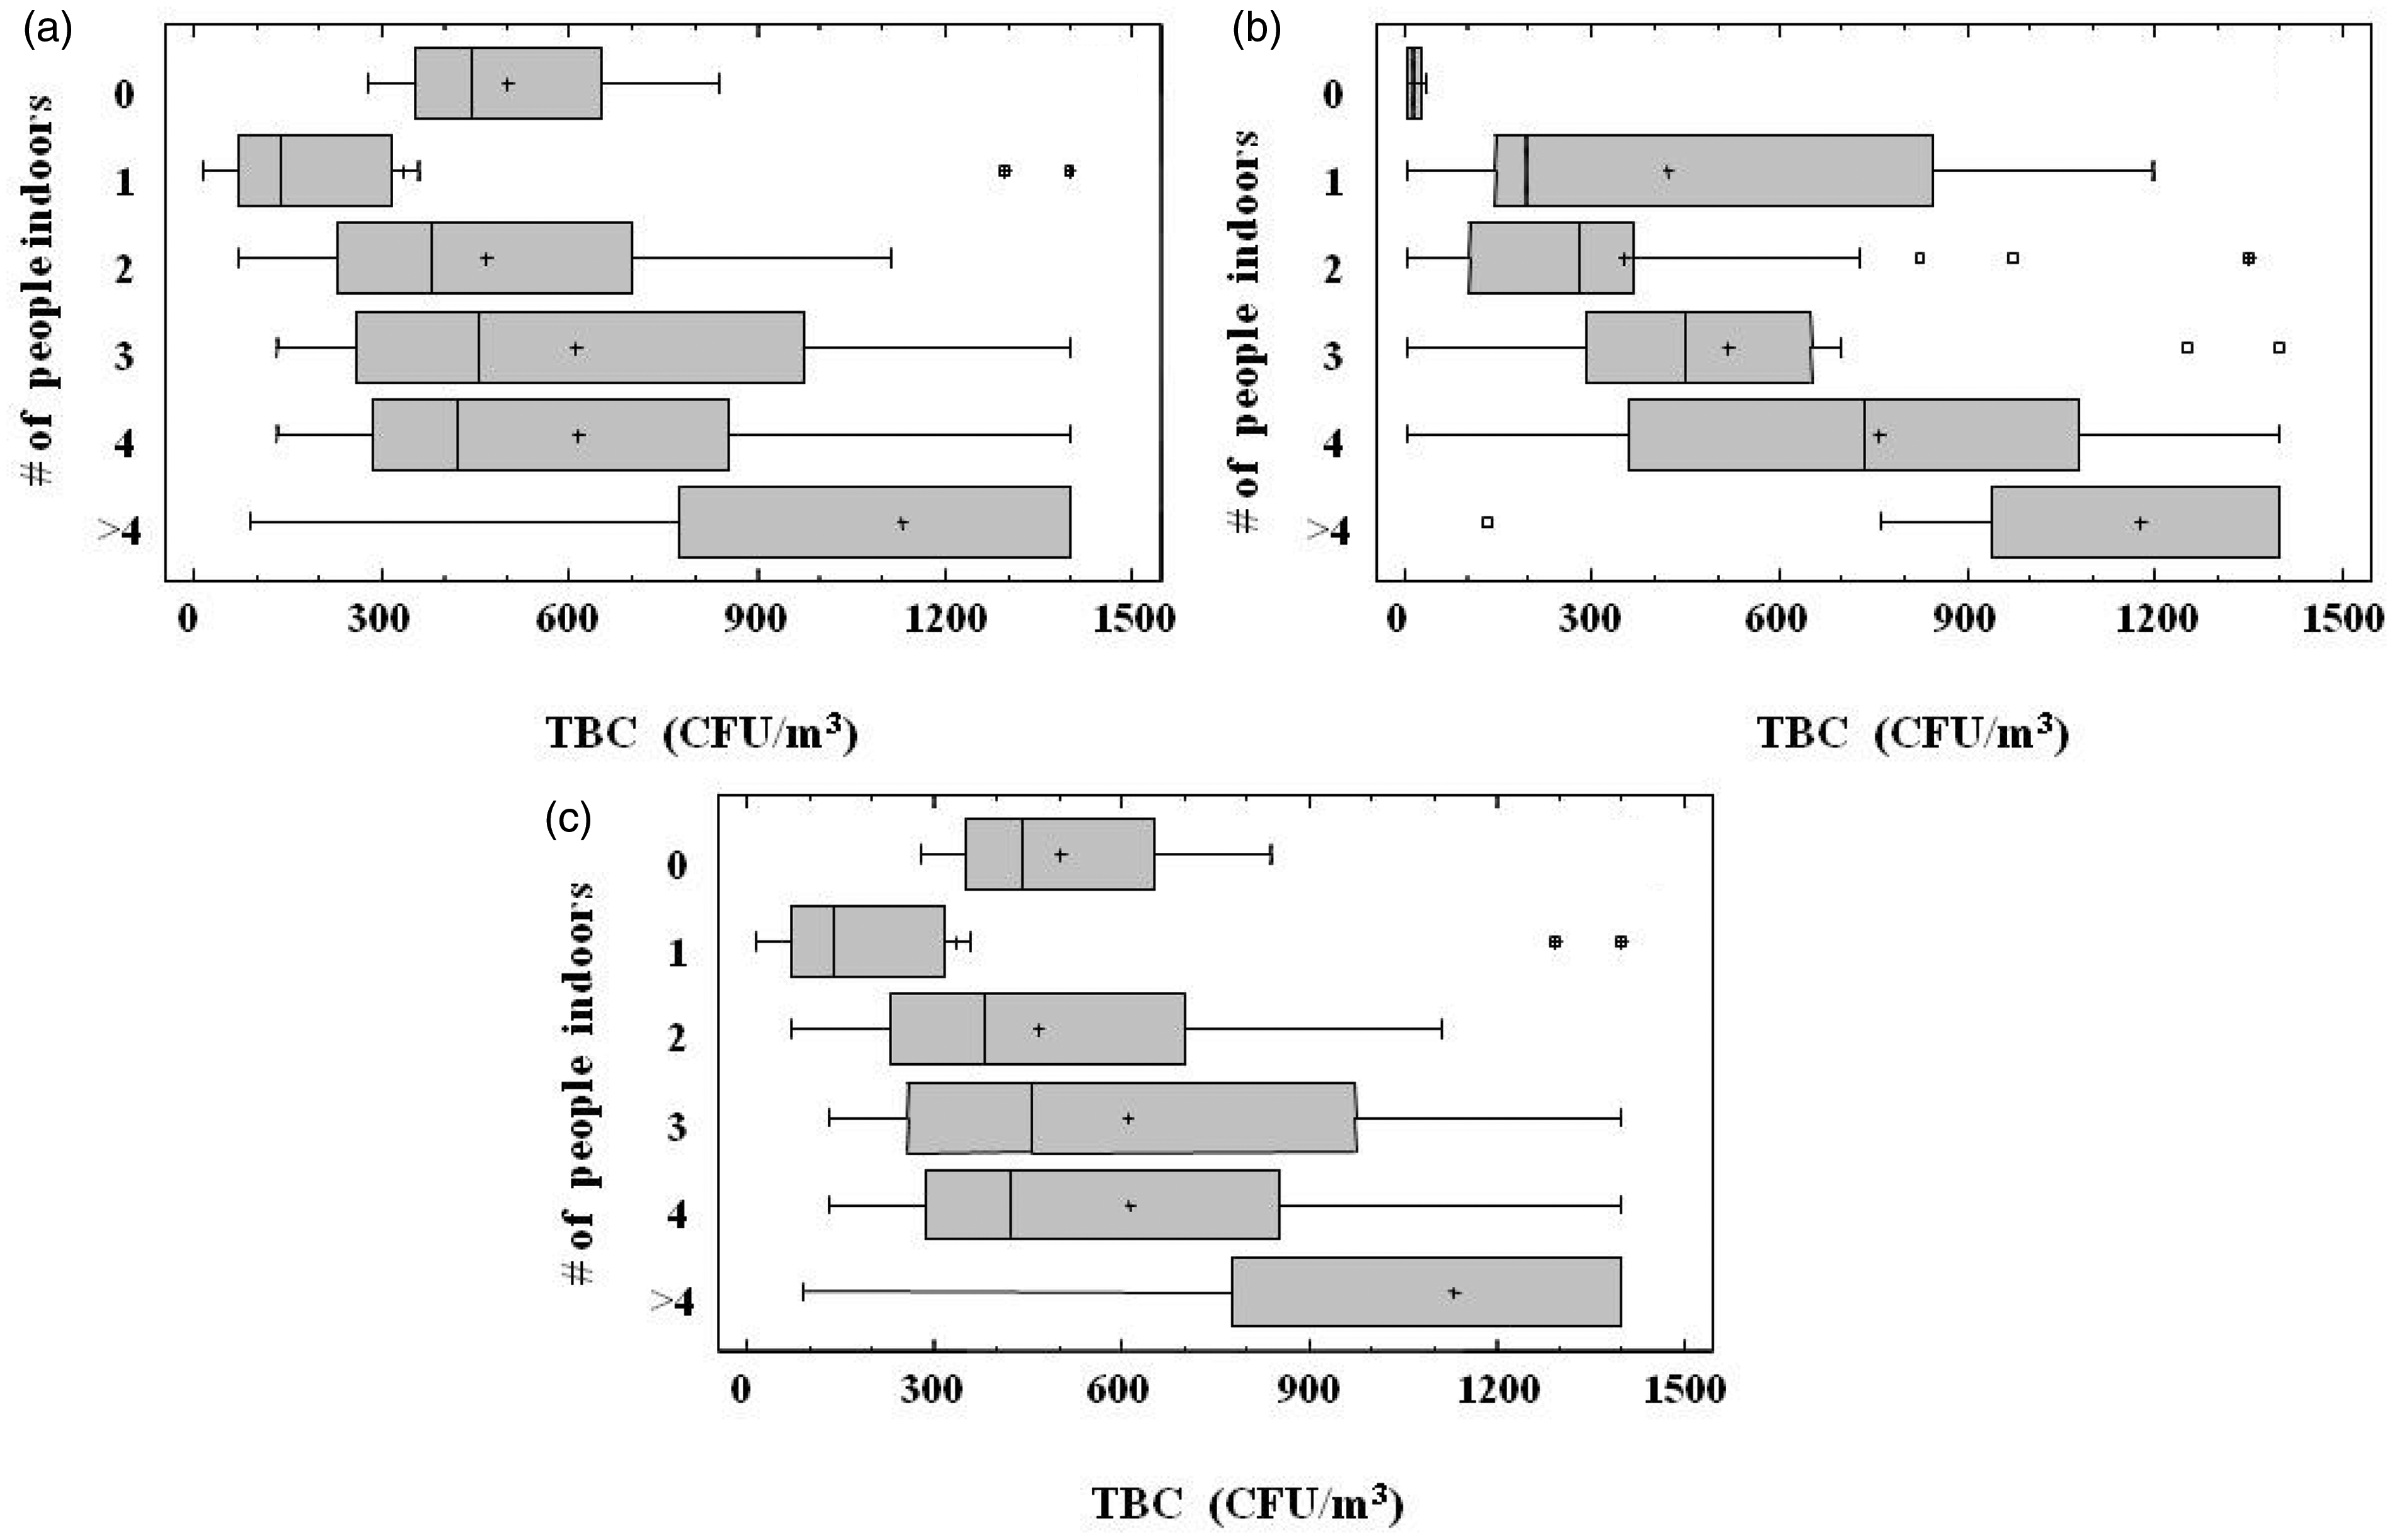
In terms of cooking fuel, TBC levels varied in the sampling sites with electrical systems, natural gas and butane–propane gas appliances, in ascending order. As can be seen in Figure 4, the highest TBC levels were found in the sampling sites where coal is used as a heating fuel, particularly in the winter period. In Çanakkale, coal used to be the main heating fuel. Natural gas has become the main heating fuel in most metropolitan areas of Turkey over the last decade. The residential and commercial natural gas subscription rate in Çanakkale has slightly exceeded 50% since 2008. Also, TBC levels were close to each other in measured sampling sites before the heating period, regardless of the type of the heating fuel used. A remarkable increase in TBC levels for the sampling sites using coal was especially noticeable throughout the heating season. Thus, we can conclude that heating activity, as well as the type of heating fuel, was associated with the TBC levels at the sampling sites.
TBC levels (CFU/m3) vs. type of heating fuel for (a) Autumn, (b) Winter and (c) Spring periods.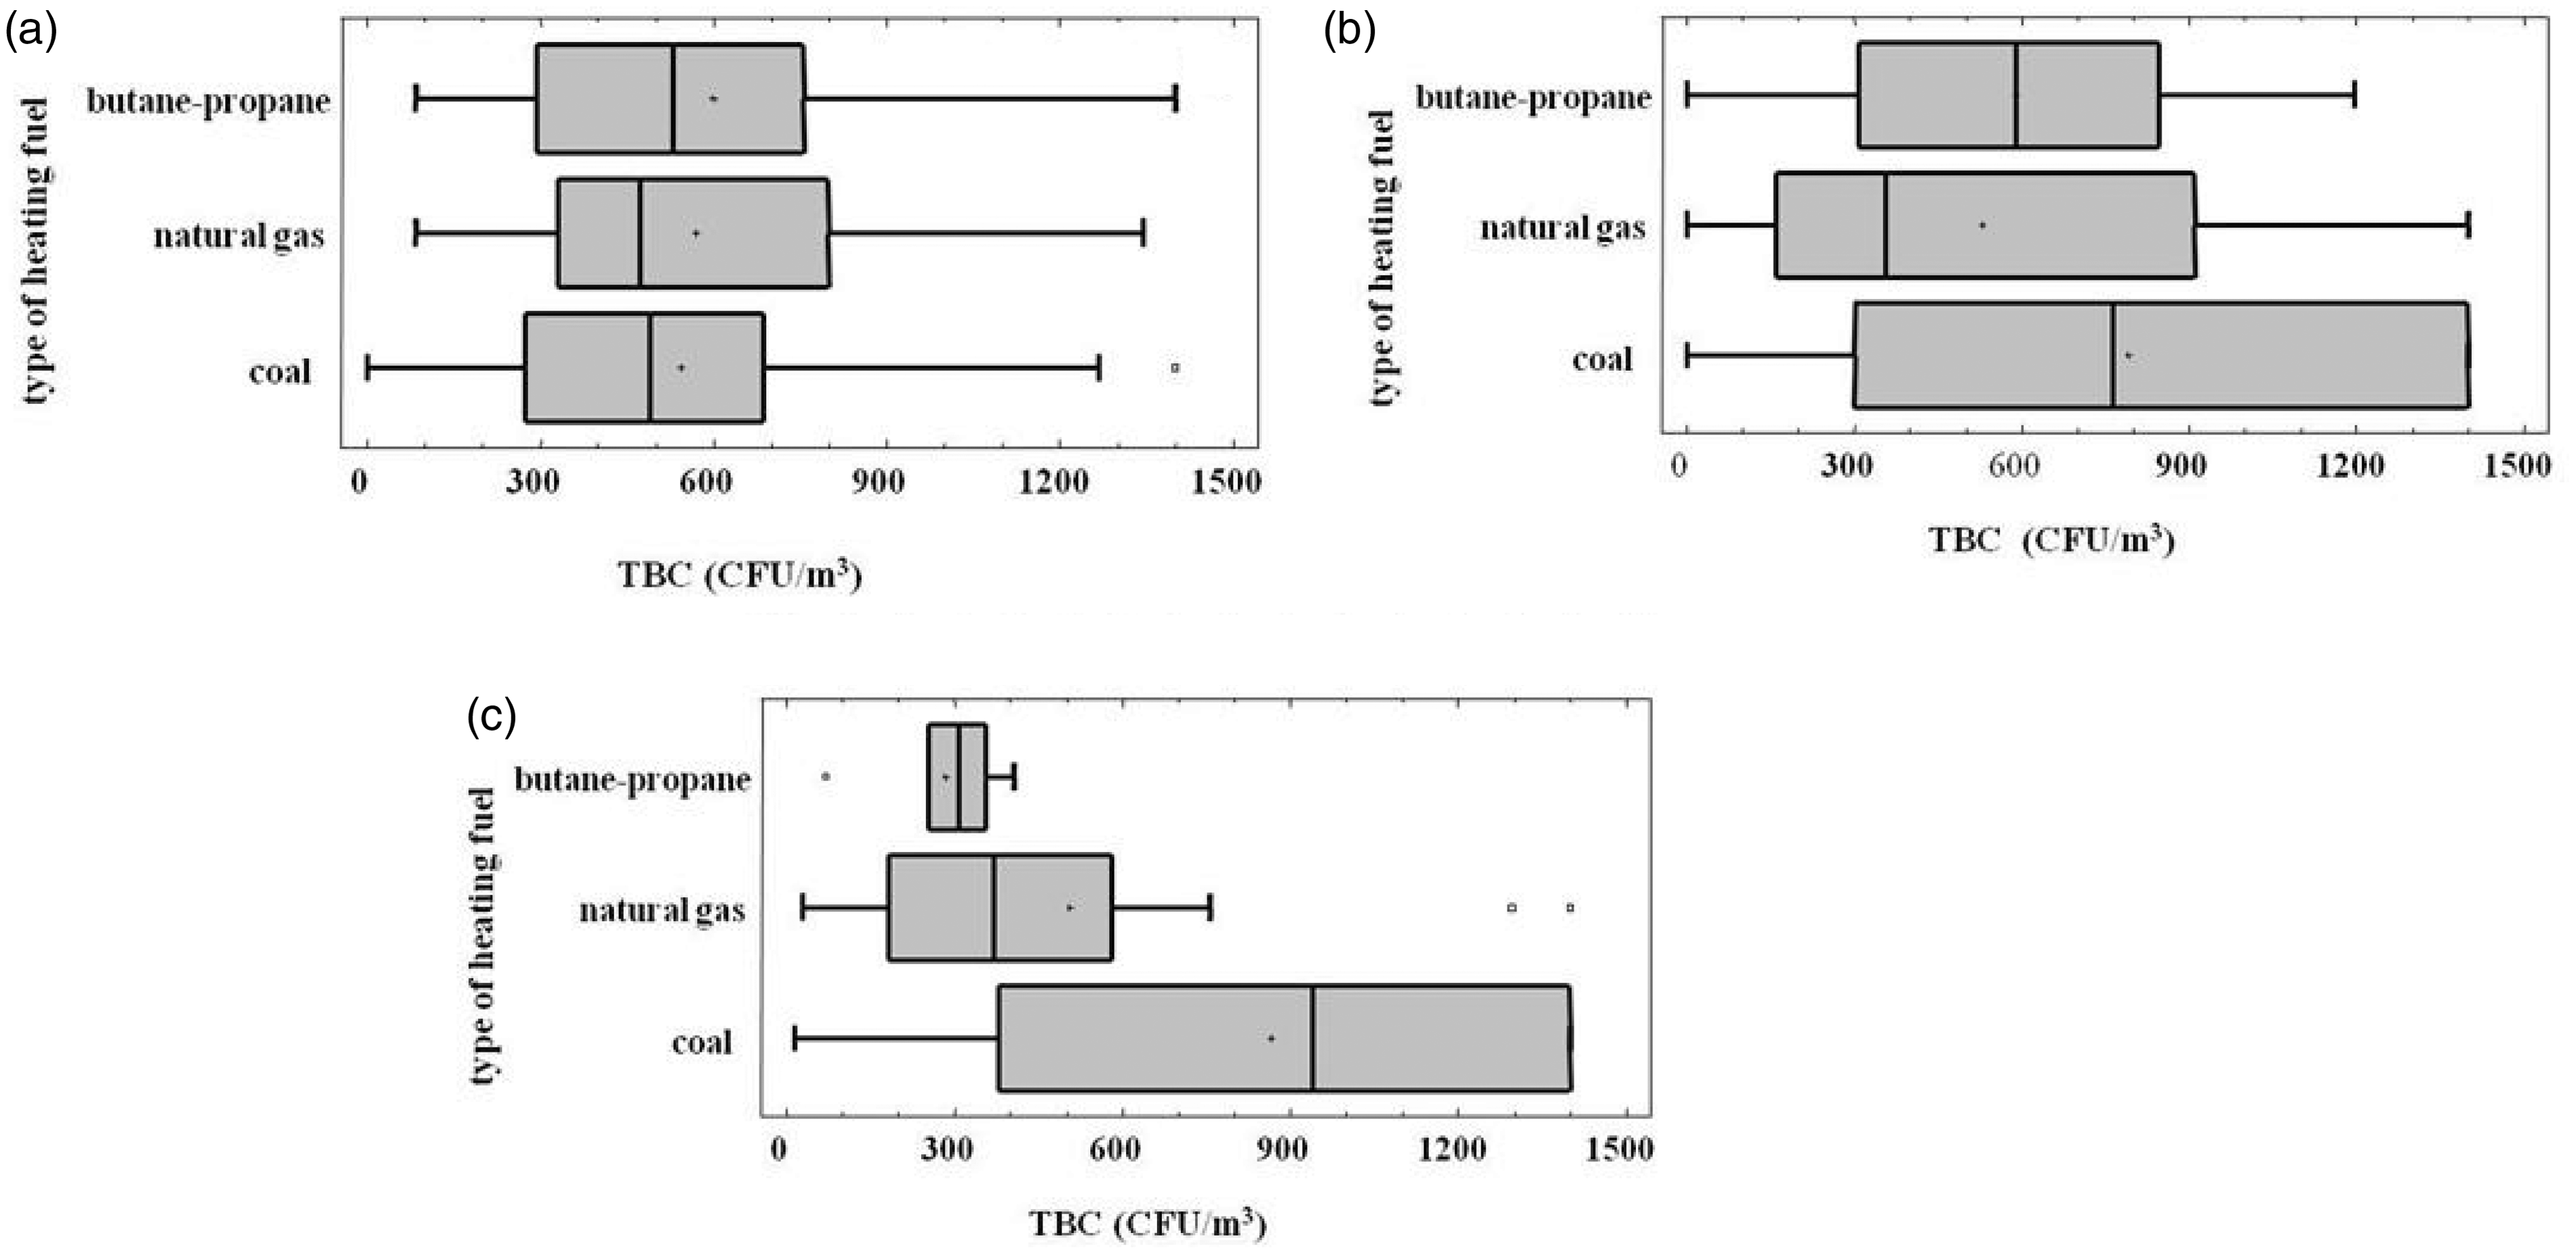
Airborne bacteria levels at the sampling sites
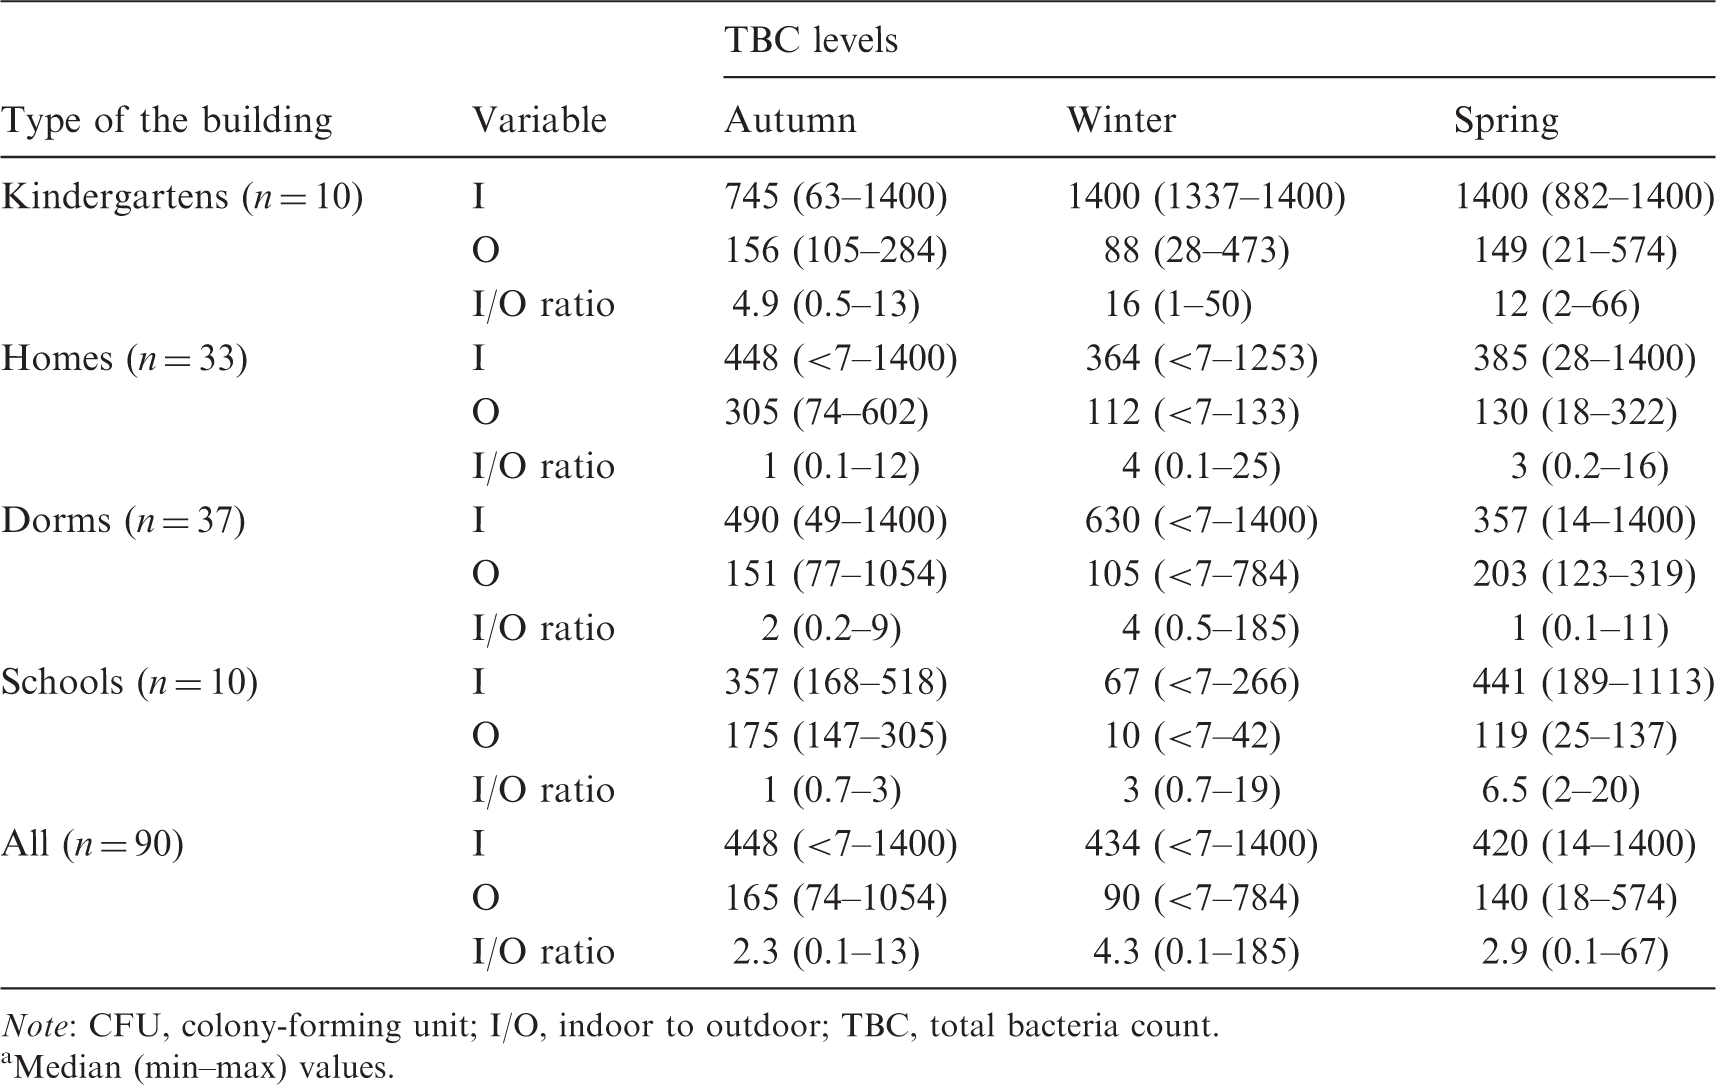
Note: CFU, colony-forming unit; I/O, indoor to outdoor; TBC, total bacteria count.
Median (min–max) values.
Indoor TBC levels, observed during autumn, winter and spring periods varied on a large scale among the sampling site groups and the period. Before the heating season, the highest indoor TBC levels were seen in kindergartens within a broad range (102 to >1400 CFU m−3). As Fanger 31 pointed out, IAQ in classrooms is generally poor due to inadequate ventilation, which resulted in elevated TBC levels especially during the heating season of this study. Since the occupancy rate of kindergartens (approximately 15 children in one class) is higher than other sampling groups, those elevated TBC levels occurring in kindergartens are most likely related to the elevated number of people indoors. Neither air-conditioning (AC) systems nor mechanical ventilation equipment was available in any of the kindergartens. In addition, TBC levels in kindergartens ranged in a broad scale with a median value of approximately 745 CFU m−3 during autumn, whereas TBC levels were found to be at the maximum level in the winter and spring due to lack of ventilation to save energy for heating purposes. Thus, occupancy rates together with inadequate fresh air intake can induce the promotion of bacteria propagation in such indoor environments (see also Figure 3). In another study, an increasing effect of occupancy in TBC levels was found in kindergartens. 8 Qian et al. 32 also observed a strong peak in bacterial genomes during occupancy. TBC levels in dorms and homes were similar (average: 500 CFU m−3), while the lowest TBC levels were seen in the schools (in university classes). The reason why indoor TBC levels in the schools were found to be the lowest among the sampling sites was that the classrooms were not occupied during the sampling. Note that airborne bacteria samplings in the classrooms of the schools were conducted right after the courses during the autumn and the spring campaigns, while airborne samples in all of the schools were collected before the courses during the winter campaign.
In the earlier phase of the heating season (winter), TBC levels observed at the kindergartens and dorms increased. In winter, TBC levels observed in the kindergartens showed no variation and were always found to be higher than 1400 CFU m−3, which was upper detection limit of airborne bacteria concentration for this study. The range of TBC levels in the dorms for the winter period was broader than those found before the heating season. Similar to autumn results, the lowest TBC levels in the winter period were seen in the schools. TBC levels measured in the kindergartens were again higher than 1400 CFU m−3, during the middle of the heating season (spring). TBC levels in the homes showed similar distribution for both winter and spring periods. TBC levels found in this study are similar to those found in other studies conducted in environments without complaints, including 300 CFU m−3 in offices, 33 10–103 CFU m−3 in high-rise buildings in Korea, 34 401–743 CFU m−3 in Hong Kong markets, 25 600–1800 CFU m−3 in Hong Kong shopping malls, 35 10–103 CFU m−3 in bars, cafeterias, classrooms and homes in Korea, 36 and 102–103 CFU m−3 in university rooms. 37
Since meteorological conditions have substantial effects on airborne bacteria levels, 38 investigating the effect of heating activity by comparing the TBC values before and during the heating season should be helpful to evaluate the sampling results accurately. The most remarkable change in TBC levels (i.e. to >1400 CFU m−3) during the heating season was observed in kindergartens (p < 0.05) (see Table 6). Since most kindergarten children in Turkey are under the age of 6, kindergartens are crucial buildings for child development, including the development of their immune systems. Children are prone to acquire some illnesses, while environmental conditions in the kindergartens can trigger some already existing diseases. Since concerns about the increasing worldwide prevalence of childhood asthma have been rising lately, sustaining ‘healthy’ IAQ in kindergartens is crucial. 39
Obviously ventilation decreases during the heating season, especially in naturally ventilated spaces. Ventilation frequency here reaches a maximum in July–August. On the other hand, the chosen sampling period before the heating season was October, which was neither too hot to ventilate indoors nor too cold to close windows like people usually do in January. Thus, observed TBC levels did not primarily originate from the ventilation frequency, since extreme differences in ventilation frequencies were not expected.
Indoor to outdoor (I/O) ratios of TBC values were also calculated. If the I/O ratio is >1.0, there is a difference between outdoor and indoor bacteria sources and the source exists in the indoor environment. I/O ratios of TBC levels at the sampling sites according to the building types (i.e. kindergarten, home, dorm and school) were calculated in each sampling period (see Table 6). As can be seen from the table, the median values of I/O ratios for the four building types were found to be ≥1.0 during the study. I/O ratios during the heating periods (winter and spring) were found to be higher than those observed before the heating season (autumn). Among the buildings monitored in this study, the highest I/O ratios were observed in kindergartens for each period.
Paired sample comparisons at 95% confidence level.
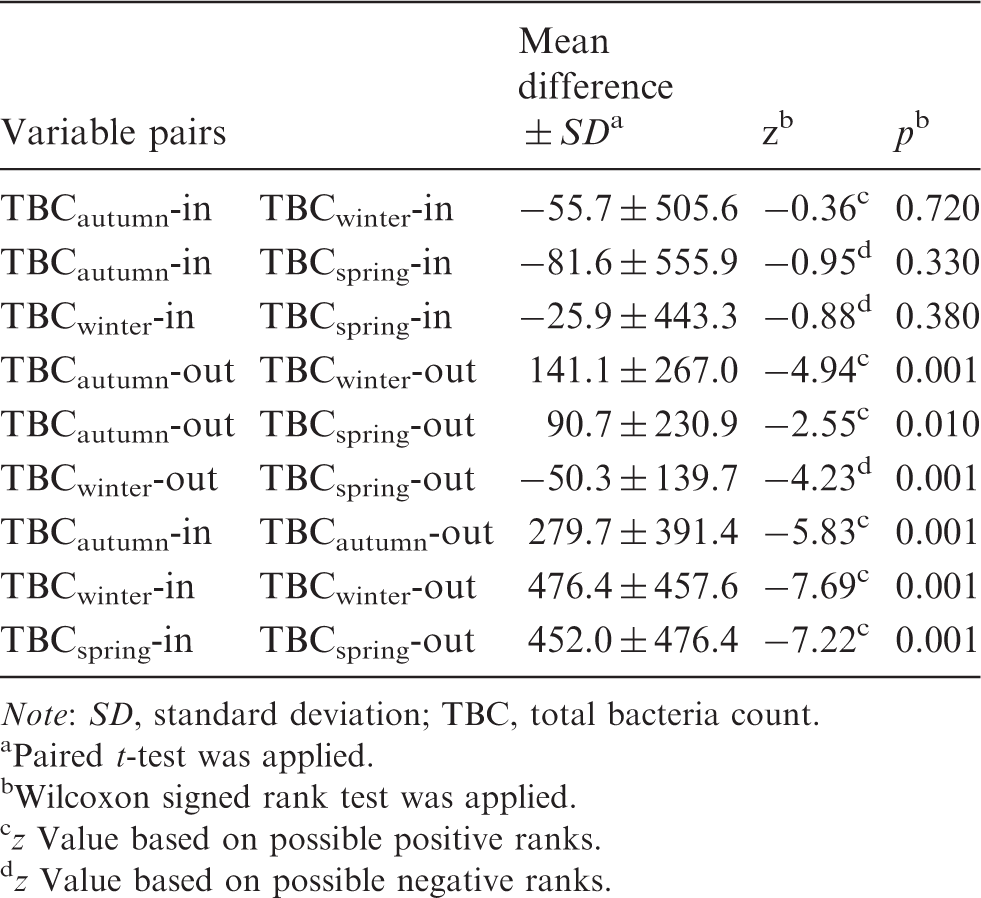
Note: SD, standard deviation; TBC, total bacteria count.
Paired t-test was applied.
Wilcoxon signed rank test was applied.
z Value based on possible positive ranks.
z Value based on possible negative ranks.
Personal factors and observation frequency of SBS symptoms
Characteristics of the occupants. a
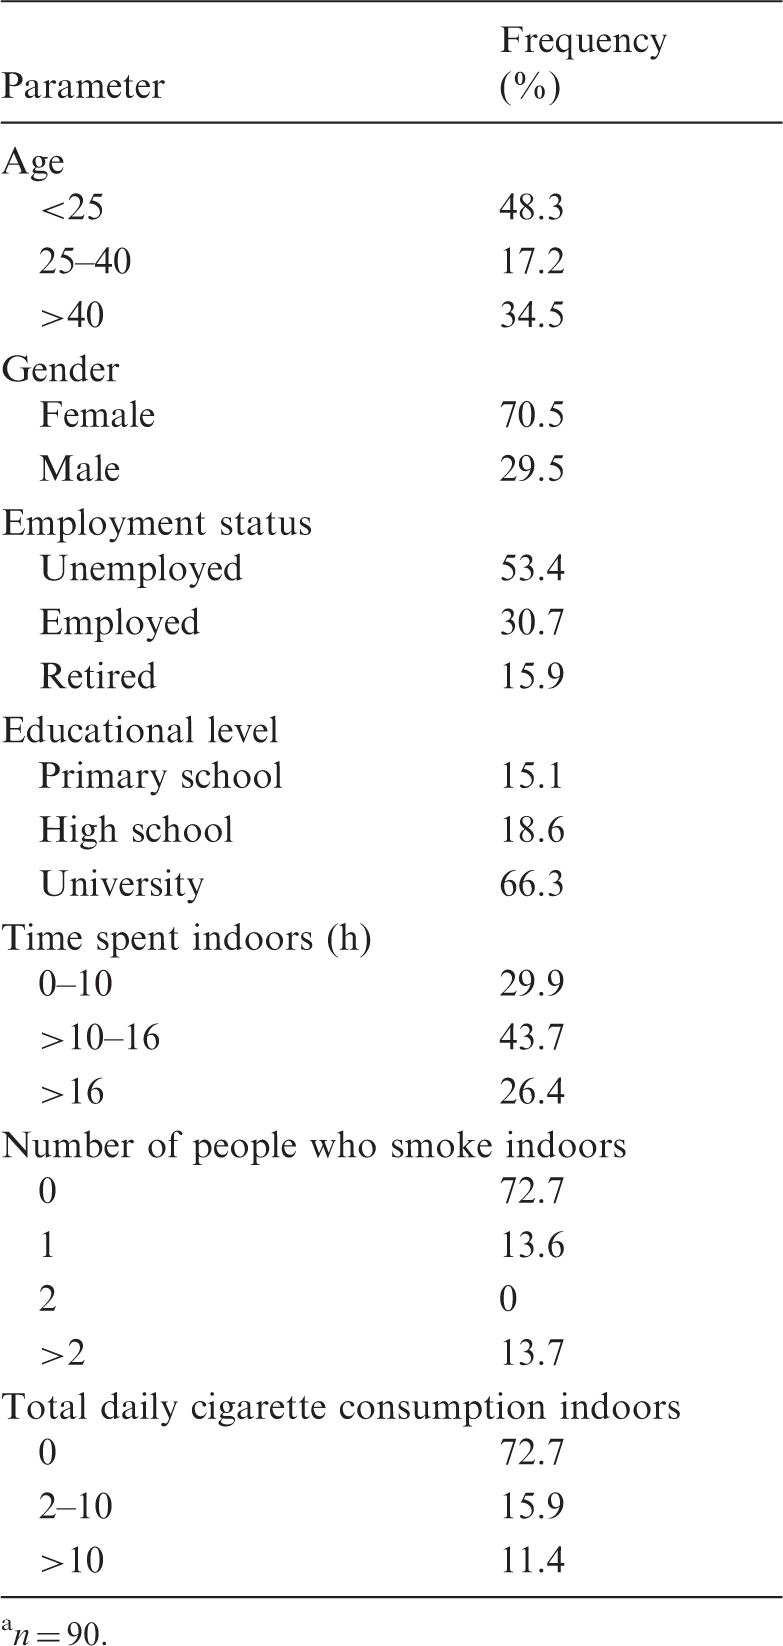
n = 90.
Prevalance (%) of Weekly SBS Symptoms among Healthy Participants
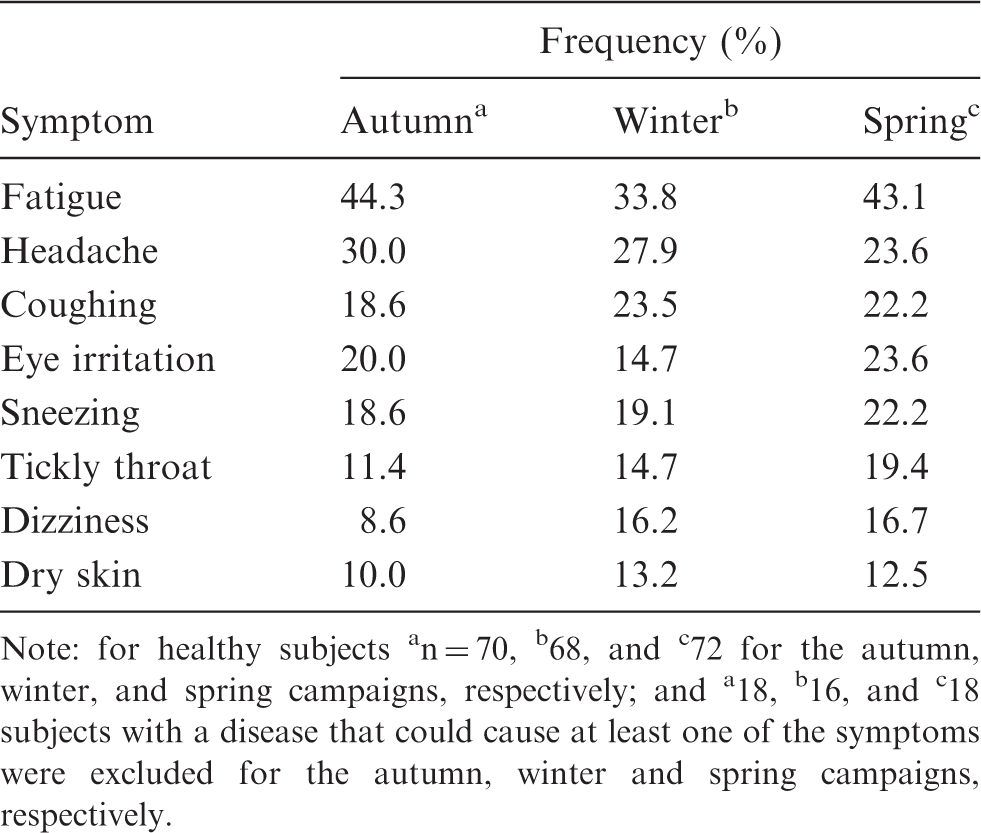
Note: for healthy subjects an = 70, b68, and c72 for the autumn, winter, and spring campaigns, respectively; and a18, b16, and c18 subjects with a disease that could cause at least one of the symptoms were excluded for the autumn, winter and spring campaigns, respectively.
Prevalence of the number of observed SBS symptoms among the healthy participants was also examined. Almost one third of the healthy participants did not suffer from any of the SBS symptoms (i.e. control group of the healthy participants), while the remaining healthy participants suffered from at least one of the SBS symptoms (i.e. case group of the healthy participants).
Bivariate analysis results between the SBS symptoms and the building/occupant-related factors. a
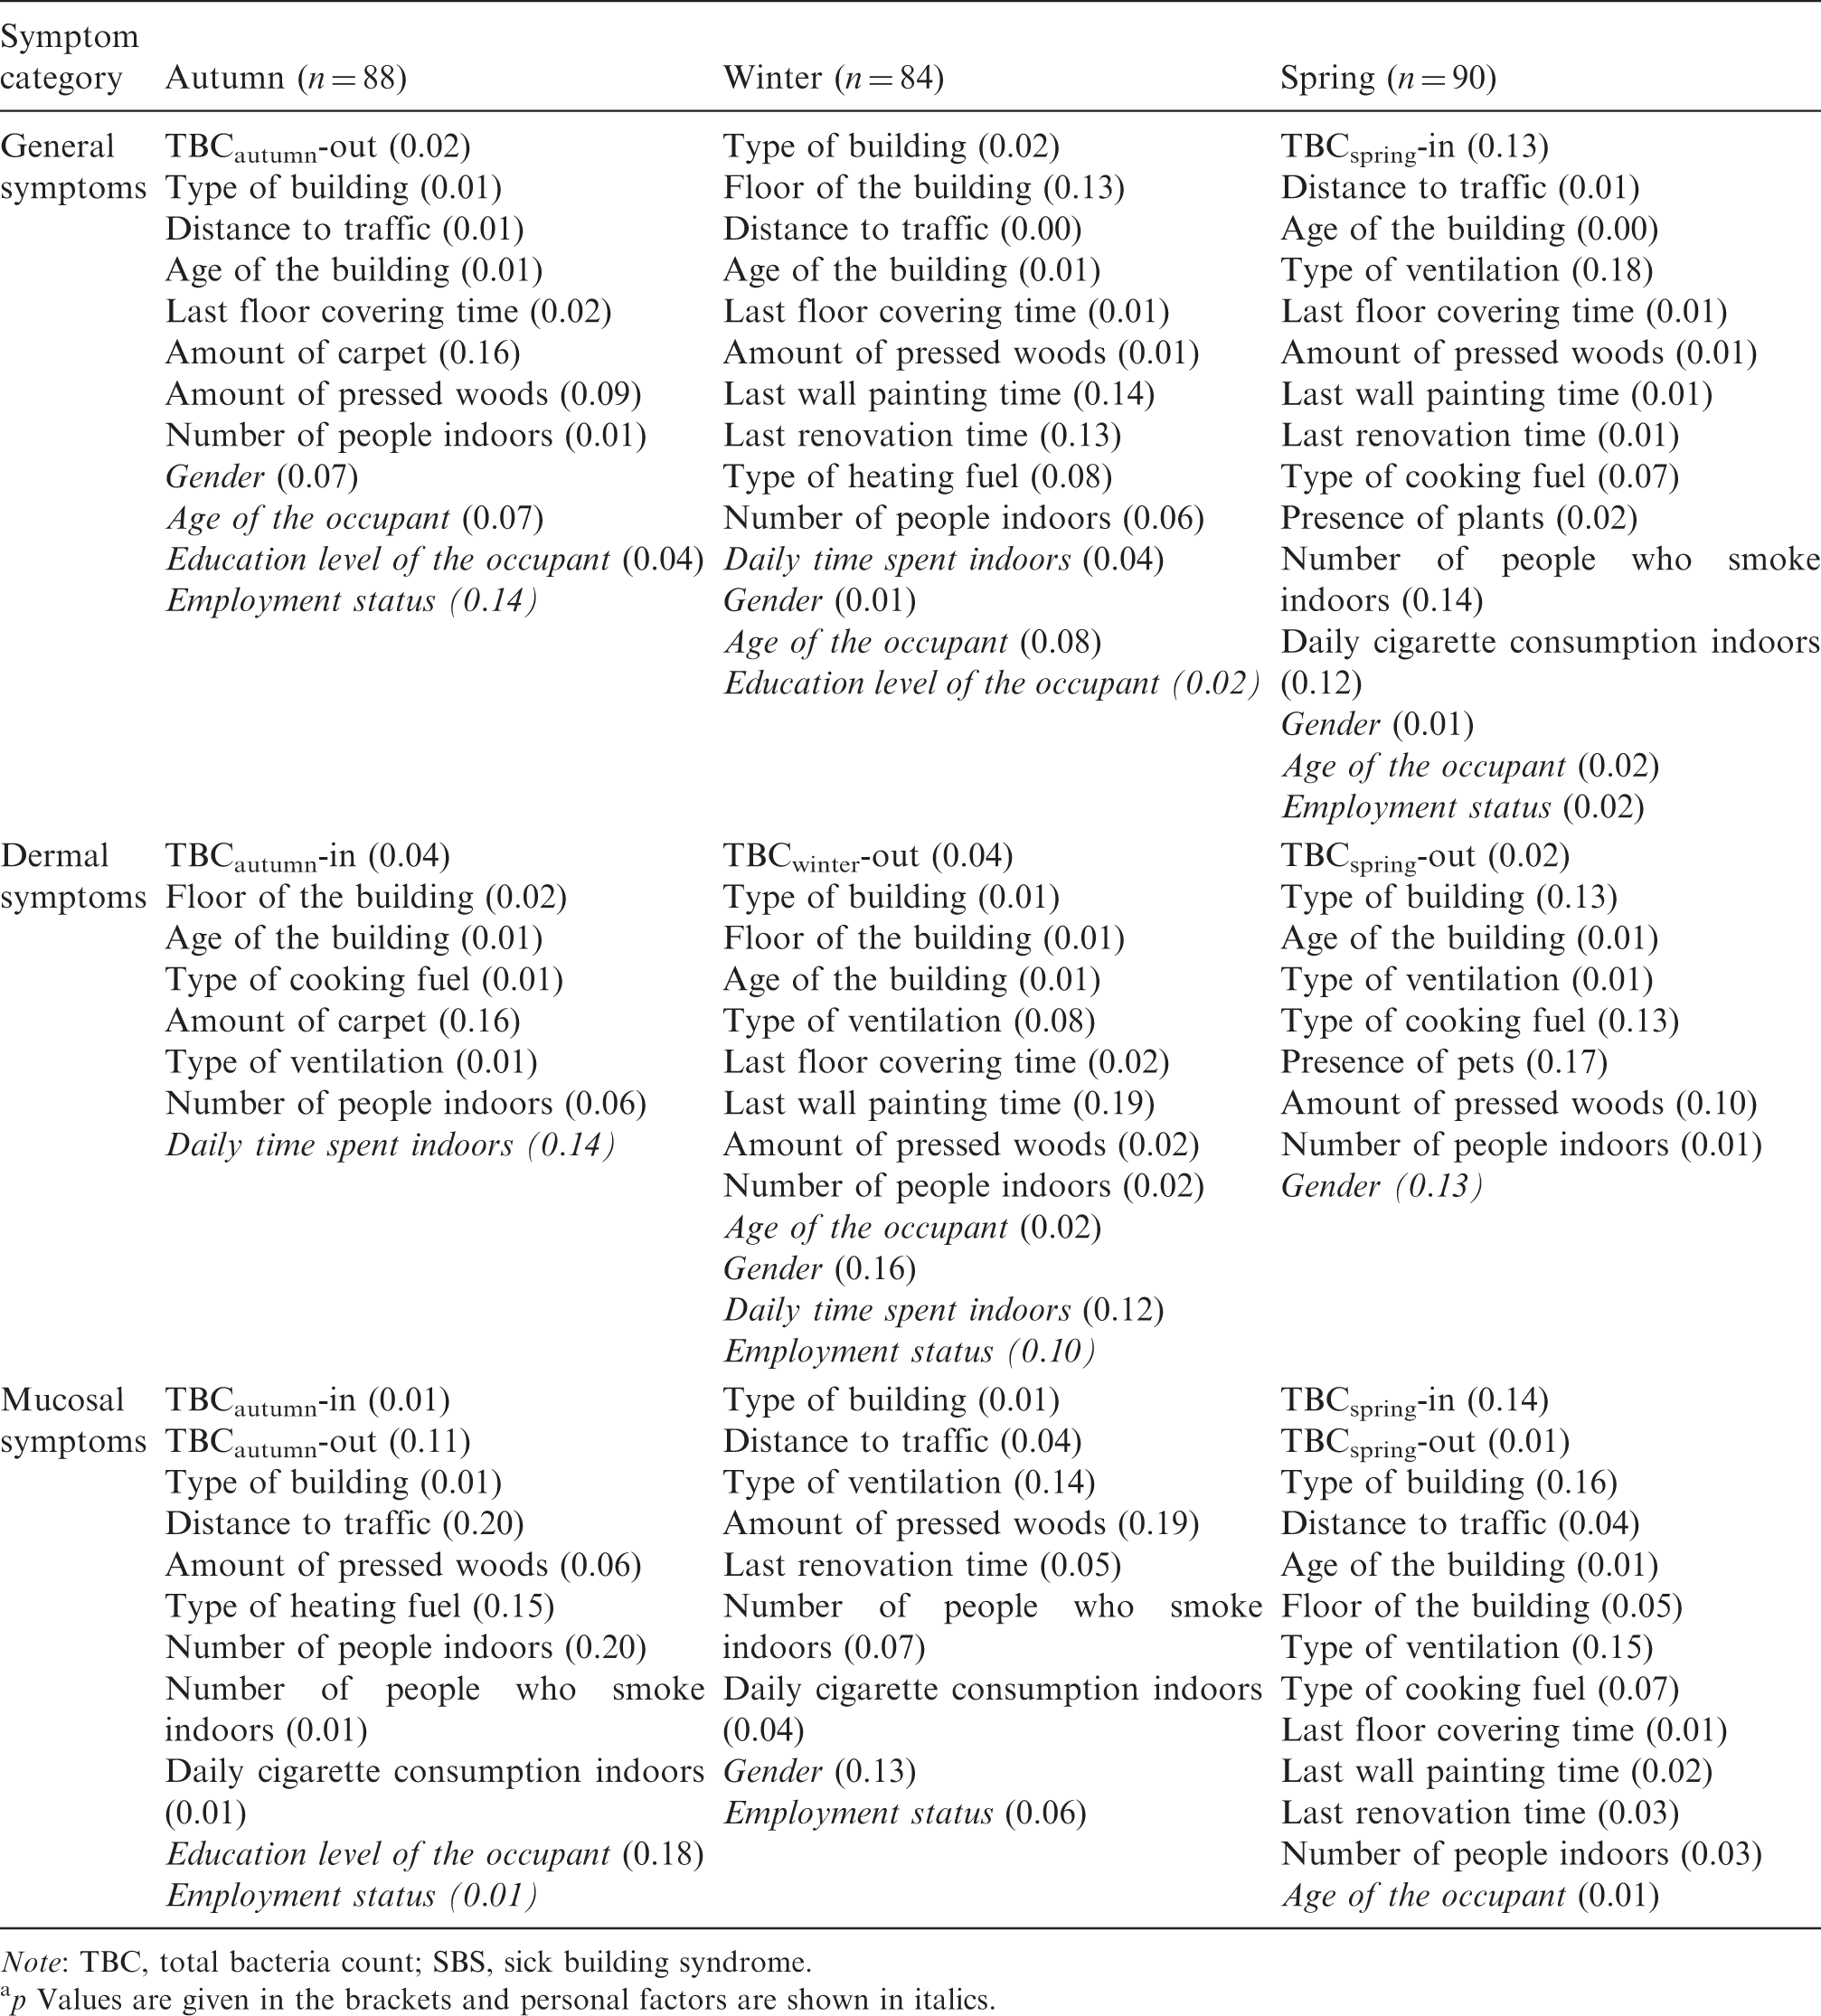
Note: TBC, total bacteria count; SBS, sick building syndrome.
p Values are given in the brackets and personal factors are shown in italics.
Multiple Logistic Regression Models between the SBS Symptoms and the Building/Personal Related Factorsa
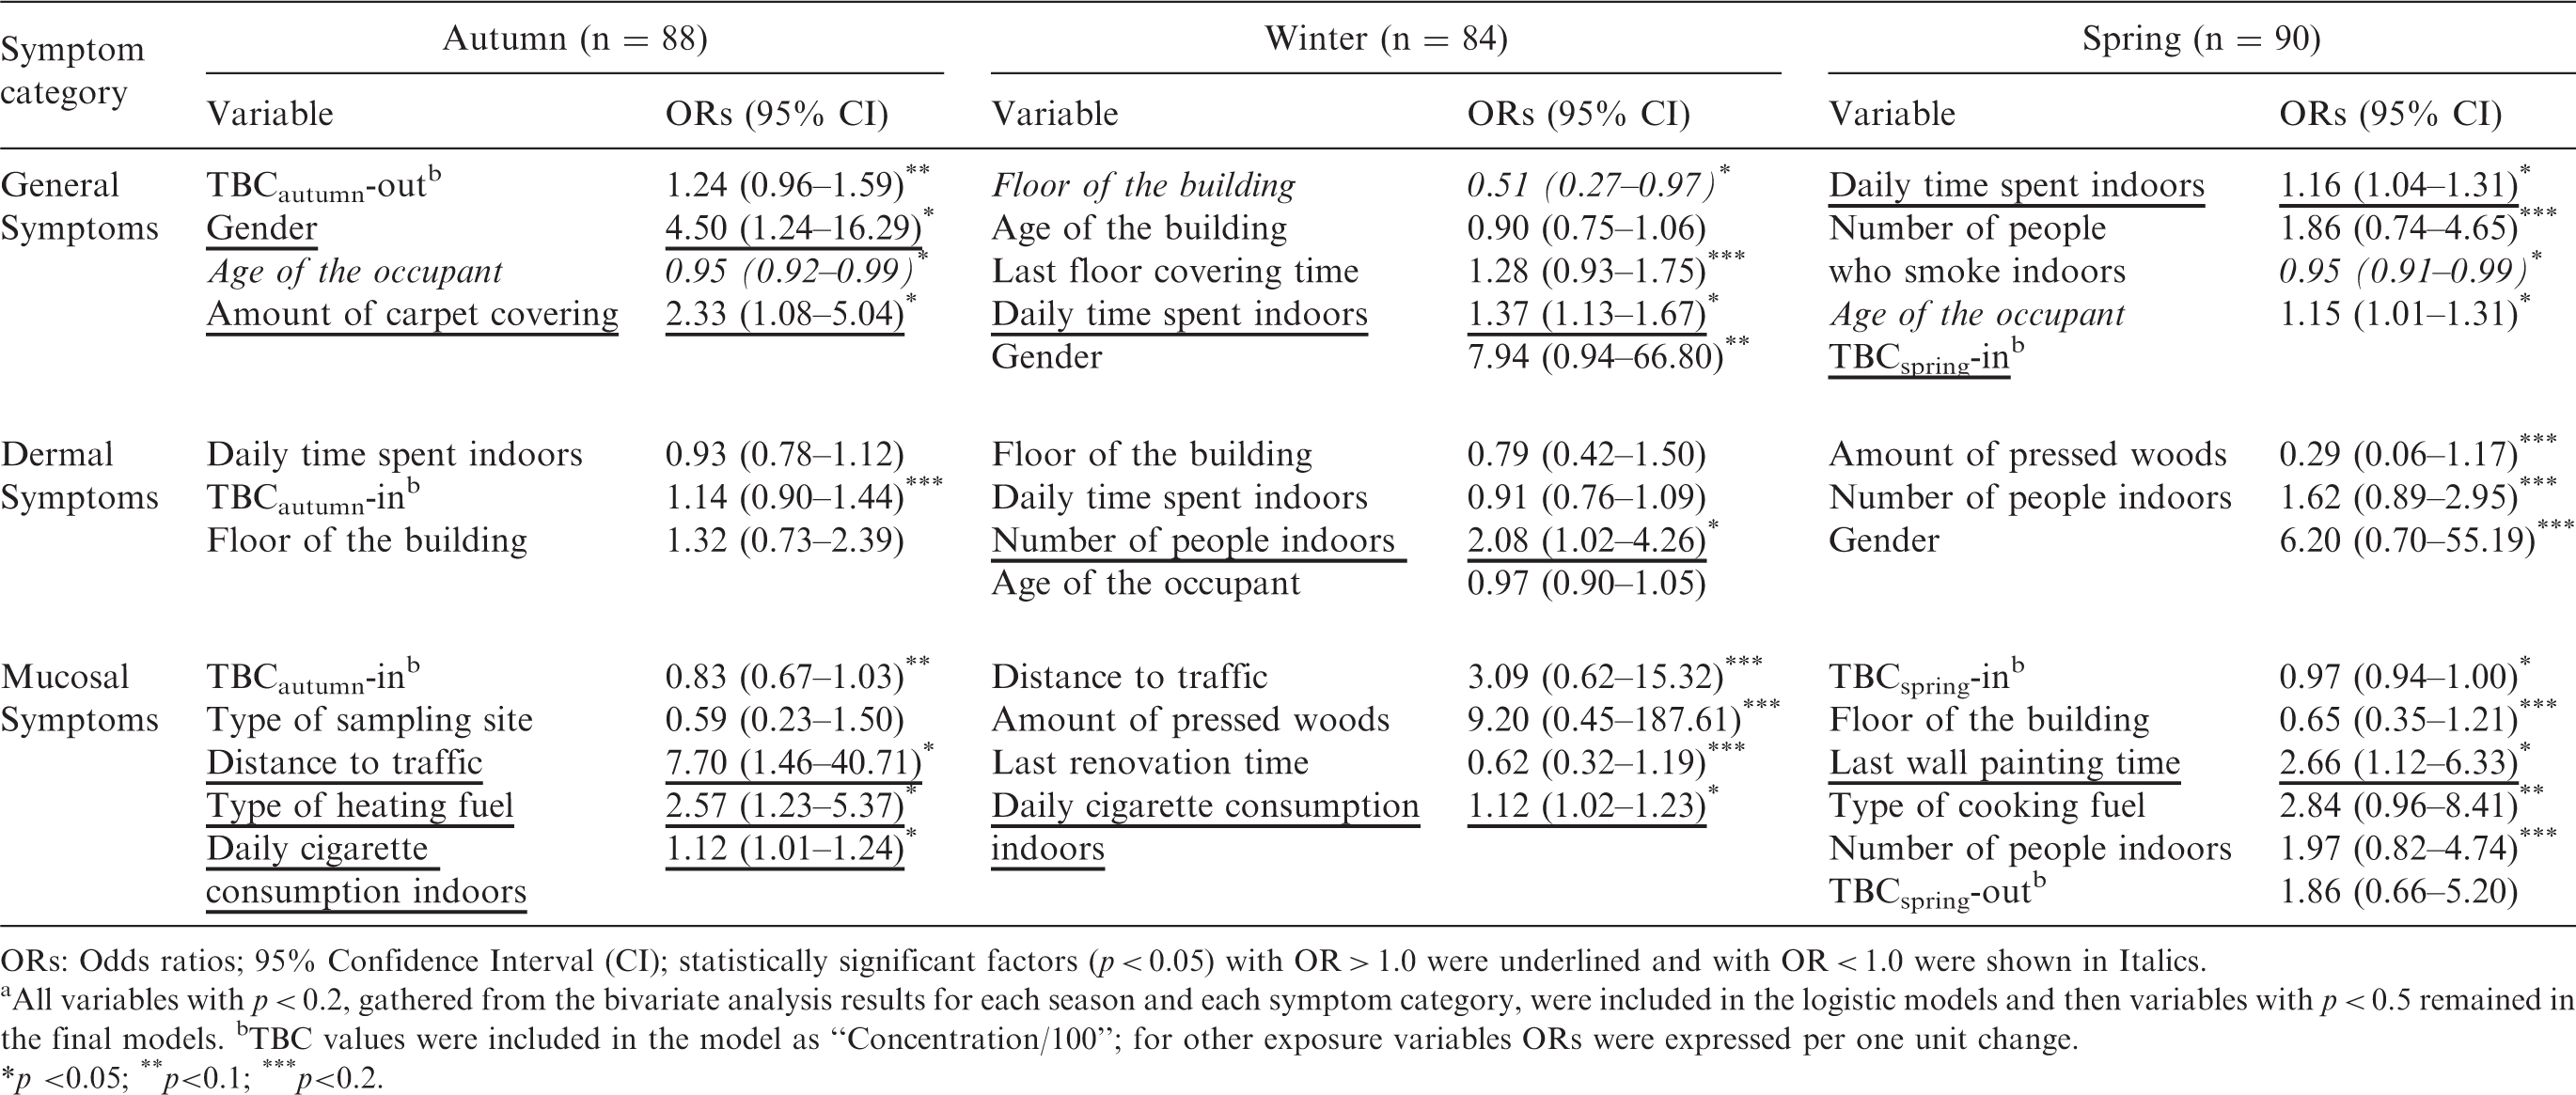
ORs: Odds ratios; 95% Confidence Interval (CI); statistically significant factors (p < 0.05) with OR > 1.0 were underlined and with OR < 1.0 were shown in Italics.
All variables with p < 0.2, gathered from the bivariate analysis results for each season and each symptom category, were included in the logistic models and then variables with p < 0.5 remained in the final models. bTBC values were included in the model as “Concentration/100”; for other exposure variables ORs were expressed per one unit change.
p <0.05; **p<0.1; ***p<0.2.
Gender was found to be associated with general symptoms observed in autumn (ORs = 4.50), indicating that female occupants suffered from the general symptoms of SBS at least 4.5 times more than male occupants. Amount of carpet covering was related with the general SBS symptoms observed in the autumn (ORs = 2.33). Daily time spent (h) by the occupants indoors was associated with general symptoms of SBS both in the winter (ORs = 1.37) and spring (ORs = 1.16). TBC levels measured in the spring were found to be associated with general SBS symptoms (ORs = 1.15). A 100 CFU m−3 increment in TBC levels increased the odds of general SBS symptoms by 15%. Besides, some of the factors with ORs < 1.0 and p < 0.05 were found to be ‘preventive’ for the occurrence of the general SBS symptoms, which are the age of the occupant and floor number of the sampling site. Thus, the probability of observation of general SBS symptoms among young occupants was less than for old ones. Also, as the floor of the site increases, occurrence of general SBS symptoms decreases. When the height of the site is close to ground level, it is possible to be exposed to pollutants coming from traffic sources or due to the resuspension of particles or bioaerosols from the soil.
The number of people indoors was found to be associated with dermal symptoms occurring in the winter (ORs = 2.08). One person increment of the occupants at the sampling sites resulted in 2.08 times greater odds of having dermal SBS symptoms. Since climatic conditions indoors are more comfortable for people than staying outdoors during the winter period, people mostly prefer to spend their time indoors.
Daily cigarette consumption indoors (i.e. ETS exposure) were found to be associated with the mucosal SBS symptoms occurring both in the autumn and winter (ORs = 1.12). Every single cigarette consumed resulted in a 12% increase in the odds of having mucosal SBS symptoms. Distance of the sampling site to traffic was found to be associated with exposure to mucosal SBS symptoms in the autumn with high odds (ORs = 7.70). Distance of sampling sites to traffic sources was classified as located ‘on the street’ and ‘on the/close to highway’. Living close to high traffic sources resulted in 7.7 times odds of having mucosal SBS symptoms. Proximity to traffic sources can result in exposure to other pollutants such as particles and organic or oxygenated compounds,43,44 which can also induce SBS symptoms. Also, type of heating fuel of the sampling site (ORs = 2.57) was associated with mucosal SBS symptoms observed in the autumn. In terms of heating fuel types, natural gas was assumed to be the reference fuel, while butane–propane gas and coal were assumed to be the categories. When the other fuels were used as heating source, the probability of having mucosal SBS symptoms increased 2.57 times compared to locations using natural gas. Finally, it was found that as the time since last wall painting increases, the probability of occurrence of mucosal symptoms increased during the spring (ORs = 2.66). Since microbiological pollutants can grow on the walls, 45 environmental factors such as temperature and humidity might have increased the exposure to biological pollutants over time.
According to the ANOVA tests, some of the individual SBS symptoms showed dose–response relationships with measured TBC levels (p < 0.05). They are fatigue, headache and dry skin. TBC levels were found to be higher when the participant had these problems. Harrison et al. 18 also found positive associations between symptom prevalence rates and levels of airborne viable bacteria in buildings with similar ventilation systems.
The occurrence of SBS symptoms according to gender was also researched by Spearman’s rank correlation test. Similar to outcomes gathered from the multiple logistic regression models, significant associations were found for the occurrence of the general SBS symptoms (Spearman’s R = 0.39, p = 0.002) observed in female participants during the winter and spring seasons. As stated, females had a higher prevalence of SBS than males,46–53 probably due to calculated higher time spent indoors in this study (M ± SD; for females = 17.4 ± 5.8 h and males = 10.7 ± 4.4 h) and having higher sensitivity than men.
The prevalence of the SBS symptoms among different age groups was also studied. Since the sampling sites were selected randomly, a relatively high ratio of young participants (1/2 of the participants were <25, especially in dorms and schools) was included to the study. General and mucosal SBS symptoms (Spearman’s R = −0.33, p = 0.06) were related to the ages of the occupants throughout the study period. Norlén and Andersson 54 pointed out that the relationship between age and SBS seemed to be rather complex; in addition several studies55,56 showed no relationship between age and SBS. Links between SBS symptoms and the age of the occupants were considered here in spite of some confounding factors. However, it should be noted that younger people may suffer less from any related disease for several reasons: a strong immune system response, having fewer symptoms of any unknown disease and acquiring a new disease less often. Also, elderly people are more susceptible to diseases. On the other hand, even though we asked the participants whether they had any related disease that can induce SBS-like symptoms, it might be possible that they already acquired a disease but they were unaware of it.
Conclusions
This study has shown that indoor TBC levels were found to be higher in the sampling sites where coal is used as a heating source during the heating season (p < 0.05). Statistically significant differences were found between TBC levels measured indoors and outdoors (p < 0.001). Additionally, calculated I/O ratios were found to be >1.0, indicating bacteria proliferation due to indoor sources. Outdoor TBC levels had associations with the meteorological factors of wind speed, RH, temperature and cloudiness (p < 0.001). The most prominent difference in indoor TBC levels was seen between the kindergartens and the schools. This result can be explained by two relationships: (i) bacteria levels were strongly correlated with occupancy; this was verified by a dose–response relationship between the TBC levels and occupancy rate, and (ii) lower outdoor TBC levels indicate that indoor bacteria originates from indoor sources. Indoor TBC levels showed statistically significant relationships among the building factors of occupancy rate, type and age of the building, last floor/wall painting/renovation times and type of heating/cooking fuels (p < 0.05). 80% of the participants had no existing disease/diseases, which may induce similar symptoms to SBS (i.e. healthy participants). Almost 30% of the healthy participants did not suffer from any SBS symptoms. Among the healthy participants, fatigue, headache and coughing were the most frequently occurring SBS – symptoms. Multiple logistic models showed that season has an obvious effect on associations between the environmental conditions and occurring SBS symptoms. Multiple logistic models also showed that indoor TBC levels, personal factors (gender and daily time spent indoors) and building-related factors (occupancy rate, ETS exposure, distance to traffic, type of heating fuel, amount of carpet covering and last wall painting time) were found to be associated with at least one group of the SBS symptoms. The general SBS symptoms (headache, fatigue and dizziness) occurred significantly in female participants, probably due to more time spent indoors and higher sensitivity than men.
The study also has some limitations that should be taken into account, particularly when conducting further studies:
While estimating SBS symptoms among people, several points should be taken into consideration: participants should be in the age ranges from 18–25 to 50–60, depending on the average life expectancy and socioeconomic status of the country involved. Finally, this study was a small study and associations between air pollutants (i.e. TBC and other pollutants) and SBS symptoms should be investigated in a larger study population, including more than one person at each site to minimise selection bias.
Footnotes
Authors’ contribution
Sibel Mentese was responsible for all steps of the study and the evaluation and publication of the study results. Deniz Tasdibi was responsible for the application of the questionnaires.
Acknowledgements
The authors thank Env. Eng. students Tuğba Böce, Melis B. Mutlu, Saime S. Özdemirpençe, Salih Y. Nişancı, Elif Palaz, Burak Çetin, Burak Selçuk and Sevil Karagöz for their help during the field studies; Dr. Margaret Hawthorne and Catherine Yigit for reading the manuscript; Dr. Coskun Bakar and Dr. Sibel Cevizci for the recommendation about the logistic regression, and the occupants of the sampling points for their patience.
Declaration of conflicting interests
The authors declared no potential conflicts of interest with respect to the research, authorship, and/or publication of this article.
Funding
This study was supported by Çanakkale Onsekiz Mart University Scientific Research Center. Project no: 2010/168.