
Abstract
Urban wind environment could have an impact on pedestrian’s comfort and safety, as well as pollution dispersion and building energy consumption. For cities in the hot-summer and cold-winter climate zone of China, a proper design residential neighbourhoods is important to facilitate urban ventilation in hot and transient seasons and to protect users from strong winds in cold season. This paper reports the results of field measurements and a questionnaire survey in a large residential development with three different types of housings. Micrometeorology measurement was carried out at the pedestrian height level as well as at a rooftop reference station. Pedestrians’ subjective perception on wind and thermal comfort was recorded through a guided interview and questionnaire survey during the measurement. The measured wind velocity ratio is highest in the long-linear high-rise building layout, and is the lowest in the mid-rise linear building layout. Eight-seven per cent of respondents felt fairly comfortable living in the long-linear high-rise building layout, only 7% less than the mid-rise building layout. For similar housing forms in Shanghai, the wintertime wind shelter may not be critical compared with summertime ventilation requirement, and that the site planning and housing design should focus mainly on summertime wind channelling.
Keywords
Introduction
Urban wind environment could affect outdoor comfort and safety, and also street pollution dispersion and building energy consumption. 1 Climate-responsive urban design strategies could modify local wind pattern and help create comfortable, healthy and liveable outdoor urban spaces.2–4 Due to higher surface roughness, the overall wind speed in the urban canopy layer (UCL) is low in dense urban centres in comparison to the suburbs and rural areas, but the pedestrian-level wind speed around urban buildings could be significantly varied both spatially and temporally, due to the airflow deflection, channelling, separation and reattachment by the bluff building bodies. Previous studies on building wind climate typically dealt with building caused – gust and resultant wind comfort and safety issues in developed countries under cold/moderate climates. For example, studies on pedestrian winds in North American cities were carried out and reported in the 1980s. 5 Recent years have seen emerging research aiming to mitigate air stagnation and enhance urban ventilation in high-density cities under hot-humid climates, e.g. in Hong Kong6–7 and Guangzhou, 8 and prevent strong winds in cold cities, e.g. Shenyang. 9 However, the effect balance of building form on wind pattern and on pedestrian comfort considering both the cold season and hot season remains not well studied. In China, the middle and lower reaches of Yangtze river are climatically labelled ‘hot-summer and cold-winter (HSCW)’ Zone. This broad region has been undergoing rapid urbanization process. There is a need to understand the annual wind pattern and comfort level in typical urban blocks and neighbourhood within this climate zone, so as to inform planners and designers to create better urban wind environments.
The efforts to improve urban wind environment are included for accreditation in the green building assessment programme in China. The Chinese Evaluation Standard for Green Building (ES GB50378-2014) 10 awards 3 credits to developments which can demonstrate a wind pressure differential of less than 5 Pa between windward and leeward building façades during the wintertime, and that the wind speed at the pedestrian level should be less than 5 m/s. Further 3 credits are to be awarded if in summertime, no wind shadow in major outdoor pedestrian area, and no less than 50% of buildings have at least 0.5 Pa pressure differential between windward and leeward façades. The Standard, however, does not provide guidelines or prescriptive standards for accreditation compliance. The China Thermal Design Code for Civil Building (GB50176-93) 11 requires urban design should take into account both wind shelter in winter and wind channelling in summer, with a priority being given to summer cooling; but, no guideline is provided in regards to standard compliance. How should the architect meet the seemingly controversial need for his design in relation to the urban wind environment? Could the design strategies enhance the summer ventilation that would lead to a high probability of overly windy outdoor pressure on façade in winter? To answer these questions, the understanding of the real wind pattern in typical housing quarters by empirical analysis is necessary. This project investigated the effect of summer winds on strategically selected high-rise housing quarters in Shanghai. 12 This study also focuses on the wintertime pedestrian winds through a case study on a large housing quarter with a mixed housing forms. The objective is to investigate the impact of building form and density on urban ventilation in relation to users’ perception on wind and thermal comfort and its implication on urban planning for housings and architectural design for residential buildings.
Literature review
Wind comfort assessment
The used wind comfort criterion.
The HSCW zone and Shanghai climate
According to the Chinese Standard, GB50178-93, Climatic Regionalism of Building Design in China, 20 the country’s territory can be divided into seven climatic zones based on the mean air temperature of summer month July (Tmean-July) and winter month January (Tmean-Jan). The region with Tmean-July in the range of 25–30℃ and Tmean-Jan in the range of 0–10℃ falls into the HSCW climate zone. This region largely belongs to the Yangtze river delta, with characteristics of hilly topography and dense river-lake network. The Tmean-Jan is on average about 8–10℃ lower than other regions of similar latitudes. The number of days with Ta-min <5℃ can be as high as 90 days. 21 This region is normally humid throughout the year, with relative humidity (RH) ranging from 70 to 90%.
Shanghai is situated on the eastern boundary of the HSCW zone and adjacent to the East China Sea. The summer is not as severe as inland areas, but the winter is harsh to endure. The number of winter days (mean Ta lower than 10℃ for five consecutive days) in Shanghai is 126. The number is the second largest among major cities in the HSCW zone, next only to Hefei, Anhui Province.
21
Although Shanghai is warmer than the northern cities such as Beijing, the winter solar radiation is much less: the sunshine hours ratio in winter is 67% for Beijing, whereas it is only 43% for Shanghai. Low radiant heating rate combined with high moisture would adversely affect human thermal comfort level in outdoor spaces in winter. Also, residential buildings in the HSCW Zone are generally not centrally heated, in comparison to homes in the cold climate zones. Cold wave occurrences have been a frequent occurrence in Shanghai in the past 10–20 years, and temperatures could drop to −10 or even −20℃ in winter.
20
The long-term meteorological data of Shanghai are shown in Figure 1 (Data source: Typical Meteorological Year data from China Meteorology Bureau and Tsinghua University
22
). The annual wind rise indicates a prevailing easterly and south-easterly wind direction, and for the winter months the northerly winds are more predominant.
Long-term meteorological data of Shanghai.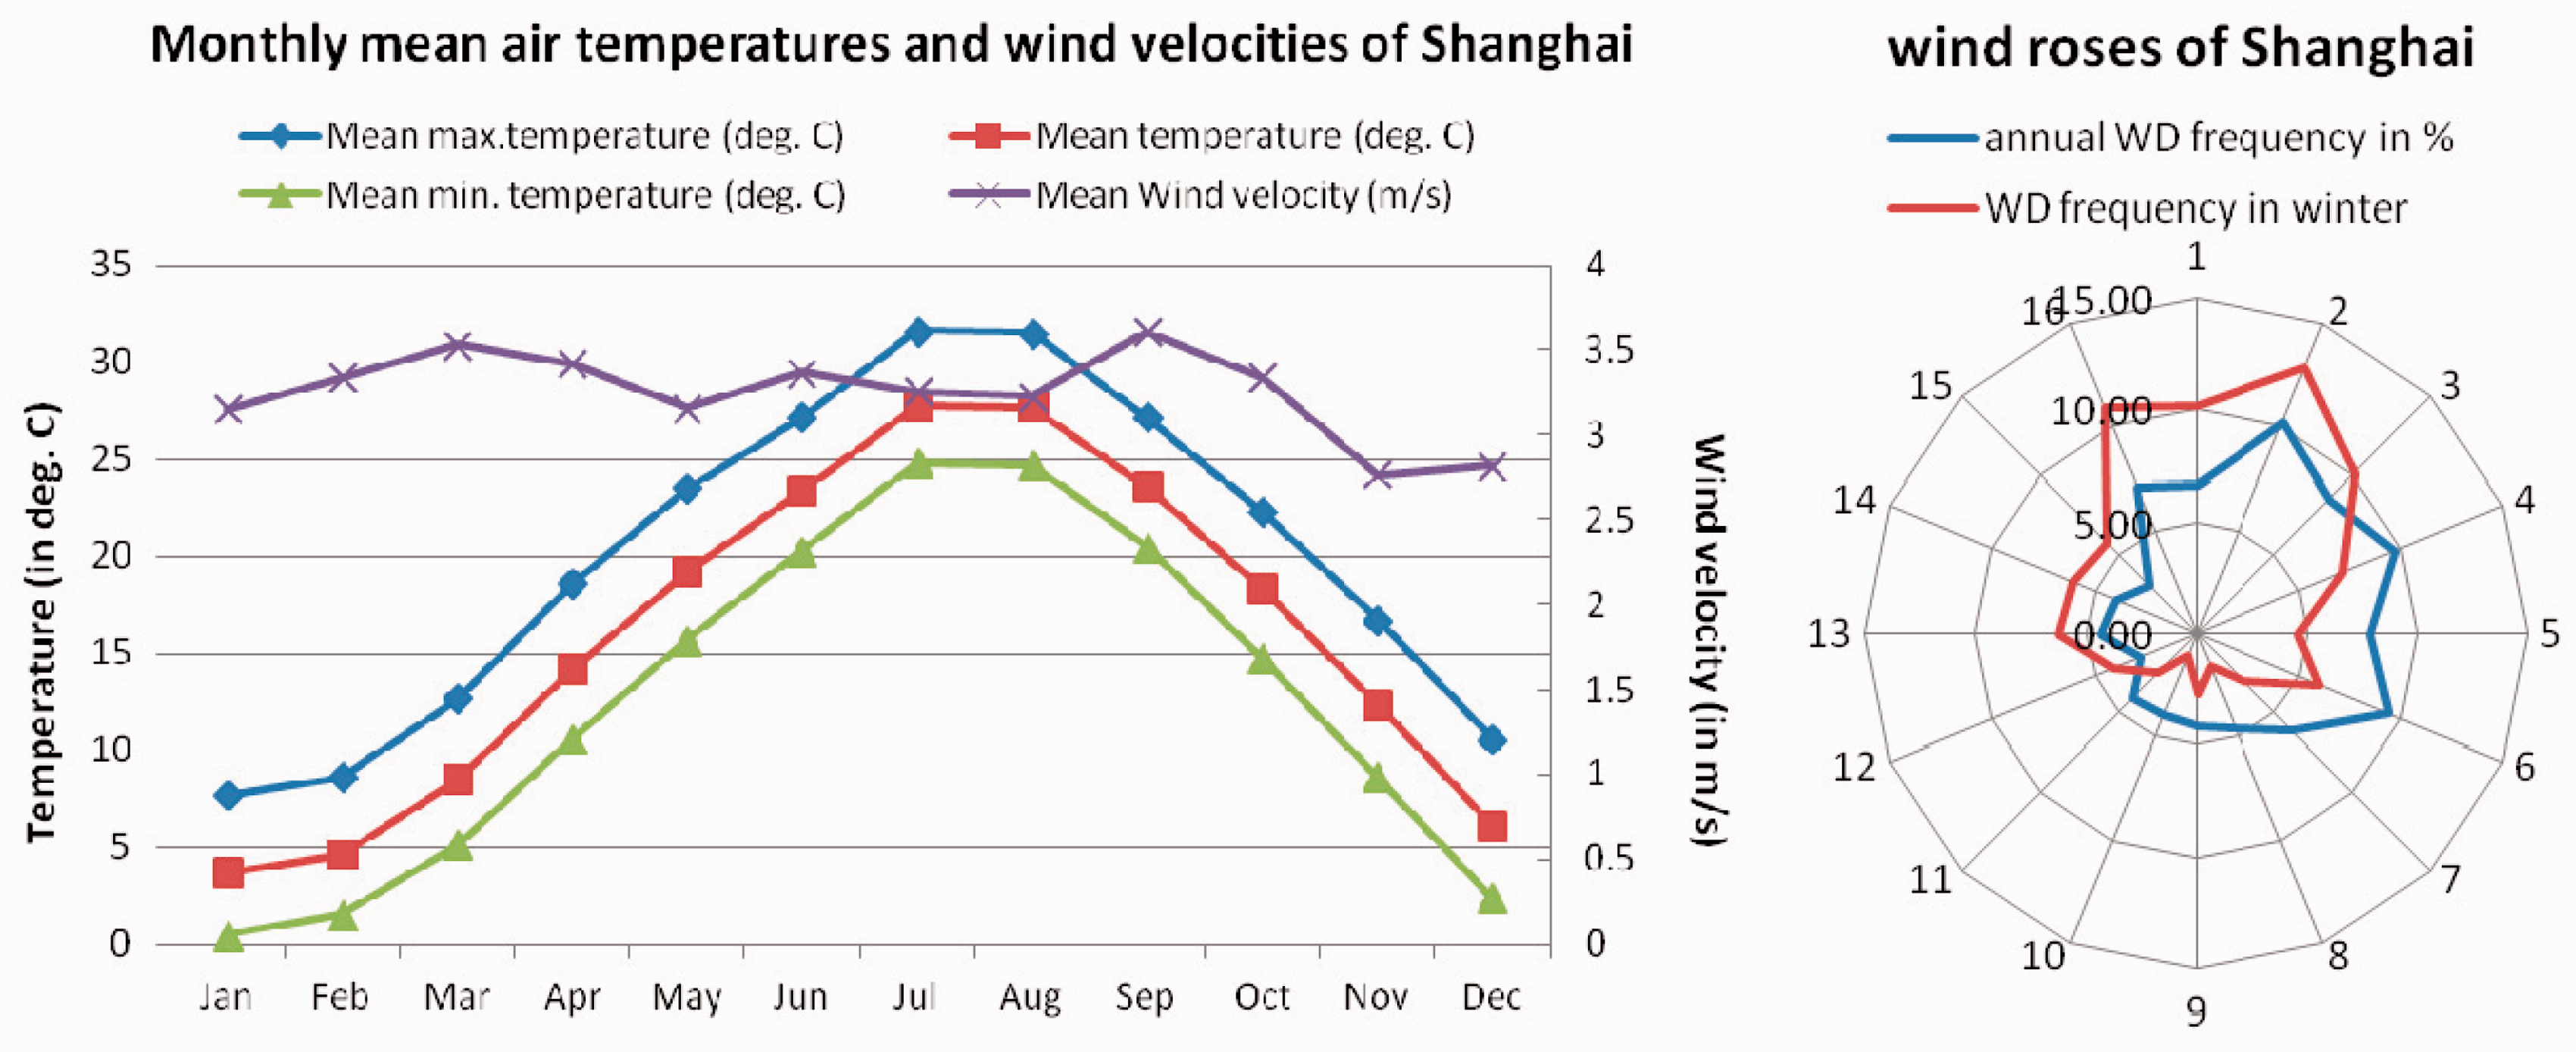
Building form and density – effects on wind flow
Before scientific inquiry was directed into the building form and its effect on urban wind flow and climate, climate-responsive design principles have long been creatively implemented in indigenous urban design in regions of both cold and hot climates. In regions of cold and temperate climates, wind protection is a key consideration in the building design, e.g. building height in dense urban area has been changing gradually over time in many cities. The ideal urban-centre skyline would be similar to the contour lines of a nearby hill, with the highest structures being permitted in the centre. The principle can be explicitly formulated in modern planning guidelines such as: ‘wherever height zones are abutted, the change in height allowed would be less than half of that allowed in the adjacent higher height zone’. 23 In hot climates, wind amplification and channelling are important. The strategy includes: reducing building coverage (footprint) and strategically organized wind corridors in urban areas, together with a varied and progressive lowering of allowed building height level to the windward direction, which would be effective measures to introduce more airflow to the pedestrian level.24,25 Streetscape planning in cold climate regions would generally prefer multistorey buildings, with recessed (stepped) podium, to prevent downward airflow from reaching pedestrian area, 9 in contrary to urban planning in hot climates which would require a reduction in building footprint and portico façade. 24
Urban climate science has quantified the urban impact on urban airflow with a series of parameters, including aspect ratio (H/W, average building height to street width of a urban canyon), building volumetric ratio (building floor area ratio, FAR), building density (building coverage ratio, BCR), frontal area index (FAI, defined as ratio of façade area to footprint), etc. 26 Studies on design implication of interaction of wind and urban form normally have been based on numerical simulation (computational flow dynamics or CFD) and wind-tunnel experiments. For instance, Hang and Li 27 numerically studied the ventilation and air change rates in hypothetical urban building arrays. They found that by lowering building density (thus widening streets), increasing building height variation, manipulating building layout (aligned or staggered) and building design variation (base penetration) can contribute to enhance wind flow rate and could benefit urban ventilation. A wind-tunnel study 28 has indicated the ventilation impact of FAR and building form; with the same range of building density, the pedestrian ventilation rates in high-rise apartment housing quarters were found to be markedly higher than those in low-rise detached houses quarters. A numerical study 29 on the effect of building grouping pattern on the resulting wind environment indicates that under a hot and dry climate, among six building configurations, the one in which buildings are grouped around a central space which open one side towards the prevailing wind provides better ventilation conditions. On contrary, empirical wind data from field measurement seem scarce, probably due to a number of factors, e.g. concerns on equipment pilferage, high costs, and most of all, difficulties in control on relevant variables in a real urban context.
Sky view factor (SVF) is defined as the fractions of the overlying hemisphere as shown in a sky view image that are occupied by the sky. An indicator of radiation exchange, SVF measured at the centre of urban canyons has been used to quantify the maximum urban heat island intensity. 30 For outdoor spaces of residential communities, SVF values measured at geometric centres of spaces represent the degree of openness to the sky. SVF can be a useful indicator of ventilation potential as well, because the ‘degree of enclosure’ created by building and/or vegetation canopy can be related to the degree of air stagnation. An earlier study by the authors suggests that in summertime, increasing SVF by 10% could increase ventilation ratios in selected locations in the studied housing quarters by 7–8%. 12
In Chinese Design Standard, JGJ286-2013, 31 for Thermal Environment of Urban Residential Areas that was issued in 2013, an index called frontal area ratio was introduced. Frontal area ratio is defined as the ratio of the frontal area of a building facing the dominant wind direction in relation to its largest possible frontal area. The ratio relates the housing geometry and orientation with the seasonal prevailing wind direction. New residential developments should comply with the requirements of summer fontal area ratio based on its climate zone. For the HSCW zone, site-average frontal area ratio should be lower than 70%. 31 This is particularly important for linear housing form, so that major façades should be at a certain angle with the prevailing winds, to facilitate site ventilation without compromising building ventilation. The index is not very much useful for building footprint such as square or circular in shape.
Housing form is associated with density, since the evolution of housing form reflects the continuing technical innovation in response to the ever-increasing pressure of accommodating more people in less area of urban land. The trend is to increase floor area ratio while decreasing building coverage ratio (BCR) and thus increasing outdoor areas for pedestrian activities. The contemporary Shanghai housing market has seen replacement of mid-rise worker’s village, consisting of 4–7 storey linear layout, and building spacing being governed by the insolation law, with high-rise apartment housing quarters in inner-city areas. At given density, high-rise housing form would perform better than mid- to low-rise form in summer pedestrian ventilation. 28 However, less is known on the impact on pedestrian wind environment in winter, due to these two types of housing forms, and also due to various mixture of high-rise housing forms (interspersed, linear, enclosed, etc.), under typical winter wind boundary conditions in Shanghai. In fact, a review on selected 26 outdoor thermal comfort studies has revealed that during the last decade, thermal comfort studies on residential outdoor spaces are very limited compared to urban open spaces such as parks and squares. 32 Therefore, the wind effect of building form on pedestrian comfort in winter needs to be evaluated, based on both subjective and objective means.
Methodology
Micrometeorological measurement
Pedestrian wind monitoring
A residential estate with a mixed housing building typology was chosen for the case study. The residential estate consists of an area of 11.2 hectare. For the purpose of this study, it is divided into three sites: site A (comprised 24-storey tower buildings), site B (14 - to 18-floor, high-rise linear slab buildings) and site C (6-floor mid-rise linear buildings) (Figure 2). The residential sites are to the eastern, western and southern side of the residential estate chosen for this study, with similar housing forms (mainly mid-rise linear residential buildings mixed with a few high-rise tower or linear residential buildings). There is an elevated highway situated to the northern side of the residential estate.
Site plan and measurement locations.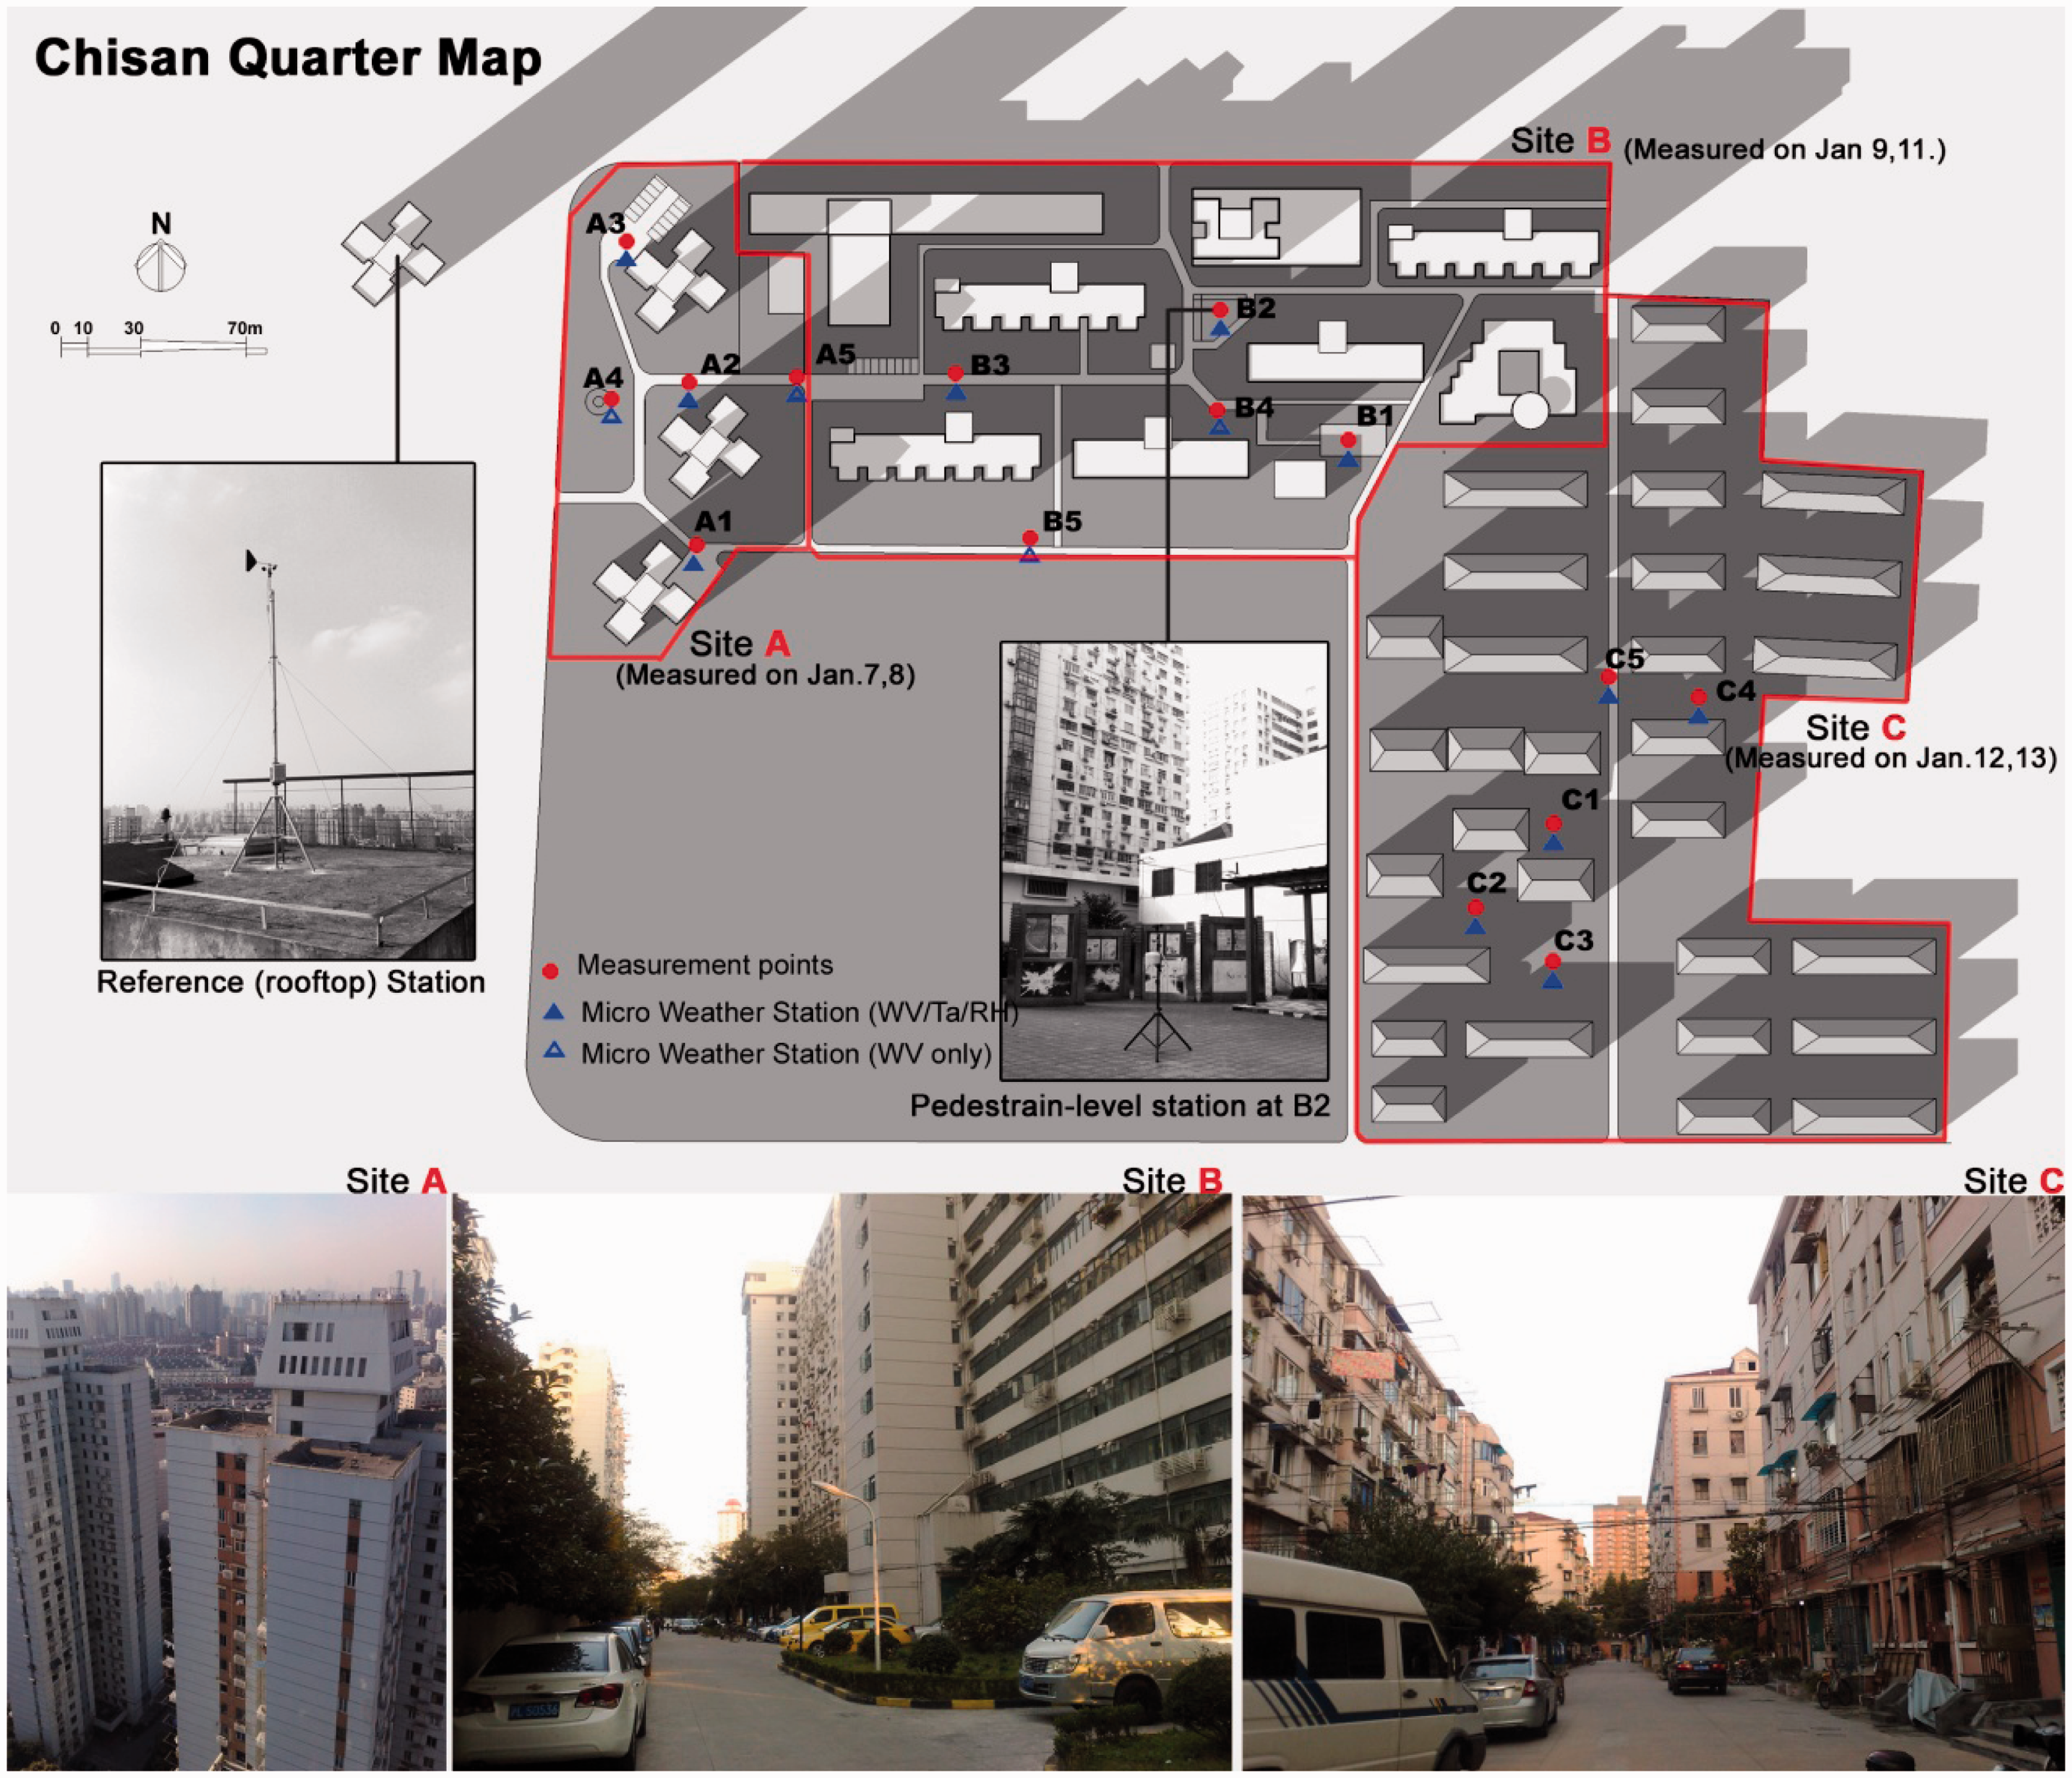
The fieldwork was carried out from 7 to 13 January 2012. A total of 15 locations at the pedestrian level were selected for this study, and the meteorological parameters were measured. The selection of sampling points should cover the widest spatial variations of the outdoor spaces. At each location, a Hobo micro weather station was set up. Air temperature (Ta), RH and wind velocity were recorded at 10-s intervals, from 8:30 a.m. to 8:30 p.m. The measurement lasted for two consecutive days at each site. Hemispherical sky view images were taken using a digital camera with a fish-eye lens. SVF was calculated using Winscanopy™ image processing software based on the images.
Reference wind monitoring
The focus of the present study is the microscale wind effect of site planning and building design. The local wind velocity should therefore be estimated, with which the pedestrian-level wind velocity can be compared. The microscale wind availability can thus be represented by the WVR. The ratio of the wind measured at the pedestrian level to that at a pre-determined reference point that is deemed free of the local downward scale urban influence. For an instrument sitting that can be considered representative of the local scale, Bottema recommends the height of the sensor above ground level (ZS) should be at least two ZH (mean building height of the working site) for a low-rise urban scenario; for a modern city, an alternative location should be upstream, with ZS equals to ZH. 33
We used the second way to define WVR, which is the ratio of pedestrian wind velocity to that at an upstream rooftop weather station, with ZS = ZH. The reference station was set up over the rooftop of a high-rise tower apartment building at the northwestern corner of the sites, i.e. the windward side in the winter. The wind velocity and wind direction sensor was mounted on top of a 5-m high-steel cast and was connected to a 15-channel Hobo data logger (Figure 2). The wind data measured were used as the reference of the local wind availability.
Subjective wind perception survey
A questionnaire survey was conducted based on guided interview with local residents and space users, in order to gather information on subjective evaluation and perception of the respondents on the comfort and safety effect of the pedestrian-level wind environment.
The guided interview and questionnaire survey were carried out during the period of micrometeorological measurement. Firstly, the demographical information, including age, gender, residence status, clothing level, physical activity level of the respondents at 15 min ago, etc. were recorded. Then, three meteorological parameters (Ta, RH and wind velocity) were subjectively evaluated, followed by a subjective evaluation on personal acceptability towards wind environment based on the four-point scales (0: clearly acceptable; 1: just acceptable; 2: just unacceptable, and 3: clearly unacceptable), and thermal comfort evaluation based on the four-point scales (0: comfortable; 1: slightly uncomfortable; 2: uncomfortable, and 3: very uncomfortable) recommended by ISO 10551:2001. 34 In total, 263 respondent questionnaires were collected which were considered valid for our analyses.
Data analysis
Wind data statistics
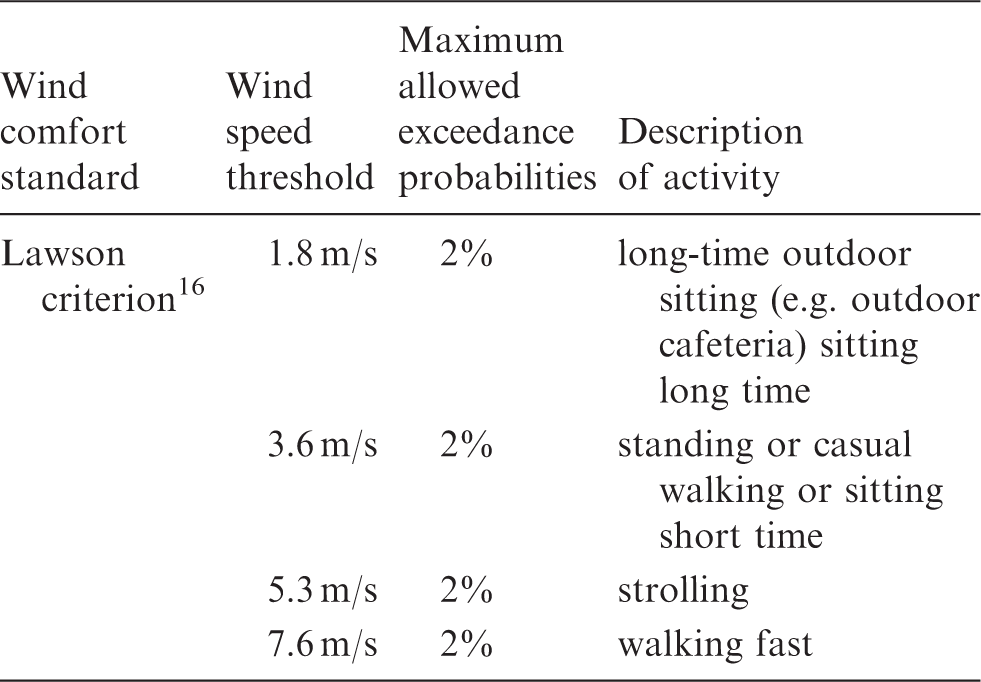
We examined the measured wind data based on accepted standard, i.e. Lawson criterion, 16 to evaluate the comfort and safety impact of the measured pedestrian wind velocity. The pedestrian wind velocity was then correlated with housing form and geometry parameters to check the possible impact of site plan, building layout and configuration on the pedestrian wind velocity.
Assessment of pedestrian’s wind comfort based on Lawson criterion.
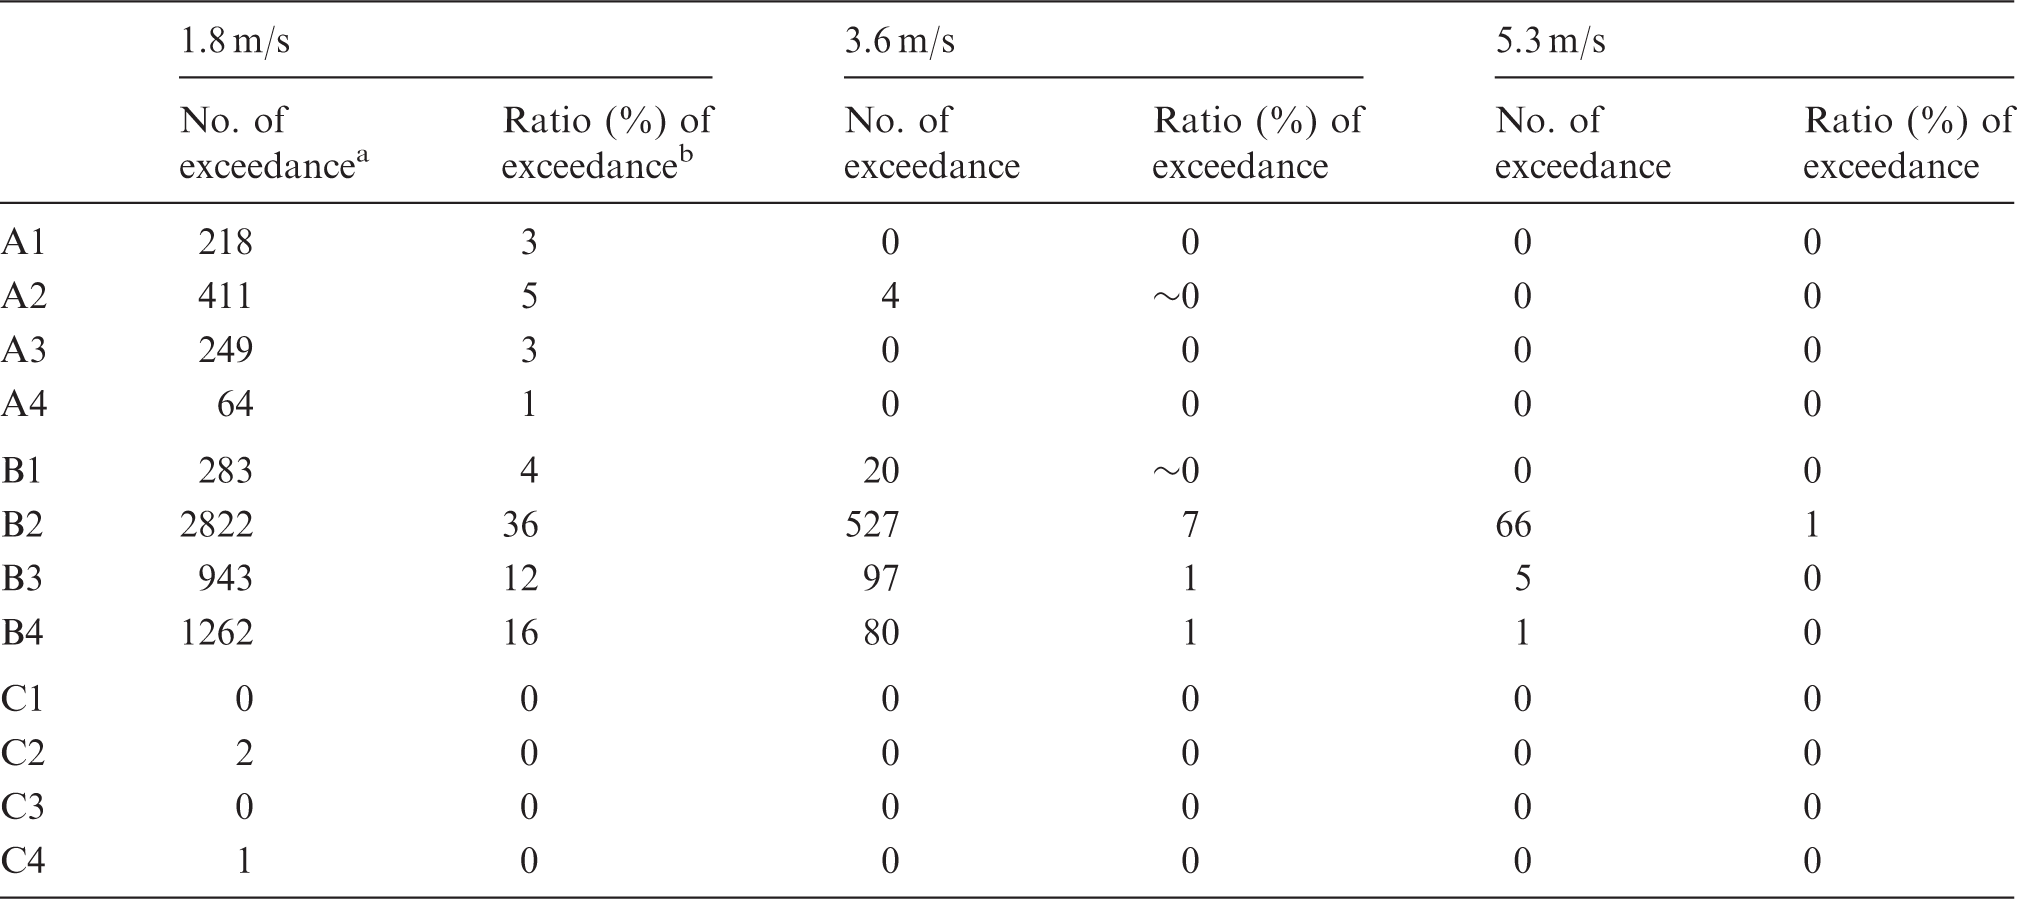
Number of exceedance is the number of measurements with wind velocities higher than a certain threshold;
Ratio of exceedance is the ratio of number of exceedance to the total number of measurements (in percentage).
The wind velocity statistics for the three sites A to C are shown in Figure 3. The major wind velocity values (between the 25th and 75th percentile) at the reference rooftop station fell within approximately 3–4 m/s, 2–4 m/s and 1–2 m/s for sites A, B and C, respectively. The pedestrian-level wind velocity data are all significantly reduced compared to the reference data. Except in site C where the wind movement in all stations appeared to be stagnated, wind velocity variations in sites A and B reasonably reflected the wind effect of building. For instance, A2 and A3 are located at the northwestern side of the residential towers and exposed to the prevailing wind, whereas A1 is at the leeward side of tall buildings. The results have reflected the effect of site locations on the wind velocity pattern, in which A1 was significantly lower than A2 and A3. B2 and B4 are located along a northwest-southeast road that is connected with the main entrance of site B at the northern boundary. The wind channelling effect was clearly shown in the results, as the wind velocities at B2 and B4 were markedly higher than B3 and B1 which are sheltered by long-linear tall buildings at their windward side. By examining the tabulated wind velocity according to the Lawson criterion
16
(Table 2), the wind velocities at points A1, A2 and A3 in site A exceeded 1.8 m/s by more than 2% of the measured data, meaning unsuitable for pedestrian sitting for a long time. In site B, all points were unsuitable for sitting for long period of time, and wind velocity at B2 exceeded 3.6 m/s by 7% of measured data, meaning unsuitable also for standing and casual walking. As for site C, a calm wind condition was recorded, and at no point the wind velocity exceeded the lowest threshold.
Wind statistics: 10-min mean WV plot and WV box plots at measured locations and the reference station. (a) Wind velocities at pedestrian and reference level: site A, (b) wind velocities at pedestrian and reference level: site B (c) wind velocities at pedestrian and reference level: site C.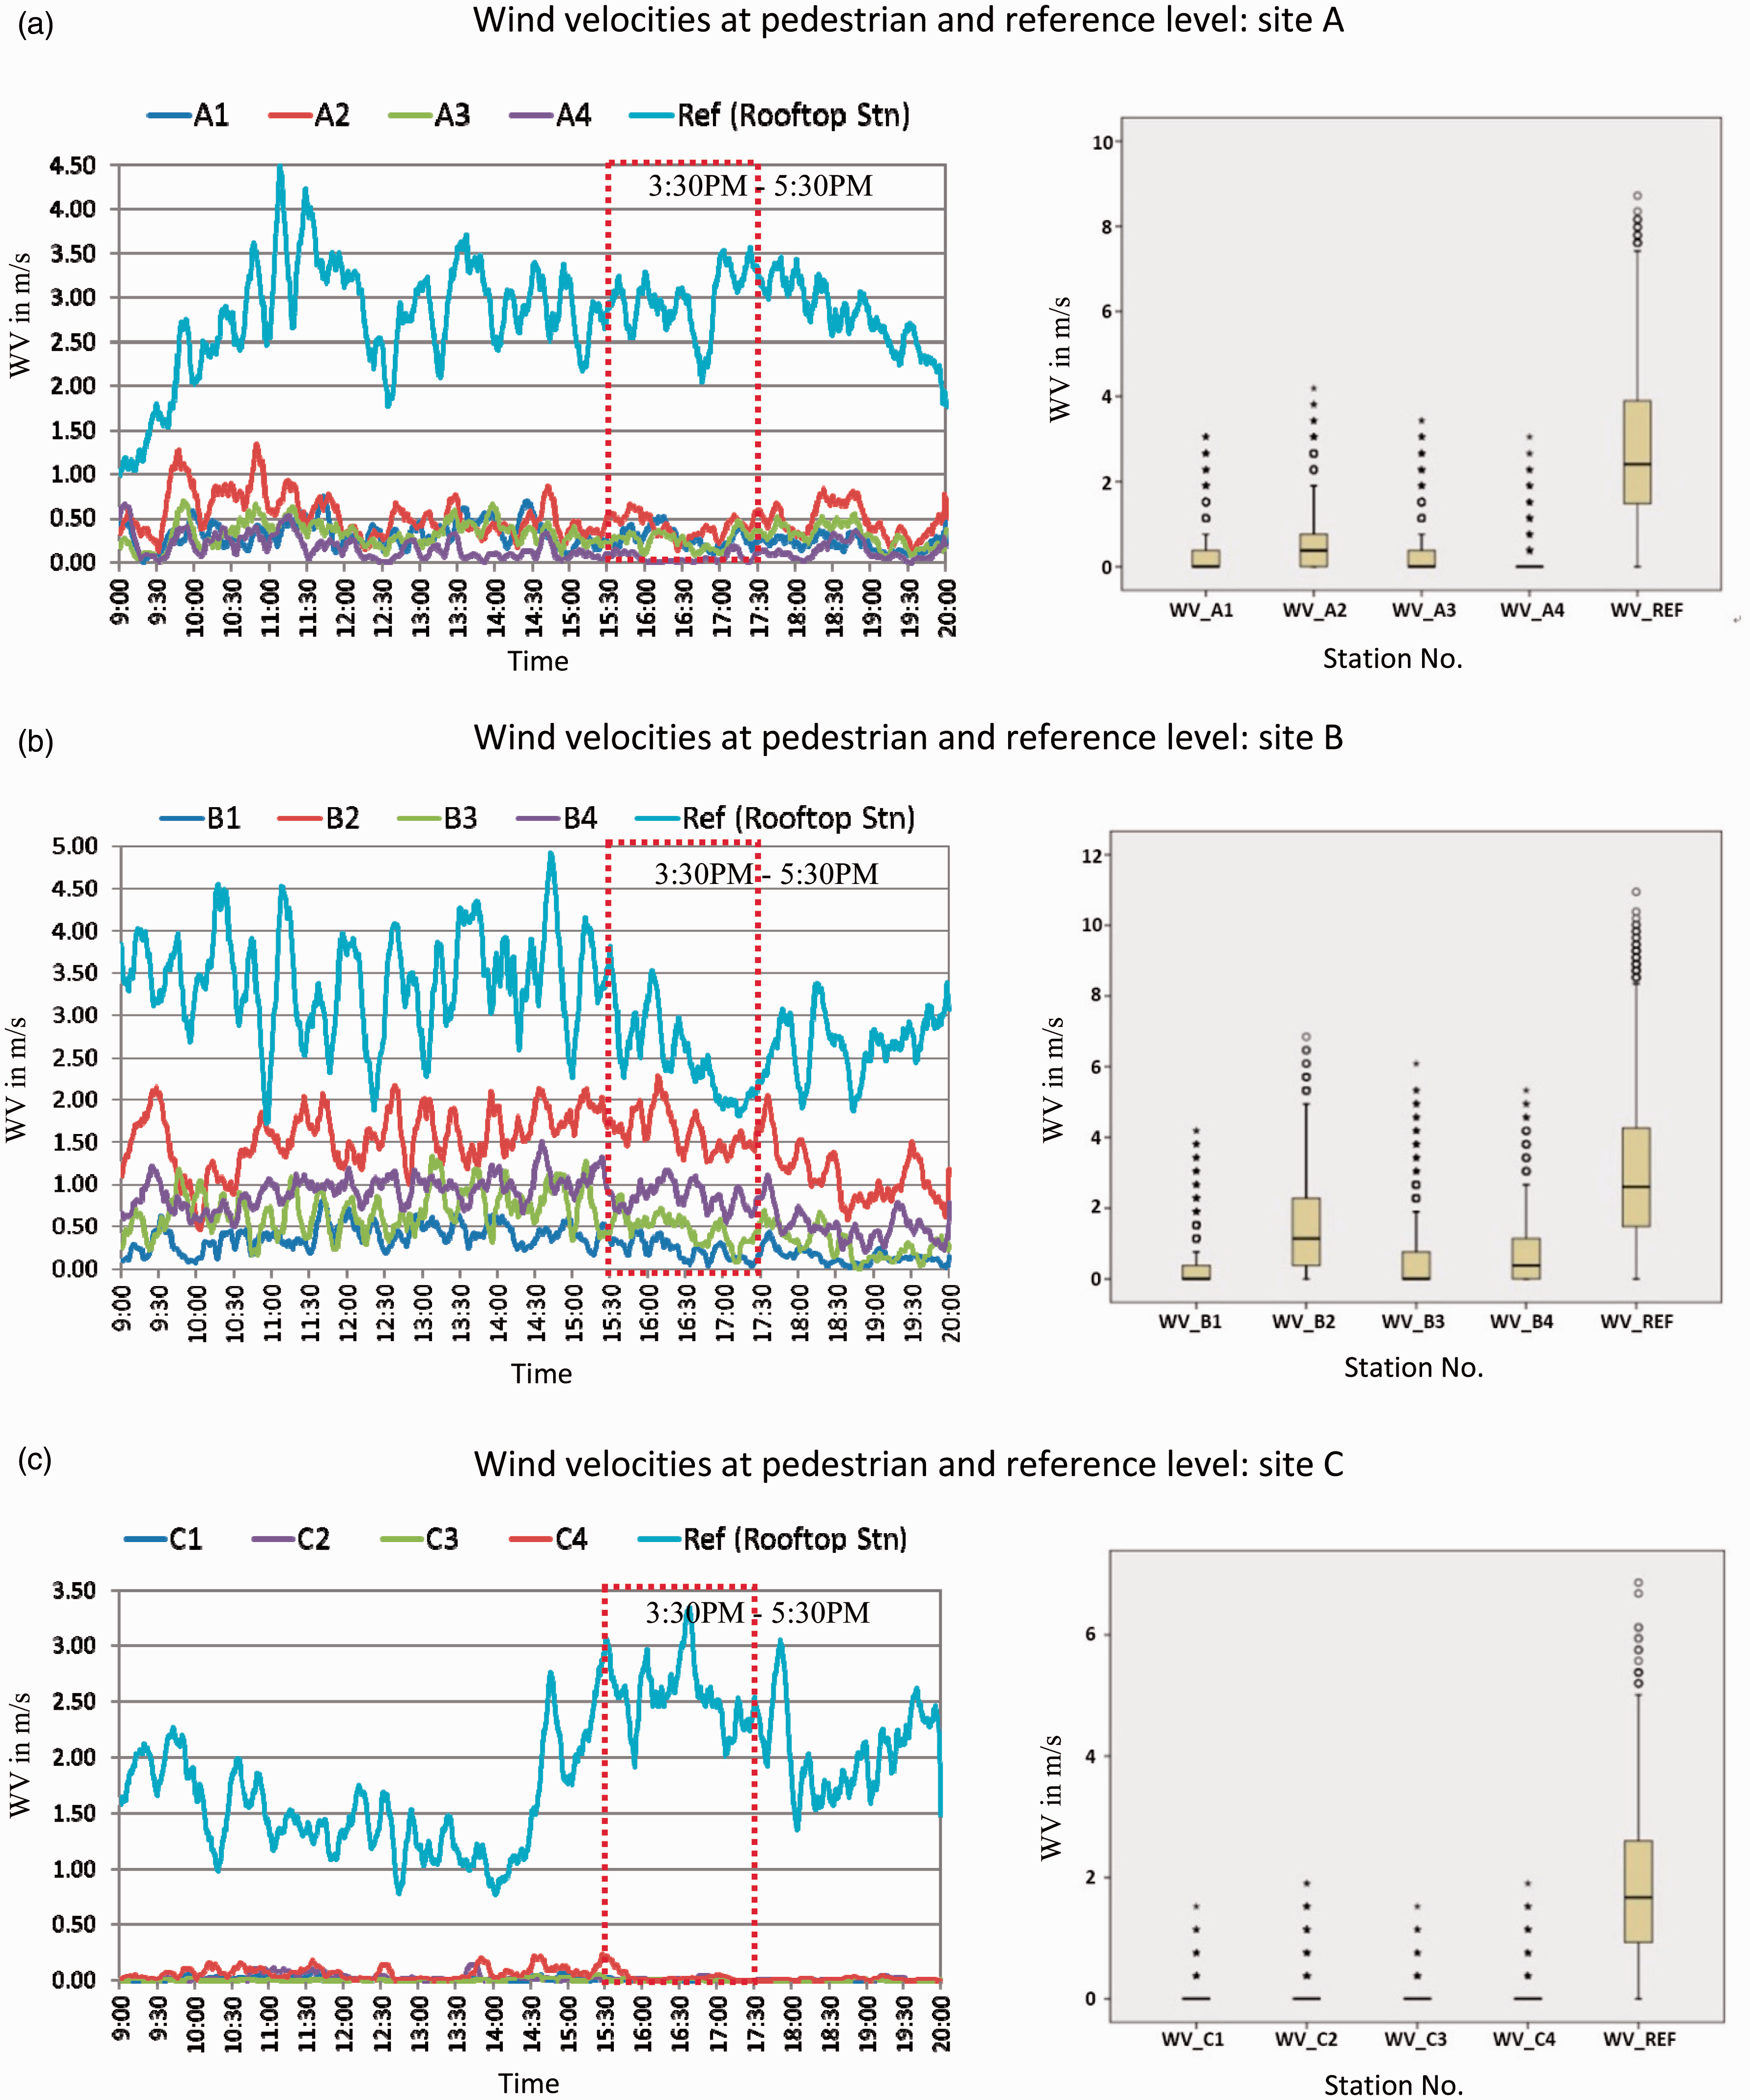
To effectively investigate the effect of urban form parameters on pedestrian-level ventilation using a reference rooftop station, the wind velocity at the reference station should exceed some threshold values, otherwise the coupling between the upper and the lower flow can be lost, and urban materials and thermal effect can determine final wind velocity. 35 The wind velocity threshold depends on ambient wind direction and building geometry, and can be 1.5–4 m/s for various aspect ratios. 36 Strictly speaking, the three sites in the present study cannot be classified as street canyons (i.e. L/W > 20). However, to minimize the effect of thermal buoyancy flow, a reasonably high reference wind velocity range is still preferred. In addition, the three sites should share a common range of reference velocity. Therefore, the measurement period from 3:30 p.m. to 5:30 p.m. was chosen, as during this period, the mean reference wind velocities of three sites were all within 2.5–3 m/s (site A: 2.96 m/s; site B: 2.50 m/s; site C: 2.57 m/s). Therefore, the wind data measured during this period were used to calculate point-mean WVR and site-mean WVR.
The results illustrated that site B which comprised several long-linear high-rise apartment buildings would exhibit the highest WVR, while the site C which is comprised linear mid-rise ‘worker village’ buildings would have the lowest mean WVR, demonstrating a strong wind sheltering effect (Figure 4). A low BCR should lead to high pedestrian WVR, but site A showed lower WVR than site B. This should be mainly due to the dense vegetation coverage at site A, which provides effective wind shelter for outdoor activity areas.
Wind velocity ratio (WVR) and building coverage ratio (BCR): site mean comparison.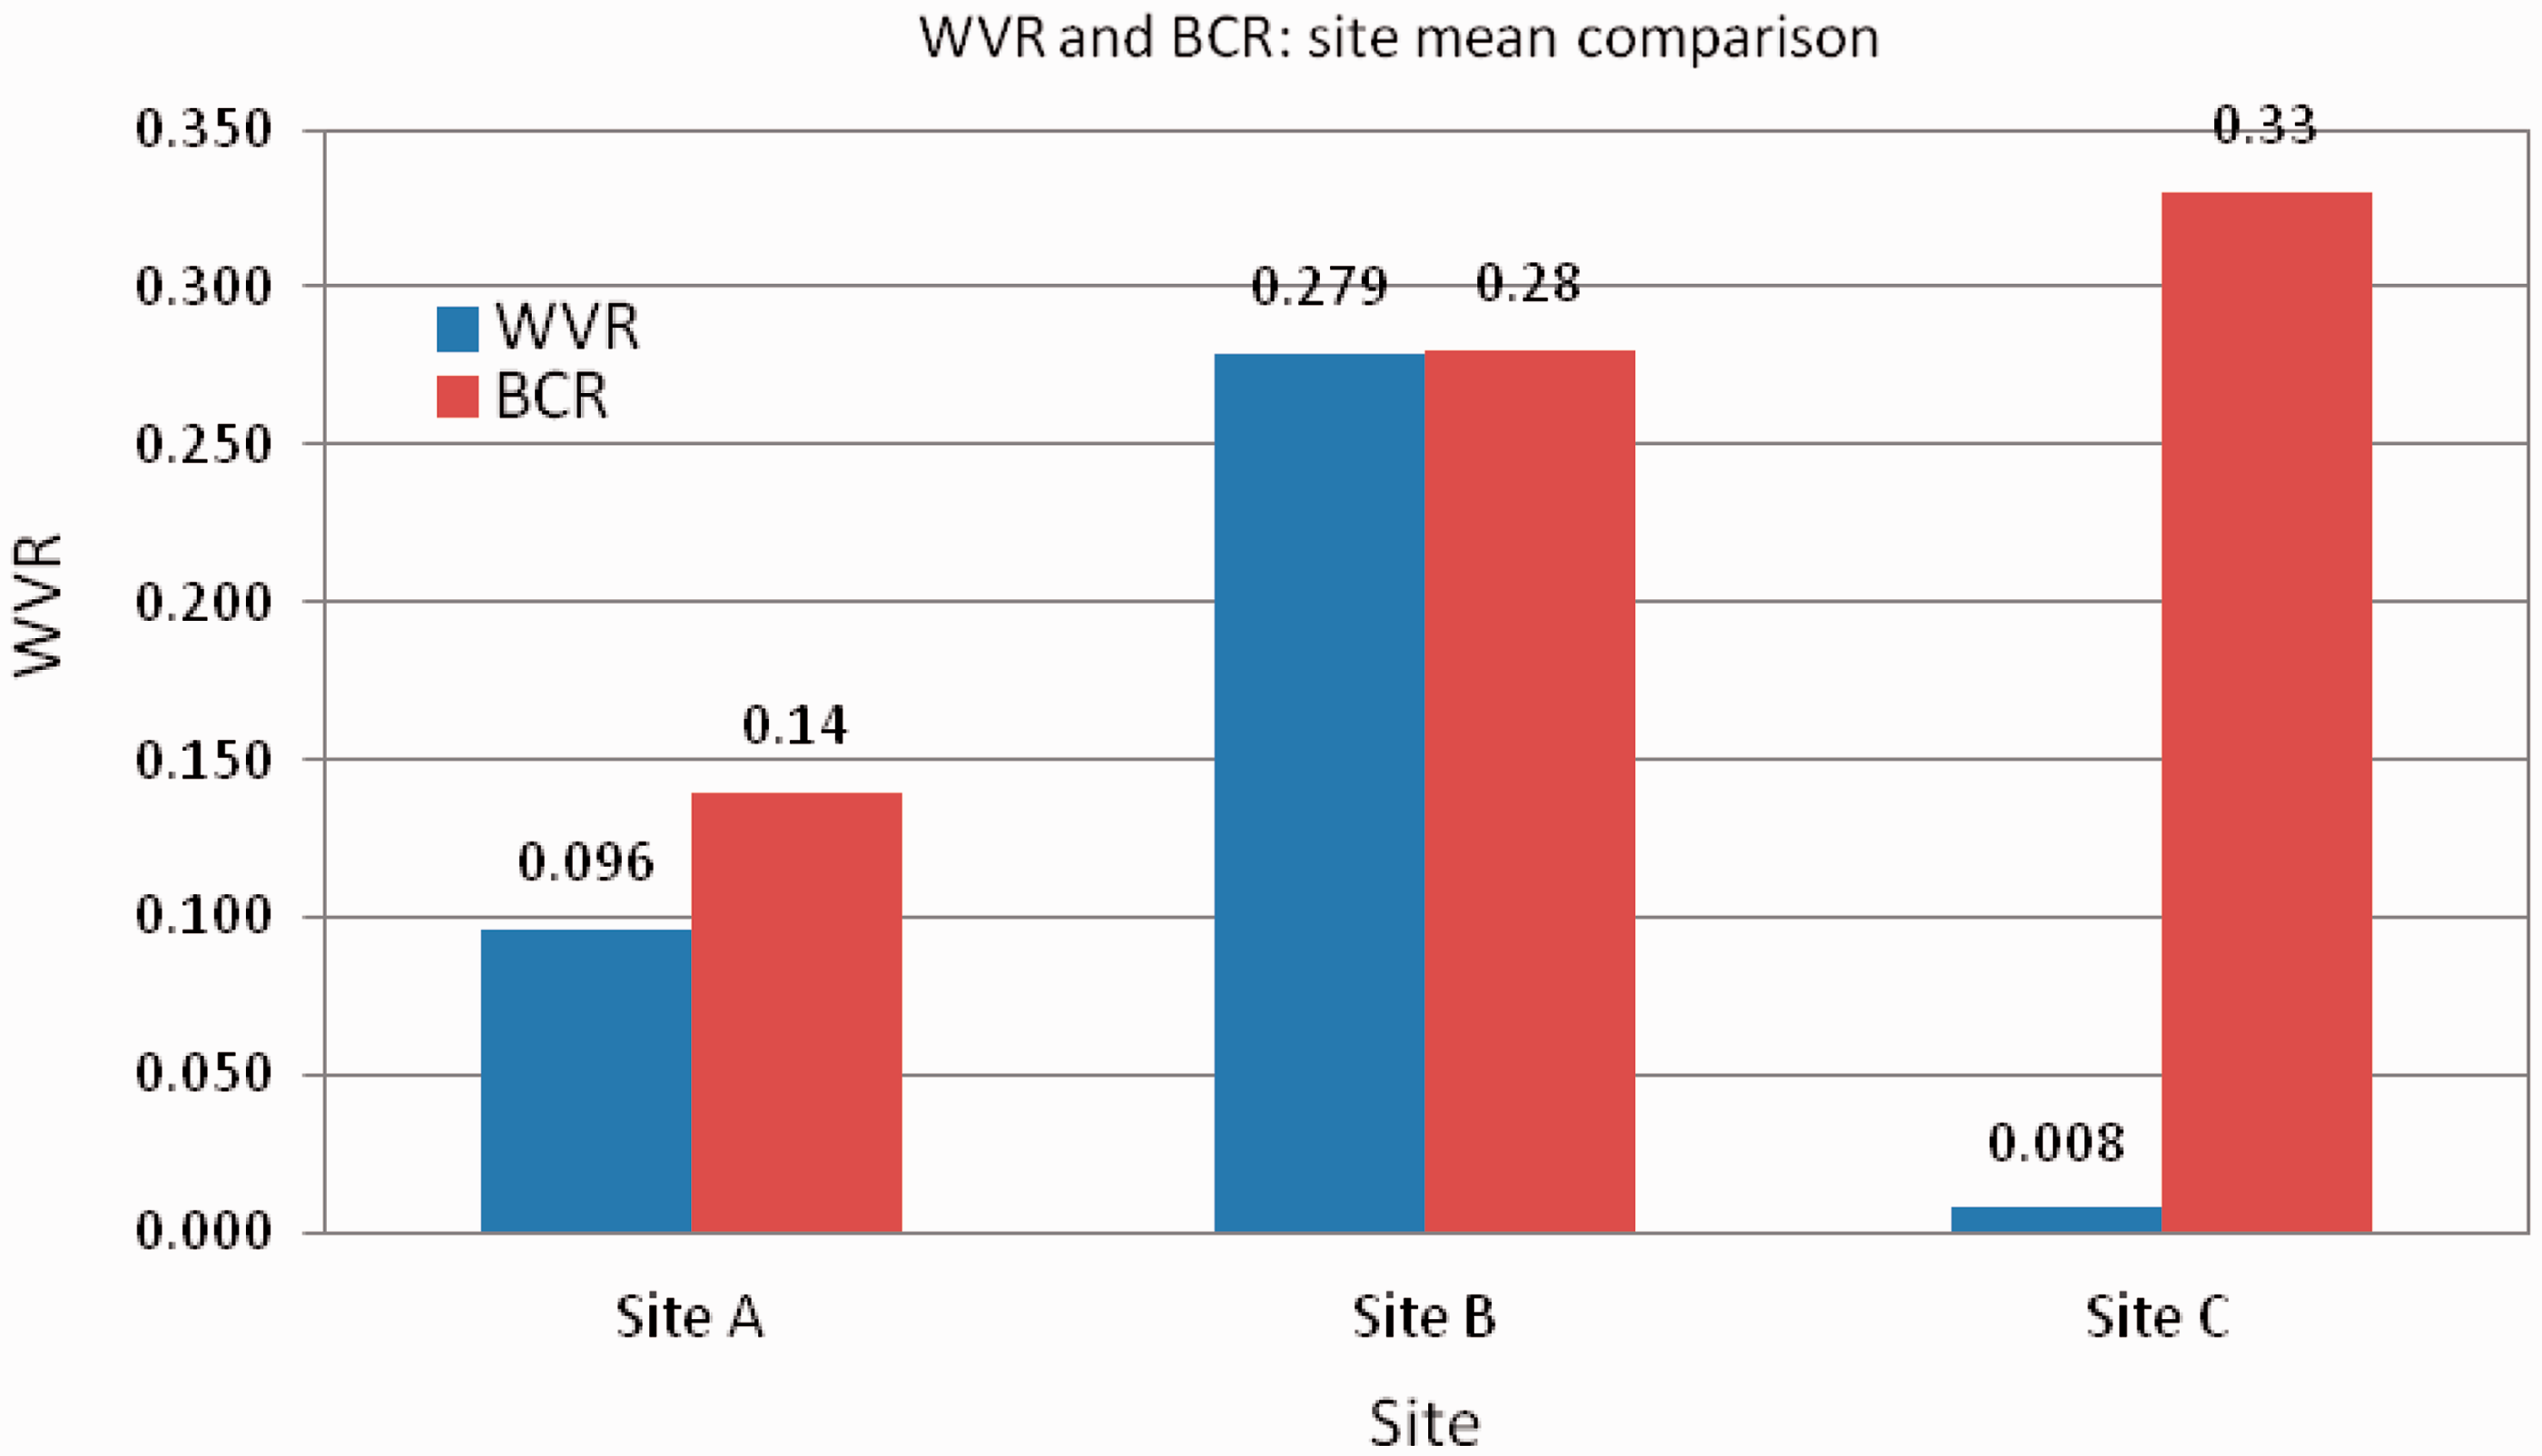
Point-wise, the points that are located in the road intersection, small plaza and free from tree canopy shading would be best ventilated, as indicated by higher WVRs, e.g. A2 (0.17 m/s) and B2 (0.66 m/s); whereas the points surrounded and covered by dense trees or shrubs appeared to be best sheltered from winter wind, e.g. A4 (0.05 m/s) and B1 (0.09 m/s).
A cross-season wind velocity comparison between two outdoor spaces at site B reveals the impact of housing form and configuration on street ventilation (Figure 5). B1 is a paved playground area for resident exercise, the apartment building sites are situated to its northern side, and an open road to its southern side. B2 is a small elevated plaza at a road junction area, in between three tall apartment buildings. The data show that, in summer, B1 would record higher wind velocity than B2, since it is more open towards the prevailing southeastern wind direction, while in winter it is better protected from cold winds, due to the shelter provided by its northern tall building, whereas B2 is located just on a winter wind corridor formed by the surrounding tall buildings, under the prevailing northwestern wind direction.
A comparison of summer and winter WV at two points in site B.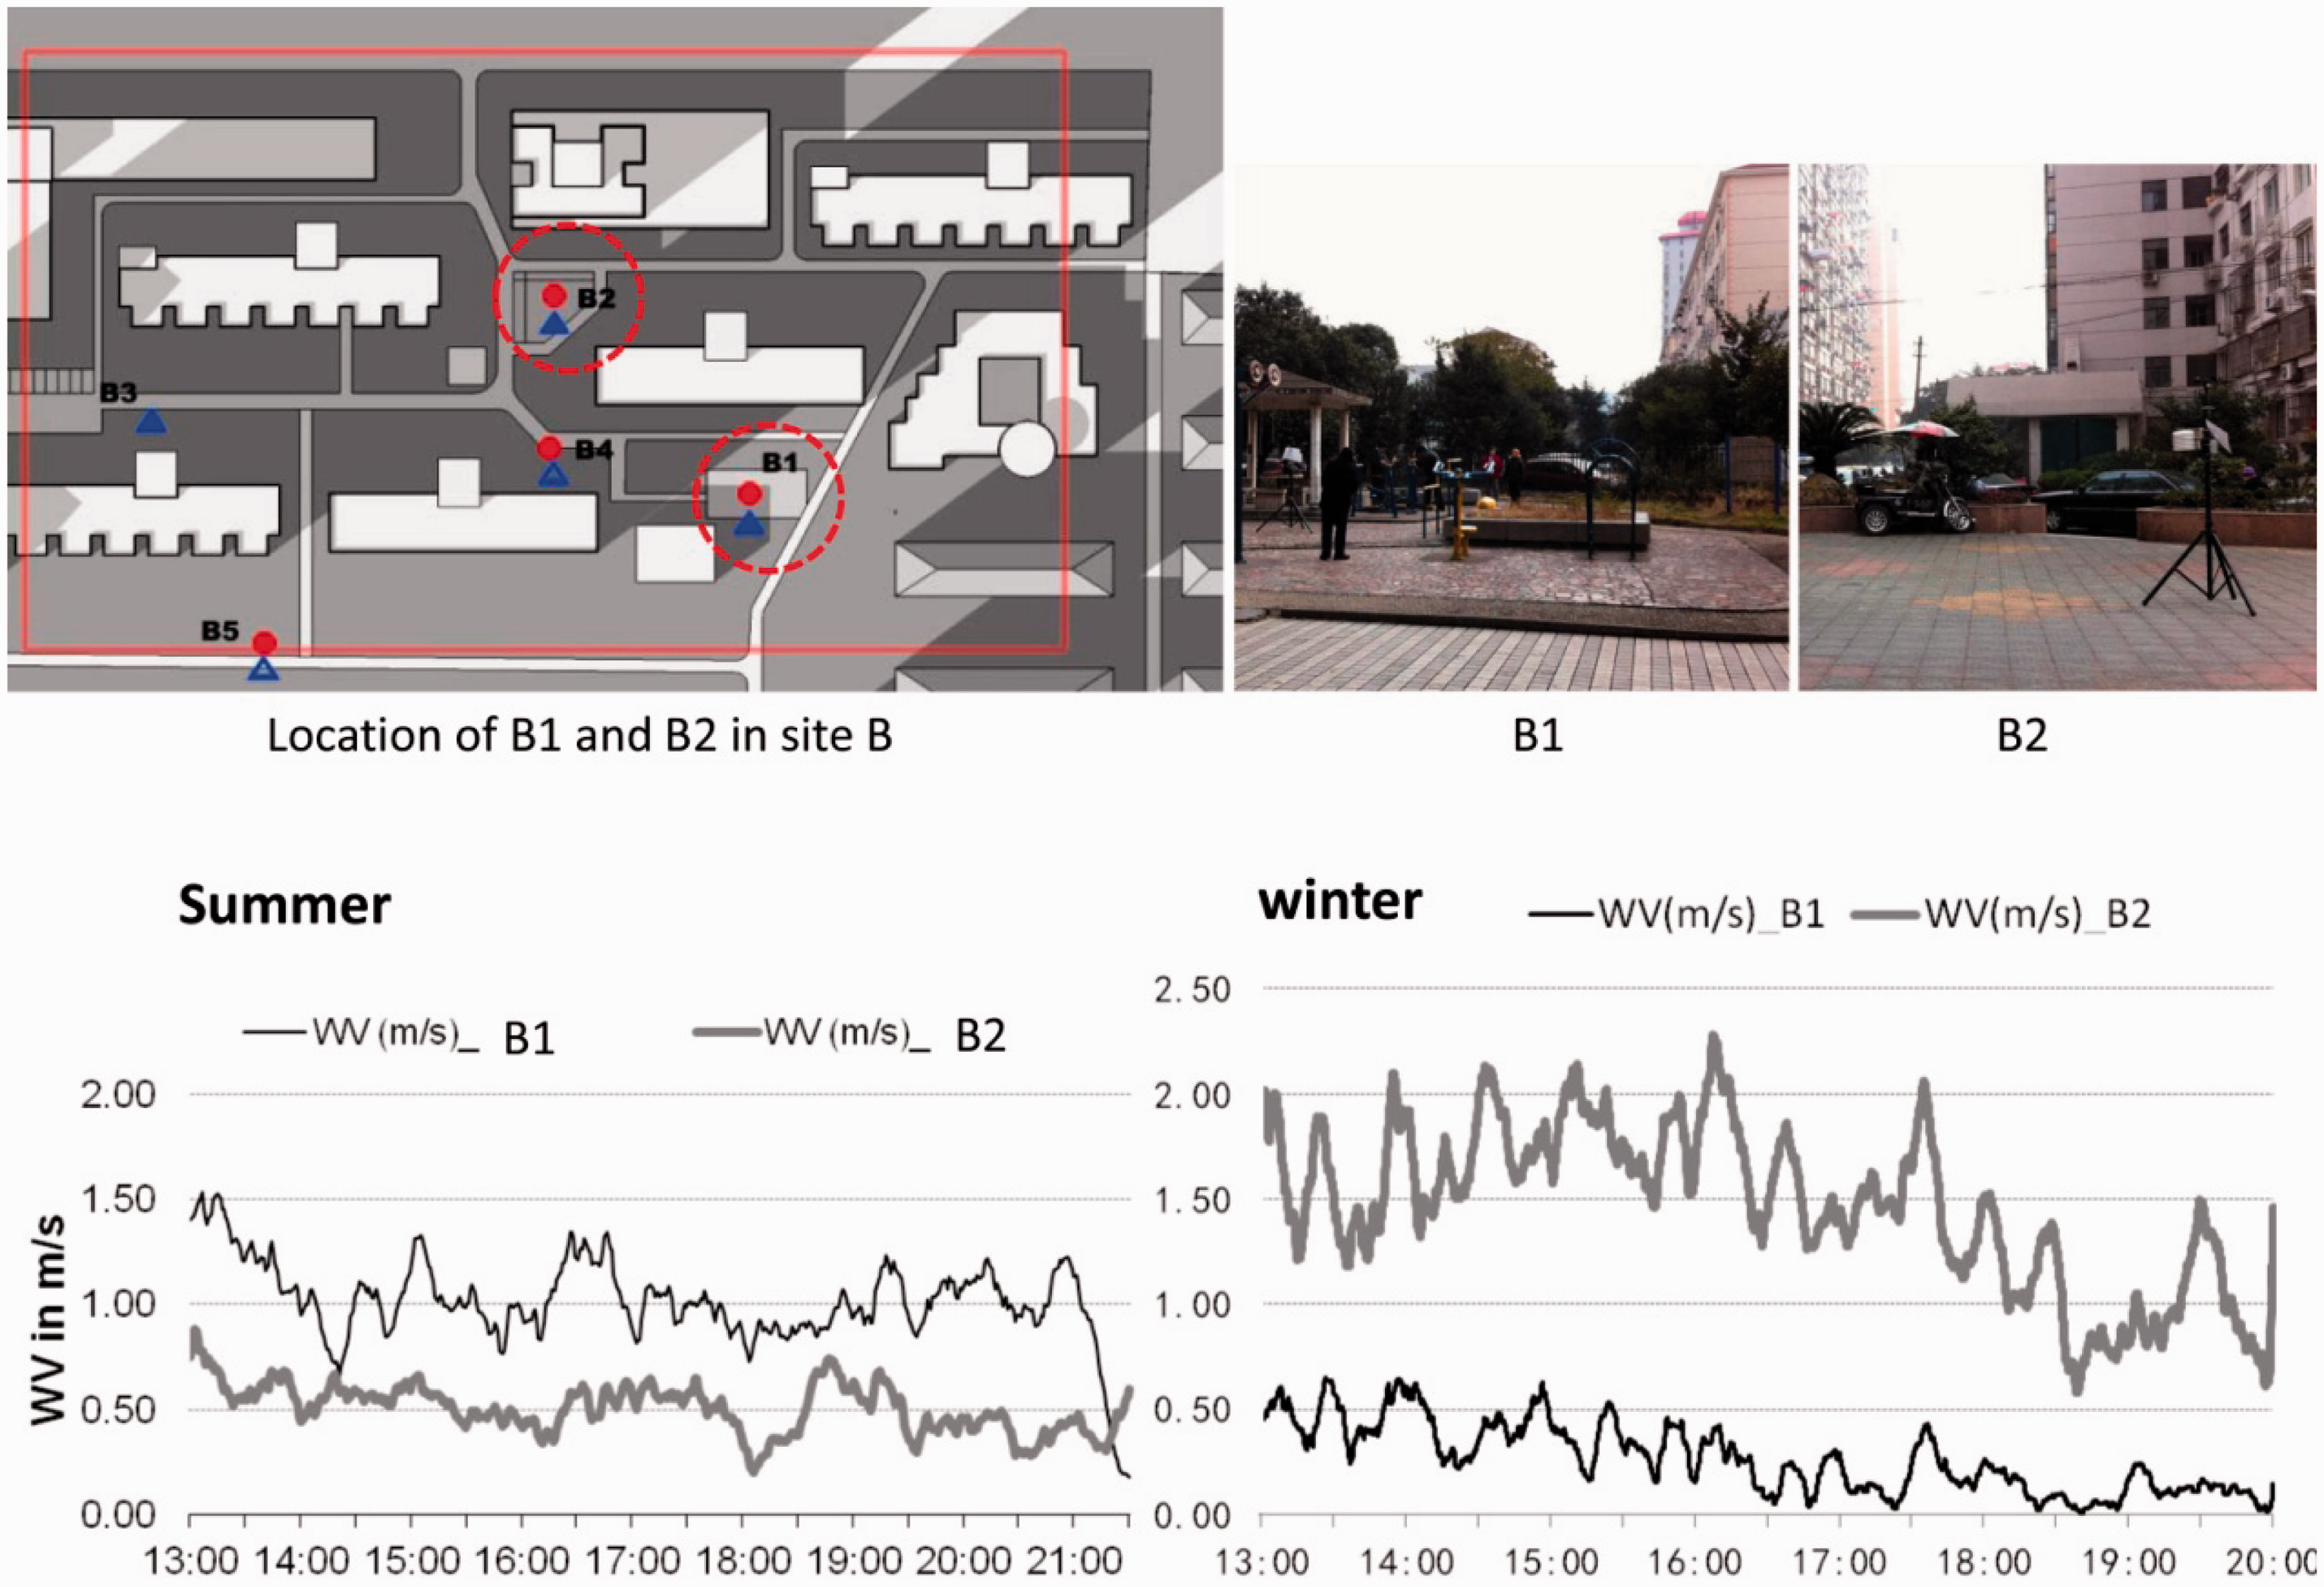

Coefficients of model.
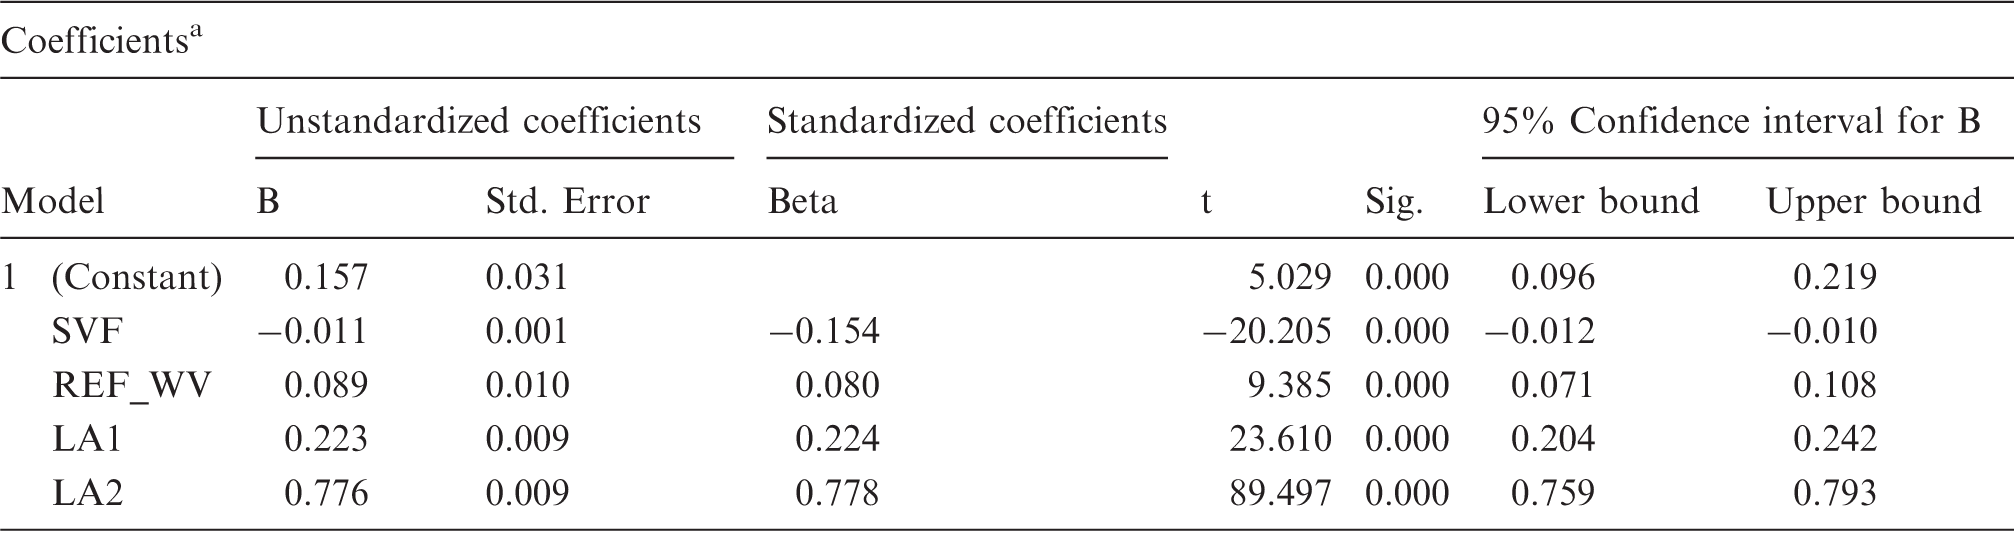
Dependent Variable: WV.
From equation (1), the reference wind velocity is positively related to the pedestrian wind velocity, and the housing form has a strong impact: the pedestrian wind velocity in an interspersed housing form would be averagely 0.22 m/s higher than a low-rise linear housing form, and a high-rise linear housing form would be 0.78 m/s higher than a low-rise one. From the comparison among individual points, the degree of enclosure would have an impact on ventilation rate, but correlation analysis between WVR and SVF would support a negative coefficient. The significant positive correlation of SVF with WVR derived from our summer measurement had indicated that, in hot and calm summer days, thermal-induced air movement can be a major contribution to ventilation. As such, SVF also indicates the degree of short-wave radiation heating, and thus the degree of buoyancy driven airflow rate. 12 In winter days, however, solar radiation is low and thermal buoyancy effect is week, wind pressure can be the major driving force. Due to the Venturi effect, The air flow speed at pedestrian level would be increased when section area of the air path is reduced. This is why wind velocity amplification is often found around gaps between tall buildings. This could explain the different effect of SVF on summer and winter WVR. The explanatory power of the model is just more than a half (52%). Clearly, more empirical data and numerical study are needed before any solid conclusion can be made.
Questionnaire survey
From Figure 6, all measured points in site A have largely acceptable wind environment. The worst case is A3, where 26% of the respondents voted unacceptable wind environment (2 and 3). This is because A3 is located at the northwestern corner of the estate and is highly exposed to the prevailing wind. There is one respondent voted for clearly unacceptable (3) at A2 (4%) and A3 (3%). The vote at A2 was given by a 79-years-old male resident that is physically not very well. He also voted very cold (3) for thermal perception and uncomfortable (2) for thermal comfort. A5 had a 100% of just acceptable votes, probably due to the small sample size (4). As for thermal comfort votes, more than a half (53%) of the respondents at A3 voted slightly uncomfortable (1) or worse; and about one-fourth of the respondents at A2 and A4 voted uncomfortable (2). A2 to A4 are all lack of shelter from the northwesterly winds, whereas A1 and A5 are better sheltered and thus more comfortable.
(a) Wind perception and (b) thermal comfort votes in site A.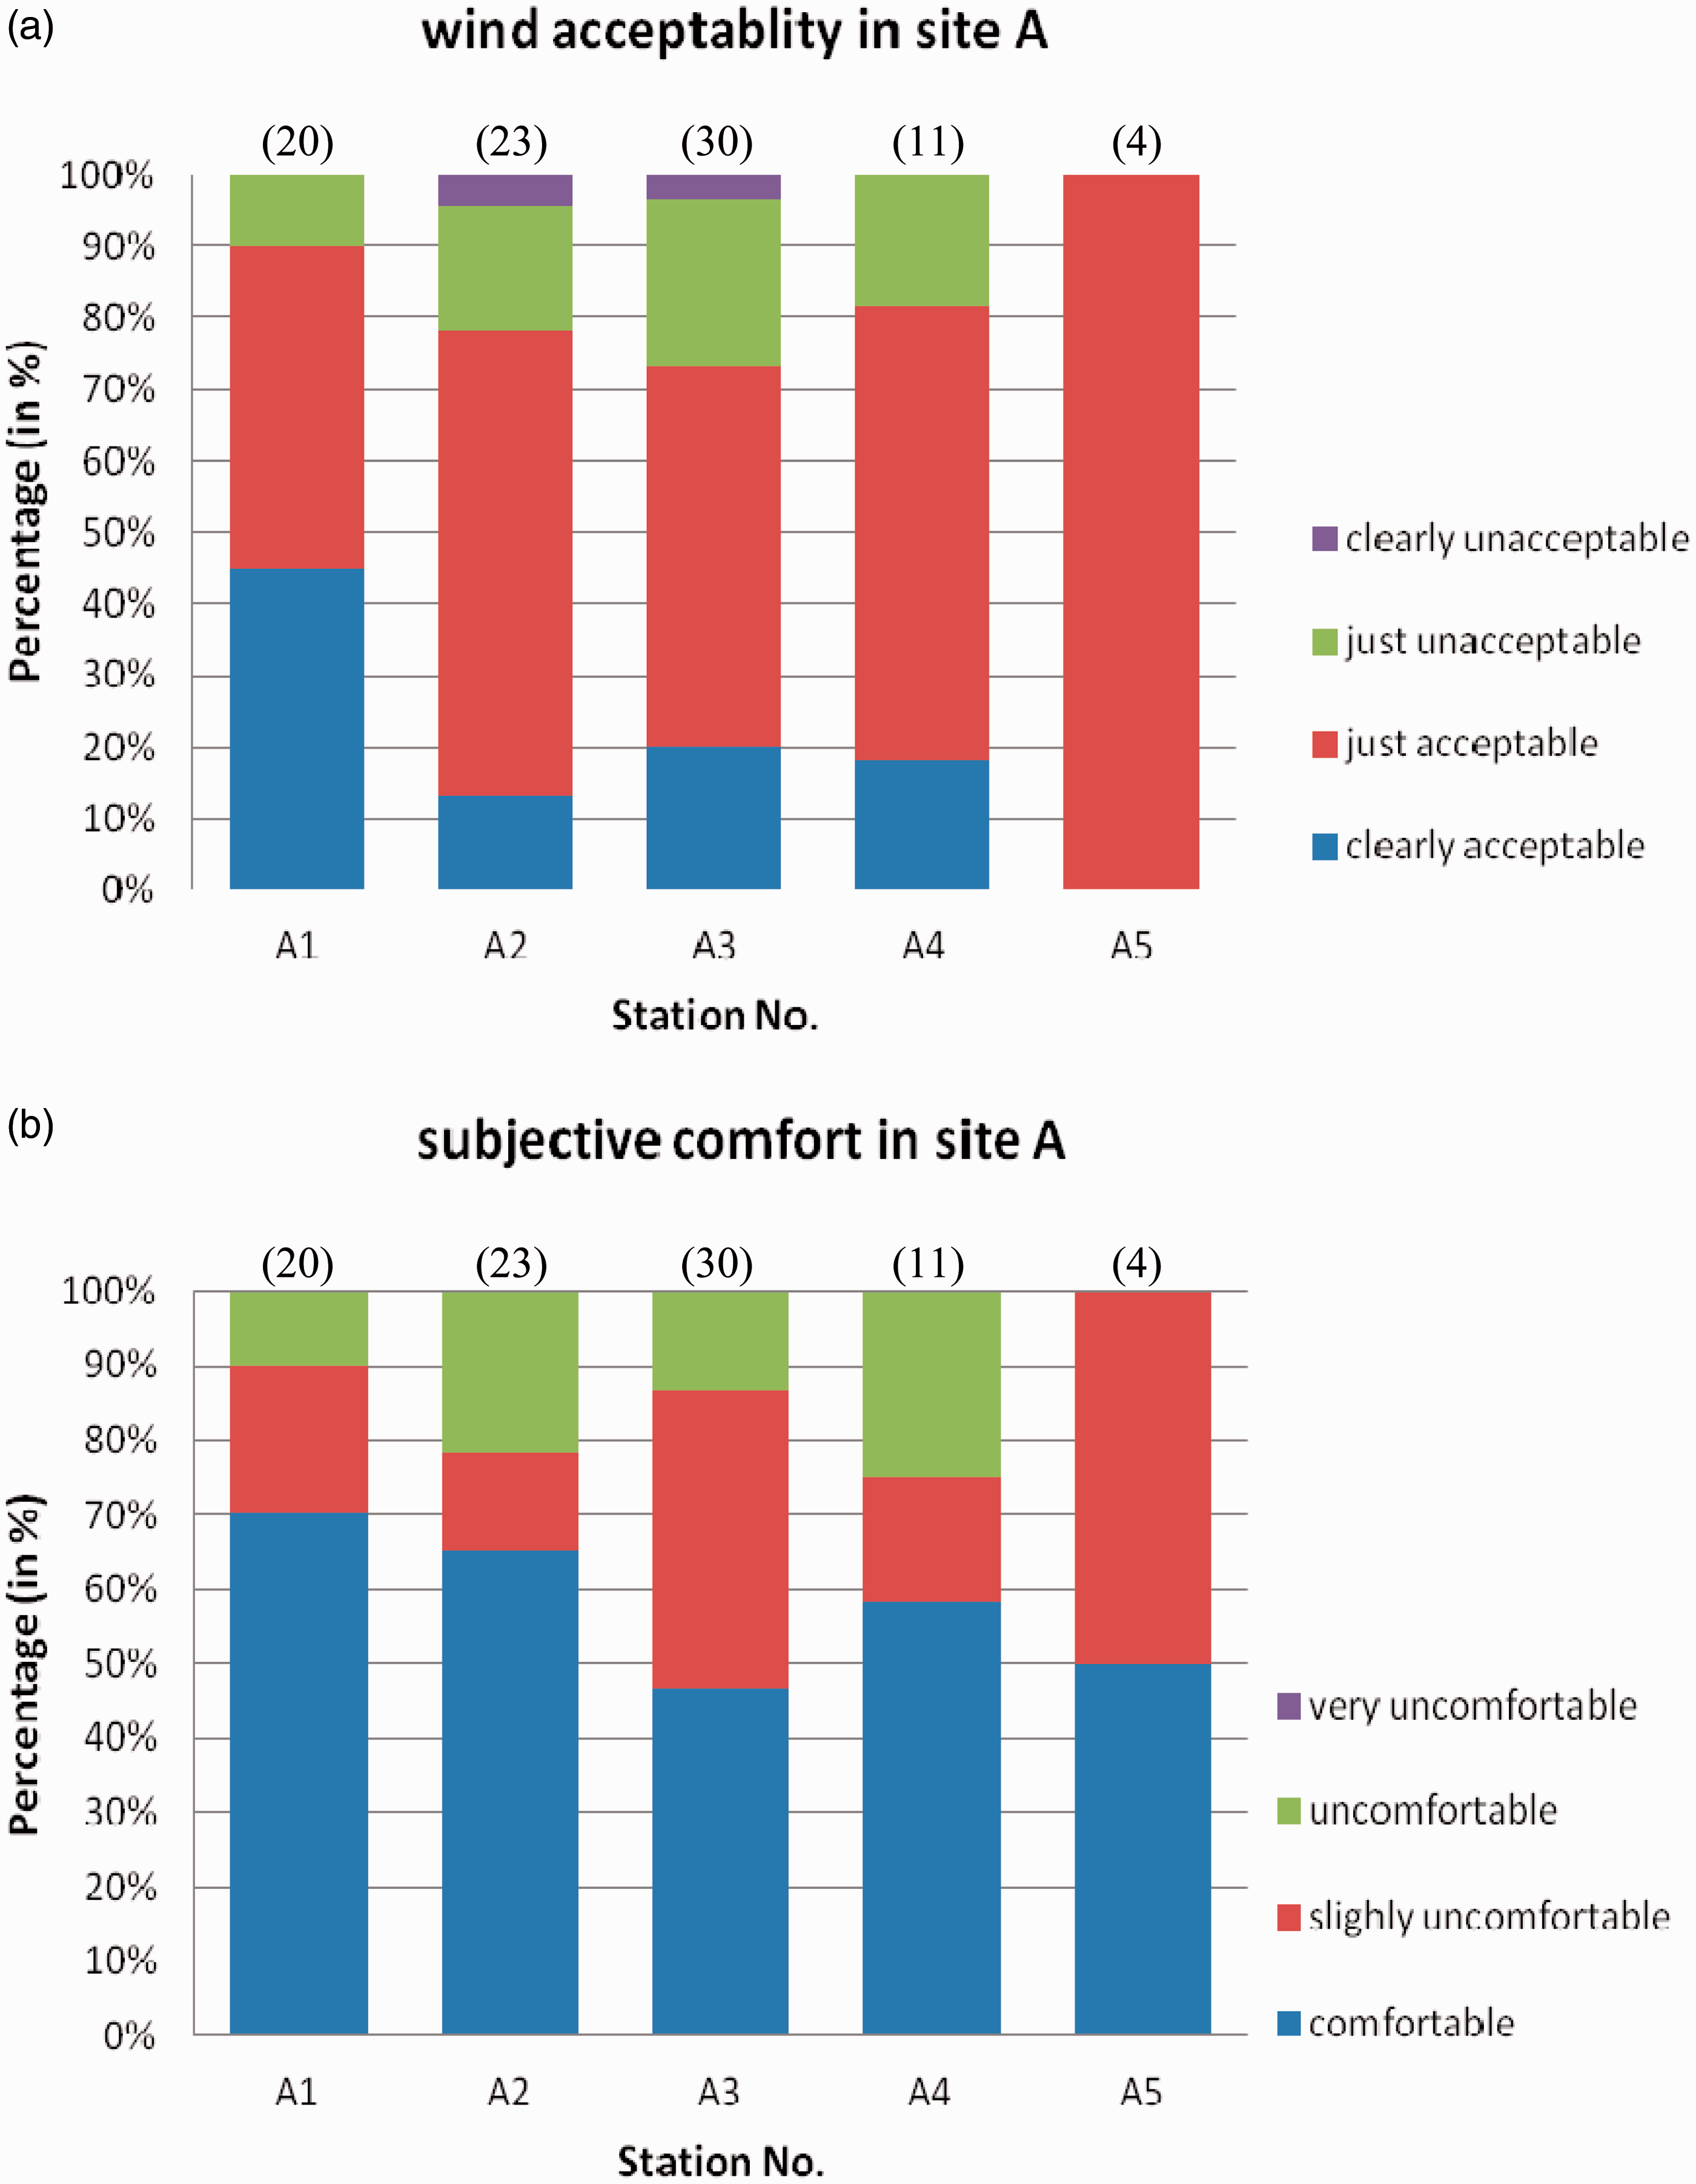
The wind and comfort perception seems more diverse at site B (Figure 7), regarding wind acceptability, less than 5% at B1 and B5 chose unacceptable (2 and 3), while nearly a half of respondents at B4 chose unacceptable. Higher wind velocity was measured at B2 than B4 (Figure 3), but it is considered more acceptable at B4 than B2 with less than 30% voted unacceptable wind environment. The sensor location could be an influential factor. B4 is located to the southeast of B2, on a major road of the housing estate. The interview was carried out on the road, but the wind sensor had to be placed on the adjacent green patch to make way for vehicle traffic. The surrounding shrubs and small trees could have reduced the measured wind velocity. Concerning thermal comfort, B4 is considered uncomfortable or worse, voted 2 and 3 by more than 30% of the respondents, followed by B2 (nearly 10%). B2 and B4 are aligned with a NW-SE-oriented wind corridor, whereas B1 and B5 are well sheltered by tall buildings to their northern side.
(a) Wind perception and (b) thermal comfort votes in site B.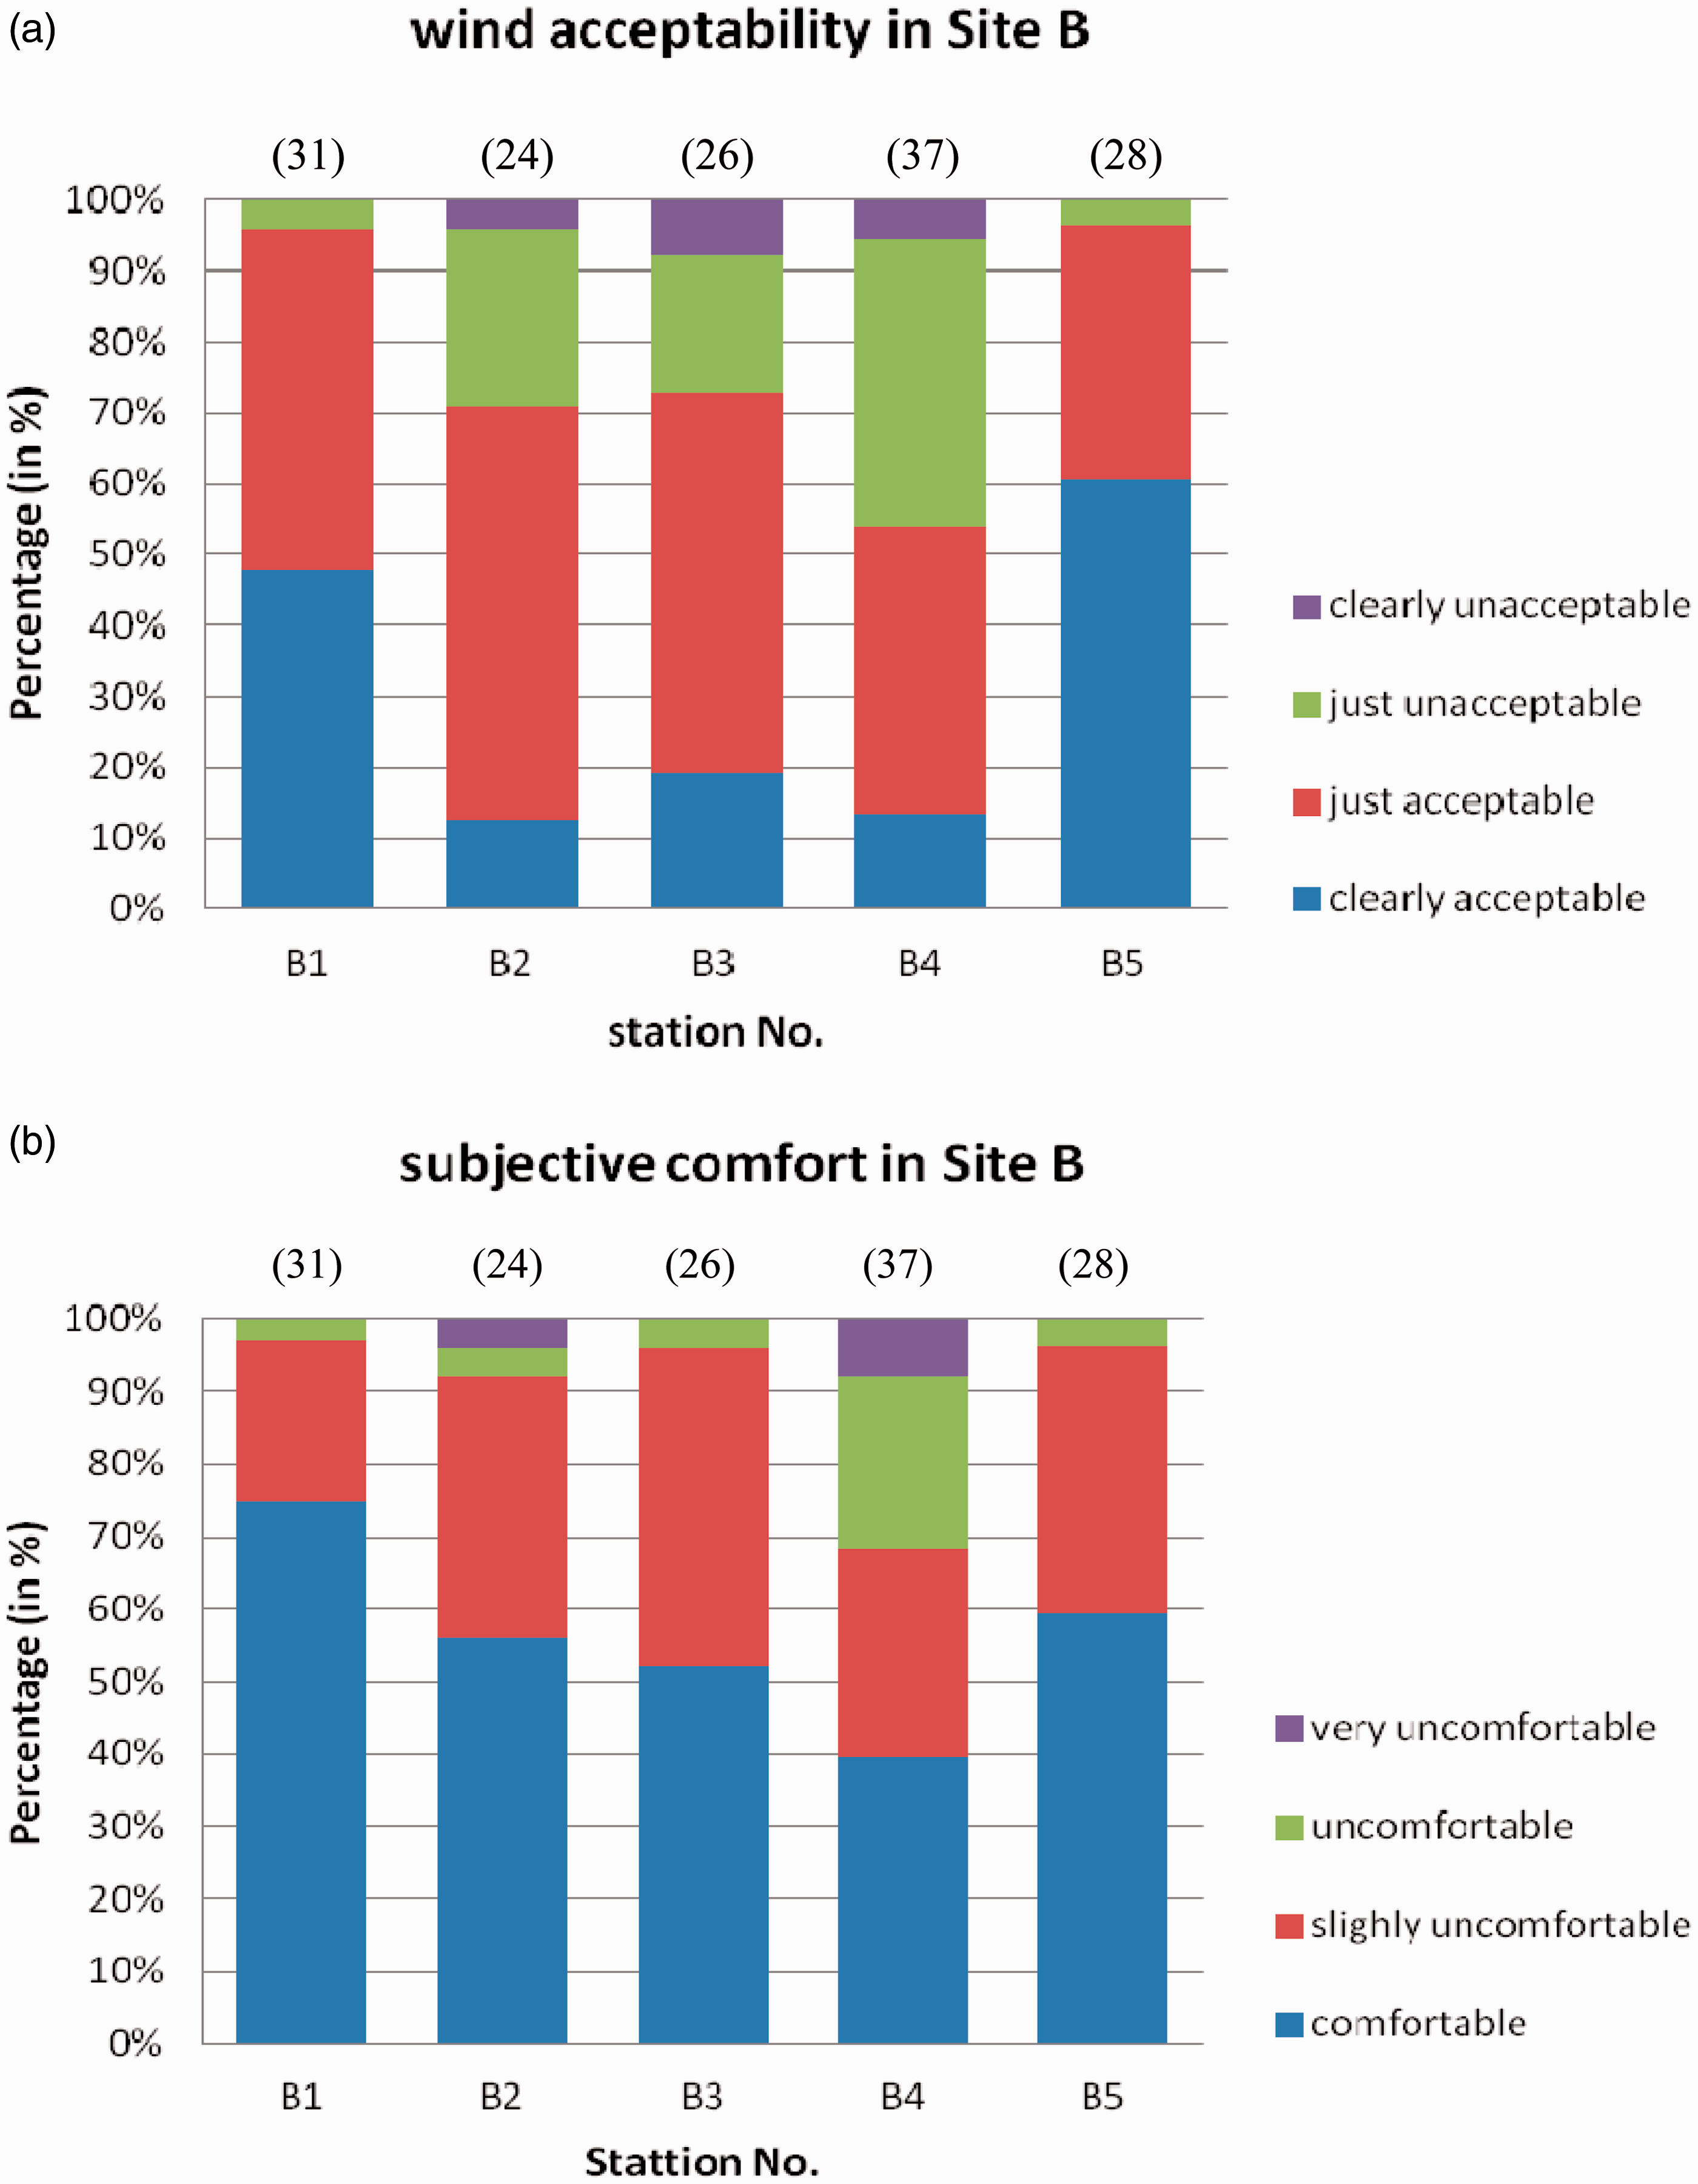
As shown in Figure 8, two respondents (50%) from C3 considered the wind environment just unacceptable (2), and the same two people considered the thermal environment uncomfortable or worse (2 and 3). The number of valid responded questionnaires from site C is significantly smaller than that of sites A and B. Considering the small sample size, the deviation at C3 should therefore be treated with caution. Besides at C3, other points were considered acceptable (0 and 1) in terms of wind, and comfortable and only slightly uncomfortable with respect to thermal comfort. This is in accordance with the measured wind data (Figure 3).
(a) Wind perception and (b) comfort votes in site C.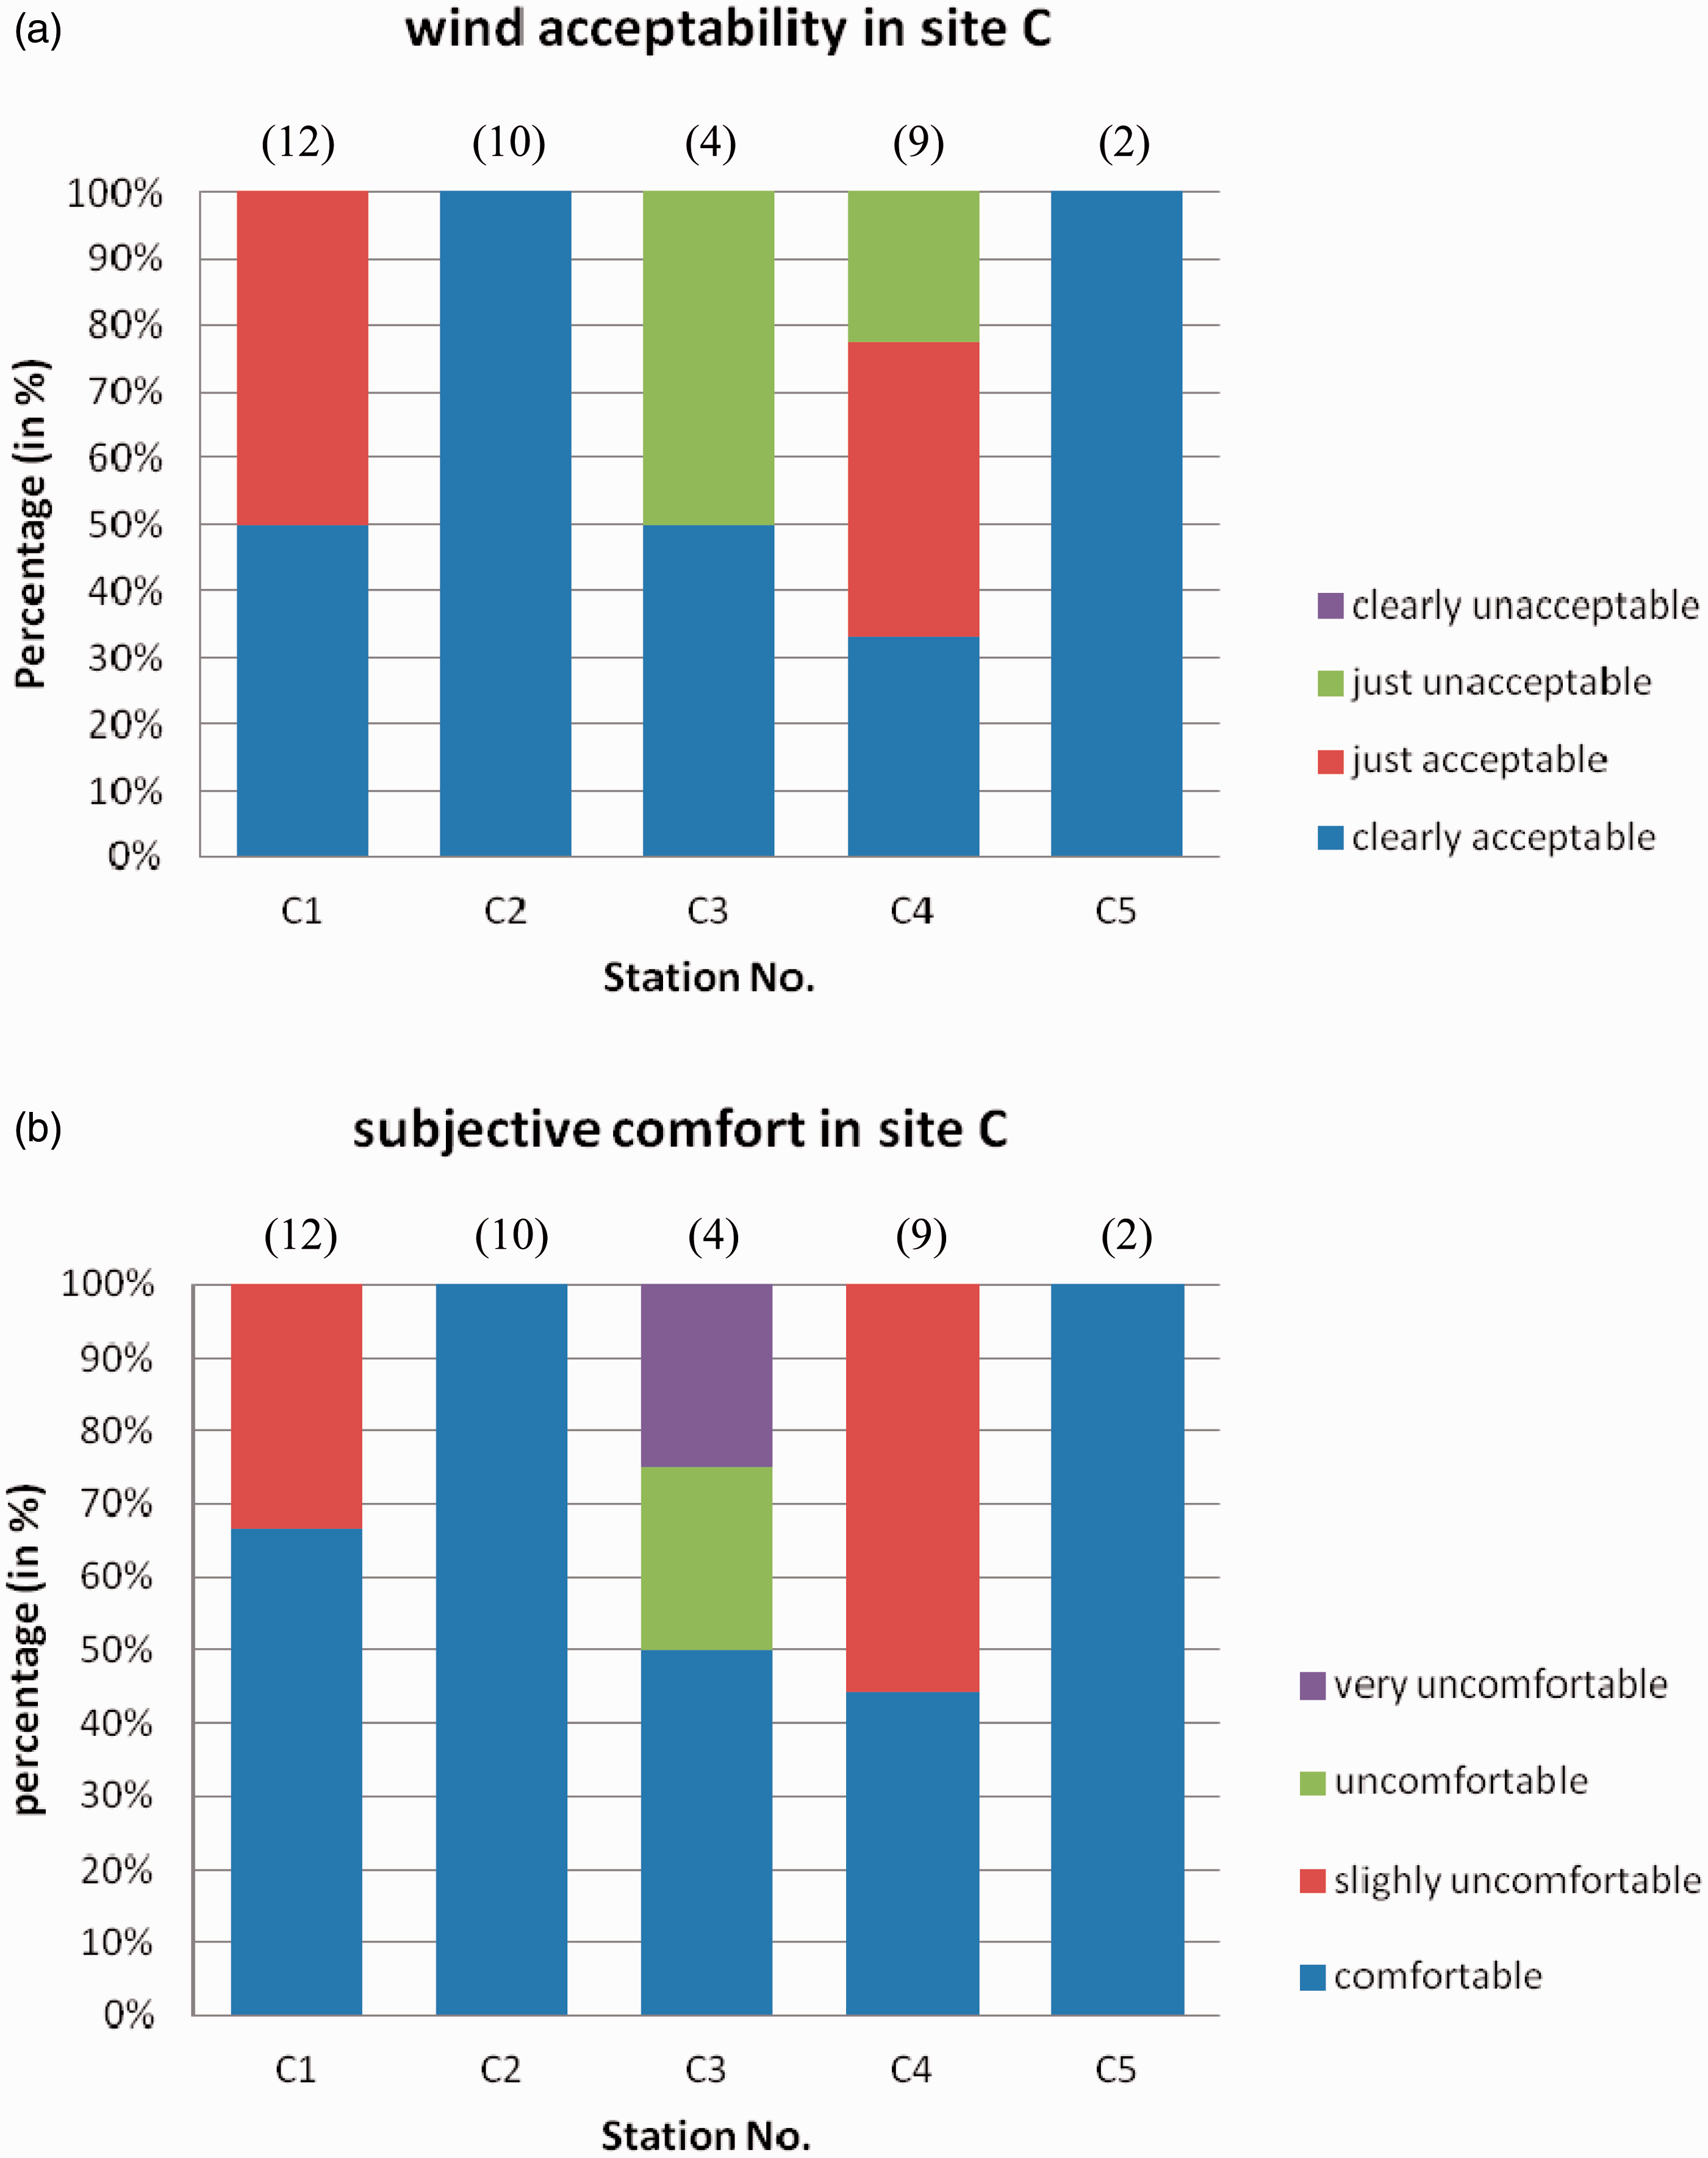
As shown in Figure 9, the relationship between mean wind velocity at each point and the percentage of respondents at the point that voted clearly acceptable (0) and acceptable (0 and 1) about the wind environment (Figure 9(a) and (b)) and voted comfortable (0) about thermal comfort (Figure 9(c)). The mean wind velocity is significantly and negatively correlated with the wind perception and comfort perception. Therefore, explaining the variation in wind perception was more acceptable than in thermal comfort as indicated by the R-square values. The correlations are significant, but not sufficient to explain the majority of variations. This makes sense as thermal comfort is affected by other variables such as air temperature and solar radiation, etc. The reason for the low R-square for wind acceptability can be that the respondents based their judgments on a short-term wind velocity experience (past 15 min), but wind velocity was highly variable and the variation is not reflected in the mean wind velocity. Also, the small sample size may affect the linear-fit outcome. More datasets would need to be collected in future work to test this preliminary result.
Correlation of mean WV with (a,b) wind perception and (c) comfort evaluation.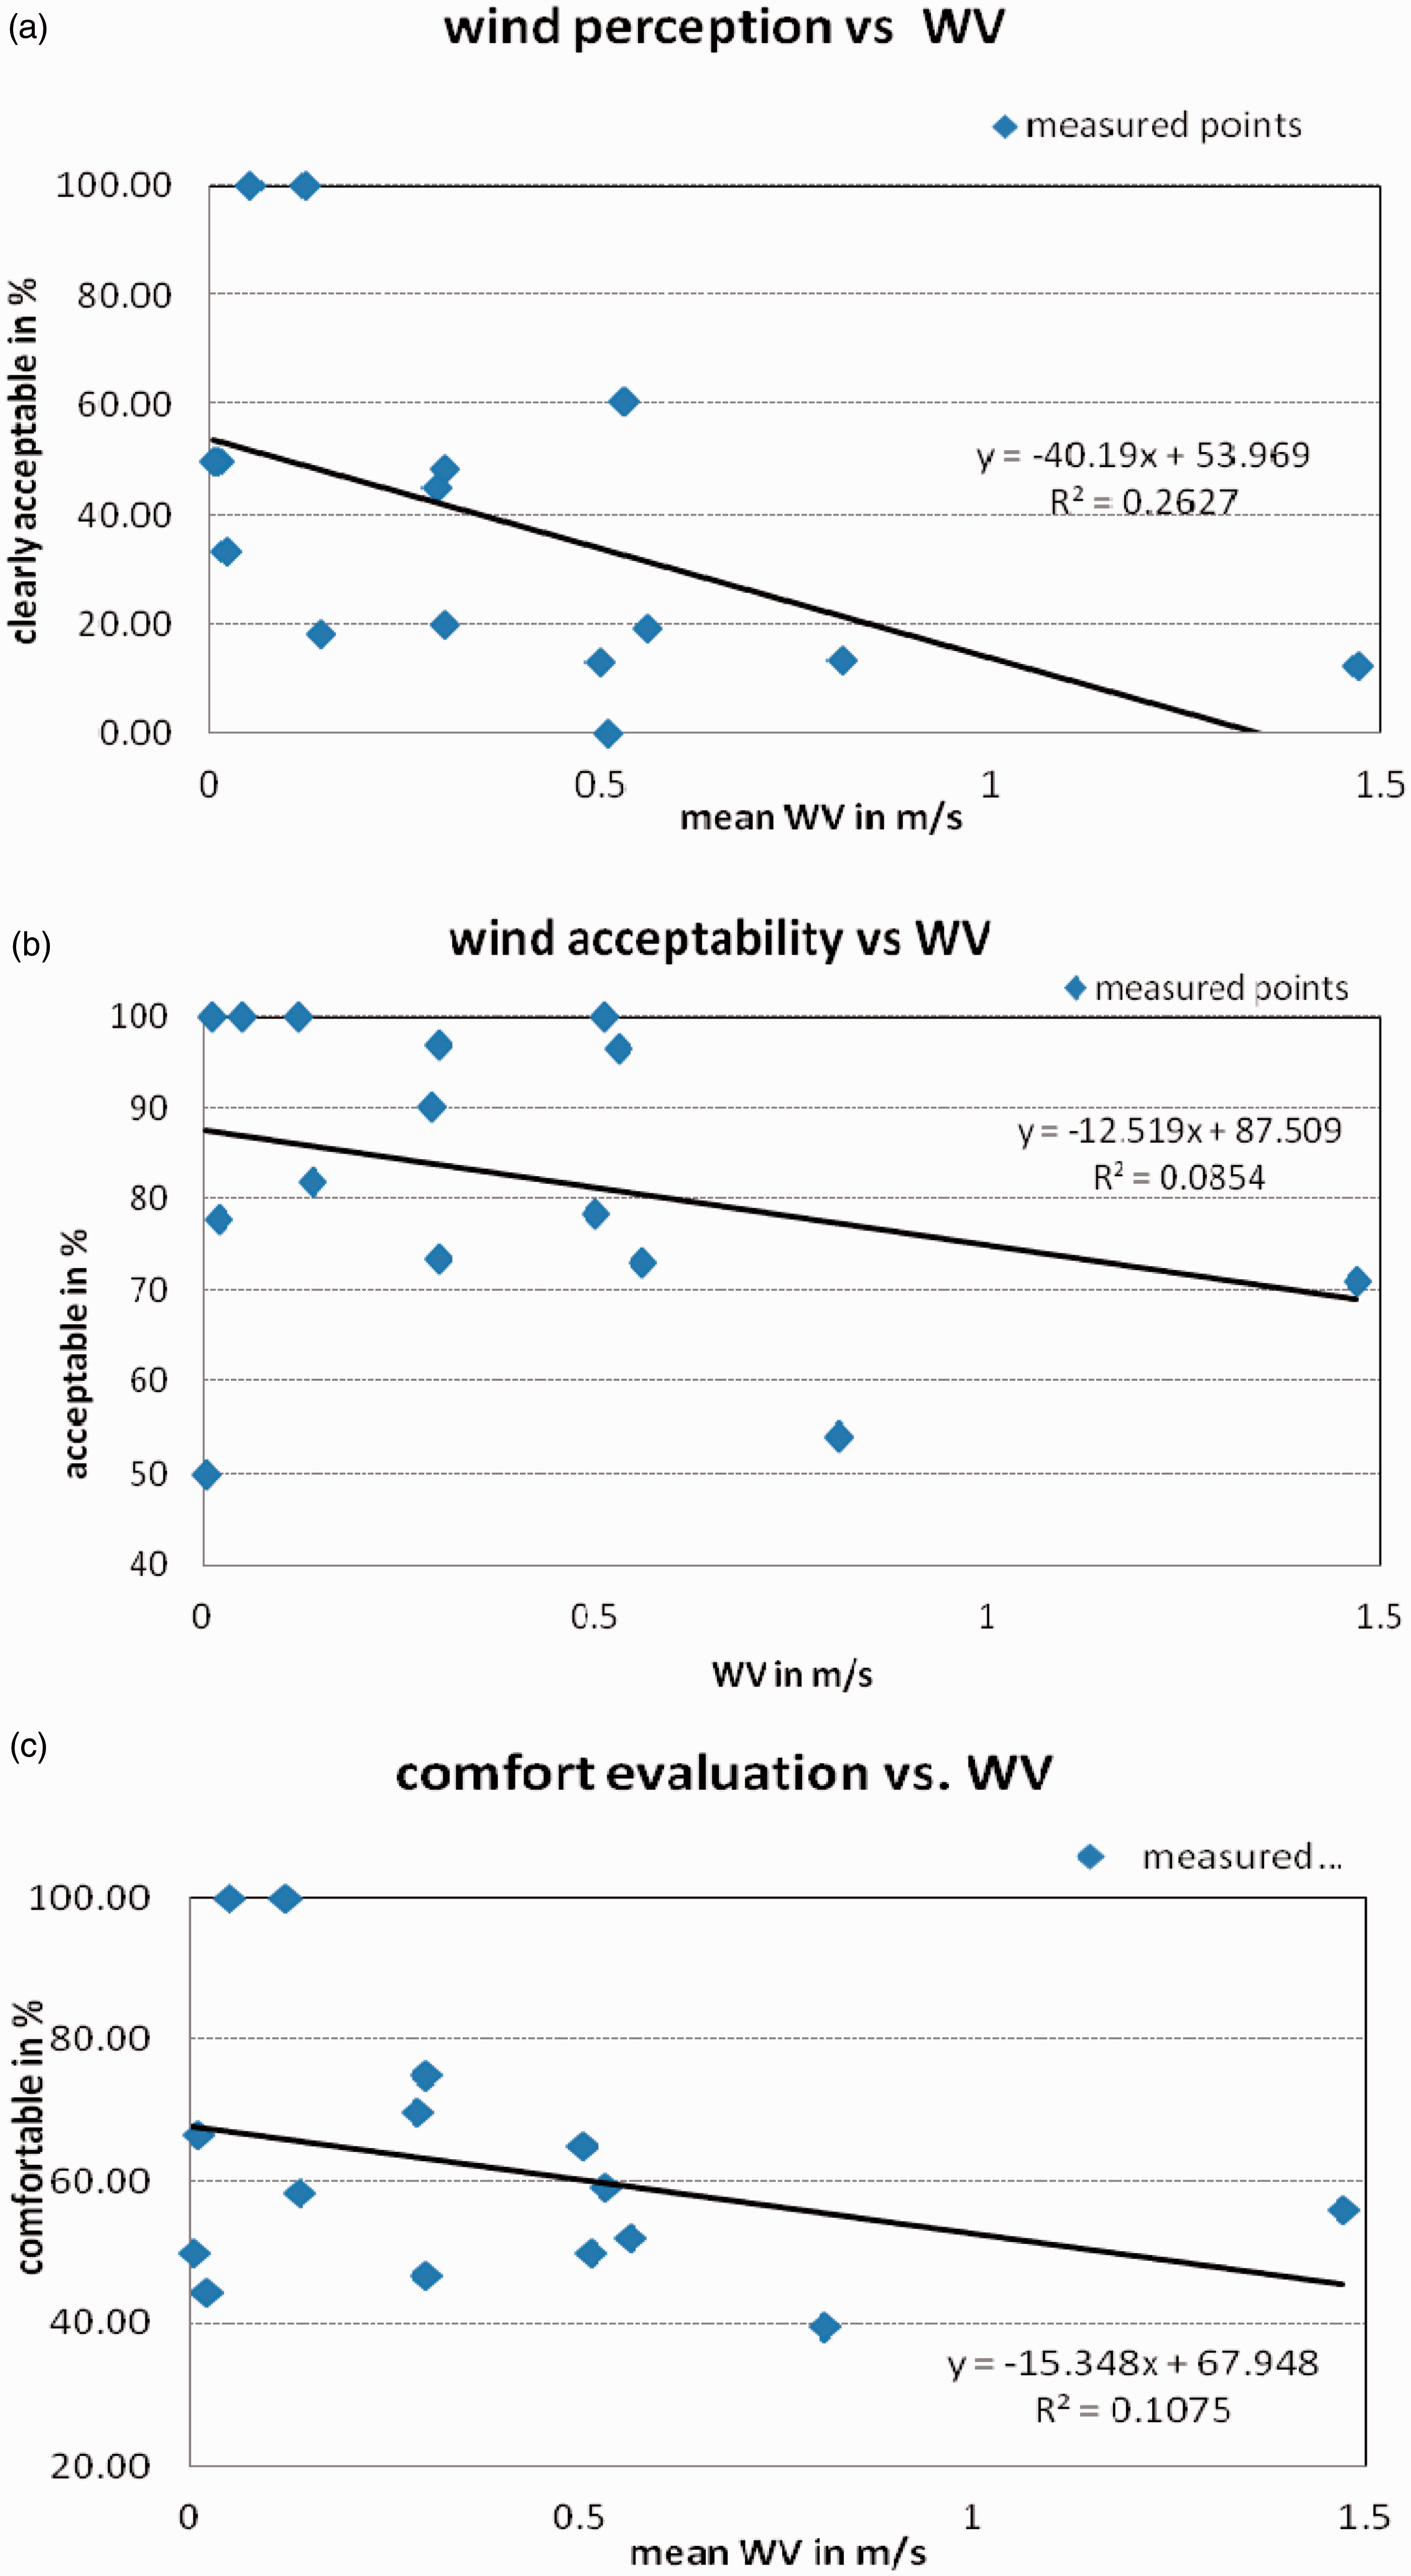
The overlay of site-mean wind velocity on the wind and comfort perception distribution (Figure 10) indicate that the rate of accepting the wind environment is negatively related with the mean wind velocity, so is the relationship between mean wind velocity and comfort perception. But the difference seems not significant. For instance, site B suffered highest wind velocity and scored lowest in both subjective wind and comfort tests, but respondents from site B who voted acceptable wind are 77%, only about 10% lower than that of site C (88%). In terms of overall comfort level, about 56% of respondents from site B voted for overall comfort, about 15% lower than that of site C. If we consider the slightly uncomfortable rating in an outdoor setting, which is still in the adaptable comfort range, then the difference between sites B and C is even smaller: site B scores 87% which is lower than site C by only 7%.
Comparison of three sites on: (a) wind perception and (b) comfort perception.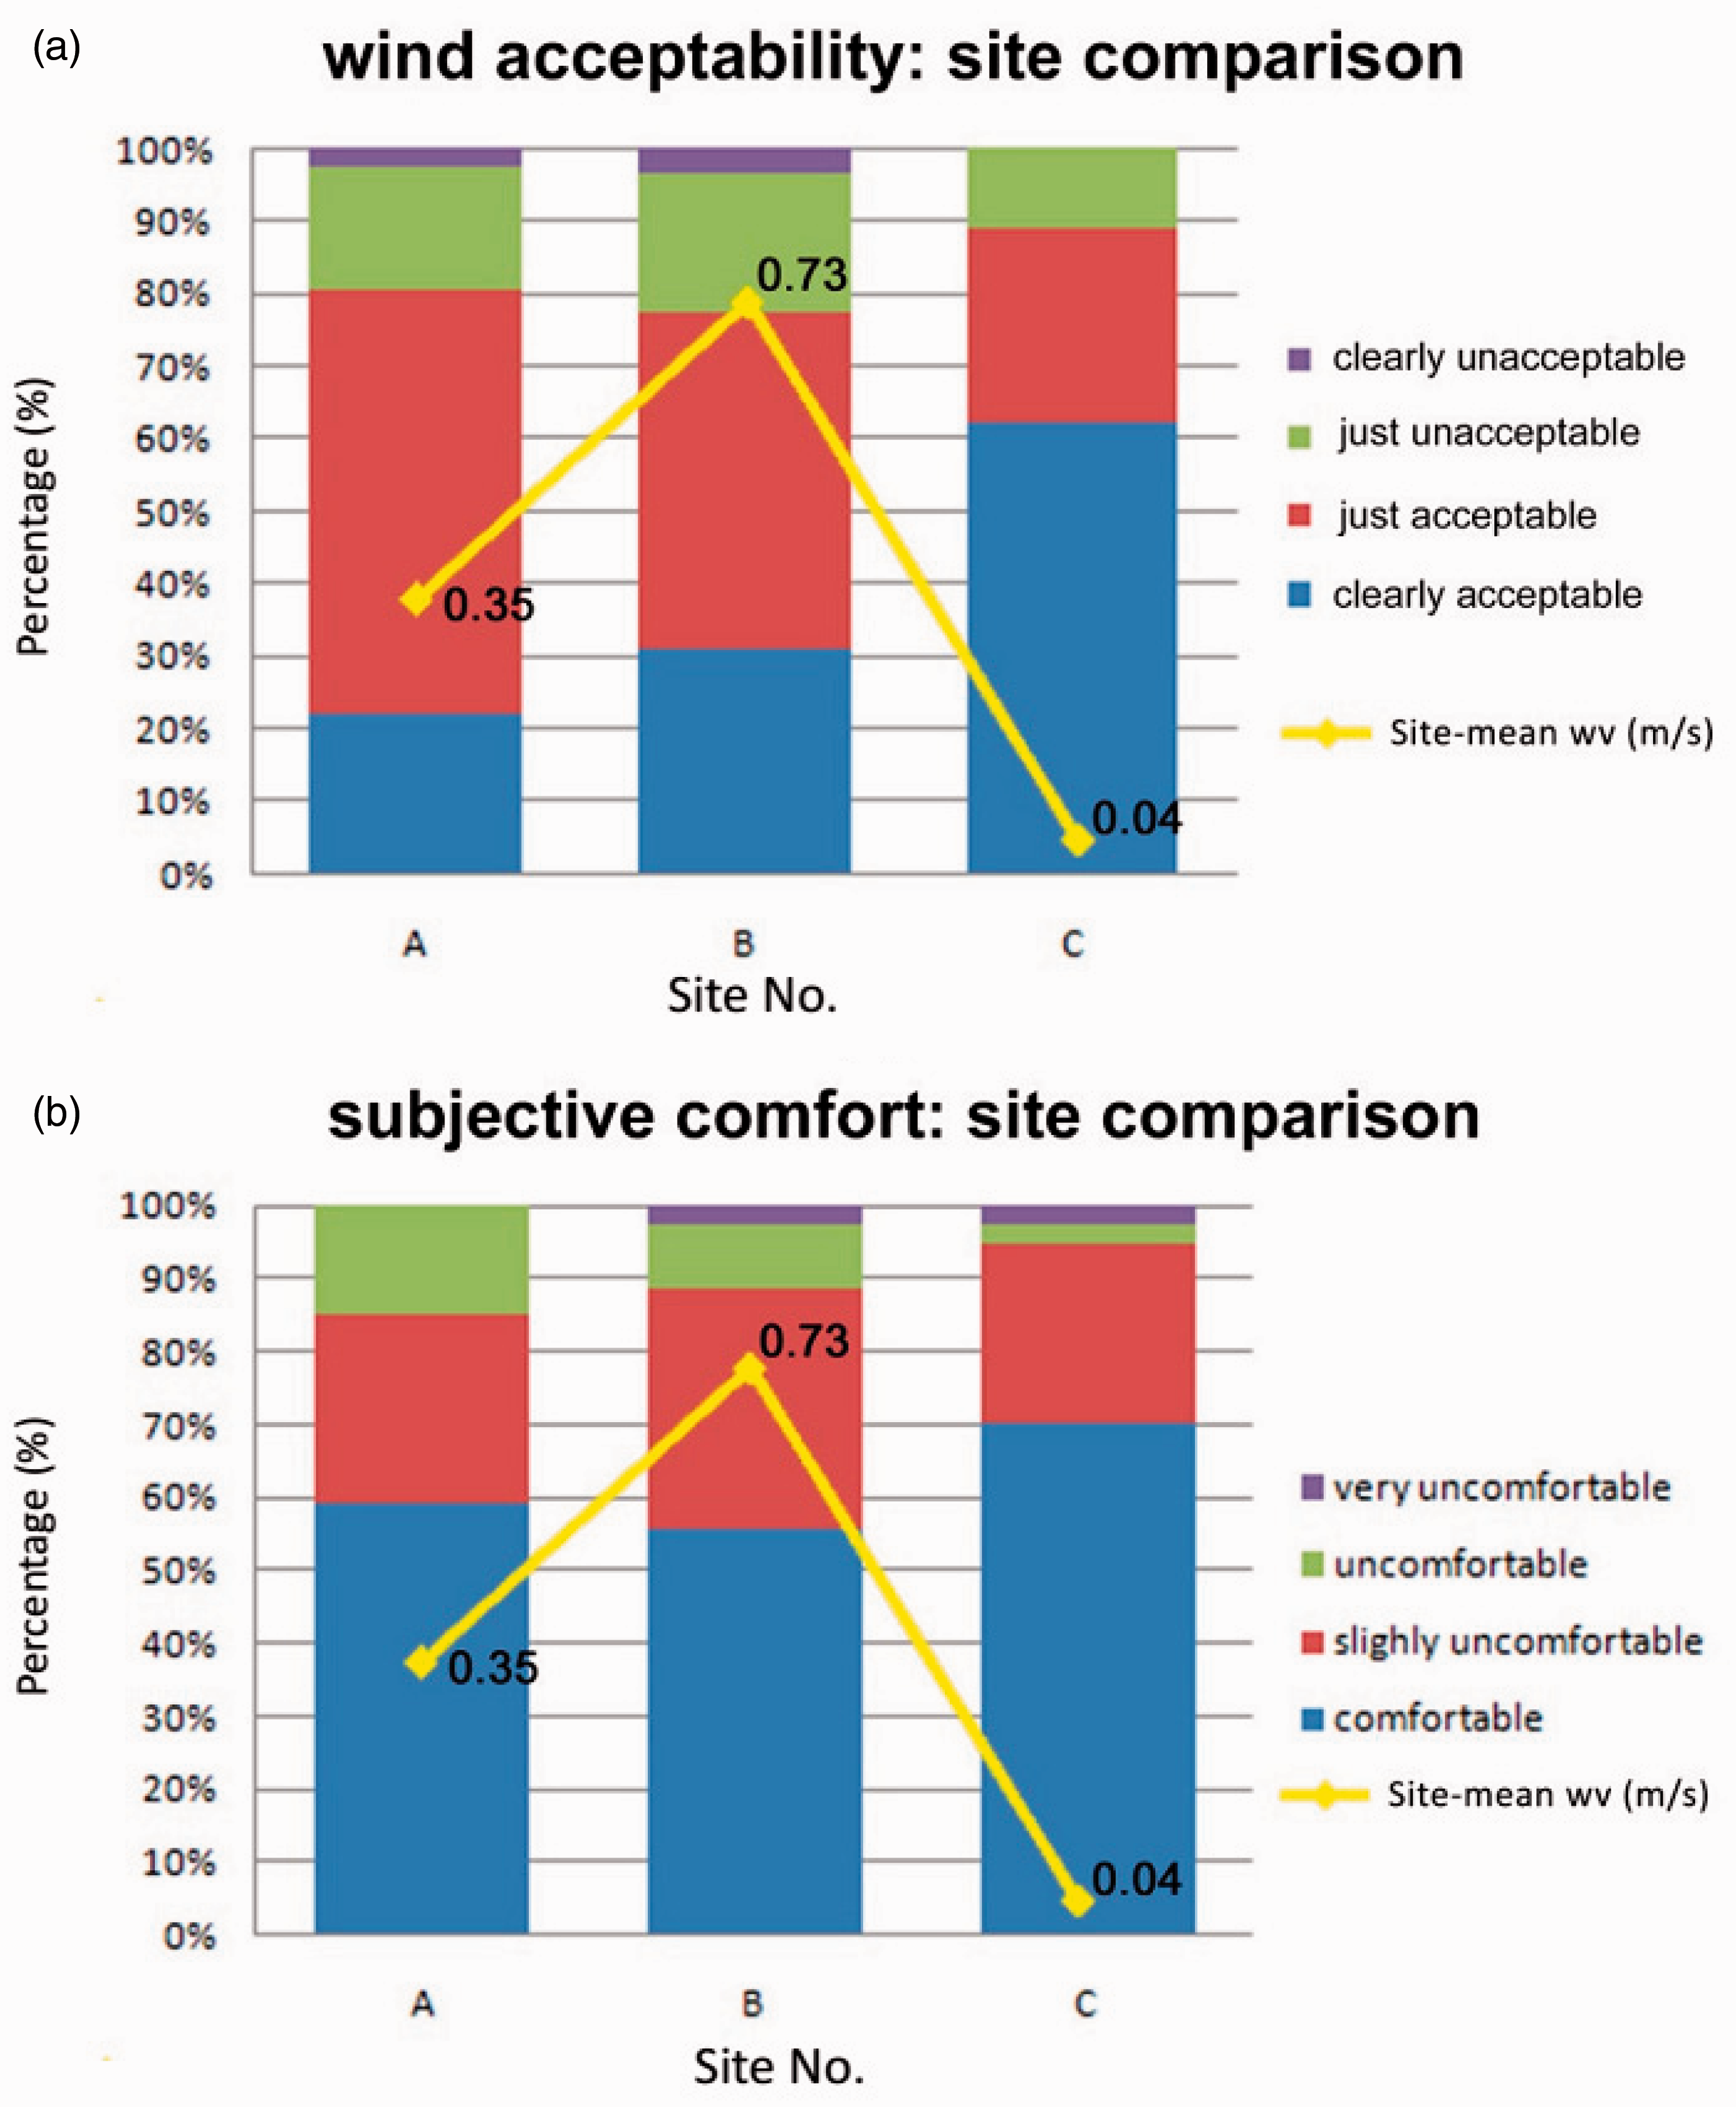
Discussion
Various site layouts demonstrate different wind sheltering performance, indicating a significant impact of building form and housing typology on outdoor ventilation. The site with high-rise, long-linear slab buildings had the highest wind velocity ratio within its major outdoor spaces. The other linear layout with mid-rise linear housing form was best sheltered from the winter wind. However, according to the accepted industry criteria, even the windiest points within site B are still considered safe for passing-by pedestrians. The difference in subjective wind and comfort perception between site B and site C was not large. In fact, there are still more than three quarters of respondents from site B who considered the wind acceptable. Can we therefore assume that the wintertime wind shelter for high-density high-rise housing quarters in Shanghai is not critical compared with summertime ventilation requirement, and that the site planning and design should focus mainly on enhancing ventilation and consider wind shelter as secondary?
More study is obviously needed to answer this question. If future work supports the above assumption, then the mid-rise linear layout would be the worst planning model in terms of site ventilation. The aspect ratio (height to width of the street canyon) of this layout, determined by the insolation right law of Shanghai housing design code, 38 is 1:1(H:W). This would be the urban canyon configuration where the skimming flow dominates, 26 and thus wind shelter would be enhanced but street ventilation would be restrained. This housing typology is mostly built during the 1950–1970s, and is still the dominant one by floor area in Shanghai. To improve the area, the housing layout could be renovated to introduce more winds into its inner space, e.g. add some tall buildings within old mid-rise housing clusters, and remove some buildings to break the long-linear canyon to form vertical and horizontal wind corridors.
Conclusions and future work
This paper presents a preliminary case study on the wintertime pedestrian winds at outdoor spaces of a large housing estate with a mix of housing forms and typologies in the inner city of Shanghai. Wind data of daytime period from six days of one year was measured; therefore, more work should be expected in the future. A field measurement is quasi-experimental, and the boundary conditions around each measurement point and around each site could not be clearly defined in terms of wind deflection, channelling, separation, etc. Consequently, the causal relationship between building form and ventilation ratio would remain to require further exploration. Wind-tunnel experiment or validated CFD tools could overcome the above problem. Despite the limitations, the findings on the users’ perception on winter wind and thermal environment are very interesting and can be useful in informing better wind environmental design for the HSCW climate cities in China. Some preliminary observations from the result are given below:
Wind velocity ratio and building layout: The measured WVR was highest in high-rise long-linear building layout (site B), but was lowest in mid-rise linear building layout (site C). The measured WVR of interspersed high-rise building layout (site A) is in the middle of the above two sites, but the WVR at site A can be lowered by the nearby dense vegetation. Wind velocity and pedestrian comfort: The measured pedestrian wind velocity is largely mild. All measurement points at site B were found unsuitable for sitting around for long period, and one point at B2 was uncomfortable for casual walking. Although site B has higher WVR and is windier than at C, the percentage of people that felt comfortable and slightly uncomfortable (87%) was only 7% less than at C (94%). B2 is located in a Northwest-Southeast-oriented road in a winter wind corridor. The wind problem can be alleviated by proper landscape design. Summer wind channelling vs. winter sheltering: Under the HSCW climate, for a given building volume, high-rise and mid-density housing form can be better than mid-rise and high-density one. The former can be windier in winter but most area are still within comfort zone; furthermore, the windy areas can be moderated by proper landscape design, which would introduce more airflow to pedestrian level in summer, enhancing wind channelling and thus enable pedestrian comfort.
Footnotes
Author’s contribution
Feng Yang is the only contributor for this article.
Acknowledgement
The author is grateful to Professor Stephen Lau for providing the necessary instruments. The author also thanks research assistants from CAUP, Tongji University: Han Jingyang, Li Ao, Chen Wenqiang, He Xiaodong, Zou Jie, and Zhao Jingjing.
Declaration of conflicting interests
The author(s) declared no potential conflicts of interest with respect to the research, authorship, and/or publication of this article.
Funding
The author(s) disclosed receipt of the following financial support for the research, authorship, and/or publication of this article: National Natural Science Foundation of China (project no.: 51208361), Innovation Program of Shanghai Municipal Education Commission (project no.: 15ZZ020), and the Fundamental Research Funds for the Central Universities (project no.: 0100219161).