
Abstract
Simplified computational thermal manikins are beneficial to the computational efficiency of computational fluid dynamics simulations. However, the criterion of how to simplify a computational thermal manikin is still absent. In this study, three simplified computational thermal manikins (CTMs 2, 3 and 4) were rebuilt based on a detailed 3D scanned manikin (CTM 1) using different simplification approaches. Computational fluid dynamics computations of the human thermal plume in a quiescent indoor environment were conducted. The predicted airflow field using CTM 1 agreed well with the experimental observations from the literature. Although the simplified computational thermal manikins did not significantly affect the airflow predictions in the bulk regions, they strongly influenced the predicted airflow patterns near the computational thermal manikins. The predictive error of the computational thermal manikin was strongly related to the simplification approach. The computational thermal manikins generated from the surface-smoothing approach (CTM 2) was very close to CTM 1, while the required mesh elements for a stable numerical solution dropped by over 75%. Comparatively, the predictive errors of CTMs 3 and 4 were considerable in the near-body regions. This study has illustrated the importance of keeping the key body features when simplifying a computational thermal manikin. The surface-smoothing-based simplification method was shown to be a promising approach.
Introduction
Micro-environment around human occupants in indoor spaces 1 has been attracting increasing research interest with concerns regarding personal thermal comfort and possible exposure to health hazards.2,3 The importance of the thermal buoyancy flows generated by human metabolic heat and its interaction with the environment has been thereby recognised. As the major thermal flows in most indoor spaces, the human thermal plumes can strongly affect the airflow pattern around human bodies. 4 They play an important role in transporting the contaminants released from human bodies, such as pathogen-carrying droplets exhaled by coughing or sneezing5,6 and the gaseous and ultrafine particulate contaminants initiated from ozone reactions with human skin lipids.7,8 In addition, the contaminants from near-floor levels could also be brought into the breathing zone by the thermal airflows and cause health issues.9,10
In order to evaluate the relationship between human bodies and their surroundings, computational thermal manikins (CTMs) representing human occupants have been included in the computational fluid dynamics (CFD) models for indoor air quality, thermal comfort and exposure risk assessments. A number of CTMs varying from simple blocks and cylinders to detailed 3D scanned manikins1,11,12 have been reported in literature. Generally, detailed CTMs are desirable to use in CFD simulations in order to achieve better accurate predictions. Also, the inaccuracy in air velocity and temperature field predictions caused by model geometry differences could generate even greater errors in further CFD computations. However, the computational cost, on the other hand, increases exponentially when such complicated CTMs are used, which could become a barrier for practical applications. This is especially true when the interested space is occupied by multiple occupants, such as public transport vehicles 13 and classrooms. 14 As a compromise, CTMs have to be simplified in order to improve the computational efficiency, although this would inevitably reduce simulation accuracy.
As CFD approaches have been widely employed to assess the thermal comfort and estimate the health risks associated with contaminant exposure. Deevy and Gobeau 15 and Seo et al. 16 investigated the effects of CTM simplification on CFD analyses of indoor airflow field and human thermal comfort. They reported that the predicted airflow field in the bulk region was not sensitive to the complexity of the CTM, while the airflow field in the vicinity of the CTM was significantly changed when CTMs with different body complexity were used. The deviation in airflow field prediction further affected the results of thermal comfort evaluation. Therefore, a simplified CTM model seems to affect the airflow field prediction only in the regions close to the CTM. However, the inaccuracy caused by body geometry simplification could be greater when the CTMs are in motion. Mazumdar et al. 17 simulated contaminants transport in an airliner cabin containing a moving passenger in the aisle. They used a rectangular block, a cylinder and a human-like block-set, respectively, to represent the moving passenger and found that the predicted concentration patterns were significantly different when different CTMs were employed.
Therefore, for the dual purposes of reducing the computational cost and maintaining an acceptable accuracy, appropriately simplified CTMs are generally preferred. Although a number of CTM simplification methods were reported in the literature, the criterion of choosing or creating an appropriately simplified CTM is still absent.
This study aimed to evaluate the effects of CTM simplifications on thermal flow field predictions by presenting detailed comparisons of various simplified CTMs. A smoothed 3D scanned CTM, a skeleton-based rebuilt CTM using Ruzic and Bikic’s method 18 and a surface-area-based CTM which was rebuilt according to Miyanaga et al.’s method 19 were developed in this study. The numerical results yielded from those simplified models were tested and compared against the detailed 3D scanned model. The computational costs associated with the simplification methods were also analysed.
Methodology
Computational domain and boundary conditions
The experimental data by Licina et al.
20
were utilised in this study for model validation and comparison. During their experiment, a sitting manikin with a height of 1.23 m, as illustrated in Figure 1(a), was placed in the middle of an enclosed room with dimensions of 11.1 m-length × 8 m-width × 2.6 m-height. The manikin was electrically heated, and the ambient temperature was maintained at 26℃. The ventilation system was turned off during the measurements to provide a quiescent condition. Thus, the thermal buoyancy flow driven by the manikin body heat was the only airflow in the room. The airflow and temperature fields around the manikin surface were measured using the particle image velocimetry (PIV) technique and complemented with the pseudo colour visualisation (PCV) technique.
The computational domain based on the experimental setup (a) PIV setup by Licina et al.,
20
(b) the computational domain.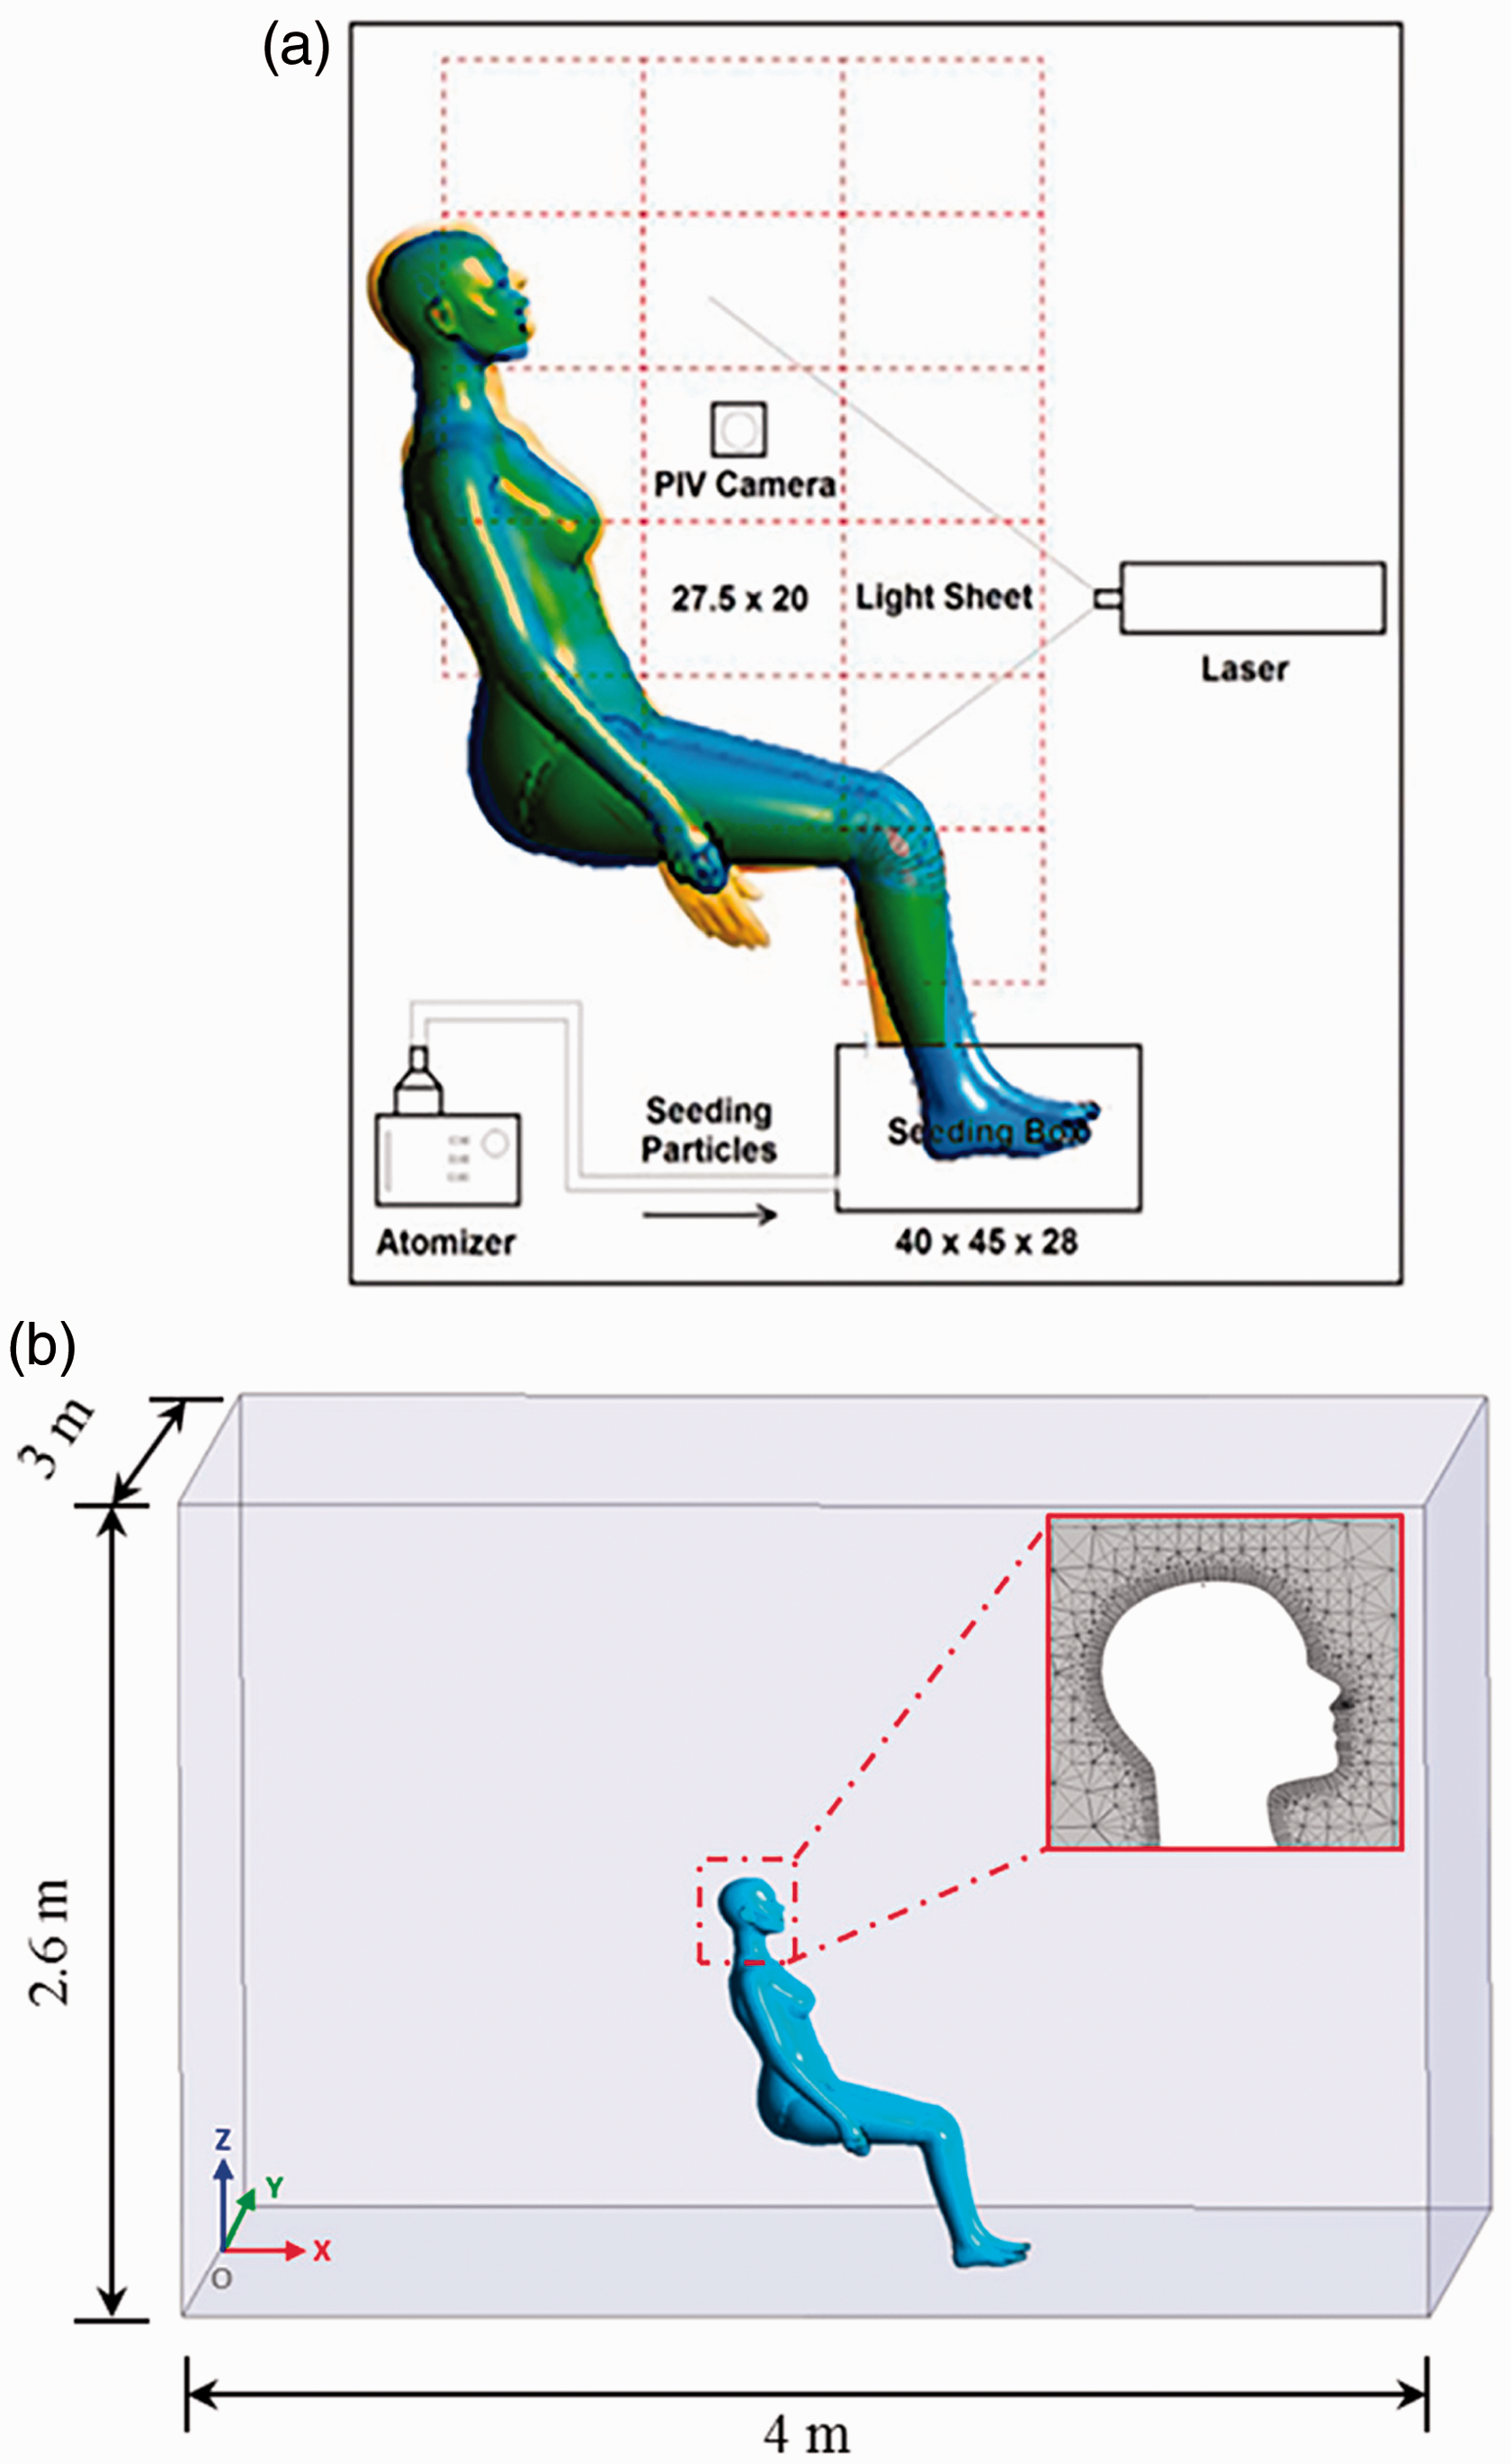
As the bulk air was free from the manikin’s thermal effect and was quiescent during the experiment, a smaller computational domain was applied during the simulations. Model tests have proved that stable predictions could be achieved when the domain dimensions reached 4 m × 3 m × 2.6 m. As shown in Figure 1(b), the front, back and side walls of the computational domain were set as free-flow openings with zero gauge pressure to allow air flowing in and out depending on the interior conditions. The air temperature at the openings was set to 26℃ according to the experimental setup.
The CTMs
Four different CTM models including a 3D scanned manikin, a smoothed 3D scanned manikin, a skeleton-based CTM and a surface-area-based CTM were employed in this study.
The 3D scanned manikin model with detailed body and facial feature, designated CTM 1 in this study, was downloaded from an open database (http://www.ie.dtu.dk/manikin). This original manikin was slightly modified in order to achieve a comparable sitting posture and body surface area to the experimental manikin by Licina et al. 20 As shown in Figure 1(a), CTM 1 could overlap perfectly with the experimental manikin, except some local segments such as the hands and shanks. Thus, the numerical results yielded from CTM 1 could be compared directly to the experimental data. In the following sections, CTM 1 was used as a baseline model for further developments of the other CTMs.
The smoothed manikin (CTM 2) was obtained through smoothing CTM 1, as shown in Figure 2. Some unnecessary body and facial features including eyes, mouth and fingers were smoothed, while the overall and key features were preserved. In addition, errors from the 3D scanning process such as the abnormal shapes on the manikin hands were removed by smoothing the corresponding segments.
Simplified and smoothed model (CTM 2) from the original 3D scanned model.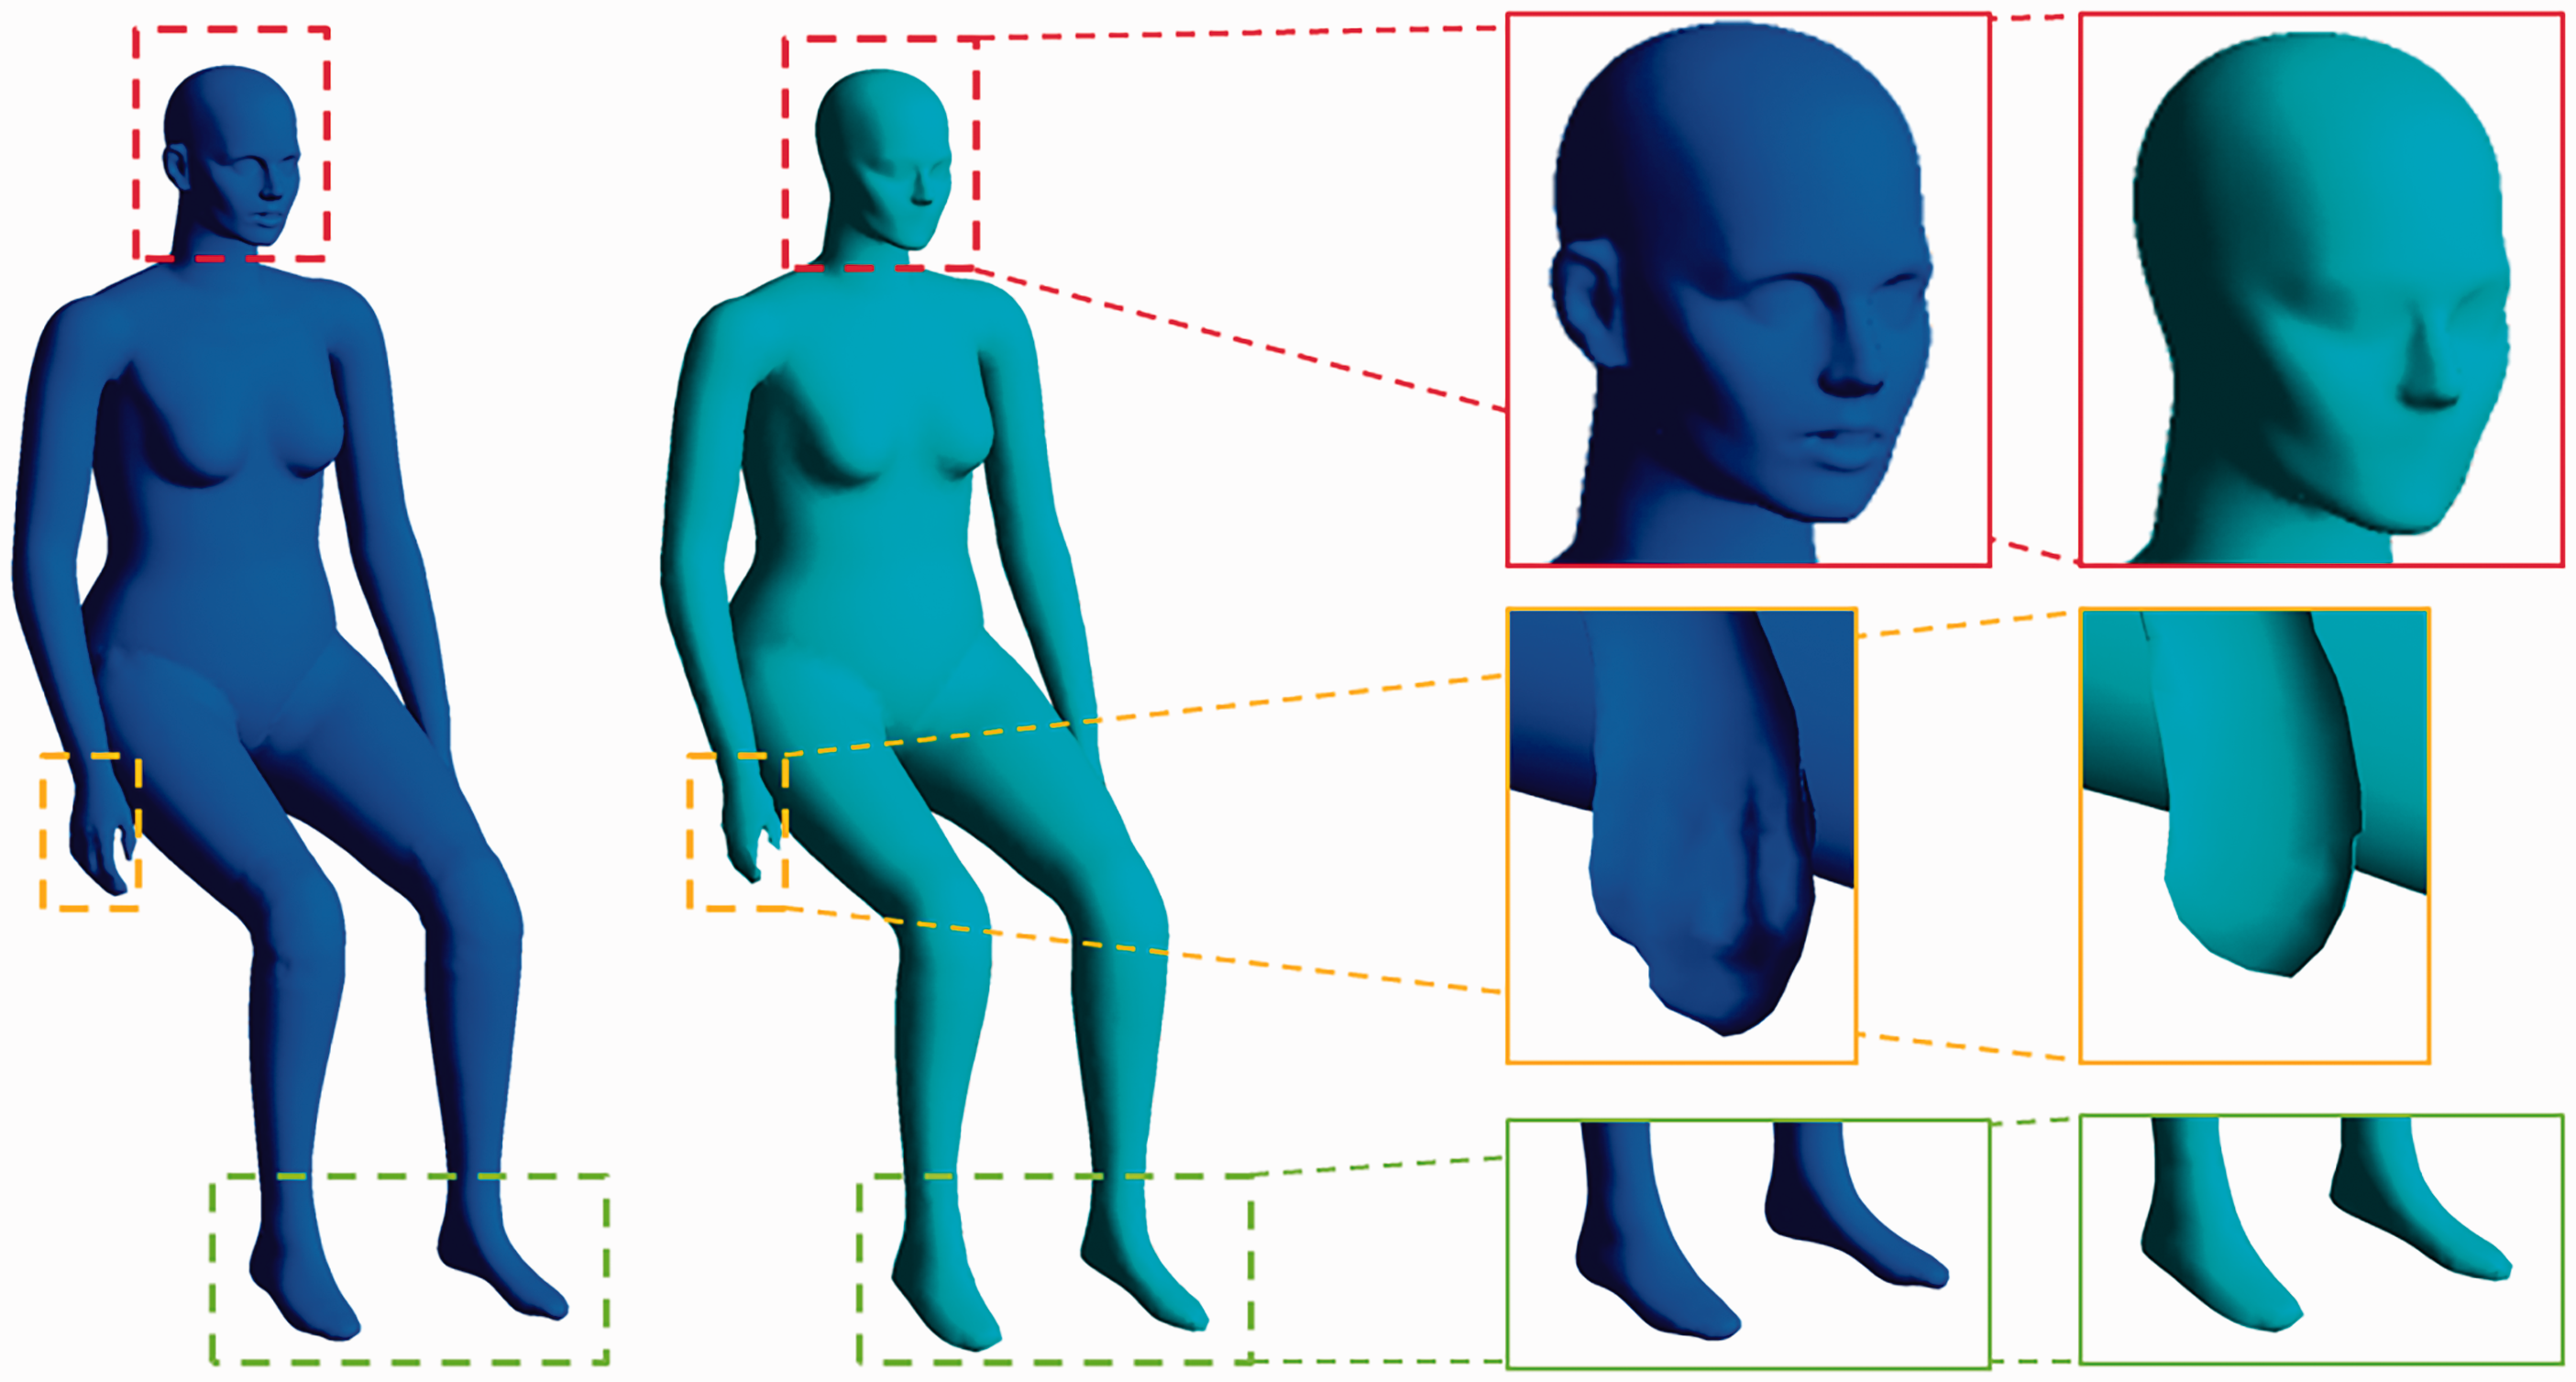
Ruzic and Bikic’s
18
introduced a simple approach to build CTMs based on the skeleton structures of a human body. Their approach was employed in this study to build another thermal manikin model (CTM 3) based on the skeleton structure of CTM 1. To do this, the skeleton structure of CTM 1 was first extracted according to the major connections of each body segment, as well as the overall body shape (e.g. nose, elbows and knees). Some key sizes including the head dimensions, nostril size, shoulder width and leg diameter were measured. Then, the surface area of each body segment was measured. Finally, the body segments were rebuilt based on the skeleton structure and the segment surface area. The process of building CTM 3 was illustrated in Figure 3.
Rebuilt manikin model (CTM 3) based on the skeleton structures.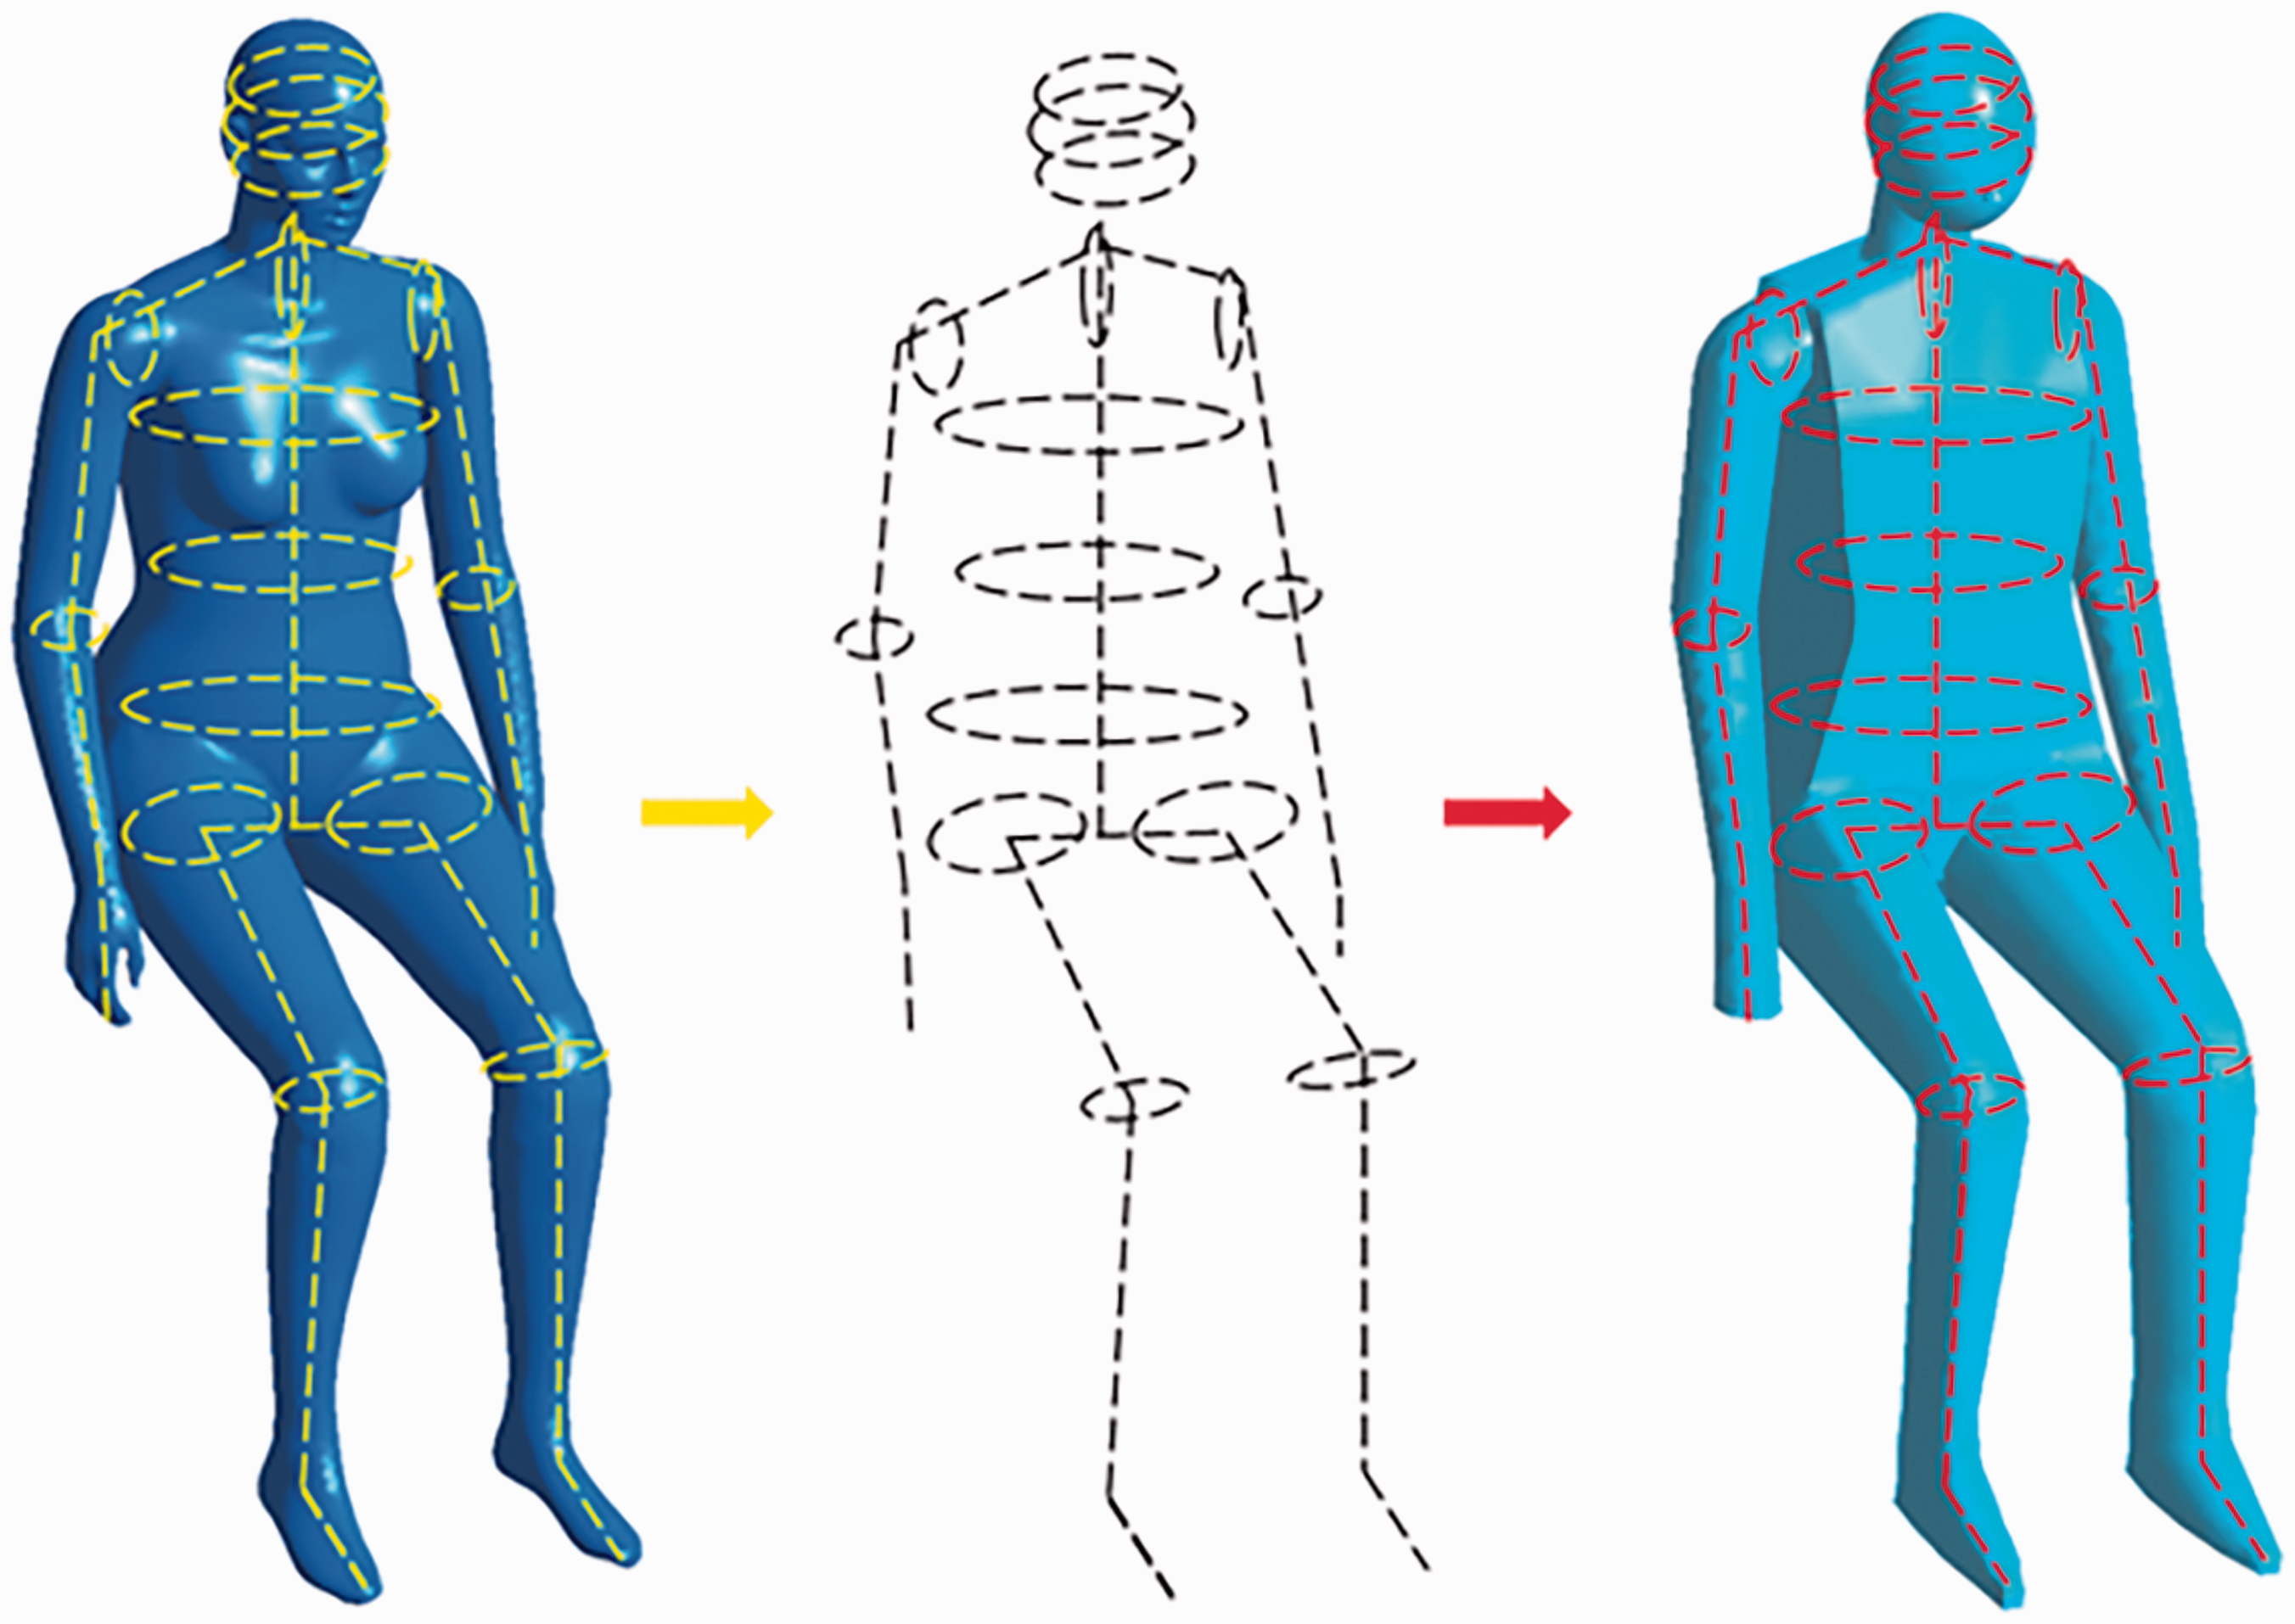
The surface-area based approach as introduced by Miyanaga et al.
19
was employed in this study to build CTM 4. By using their approach, the 3D scanned manikin (CTM 1) was firstly divided into several major body segments (head, upper body, left leg and right leg). Then the surface area and basic dimensions of each segment were measured. Finally, the corresponding segment from CTM 1 was rebuilt with similar surface area but using very simple geometries (i.e. cylinders and rectangular solids). The schematic view of this approach is given in Figure 4.
Highly simplified model (CTM 4) based on the key dimensions of the 3D scanned model.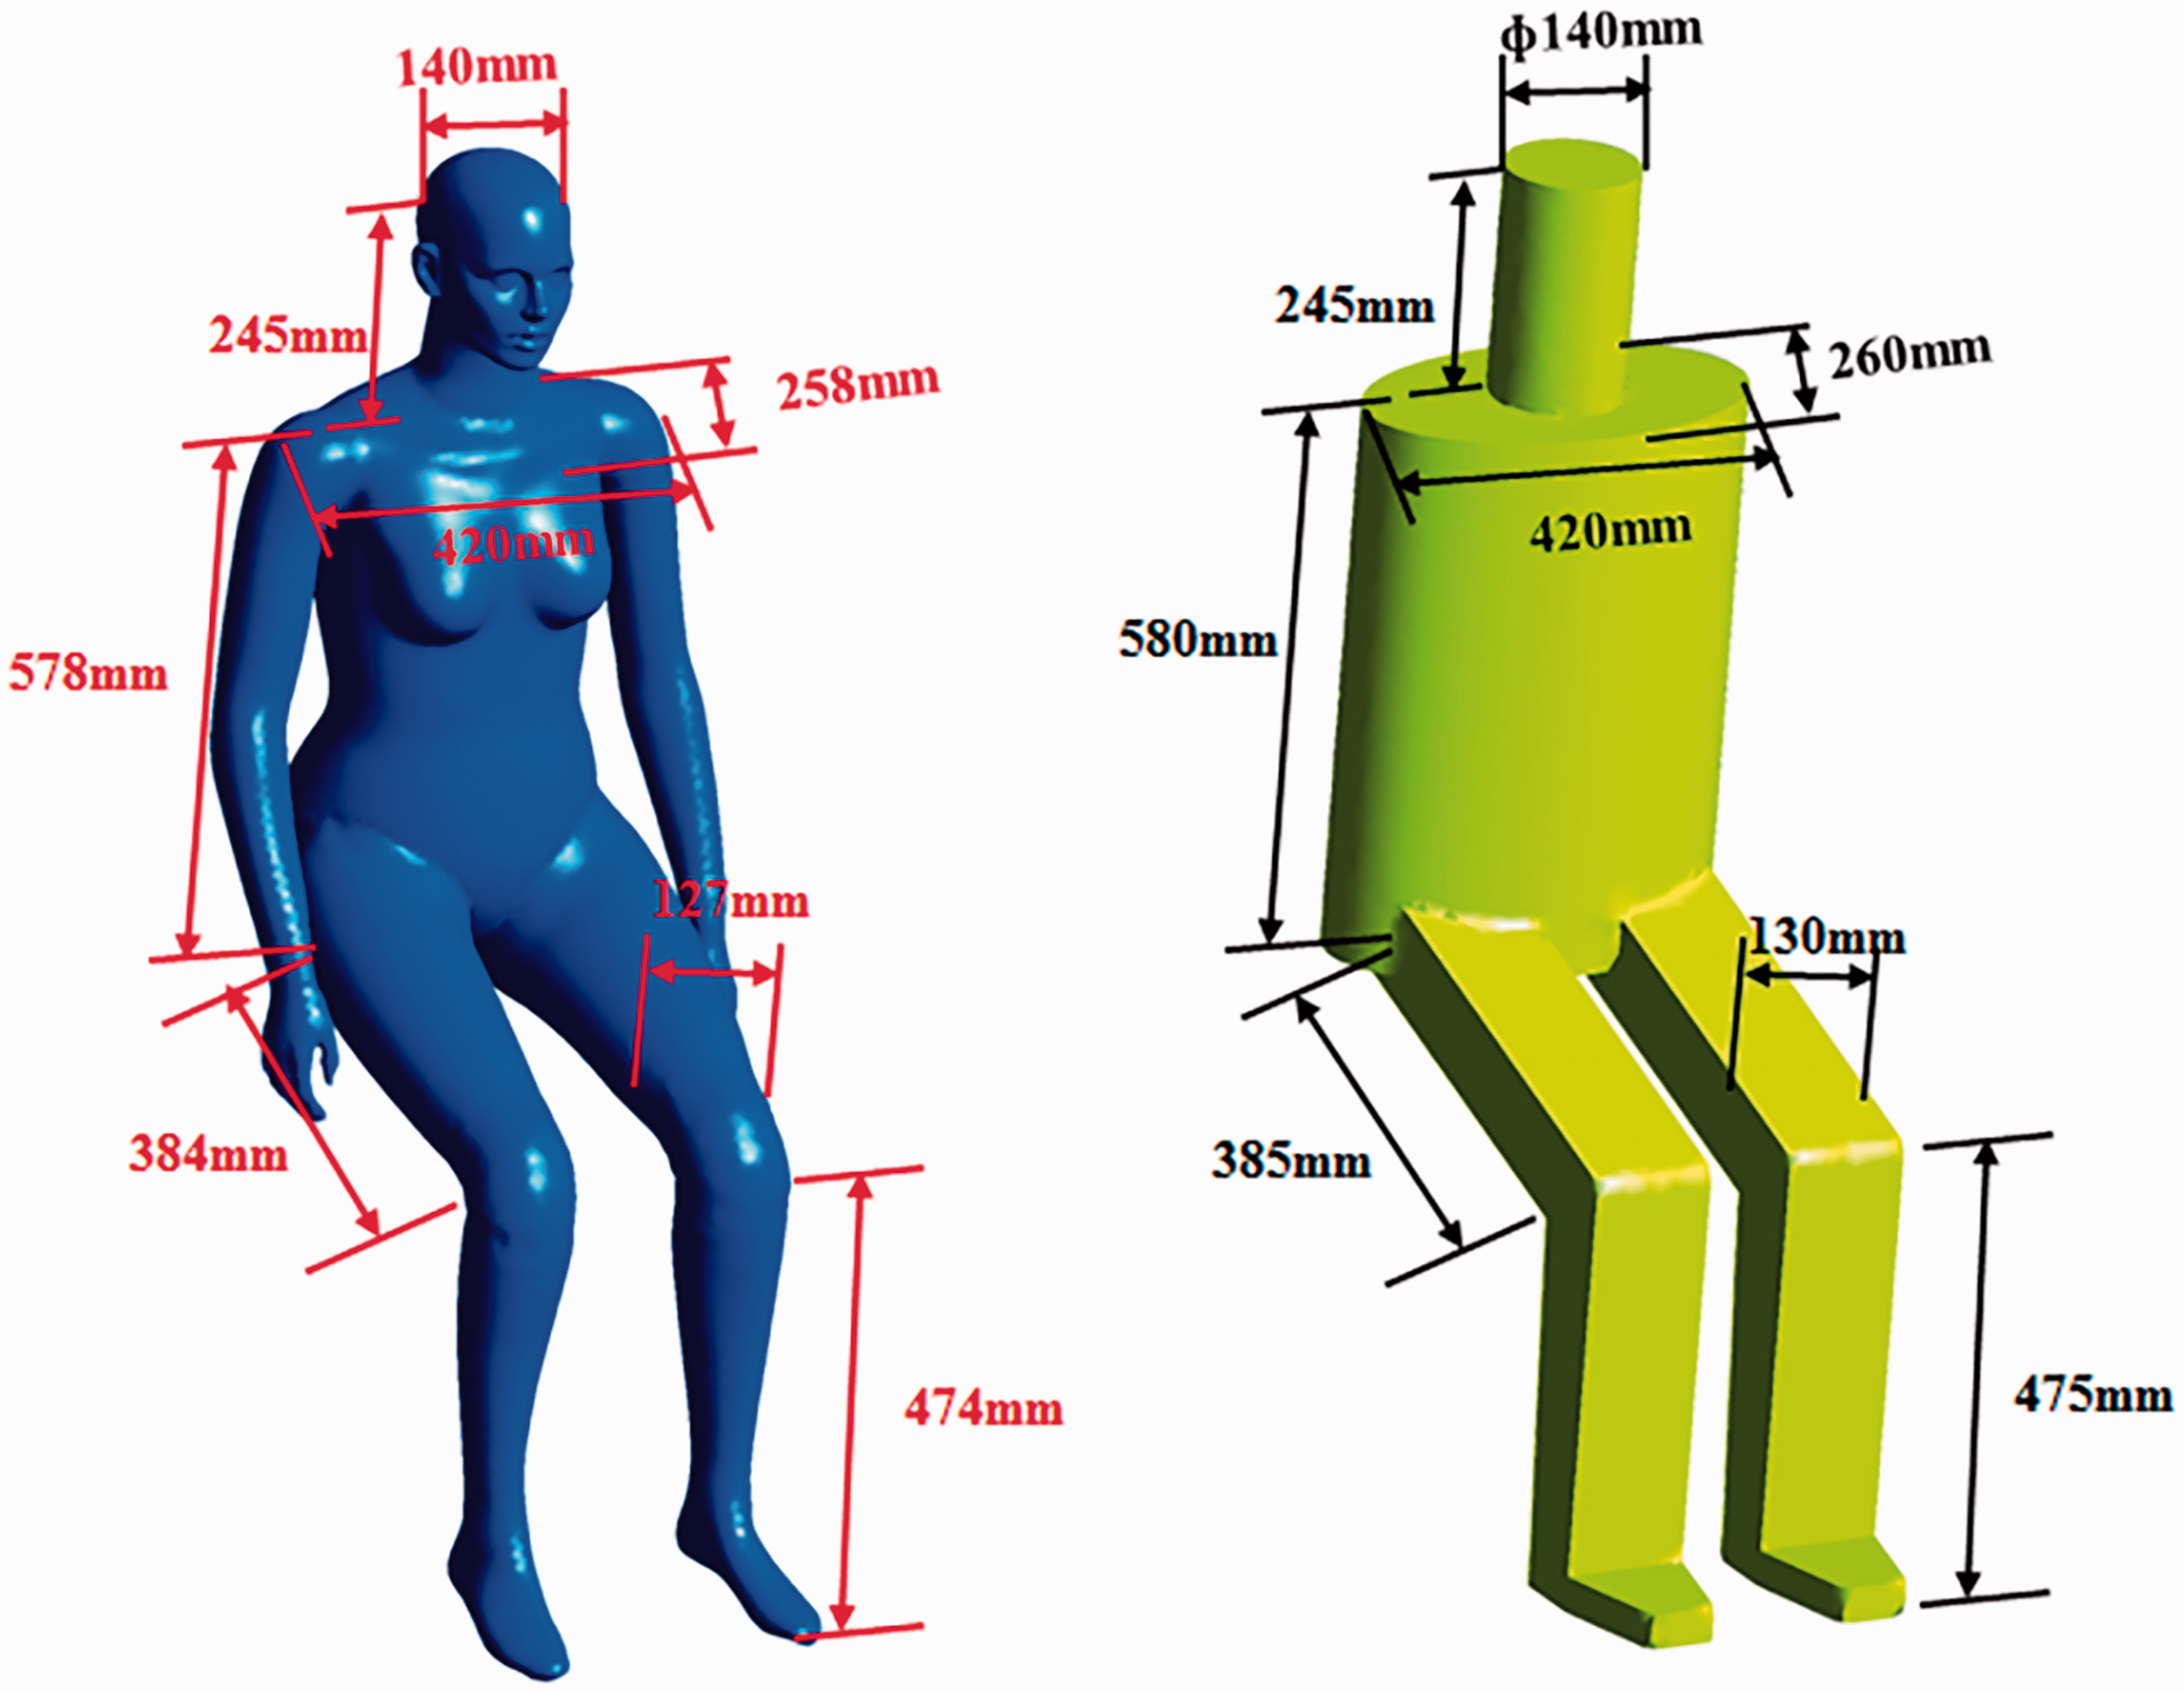
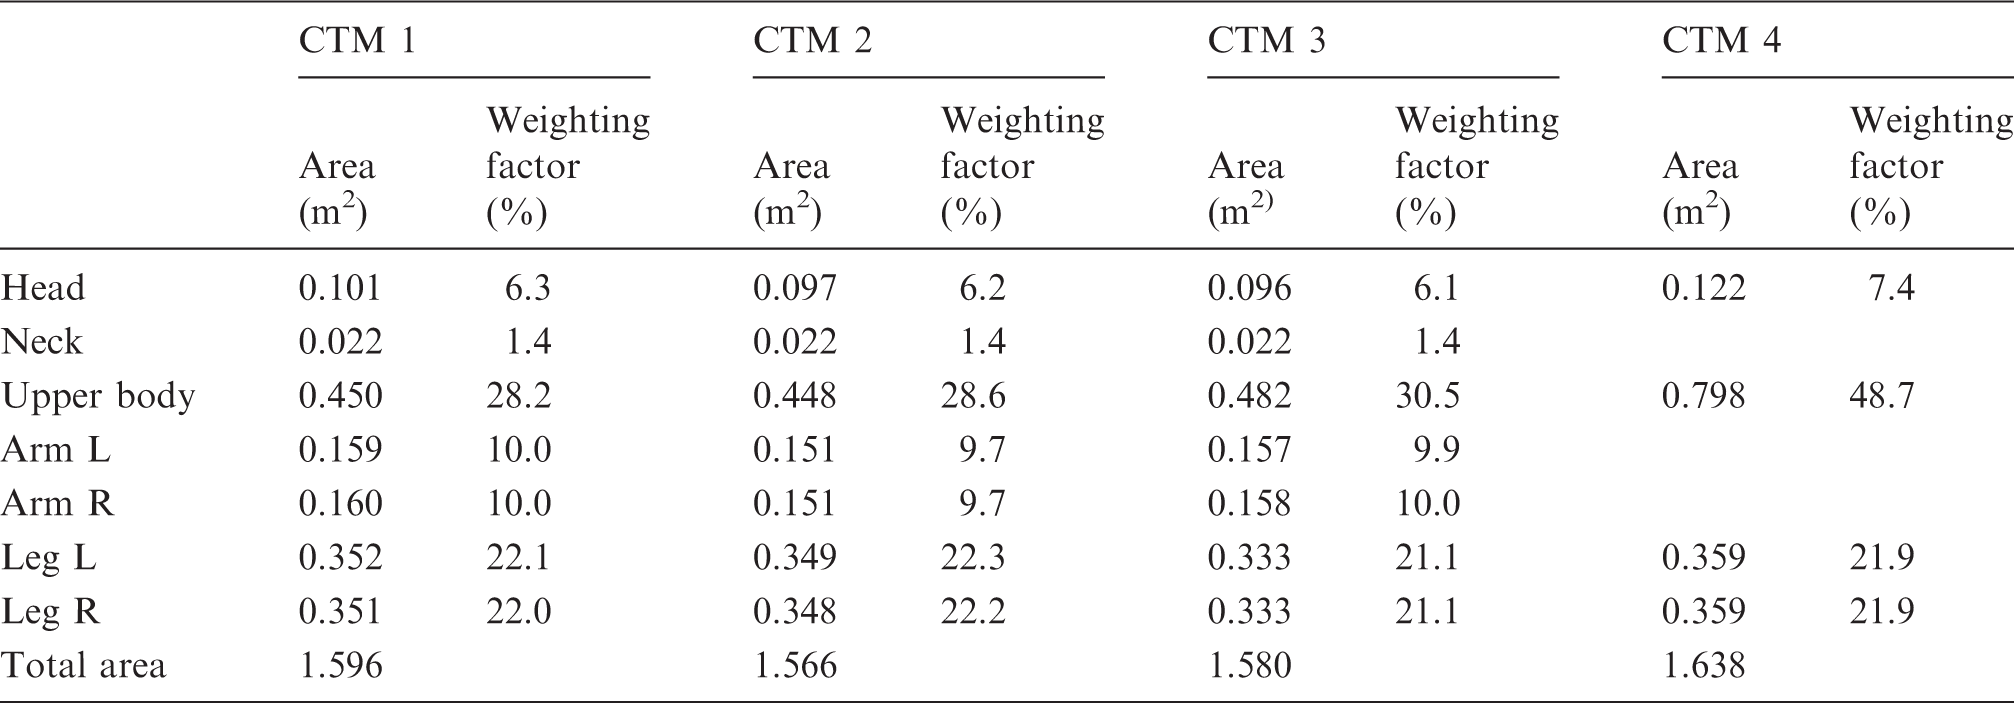
Body surface areas and segment weighting factors of CTM models.
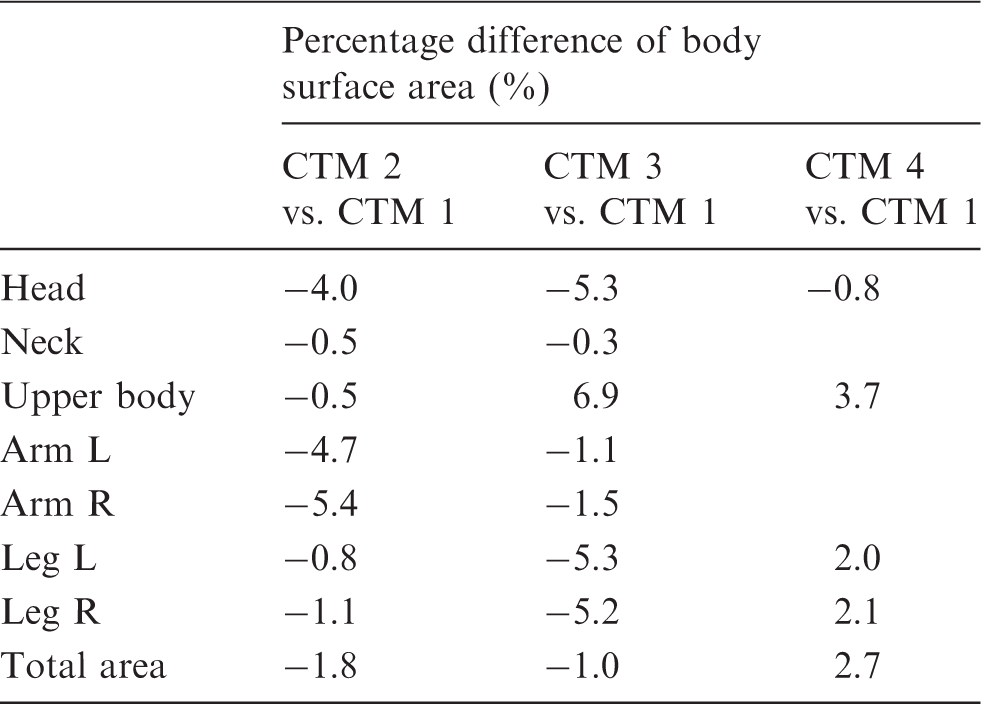
Percentage differences of BSAs between the original model and the other models.
Numerical procedures
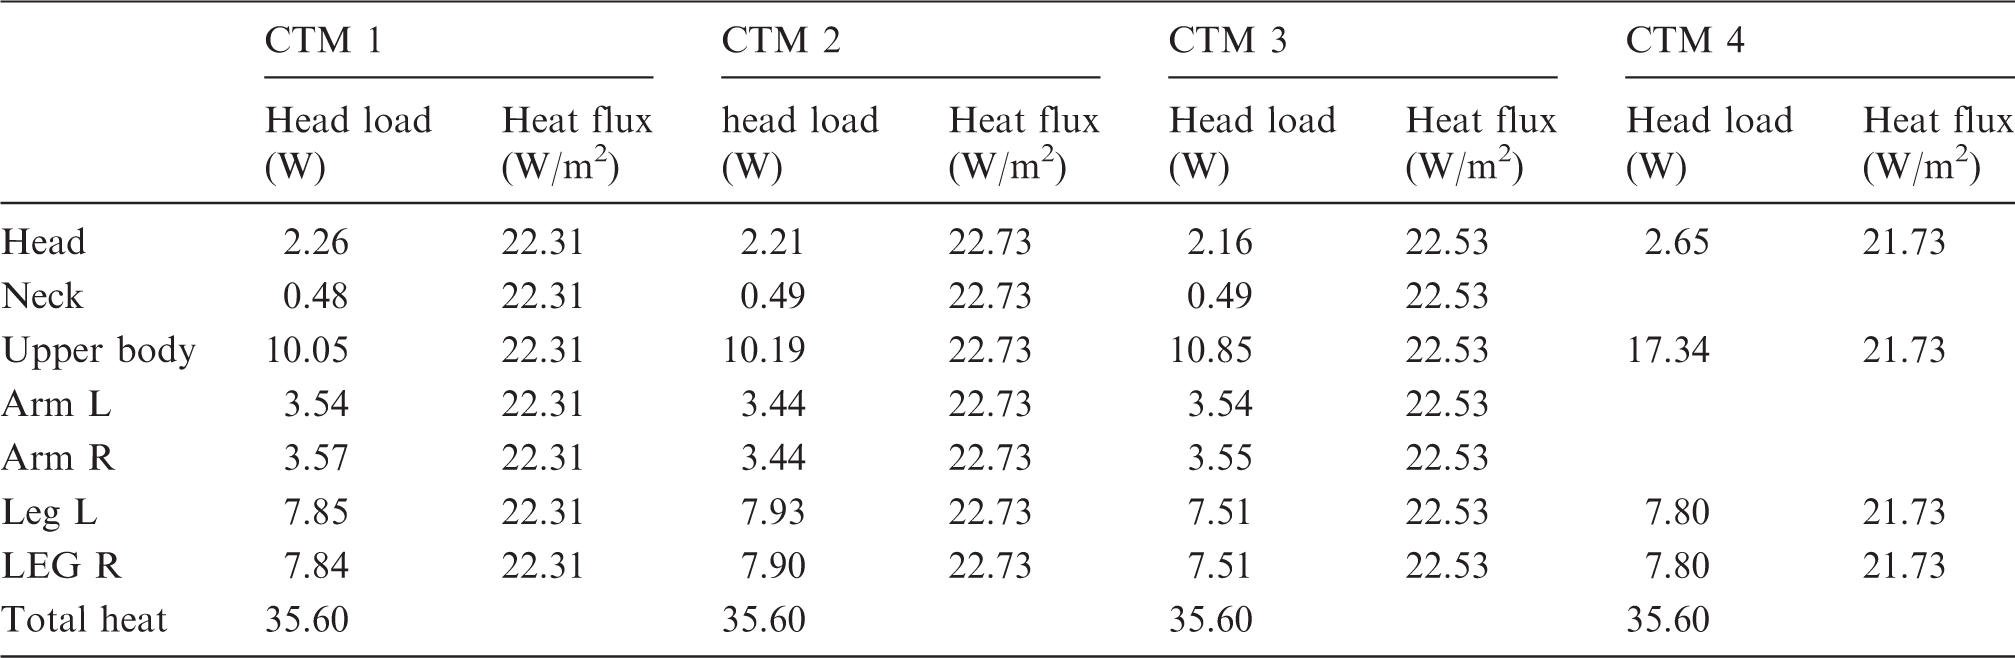
Since the thermal buoyancy flow in the domain was exclusively driven by the heat released from the CTM, proper specification of the heat flux at the CTM surface was crucial for predicting airflow field. Yan et al. 22 investigated the effects of the surface heat conditions of the CTM on the airflow field prediction. They found that both the total heating power of a CTM and the distribution of the heat flux on the CTM surface have significant effects on the predicted airflow pattern. They recommended that, in order to achieve a stable prediction when using simplified CTMs, the overall heating power of the manikin body should be kept constant. This strategy was employed in this study in order to achieve a consistent heat condition with different CTM models.
Head load and heat flux of CTM models.
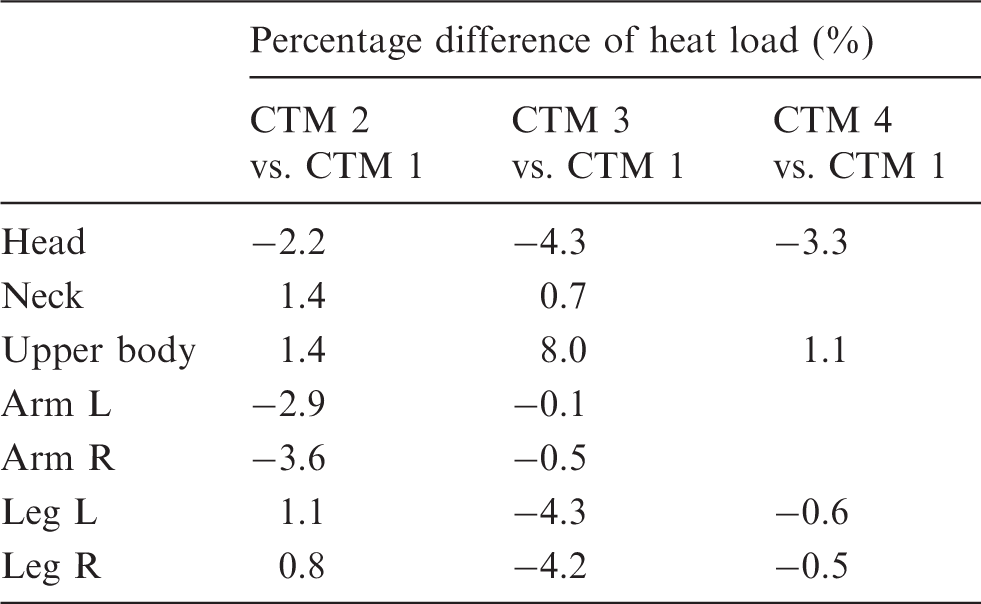
Percentage difference of heat load between the original model and the other models.
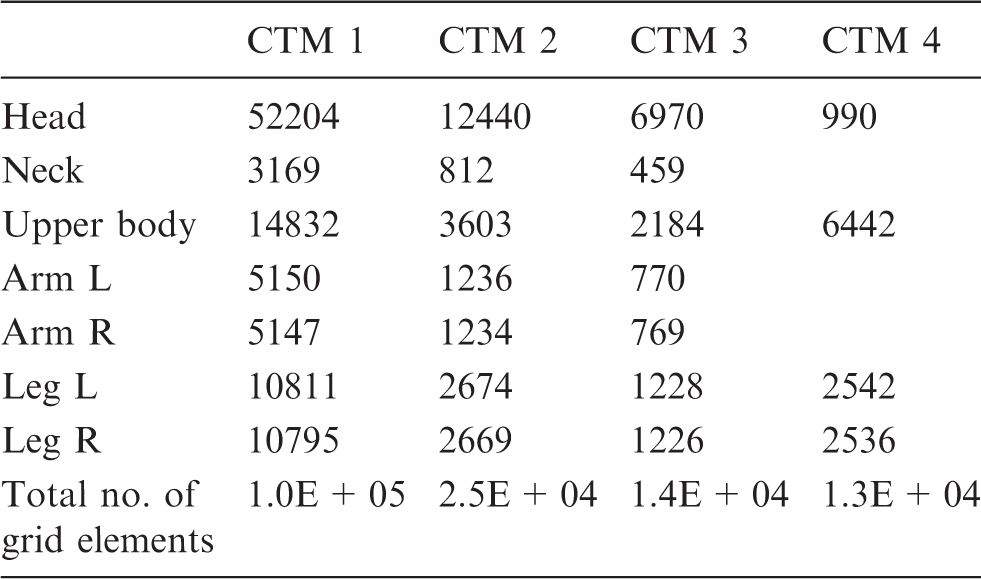
Grid information for different CTM models.
The thermal flow was modelled using the incompressible Navier-Stokes equations with the Boussinesq approximation accounting for the thermal buoyancy force. The Re-Normalisation Group K-epsilon (RNG k-ɛ) model was applied for the air turbulence due to its well-documented performance in predicting indoor airflows.27,28 The discretisation for advection terms was calculated with high-resolution advection scheme to achieve better robustness and accuracy. The equations were solved using the commercial computational fluid dynamics software CFX 14.5. 24
Results and discussions
Model validation
Numerical simulation was firstly preformed using the 3D-scanned CTM (CTM 1) to validate the CFD models. The predicted airflow field around the CTM (in the Y = 0 plane) is shown in Figure 5 and this was compared against the PIV image measured at ambient temperature of 26℃, given by Licina et al.
20
As shown in Figure 5, the CFD simulation achieved a similar airflow development pattern to the experimental image in the vicinity of the manikin. As the thermal buoyancy flow develops upwards along the manikin skin, two significant thermal plumes were observed from both experimental measurements and the numerical results above the vertically postured body segments, the torso and the knees. Comparatively, the thermal flow above the near-horizontal thighs was much weaker. The local high-speed regions such as those in front of the chest and face were successfully captured. In Licina et al.’s experiments,
20
higher air velocity was detected near the upper torso (Figure 5(a)) where the thermal plume detached itself from the manikin. Both the detachment and the high air velocity region were successfully predicted in the CFD simulations (Figure 5(b)). Although minor deviations between the PIV data and numerical results were detected in some bulk regions, the main effects of the thermal plume on the airflow acceleration near the manikin body were captured.
Comparison of overall velocity contour in front of the sitting manikin; (a) PIV image by Licina et al.
20
at 26℃, (b) Velocity contour predicted using CFD at 26℃.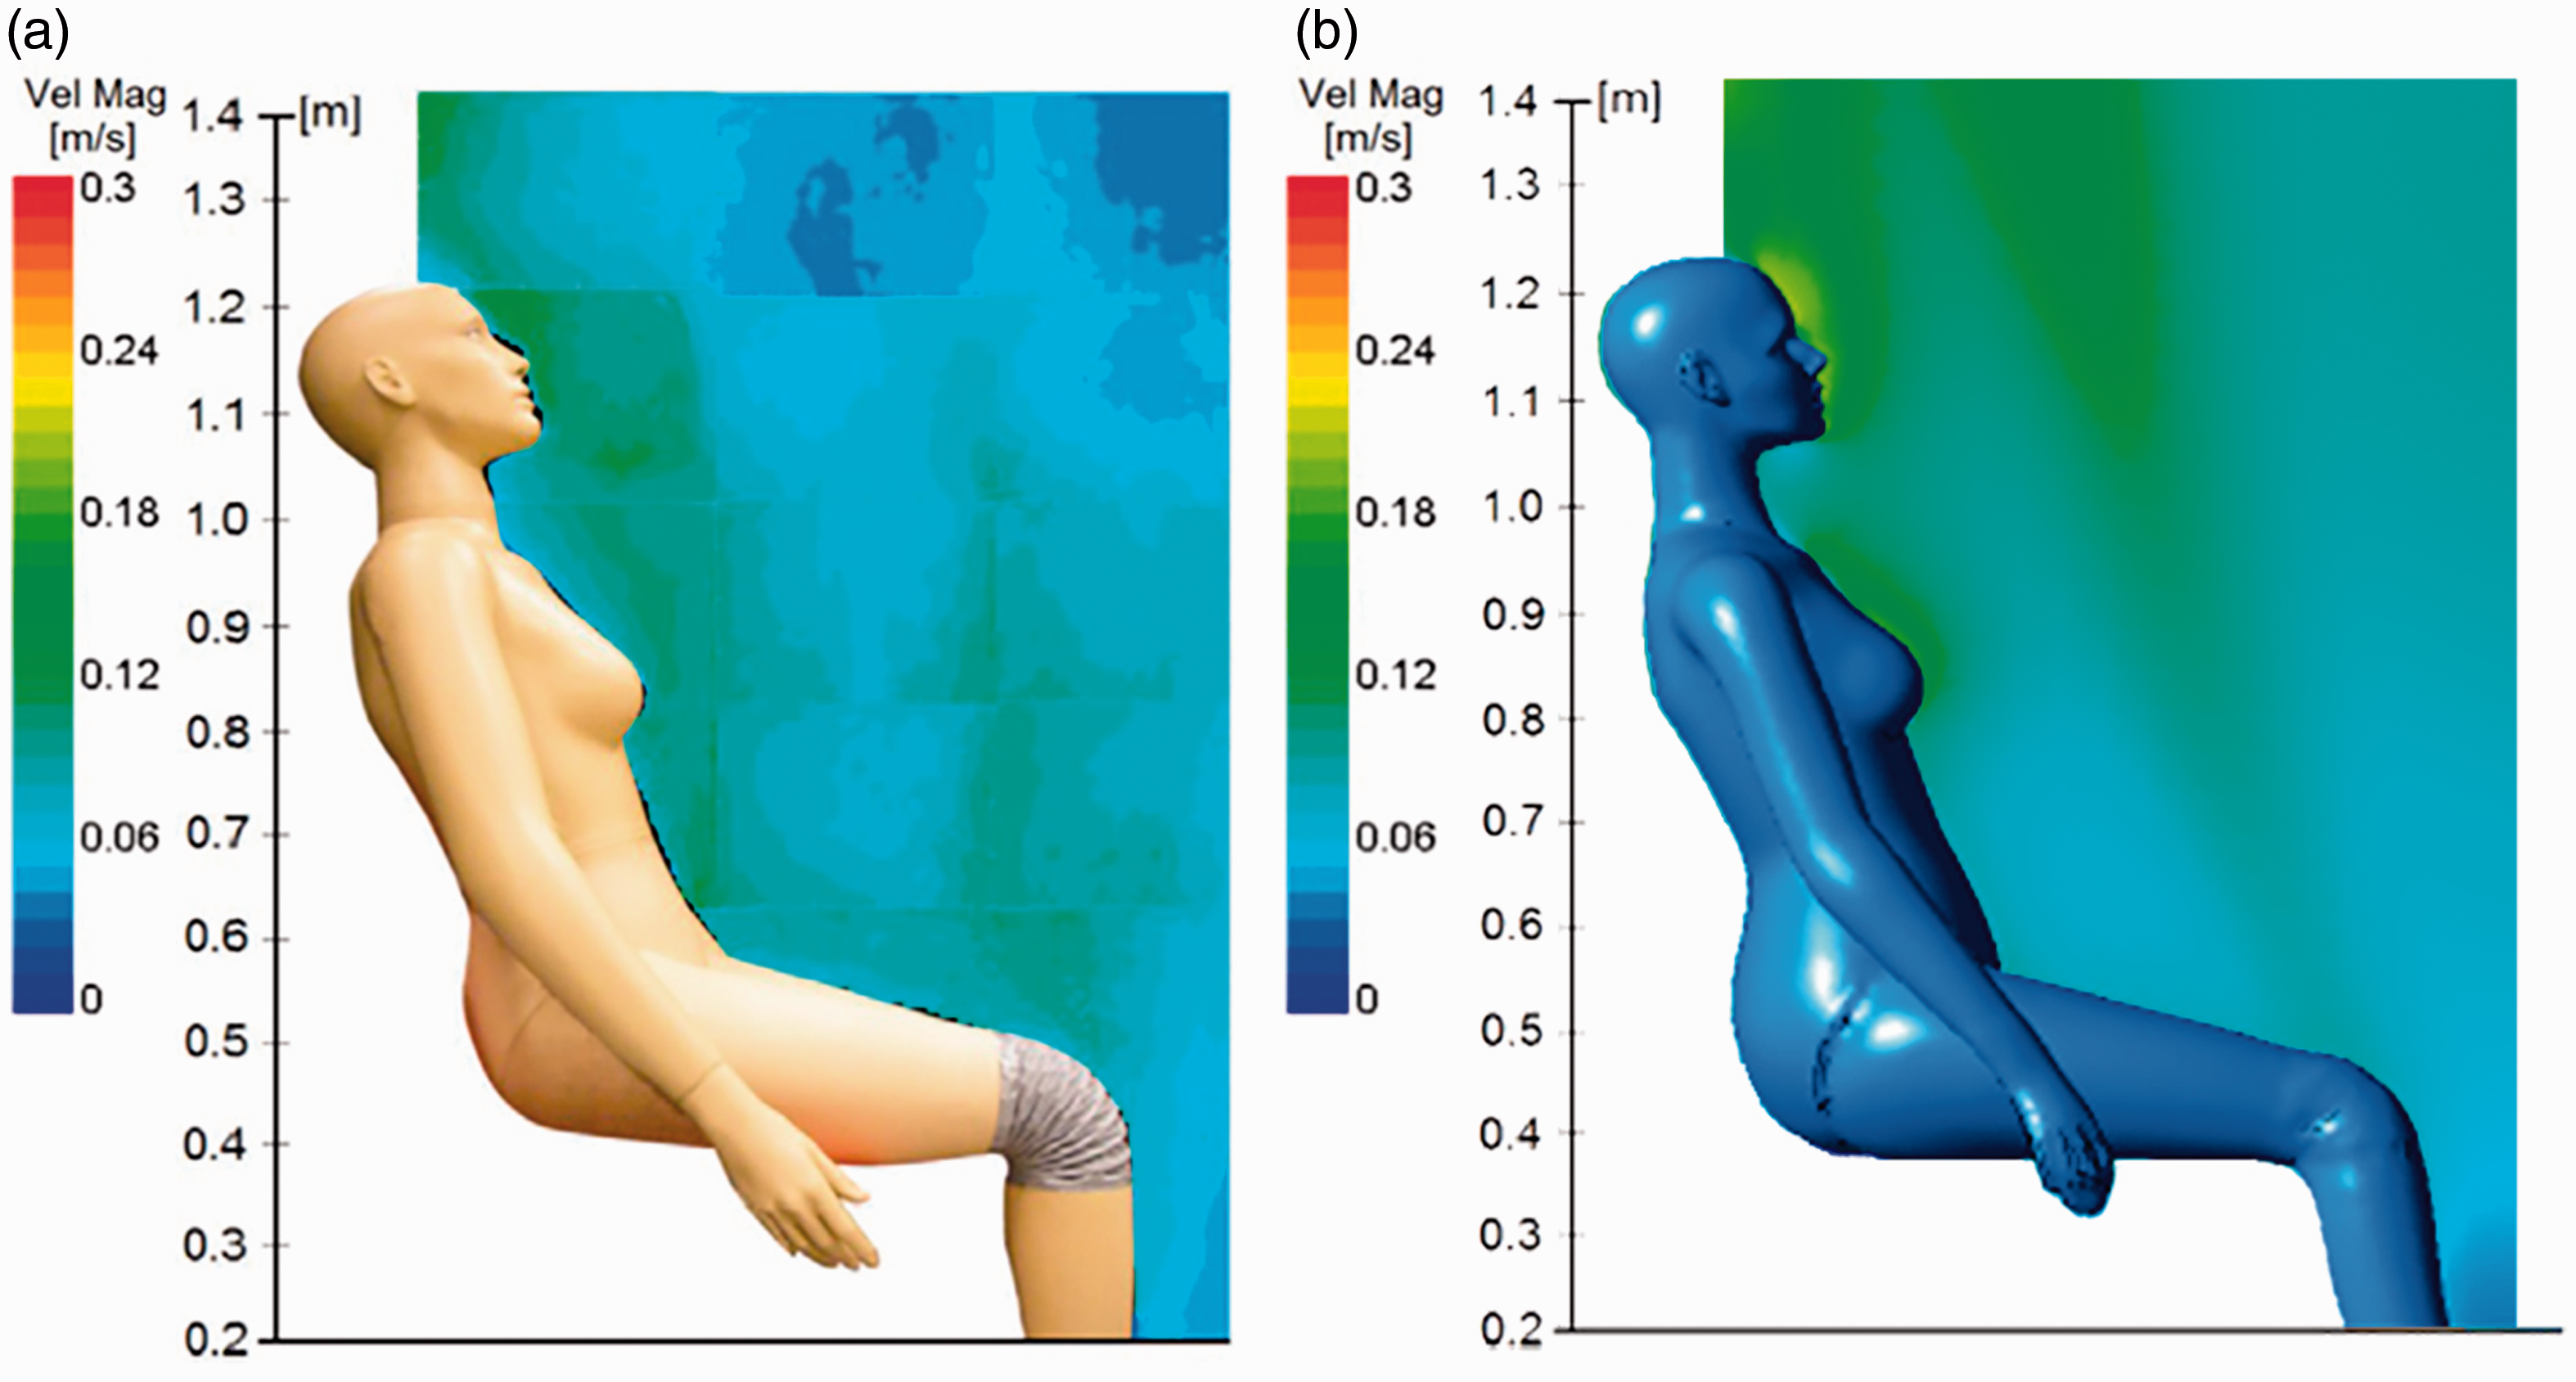
Licina et al.
20
found in their experiments that the convective boundary layer of the thermal manikin fell within a range of 10–30 mm from the surface of the manikin body. They measured the air velocities at 10 positions of different heights and 30 mm offset from the manikin surface. The predicted air velocity at corresponding positions were extracted and compared against the experimental data, as shown in Figure 6, which demonstrated that the predicted air velocity at the selected positions agreed well with the experimental data. The average predictive error was approximately 3.9%, with the maximum value appeared at the lowest height location (Z = 0.4 m). This local error was supposed to be induced by the slightly different crus angle between the experimental manikin and CTM 1.
Quantitative comparison of the air velocity at selected positions.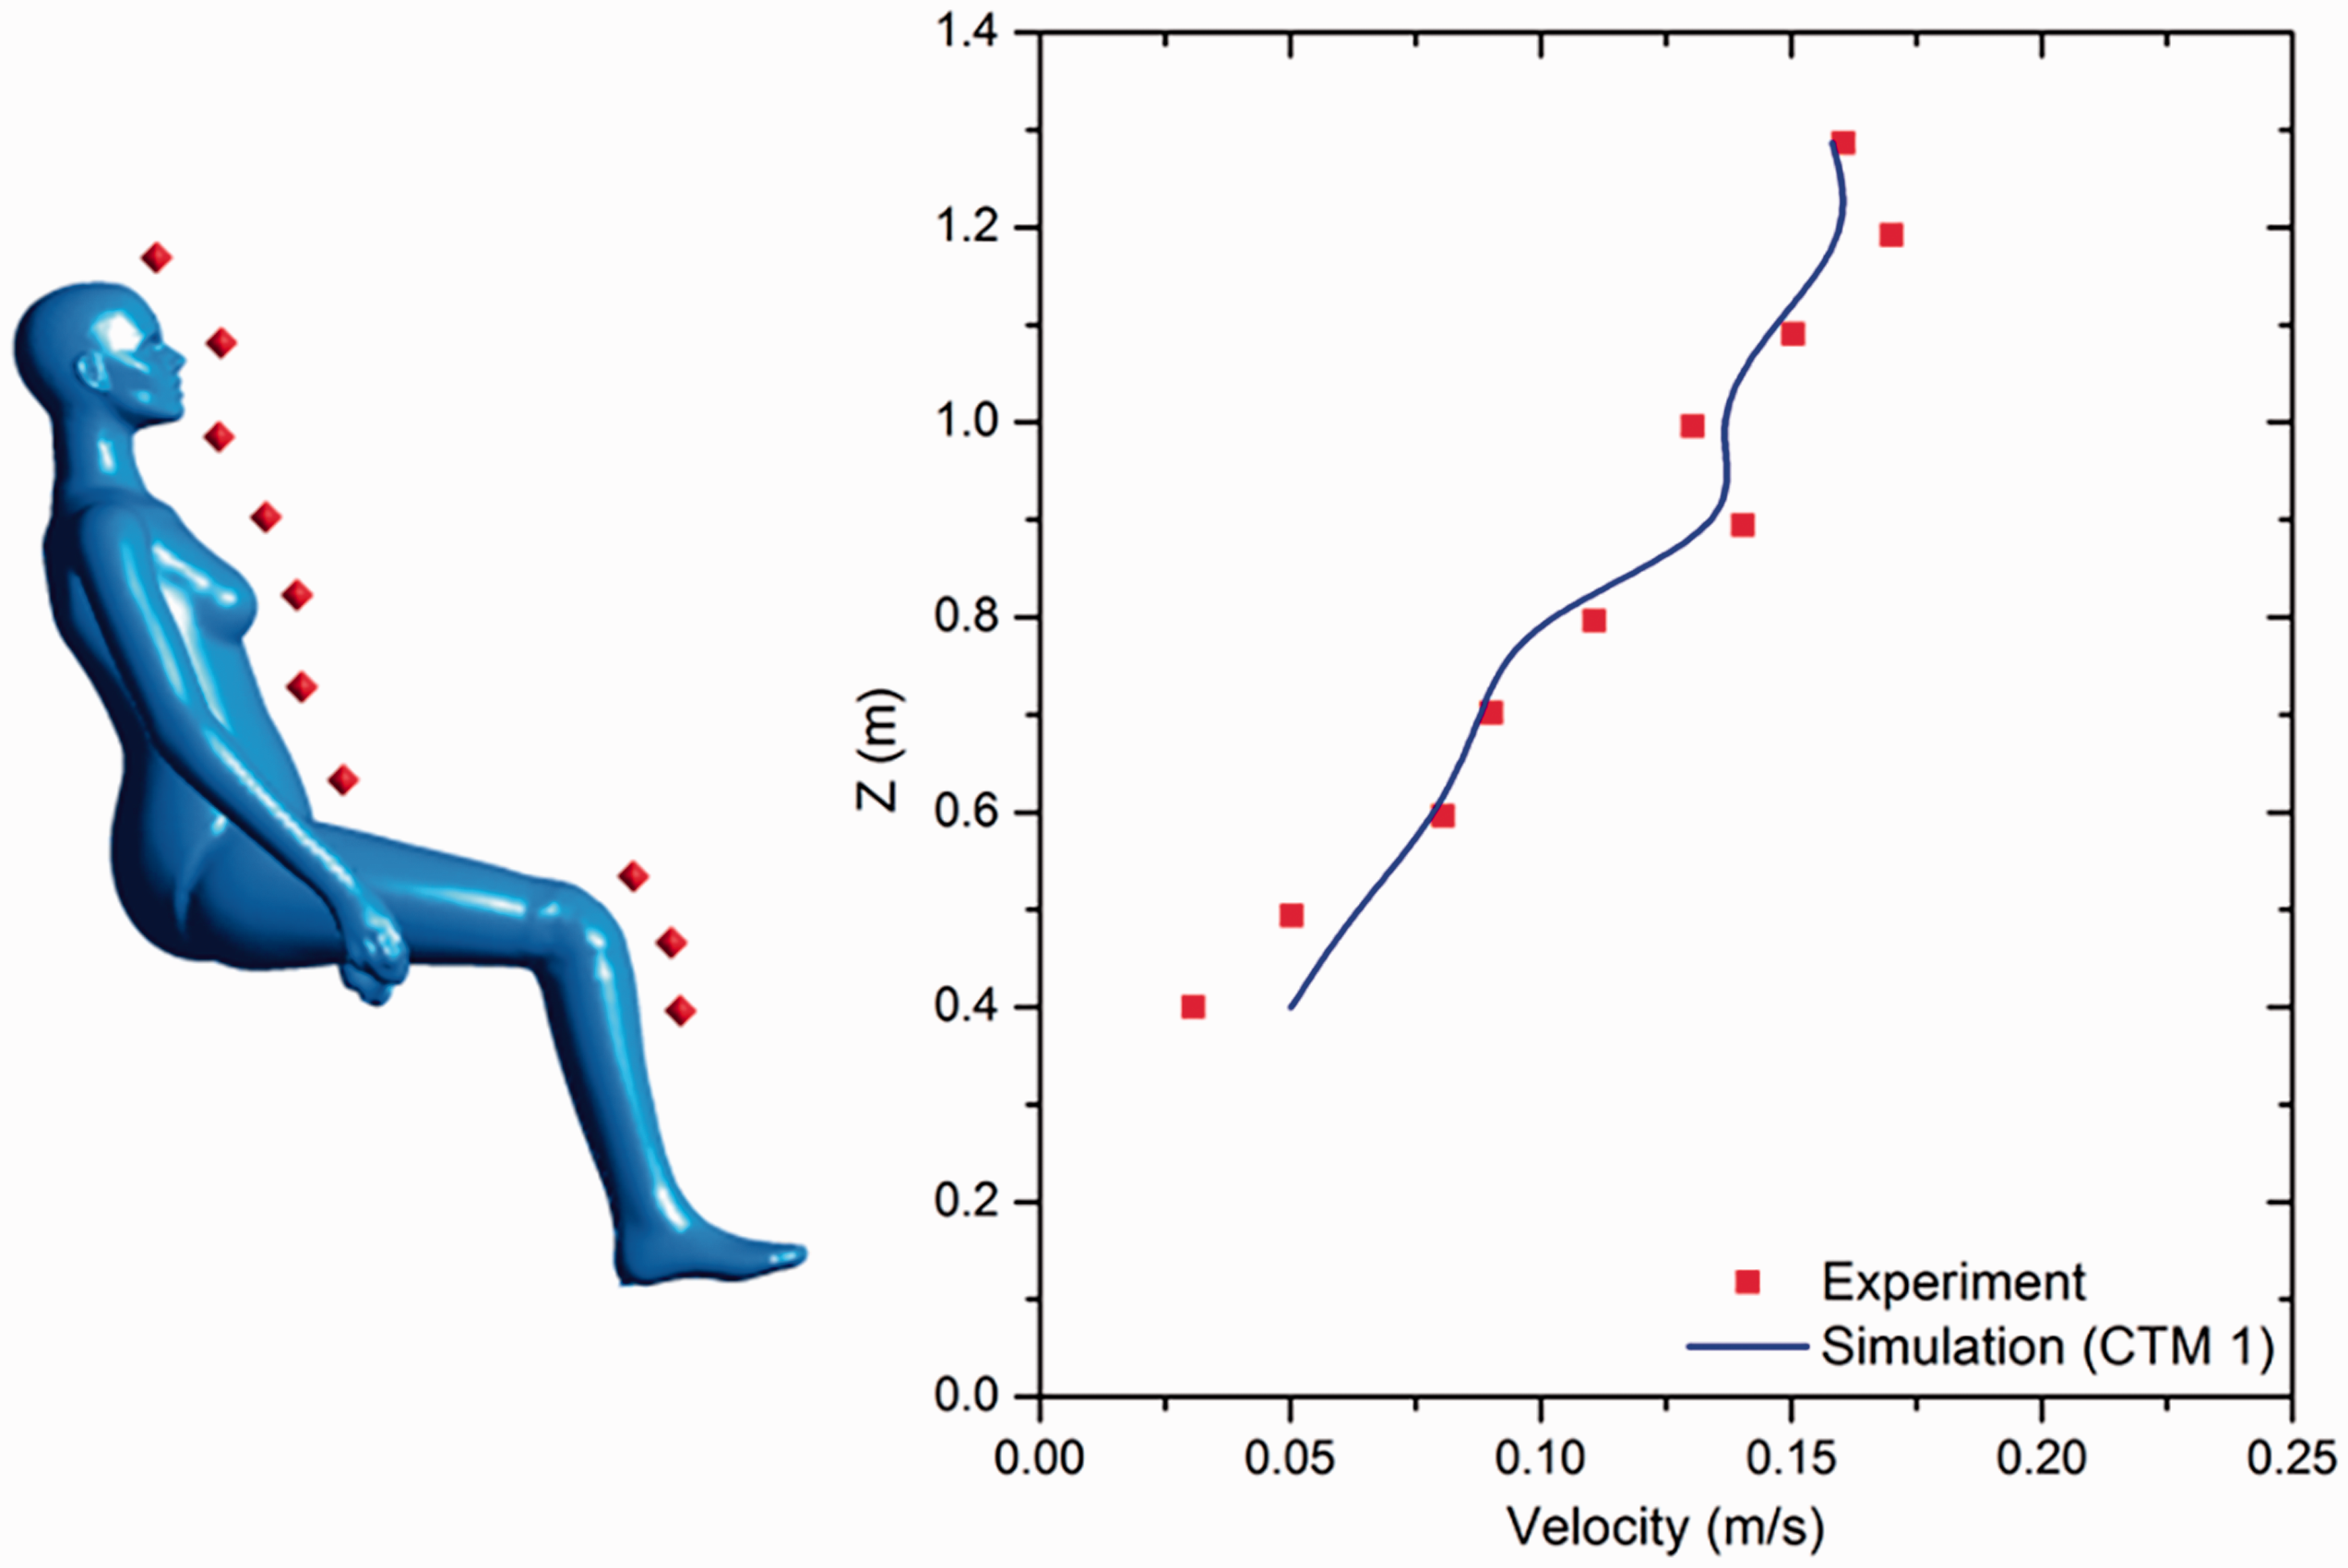
The predicted local airflow field in the breathing zone was also compared against the experimental data, as shown in Figure 7. Both the velocity magnitude and the vector directions were successfully predicted. According to Figure 7, the breathing zone was dominated by a significant uprising buoyancy flow. Higher air velocity up to 0.2 m/s was found in the region between the chin and the nose tip, which agreed well with most experimental measurements reported in literature that the human thermal plume could induce a vertical air velocity of 0.1–0.2 m/s in the breathing zone.4,29–31
Comparison of velocity contour and velocity vector in the breathing zone; (a) PIV image by Licina et al.,
20
(b) Velocity contour predicted using CFD.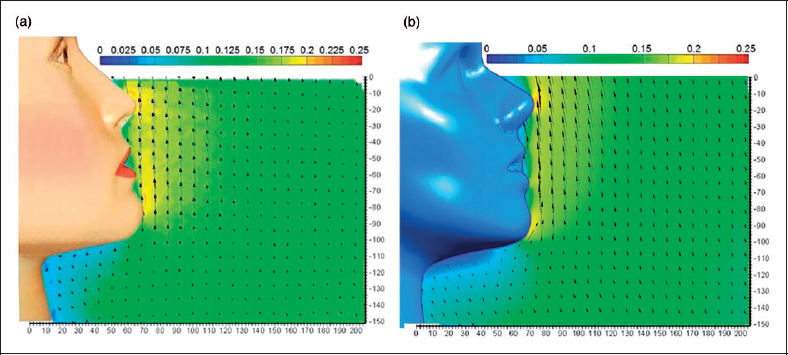
The predicted airflow field agreed well with the PIV measurements given by Licina et al., 20 both globally and locally. Thus, the CFD modelling of the thermal buoyancy flows driven by human body heat was proven effective and thereby a baseline for the following analyses and comparisons of CTM simplification could be established.
Effects of CTM simplification
In order to assess the predictive errors associated with CTM simplification, further CFD simulations were conducted using the aforementioned simplified CTMs (i.e. CTMs 2, 3 and 4), with numerical procedures and boundary conditions exactly the same as those for CTM 1.
The predicted air velocity profiles along three lines penetrating the computational domain were firstly analysed, as shown in Figure 8. Lines 1 and 2 were horizontal lines above the manikin, while Line 3 was positioned to be inclined and parallel to the manikin torso so that it was partially located in the thermal plume. The results indicated that the simulated room could be basically divided into two distinct regions: the thermally affected region and the bulk region. The thermally affected region included the thermal convective boundary layer around the manikin and the thermal plume above it. The bulk region was free from the thermal effects of the CTM. According to Figure 8(a) and (b), the simplification of CTM did not cause any noticeable change in the predicted airflow field in the bulk region (see the velocity profiles along Lines 1 and 2). However, the predicted air velocity profile in the thermally affected region was significantly changed when different CTMs were employed. This impact was especially significant in the thermal plume region above the manikin head. As shown in Figure 8(c), the predictive error of the local air velocity at Z = 2.25 m could be as large as 35% when CTM 3 was employed in place of CTM 1.
Velocity profiles along the selected lines; (a) line 1, (b) line 2 and (c) line 3.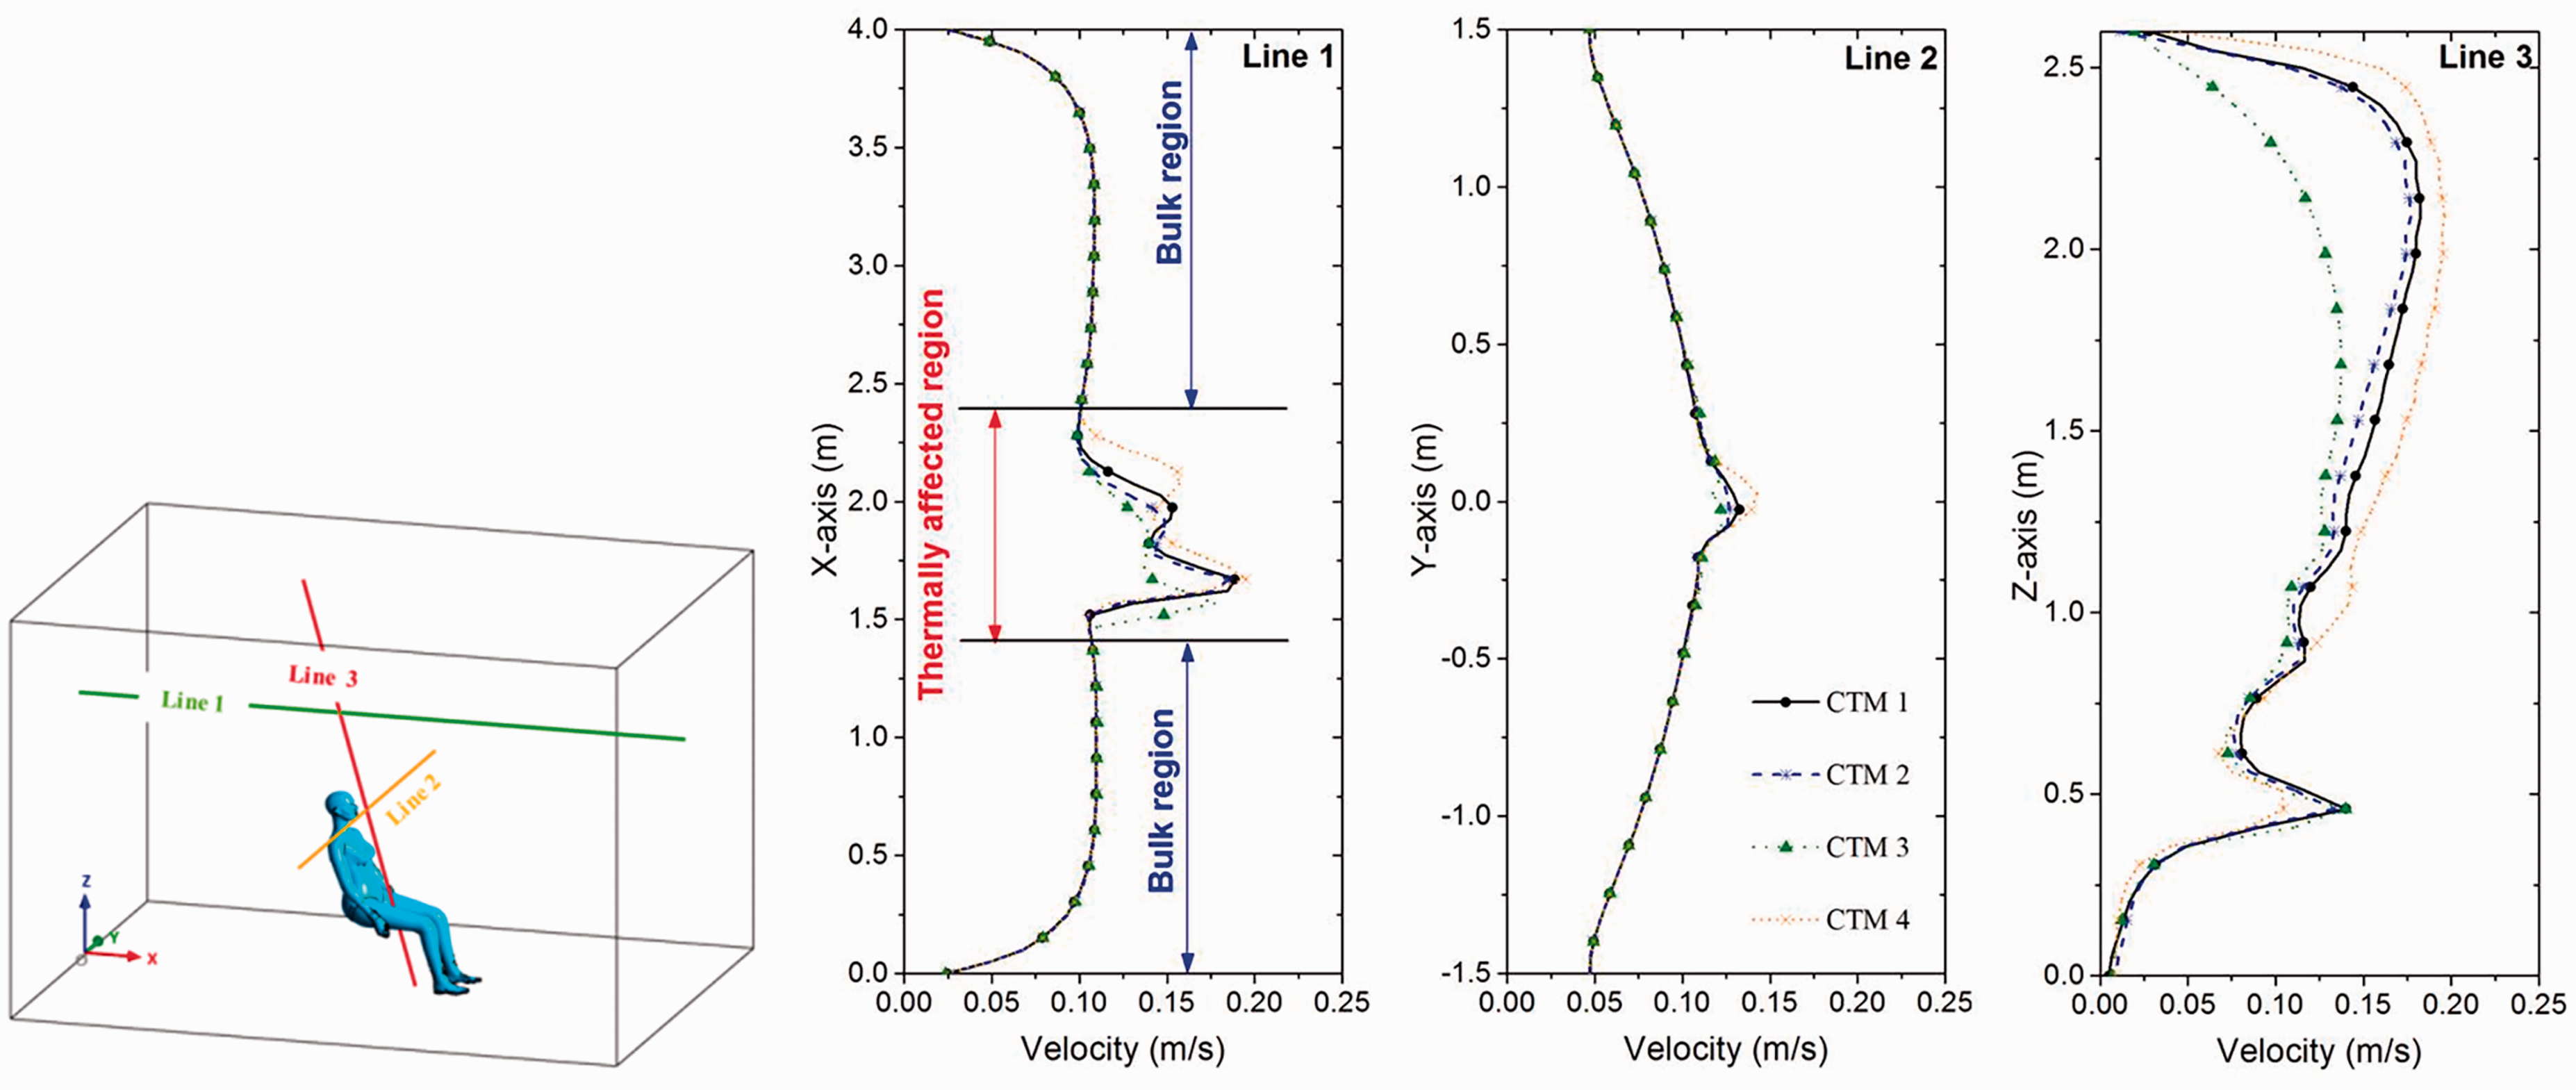
Due to the inherent complexity of coupled numerical computations, CFD simulations of complicated indoor physical and chemical processes were generally conducted using a step-by-step approach. The air velocity and temperature fields were firstly solved to provide an optimal initial field, and then based on that, the transport of contaminants was solved using the Eulerian or Lagrangian approaches. 32 The inaccuracy in the airflow field prediction could cause enlarged problems in the prediction of contaminant transport, which is especially true when the contaminants are released from the human body.
Figure 8 also reveals that all three simplified CTMs caused predictive errors relative to the baseline CTM. However, the magnitude of error varied with different CTMs. Comparatively, the prediction by CTM 2 was the closest to the baseline CTM.
The predicted air velocity and temperature fields in the vicinity of the CTMs are shown in Figure 9. For the convenience of comparison, the numerical results yielded from the baseline case (CTM 1) were also included. The visualised air velocity field (Figure 9(a)) and temperature field (Figure 9(b)) demonstrated that the thermal buoyancy flow developed upwards along the manikin surface. After departing from the manikin at the head, the flow kept accelerating until it reached its maximum velocity somewhere above the manikin head (Figure 9(a)). The comparison results indicate that the CTM geometry had a significant influence on the profile of the convective boundary layer. While CTMs 1, 2 and 3 yielded similar convective boundary layers near the CTM surface, CTM 4 generated a notably different convective boundary layer. In the region immediately above CTM’s head and shoulders, CTM 4 predicted a much lower air velocity than those by the other three CTMs (Figure 9(a)) while the air temperature was largely over-predicted by CTM 4 in the same region (Figure 9(b)). Because simple blocks and cylinders were used to represent the CTM 4 manikin, inevitably some sharp corners and dead regions in the airflow would be resulted. Applying a block-based CTM is thought to be a major source of error for CTM 4.
Effects of CTM simplification on prediction of velocity and temperature fields; (a) air velocity field and (b) temperature fields.
In addition, as the CTMs were slightly backward inclined, the buoyancy flow gained a horizontal velocity component. Thus, an inclined thermal plume was observed above the manikin head. Figure 9(b) shows that the thermal plume rose upwards, and then bended to the horizontal direction after hitting the room ceiling. When the overall developing processes of the thermal plumes were similar, the CTM geometry had a detectable effect on the thermal plume profile when different CTMs were employed. As shown in Figure 9(b), CTMs 1 and 2 generated almost the same thermal plume. The thermal plume yielded from CTM 3 had a larger horizontal velocity component, and consequently, it hit the room ceiling at a more downstream location. The thermal plume yielded from CTM 4 was significantly different from those of the other three cases, with the highest vertical velocity and the widest horizontal size of thermally affected region. Taking the numerical results generated with CTM 1 as the baseline, the predictive error induced by the simplified CTM was shown to increase with a degree of simplification.
The computations predicted that the maximum air velocity appeared at 20 to 26 cm above the manikin head, which agreed well with most experimental observations4,11,33 that the human thermal plume generally reaches its maximum speed 20–30 cm above the occupant’s head in a low-turbulent room. By defining the thermal plume region as that in which the air velocity was greater than 0.2 m/s, the outline profiles of the thermal plumes predicted using different CTMs at 25 cm above the manikin head are plotted in Figure 10.
Thermal plume regions (velocity > 0.20 m/s) at 25 cm above manikin head.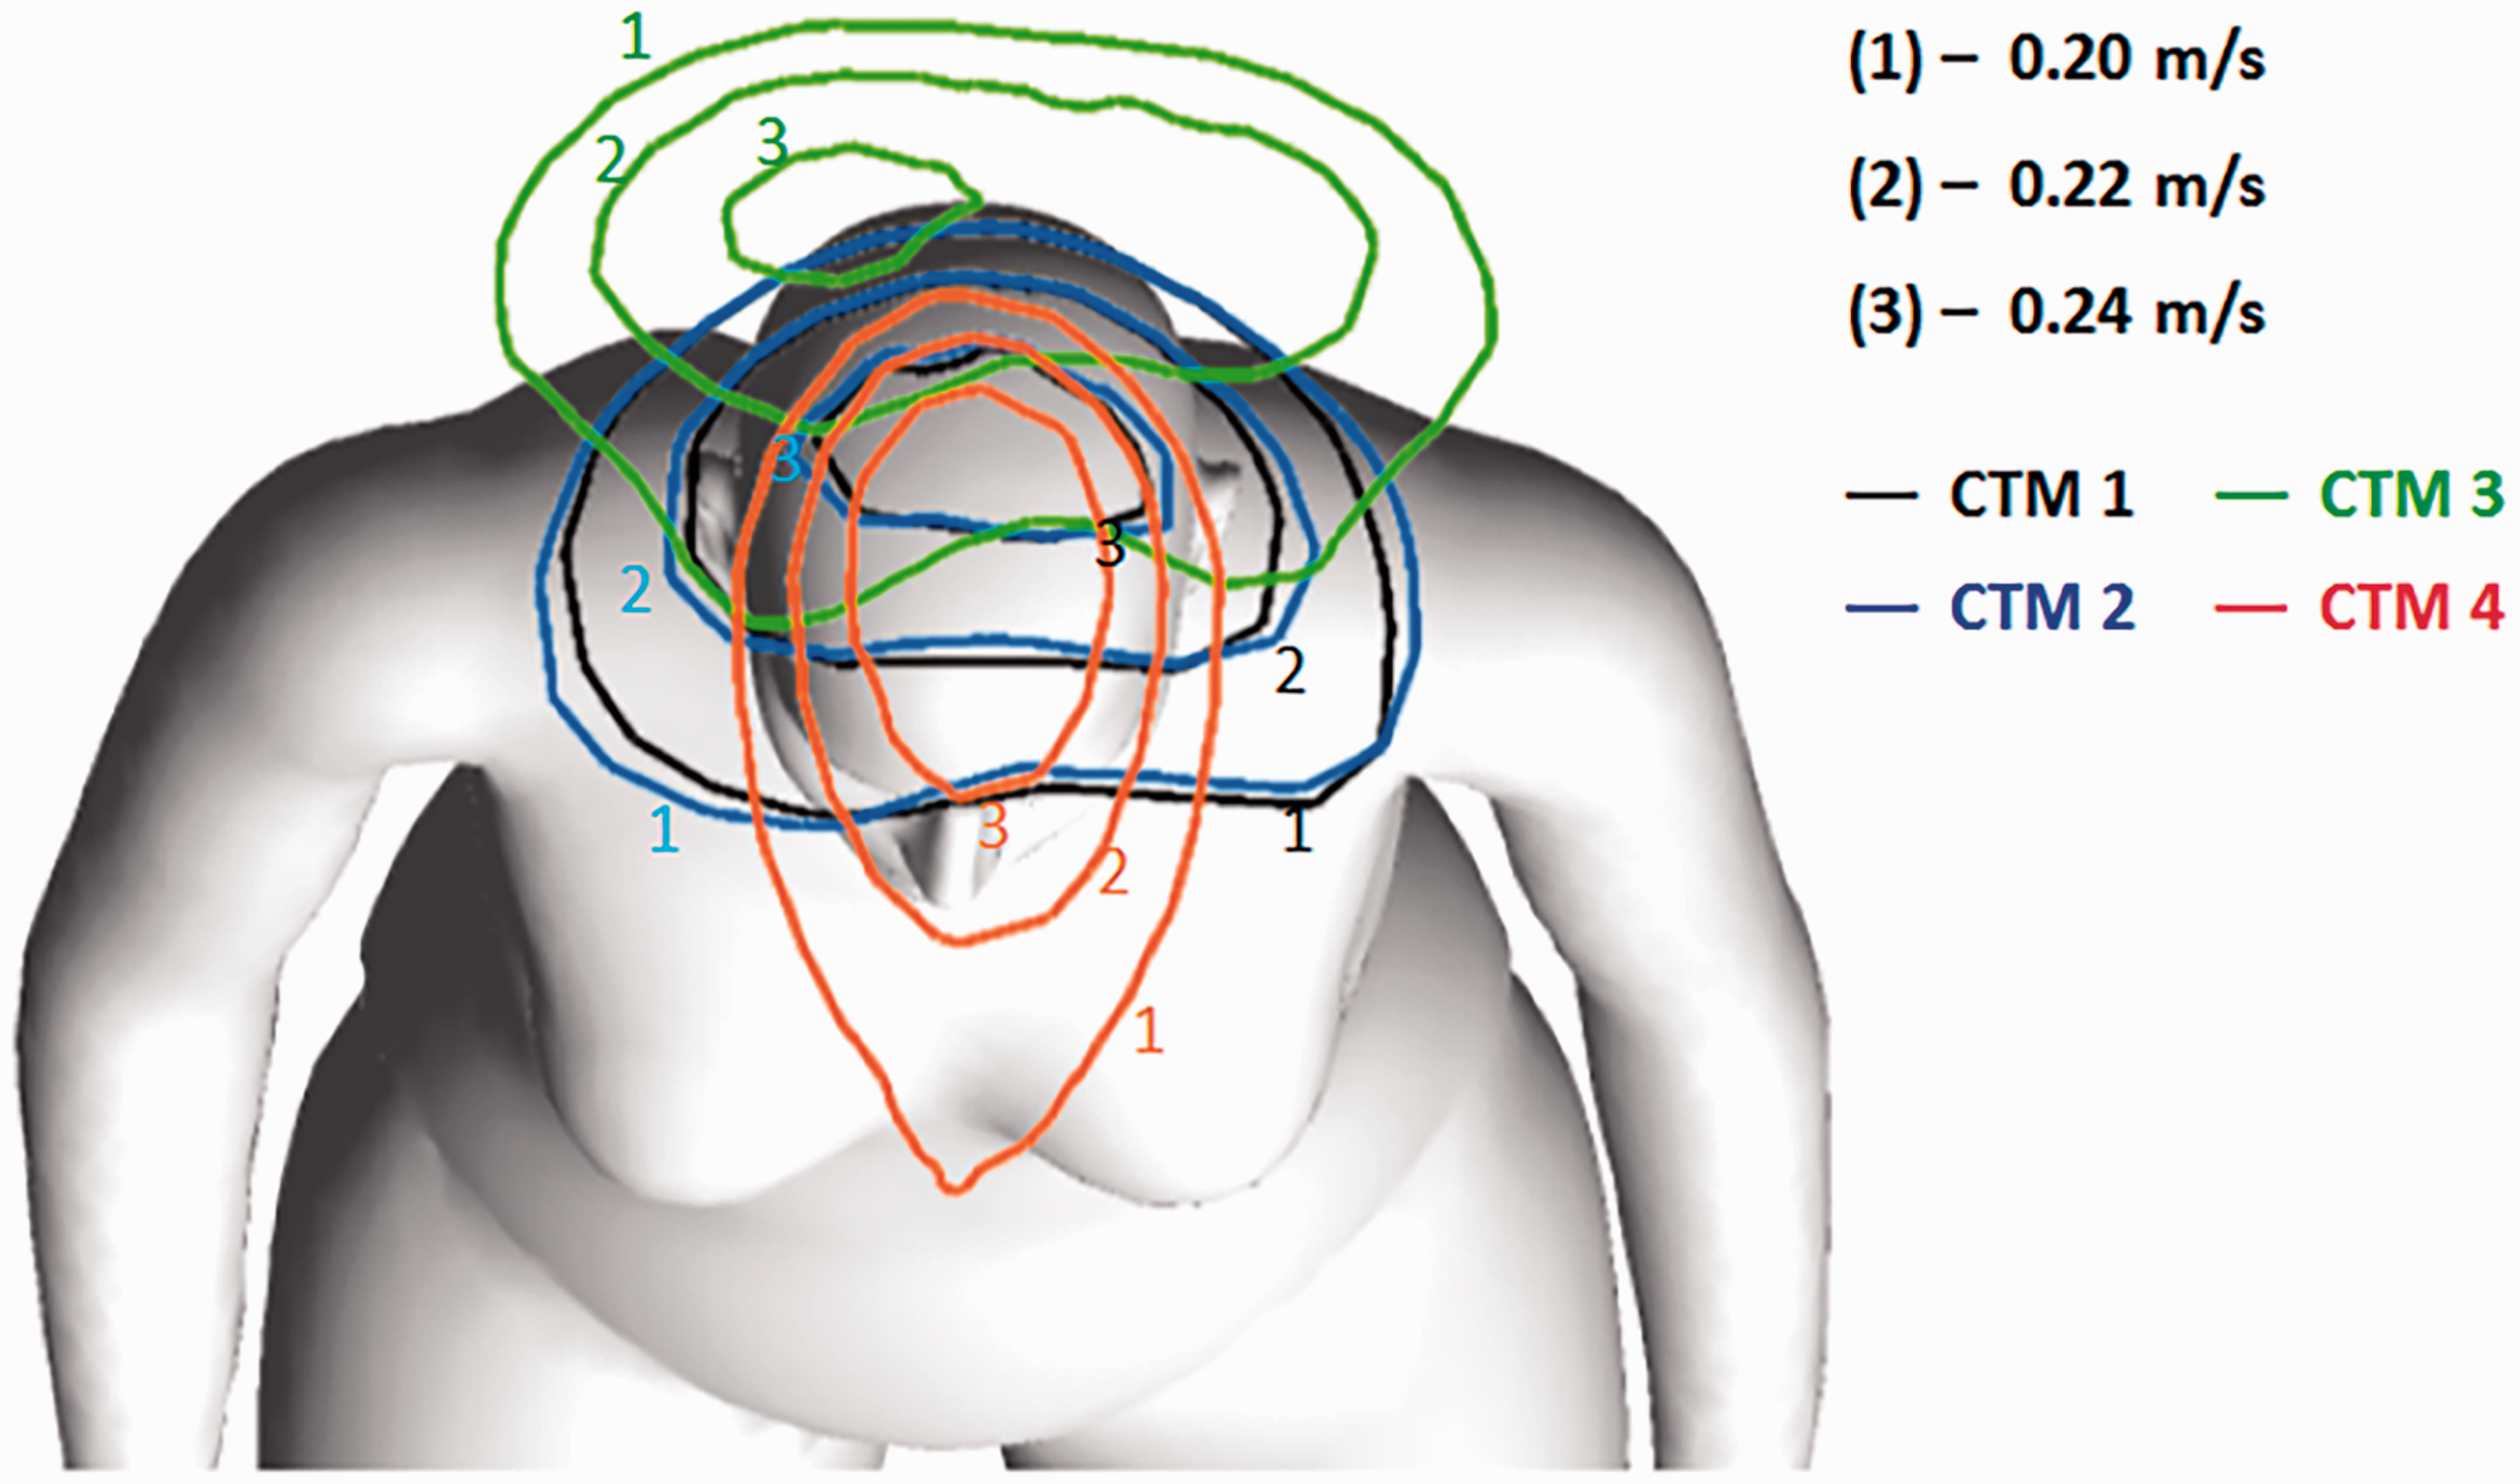
Figure 10 reveals that the predicted shapes of the thermal plume regions were significantly different depending on the CTMs employed. At the selected plane, the thermal plume outline yielded from CTM 1 took a near-semicircular shape and was right above the manikin head. CTM 2 achieved a prediction very close to that of the baseline case due to its slight change of overall geometric features from CTM 1. On the other hand, CTMs 3 and 4 predicted distinctly different shapes and locations of thermal plume. The thermal plume predicted with CTM 3 was significantly deformed from the semicircular shape and was located closer to the manikin back. CTM 4 yielded a smaller elliptic shape which was closer to the front of the manikin than that predicted with CTM 1.
The areas of the thermal plume regions, as shown in Figure 10, were calculated and are shown in Figure 11. In terms of the overall thermal plume area at the selected horizontal plane, simulation with CTM 2 predicted the results closest to those of the CTM 1 case with an acceptable error of less than 6%. Also, by presenting the area of the thermal plume under various velocity ranges, over 55% of the illustrated thermal plume region was found in all cases with velocities ranging from 0.2 m/s to 0.22 m/s. Under this main velocity range, the CTM 2 case also generated a very close prediction to that of the baseline case (CTM 1), with an acceptable error of less than 5% of the thermal plume area. In contrast, the errors of CTMs 3 and 4 were 14.8% and 18.1%, respectively.
Area of thermal plume region under various velocity ranges.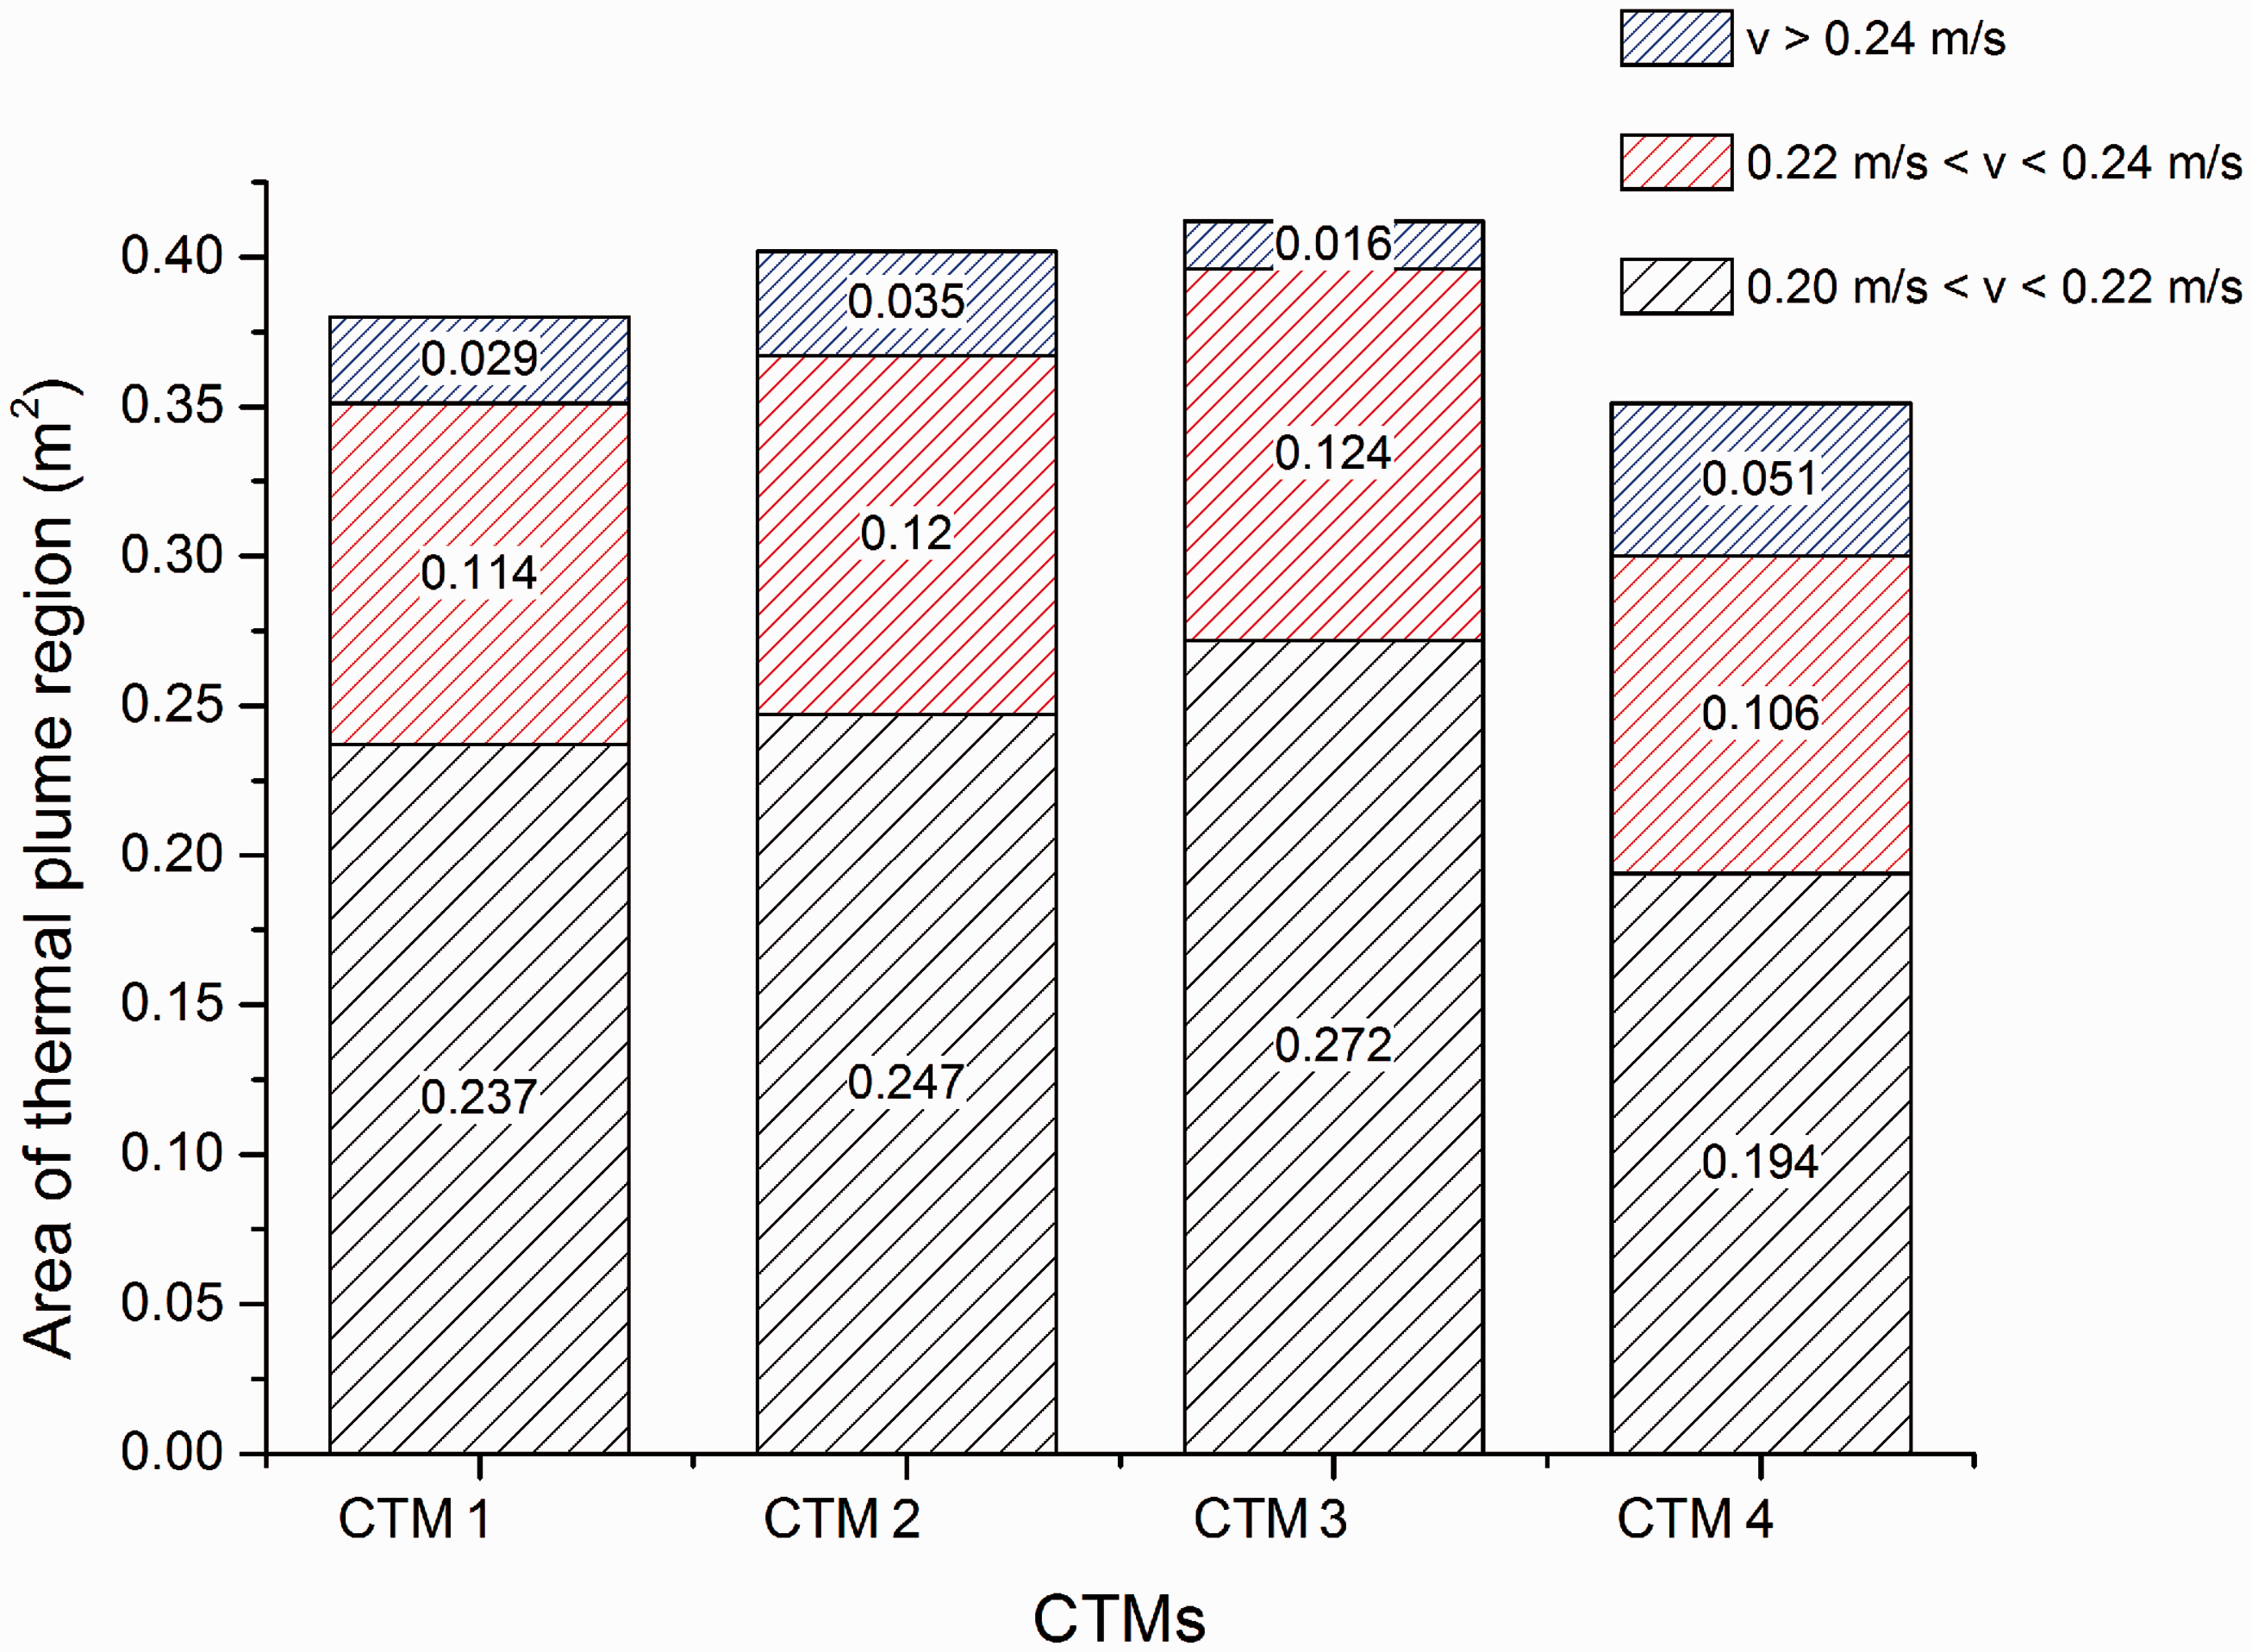
In summary, this study demonstrated that, although the simplified CTMs did not notably affect the predicted airflow field in the bulk region, the characteristics of the predicted thermal buoyancy flow around the manikin were highly sensitive to the geometrical features of the CTM. Changing the CTM geometry would inevitably affect the outline of the thermal plume. Among the three simplified CTMs investigated in this study, CTM 2, which was obtained through smoothing the 3D-scanned manikin (CTM 1) and deleting unnecessary body features, achieved a satisfactorily accurate prediction of the thermal buoyancy flow with an error of less than 5%. Comparatively, the CTMs rebuilt based on the skeleton structure (CMT 3) and the surface area (CMT 4) caused significant predictive errors. Also, according to Table 5, the number of the mesh element on the CTM surface which was required to achieve a mesh-independent computation was reduced to over 75% after the surface smoothing (CTM 1 to CTM 2). This would be of great importance in reducing the computational cost of CFD simulations while retaining an acceptable predictive accuracy. For the rebuilt CTMs (CTMs 3 and 4), considerable errors caused by simplification were the main drawbacks, although they could help further reduce the mesh density on the CTM surface. Therefore, the CTM simplifying approach through surface smoothing is more promising. This is especially true when the regions of interest are close to the occupants.
Simplifying CTMs through surface smoothing provides a robust approach to delete the redundant body features while preserving the key geometrical features, which would contribute to a largely improved computational efficiency without significantly sacrificing the quality of the numerical results. However, the smoothing approach presented in this study is not quantitative, and the degree of CTM simplification could be hard to control. Alternatively, the blooming computational geometry has brought out a number of advanced surface smoothing and simplifying algorithms such as the directed anisotropic diffusion algorithm 34 and the mesh decimating algorithm. 35 These algorithms could simplify the local geometrical details by preserving the overall and key geometrical features. Therefore, there could be a quantitative and controllable approach to simplify the CTMs for CFD computations of the thermal buoyancy flows by human body heat, and these will be investigated in our future studies.
Conclusions
The thermal buoyancy flow driven by the human body heat in quiescent indoor air was simulated using a 3D-scanned CTM. The predicted airflow field agreed well with the PIV measurements by Licina et al. 20 Comparisons of the predicted airflow fields between the simplified CTMs and the baseline CTM have demonstrated that the simplified CTMs did not have any detectable effects on the airflow prediction in the bulk region. However, the predicted airflow in the thermally affected region was highly sensitive to the approach of the CTM simplifications. The CTM generated through surface smoothing (CTM 2) achieved a very close prediction as compared to the baseline case with an error of less than 5%, whereas the predictive errors associated with the skeleton-based (CTM 3) and the surface-area-based (CTM 4) CTM simplifying approaches were 14.8% and 18.1%, respectively. Using the surface smoothing approach, the required number of the mesh elements on the CTM surface to achieve mesh-independency could be reduced by 75%, which would certainly contribute to an improved computational efficiency while maintaining a reasonable predictive accuracy. Therefore, the CTM simplification approach based on surface feature smooth was recommended for the future work.
Footnotes
Authors’ contributions
YY conducted the numerical simulations, analysed the results and drafted the manuscript. XL helped analyse the results and contributed to the drafting. JT is the supervisor of the research project. He gave important advices on the simulations, and provided the overall review of the paper writing.
Declaration of conflicting interests
The author(s) declared no potential conflicts of interest with respect to the research, authorship, and/or publication of this article.
Funding
The author(s) disclosed receipt of the following financial support for the research, authorship, and/or publication of this article: The financial supports provided by the National Basic Research Program (973) of China (Grant No. 2012CB720100), the Australian Research Council (project ID LP110100140) and the Natural Science Foundation of China (Grant No. 21277080) are gratefully acknowledged.