
Abstract
Indoor radon, thoron and progenies are major contributors to the indoor radiation dose which have been measured by our study for different types of dwellings during four seasons of a year. The indoor radon, thoron and progeny levels observed in the present study found to vary with seasons of a year. The average highest radon, thoron and progeny were observed during winter and the corresponding lowest values were observed during summer. The highest 222Rn, 220Rn and progenies concentrations were observed in mud houses and the lowest values were recorded in wooden houses. A good correlation with a correlation coefficient of 0.85 was observed between indoor 222Rn and concentration of its grandparent 238U in underlying soil. A moderate correlation was found between 220Rn and 232Th concentration in underlying soil. The effective dose received by the general public in the present study due to radon and thoron was estimated as 1.43 and 1.13 mSv y−1, respectively. The 222Rn and 220Rn progenies contribute 0.79 and 0.25 mSv y−1, respectively to the annual effective dose received. The inhalation dose received by the general public of the study area due to these airborne isotopes 3.69 mSv y−1 is less than the action limit of International Commission of Radiological Protection (ICRP) (2009).
Introduction
Human beings have been exposed to radiation arising out of natural radioisotopes found in the ground, air, water, food materials and cosmic radiation together with a contribution from anthropogenic radioisotopes. Environmental background radiation varies considerably due to local geological features, lifestyle, food habits and atmospheric conditions. About 87% of the total radiation dose received by the general public is from natural sources 1 and this emphasizes the importance of its knowledge for an environment. Natural radiation exposure to the general public can be classified into two, namely: external and internal exposures due to the existence of the source of radiation. External exposure comes mainly from the gamma emitters in the environment which have an impact on human health and can be harmful to human beings due to the high penetrating property of gamma rays. Airborne radioisotopes and radioisotopes present in food materials and drinking water enter the human body through inhaled air and consumed food materials, which result in internal radiation exposure.
Airborne radon and its short-living decay products are the most important contributors to natural radiation exposure for the general public. The United Nations Scientific Committee on the Effects of Atomic Radiation (UNSCEAR) (2008) estimates that the radiation dose received from airborne radon and its daughter products contributes about 50% of the total dose received by the general public. 2 Radon 222Rn and its short-lived daughter products are considered the second leading causes of lung cancers after tobacco. 3 As such, there has been much concern about the activity concentrations of indoor radon, thoron and progenies in the indoor environment.
The activity concentration of radon, colourless, odourless and a chemically inert gas in the environment is dependent on (i) the activity concentration of its grandparent 238U and its decay products, (ii) radon emanation and (iii) radon exhalation. The activity concentration of 238U in the environment depends on the geological and geographical condition of the location and type of building materials used. The emanation depends on the recoil length 4 and on the grain size. Exhalation is affected by geophysical and hydrometeorological parameters. 5
Indoor radon and thoron activity concentration also depends on ventilation conditions of the dwellings and the season of the year. 6 Since radon is an inert gas it can diffuse easily out of the soil surface into air in indoor environment. It can be trapped in poorly ventilated houses and so its concentration can build up to higher levels. The build-up of radon concentration in enclosed areas may pose a risk to human health. In enclosed areas, radon and its products are attached to dust particles and enter the human body by inhalation, where lung tissues have been irradiated by alpha particles produced during disintegration. Several studies have been conducted on the radon concentrations in the indoor environment and its effect on human health.7–11 In order to find the indoor radiation dose received, the concentration of radon, thoron and progenies in residential places of Coonoor, South India has been undertaken. This study is a part of a systematic study of natural environmental background radiation of important places on Western Ghats in South India. 12 Several types of building materials brought from different places have been used in the construction of residential dwellings and the local soil contains a high concentration of primordial radionuclides 12 also used as an important building material which alters the indoor airborne radioisotope concentration. Poor ventilation is maintained in the dwellings to protect them from the cool environment, which plays an important role in deciding indoor radon, thoron and progenies concentration. Under these conditions the knowledge of indoor radon, thoron and progenies concentrations is important and hence this study has been undertaken. The importance of this study is increased because a study of radon and thoron has not been conducted previously in this area.
Materials and methods
Study area
Coonoor, one of the more populated areas on the Eastern side of Western Ghat of peninsular India, was selected as the study area. Coonoor is a hill station situated at the meeting point of Eastern and Western Ghats on the Nilgiri mountain range with latitude 11° 35′ N and longitude 76° 82′ E and average altitude 1850 m above mean sea level. Figure 1 shows location of study area in the South India. The houses that were constructed in the study area can be classified into four types based on the construction materials. Concrete houses were constructed with clay bricks, cement concrete and floors were laid with ceramic tiles and the concrete roof. Tiled houses were constructed with clay brick, cement concrete and floors were made with cement and roof with clay tiles. Mud houses were constructed with locally available stones and pasted with mud and floor was also made out of mud. These types of houses have lots of pores in walls and floors. Wood is the main construction material used in wooden type houses. In this type of houses, walls, floors and roofs are covered with wood. Being a hilly area, the general public spends most of their time indoors. The radon, thoron and daughters concentrations in the indoor environment were estimated using LR 115-based Solid-State Nuclear Track Detector (SSNTD). The results obtained are presented in this paper.
Location of study area Coonoor.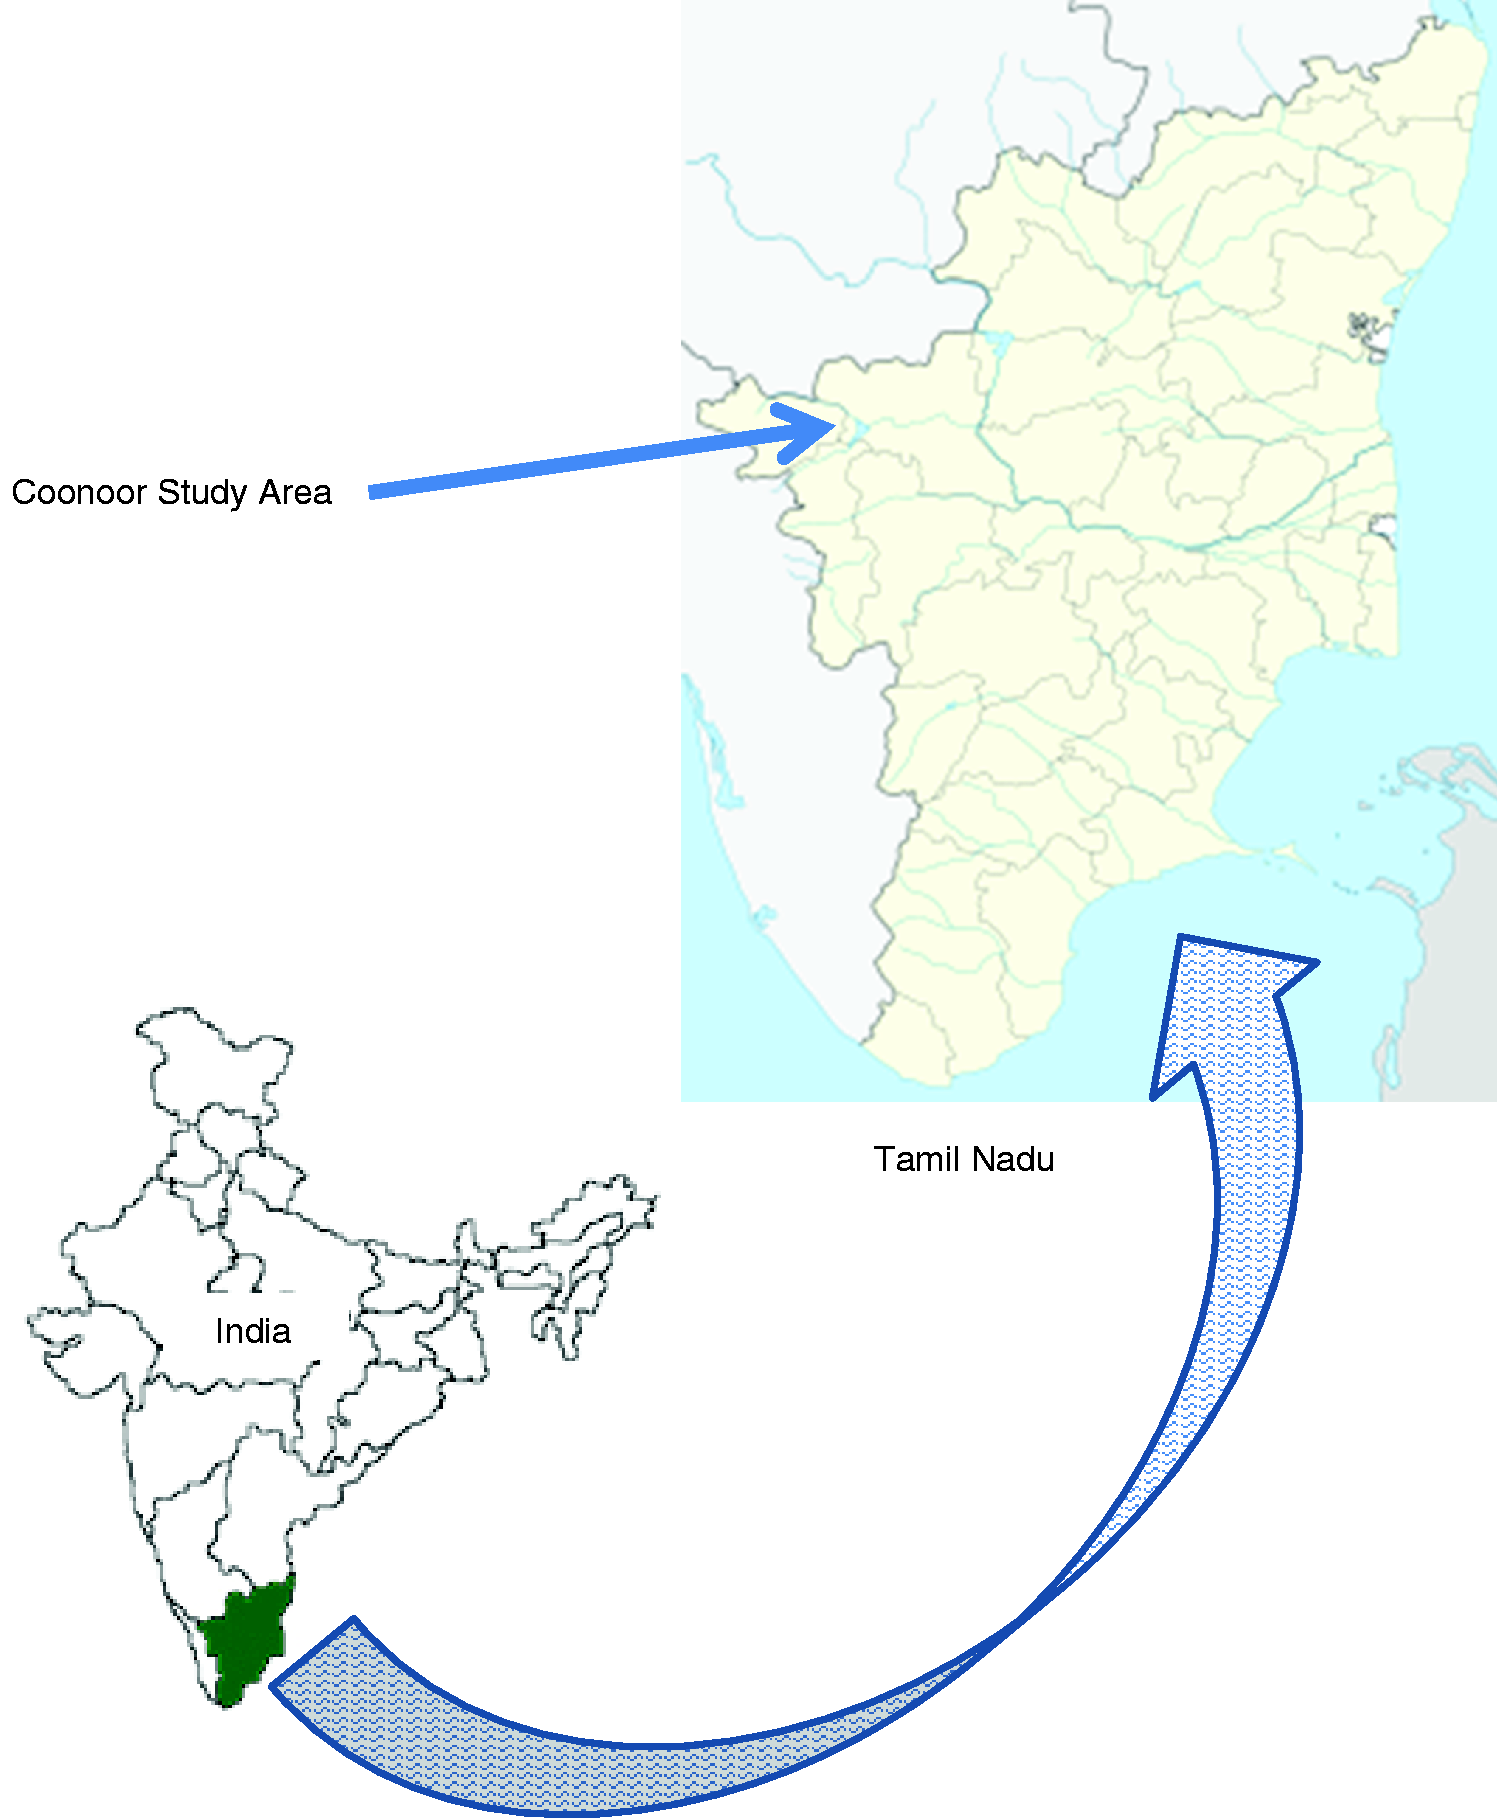
Radon and thoron measurement
The measurements of radon, thoron and progenies were carried out using the LR-115 type II plastic track detector loaded in twin chamber plastic dosimeters.13,14 Compartment 1 was closed with a semipermeable membrane (e.g. latex, cellulose nitrate, etc.) of 25 µm thickness which allows uptake of radon, the SSNTD film placed in this chamber registers track only due to radon.15,16 The compartment 2 was covered with a glass fibre filter paper, of a thickness 0.56 mm which allows both radon and thoron gases to diffuse in and hence the tracks on the SSNTD film placed in this compartment were produced by both these gases. The SSNTD film exposed in the bare mode (placed on the outer surface of the dosimeter) registers alpha tracks attributable to both these gases and their alpha-emitting progeny, namely: 218Po, 214Po, 216Po and 212Po.
14
The dosimeters were suspended inside the house at a height of about 1 m from the floor. After an exposure time of about three months, films were replaced with fresh ones for the estimation of seasonal variation. The exposed films were etched in 2.5 N NaOH solutions for 2 h at 60℃ in a constant temperature bath. After etching, the detectors were peeled off from the plastic base and registered tracks were counted using a spark counter.
17
From the counts obtained and area of the film the track density was calculated. The minimum detectable limit for radon and thoron was 5 and 1 Bq m−3, respectively, whereas for radon–thoron progenies, this was 0.6 mWL. The background subtracted track densities were used for the estimation of radon and thoron concentration using equations (1) and (2), respectively13,14


ρm ⇒ track densities in membrane mode (cm−2)
ρf ⇒ track densities in filter mode (cm−2)
Krm ⇒ 0.019±0.003 cm−2 d−1 (Bq m−3)−1
Krf ⇒ 0.020 ± 0.004 cm−2 d−1 (Bq m−3)−1
Ktf ⇒ 0.016 ± 0.005 cm−2 d−1 (Bq m−3)−1
d ⇒ exposure period
The potential alpha energy concentration due to radon and thoron progenies was estimated from radon and thoron concentration using the equilibrium factor for radon (FR = 0.4) and thoron (FT = 0.1) as recommended by UNSCEAR.2,18
Twin chamber dosimeters loaded with LR 115 type II-based SSNTD detectors were placed in more than one hundred residential places distributed throughout the study area for the estimation of radon, thoron and progenies concentration.
Gamma ray-spectroscopy
A 3″ × 3″ NaI(Tl) detector-based gamma ray spectrometer was used for gamma ray spectral measurements to enable measurement of the entire energy range of the naturally occurring radionuclides up to 3 MeV (to cover 2.6 MeV energy emitted by 208Tl, one of the daughter products of 232Th). The detector was shielded by 15 cm thick lead on all sides including at the top to reduce background due to cosmic ray component by almost 98%. The inner sides of the lead shielding were lined by 2 mm thick cadmium and 1 mm thick copper to cut off lead x-rays and cadmium x-rays, respectively. These graded-lining shield materials further reduced the background radiation especially in the low energy region. Standard sources of the primordial radionuclides obtained from International Atomic Energy Agency in the similar geometry and having soil equivalent matrix were used to determine the efficiency of the detector for various energies. The procedure used for the estimation of concentration of 232Th and 238U concentration has been described elsewhere.12,18
Effective dose
The annual effective dose due to indoor radon and thoron concentrations was estimated using equations (3) and (4), respectively
2


The effective dose due to radon and thoron progenies was estimated from corresponding working level month (WLM) values and using conversion factors 3.9 and 3.4 mSv/WLM for radon and thoron progenies, respectively.2,19
Results and discussion
Radon concentration
Table 1 presents the statistics of indoor radon concentration estimated in the present study. From Table 1, the radon concentration was observed to vary from 20.6 to 146 Bq m−3. The low radon concentration 20.6 Bq m−3 was observed in wooden house at location #50 during summer, whereas a house constructed with mud at location #5 was registered the highest value 146 Bq m−3 during winter. The annual average radon concentration observed in the present study varied from 26.9 to 110.3 Bq m−3 with a mean value of 56.6 ± 20.4 Bq m−3. The skewness and kurtosis coefficient of radon concentration that was observed during summer and autumn seasons indicate that the concentration follows a frequency distribution close to normal distribution, whereas the radon concentration that was observed during winter and spring show its distribution follows a log normal with right tail longer than left tail. The frequency distribution of annual indoor radon concentration measured in the present study is shown in Figure 2. From Figure 2 the annual average radon concentration that was observed in dwellings follows a log normal distribution as skewness and kurtosis obtained are high. From Table 1, the concentration of radon was observed to vary widely during winter and spring seasons. The wide variation observed in the radon concentration during these seasons may be attributed to the variation in the ventilation conditions of the house monitored.
Frequency distribution of 222Rn concentration observed in residential places of study area. Statistical data of radon concentration measured in Coonoor for different seasons of a year.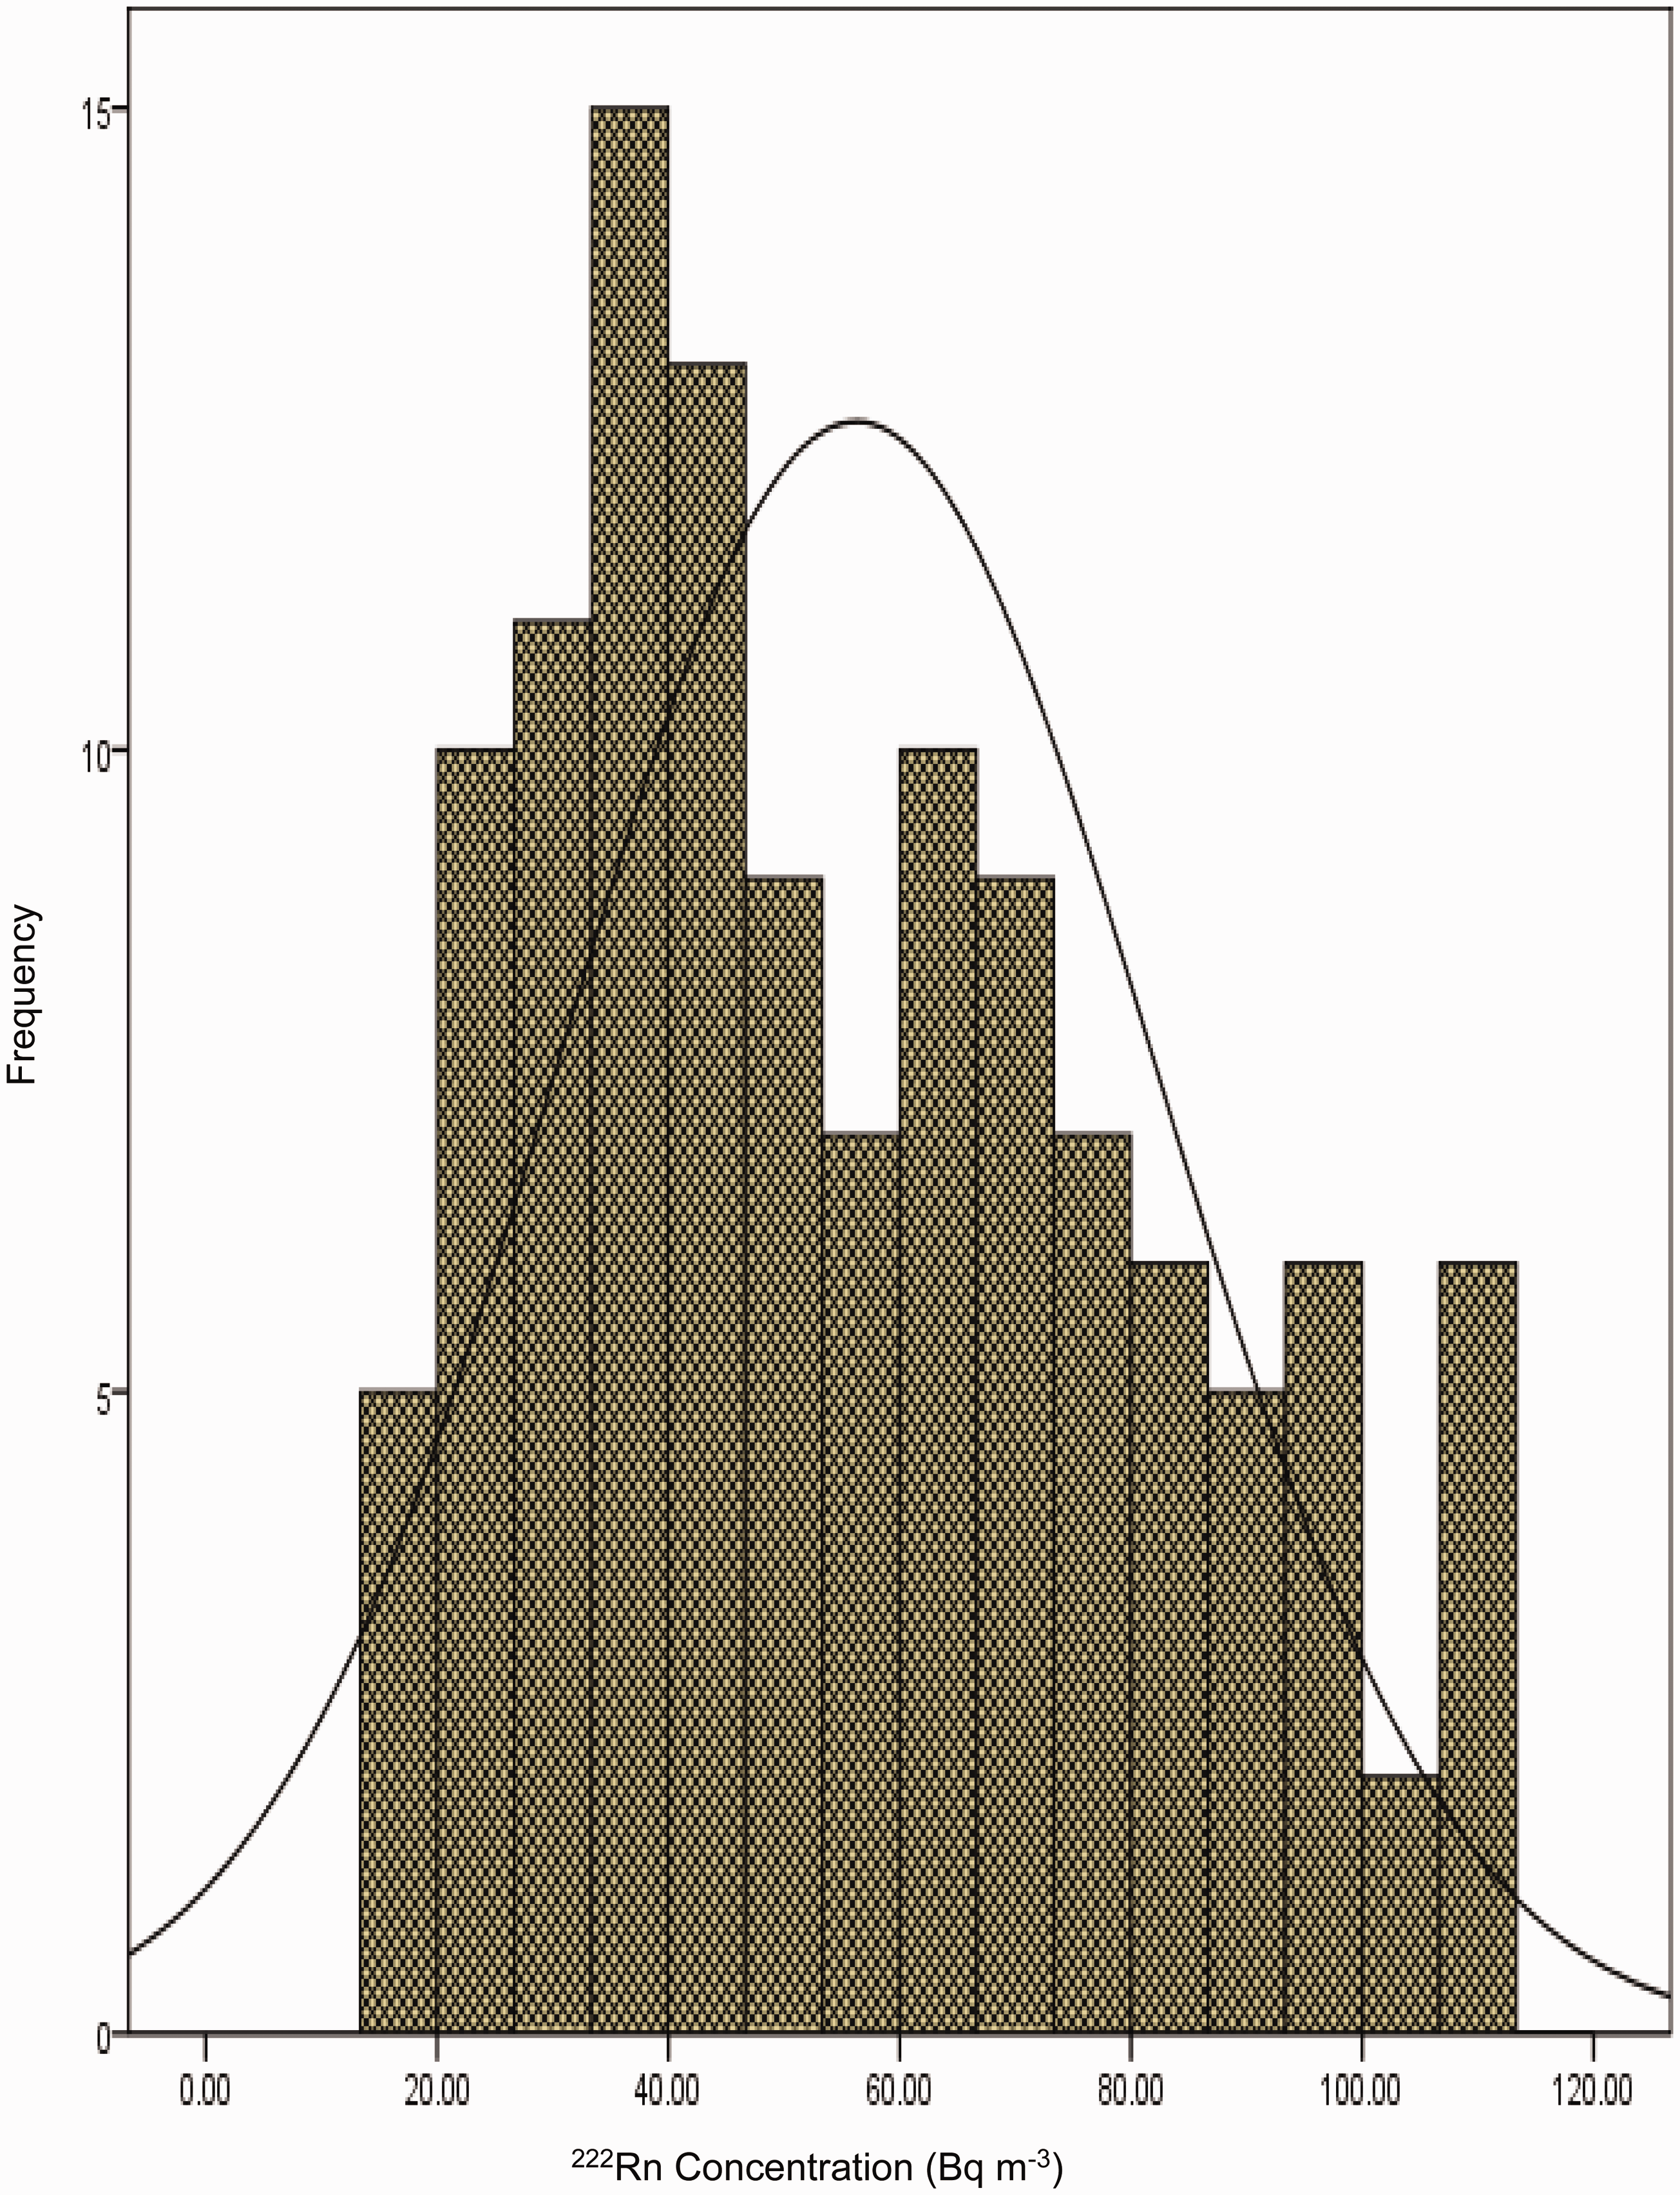
Being a hilly area, to protect people from cold weather, windows and doors of the residential houses were kept closed during winter and spring seasons leading to poor ventilation which in turn lead to increases in indoor radon concentrations. The trend in the seasonal variation of indoor radon concentration that was observed in the present study is in good agreement with the results reported for various locations.18,20,21 The wide variation in the indoor radon concentration that was observed in the present study may also be attributed to the variation in lithological components; geology of the soil exists in the study area and concentration of primordial radionuclides in the building materials used for construction. A major portion of the study area is covered by charnockite, unclassiEed gneiss rocks whereas granitic, dolerite, magnetite quartzite and pyroxene granulite rock type exist as patches. 22
The concentration of 238U in the underlying soil was estimated using gamma spectroscopy described elsewhere.
12
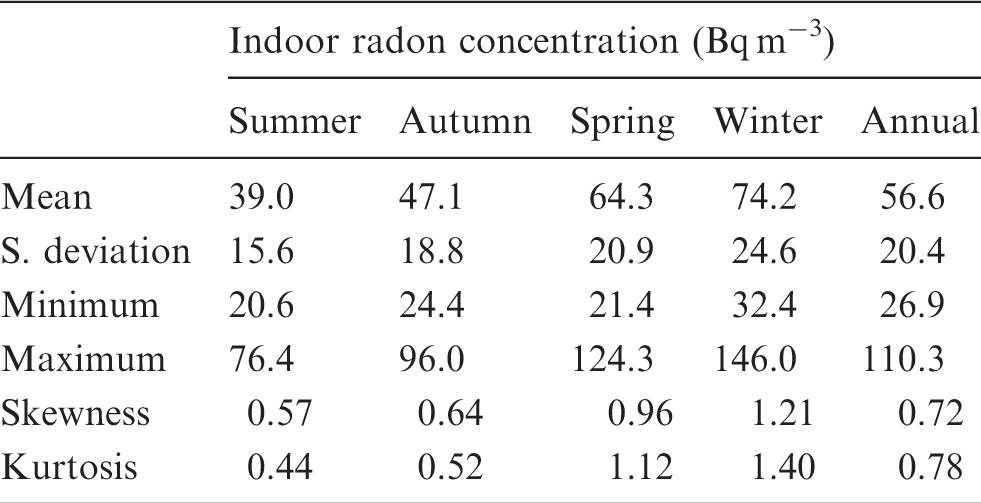
An attempt was made to correlate the indoor radon concentration and 238U (grand parent of 222Rn) activity concentration estimated in the underlying soil. Figure 3 shows the correlation between 238U in underlying soil and indoor 222Rn concentration measured in the residential dwellings. A good correlation with correlation coefficient of 0.85 was observed. This study shows that the concentration of 238U in the underlying soil is one of the factors which decide the indoor radon concentration in the residential houses. Tchorz and Solecki
23
reported a strong positive correlation between basement uranium content and indoor radon with a correlation coefficient of 0.9 for Poland environment which is in good agreement with the results of present study.
Correlation between indoor 222Rn concentration and activity concentration of 238U measured in underlying soil of residential places.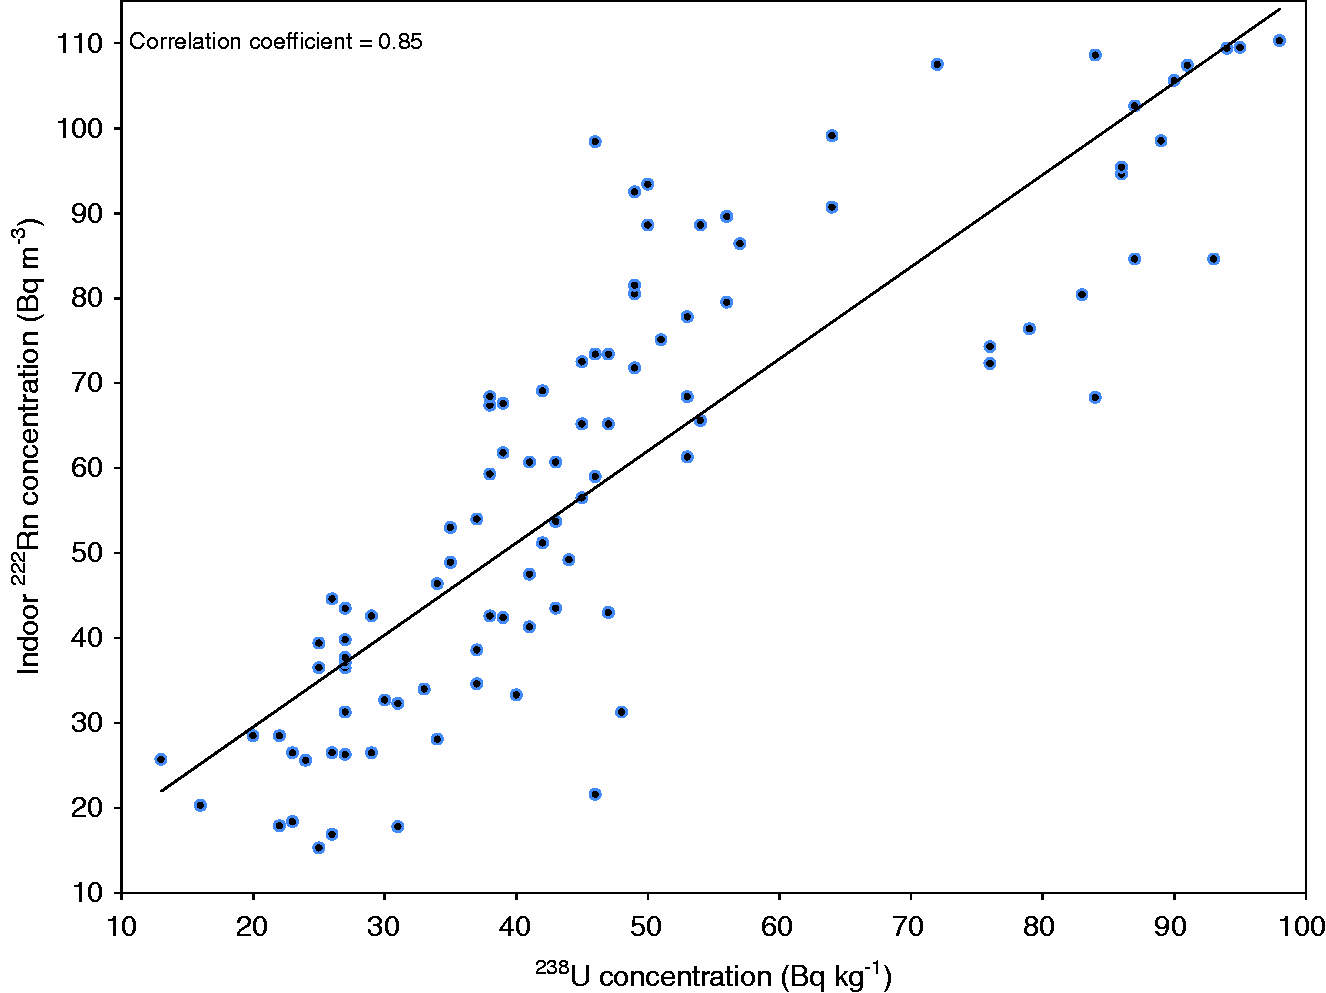
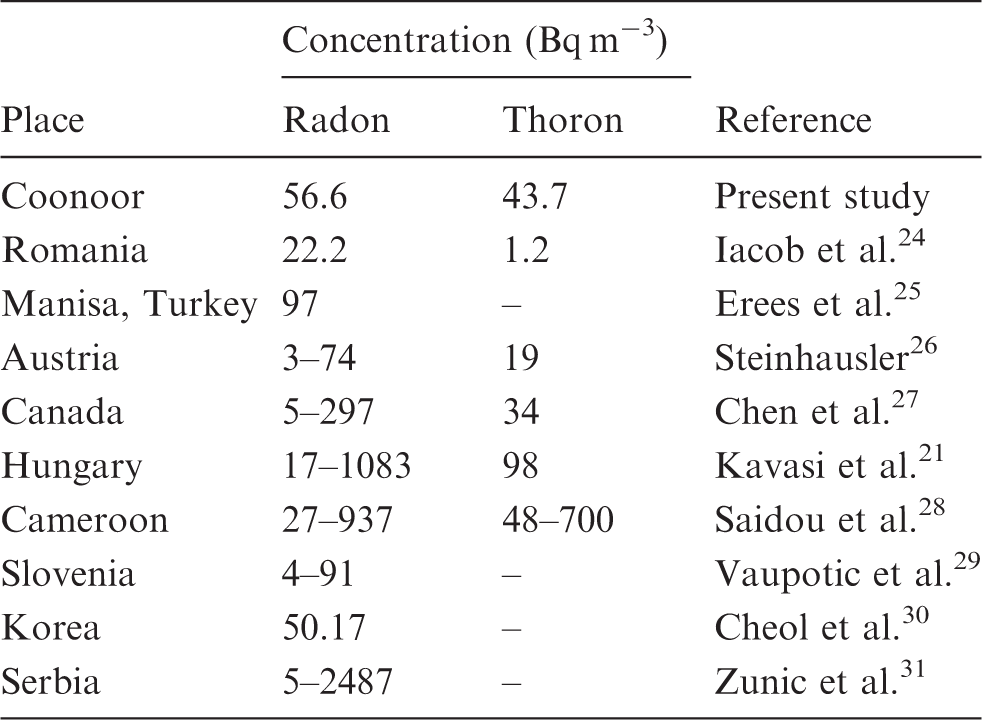
Comparison of radon and thoron concentration observed in residential places in the study area with various locations.
Thoron concentration
The concentration of thoron (220Rn) in an indoor environment was estimated for four seasons of a year and the statistical data are presented in Table 3. From Table 3, the 220Rn concentration varied from 14.3 to 110.4 Bq m−3. The highest concentration 110.4 Bq m−3 was observed in a tiled type house at location # 24 during winter whereas the lowest value of 14.3 Bq m−3 was registered in a house constructed with wood at location #38 during summer. The annual average concentration of 220Rn varied from 19.6 to 86.4 Bq m−3 with a mean value 43.7 ± 18.4 Bq m−3. From Table 3, the high value of skewness and kurtosis of 220Rn concentration was observed during four seasons which indicates log-normal distribution. The annual average thoron concentration observed in dwellings also follows a log-normal distribution as it registers positive and high skewness and kurtosis values and this is presented in Figure 4. From Table 3, the high skewness of data was observed for winter and spring seasons; this may be attributed to the changes in the ventilation condition in various houses studied. The maximum concentration of 220Rn was observed during winter season as that observed for 222Rn this may be attributed to poor ventilation in the houses as the doors and windows are kept closed to protect people from the cool breeze. The wide variation observed in the concentration of indoor 220Rn may also be attributed to the variation in the 232Th primordial radionuclide (grand parent of 220Rn) distribution in the soil of the study area.
12
Frequency distribution of 220Rn concentration estimated in residential places of study area. Statistical data of thoron concentration measured in Coonoor for different seasons of a year.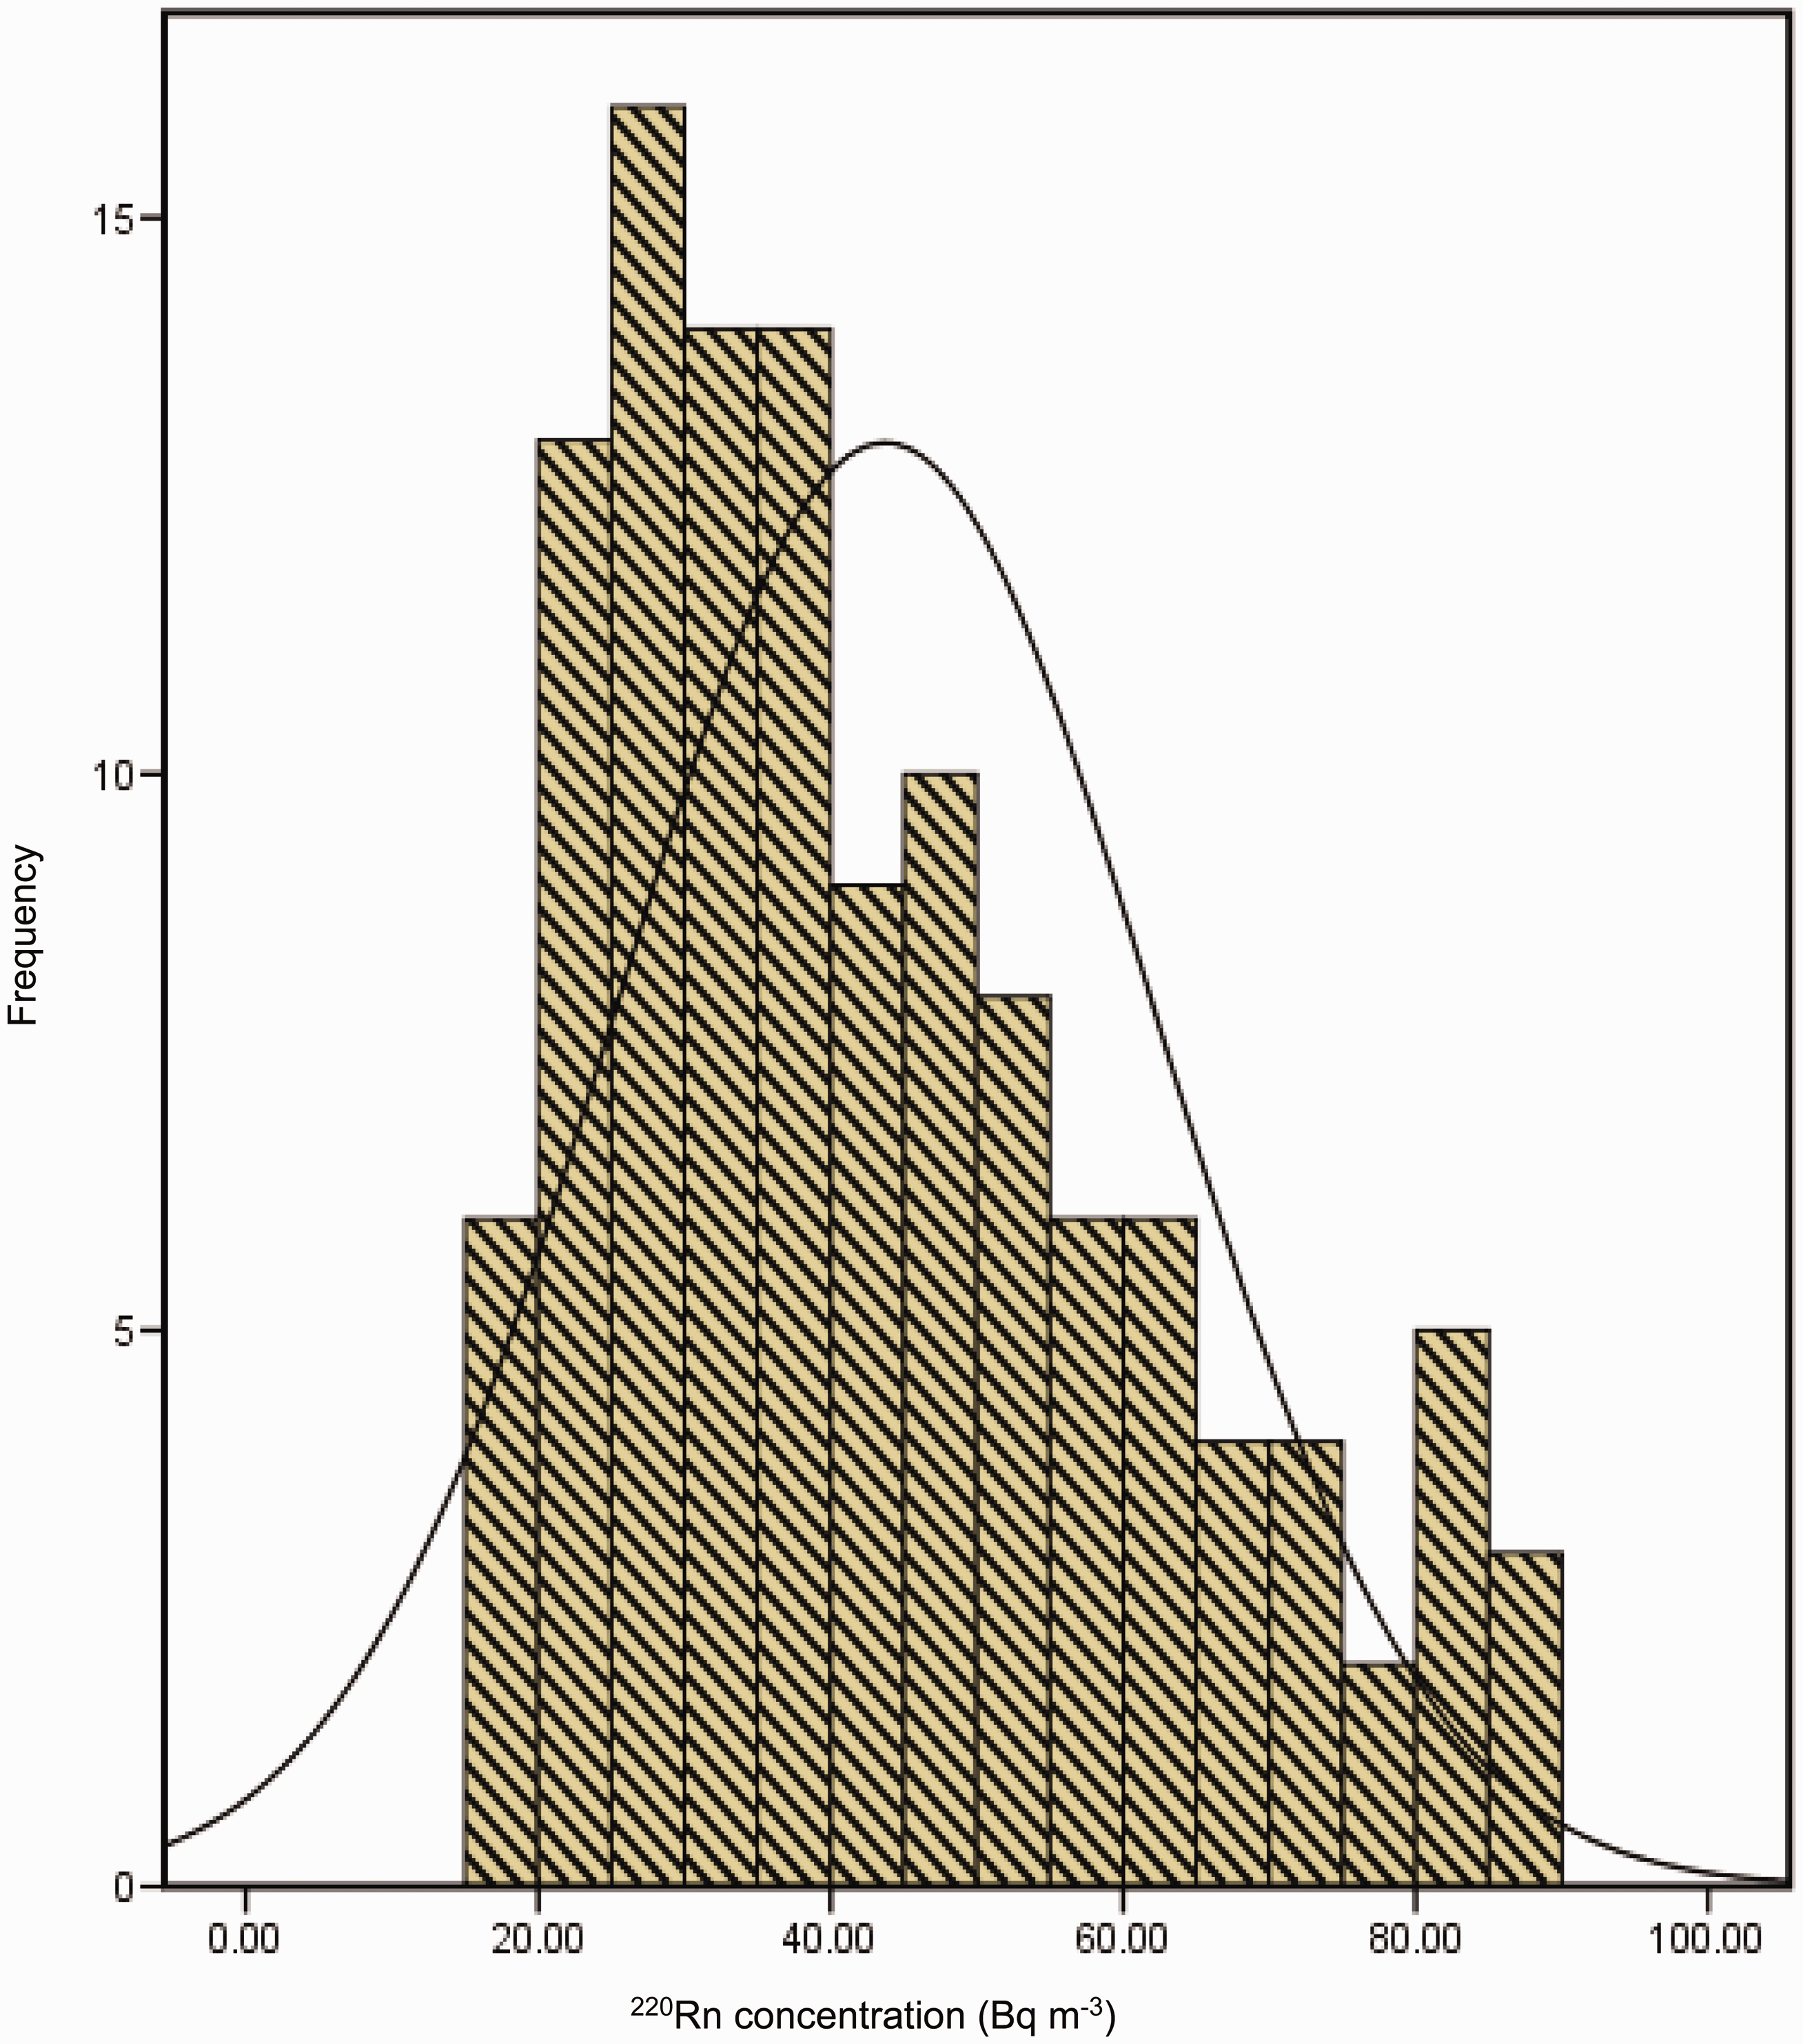
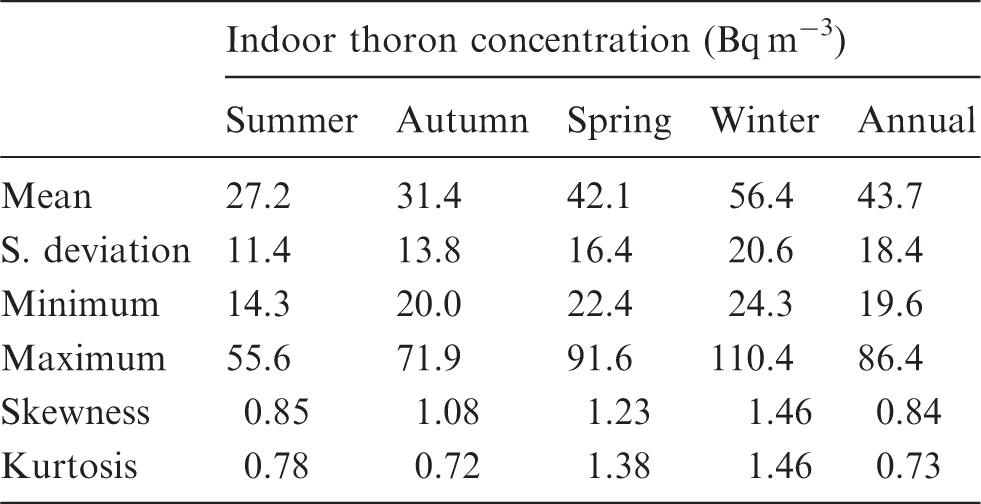
Figure 5 presents the correlation between indoor 220Rn concentrations estimated in residential houses and the concentration of its grandparent 232Th present in the underlying soil which were determined using gamma spectroscopy. Reasonable correlation with a correlation coefficient of 0.61 was observed in this study. This study clearly shows the contribution of 232Th observed in the underlying soil to the thoron concentration in the indoor environment. The correlation coefficient observed between 220Rn and 232Th was found to be less than that observed between 222Rn and 238U, which may be due to the fact that considerable 220Rn was decayed due to the low half-life of 220Rn.
Correlation between indoor 220Rn concentration and concentration of 232Th in underlying soil of a residential place.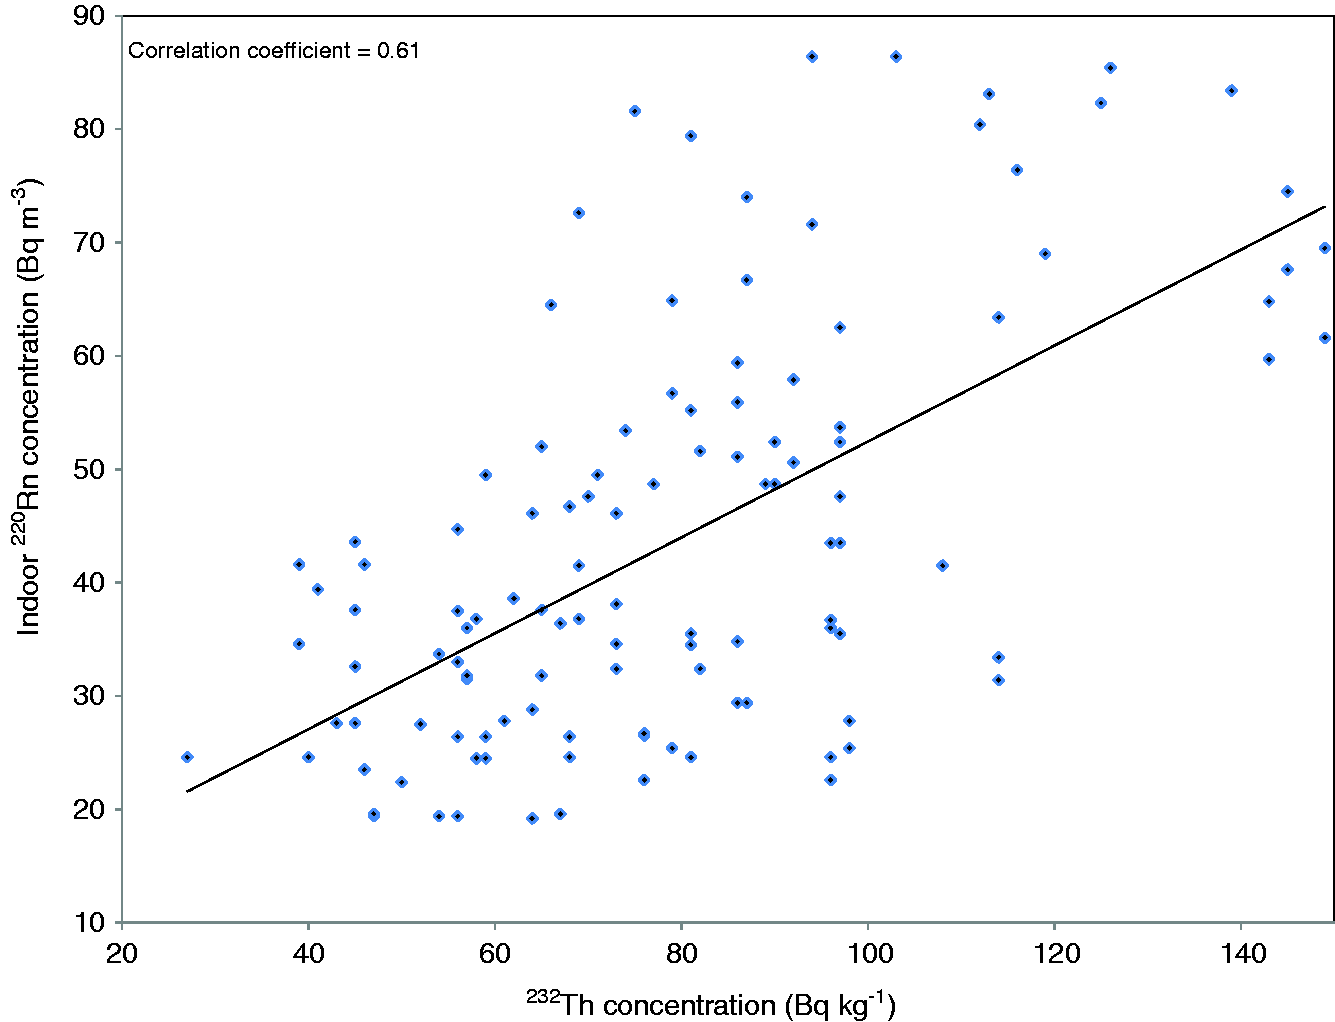
The annual average indoor 220Rn concentration observed in the present study was 43.7 Bq m−3 and this was found to be higher than the corresponding values of 1.2 Bq m−3observed in Romanian dwellings, 24 19 Bq m−3 in Austria dwellings, 26 34 Bq m−3 in dwellings in Canada 27 whereas the present value was found to be less than the concentration 98 Bq m−3, that was observed in Hungarian dwellings, 21 and 48–700 Bq m−3 in dwellings in Camaron. 28
Thoron-to-radon ratio
The ratio of indoor 220Rn/222Rn concentrations measured in the present study was determined. This was found to vary from 0.52 to 2.27 with a mean value of 0.77. This observed variation may be attributed to the changes in the concentration of indoor 222Rn and 220Rn in dwellings monitored due to changes in ventilation conditions. The observed ratio between 222Rn and 220Rn was found to be much less than the ratio of 232Th/238U concentration in the surrounding soil in this area. 12 This may be attributed to the fact that a considerable amount of 220Rn was being decayed faster than 222Rn as its half-life is shorter than that of 222Rn. The observed 220Rn/ 222Rn in the present study was found to be higher than the ratio 0.02–0.83 that was observed in Slovenian schools 29 and 0.11–0.72 found in Slovenian residences. 33 Whereas, the observed ratio in the present study was lower than the observed values of 0.9–4.6 found in Hungary 21 and 0.6–6 in Japan. 7 The average 220Rn/222Rn ratio, 0.71 was observed in the present study which was found to be higher than 0.24 that was observed in Canada, 27 and 0.6 that was found in Hungary. 21 This result could be attributed to a higher concentration of 232Th than 238U observed in the soil of the study area. 12
Radon and thoron progenies
Statistical data of radon and thoron progenies measured in Coonoor for different seasons of a year.
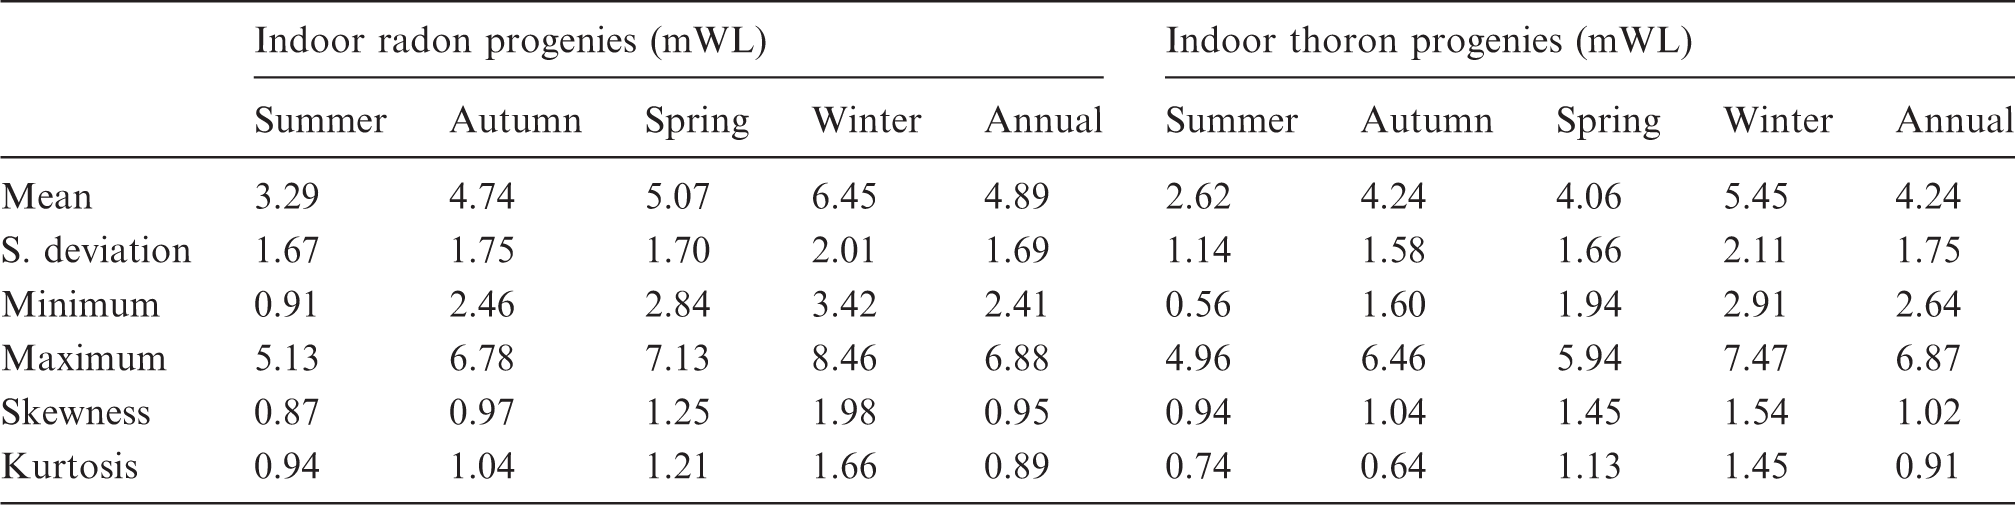
Seasonal variation
The highest 222Rn, 220Rn and progeny levels were observed during the winter and the corresponding lowest values were observed during summer. In the winter season the doors and windows of the houses were kept closed for most of the time to protect people from the cool breeze in the study area which resulted in poor ventilation. The poor ventilation maintained in indoor environment had led to a reduction in the mixing of radon, thoron and its progenies in the indoor air with the external environment, and had led to an increase in the indoor radon, thoron and its progeny level. The doors and windows of a house were kept open due to high temperature that exists during summer with good ventilation. This leads to a mixing of indoor air well with the external environment resulting in lower concentrations of indoor radon, thoron and its progeny.17,34 Radon and thoron concentrations in an enclosed environment are affected by the degree of exchange with outdoor air as measured by the ventilation. 23 The magnitude of seasonal variation of radon and thoron concentrations is pronounced well by the ratios of its concentrations observed during various seasons. The winter/summer ratio of radon concentration observed in the present study varies from 1.25 to 2.27 with a mean value of 1.9, whereas the corresponding values observed for thoron varied from 1.12 to 4.85 with a mean value of 2.26, which was the highest ratio observed in the present study. The minimum ratio of radon concentration was observed between winter and spring which was found to vary from 0.96 to 1.69 with a mean value of 1.32, whereas the corresponding mean value observed for thoron was 1.21 which was found to vary from 1.0 to 1.57. The ratio of winter/autumn of radon and thoron concentrations was observed to lie between these values. The seasonal variation of 222Rn and 220Rn concentrations follows the same trend as a maximum was recorded in winter and a minimum was recorded in summer at various locations.33,35,36 The important cause for seasonal fluctuations in the indoor radon and thoron concentrations is air temperature, which could affect radon diffusion in the upper atmosphere. From the results observed in the present study, meteorological parameters such as ventilation and temperature are playing a crucial role in deciding the concentrations of indoor radon, thoron and progenies.
222Rn and 220Rn concentration in various types of houses
An attempt was made to compare the indoor radon and thoron concentrations measured in various types of houses in the study area. Figure 6 presents the concentration of indoor radon and thoron measured in various types of houses monitored in the present study. From Figure 6, a house constructed with mud was shown to register the highest radon and thoron concentration followed by a concrete type house. The minimum indoor radon and thoron concentrations were observed in the house constructed with wood whereas intermediate values were registered in tiled and concrete type houses. The high concentration of indoor radon and thoron observed in the mud houses may be attributable to the high concentration of 238U and 232Th observed in the underlying and surrounding soil.
12
The walls of mud houses are not covered with paint and thus, higher radon and thoron exhalation rates were recorded due to large porousness in the walls. This type of house does not contain many windows in order to protect residents from the cool breeze and due to the poor ventilation high indoor radon and thoron concentrations were therefore recorded. Similar findings were reported by Ramachandran et al.
37
for Tehri Garhwal, which is a hilly area in North India. The floor of this type of house is plastered with local mud and allows more 222Rn and 220Rn to diffuse inside the houses due to higher porousness of flooring materials.
13
Tchorz and Solecki reported that indoor radon concentration in a closed environment could be affected by changes in the entry rate of radon-rich air from the underlying soil and rocks.
23
Variations of indoor 222Rn and 220Rn concentration in different types of houses.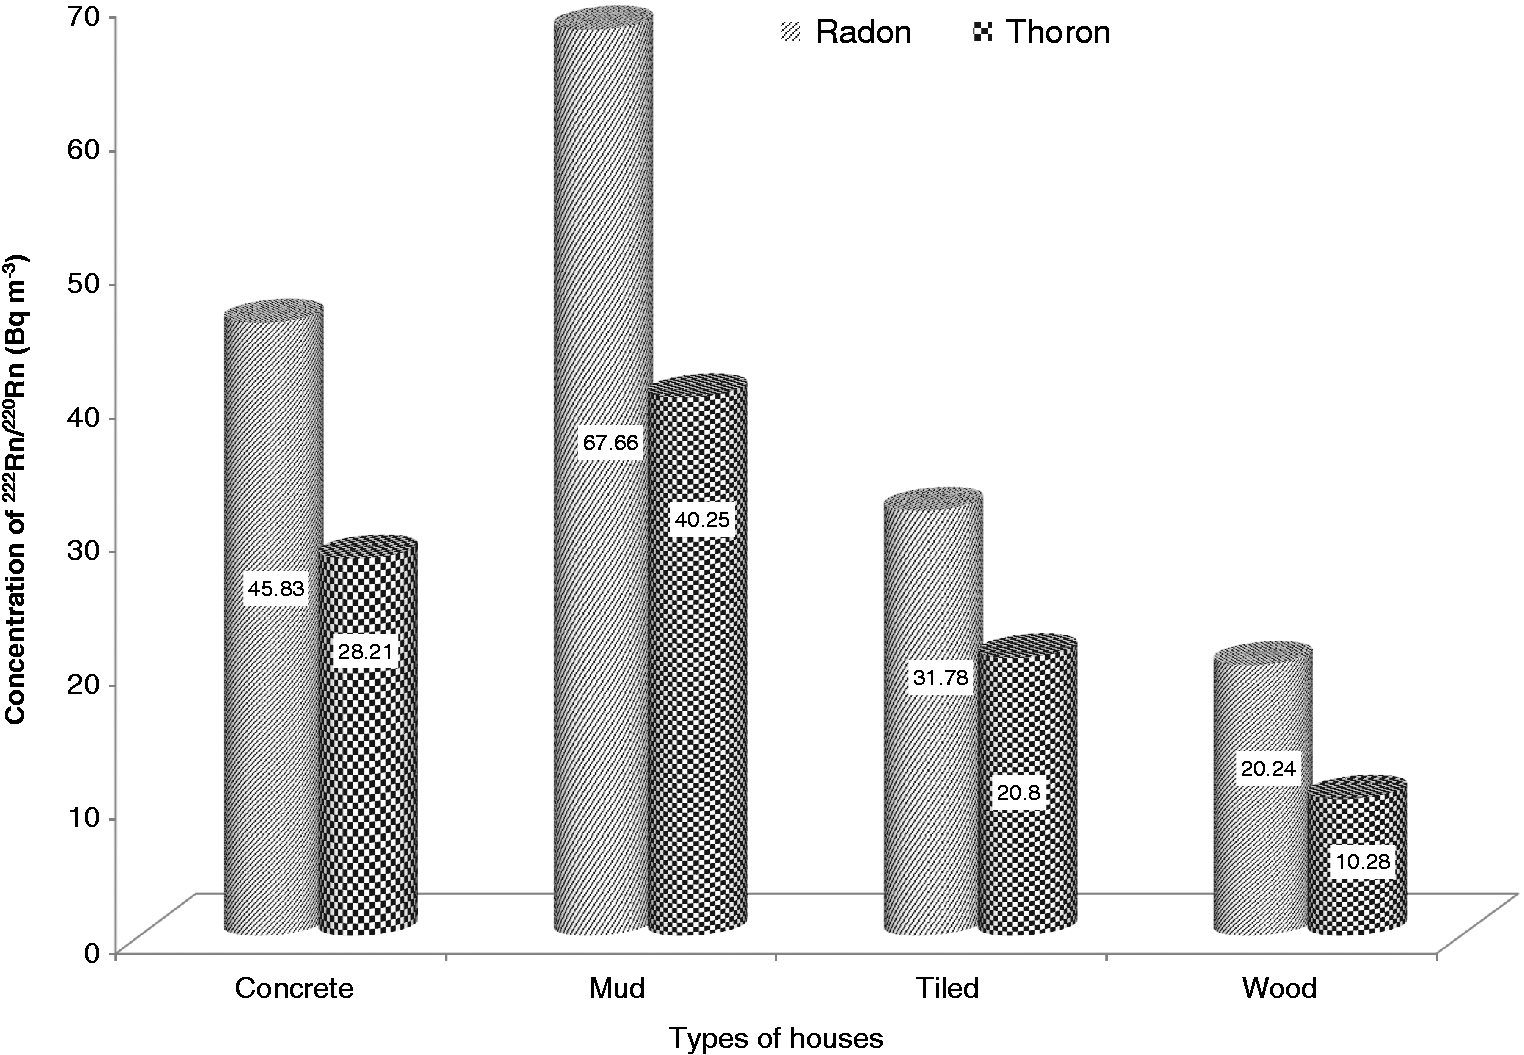
The low indoor radon concentration observed in the wooden house may be attributed to the negligible contribution to indoor 222Rn, 220Rn and progeny level from the building materials as wood contains trace levels of primordial radionuclides which is the main construction material used in this type of house. Wood used in the house’s construction could also prevent the entry of radon and thoron into the indoor environment. These could be a reason for low 222Rn, 220Rn and progeny levels were observed in wooden type houses. Many investigators have reported that lower radon and thoron concentrations were registered in wooden houses than other types of houses studied,24,38,39 which is in good agreement with the results of this study.
The intermediate level of indoor radon and thoron concentrations that was observed in concrete and tiled houses may be attributable to the moderate contribution from the building materials used. The walls of these houses are covered with paint which blocks the pores and therefore a reduction in exhalation of radon and thoron from walls. 40 The cement and other flooring materials used in these types of houses would reduce the porousness in the floor and results in lower radon and thoron entry into indoor environment. These types of houses contain many windows and doors which increase the ventilation rate leading to lower radon, thoron and progenies concentrations. A similar finding has been reported by several investigators.13,18
Annual effective dose
The annual effective dose received by the general public due to radon and thoron was calculated using the dose conversion factor, equilibrium factor and occupancy factor given by UNSCEAR. 2 The annual effective dose due to radon was found to vary from 0.68 to 2.78 mSv y−1 with a mean value of 1.43 ± 0.51 mSv y−1 whereas the dose due to thoron varied from 0.55 to 2.42 mSv y−1 with a mean value of 1.22 ± 0.36 mSv y−1. The effective dose due to radon reported for Greece residents was 1.36 mSv which is comparable with the observed result in the present study, whereas the dose due to thoron was found to be higher than that reported for Greece 41 as 0.2 mSv. The effective dose due to radon progeny was found to vary from 0.39 to 1.11 mSv y−1 with a mean value of 0.79 ± 0.27 mSv y−1, whereas the mean annual effective dose due to thoron progeny was estimated as 0.59 ± 0.25 mSv y−1, which was found to vary from 0.37 to 0.96 mSv y−1.
The total annual average effective dose received by the general public due to radon and thoron was found to vary from 1.23 to 5.2 mSv y−1 with a mean value of 2.65 mSv y−1. The effective inhalation dose due to 222Rn, 220Rn and progenies received by the general public in the study area was calculated as 3.69 mSv y−1. Figure 7 presents the contribution of 222Rn, 220Rn and progenies to the annual effective inhalation dose received by the general public in the present study. From Figure 7, 222Rn and 220Rn contributes 39% and 33%, respectively, to the total inhalation dose received, whereas 23% and 7% contribution to the inhalation dose received was from radon and thoron progenies, respectively. The annual effective inhalation dose due to radon and thoron observed in the present study was found to be higher than the Indian average value of 1.11 mSv y−1 reported by Ramachandran et al.
37
excluding high background radiation areas in India. The inhalation dose received by residents of Coonoor due to radon and thoron was higher than that was observed in Osmaniye, Turkey
42
at 1.29 mSv y−1 and that was observed in the Killis and Antakya environment at 1.26 and 1.29 mSv y−1, respectively.
40
The effective annual inhalation dose due to 222Rn, 220Rn and progenies received by the general public in the study area of Coonoor was 3.69 mSv y−1 which was found to be lower than the recommended value of 10 mSv y−1 given by the ICRP.
32
Contribution of 222Rn, 220Rn and corresponding progenies to the total annual effective dose received by general public of study area.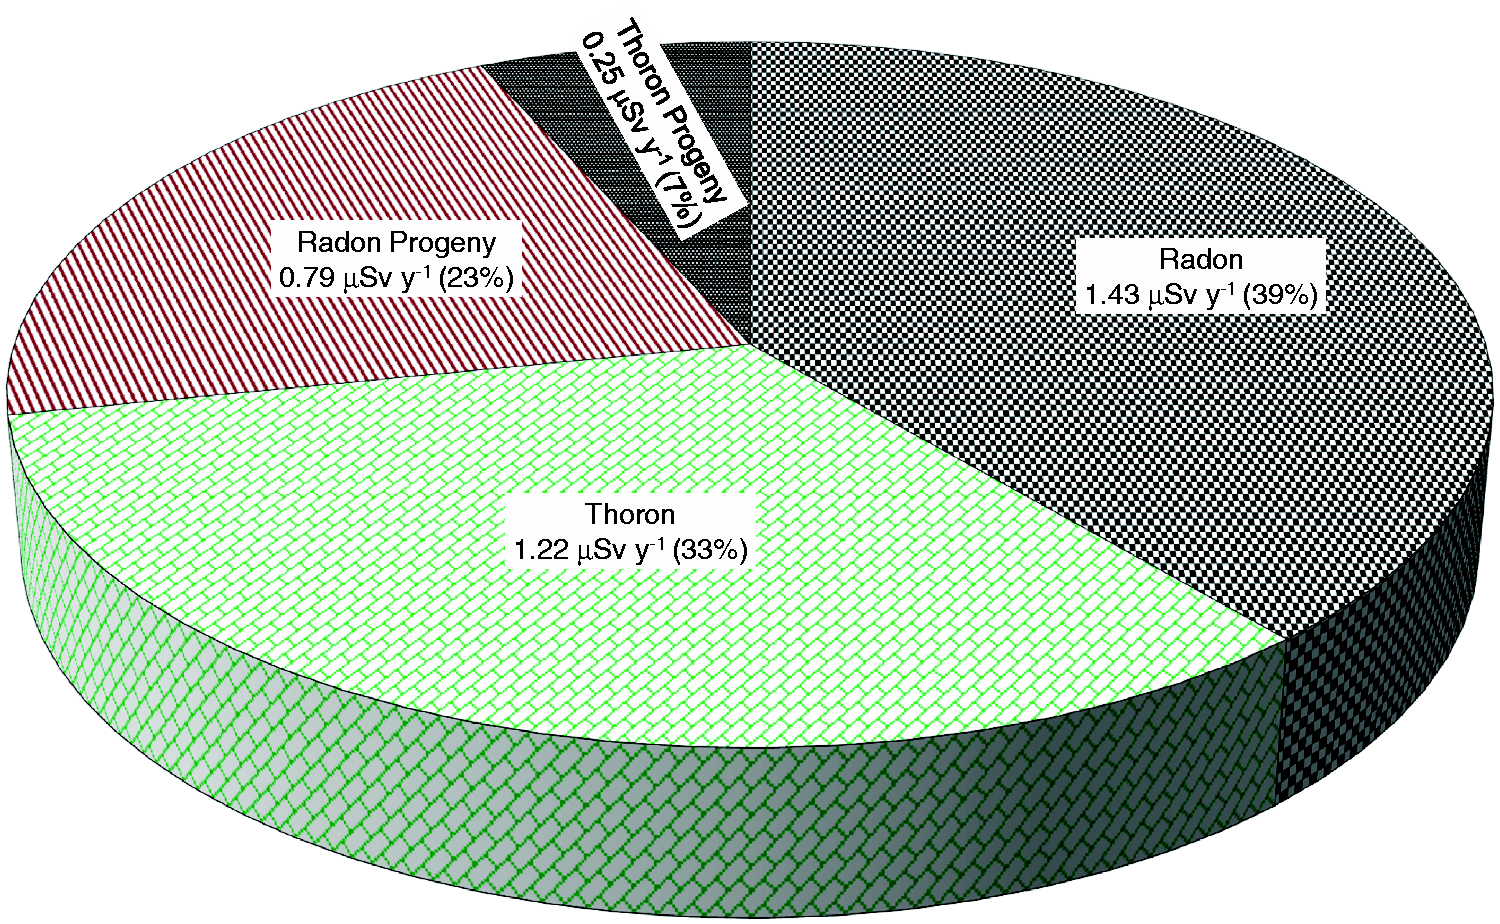
Conclusions
From the detailed study on indoor 222Rn, 220Rn and progenies concentration carried out in the study area Coonoor the following conclusions have been reached.
The radon, thoron and progeny level observed in the present study was found to vary with seasons of the year. The high indoor 222Rn, 220Rn and progenies concentrations were observed during winter in which poor ventilation was maintained and the lowest concentrations was registered in summer season due to high ventilation. The concentration of 222Rn observed in the indoor environment was correlated with the concentration of 238U estimated in the underlying soil. A good correlation with a correlation coefficient of 0.85 was observed and this indicates the contribution of primordial radioisotopes in the underlying soil to the indoor radon concentration. A correlation coefficient of 0.61 was observed between 220Rn and 232Th found in underlying soil which implies less contribution from 232Th to indoor 220Rn, this may be attributable to short half-life of 220Rn. The radon, thoron and progeny levels in indoor environments were found to vary with the types of houses. A high concentration of 222Rn and 220Rn was observed in mud houses and this may be attributable to poor ventilation maintained in this type of houses and higher exhalation of radon and thoron from bare walls and floors due to high porousness in wall and floor. The wood restricts entry of radon and thoron into the indoor environment which results in the lower concentration of these isotopes. The average effective doses due to indoor 222Rn, 220Rn and corresponding progenies observed in the residential houses were estimated as 1.43, 1.22, 0.79 and 0.25 mSv y−1, respectively. The total annual effective dose due to 222Rn, 220Rn and progenies estimated in the present study was 3.69 mSv y−1 which is less than the recommended level 10 mSv y−1 given by ICRP (2009).
Footnotes
Author’s contribution
R. Sivakumar is the only contributor for this article.
Acknowledgement
The author is thankful to Dr V. Meenakshisundam, former Head, Radiation Safety section, Indira Gandhi Center for Atomic Research, Kalpakkam; Mr S. Santhanam, Radiation Safety section, Indira Gandhi Center for Atomic Research, Kalpakkam and Dr S. Selvasekarapandian, former Professor, Karunya University, Coimbatore for their continued support and encouragement throughout this work. The cooperation and assistance provided by the Administration, Dr Kevin, Chairman of the English Language Department and cofaculty members of GS department while preparing the manuscripts is gratefully acknowledged.
Declaration of conflicting interests
The author(s) declared no potential conflicts of interest with respect to the research, authorship, and/or publication of this article.
Funding
The author(s) received no financial support for the research, authorship, and/or publication of this article.