
Abstract
A thermal analysis of a two-storey building was made using a dynamic simulation software (TRNSYS). Thermal performance of a 2000 m2 building was examined by means of several dynamic simulations. The building is located in a region within the BS climate (steppe) according to the Köppen climate classification, where both air cooling and heating are needed to provide comfortable thermal conditions through the entire year. This weather often represents an energy saving challenge, where heat gains and heat losses need to be efficiently managed. A selection of common construction and glazing materials was implemented, and a simple but effective ventilating strategy was tested. Six thermal zones were defined in the building and a comfort temperature range was established as an operating parameter. The results show hourly mean temperatures and energy consumption due to air conditioning throughout a year.
Introduction
Buildings are made to provide shelter for the occupants; therefore, to deliver a satisfactory thermal environment using a fair amount of energy has become an essential task for building developers, architects, researchers, policy makers, government and occupants in general. In industrialized countries, the building’s energy use mainly comprised lighting, heating, cooling and ventilation. 1 This energy represents more than a third of the total energy demand and a primary source of pollution. 2 Thermal and optical properties of materials, distribution of space, global building configuration along with building location and orientation and even more the occupant’s behaviour are critical agents that add up to the overall energy demand of the building. 3 However, some key parameters that determine the building energy requirements have been given by Ekici and Aksoy 4 ; these are daily outside temperature, solar radiation, wind direction and speed, shape factor, transparent surface, orientation, thermal properties of building materials and distance between buildings.
Thermal comfort and energy efficiency constitute two priorities concerning the operation and general design of the building. The building’s envelope is a primary object for thermal analysis due to the impact caused by the solar heat gain which depends on the construction and glazing materials, orientation, etc. It is important that the thermal comfort of the occupants is considered before the calculation of the building’s conditioning system. Also, in further stages, the integration of renewable energy systems is to be thought. 5
Frequently, in the building design, bioclimatic strategies need to be implemented as set of actions intended to ensure thermal comfort of the inhabitants. The strategies have to ensure several thermal comfort conditions as stated by Olgyay and Olgyay. 6 The average satisfaction for occupants in buildings compared with a larger database by Bragerm and Baker 7 can be summarized as follows: general satisfaction of building and workspace, office layout, office furnishings, thermal comfort, air quality, lighting, acoustic quality and cleanliness and maintenance. To achieve the satisfaction of the building’s occupants, some matters need to be taken into consideration: orientation, geographic location, solar radiation, wind, precipitation, available natural light, etc. After considering the bioclimatic and sustainable building concepts, the building’s thermal performance is assumed to be at the following stage.
Thermal modelling of the building envelope enables a detailed analysis of the dynamic behaviour for the architectonic project by means of simulation techniques together with mathematical modelling, whereas today’s performance of a building can be expressed by the following pointers: environmental load, indoor quality and primary energy use. 1 The building’s energy consumption and thermal comfort of the occupants can be improved by running a building performance simulation with the already available specialized simulation tools. These tools integrate a robust catalogue of heating and cooling systems, construction and glazing materials and even occupation and acclimatization usage profiles can be established. The use of such simulation tools has been applied to several building conditioning and occupant comfort studies; examples of such studies are: the use of natural and hybrid ventilation,8,9 the impact of using green envelopes, 10 assessments on energy consumption and energy efficiency11,12 and the application of passive heating and cooling techniques.13,14
Currently, in Mexico, some construction companies and organizations promote the use of sustainable and ecological materials like: adobe, bamboo, straw, recycled bottles, wood, ecological bricks, thermal bricks and blocks, etc., due to ecological and energy efficiency consciousness. In spite of this, existing regulations limit funding and subsidy of constructions created with such materials. 15 As a result, nowadays economic housing and most of state institution buildings are primarily built with common construction materials mainly because that will allow easy access of low-interest financing.
The analysed building is constructed with agreement of the utilization of common construction materials; nevertheless, it incorporates bioclimatic methodologies along with a suggested dynamic thermal analysis and a natural ventilation strategy.
Physical and system modelling
Heating and cooling energy consumption along with a heat transfer analysis for a 2000 m2 two-storey building for a research facility were calculated. With the dynamic simulation software TRNSYS 17, the energetic demand and hourly mean temperatures (Tmean) were obtained. The first and second storeys of the facility are being detailed in Figure 1. The comfort range temperature was set from 20 up to 28℃. The building thermal zone distribution consists in offices at the first floor, a reception hall, three research laboratories and a machinery room. Each of them were established as thermal zones at the second floor.
(a) Transversal cut and (b) floor plan with the defined thermal areas.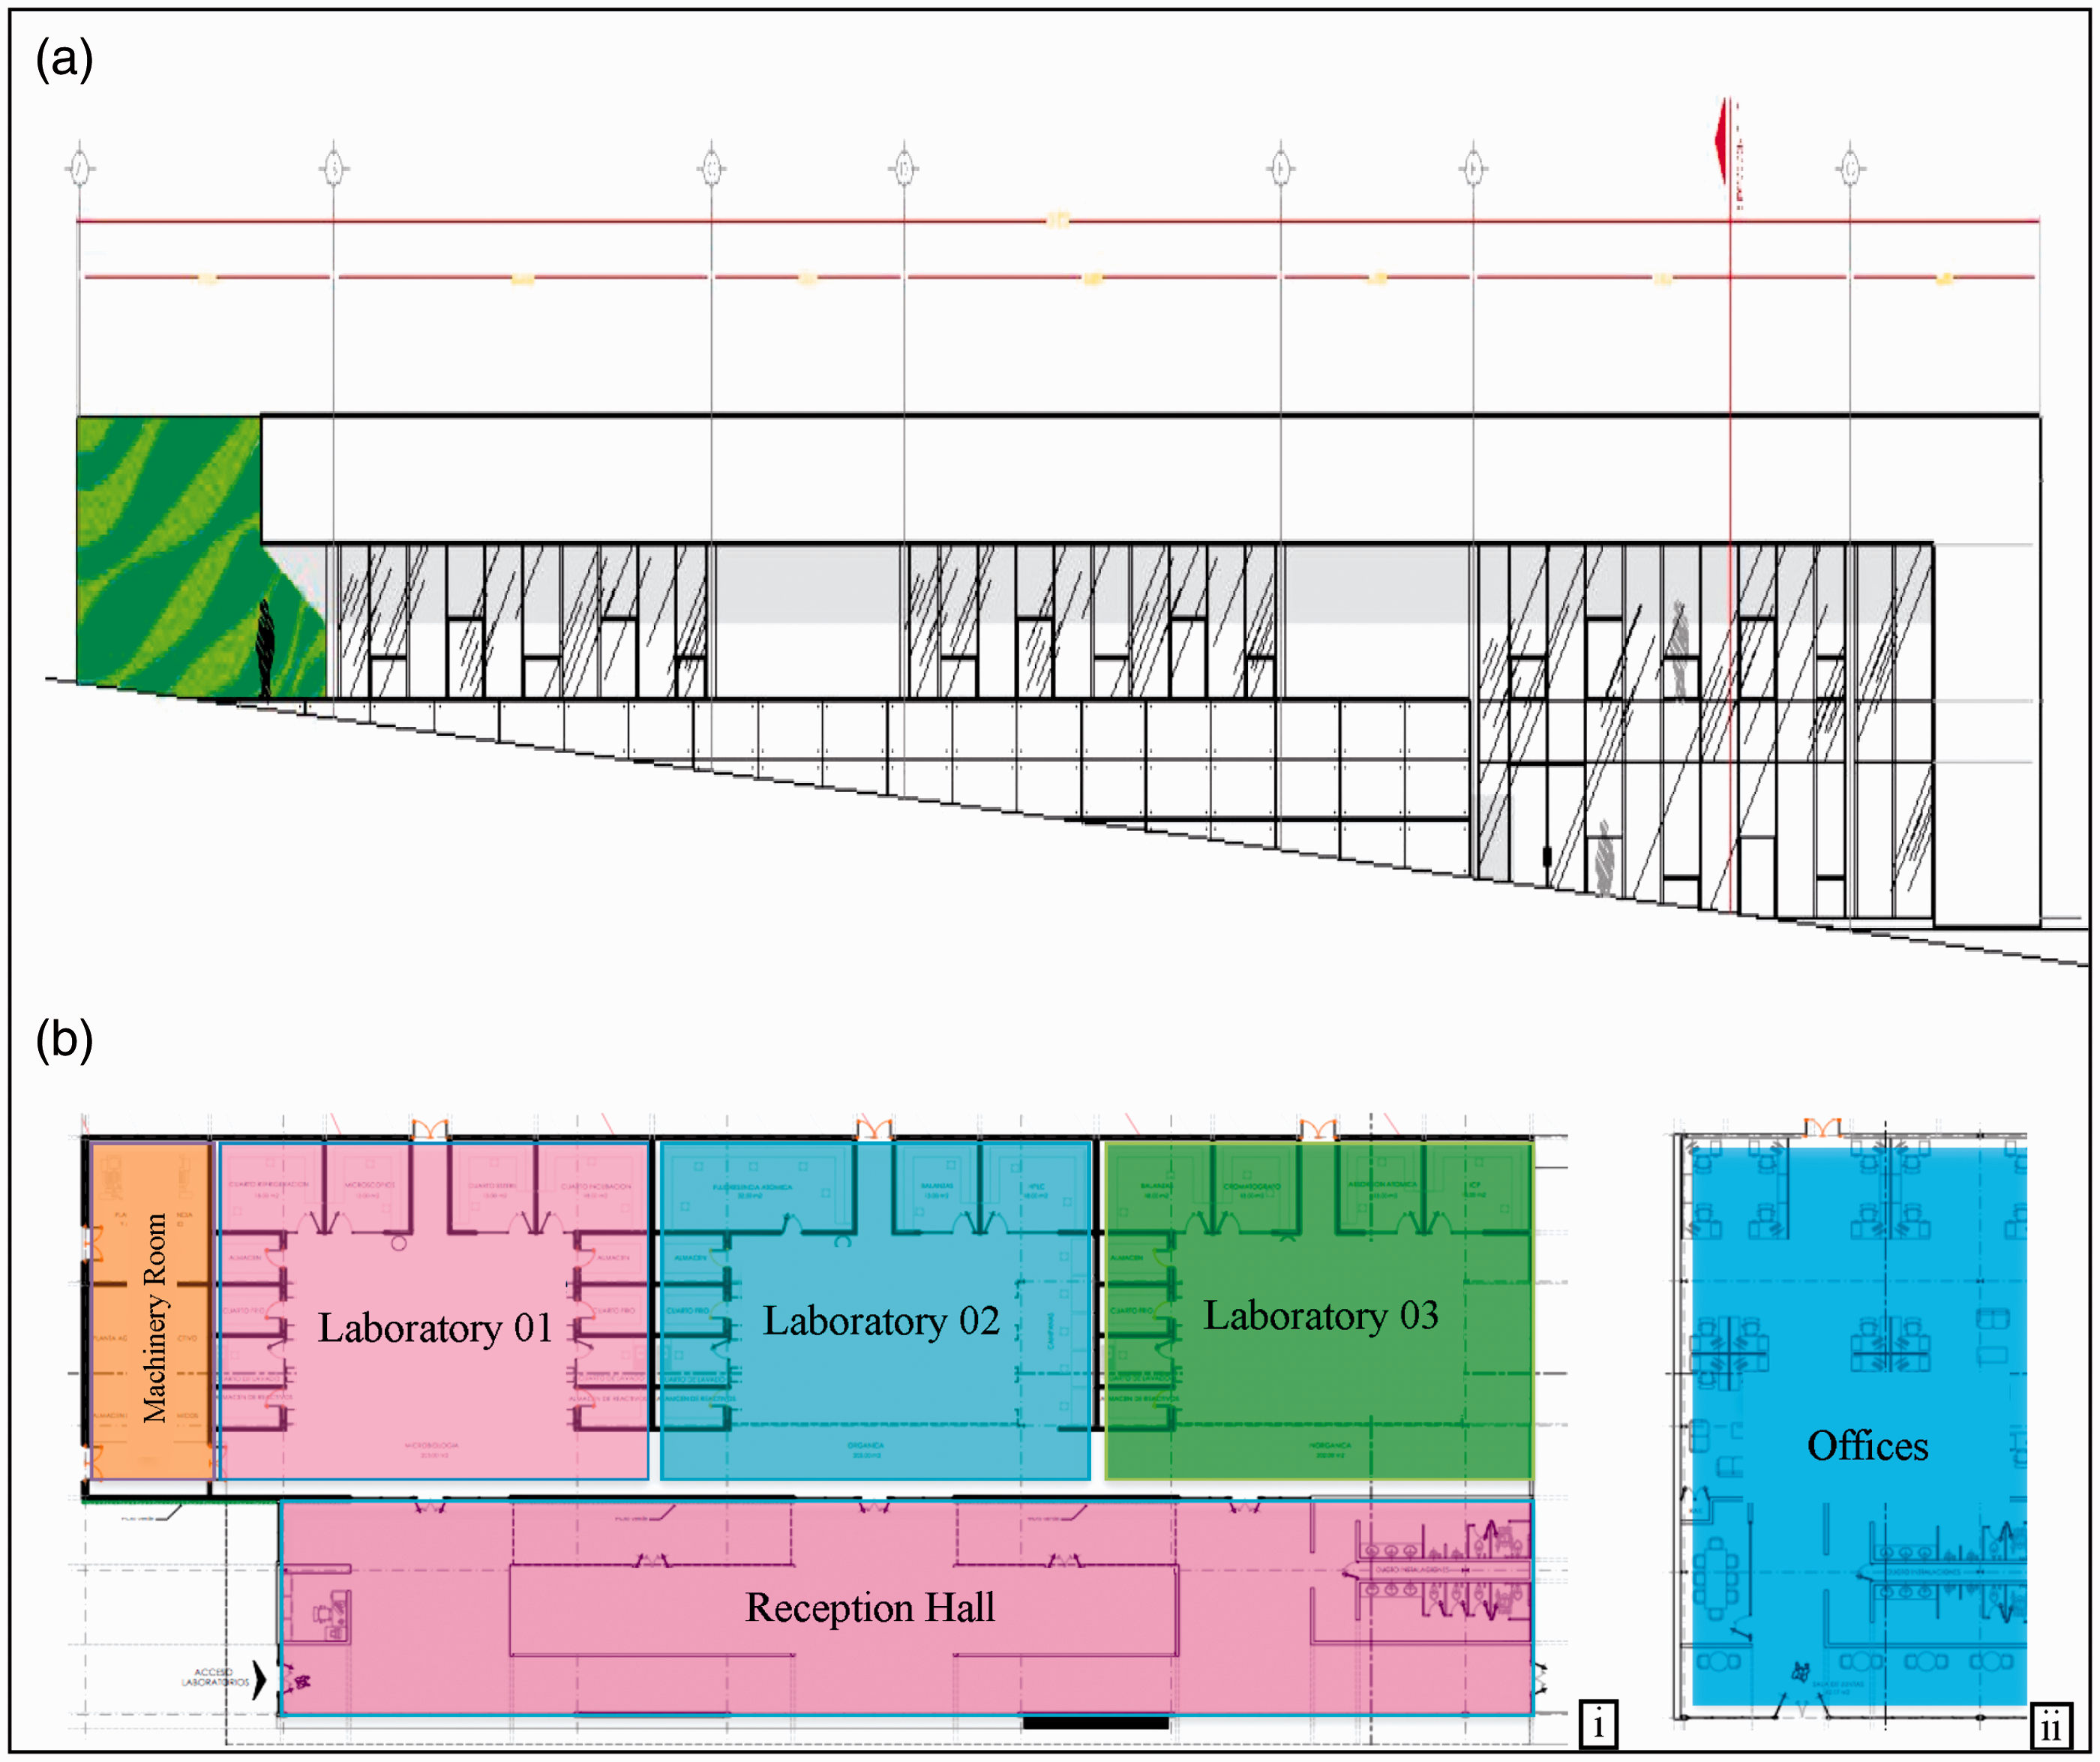
The building geometry was drawn by the SketchUp 8 plugin for TRNSYS, whereas the building envelope information was integrated using the TRNBUILD program. The TYPE 56 component and TRNBUILD program model the thermal performance of the building zones. The TRNBUILD part involves the physical description of the studied building: building geometry and physical boundaries. Material properties, schedules, thermal comfort parameters, internal heat gains, heating, cooling and ventilation controls were also added to the project. Thermal and optical properties of each material layer such as density, specific heat, thermal conductivity, thickness, absorptivity, transmissivity, reflectivity, emissivity, of the specific construction materials were given by the user.
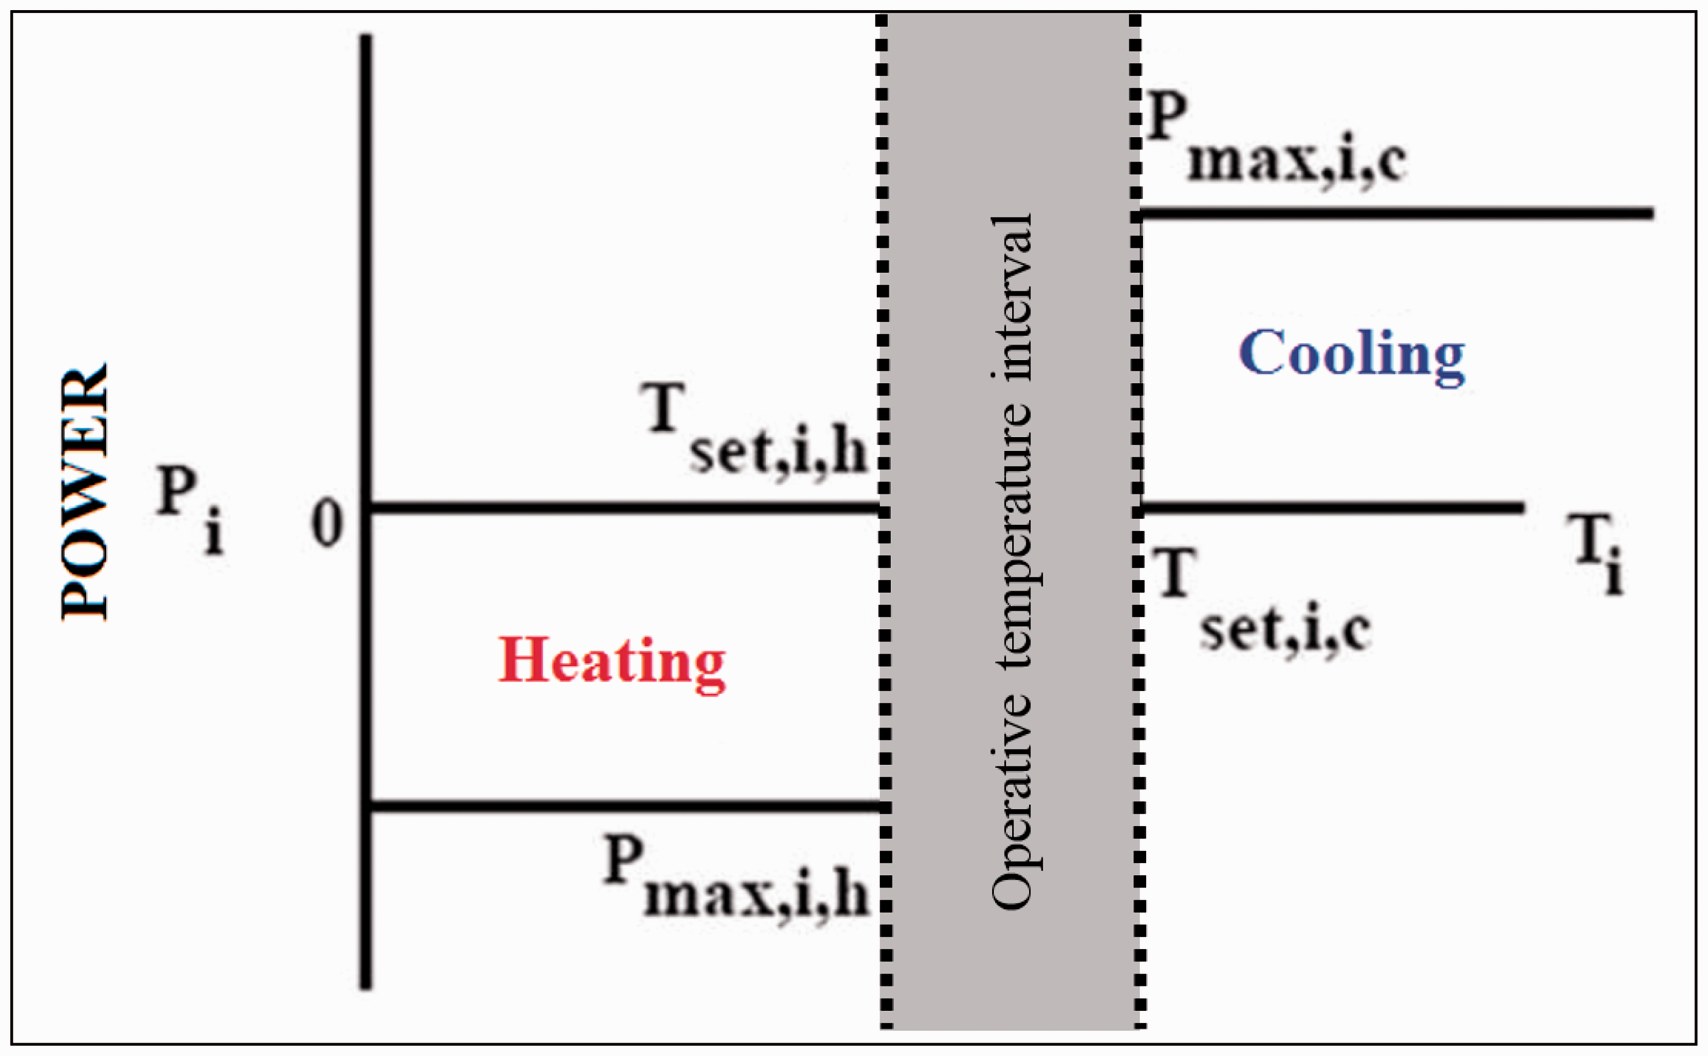
A simplified air conditioning model was used in the TYPE 56, where the energy demand was calculated. The operation of this simplified system was based on the theoretical supposition that the energy requirement of heating and cooling would be always a function of the air node temperature. In Figure 2, a power output versus temperature graph shows the operation of the simplified heating and cooling model, where Pi is the power output for air node i: negative for heating and positive for cooling, Pmax,i is the absolute value of the maximum power for air node i and Tset,i is the set temperature for heating or cooling in air node i. Hence, this calculation will provide the total energy required to keep the temperature within the previously established comfort range.
Operation logic of simplified air conditioning system in TRNSYS (modified from Georges et al.
14
).
The simulation was performed as a non-geometrical balance model with one air node per zone, which represents the thermal capacity of the zone air volume. Furthermore, the heat transfer through the walls and roofs was modelled according to the transfer function method by Mitalas and Arseneault, 16 whereas the star network approach by Seem 17 was applied to calculate the long-wave radiation exchange among the air node and the convective heat flux from the inside surfaces to the air node air. This method creates a new temperature node (Tstar), and then considers the energy from a wall by convection to the air node and by radiation to other walls and windows.
The windows require a special treatment; therefore, these elements were considered to be an external wall without thermal mass, partially transparent to solar radiation, however, opaque to the long wave internal gains. The window model also included a detailed optical and thermal model based on WINDOW 7.3 developed by Lawrence Berkeley Laboratory USA, 18 which calculates a resulting temperature for each glazing: transmission, reflection and absorption of incoming direct and diffuse solar radiation.
The air volume between the roof and ceiling was considered as a thermal node called ‘air plenum’. The ventilation of the plenum was expressed as air volume changes per hour and was treated as infiltration. The inlet airflow temperature was considered to be the same as the outdoor ambient temperature. The plenum outlet airflow temperature would be equal to the node temperature resulting from the calculated energy balance.
System conditions and methodology
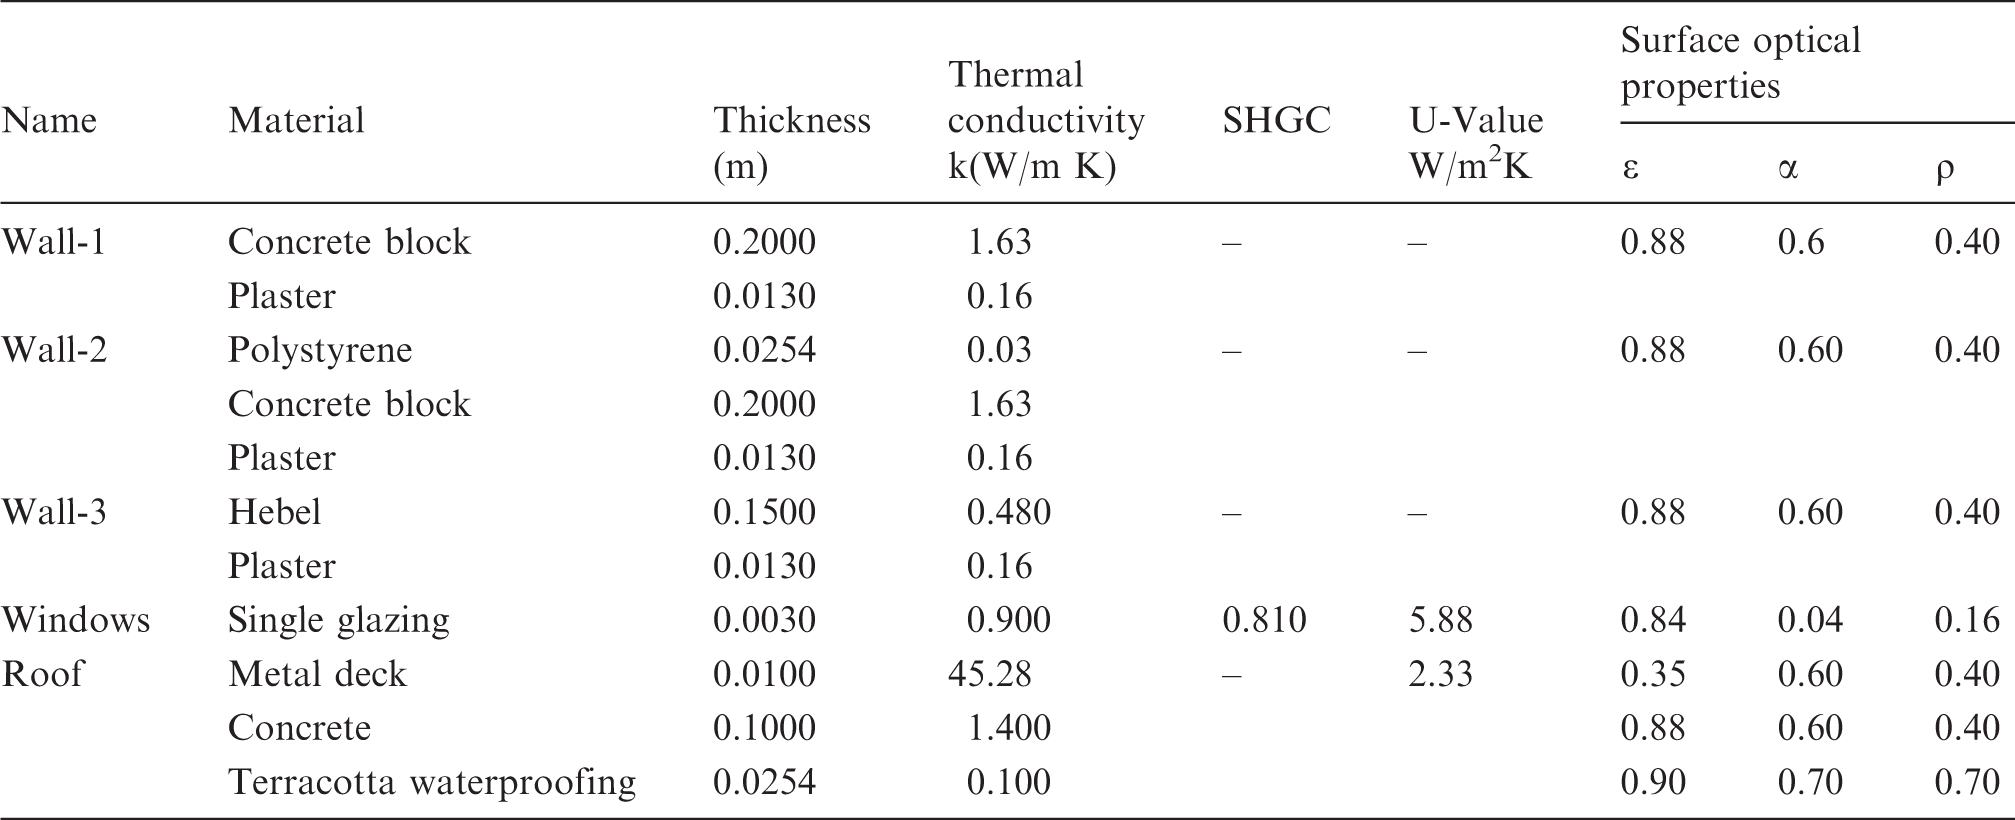
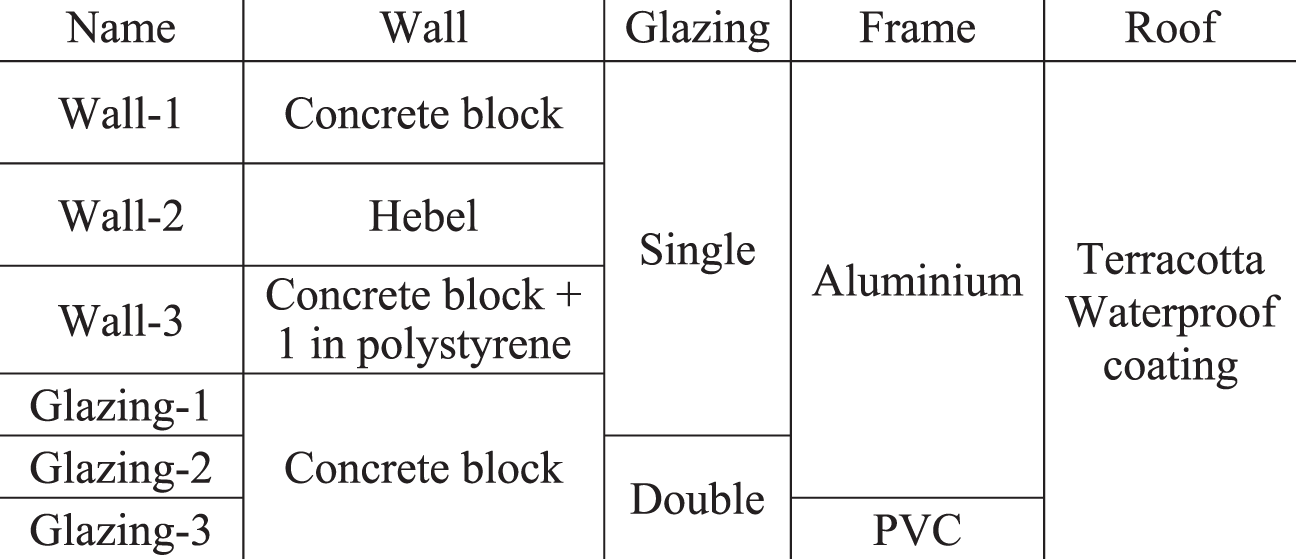
A climatic analysis for the region was performed, where solar radiation, hourly mean temperatures, humidity and wind speed were provided by the weather data software Meteonorm. The location and weather conditions were supplied in the format of typical meteorological year format (TMY) and were generated in intervals of 15 min. Six thermal zones (Figure 1(b), an occupation profile and the indoor thermostat control were established. Bioclimatic concepts were applied during the design and space distribution process; afterwards the building’s materials and operative conditions were incorporated. An initial case of study named ‘base building’ was developed considering regional construction materials 19 ; the materials were: concrete block walls, single glazing windows with an aluminium frame, single glazing skylights, terracotta waterproofing at the roof, and the internal partitions were considered to be made of sheetrock.
Several simulation cases were set, so the thermal performance of the building could be calculated. The base building case was simulated without considering an air conditioning system. The obtained parameters represent the thermal performance of the building design such as construction materials, location and orientation.
Thermal and optical properties of construction materials.
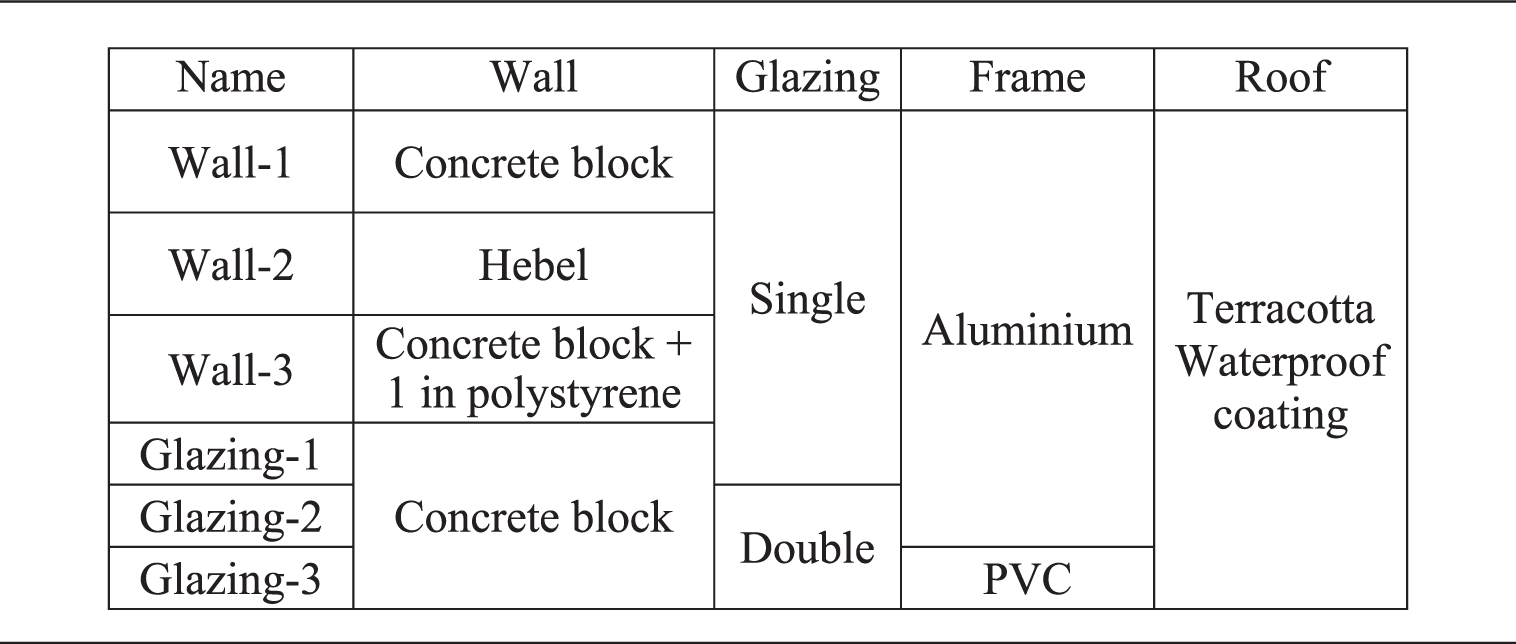
Wall and glazing studied cases.
The building occupational profile, which affects the air conditioning system usage, was added to the model in order to improve the accuracy of results. The climate control was set to work only during the set occupational periods: Monday to Friday from 7:00 to 19:00 h. A TRNSYS diagram is presented in Figure 3, where the inputs and outputs of the building are shown.
TRNSYS implementation scheme.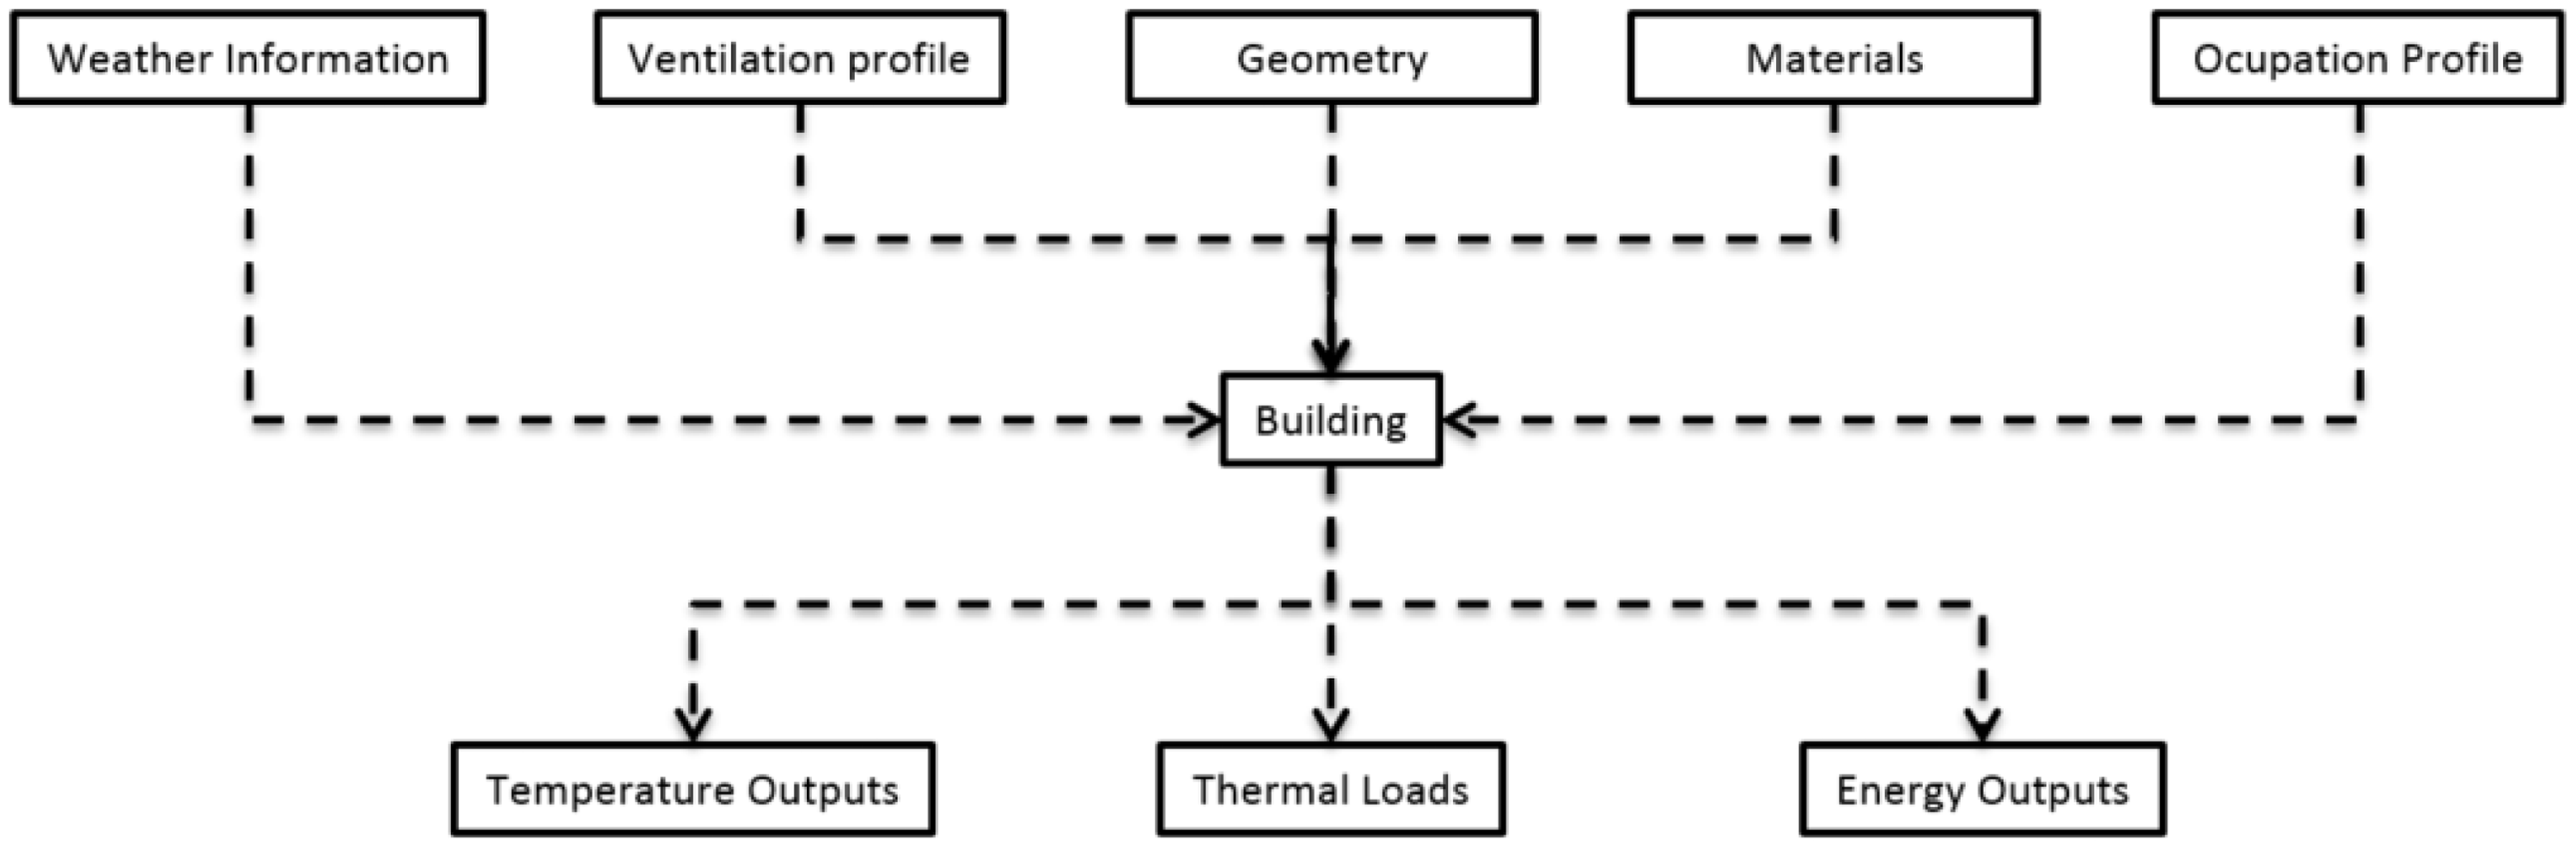
Results
An analysis of the mean hourly temperatures (Tmean) and the thermal loads, which were obtained as a result of the air conditioning when the comfort criteria were not satisfied, is presented. The thermal comfort range was set from 20 to 28℃; meanwhile, the results were divided as follows: base building without air conditioning, base building with air conditioning and base building with air conditioning and ventilation.
Base building without air conditioning
The results of the base building without conditioning were obtained to estimate the building’s envelope performance prior the use of acclimatization systems. Figure 4 shows the behaviour of the indoor and outdoor mean temperatures. The minimum temperature (Tin-min) inside the building was 3.9℃, whereas the maximum temperature (Tin-max) was up to 38.8℃. The indoor temperatures were attained, while the outdoor minimum and maximum temperature (Tout-min and Tout-max) were −3.8 and 35.3℃, respectively. These temperatures were reached when the building was not utilizing an air conditioning system, which is clearly outside of the comfort temperature range. The coldest day occurs during the month of January, whereas the hottest day is during the month of May. The building’s thermal shelter would be provided exclusively by the envelope and the interior temperature could be up to 7.6℃ during a cold day; nevertheless, during a hot day the interior could reach up to 3.5℃ more than the outsides temperature (38.8℃).
Indoor and outdoor temperatures of analysed building in Durango, Mexico.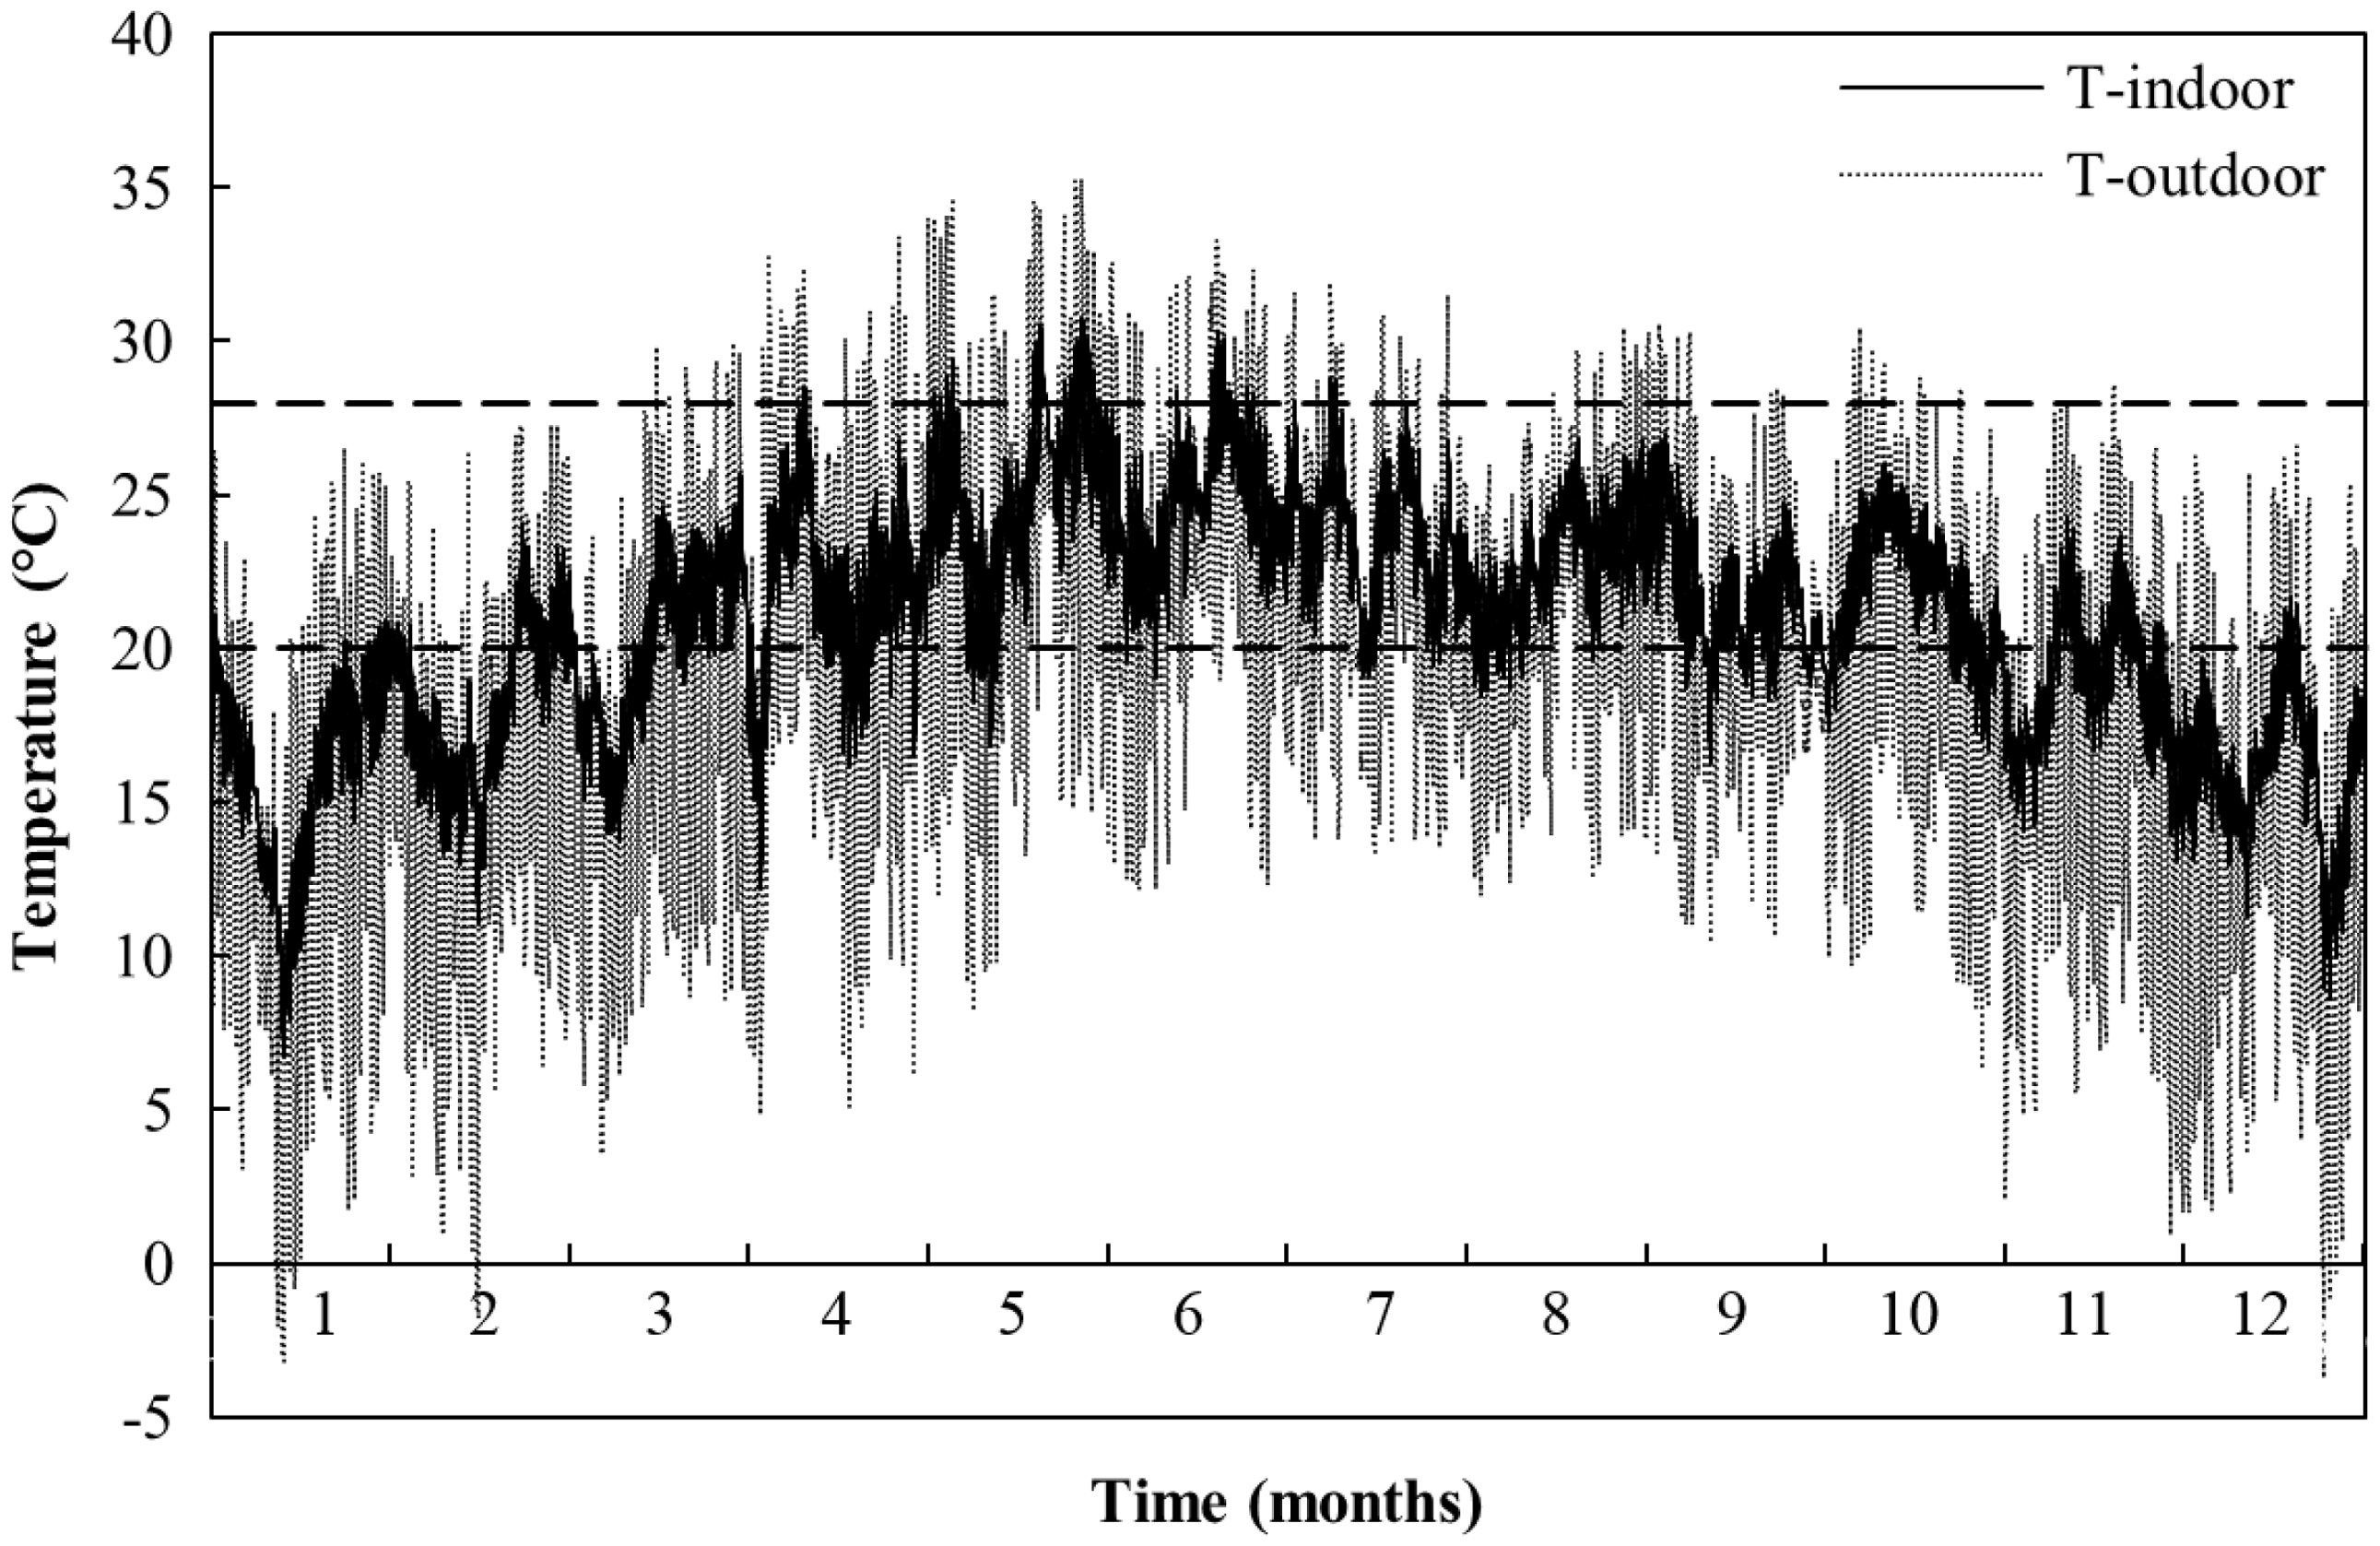
Base building with air conditioning
A fan and coil air conditioning system was integrated to the base building simulation. As mentioned before, the heating and cooling system was turned on for the working schedule which runs through Monday to Friday from 7:00 to 19:00 h, and also when the temperature was out of comfort range (20–28℃) when the air conditioning system was turned on.
Base building with air conditioning and ventilation
The third case represents the base building with the addition of a ventilated ceiling. After analysing the results of the behaviour of the conditioned base building, a ventilation strategy was applied.
A simple but effective ventilation strategy was applied to the second storey ceiling during the warm months; as a result, the refrigeration load was reduced. In this region, the warm months run from May to the end of August. The ventilation of the second storey ceiling was incorporated by adding a ventilation on the existing ceiling (0.90 m) creating an air entrance from the exterior. The temperature of the incoming air would be maintained at the climatic conditions at the moment after entry; at this stage of the analysis, the incoming air temperature was not restricted by a temperature sensor. The incoming air would then enter through four ventilation grids of a total of 2.0 m2 area; the ventilation inlet would be situated at the south side of the façade and an equal size of outlet grids at the northern side of the building. The velocity of the air inlet was equal to the mean wind speed provided by the local climatic conditions.
Discussion
In Figure 5, the proposed ventilation strategy is sketched, where the air inlet is located at the southern part of the façade and the air outlet at the northern façade. A total of 2.0 m2 of inlet ventilating grids were placed in the southern façade to allow the air circulation through the ceiling. An equivalent area of outlet ventilation grids was placed on the northern façade of the building, allowing 20 air changes per hour across the ceiling (1265 m3/h of fresh air).
Ventilation strategy applied to the building.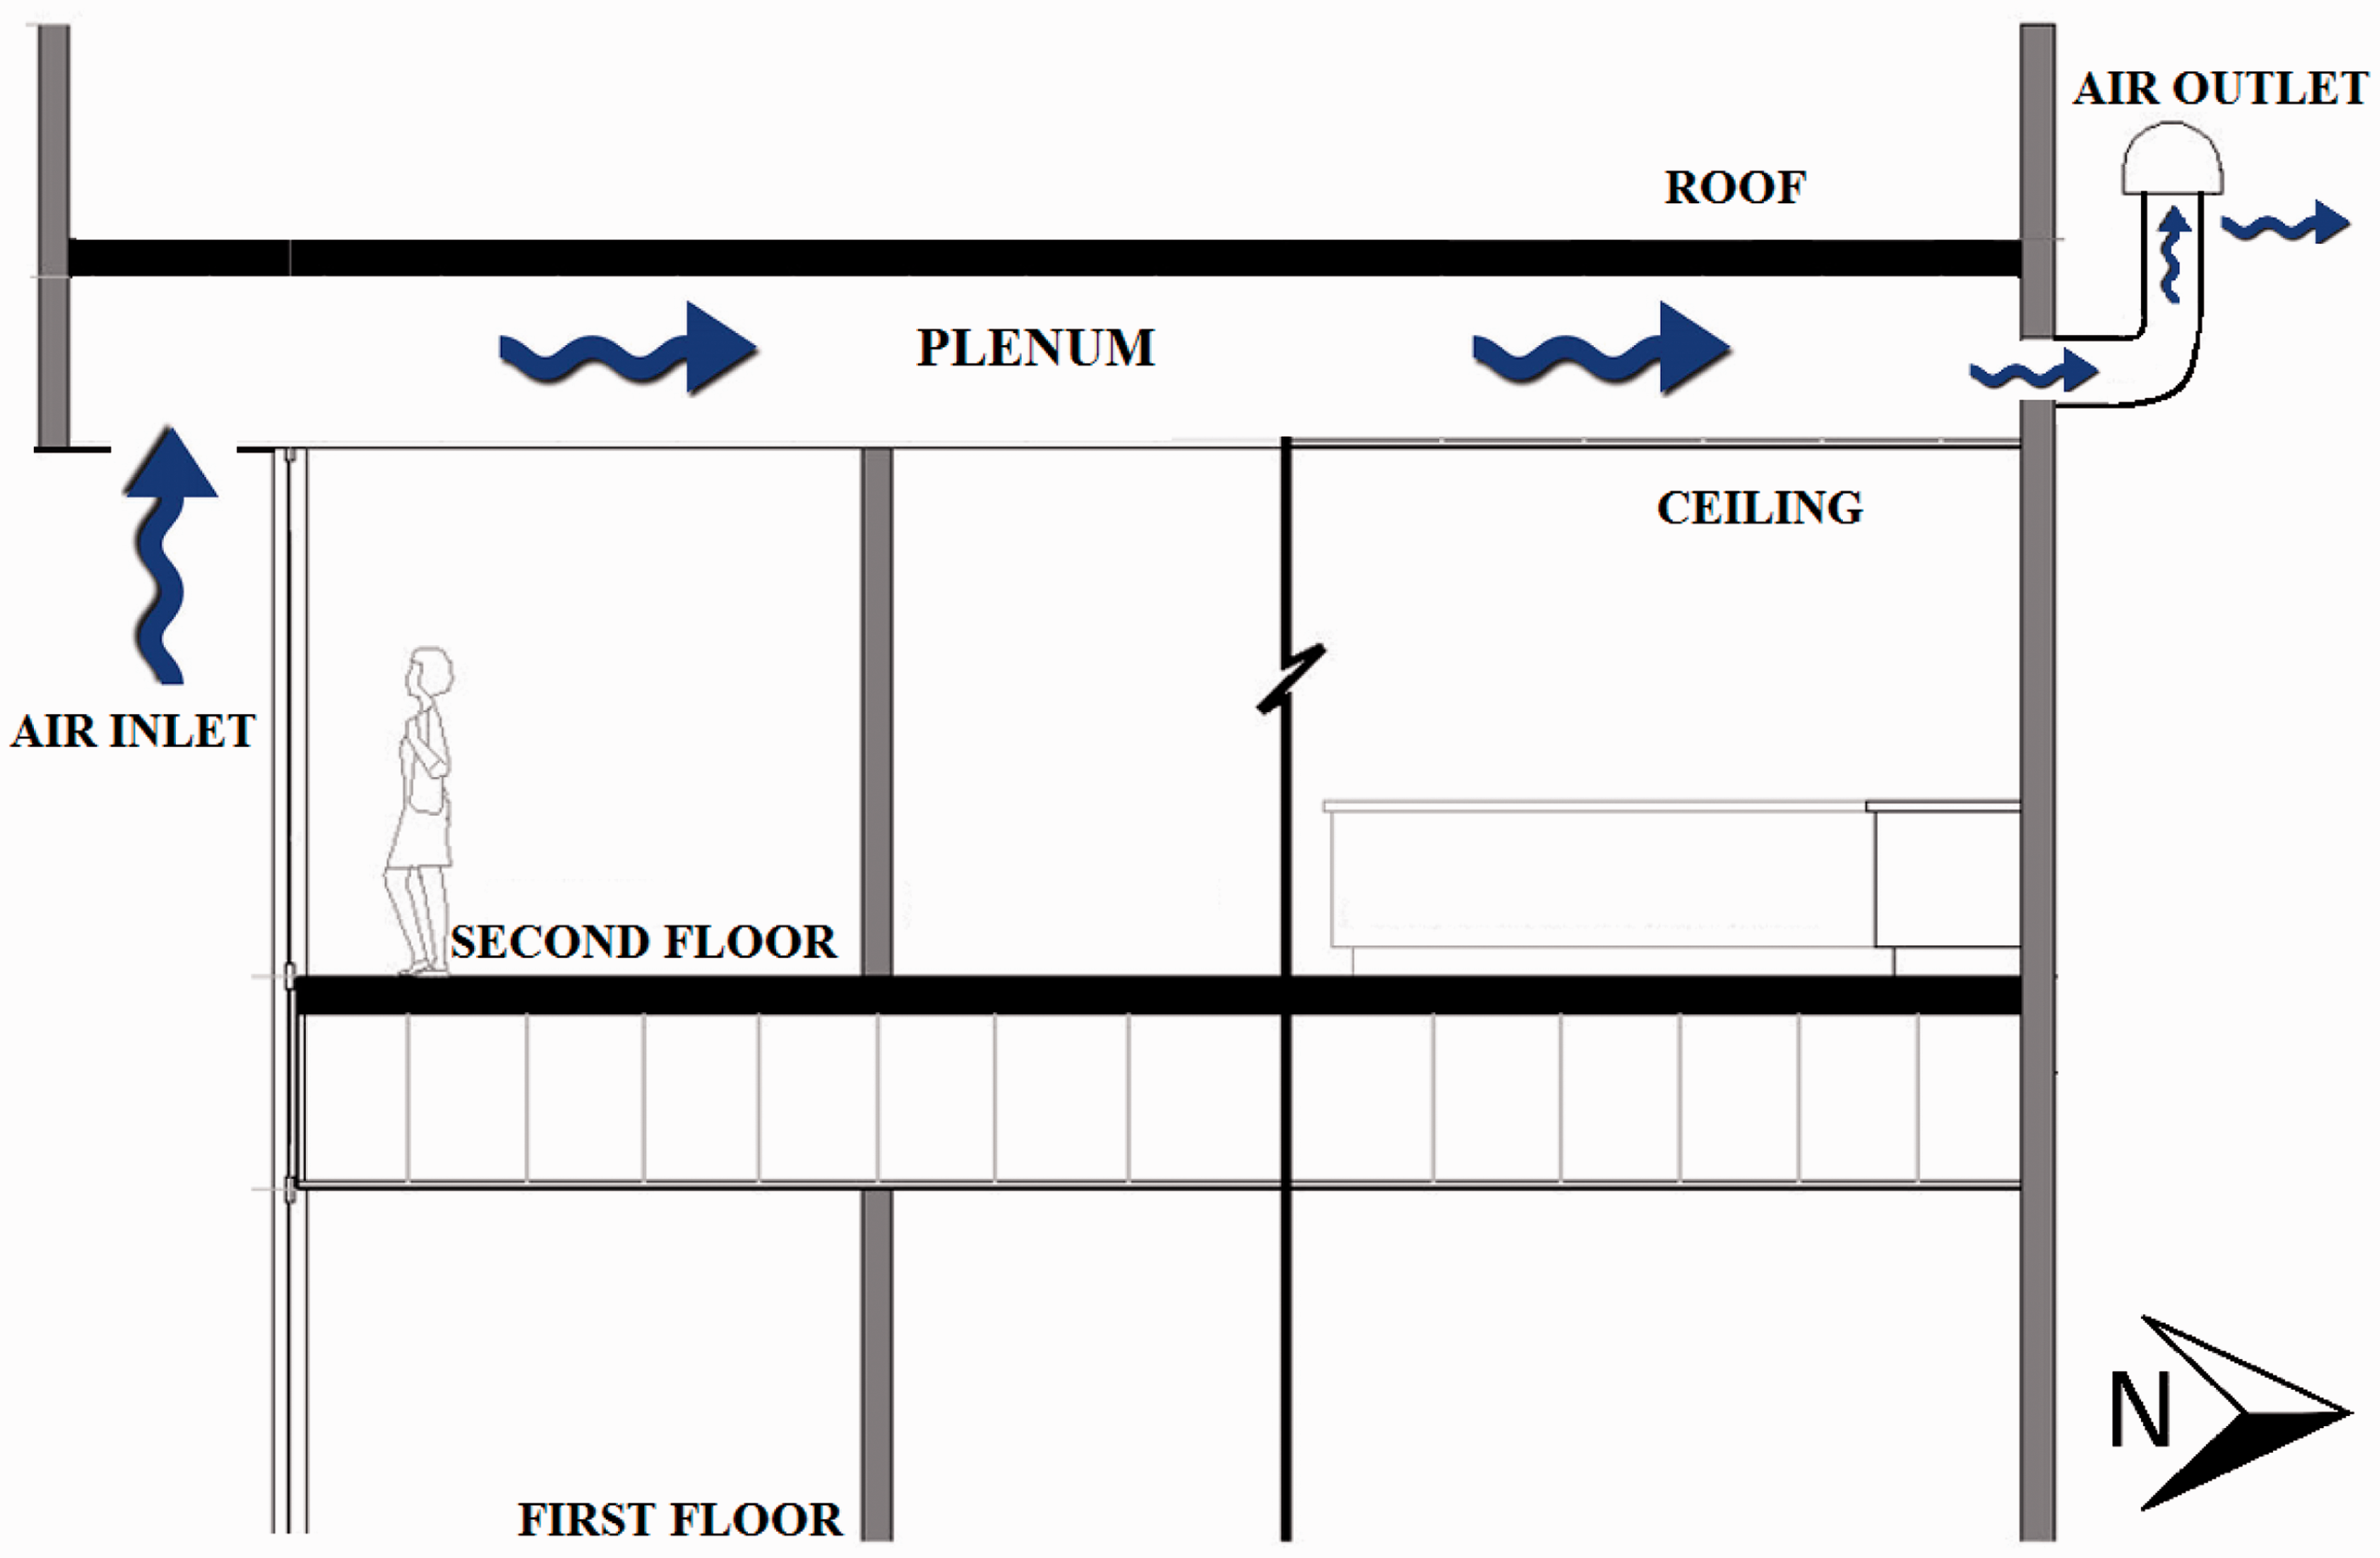
In Figure 6, the hourly mean temperatures of the building during the warm months of the year and the hottest week of May, with and without the implementation of the ventilation strategy are shown. In both graphs, the dotted black line represents the outdoor mean hourly temperatures, whereas the black and red lines represent the indoor mean temperatures on the second floor. In Figure 6(a), the behaviour of the mean temperatures of the building is shown, where temperatures of the unventilated building were shown to be higher than temperatures from the ventilated building. From this graph, the need to show a more detailed behaviour of the temperatures arises; therefore, in Figure 6(b), a comprehensive performance of the building’s ventilation strategy and conditioning was plotted. The horizontal behaviour of the black and red lines indicates the duration of the air conditioning periods. Two dark grey areas are located at the beginning and end of the graph, which represent hours of the weekend when the air conditioning systems are turned off. The building working hours from Monday to Friday are shown by light grey areas. Within the working hours period, the air conditioning usage profile can be observed. Air conditioning periods are longer when the second floor ceiling is not ventilated; on the other hand, they are shorter when it is ventilated. This has a direct impact on the energy consumption due to the usage reduction of the air conditioning systems. When the outdoor air enters the second storey ceiling, outdoor ambient temperature would influence the behaviour of the mean temperature at the second floor, reducing the indoor mean temperatures and reducing the energy consumption due to air conditioning during the warm months.
Hourly mean temperatures when ventilation strategy is applied: (a) warm months and (b) hottest week of May.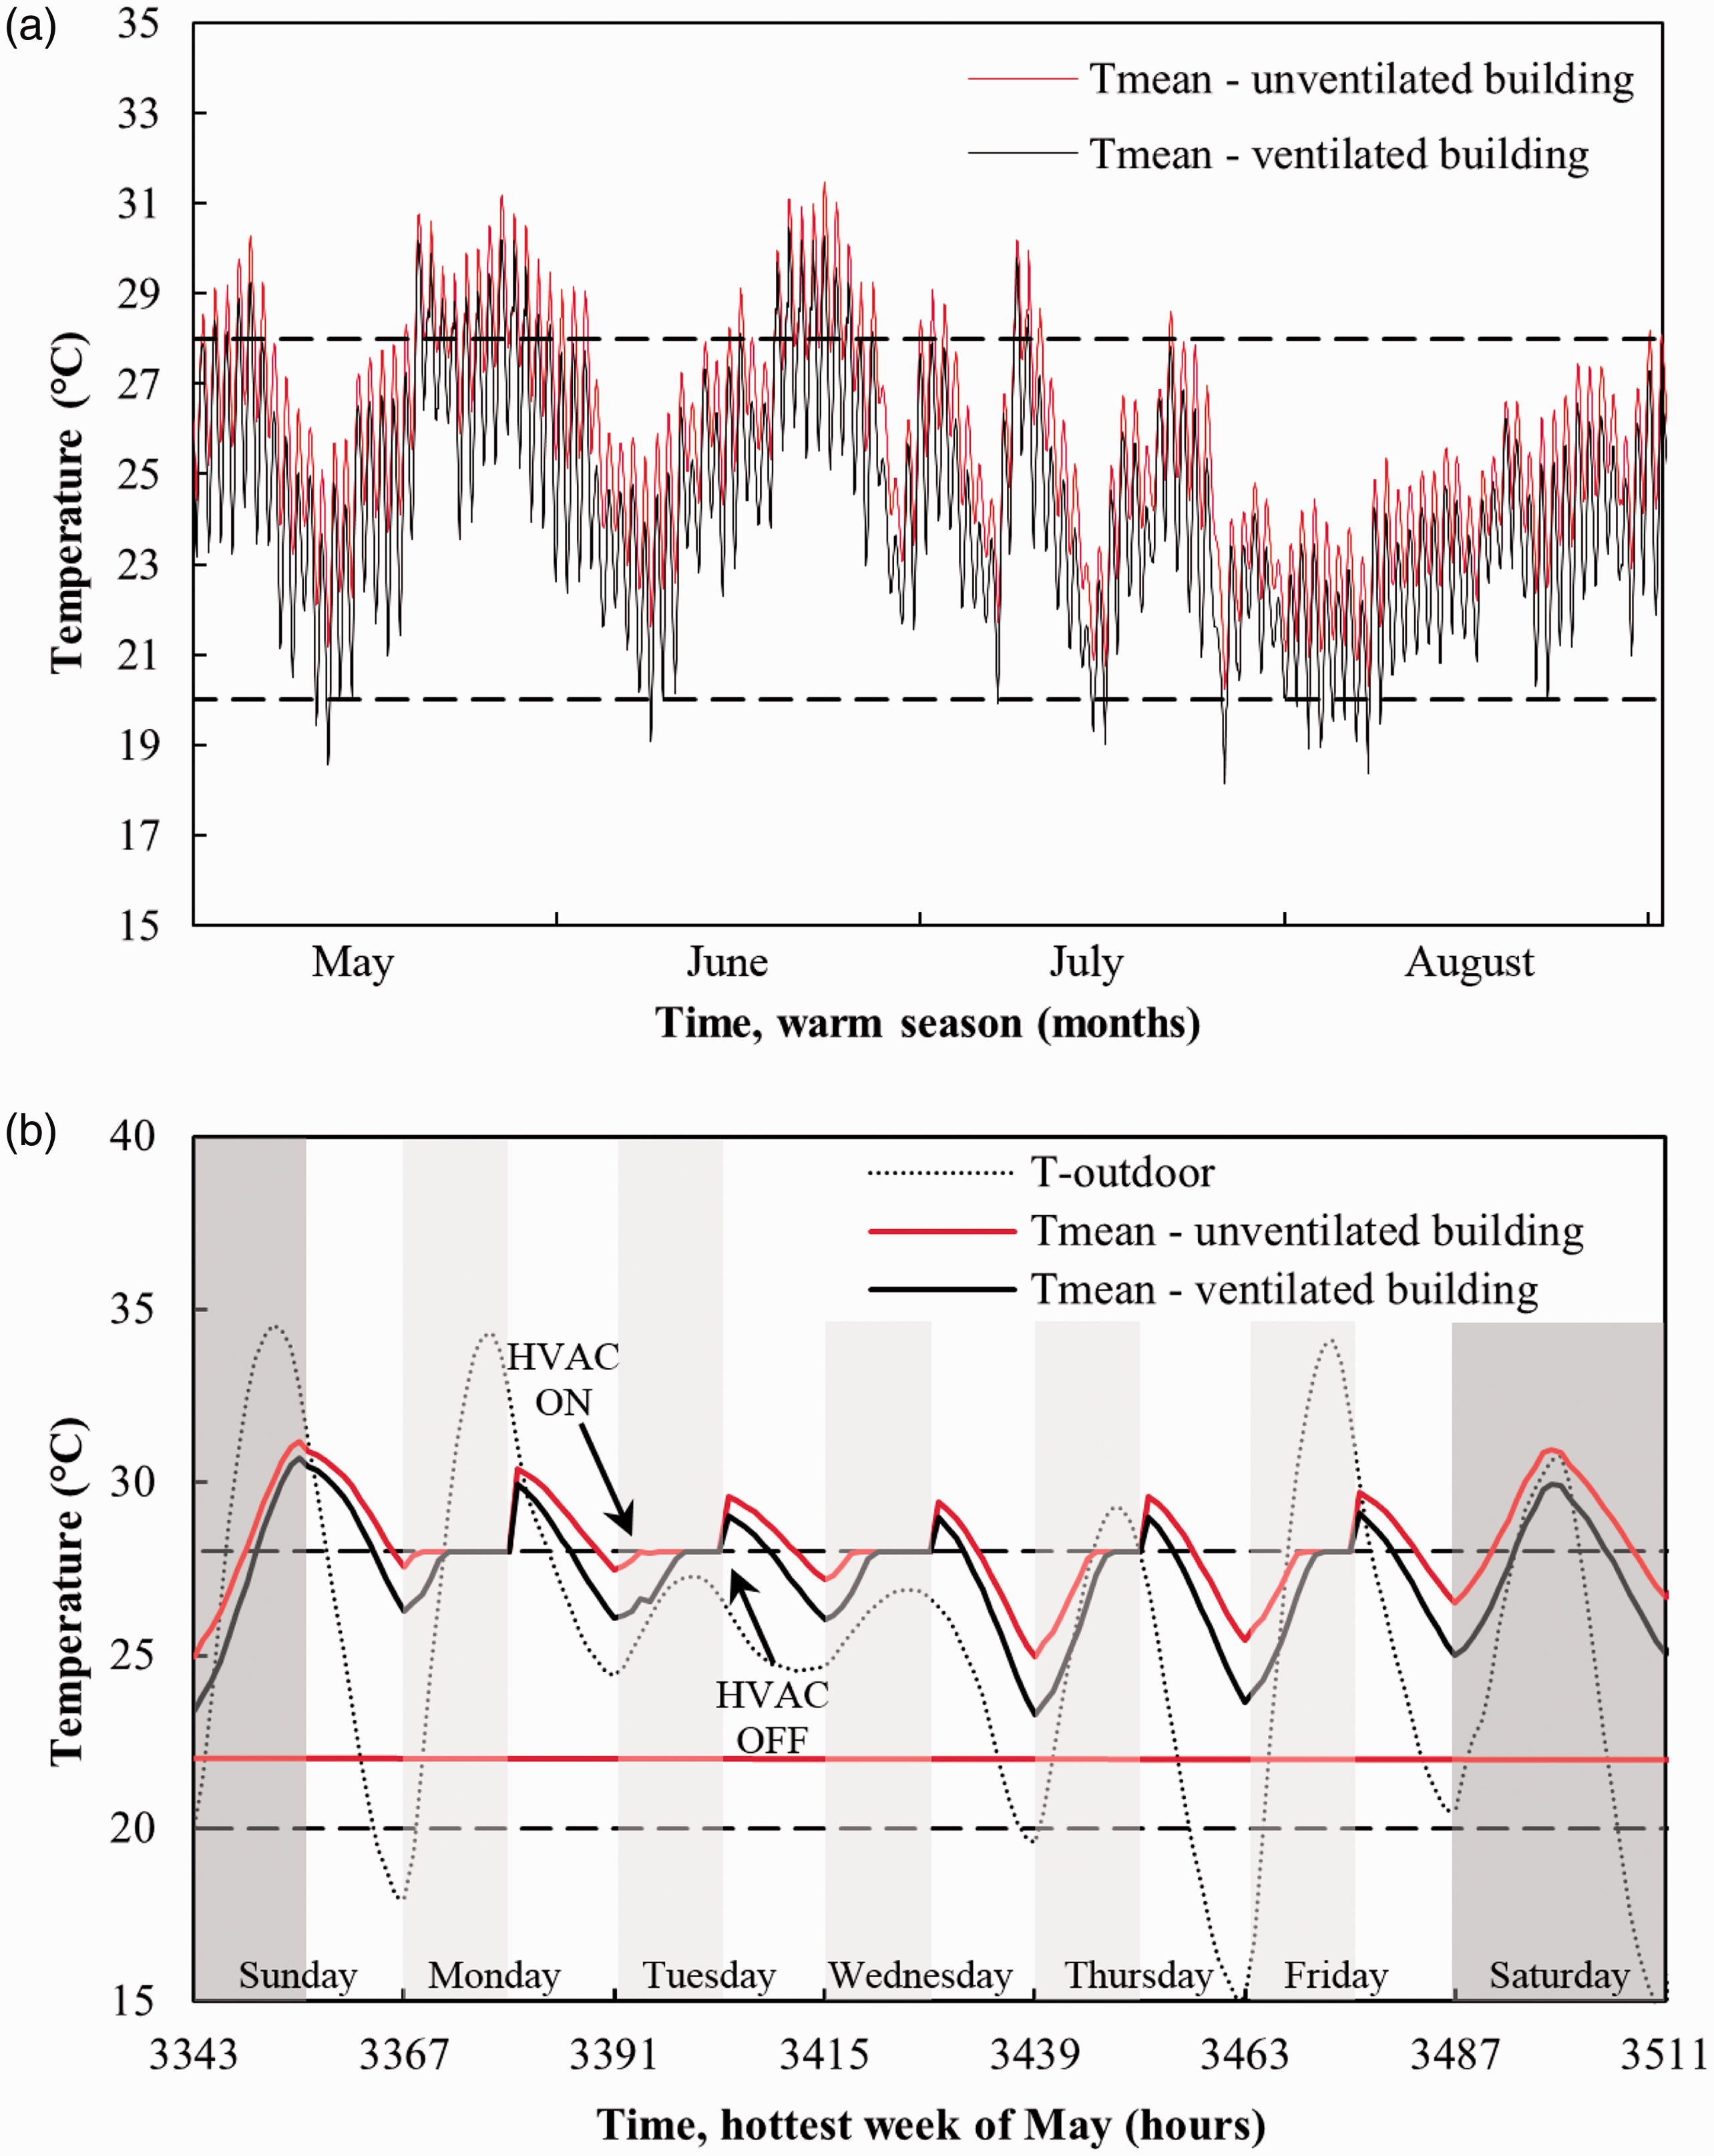
After the incorporation of the ventilation in the second storey ceiling, an analysis of the impact in the choice of construction materials was performed. For this purpose, regional available construction materials were employed, such as, concrete block, concrete block with an inch of polystyrene and a Hebel block. In Table 2, the studied cases for the wall and glazing are specified.
With the aim of proving that the energy consumption can be reduced by making smart decisions with the choice of available materials and a careful examination of the building through dynamic simulations, in Figure 7, the hourly mean temperatures for the coldest week of January and the hottest week of May are graphed. Figure 7(a) indicates how the mean temperature of each zone behaves, where slight temperature differences are noted between the three wall configurations. The behaviour of temperatures during the week of January confirms that the worst configuration is wall-1. Nevertheless, further analysis involving a combination of strategies is needed to be done in order to reach a conclusive result.
Hourly mean temperatures when different wall configurations are applied: (a) coldest week of January and (b) hottest week of May.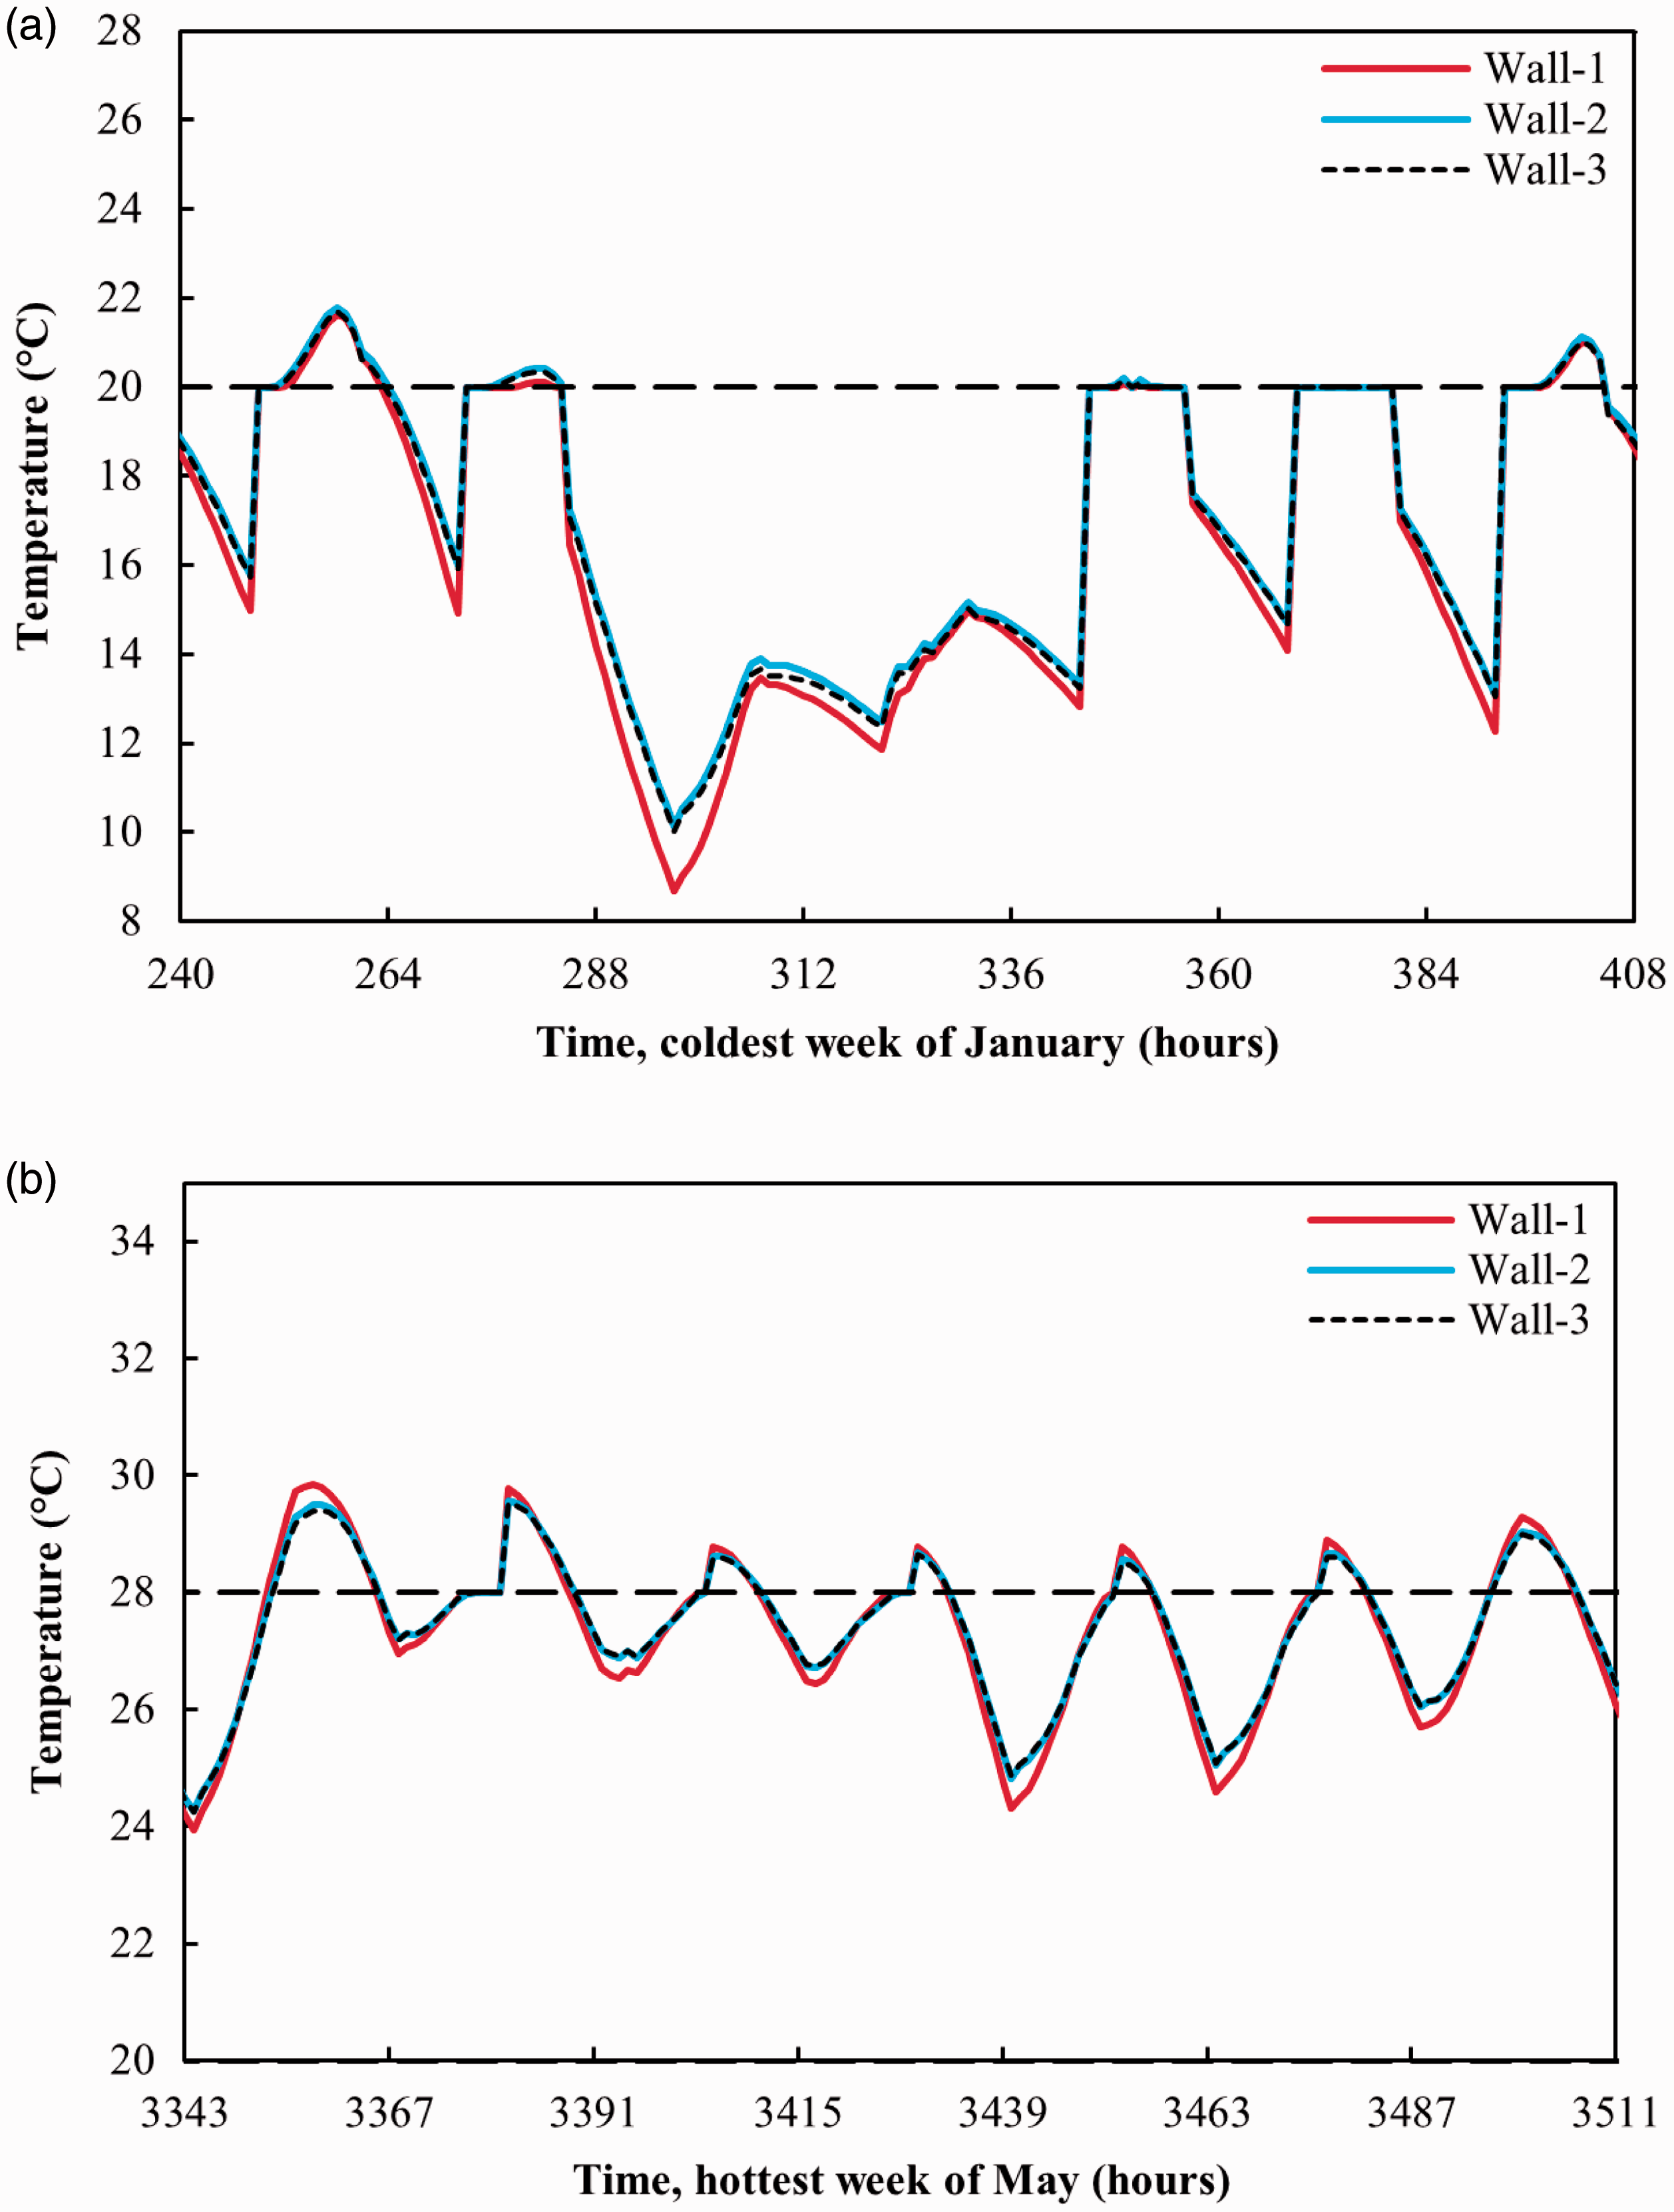
A basic analysis on the glazing and frame implementation was also performed, where a comparison between single and double glazing with aluminium and PVC frames is shown in Figure 8. In Figure 8(a), the hourly mean temperatures are observed to be strongly affected by the glazing type, where glazing-1 (single glass with aluminium frame) reaches lower temperatures than configurations glazing-2 and glazing-3.
Hourly mean temperatures when glazing strategy is applied: (a) coldest week of January and (b) hottest week of May.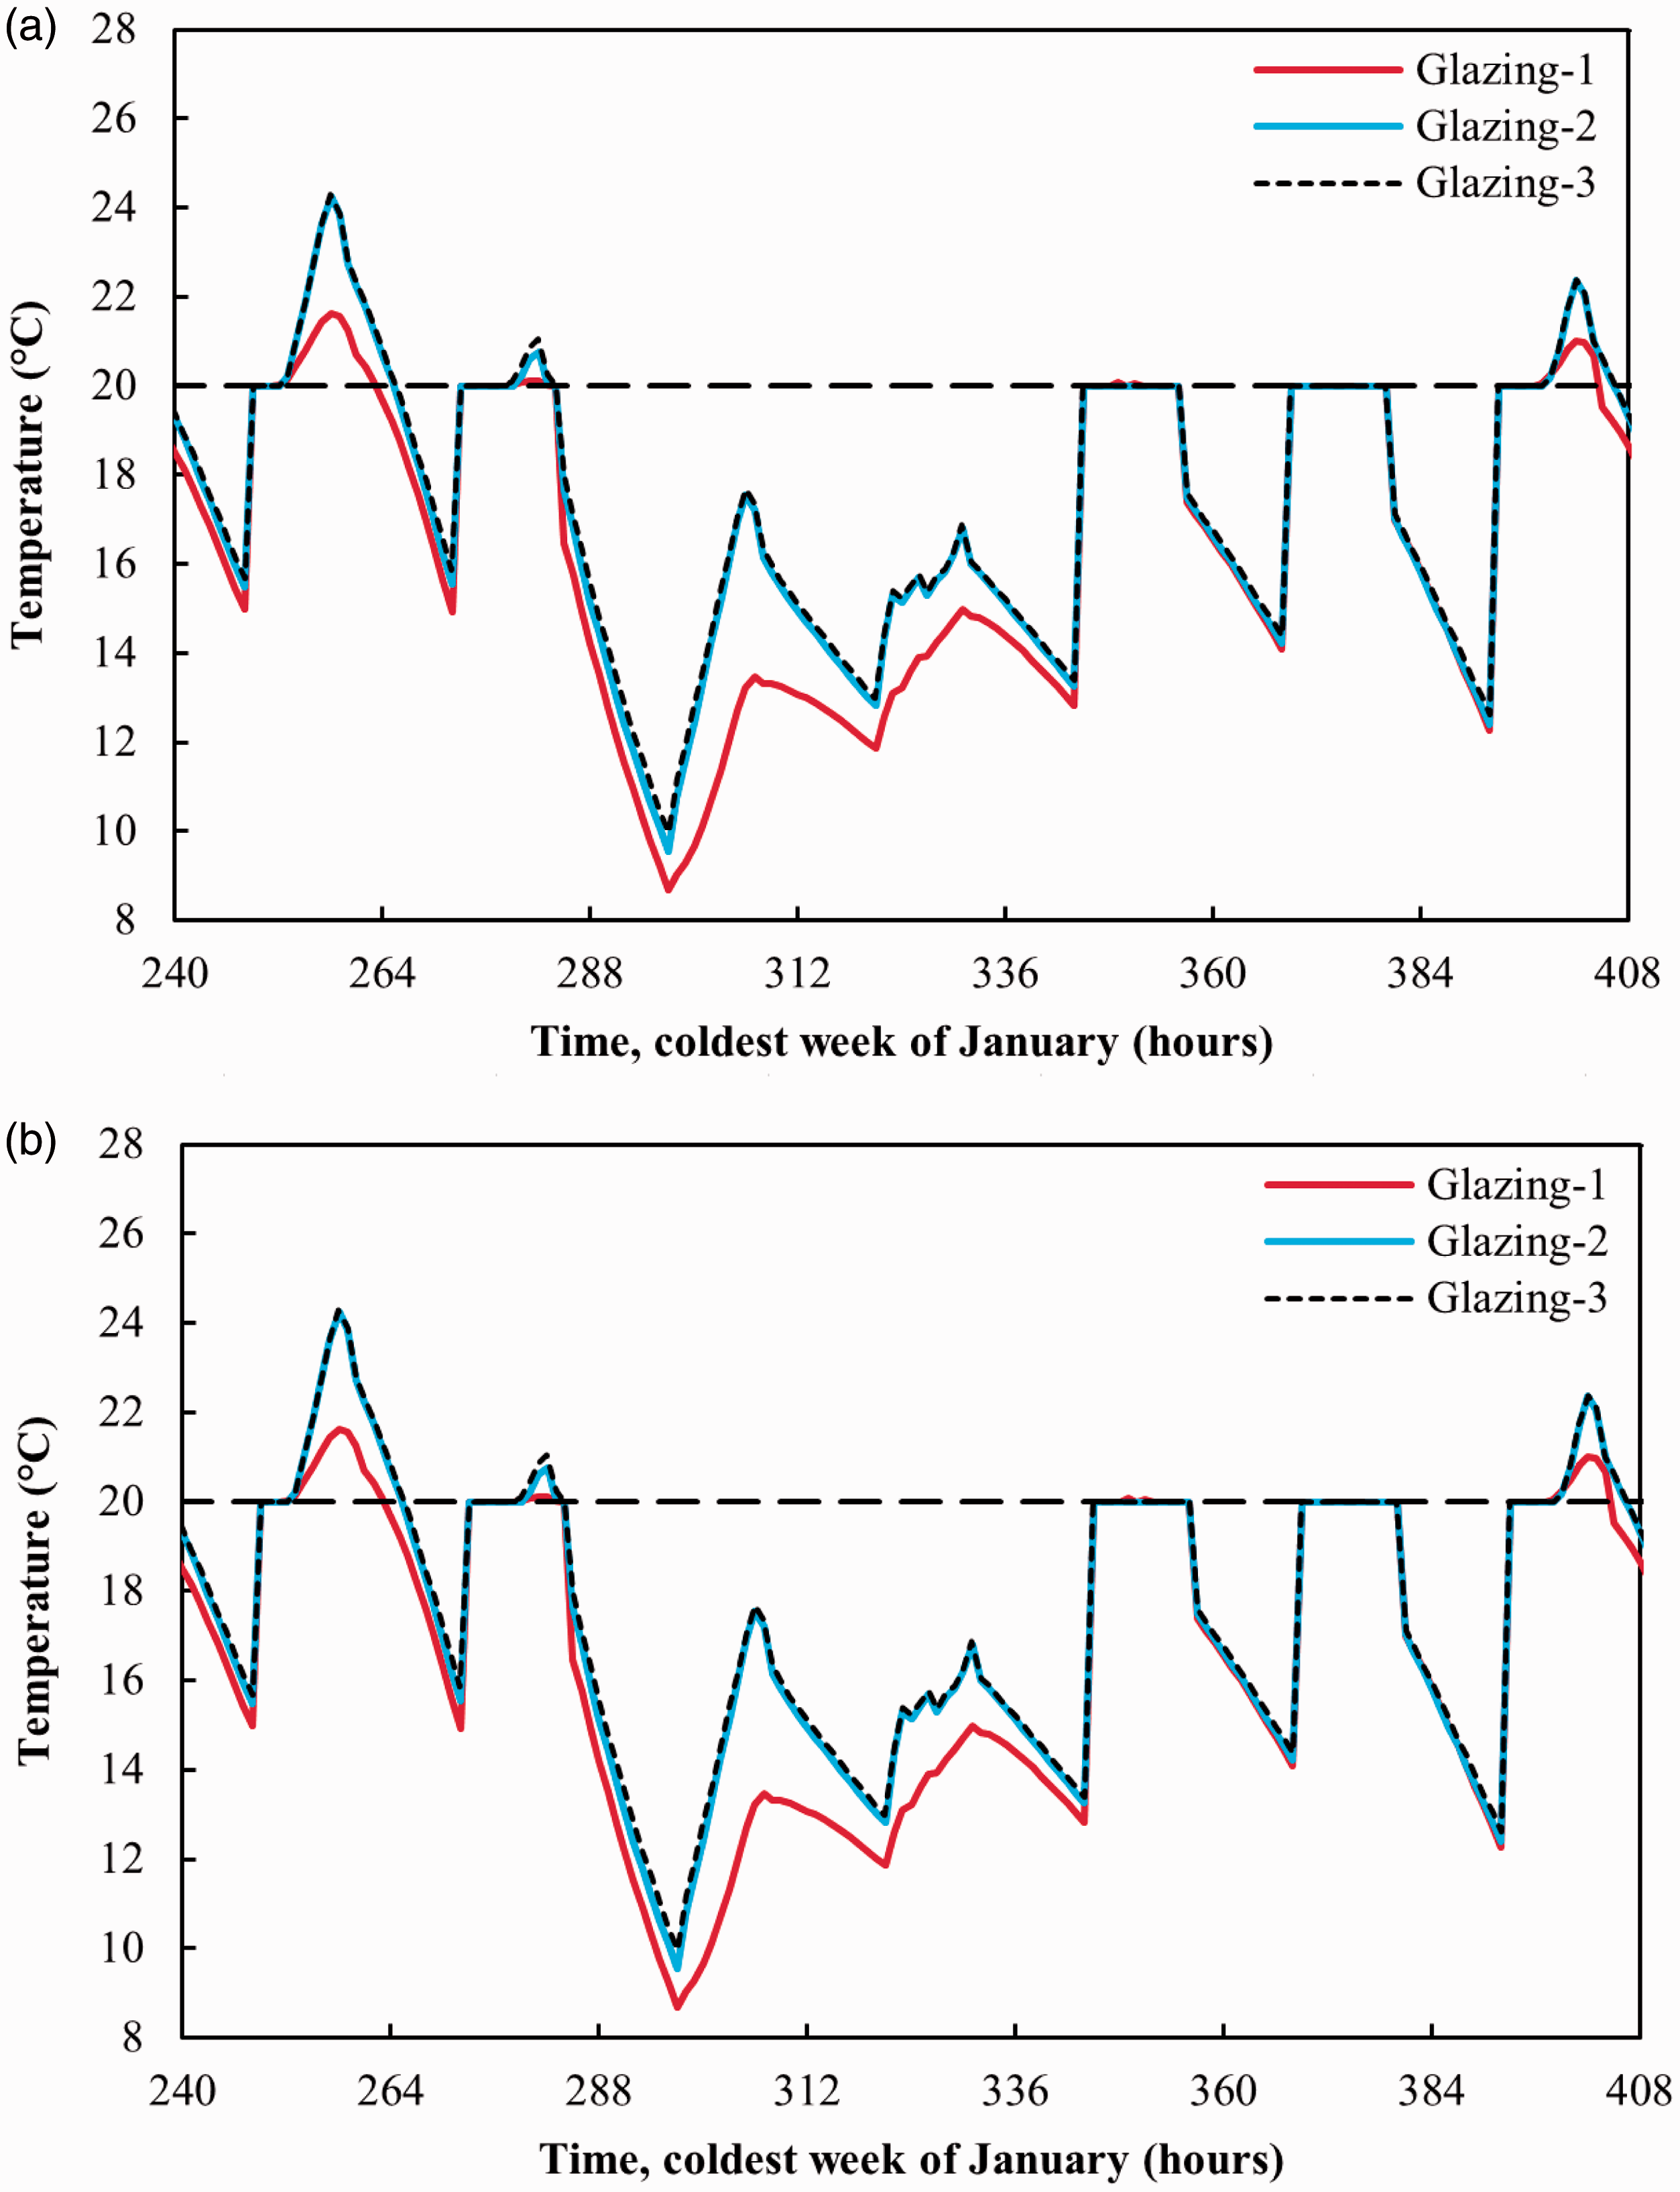
As a final analysis, the implementation of the best choice of strategies is presented in Figure 9, where the base unventilated building is compared with the ventilated building along with the selection of wall-3 and glazing-3. In Figure 9(a), it can be observed how the temperatures behave during the coldest week of January, where the building’s conditioning system struggled to reach the desired 20℃ due to the low outdoor ambient temperatures. It can also be noted that the indoor temperatures of the base declined during the night-time due to the system usage restriction from 19 to 7 hours and also during the weekend (in this case around hours 285 to 335). In the case of the hottest week of May, (Figure 9(b)), a lower temperature as expected is shown. Also, a robust thermal inertia of the indoor temperature behaviour against the outdoor ambient temperatures is strongly noticeable.
Hourly mean temperatures of base building and the applied strategies: (a) coldest week of January and (b) hottest week of May.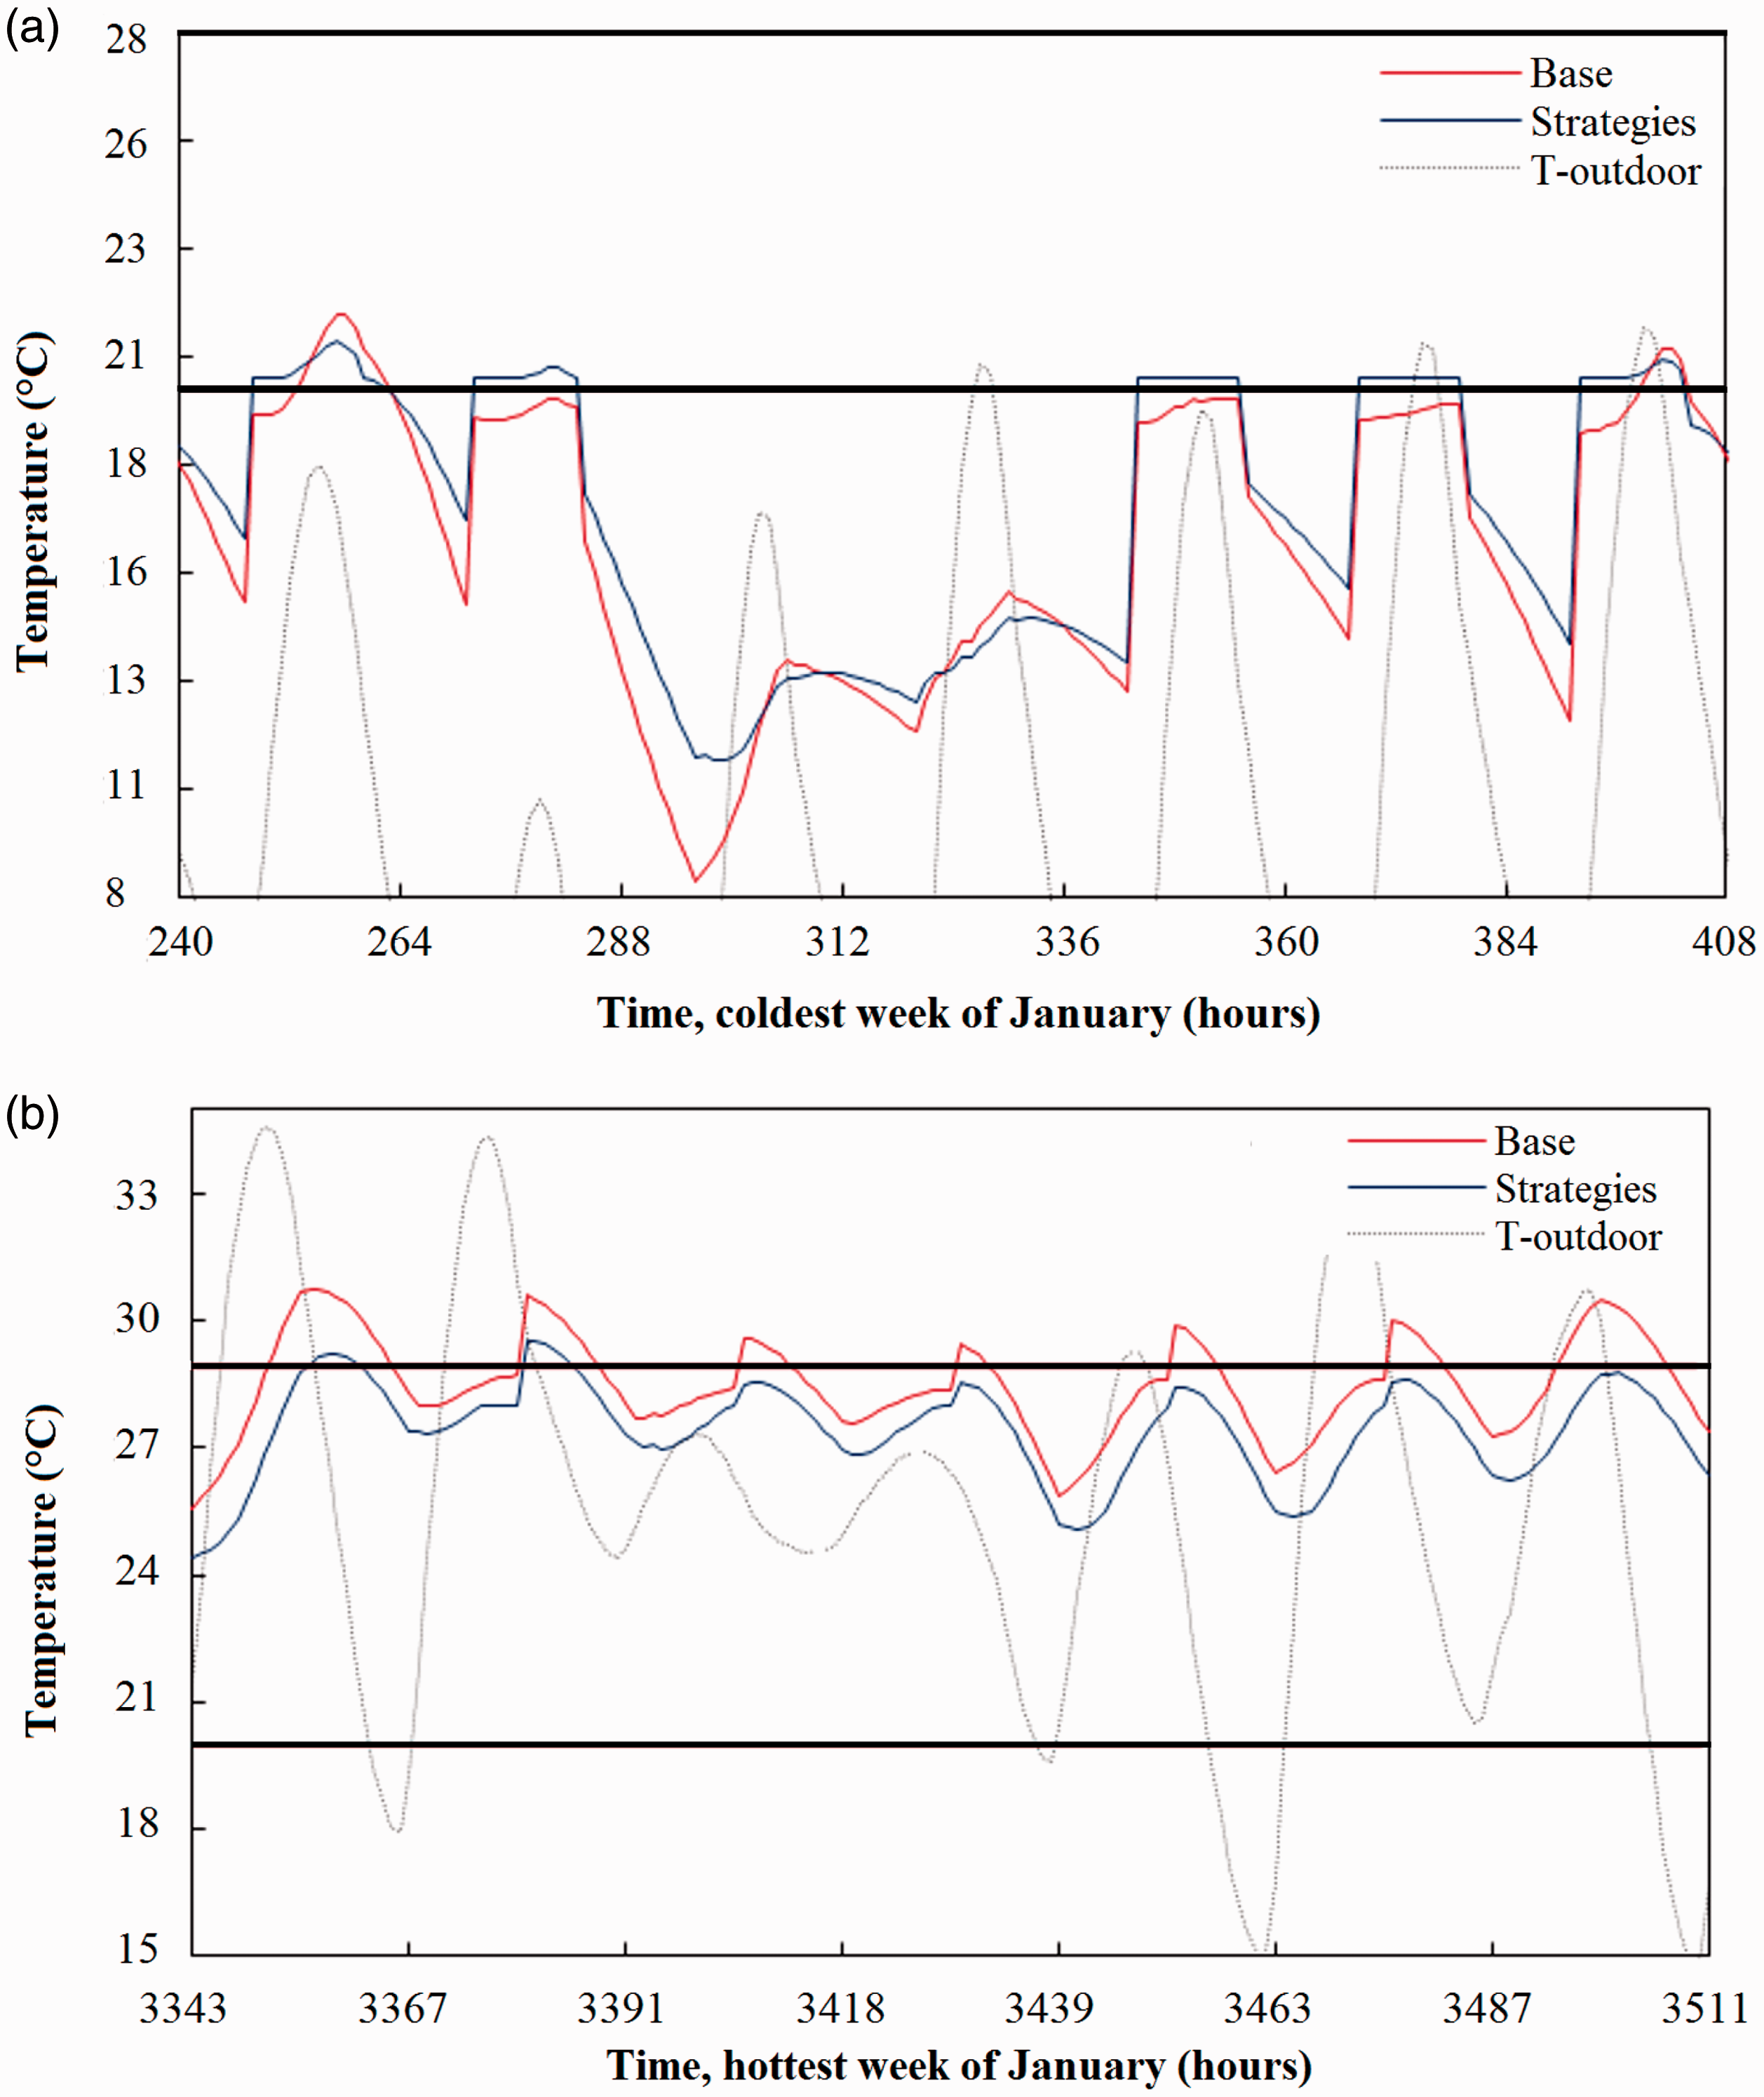
Ventilation: For the unventilated building, the required cooling load obtained with the dynamic simulation was 2845 kWh, while the required heating load was 16,330 kWh. With the application of the ventilation strategy during the hottest months, the cooling load was reduced by 37%; Wall: The use of a concrete block with an inch of polystyrene could successfully reduce up to 14% of the required heating load that the building would need if it was constructed solely with concrete blocks; Glazing: A 23.5% reduction on the heating loads was calculated when the single glazing and aluminium frame (glazing-1) versus double glazing with PVC frame (glazing-3) are compared.
Summary of required cooling and heating loads.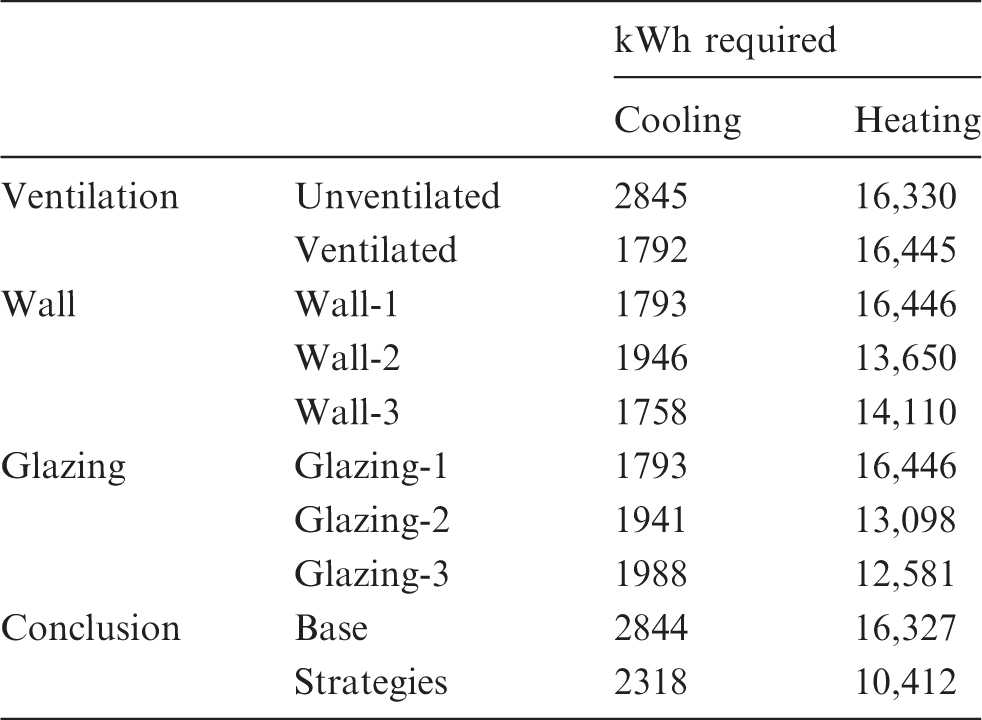
Conclusions
A building’s thermal assessment for the research centre ‘Centro de Investigación en Materiales Avanzados’ – CIMAV at the state of Durango, México using a dynamic simulation software was carried out. Various energy saving strategies were implemented resulting in the implementation of a ventilation arrangement on the second’s floor ceiling during the warm season which comprises the months from April through the end of August. This strategy was proven to be as an effective measure to reduce the energy consumption due to air conditioning during the warm months. A 37% energy saving is accomplished due to the ventilation strategy; however, the heating needs were raised by approximately 1%, which was due to some cool days in April, and in November, the space would be cooled by ventilation. However, this can be prevented if a temperature sensor is installed to regulate the incoming air’s temperature at the entry grids. As a conclusion of the implementation of different construction and glazing materials, a 14% reduction in the energy bill can be accomplished with the use of one inch of polystyrene as insulation for the concrete block walls (wall-3). Comparing the performance of the three different glazing systems, glazing-3 was proven to save up to 23.5% in the annual consumption due the heating system.
Finally, with the implementation of the three different strategies (ceiling ventilation, wall-3 and glazing-3), a new building was to be considered. Then, a new synergy between the envelope materials is generated where a total of 36% and 18.5% for the heating and cooling systems was calculated as potential annual saving in energy.
Footnotes
Authors’ contribution
All authors contributed equally in the preparation of this manuscript.
Declaration of conflicting interests
The author(s) declared no potential conflicts of interest with respect to the research, authorship, and/or publication of this article.
Funding
The author(s) disclosed receipt of the following financial support for the research, authorship, and/or publication of this article: The authors would like to thank the FOMIX-Durango project: DGO-2014-01-229107 and the CeMIE-Sol project P13 (2013:02 CONACYT-SENER Sustentabilidad Energética).