
Abstract
Air distribution systems generally focus on diluting contaminants and distributing conditioned air. However, this strategy has a potential for spreading particulate matter or bioaerosols. Thus, it is considered to be useful to create a non-uniform indoor environment to prevent such dispersion of particulate matter or bioaerosols, and an air curtain could serve for this purpose. This study investigates the effects of an air curtain system in a ventilated office to prevent the dispersion of expiratory droplets that are generated locally, while also considering thermal comfort. Droplets dispersion was modelled with computational fluid dynamics (CFD) with the Lagrangian method. In the CFD simulations, an air curtain system was installed in the middle of an office with varied factors of design, orientation and jet velocity of the air curtain system. Numerical results showed that unless there was an independent inlet and outlet for each region, the air curtain system alone could not create a non-uniform thermal environment; however, it was effective in removing and preventing dispersion of the expiratory droplets. The droplet removal performance of an air curtain system was not proportional to its jet velocity, but a velocity of 3 m/s was found to be feasible for this office. The air curtain system showed better performance than an air cleaner used to exhaust and filter the expiratory droplets.
Keywords
Introduction
Many studies have reported that indoor air pollutants could negatively affect human health in indoor spaces, manifesting themselves in sick building syndrome, respiratory disease and carcinogenic effects.1–4 Consequently, indoor air quality (IAQ) has become a significant concern at both public and government levels.5–8 In order to provide comfortable and healthy indoor air, many commercial and institutional buildings have mechanical ventilation systems. The fundamental roles of building ventilation are to remove pollutants and to dilute stale air for the benefit of occupants’ health. 9 Removal of pollutants is considered to be the most effective method, but this is not always feasible in indoor spaces because there are many pollution sources. In general, a mixed air distribution strategy is used in buildings to dilute and mix pollutants with fresh air. A primary objective is to create a homogenous mixture of supply and indoor air throughout a space. 10 Pollutants are almost fully mixed in the occupied zone by mixing with downward ventilation, and they are removed by an air dilution process.11 However, a residual quantity of pollutants remain at a certain concentration. Recently, displacement ventilation systems, which provide stratified air distribution, have been popular for thermal comfort and IAQ. Such systems introduce supply air directly into an occupied zone at low velocity and at a temperature lower than that of room air. 10 Heat and pollutants accumulate in the upper zone of the room, from where they are exhausted. However, a displacement ventilation system is not used for room heating, as cool air is required for the buoyancy principle. 12 In a heating mode, warm air supplied from the displacement ventilation diffusers will immediately rise. Thus, pollutants may spread out in a recirculating airflow field, and it is also possible to have stratified exhalation in the occupied zone. 11 The use of personalized ventilation with mixing and displacement ventilation could improve the inhaled air quality, but only in specific cases when the pollution source is not located in the vicinity of the personalized flow.13,14
Unlike gaseous contaminants, safe levels of particles does not mean totally safe. While there is a strong exposure–response relationship between particulate matter concentrations and human health,15–18 occupants can be infected by even a few virus-laden droplets. Thus, to control particulate matter or bioaerosols over all seasons, the strategies above may not be effective because pollutants can spread easily to other locations. Gaseous contaminants, which have different dynamics compared with particulate matter, have also been considered, although particulate matters are sometimes more harmful.19–21
This study investigates airflow control strategies for the efficient removal of both indoor particulates and gaseous contaminants in an air-conditioned room. Since carbon dioxide (CO2) is one criterion of IAQ, with occupants considered as its source, CO2 and expiratory droplets were designated as gaseous contaminants and particles in the study.
It is considered to be important to create a non-uniform indoor environment to prevent particle dispersion. An air curtain is one type of approach to create a non-uniform environment, by restricting heat and mass transfer from different zones. In buildings, they have been mainly applied to reduce air infiltration at entrance doors because this is one of the main sources of building energy loss. 22 Air curtains have also been used in practical applications such as air-conditioned rooms, food storage, refrigeration and aircraft and relic preservation.23–26 Research on air curtains started in the 1960s, and mathematical models for heat transfer across air curtains were proposed.27–29 Based on research for identifying an optimal jet momentum of an air curtain,30–32 many studies consistently reported its applications, energy efficiency and numerical model development.33-41 However, these mainly focused on thermal sealing performance and energy efficiency. Of course, there have been several applications of air curtains in other fields such as tunnels,42–44 subways,45–47 hospitals,48–50 cleanrooms51,52 and so on, but little research has considered combining control of gaseous contaminants, particulates and thermal comfort with an air curtain system in indoor environments. This is because much research on air curtain systems focused on specific functions. However, in residential or office buildings, both IAQ and thermal comfort are regarded as important to occupants.
The aim of this study was to investigate the effect of an air curtain system in a ventilated office in preventing expiratory droplets from passing through the air curtain, with numerical analysis while considering air velocity, temperature, predicted mean vote (PMV) and CO2 concentration. Since human bodies generate and exchange heat and mass with the surrounding environment simultaneously, the occupant was considered as the heat and contaminant source. Expiratory droplet dispersion was investigated because these serve as carriers of airborne viruses and bacteria, spreading diseases. CO2 was chosen since it is also a human-emitted contaminant. The thermal environment was evaluated with air velocity, temperature and PMV as indices. To investigate effects of the air curtain system, a CFD method was used while varying factors of design, orientation and jet velocity of the air curtain system.
Research methods
Physical models of a ventilated office and an air curtain system
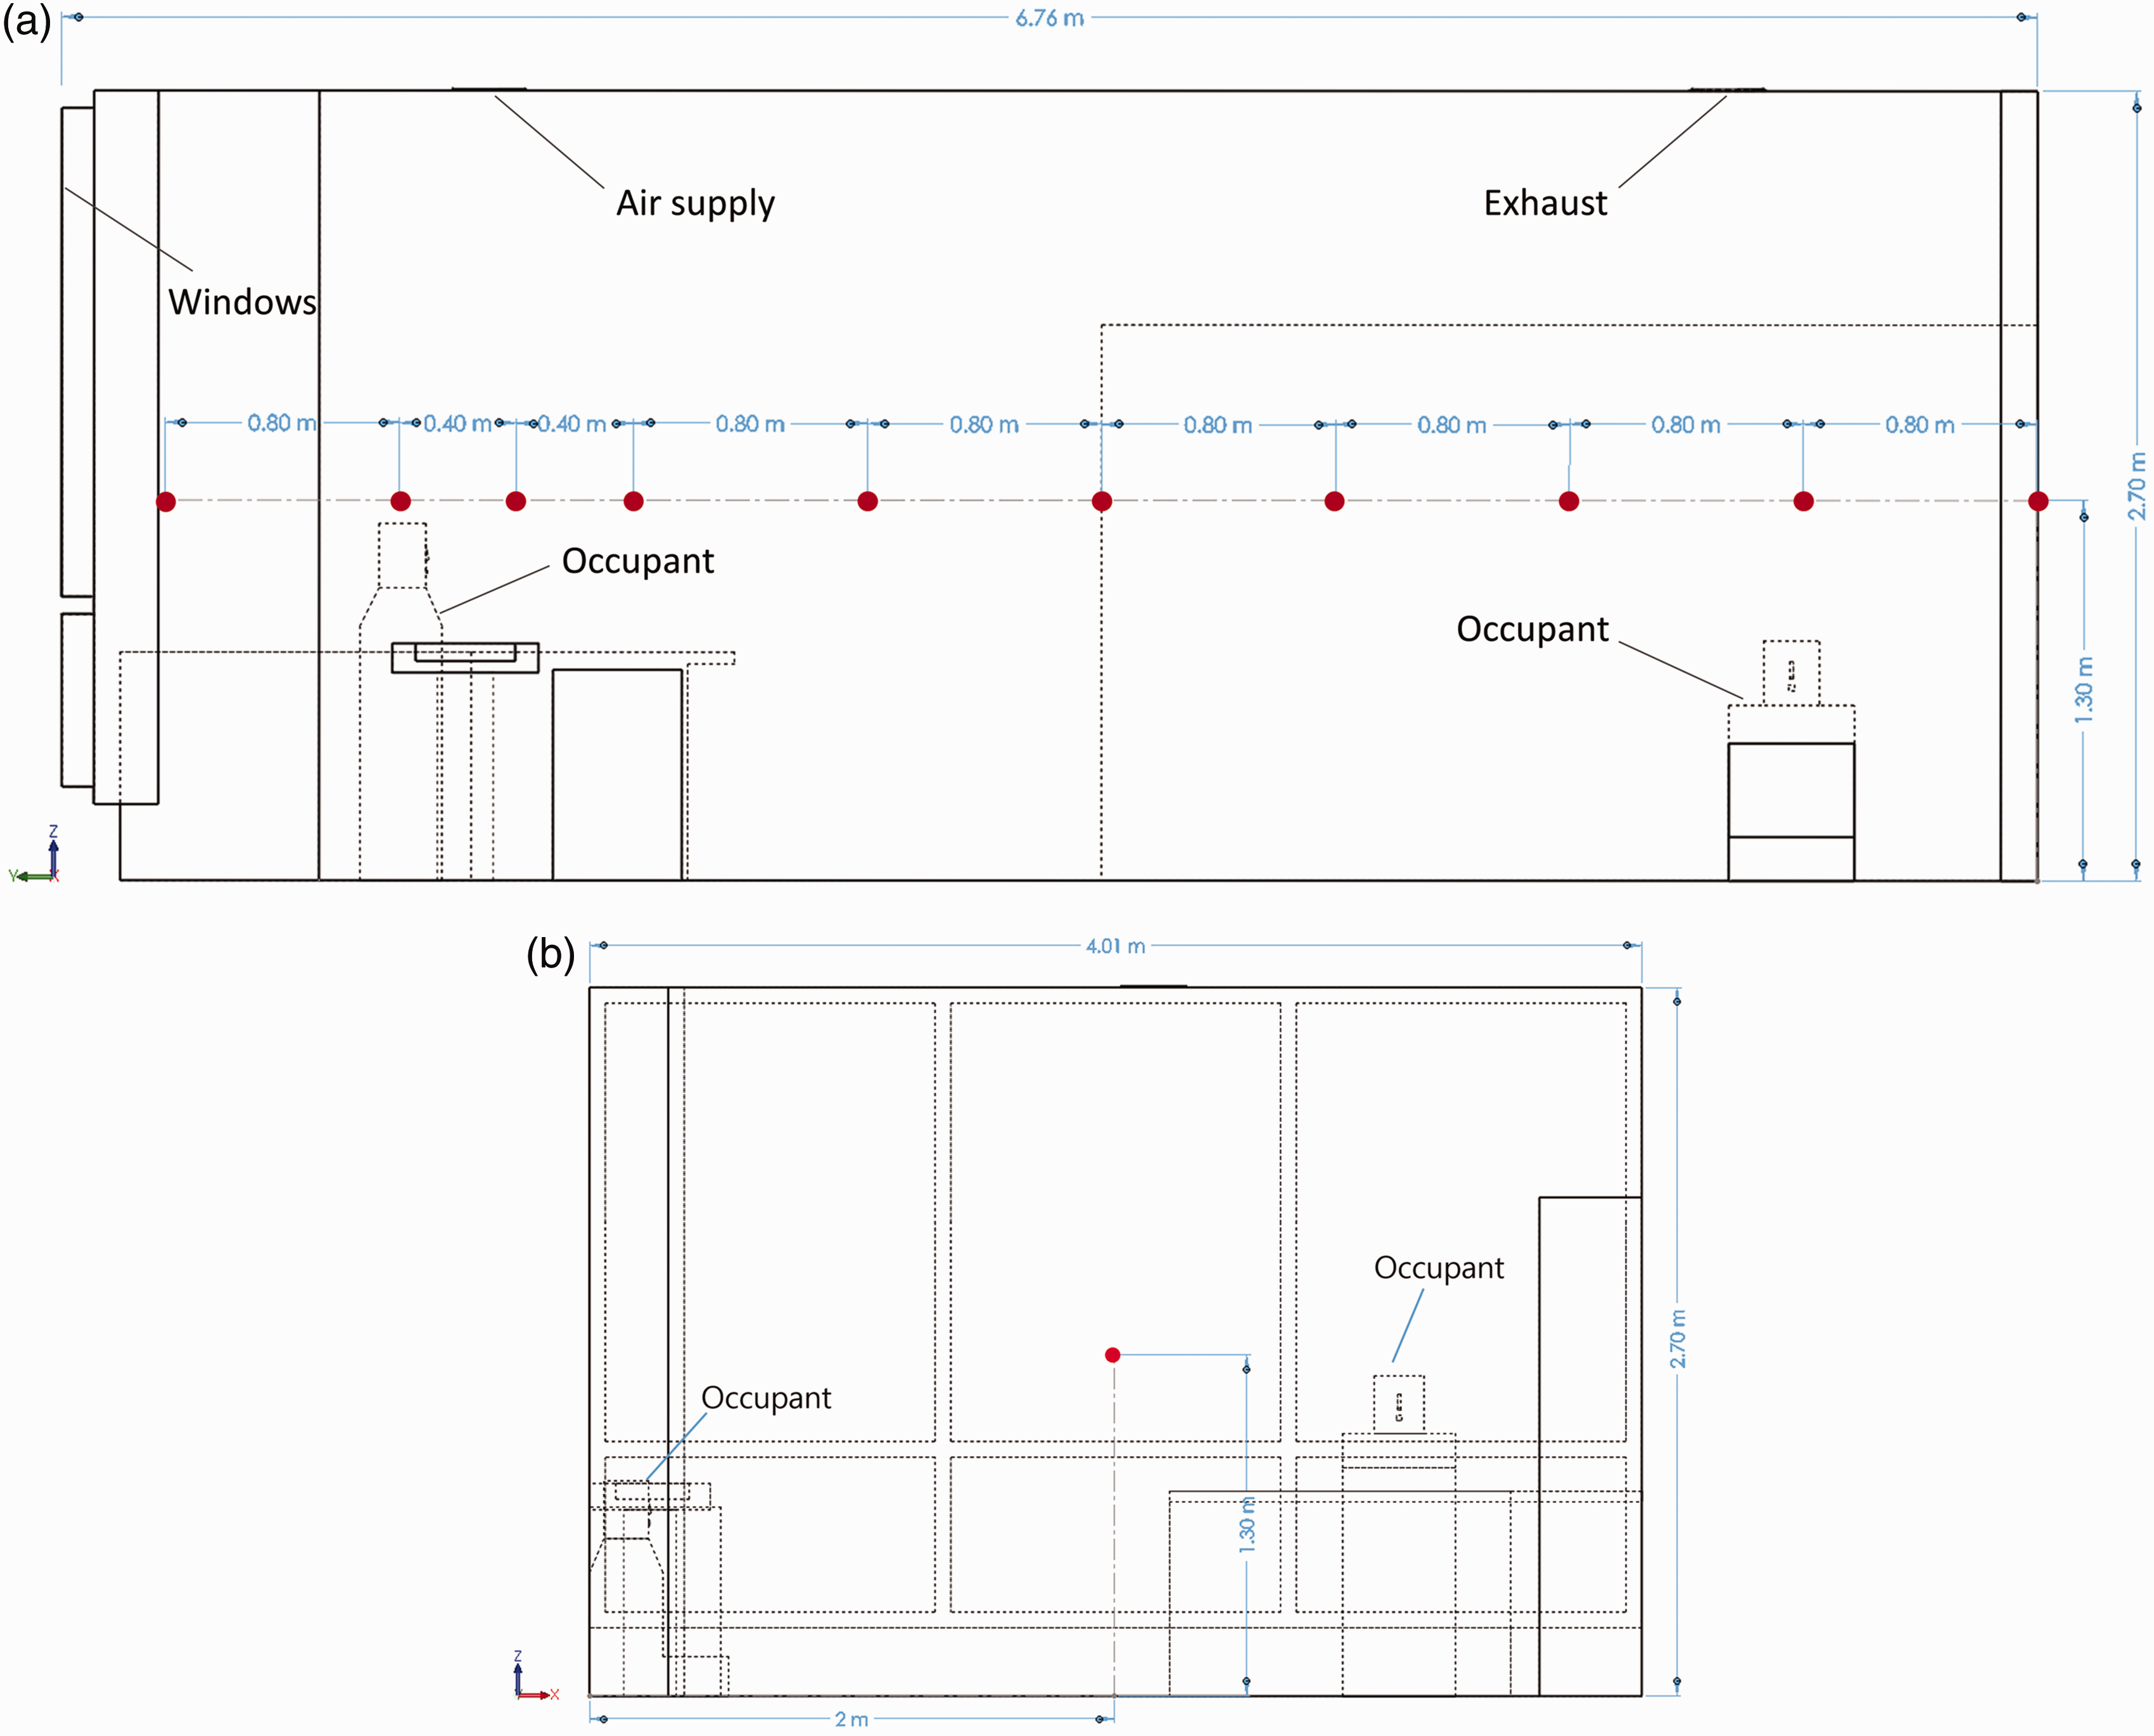
The office for a single occupant located at Korea Advanced Institute of Science and Technology in Republic of Korea (Figure 1) was selected for this study. The dimensions of the office were 4.01 m (L) × 6.76 m (D) × 2.70 m (H). The office had two diffusers for supplying fresh air and discharging indoor air. An air curtain was not mounted in the office but was incorporated in the CFD simulations. Figure 2 shows schematic diagrams of two air curtain systems used. The first air curtain unit had a supply slot and a recirculation slot. This unit drew indoor air through the recirculation slot, then discharged the air from the supply slot. The second one had only the supply slot and when this system was used in the simulations, indoor air was discharged through both diffusers on the ceiling.
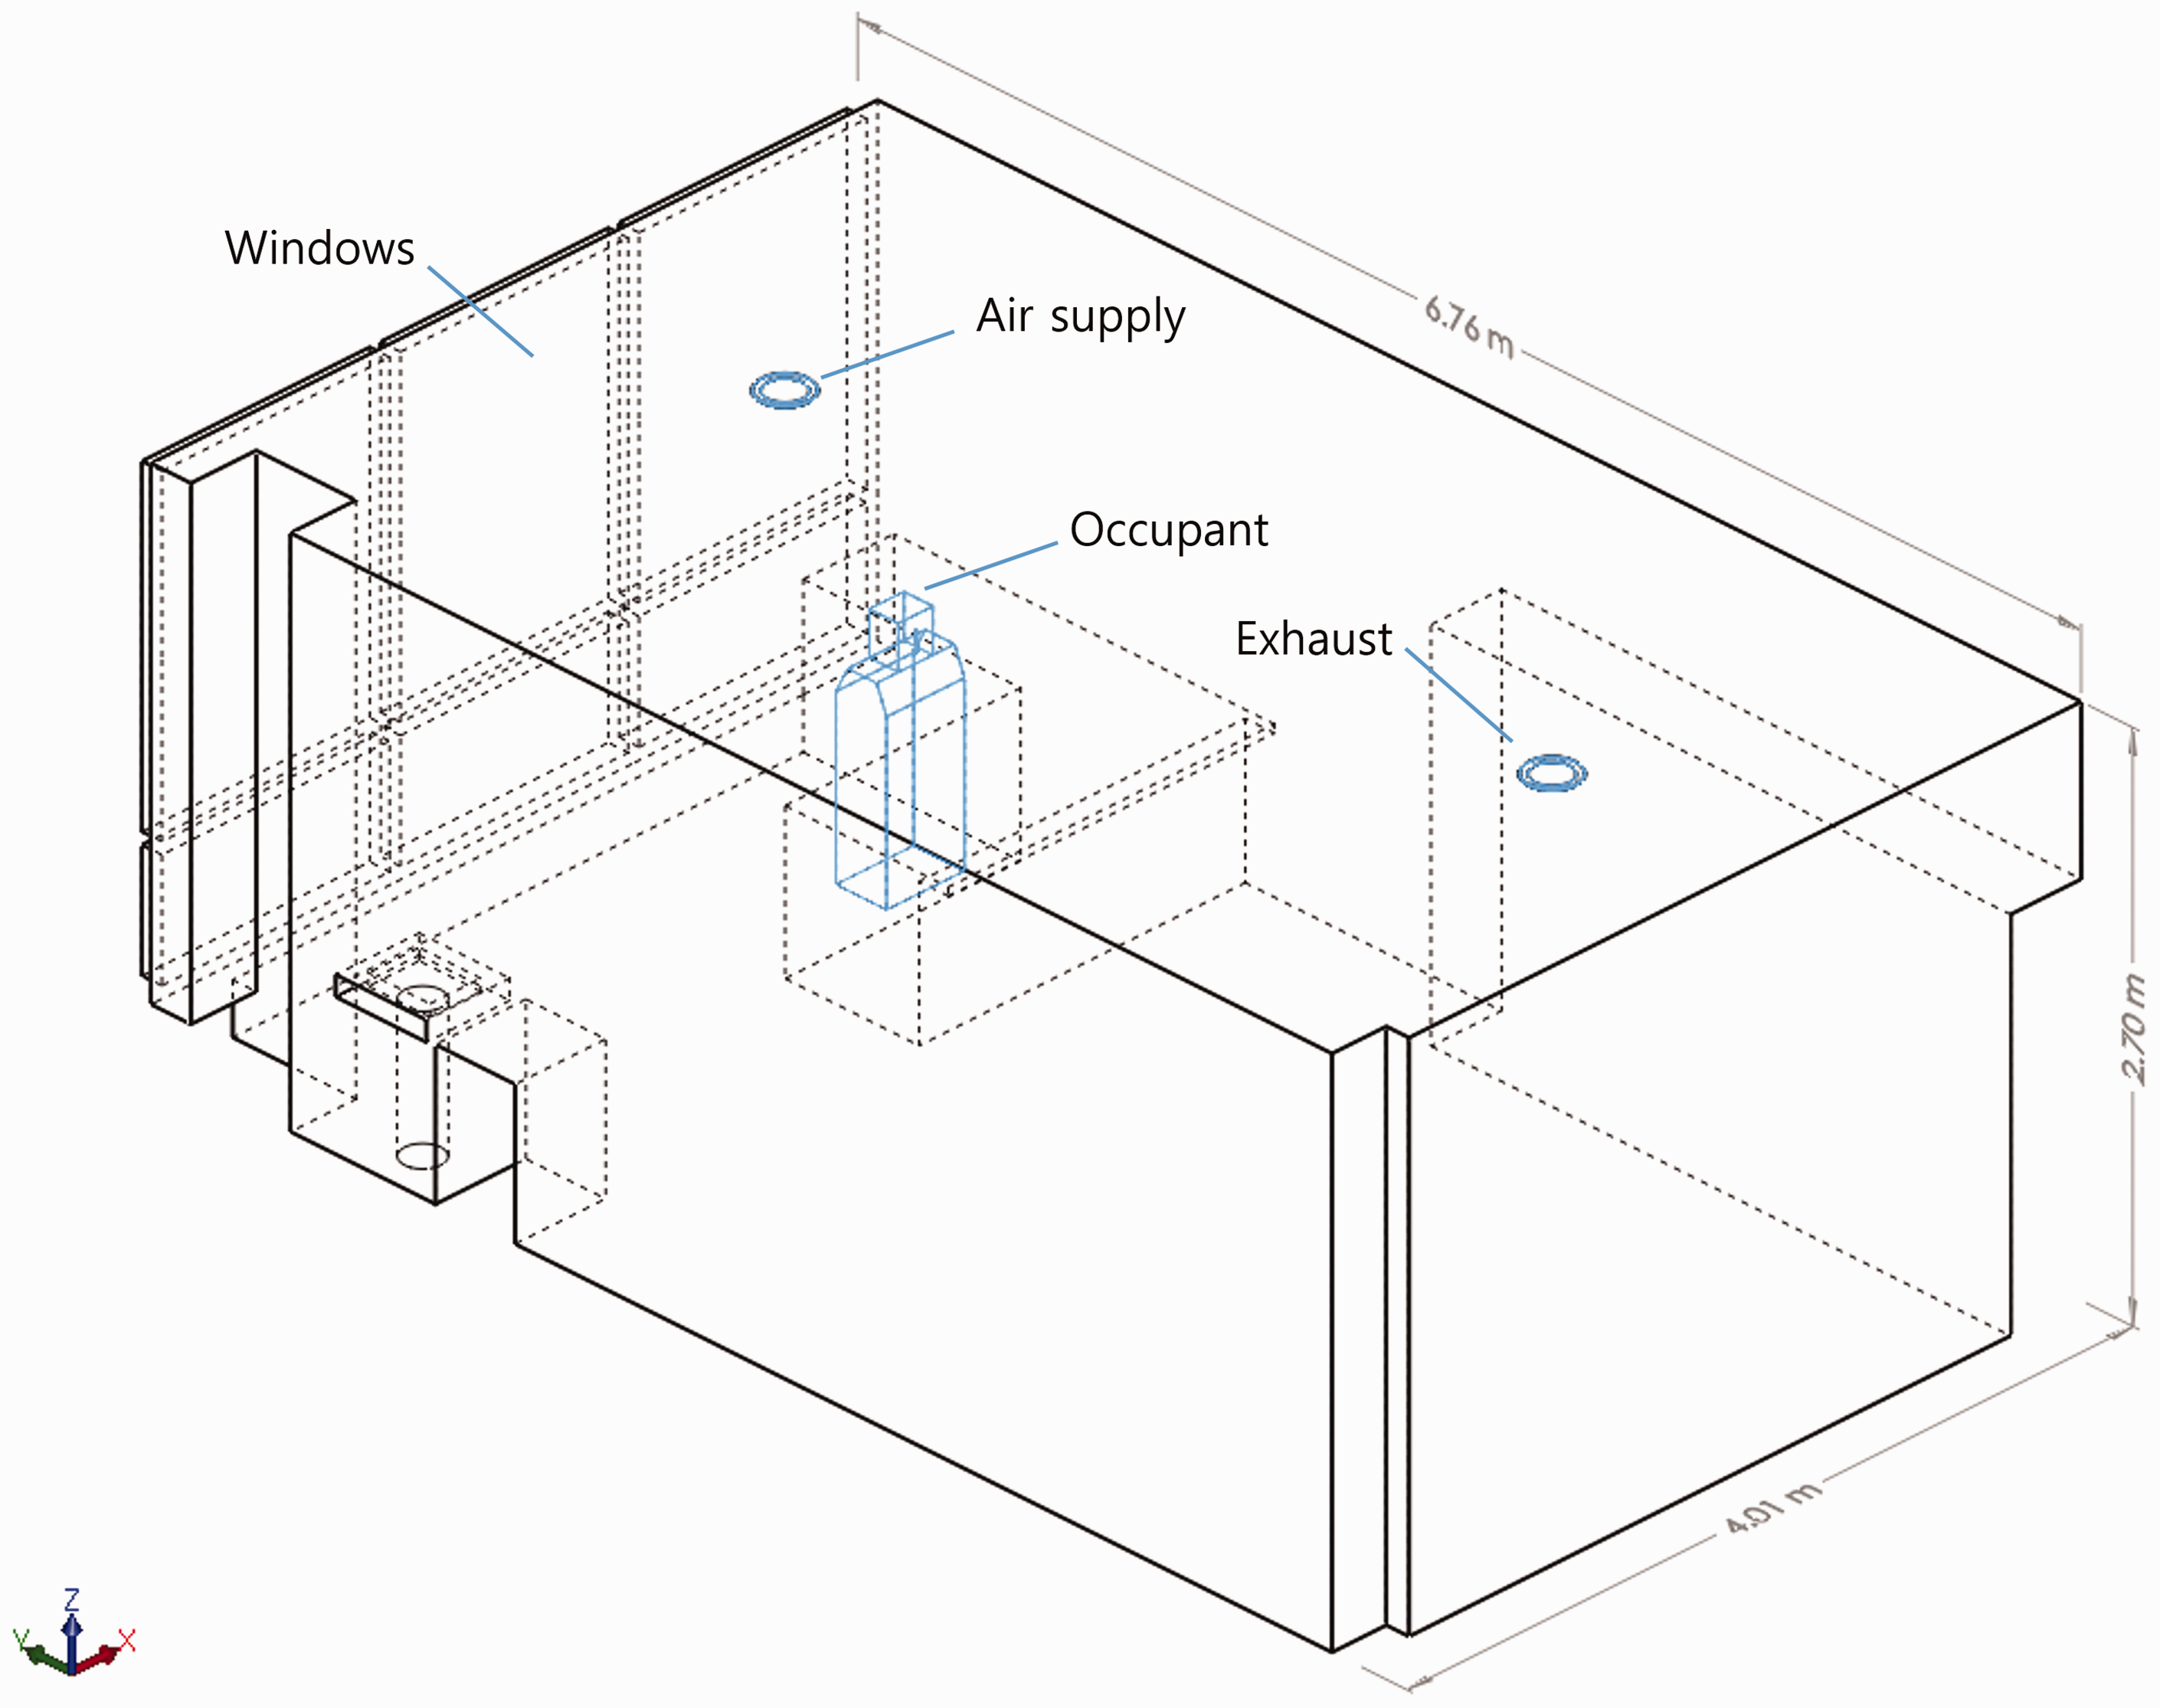
Geometrical configuration of the test office.
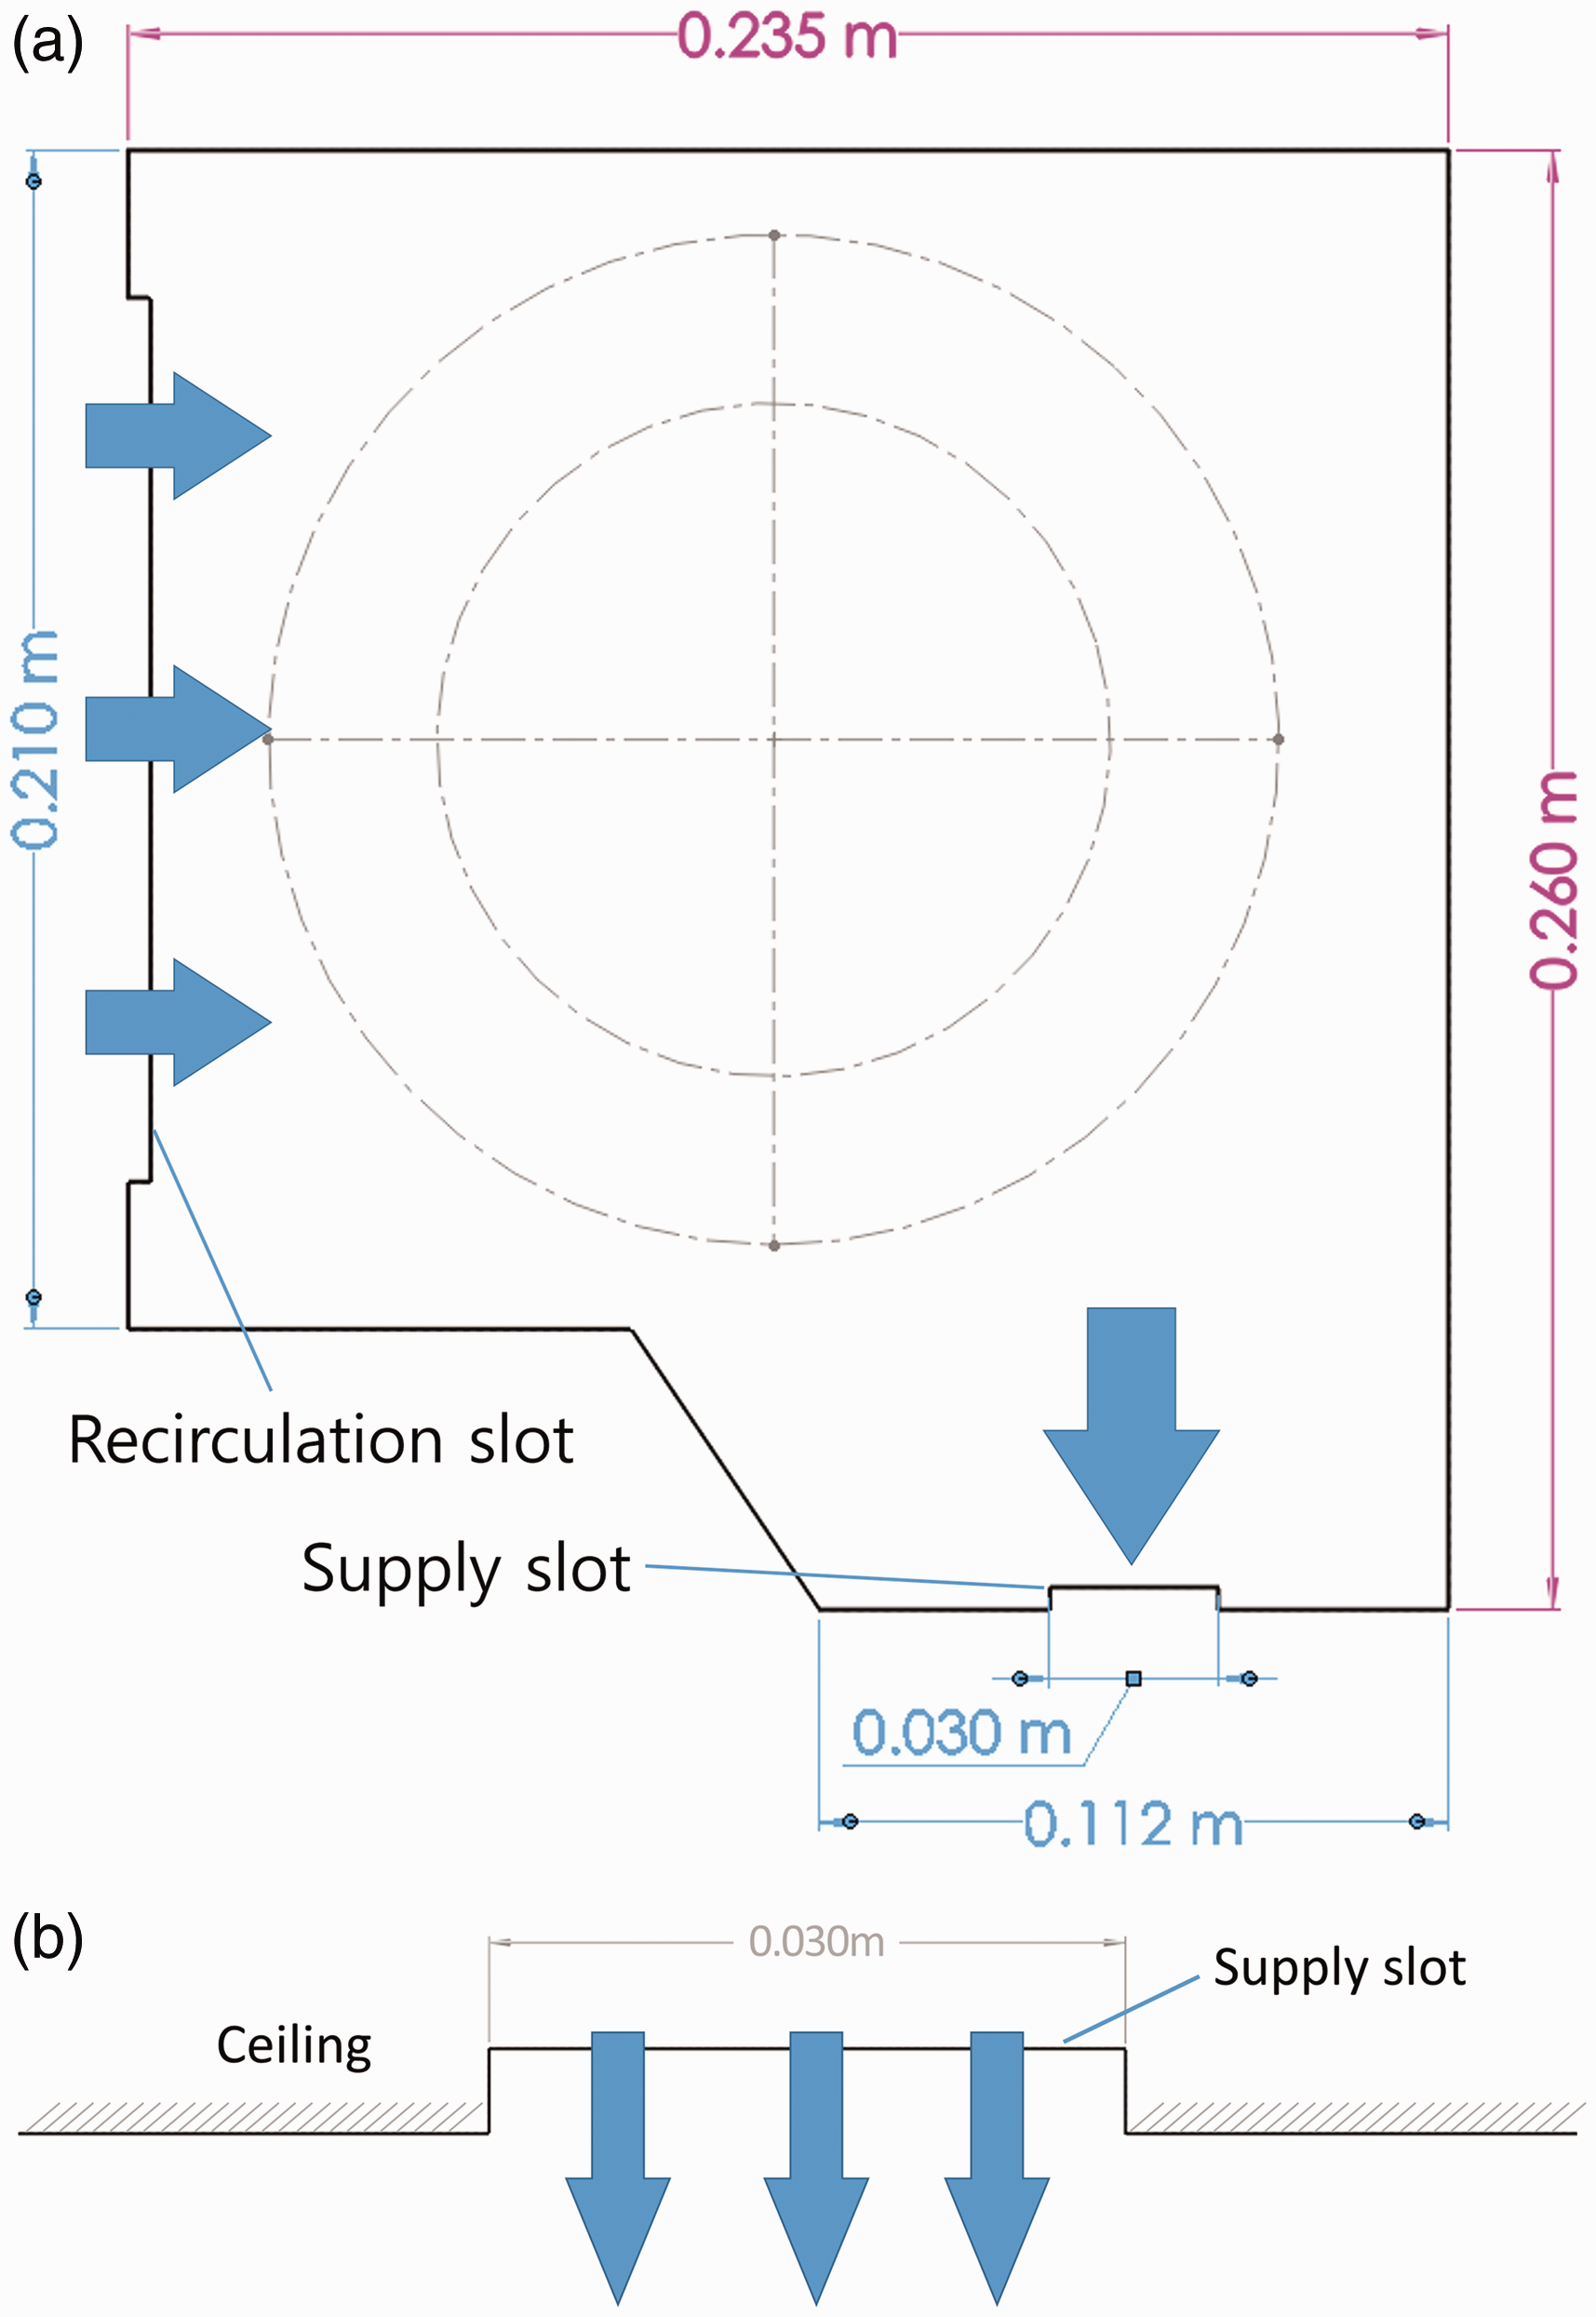
Schematic diagram of air curtain system: (a) the air curtain unit; (b) the supply slot on the ceiling.
Numerical approach
This study used a CFD method to simulate several scenarios with the air curtain system. The Reynolds-averaged Navier–Stokes (RANS) equations with the realizable k-ε turbulence model were used for solving the airflow field in CFD simulations.
53
SIMPLE (Semi-Implicit Method for Pressure Linked Equations) algorithm was adopted to couple pressure and velocity with a second-order upwind scheme for both convection and viscous terms of the governing equations.54,55 For the boundary condition at the inlet, the turbulent kinetic energy (

The expiratory droplets were assumed to be spherical particles
10
and the Lagrangian method was used to solve the momentum equation for an individual particle. To simplify the simulation, the aerodynamic particle diameter was used and coagulation of particles was not considered due to the low particle loadings.56–58 Other forces such as the pressure gradient force, the Basset force, and the virtual mass force were negligible.57,59–61 These forces are smaller than the drag and buoyancy forces in an indoor environment because of the particle properties, the air properties, and the air flow condition.
57
However, the Brownian force, Saffman’s lift force, and the thermophoretic force were considered.57,59 By integrating the force balance on the particle, the momentum equation of particle motion can be written as equation (3)
The interaction between particles and air in indoor environments was treated as one-way coupling, assuming that the effect of particles on the turbulent flow was negligible. The particle dispersion depended on the air turbulence because of the low particle loadings, but the momentum transfer from particles to the turbulence would not have a significant effect on the flow.60,63–65 In addition, the particles usually could not accumulate enough rebound energy to overcome adhesion after hitting rigid surfaces. 56 Since particles were most likely to attach to a surface, a ‘trap’ type boundary condition was adopted when the particle reached the walls, floor and ceiling. The aggregation with other droplets was considered negligible due to low concentration. The expiratory droplets evaporated to droplet nuclei within a short time (<0.1 s) after coughing.66–69 The commercial software, STAR-CCM+ (CD-adapco, USA), was employed to solve the governing equations with the initial and boundary conditions. The unsteady simulations for particle transport were calculated after obtaining the steady-state airflow field.
Among the indices, the PMV could not be derived from the governing equations. It needed an iterative procedure for calculation, with six parameters: metabolic rate, clothing insulation, air temperature, radiant temperature, air velocity and humidity. The PMV is an empirical index that predicts the mean value of the votes of a large group of people on thermal sensation. 70 In this study, metabolic rate was set to be 1.2 met (69.6 W/m2) for sedentary activity and clothing insulation was fixed at 1.0 clo (0.155 m2 K/W). The relative humidity was assumed to be 45% as a constant because the influence of humidity on thermal sensation was considered negligible when determining the PMV value.70,71
In order to demonstrate the validity of the CFD model, values of air velocity, temperature and CO2 concentration were measured at nine locations with a Multifunction instrument (AMI 300, KIMO Instruments, France), which had an accuracy of ±0.1°C for temperature, ±0.01 m/s for flow velocity and ±1 ppm for CO2 concentration. Figure 3 shows the locations of the nine measuring points and two occupants during the experiment. This office was supposed to be for one occupant but one more person was added to control the equipment during the experiment. In the experiment, the airflow rate was 18.6 air change per hour (ACH) from the air supply, CO2 concentration of supply air was 360 ppm, temperature of supply air was 26°C, inner surface temperature of windows was 34°C and surface temperature of occupants was 33°C. The experimental results were evaluated as the time-averaged data for an hour after reaching steady-state. The simulation was performed for the comparison of the numerical and experimental results. Before obtaining simulation results, a grid dependency test was performed to ensure that the numerical results were appropriate by refining the mesh. As shown in Figure 4, the CFD model was reliable for simulating the airflow distribution in the office using meshes more than 1.9 × 10⁶ which agreed well with measured data. On the basis of proven simulated airflow pattern, it could be said that prediction capability of expiratory droplets gains credibility because the expiratory droplet dispersion was in accordance with the bulk airflow. 69 In addition, because the actual measurement of the expiratory droplet is very difficult and the deviation of each measurement may be large, this study focused on the possibility of blocking and eliminating the droplet of the air curtain through numerical analysis.
Measuring points for validation in the test office.
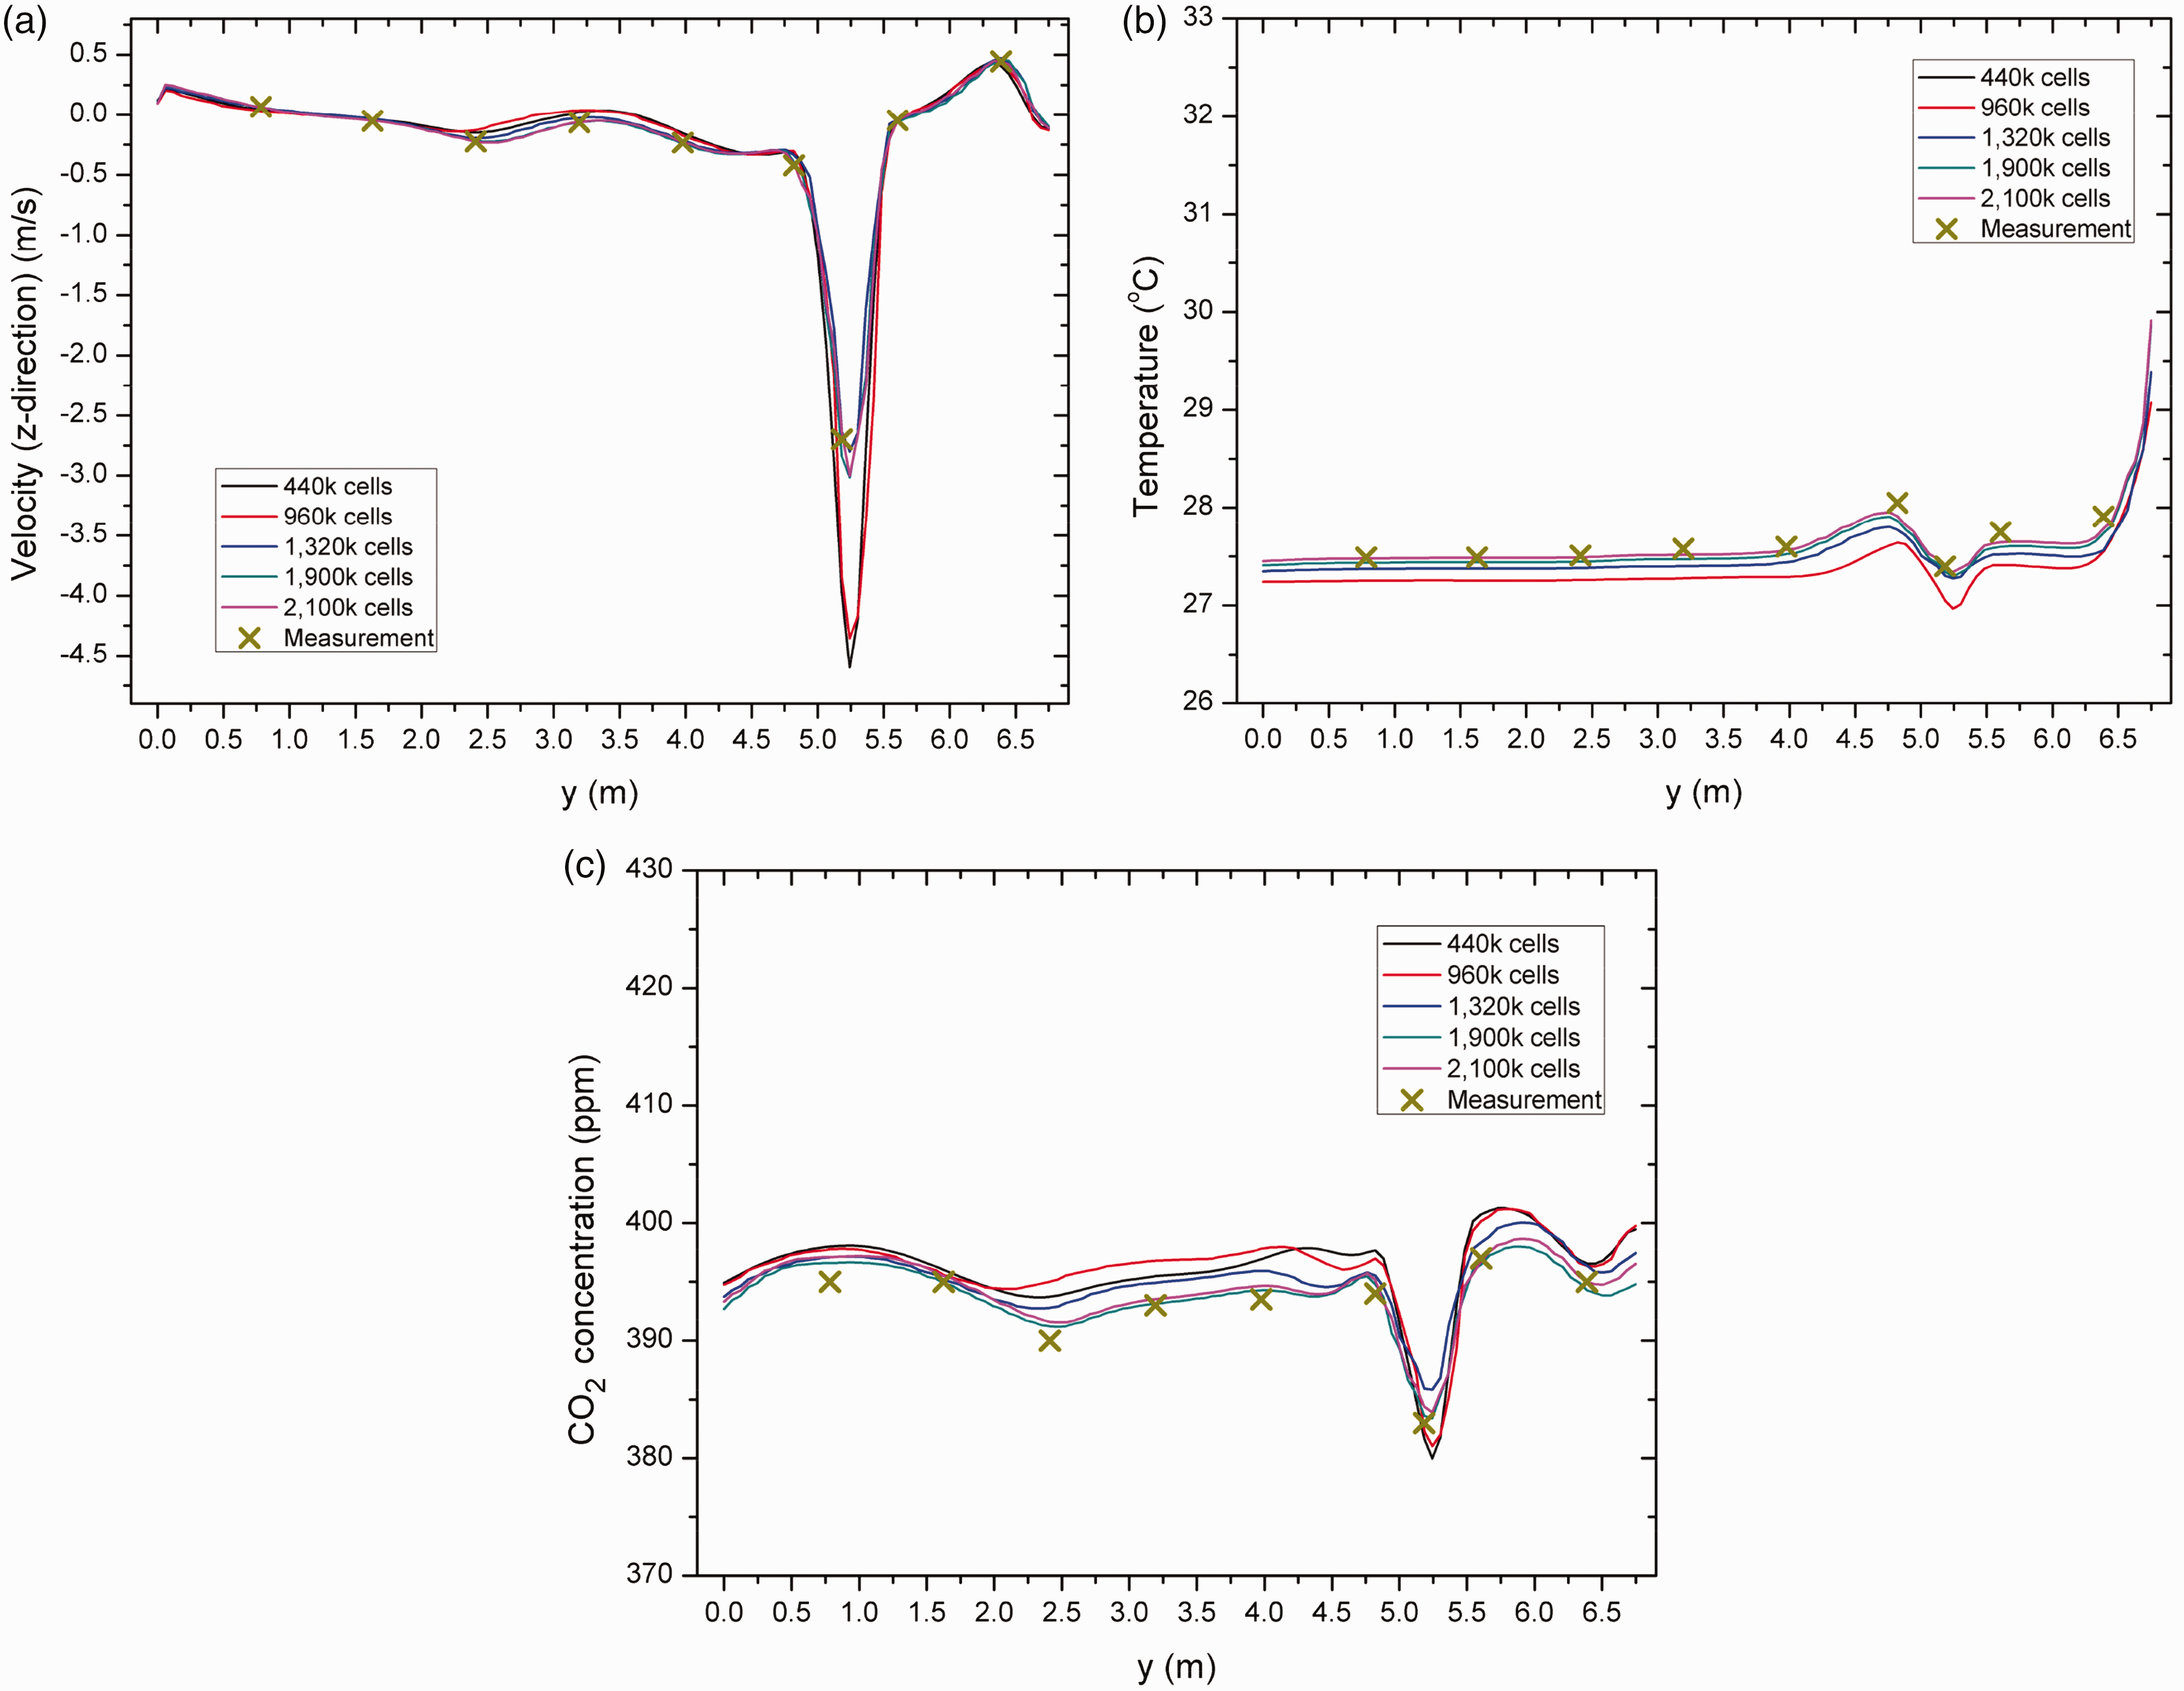
Comparison between experimental and numerical outcomes at the measuring points at x = 2 m and z = 1.3 m: (a) Velocity in z direction; (b) Air temperature; (c) CO2 concentration.
Description of case studies
Figure 5 presents the simulation cases with variations in the design and installation of the air curtain system, the jet velocity of the air curtain and the air exchange rate of the ventilated office. In the CFD simulations, expiratory droplets were expelled by coughing. The diameter of the droplets was set at 8.35 μm, the cough peak velocity was 12.7 m/s, the cough finished in 0.4 s, mouth opening was 4 cm2, nose opening was 0.71 cm2 (for each nostril) and the breathing flow rate was 0.604 m3/h, and there was no exhalation from the nose while coughing from the mouth.68,69,72–75 One hundred thousand droplets generated by one cough were considered typical for the study, consistent with other research.69,75,76 The occupant was assumed to cough just once when each simulation began. The skin temperature of the occupant was 33°C, and the exhalation temperature was 32°C.10,72 All cases of simulation were assumed to be in winter; thus, the inner surface temperature of windows was fixed at 5°C, while other inner surfaces were considered to be adiabatic. The temperature of the supply air was 24°C. The CO2 concentration of the supply air was 360 ppm. Because the air exchange rate of this office in reality was more than the minimum requirement (4 ACH) according to the regulatory guidelines for IAQ management in an office by the Republic of Korea, the air exchange rate was set to 4 ACH in all simulations. The air curtain system was installed in the middle of the office in the CFD simulations, and the indoor space was divided into two zones by the supply slot location of the air curtain system (y = 3.38 m). The two zones are presented in Figure 5(a). The infected occupant was positioned in region A, and a door leading to a hallway was in region B. Even if there was no physical structure between regions A and B, region B with the air curtain system could be regarded as a buffer between the office and the hallway. Thus, the air velocity, temperature, PMV, CO2 concentration and the number of droplets in region B (0 ≤ y < 3.38 m) were calculated and compared with those in region A (3.38 ≤ y < 6.76 m). In Case 1, there were only two diffusers without the air curtain system. In Cases 2–4, the characteristics of expiratory droplet dispersion and thermal comfort were examined with different design and installation of the air curtain systems based on Case 1. In Case 2 in particular, the air curtain slot discharged supply air that was a mixture of fresh air (16%) and return air (84%), and the rest of the return air was exhausted. The same air velocity as Cases 3 and 4 was applied. With Case 4 and Cases 5–8, the effects of air velocity of the air curtain system on the dispersion of expiratory droplets and thermal comfort were analysed. The droplets which penetrated through the recirculation slot of the air curtain system were assumed to be filtered in all cases. Case 9 involved the comparison of the droplet removal performance of the air curtain system with an air cleaner included. The air cleaner model was selected from a previous study by Noh and Oh, 77 and the dimensions of this stand-alone type air-cleaning device were 0.5 m (L) × 0.3 m (D) × 1.8 m (H). The airflow rate of air cleaner was set at the same as that of the air curtain system with the best performance among Cases 1–8.
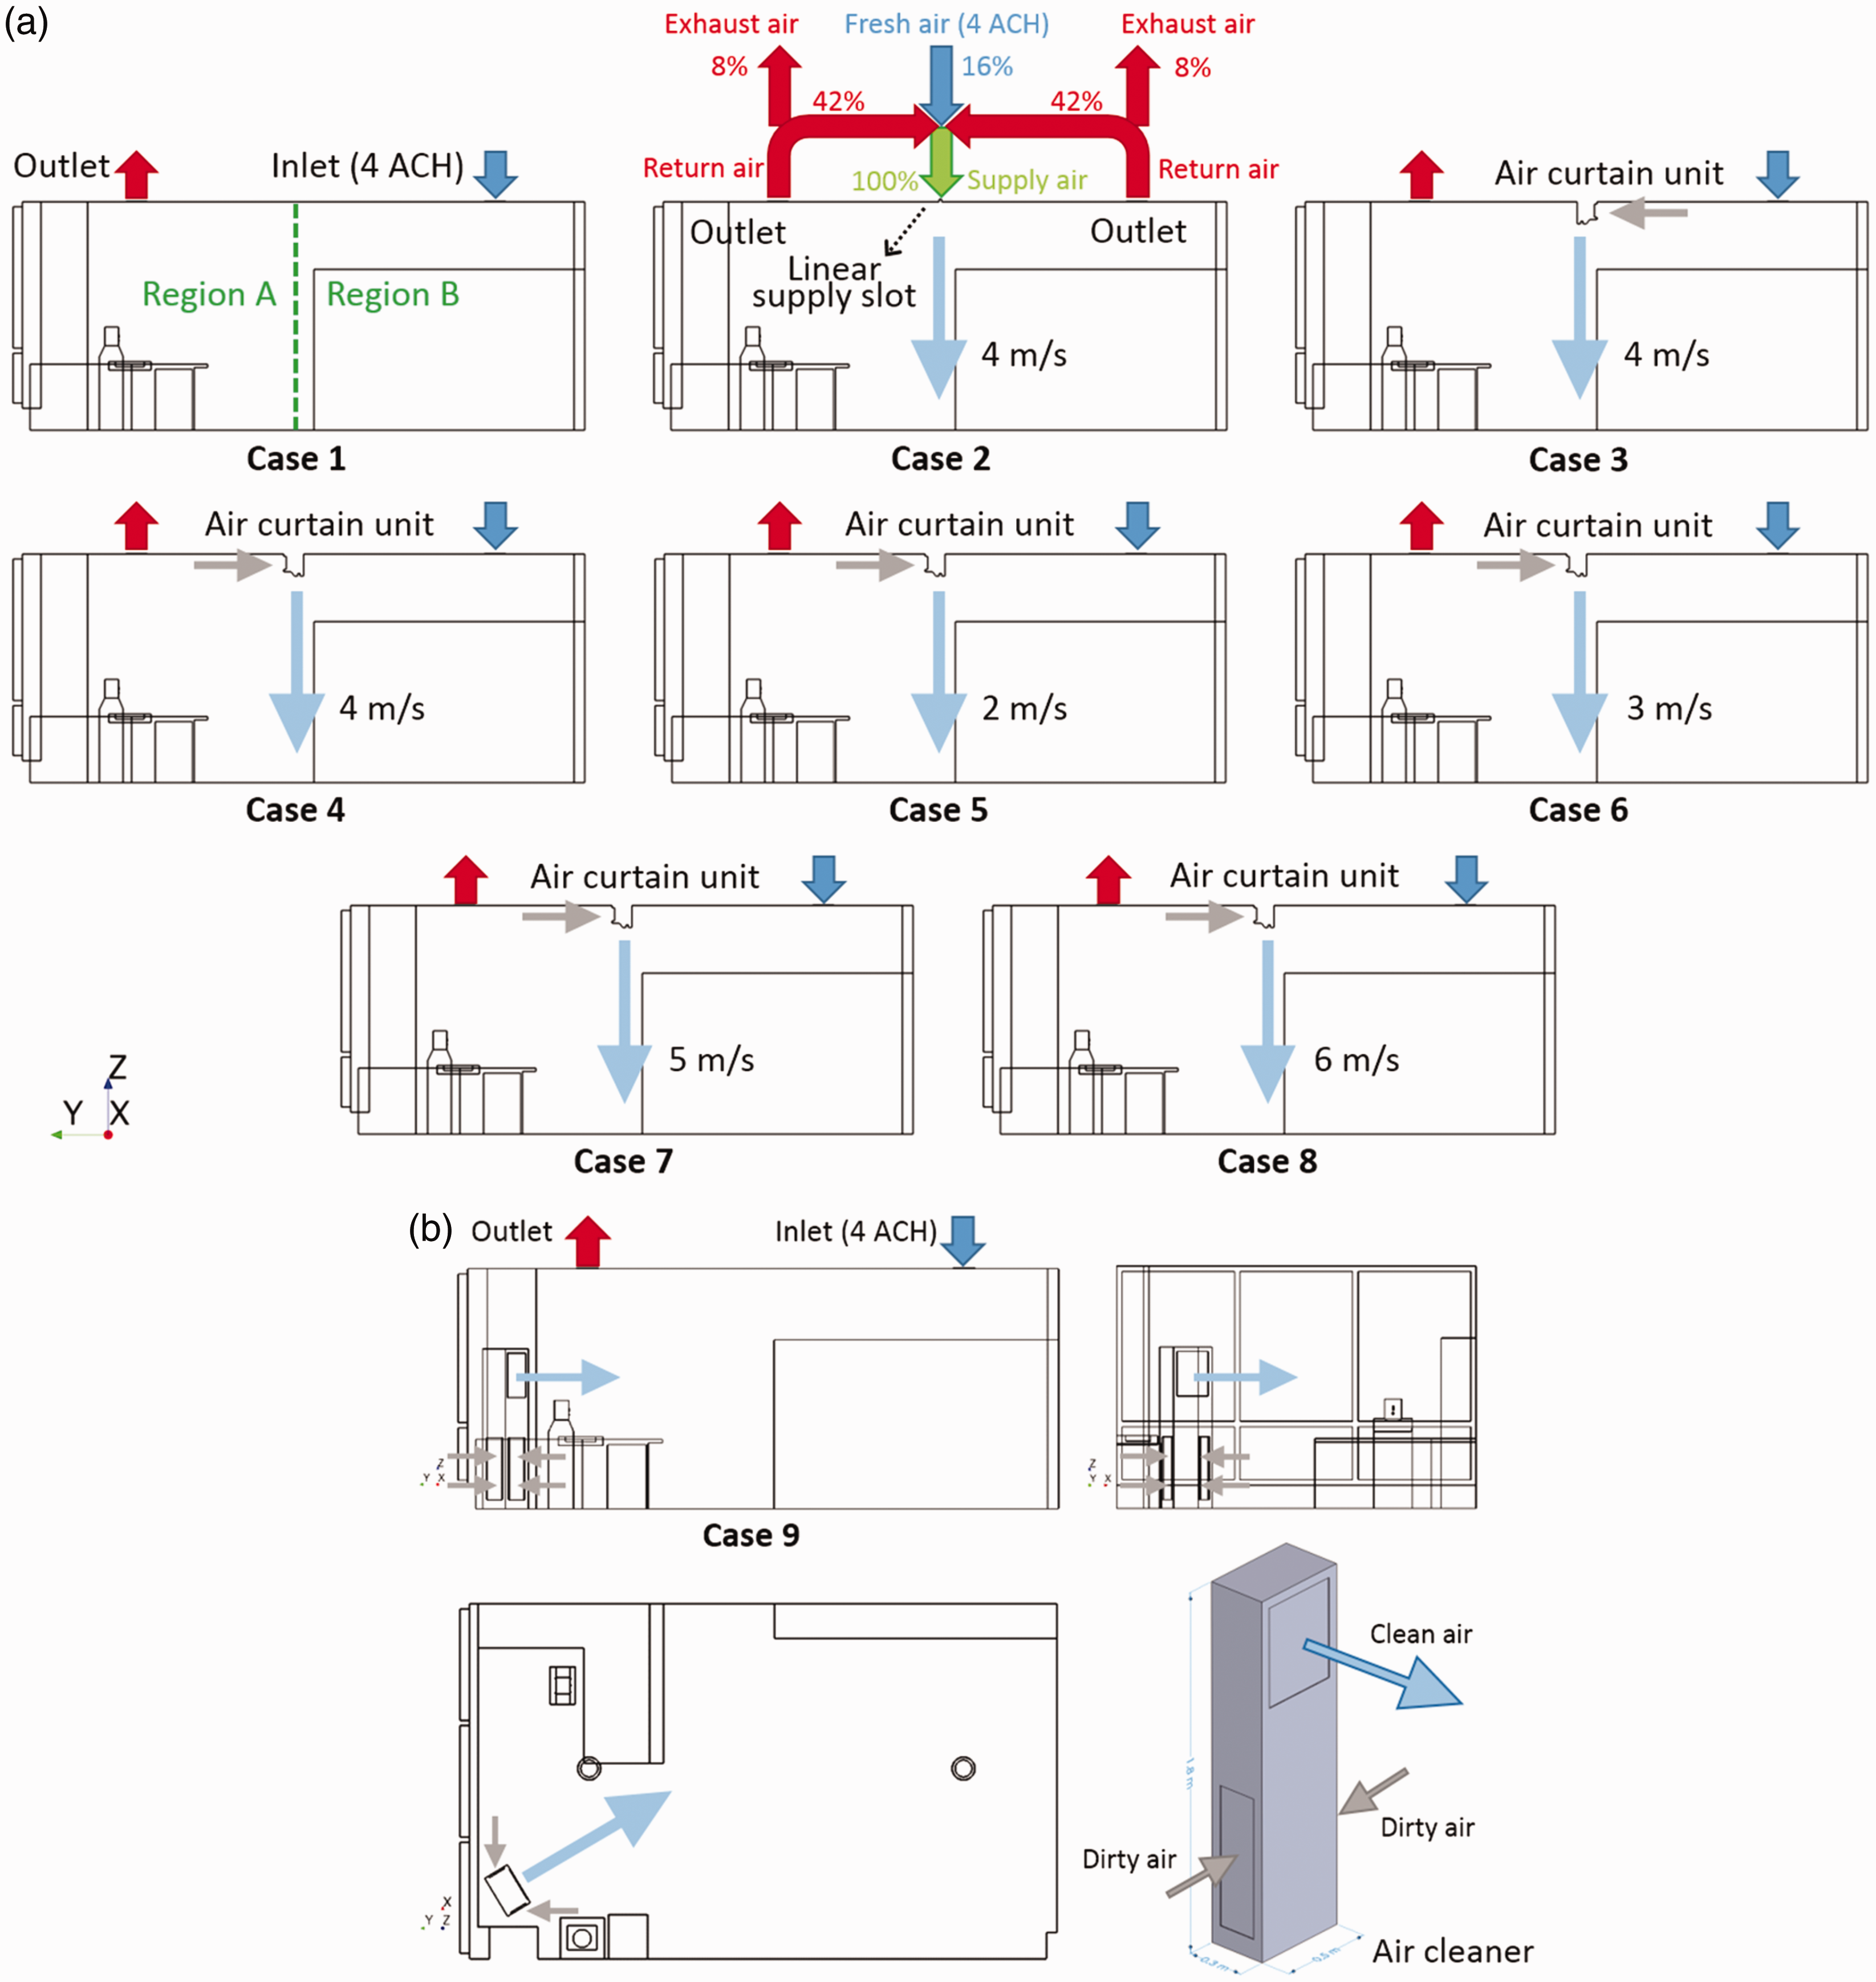
Simulation cases for parametric study: (a) Cases 1–8; (b) Case 9.
Additionally, the study analysed the infection route assuming that two people were in the office. If there are two occupants in the same region of the office, the chance of the uninfected to become infected increases. Hence, in this additional analysis, two occupants were separately located in region A and B. The other occupant considered as uninfected was placed in region B, and the exposure to droplets from the infected occupant in region A was predicted. To determine the infection risk, the number of the expiratory droplets on the uninfected occupant’s face in region B was calculated. This analysis was carried out with three cases: Cases 1, 9 and the best case among Cases 2–8.
Simulation outcomes
Figure 6 shows the averaged velocity in regions A, B, the whole space and the vicinity of occupants in Cases 1–8. The room-averaged air velocities were 0.07 m/s in Case 1 and 0.17–0.48 m/s in Cases 2–8 where the air curtain system was applied. The average air velocities in the vicinity of the occupant were 0.06 m/s in Case 1 and 0.14–0.39 m/s in Cases 2–8. The reason for the lower and uniform air velocity in Case 1 was because there was only the jet flow from the inlet without an additional jet from the air curtain system. In Cases 2 and 3, the average velocities in region B were much higher than those in region A. However, in Case 4, the average velocity in region A was higher than that in region B. In Cases 4–8, differences in the average velocity between regions A and B did not vary much even though the jet velocity of the air curtain increased. Figure 7 illustrates the air velocity field on the mid-plane (x = 2.15 m) of the office in Cases 1–8. The cold air near the windows descended to the floor by density difference and mixed with the fresh air from the inlet in region B in Case 1. In Case 2, the two diffusers functioned as the exhaust, and the air curtain system discharged the supply air that was mixed with fresh air and return air. In this case, the cold air near the windows descended and penetrated through the bottom of the air curtain jet on the floor where the jet was weak. Thus, the jet of the air curtain system bent to region B with a curve, and the averaged velocity in region B was higher than that in region A. In Case 3, the air pressure in region B was lower than that in region A because the recirculation slot of the air curtain system faced region B. Hence, the jet of the air curtain system also bent to region B with a curve, and the jet from the air curtain system entrained the air on the floor in region A into region B. Thus, the averaged velocity in region B was higher than that in region A since the main air stream was intensive in region B due to the jets from the inlet and the air curtain system. On the contrary, in Case 4, the recirculation slot of the air curtain system faced region A, and the pressure in region A was lower than that in region B. Thus, the jet of the air curtain system bent to region A with a wide curve. This bent jet entrained the air from region B into region A. The cold air near the windows was pushed up to the ceiling by the bent jet, and the air was exhausted through the diffuser or recirculated by the air curtain system as the jet again. In general, therefore, the indoor air in Case 4 tended to move from region B to region A and was easier to be exhausted than the other cases. The averaged velocity in region A was higher than that in region B since the main air stream by air recirculation was intensive in region A. In Cases 4–8, the directions of the main air stream were analogous, but the amount of the entrained air from region B to region A increased as the jet velocity decreased. Also, when the jet velocity was high, the cold air near the windows was likely to circulate throughout the office. As the jet velocity increased, the cold air near the windows easily reached the recirculation slot and circulated owing to its own high momentum. In Case 6, the jet pushed up the cold air to the ceiling and the outlet, but before reaching the recirculation slot. Hence, the average temperature in Case 6 was the highest among the cases. However, the jet in Case 5 could not reach the floor, and it flowed toward the occupant’s face and chest. For this reason, the cold air on the floor in region A spread out to region B.
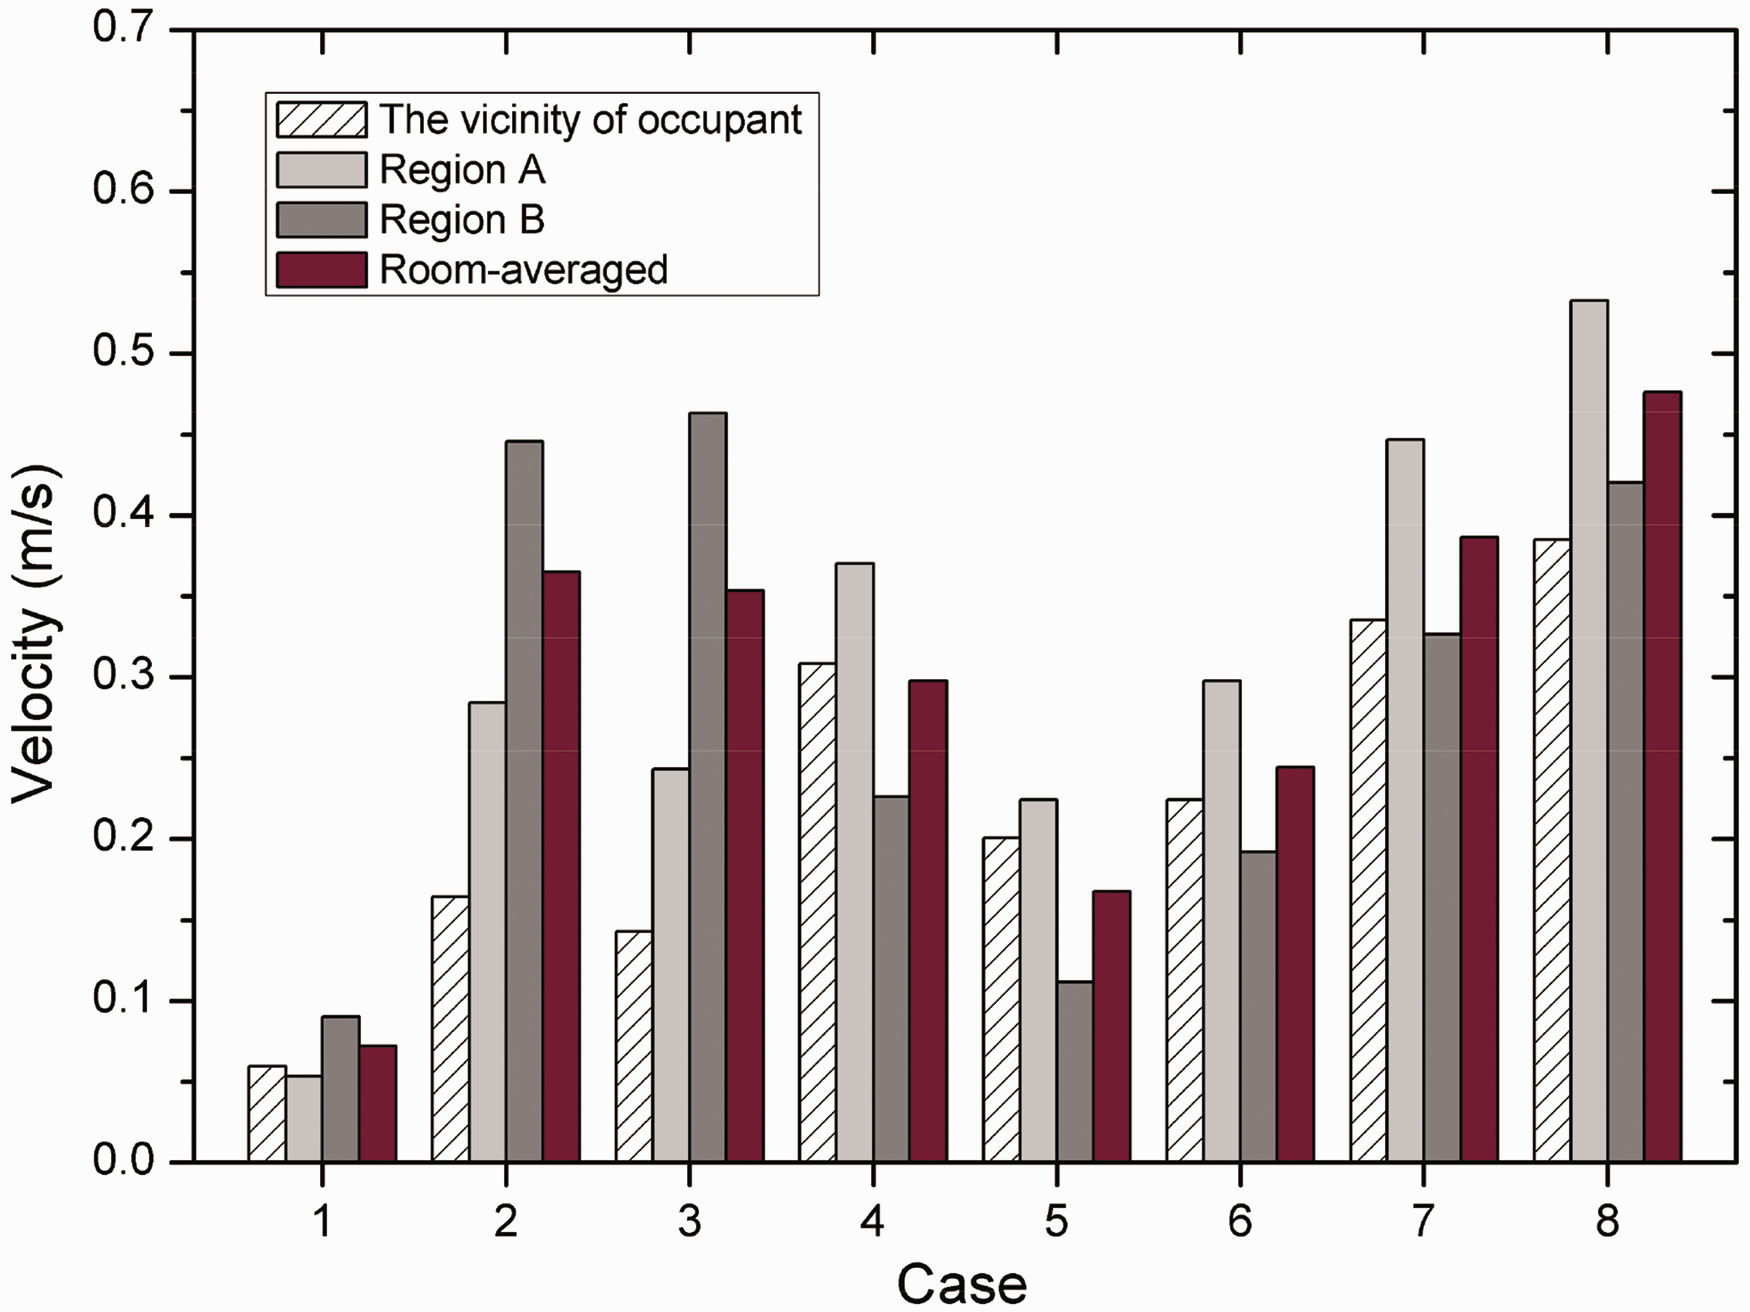
Averaged velocities in the regions A and B, the whole space and the vicinity of the occupant.
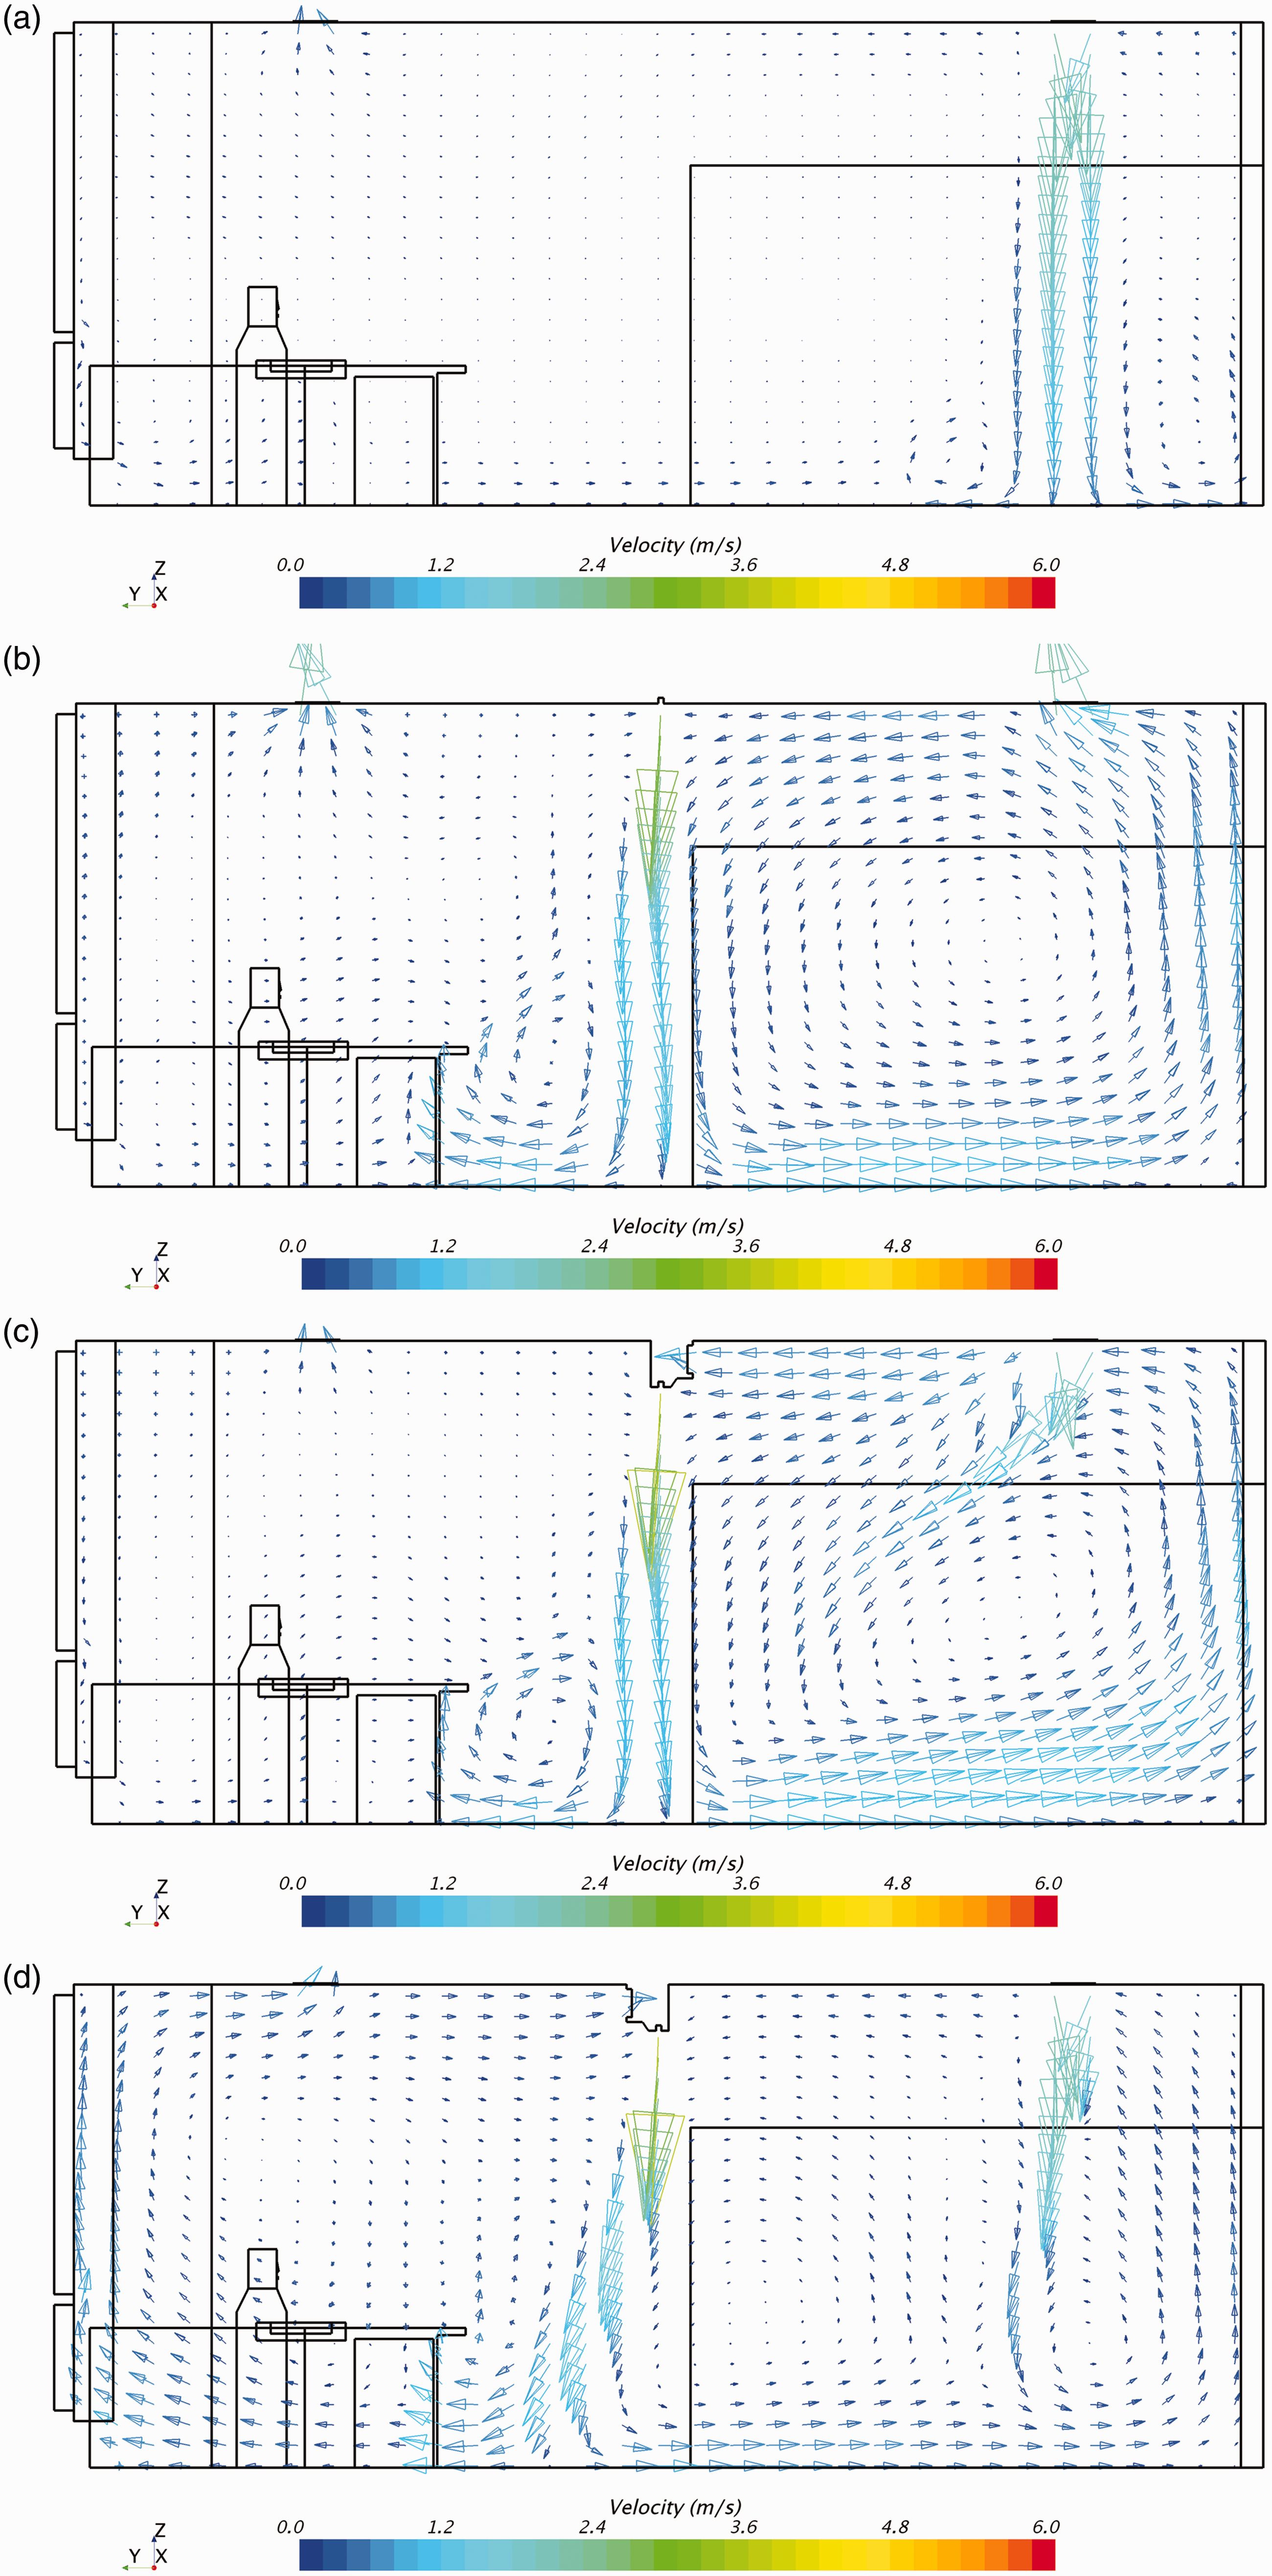
Air velocity fields on the mid-plane (x = 2.15 m) of the office: (a) Case 1; (b) Case 2; (c) Case 3; (d) Case 4; (e) Case 5; (f) Case 6; (g) Case 7; (h) Case 8.
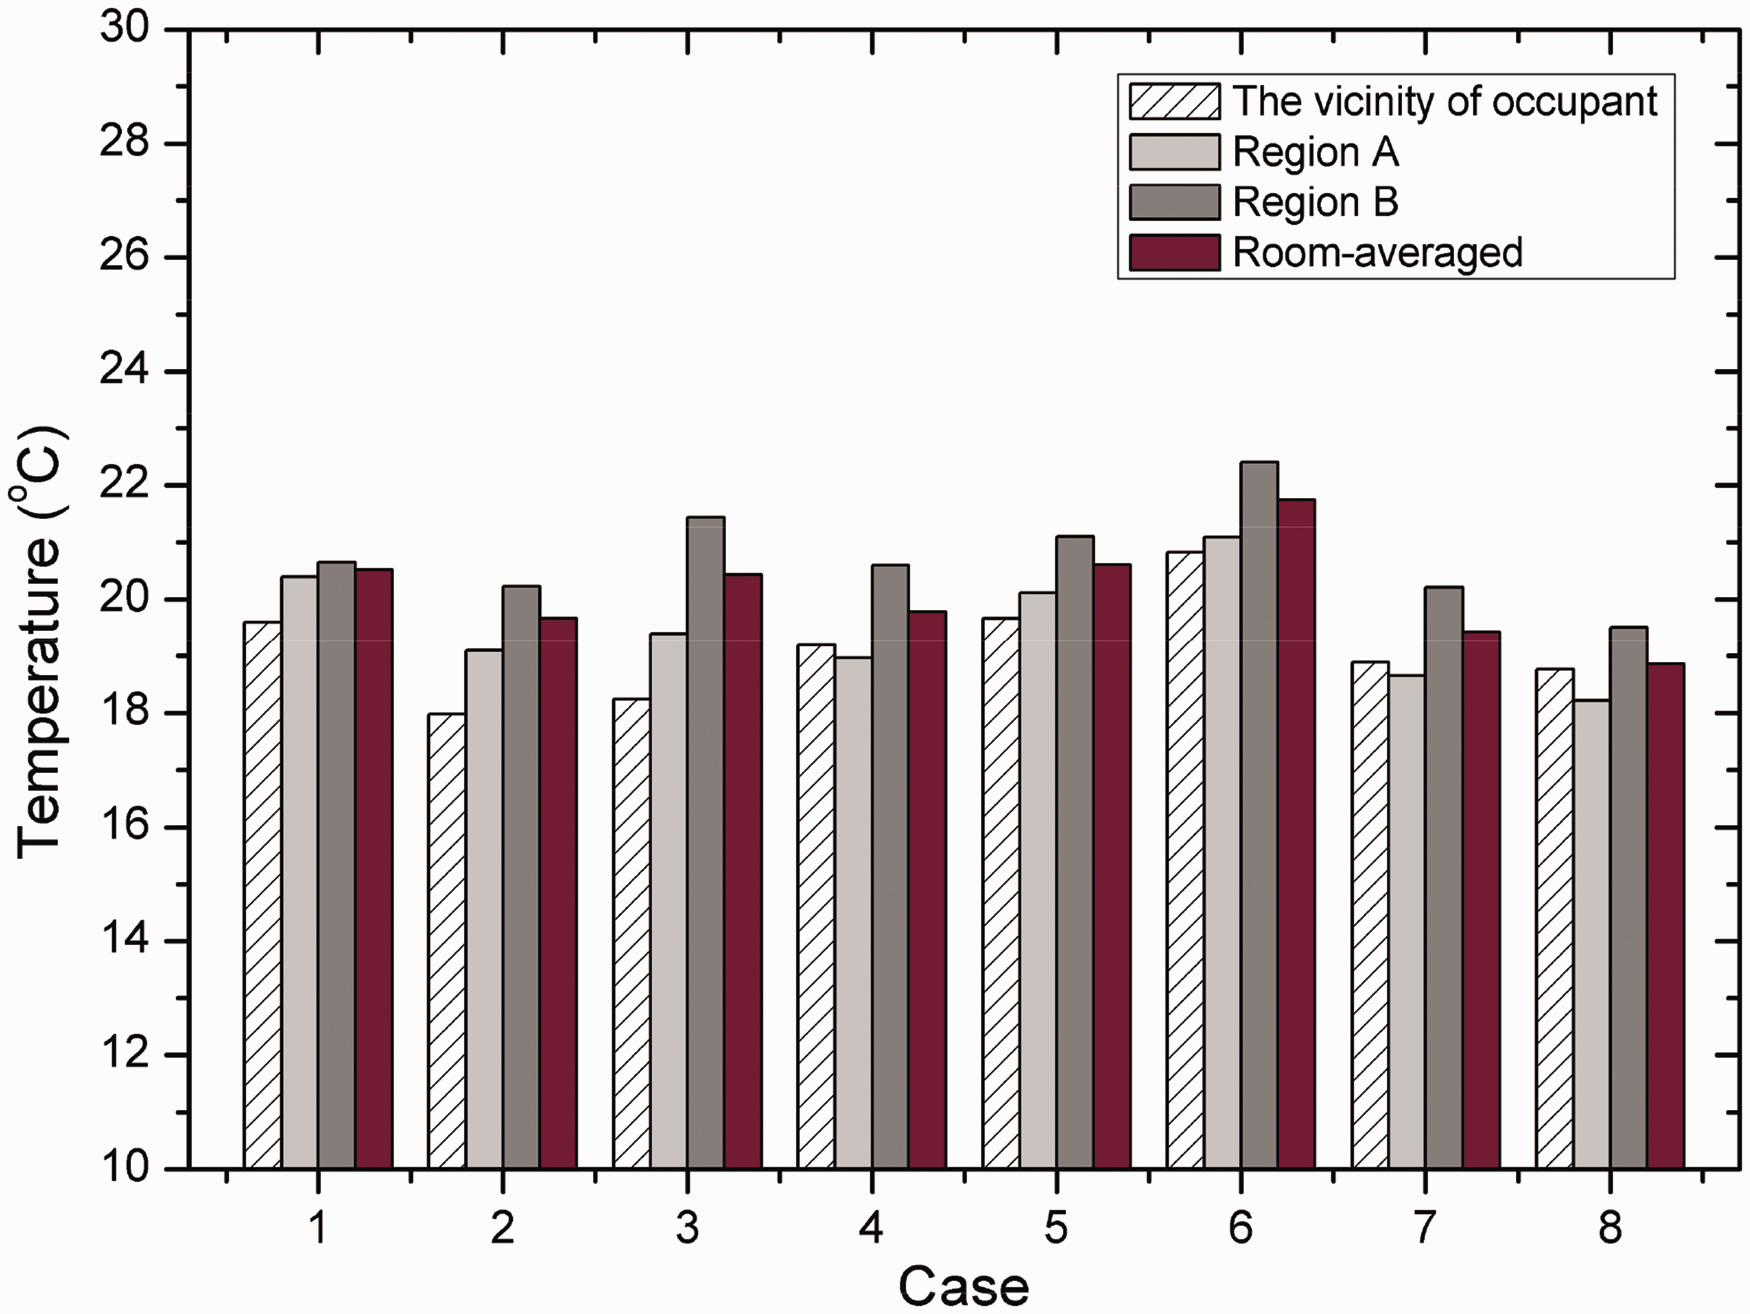
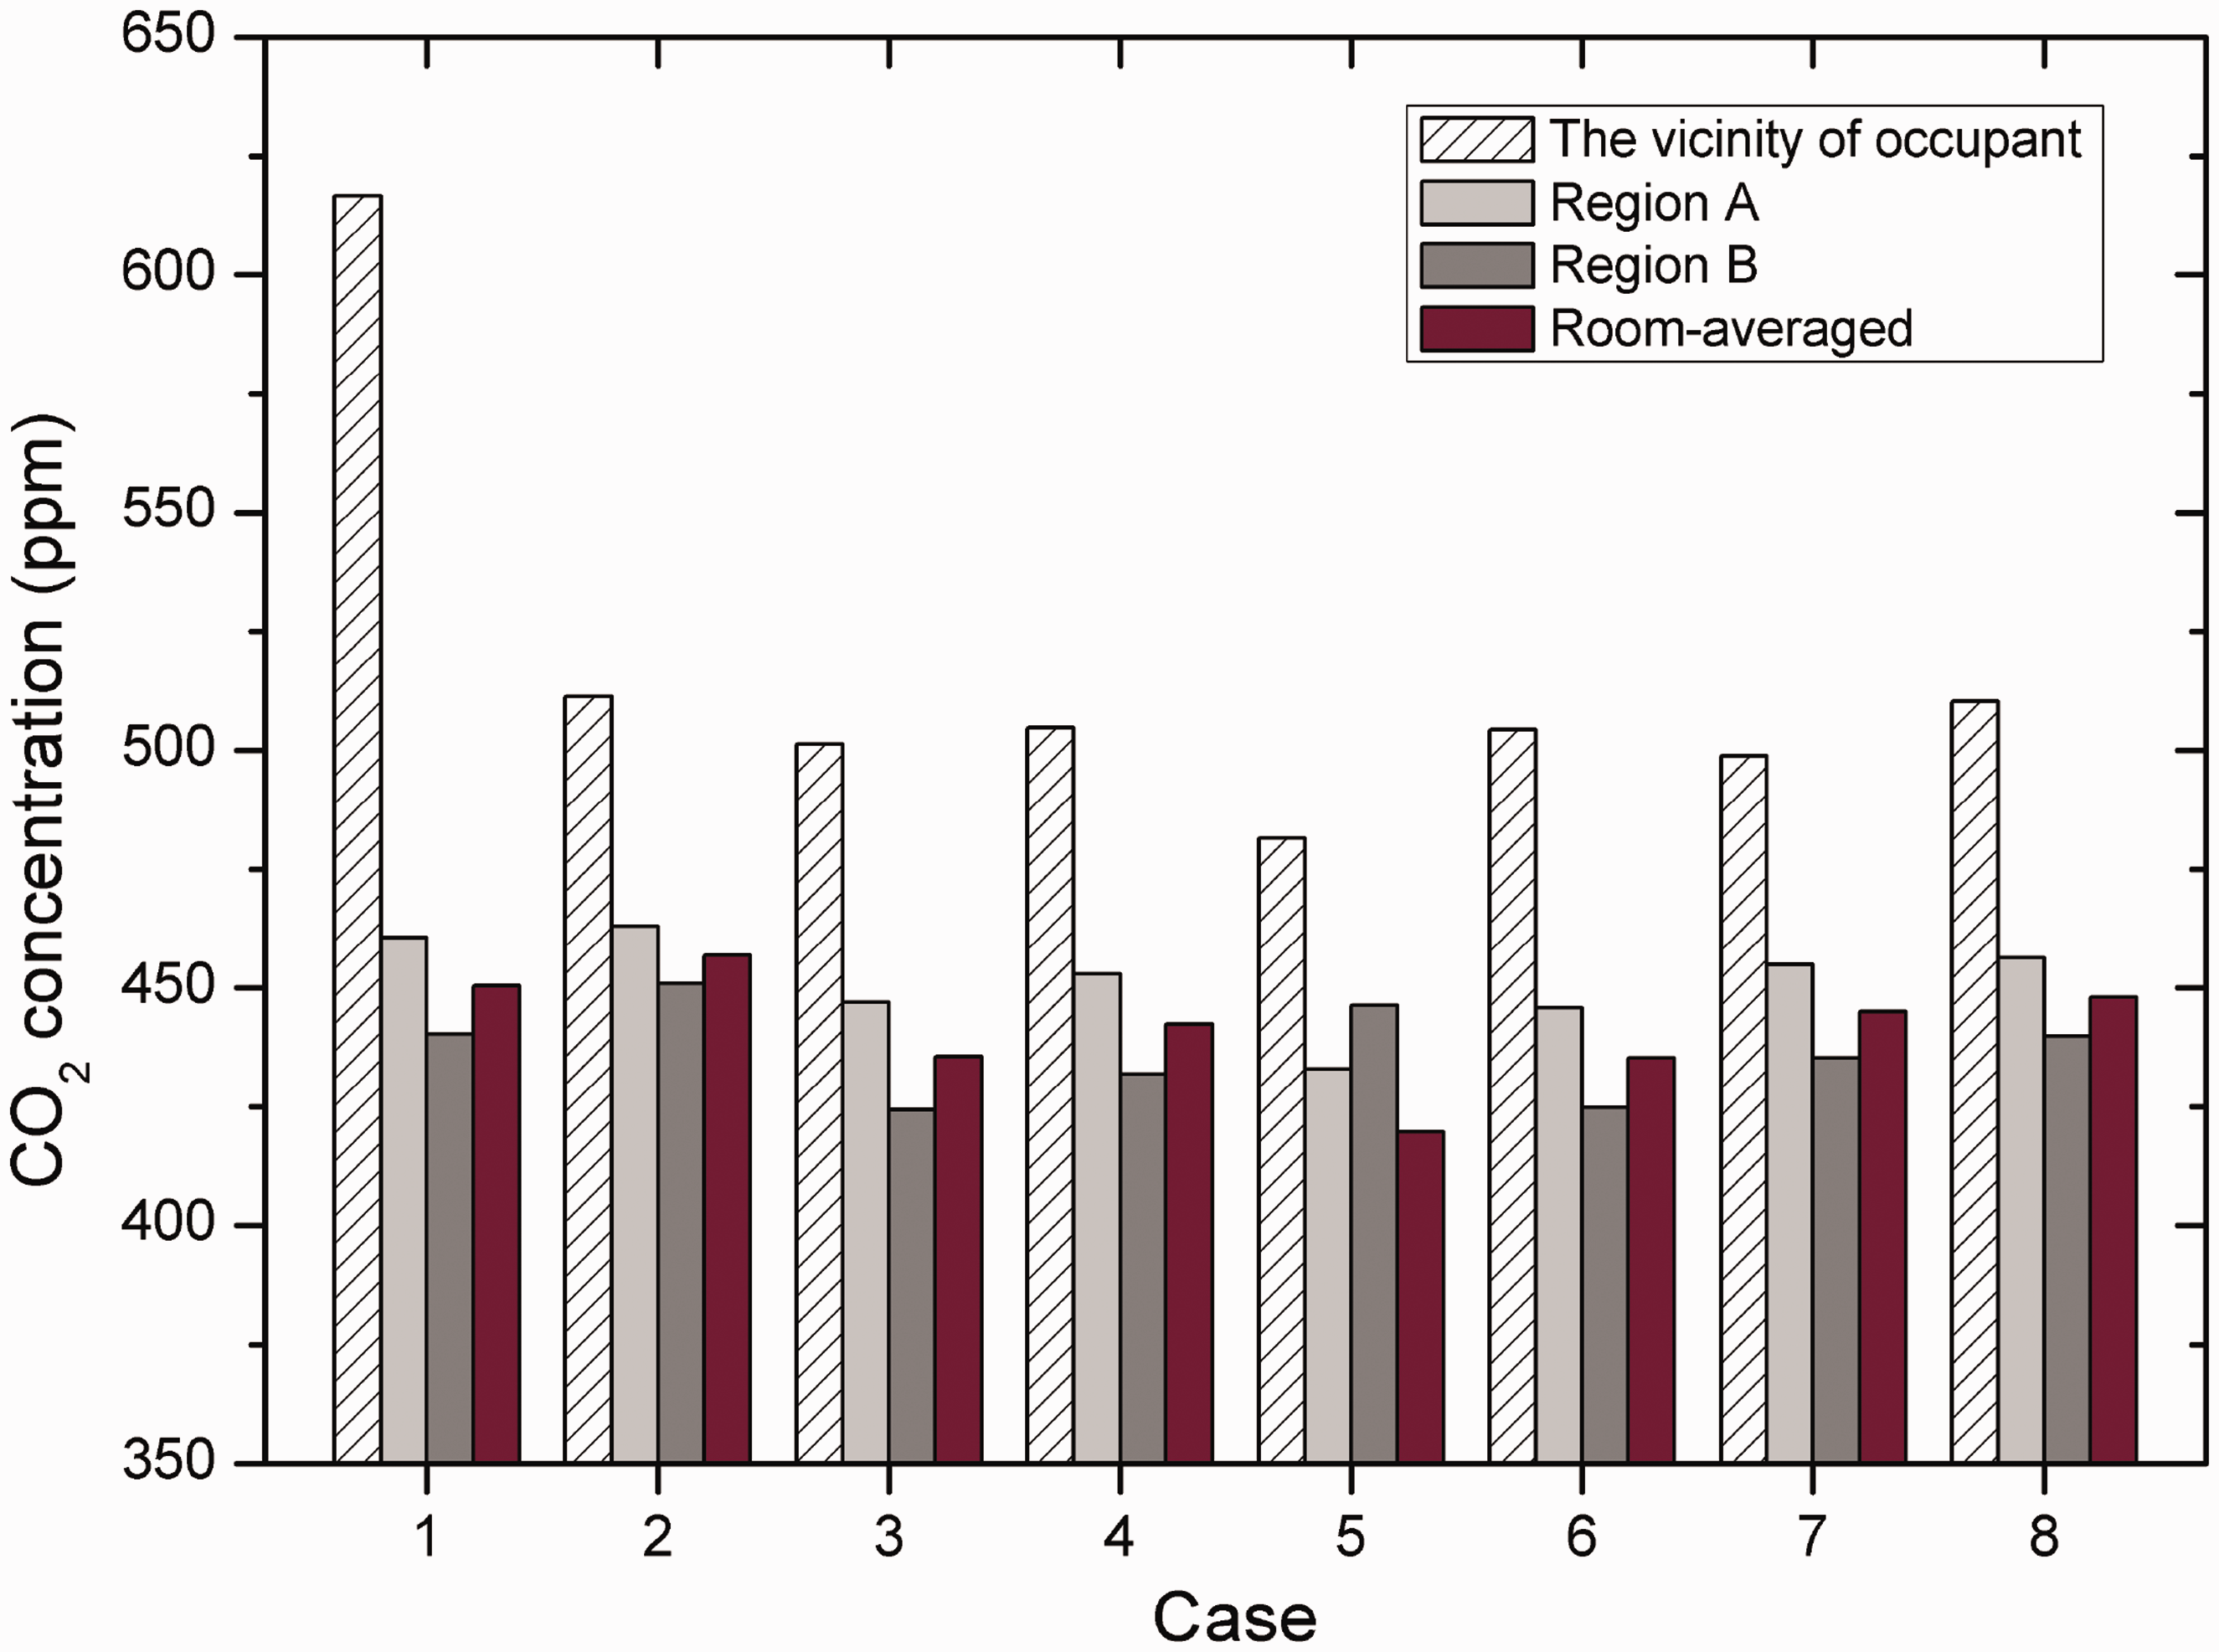
As shown in Figure 8, the room-averaged temperatures were 20.5°C in Case 1 and 18.9–21.8°C in Cases 2–8. The average temperatures in the vicinity of the occupant were 19.6°C in Case 1 and 18.0–20.8°C in Cases 2–8. The temperature in Case 6 was high compared with other cases. In Figure 9, the average CO2 concentration in the vicinity of the occupant in Case 1 was exceptionally high, quite unlike the other cases. Otherwise, there were no remarkable differences in the average CO2 concentration of these eight cases. The sealing performance effects on heat transfer and CO2 diffusion by the air curtain system, in this study, was ineffective. In Case 2, the air curtain system redistributed the heat and CO2 because the supply air was a mixture of fresh air and some of the return air from two diffusers. In Cases 3–8, the main air stream passed through the jet of the air curtain system due to the pressure difference between regions A and B. That pressure difference was caused by the intake air through the recirculation slot of the air curtain system and a single inlet and a single outlet at both sides of the air curtain system at the centre in the office. Figure 10 shows the averaged PMV values in the vicinity of the occupants in Cases 1–8. When the air curtain system was installed in the office, the PMV was commonly lower than that of Case 1, but Case 6 was exceptional. The PMV values in Cases 2–4, 7 and 8 were low due to the high air velocity. However, the PMV values in Cases 1 and 6 were close to an acceptable range because of the comparatively low air velocity and high temperature near the occupants.
Average temperatures in the regions A and B, the whole space and the vicinity of the occupants.
Average CO2 concentrations in the regions A and B, the whole space and the vicinity of the occupants.
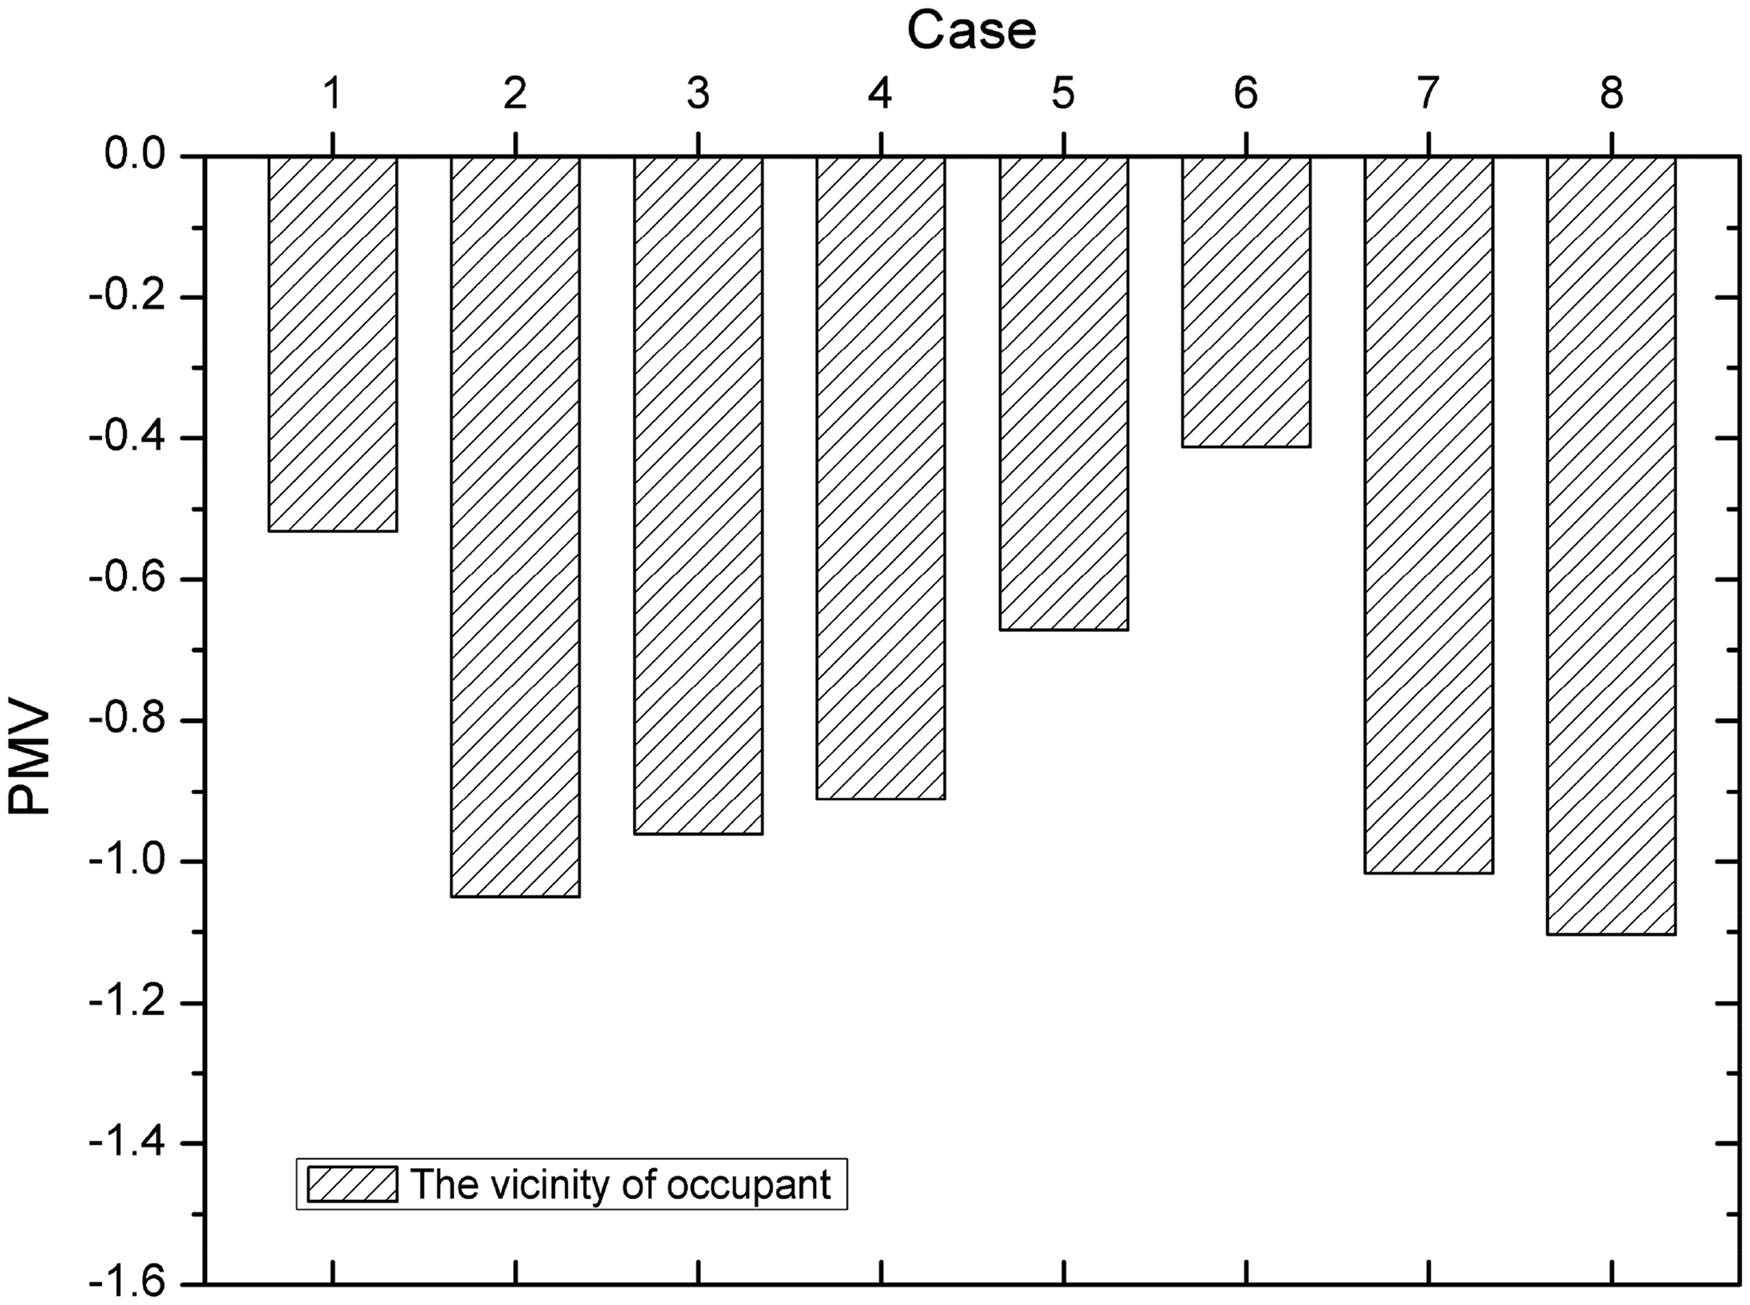
PMV values in the vicinity of the occupants.
Figure 11 presents the time required until the number of suspended expiratory droplets was less than 1% of the droplets expelled by coughing when the air exchange rate was 4 ACH. It took about 13 min for 99% of the total expelled droplets to be deposited or to escape without the air curtain system; however, with the air curtain system in Cases 2–8, the time was less than 3 min. Among Cases 2–4, the time in Case 4 was the shortest, since the recirculation slot of the air curtain system faced region A. As the jet velocity of the air curtain system increased, the time required shortened. Thus, the air curtain system was effective for the removal of the expiratory droplets. However, the removal of the expiratory droplets might not be efficient and would require investigation. For this, the numbers of suspended, deposited and escaped droplets were examined, as shown in Figure 12. The fates of indoor particles in ventilated rooms can be divided into three categories: suspended, deposited and escaped. 61 In this study, the escaped droplets meant the droplets exhausted through the outlet, or the droplets filtered through the recirculation slot of the air curtain system, and they were regarded as being efficiently removed. In Case 1, expiratory droplets were almost all deposited, and only 4% of the total expelled droplets were exhausted or filtered. In this case, there was no jet flow from the air curtain system to prevent the droplet penetration, and this caused slow movement of the indoor air and the droplets. The expiratory droplets in Case 4 escaped more than those in Cases 1–3, and the rate was 22% of the total droplets. By contrast, the expiratory droplets in Cases 2 and 3 had the disadvantage of being filtered. In Case 2, there was no chance to filter the expiratory droplets due to the recirculation slot of the air curtain system not being available. In Case 3, the recirculation slot of the air curtain system faced region B, where the occupant was absent. Thus, the expelled droplets had to move through region B to be filtered, which was a longer path than in Case 4. Therefore, when the recirculation slot of the air curtain system faced region A, where the occupant was located, the removal efficiency of expiratory droplets improved. From the above results, there appeared to be a correlation between the rate of escaped particles and the removal time. However, Cases 6–8 took on a different aspect. As the jet velocity from the air curtain system increased, the removal time of the expiratory droplets shortened, but the rate of escaped droplets decreased. The rate of escaped droplets in Case 6 was the smallest at about 31%. The rates of escaped droplets in Cases 7 and 8 were 22 and 20%, respectively, because the higher jet velocity induced the expiratory droplets to collide on the bottom and the wall, which promoted droplet deposition. In Case 5, the rate of escaped droplets was about 22%, and this was lower than that of Case 6 because the jet from the air curtain system did not reach the floor and could not prevent the dispersion of droplets on the bottom in region A. Therefore, on the condition that the jet is enough to reach the floor, and the direction of the main air stream is from region B to A, a lower jet velocity of the air curtain system was rather effective for discharging and filtering the expiratory droplets.
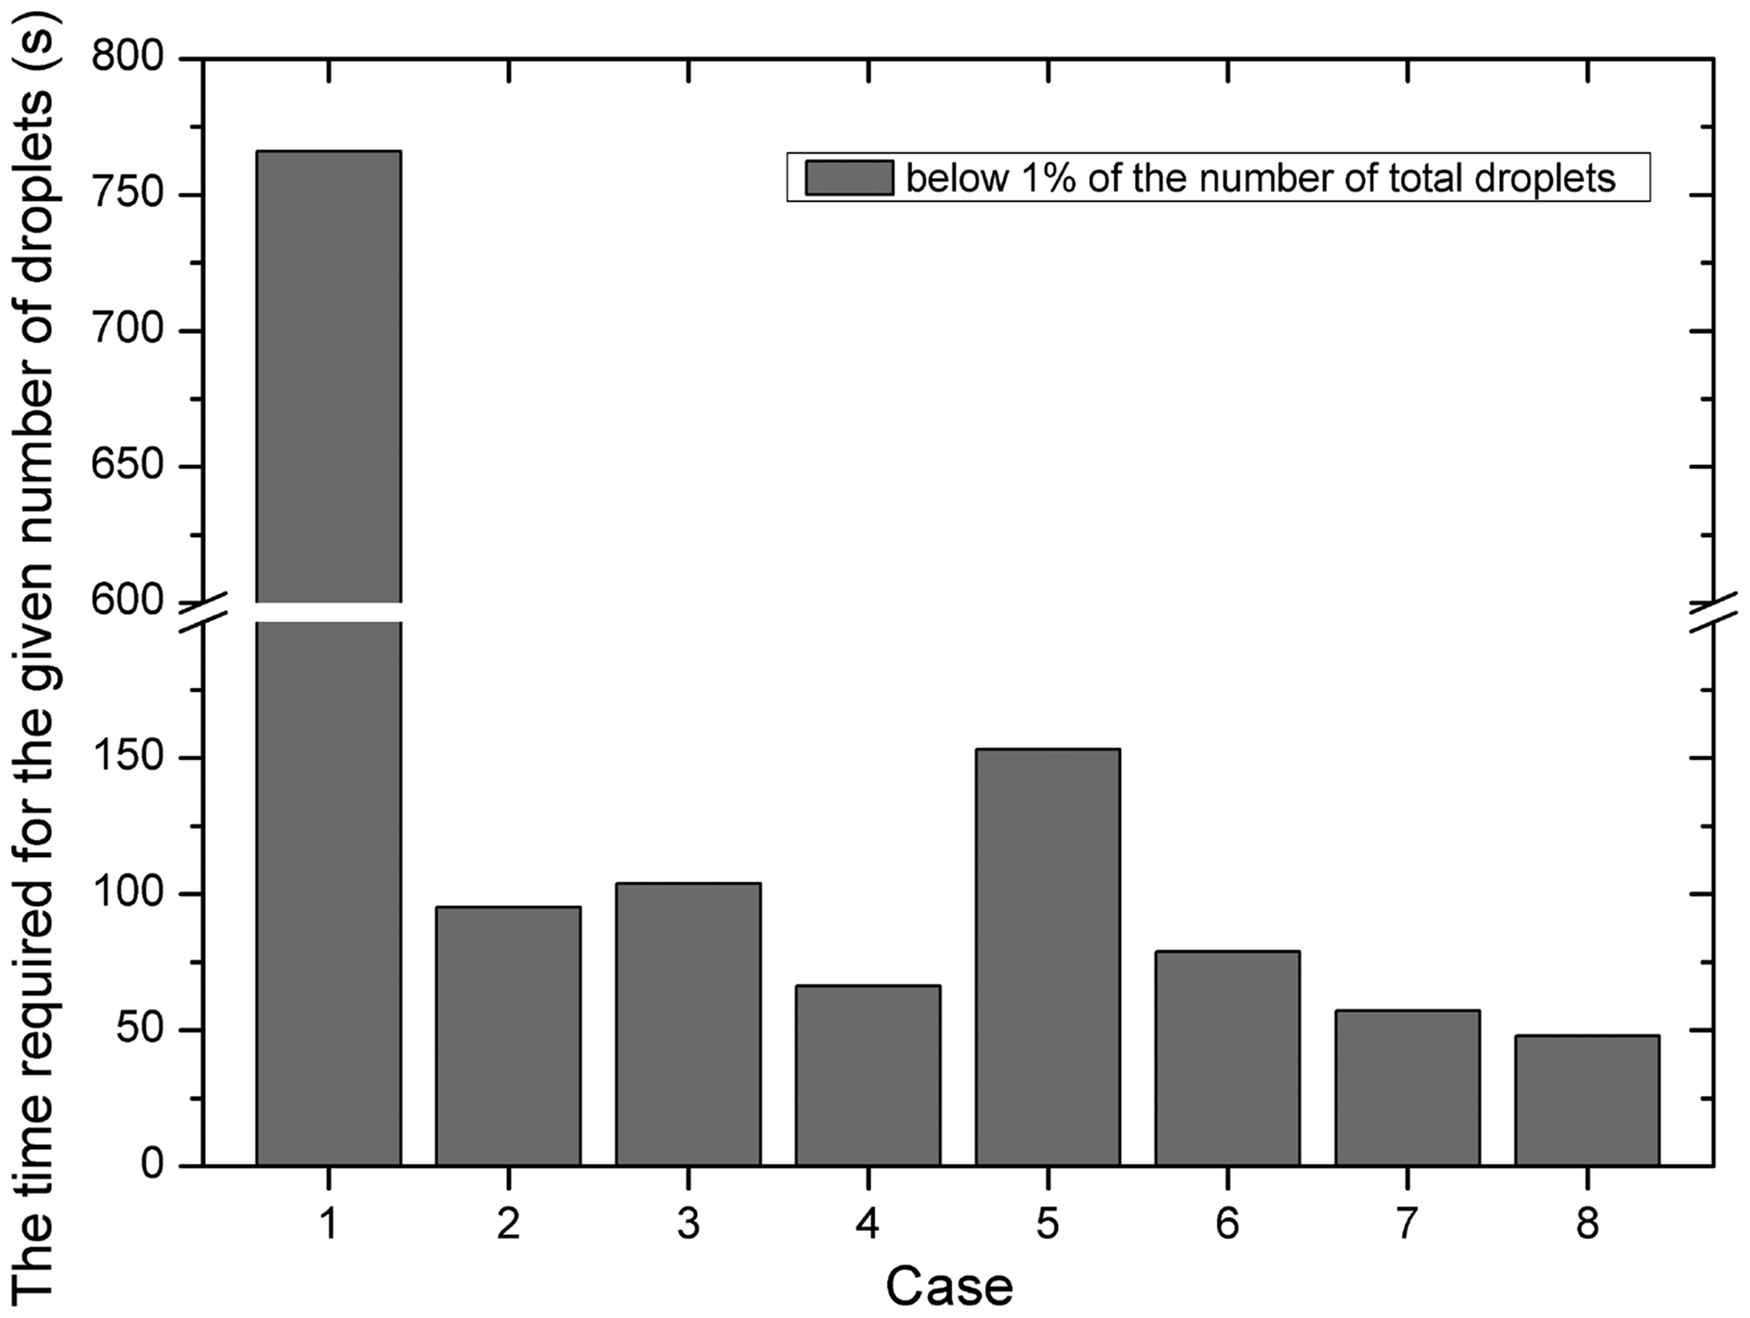
The time required until the number of suspended expiratory droplets reached less than 1% of the droplets expelled.
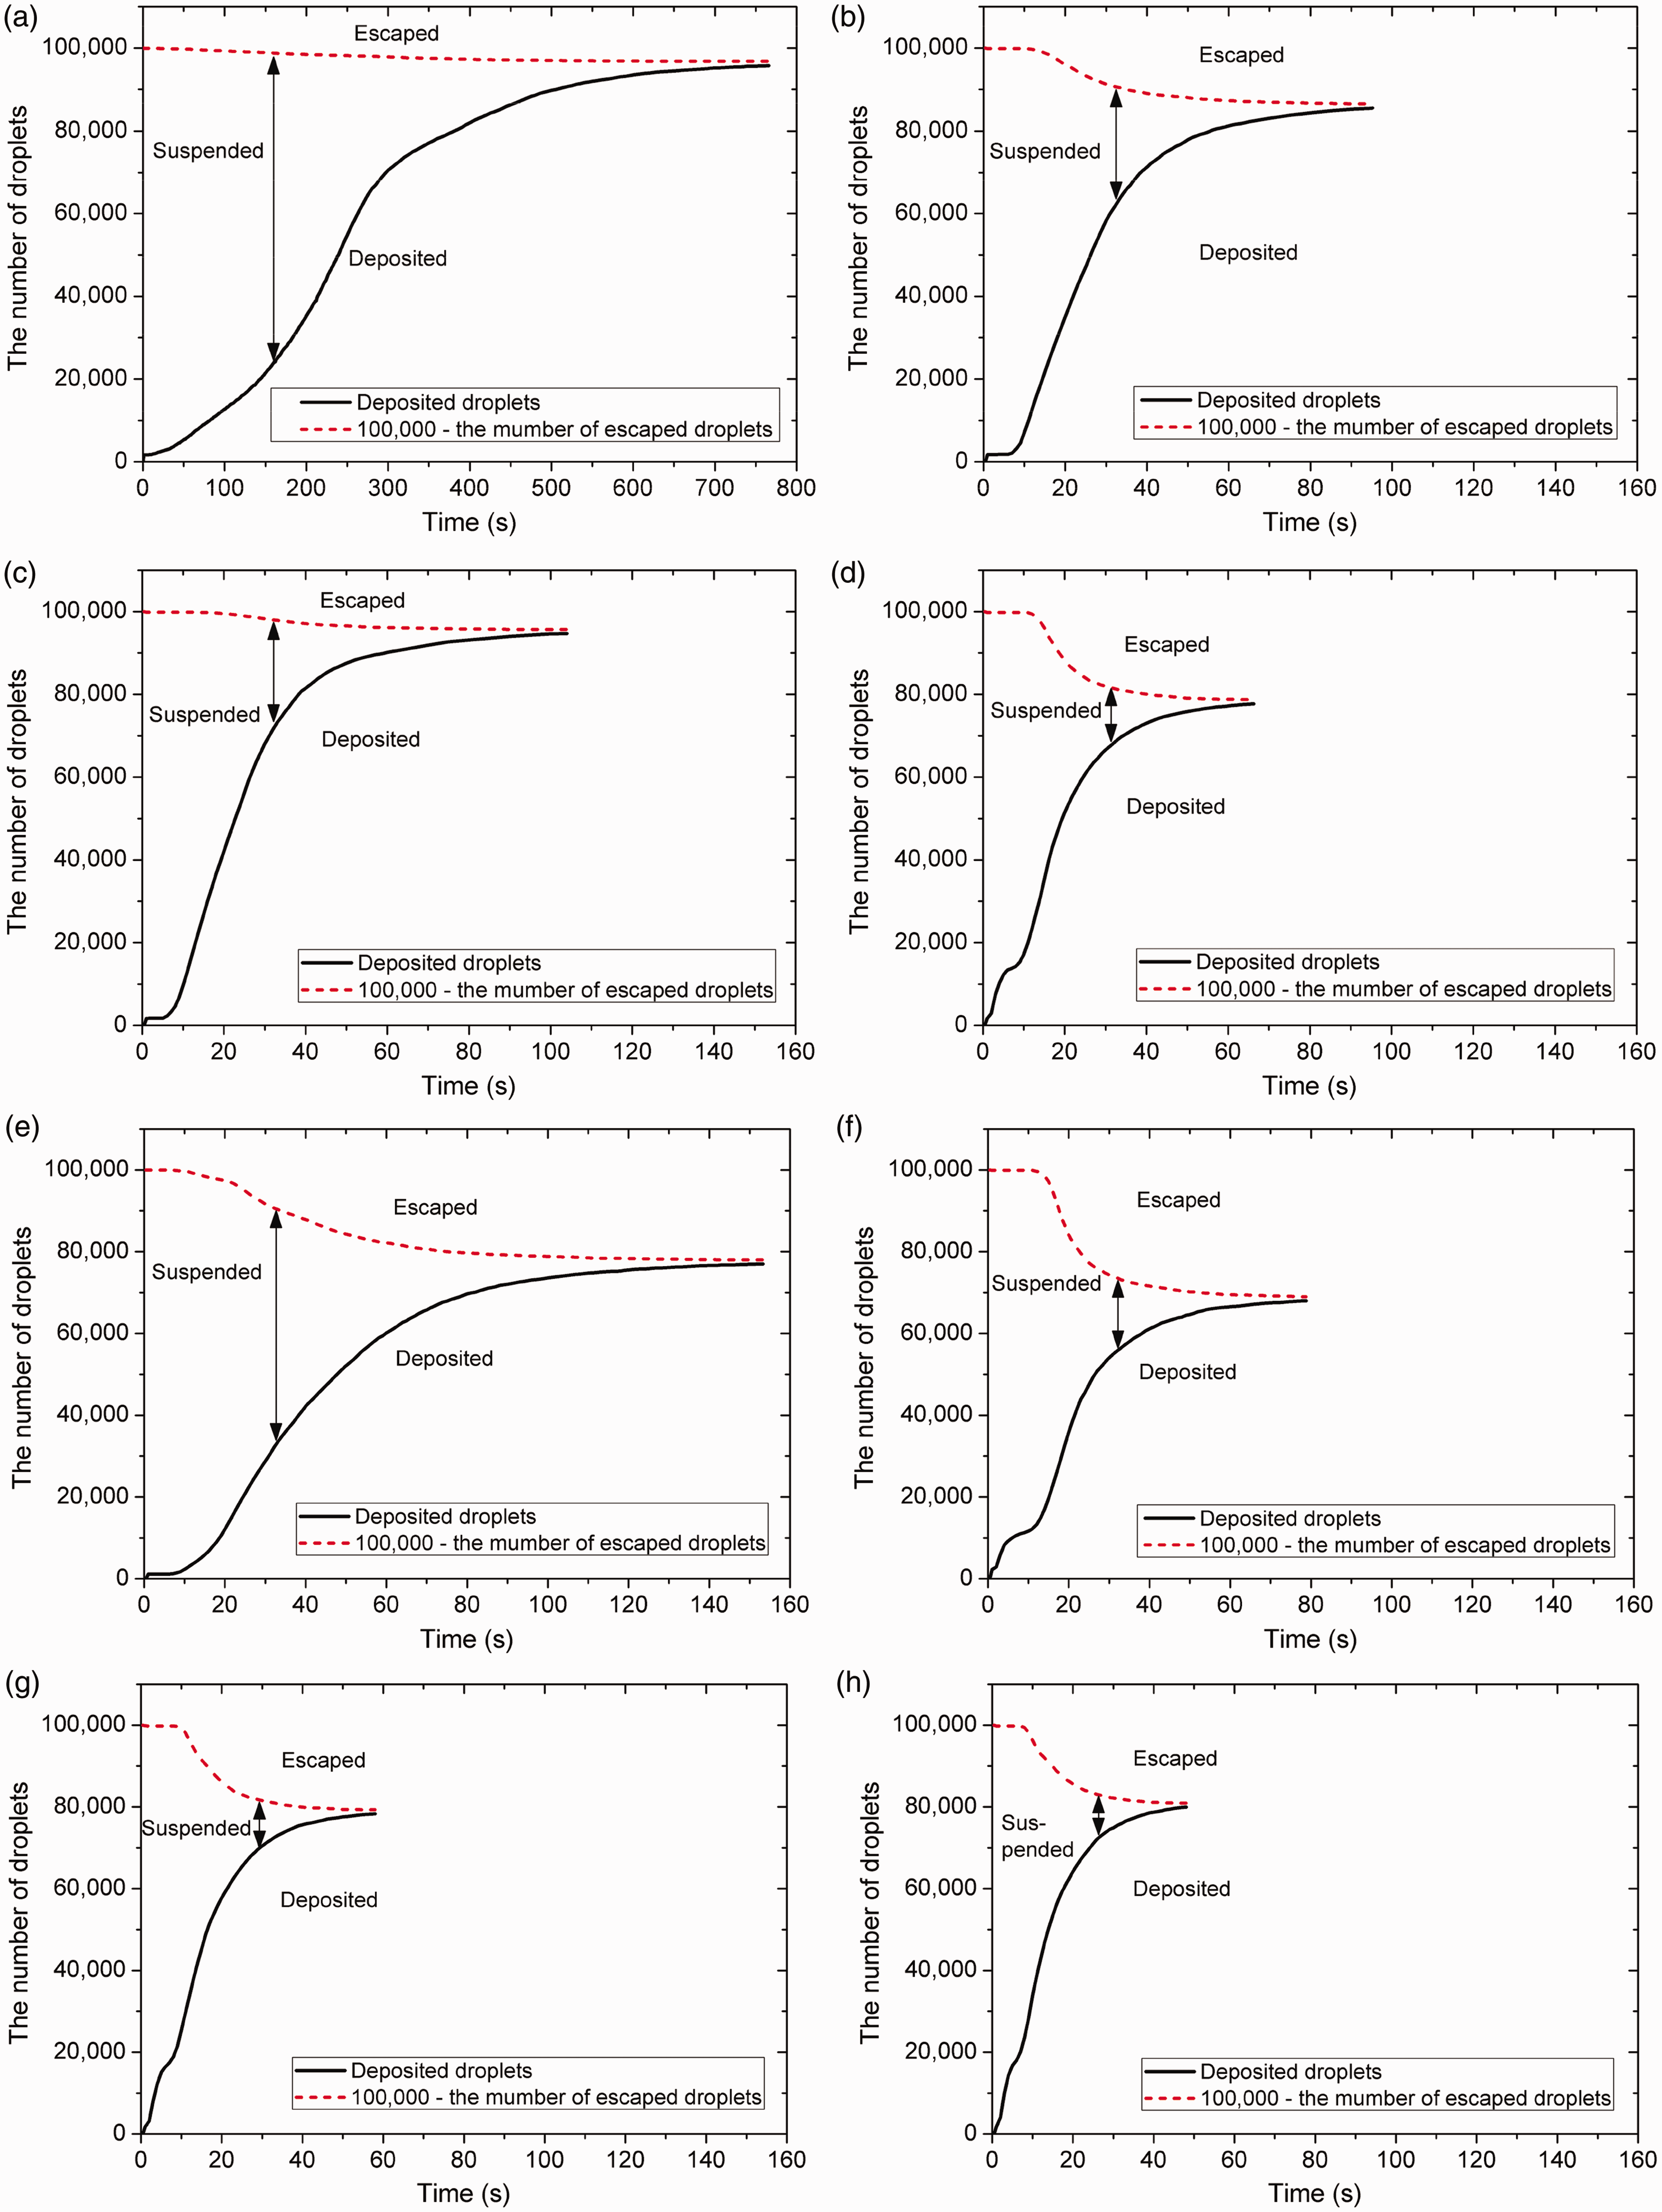
Fates of expelled droplets: (a) Case 1; (b) Case 2; (c) Case 3; (d) Case 4; (e) Case 5; (f) Case 6; (g) Case 7; (h) Case 8.
The number of suspended droplets in regions A and B over time are presented in Figure 13, which shows the effectiveness of the air curtain system for preventing droplet dispersion to region B. In Case 1, there were fluctuations in the number of suspended droplets in regions A and B. These indicated that the suspended droplets moved around the indoor space. In Cases 2–8, by contrast, there were no fluctuations, and the air curtain system was effective in preventing droplet dispersion. The maximum numbers of suspended droplets in region B were 5435 in Case 2, 9991 in Case 3, 861 in Case 4, 2004 in Case 5, 847 in Case 6, 852 in Case 7 and 1111 in Case 8. When the jet velocity was fixed to 4 m/s in Cases 2–4, the air curtain system in Case 4 exhibited better prevention performance for suspended droplets. Among Cases 4–8, even though the jet velocity increased, the prevention performance for suspended droplets did not improve. In Case 8, the maximum number of suspended droplets in region B increased rather than decreased. Therefore, for the efficient removal and prevention of expiratory droplets in this office, the recirculation slot of the air curtain system had to face region A, and the proper jet velocity was 3 m/s.
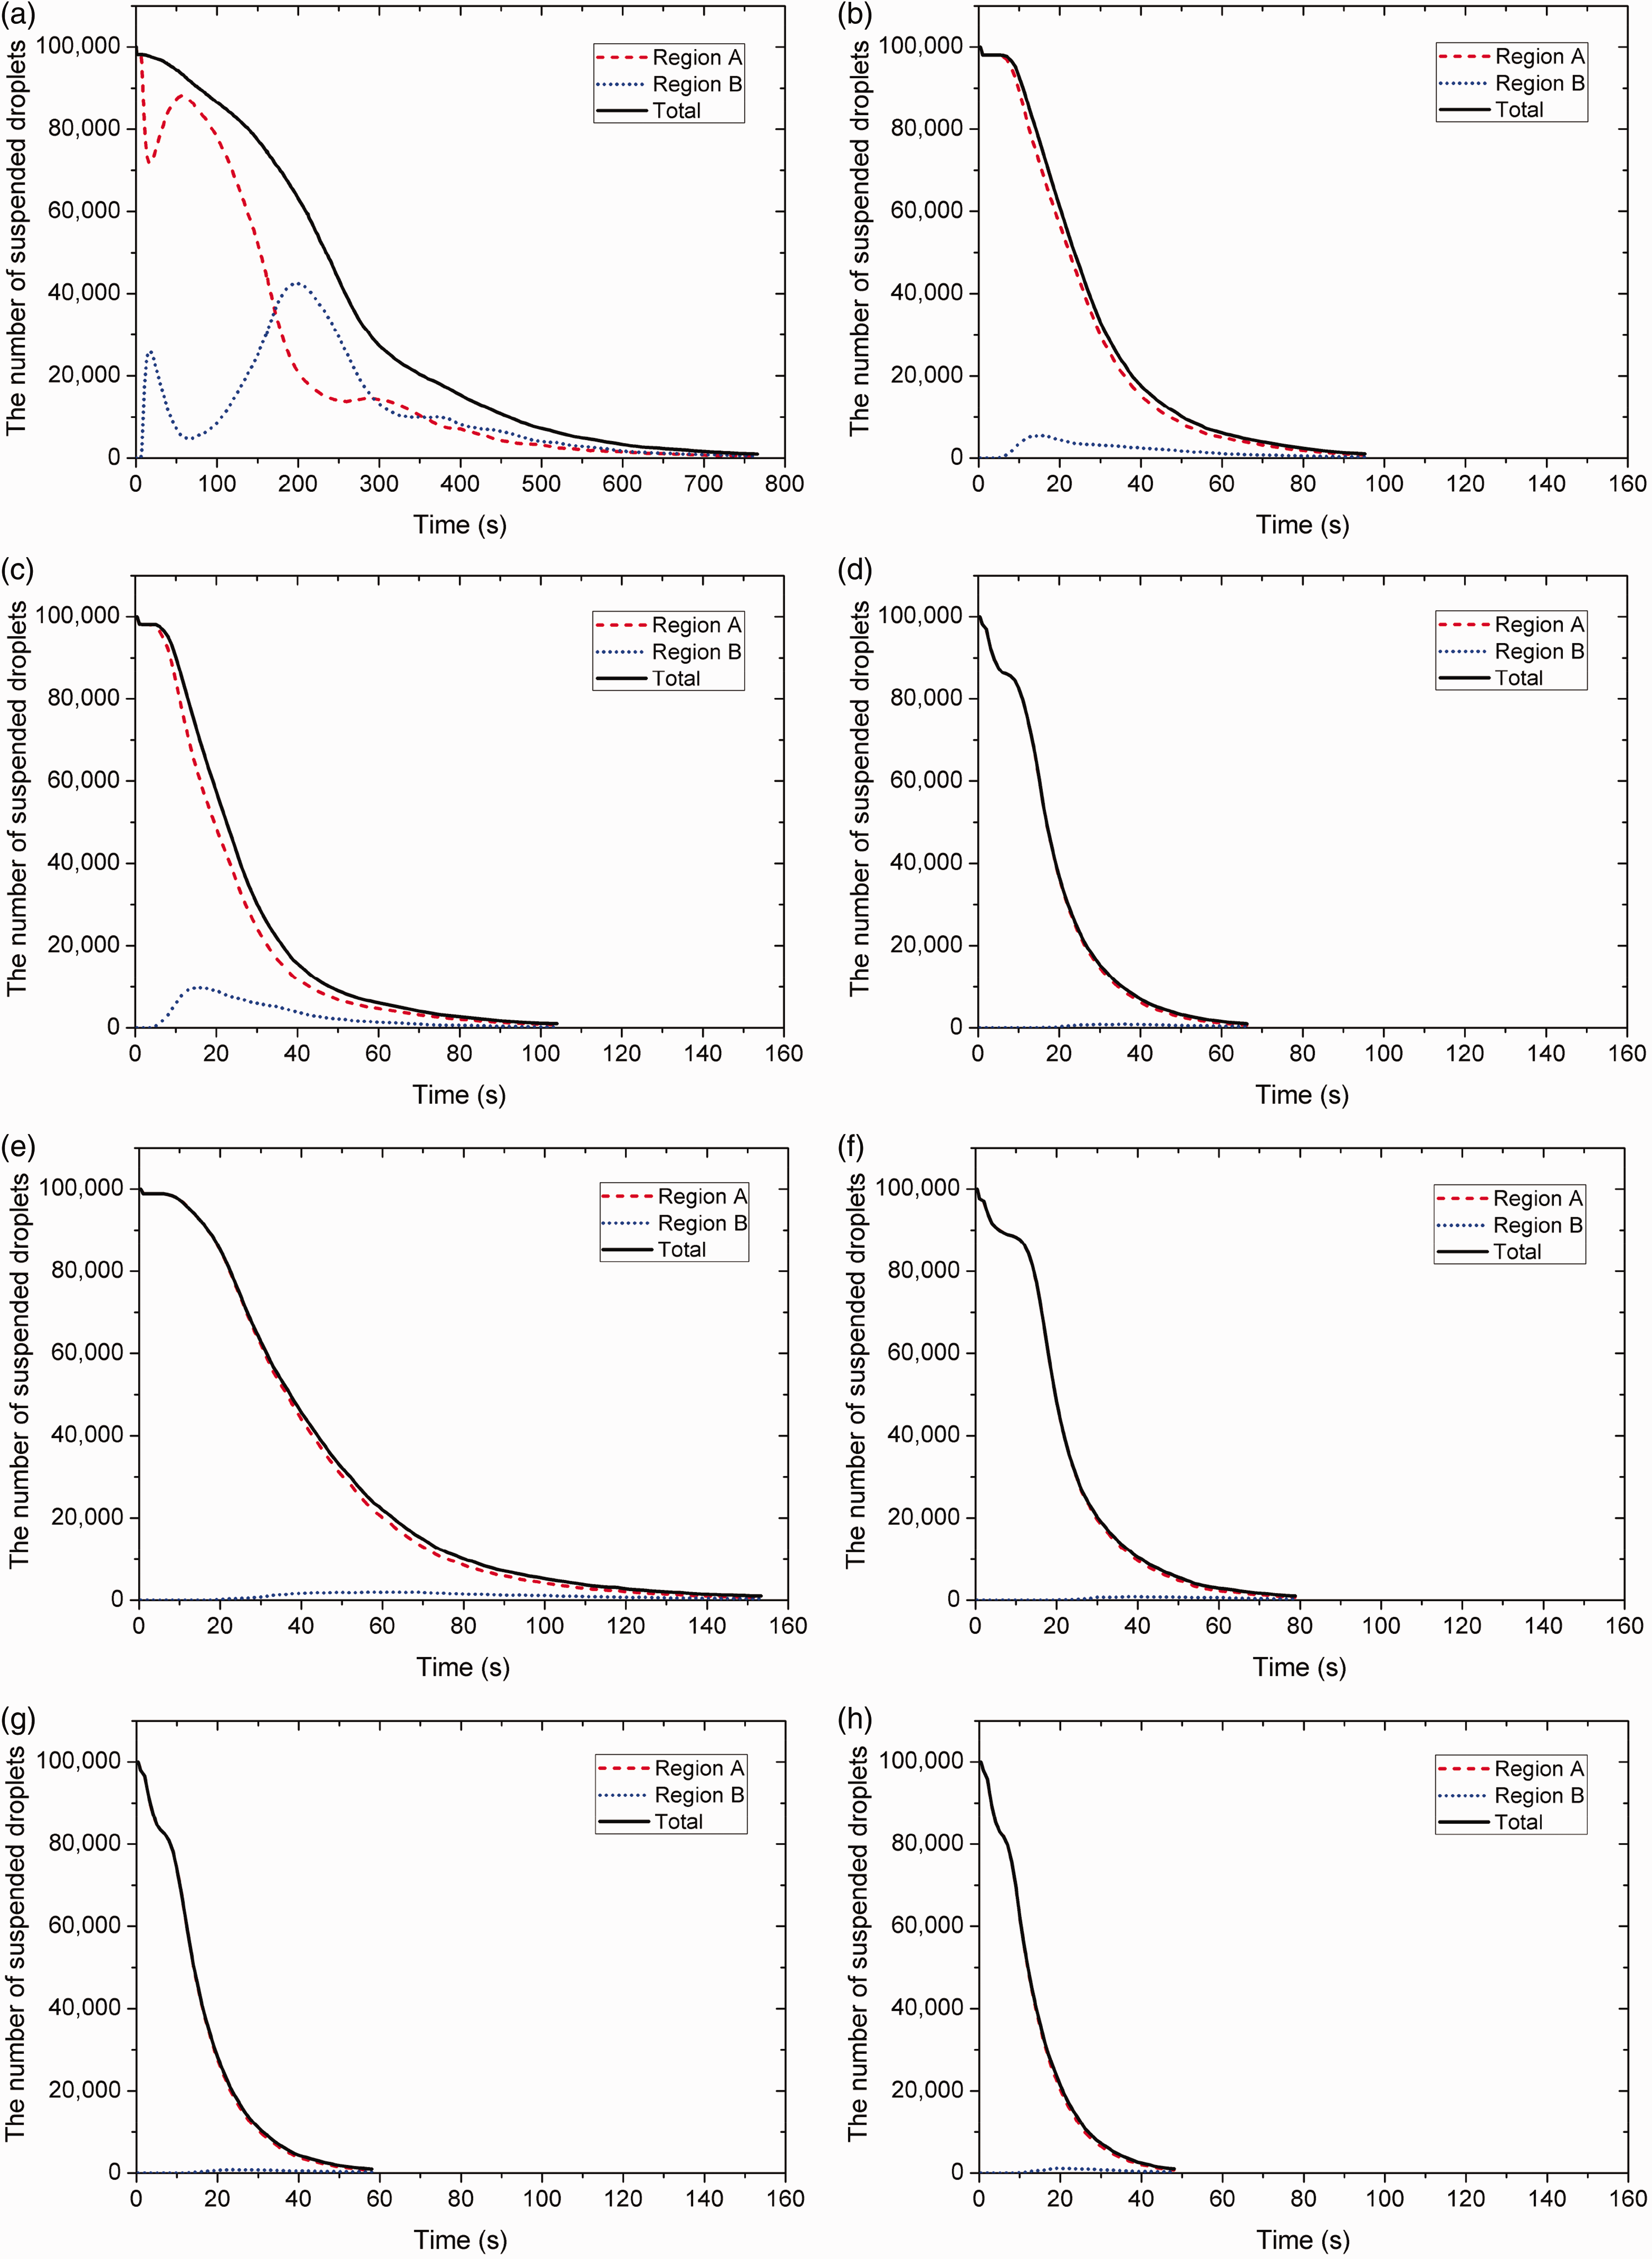
The number of suspended droplets in regions A and B and whole room: (a) Case 1; (b) Case 2; (c) Case 3; (d) Case 4; (e) Case 5; (f) Case 6; (g) Case 7; (h) Case 8.
In addition, the removal performance of the air curtain system and air cleaner was examined in Case 9. The conditions and results of Case 3 were used and compared. The airflow rate of the air cleaner was set to be the same as that of the air curtain system in Case 3, and the air exchange rate was also four ACH. The expiratory droplets that were generated locally travelled with the room airflow which limited passage through the air cleaner. Also, the momentum of the air blown by air cleaner may have promoted dispersion of the expiratory droplets. Figure 14 presents the number of suspended, deposited and escaped droplets in Case 9 and shows that the air cleaner was less effective in preventing the dispersion of the expiratory droplets compared to Figure 12. In Case 9, it took 122 s for 99% of the total expelled droplets to be deposited or to escape compared to 79 s in Case 3. The proportion of exhausted or filtered droplets with the outlet and the air cleaner in Case 9 was only 5.3%. In comparison with Case 3, usage of the air cleaner was not more efficient than the air curtain system in exhausting and filtering the expiratory droplets. Figure 15 presents the dispersion process of the expiratory droplets in Cases 1, 6 and 9. Because of the low internal velocity in Case 1, the suspended droplets were less likely to settle on the wall or move closer to the outlet, which caused the number of suspended droplets to decrease slowly. In Cases 6 and 9, on the other hand, the suspended droplets became more active in collision, exhaust and filtration due to the additional momentum transfers by the air curtain system and the air cleaner, respectively. The numbers of suspended droplets in Cases 6 and 9 were reduced to less than 1% of the initial number in a short period compared with Case 1. As stated above, in Case 6, the expiratory droplets were driven into region A by the air curtain system, and air with a high droplet concentration was exhausted by the outlet and filtered by the recirculation slot of the air curtain system. Thereby, more droplets could be removed in the same time than in Case 1 and 9. In Case 9, the number of droplets decreased faster than in Case 1, but most of the expiratory droplets settled on the wall and the floor. This was because that the droplets spread out into the whole space by air blown from the air cleaner, reducing capture by the air cleaner. As shown in the simulation results, the air cleaner may not be effective in removing the expiratory droplets depending on the relative positions of the air cleaner and the droplet generation.
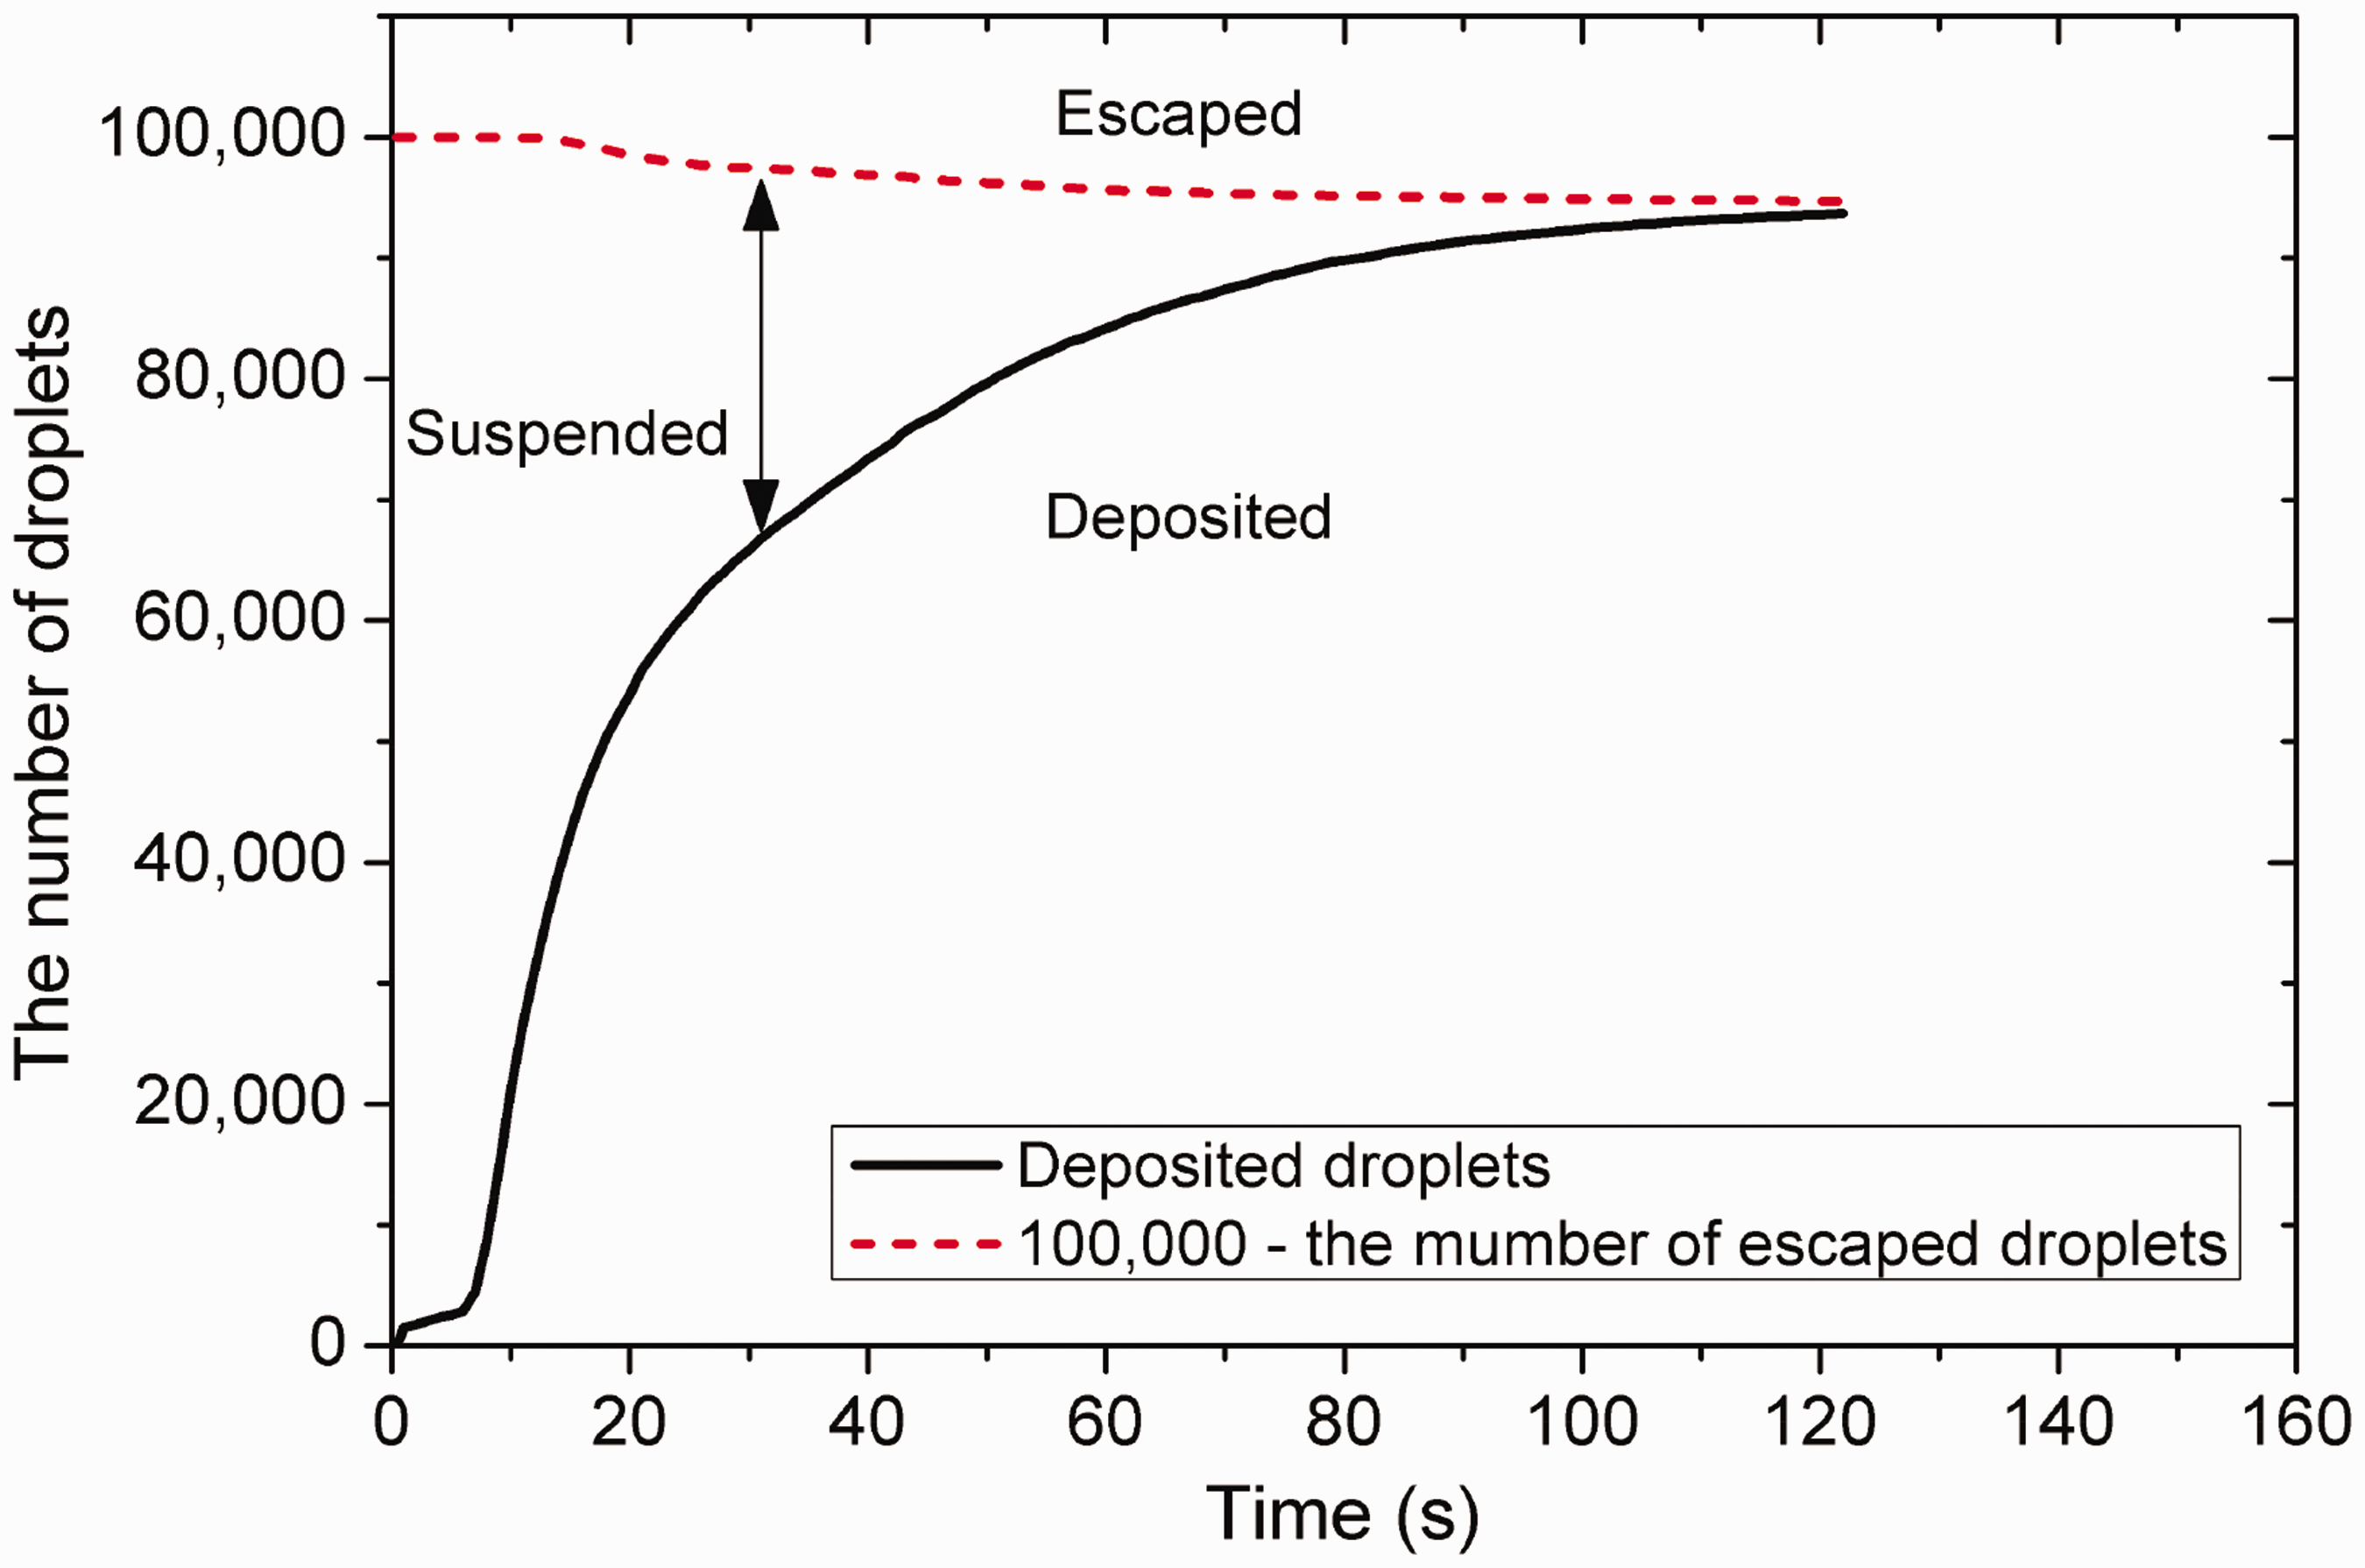
Fates of expelled droplets in the room equipped with an air cleaner.

Temporal distributions of expelled droplets: (a) Case 1; (b) Case 6; (c) Case 9.
The cases described above deal with a scenario of one infected occupant in a one-person office. However, exposure to expiratory droplets from an infected occupant to a second uninfected occupant was also investigated. For additional simulations, the uninfected occupant was located in the centre of region B whereas the infected occupant was in region A based on Cases 1, 6 and 9. Figure 16 shows the dispersion of the expiratory droplets from the infector as source in Cases 1′, 6′ and 9′ when both the infected and the uninfected occupants were in the office. The movement of the expiratory droplets was changed due to the uninfected occupant in region B. In Case 1′, the momentum on the floor of the cold air coming down from the window surface was abated because the uninfected occupant blocked the cold air. As a result, the supply air that descended to the space behind the infected occupant was spread across the floor without being pushed by the cold air. Subsequently, the warm supply air spreading on the floor in region B moved up by buoyancy, and these thermal updrafts in region B initially blocked the expiratory droplets from the infected occupant in region A. The group of blocked droplets returned to the infected occupant's face and went back to the windows, windowsill and floor in region A. Then the droplets started to disperse across the floor to region B. However, many droplets ascended before going over to region B and returned to region A, and this process was repeated. The maximum number of droplets that went over to region B was about 7% of the total. This was an unintended consequence of the location of the uninfected occupant. The time required for the number of suspended droplets to become 1% of the total in Case 1′ was about 20 min, which was 7 min longer than that in Case 1. Despite a reasonable blocking effect and removal rate, this process took a long time to remove the expiratory droplets. Thus, the removal rate was reasonable but the removal efficiency was not. The number of droplets reaching the face of the uninfected occupant was 37 until the suspended droplets became 1% of the total, so there remained a potential for infection in Case 1′.
Temporal distributions of expelled droplets when the uninfected occupant was positioned: (a) Case 1′; (b) Case 6′; (c) Case 9′.
In Case 6, the supply air circulated vertically from the floor to the ceiling in the entire area of region B, so region B was a single recirculation zone. This assisted the jet from the air curtain system to tilt into region A. In Case 6′, however, as the uninfected occupant prevented the supply air from recirculating around the entire area of region B, and the angle that tilted toward region A of the jet from the air curtain system was smaller than that in Case 6. Thus, the maximum number of suspended droplets in region B was about 1000, which was 160 more than that in Case 6. In addition, the time required for the number of suspended droplets to become 1% of the total in Case 6′ was about 2 min, 30 s longer than that in Case 6. The number of the exhausted or filtered droplets was about 18,000, showing that the removal efficiency in Case 6′ was lower than that in Case 6. However, no droplets reached the face of the uninfected occupant. Hence, the air curtain system and its operation in Case 6 could serve as an effective method to prevent exposure to the expiratory droplets.
In Cases 9 and 9′, the main air streams were formed by the air cleaner. The airflows from the air cleaner circulated horizontally along the side wall of the office, and the supply air from the inlet was entrained into this stream. The airflow in Case 9′ mainly rotated about the centre of the office, and the uninfected occupant was located at the centre of this airflow and did not block the air stream. The time for the number of suspended expiratory droplets to be less than 1% of the total in Case 9′ was about 2 min, which was 7 s shorter than that in Case 9. The number of the exhausted or filtered droplets in Case 9′ was about 5200, which meant that the removal efficiency was the same as for Case 9 owing to their similar airflow pattern. The number of droplets reaching the face of the uninfected occupant until the suspended droplets became 1% of the total was 250. Since the air from the air cleaner caused the droplets from the infected occupant to move quickly to region B, the number of droplets reaching the face of the uninfected occupant was increased in Case 9′.
These simulations with the uninfected occupant demonstrate that Case 6′ performed better than Case 1′ and 9′ in terms of droplet removal efficiency. Overall, in order to reduce the amount of droplets escaping from region A to the hallway or the risk of infecting the occupant in region B, the conditions of Case 6 or Case 6′ are recommended (recirculation slot in direction of region A; outlet in region A; inlet in region B; jet velocity of the air curtain system is 3 m/s). However, more detailed investigations of the location and movements of the infected and uninfected occupants are required in future study, since these affect droplet transport and distribution.
Conclusions
In this study, the effects of an air curtain system on the transport of expiratory particulate and gaseous contaminants and the thermal environment in a ventilated office were analysed using CFD simulations. The airflow fields and the paths of the expiratory droplets in a ventilated office were calculated with varying design, orientation and jet velocity of the air curtain system. Using these simulations, the prevention and removal performances of the air curtain system for the expiratory droplets were evaluated while also considering air velocity, temperature and PMV and CO2 concentration. The following conclusions were made:
The orientation of the recirculation slot of the air curtain system and inlet/outlet contributed to a pressure difference and a bent jet. This bent jet entrained the air from one side of the office to the other side unless the pressure difference was adjusted by an inlet and outlet. Thus, the temperature and CO2 concentration between the regions were not significantly different. However, the air velocity and the direction of the air stream in each region were affected by the bent jet, which also had an influence on PMV value due to the air velocity. Among the simulation cases, the thermal environment in Case 6 had the most comfortable thermal condition. The jet velocity in Case 6 reached the floor sufficiently to push up cold air near the windows to the outlet. However, jet velocity was not large enough to increase the averaged velocity and to circulate cold air near the windows throughout the office. When the air curtain system was installed, the time required until the number of suspended expiratory droplets was less than 1% of the droplets expelled was reduced more than seven times. The ratio of the droplets exhausted also increased. In Cases 2–4, when the recirculation slot of the air curtain system faced the occupied region A, the removal efficiency of expiratory droplets was improved. The higher jet velocity caused the removal time of the expiratory droplets to reduce, but it did not promote the exhaust of the droplets. The air curtain system was considered efficient in removing the expiratory droplets without much dependence on the higher jet velocities. In this study, a jet velocity of 3 m/s was considered adequate for removing the expiratory droplets. The air curtain system also was effective in preventing droplet dispersion. The peak number of suspended droplets in region B in Case 6 was the lowest among all cases. The jet velocity was less important for the prevention of droplet dispersion. However, the air curtain system was ineffective when the jet velocity was 2 m/s but prevented droplet dispersion at 3 m/s. The air curtain system was more effective than the air cleaner to exhaust and filter the expiratory droplets. When the airflow rate of air cleaner was set the same as that of the air curtain system, the air cleaner required more time until the number of suspended droplets was less than 1%. With the air cleaner, almost 95% of the droplets were deposited on the wall and the floor. Even with two occupants (the infected and the uninfected) in different regions, the use of an air curtain system would reduce the uninfected occupant’s exposure risk to the expiratory droplets compared to using no air curtain or an air cleaner.
Footnotes
Authors’ contribution
Dong Yoon Park conducted the numerical simulations, analysed the results and then drafted the manuscript. Seongju Chang gave advice on research and provided the overall review of the paper writing.
Declaration of conflicting interests
The author(s) declared no potential conflicts of interest with respect to the research, authorship, and/or publication of this article.
Funding
The author(s) disclosed receipt of the following financial support for the research, authorship, and/or publication of this article: This work was supported by a grant (14RERP-B090024–01) from Residential Environment Research Program funded by the Ministry of Land, Infrastructure and Transport of Korean government. It was also financially supported by Korea Ministry of Land, Infrastructure and Transport as U-City Master and Doctor Course Grant Program.