
Abstract
This study analysed the dynamic changes and driving forces in the urbanization from 1997 to 2016 of Xixian, a national new development area in Xi’an City, by using geographical information systems and remote sensing. The results showed that farmland was the main land use type from 1997 to 2004. However, the construction land occupied the largest area from 2011 to 2016. There was a significant expansion in the construction land area (33.24%), unused land (91.10%) and woodland (37.59%) from 1997 to 2016. In addition, in the period from 1997 to 2016, the water body, grassland and farmland were reduced by 52.52%, 31.73% and 23.84%, respectively. The increasing area of construction land was the inevitable result of urbanization. The terrain, policy and geographical location factors are the main driving forces for changes in the land use and urbanization. The planning of Xixian National New Area’s building environment should be linked and connected with the Xi’an main districts. The findings confirmed the applicability and effectiveness of the combined method of geographical information systems and remote sensing for revealing the notable spatio-temporal features in the dynamic changes in the land use and land cover throughout different time periods of Xixian.
Introduction
In recent years, China’s urbanization process has been developing rapidly due to reform and economic liberalization and globalization.1,2 Over the past 20 years, there has been much pressure on land preservation due to the large-scale urbanization in China. 3 The drastic changes in the regional land ecosystem and structure caused by the urbanization process have seriously affected the sustainable use of regional land resources, and brought about a series of ecological and socio-economic problems, which could seriously restrict the regional sustainable development.4–6
China’s urban land development has been expanding rapidly as its urban population will account for more than 50% of the total population by 2030 according to the UN projection.7,8 But most research on the driving force of the regional urbanization was not mature and paid less attention to the urbanization in emerging regions.9–11 Therefore, the analysis and monitoring of urbanization in emerging areas and land use will help to understand the causes and mechanisms of dynamic changes and driving forces in the use of land by adjusting the economic activities of human society so as to achieve the purpose of sustainable use of land resource. 12 The study aims to provide sufficient evidence for the government to formulate and improve the land policy, that has been undergoing the rapid urbanization process. 13
Xixian National New Area is located in the hinterland of Guanzhong Plain which is in the middle of Shaanxi Province. With the gradual deepening of the economic system reform, Guanzhong has been developing rapidly. The degree of urbanization is becoming higher and higher, especially in the past 20 years. 14 The area’s sustainable development is therefore seriously affected because of the irrational conversion of land use in the process of urbanization.15,16 The urbanization of land was approved by the Shaanxi Province Government in 2011. The planning and construction time of the new district was for 10 years. The implementation phase was during 2010–2015 and 2016–2020 was the comprehensive development phase.
As a part of the Guanzhong area, the process of urbanization is also a microcosm of the Guanzhong area’s urbanization in the past 10 years and reflects the overall performance of the whole urbanization process in Shaanxi Province. This area is a typical urban and rural development model. 17 It was the first national new district for innovative urban development approved by The State Council and the second batch of national new urbanization comprehensive pilot development area. This study about the quantitative analysis of spatial and temporal land use changes in emerging areas would help to understand the mechanism of driving forces in urbanization.18–20
The study and monitoring of the urbanization process and land use of Xixian District could provide guidance information as the embodiment of the new land use policy and urbanization development in China. Our findings could provide a model for improvement in the exploration of new characteristic of sustainable urbanization and integration of urban and rural development structure in China.
Research areas and data sources
Overview of the study area
Xixian National New Area is the first state-level new area approved by the China’s State Council to be set up under the theme of innovation and development. The area is situated between 34.169°–34.559°N and 108.495°–108.979°E, located between the built-up areas of Xi'an city and Xianyang city. The area is 440 m above the sea level. It has an area of about 882 km2 (see Figure 1). The area is 10 km away from the city centre of Xi'an in the east and 3 km from the city centre of Xianyang in the west. The average annual temperature in this region is 13°C. The annual rainfall is about 550 mm. The rainfall is concentrated in July, August and September. The annual sunshine time is more than 2000 h. The area has a warm temperate semi-humid continental monsoon climate.
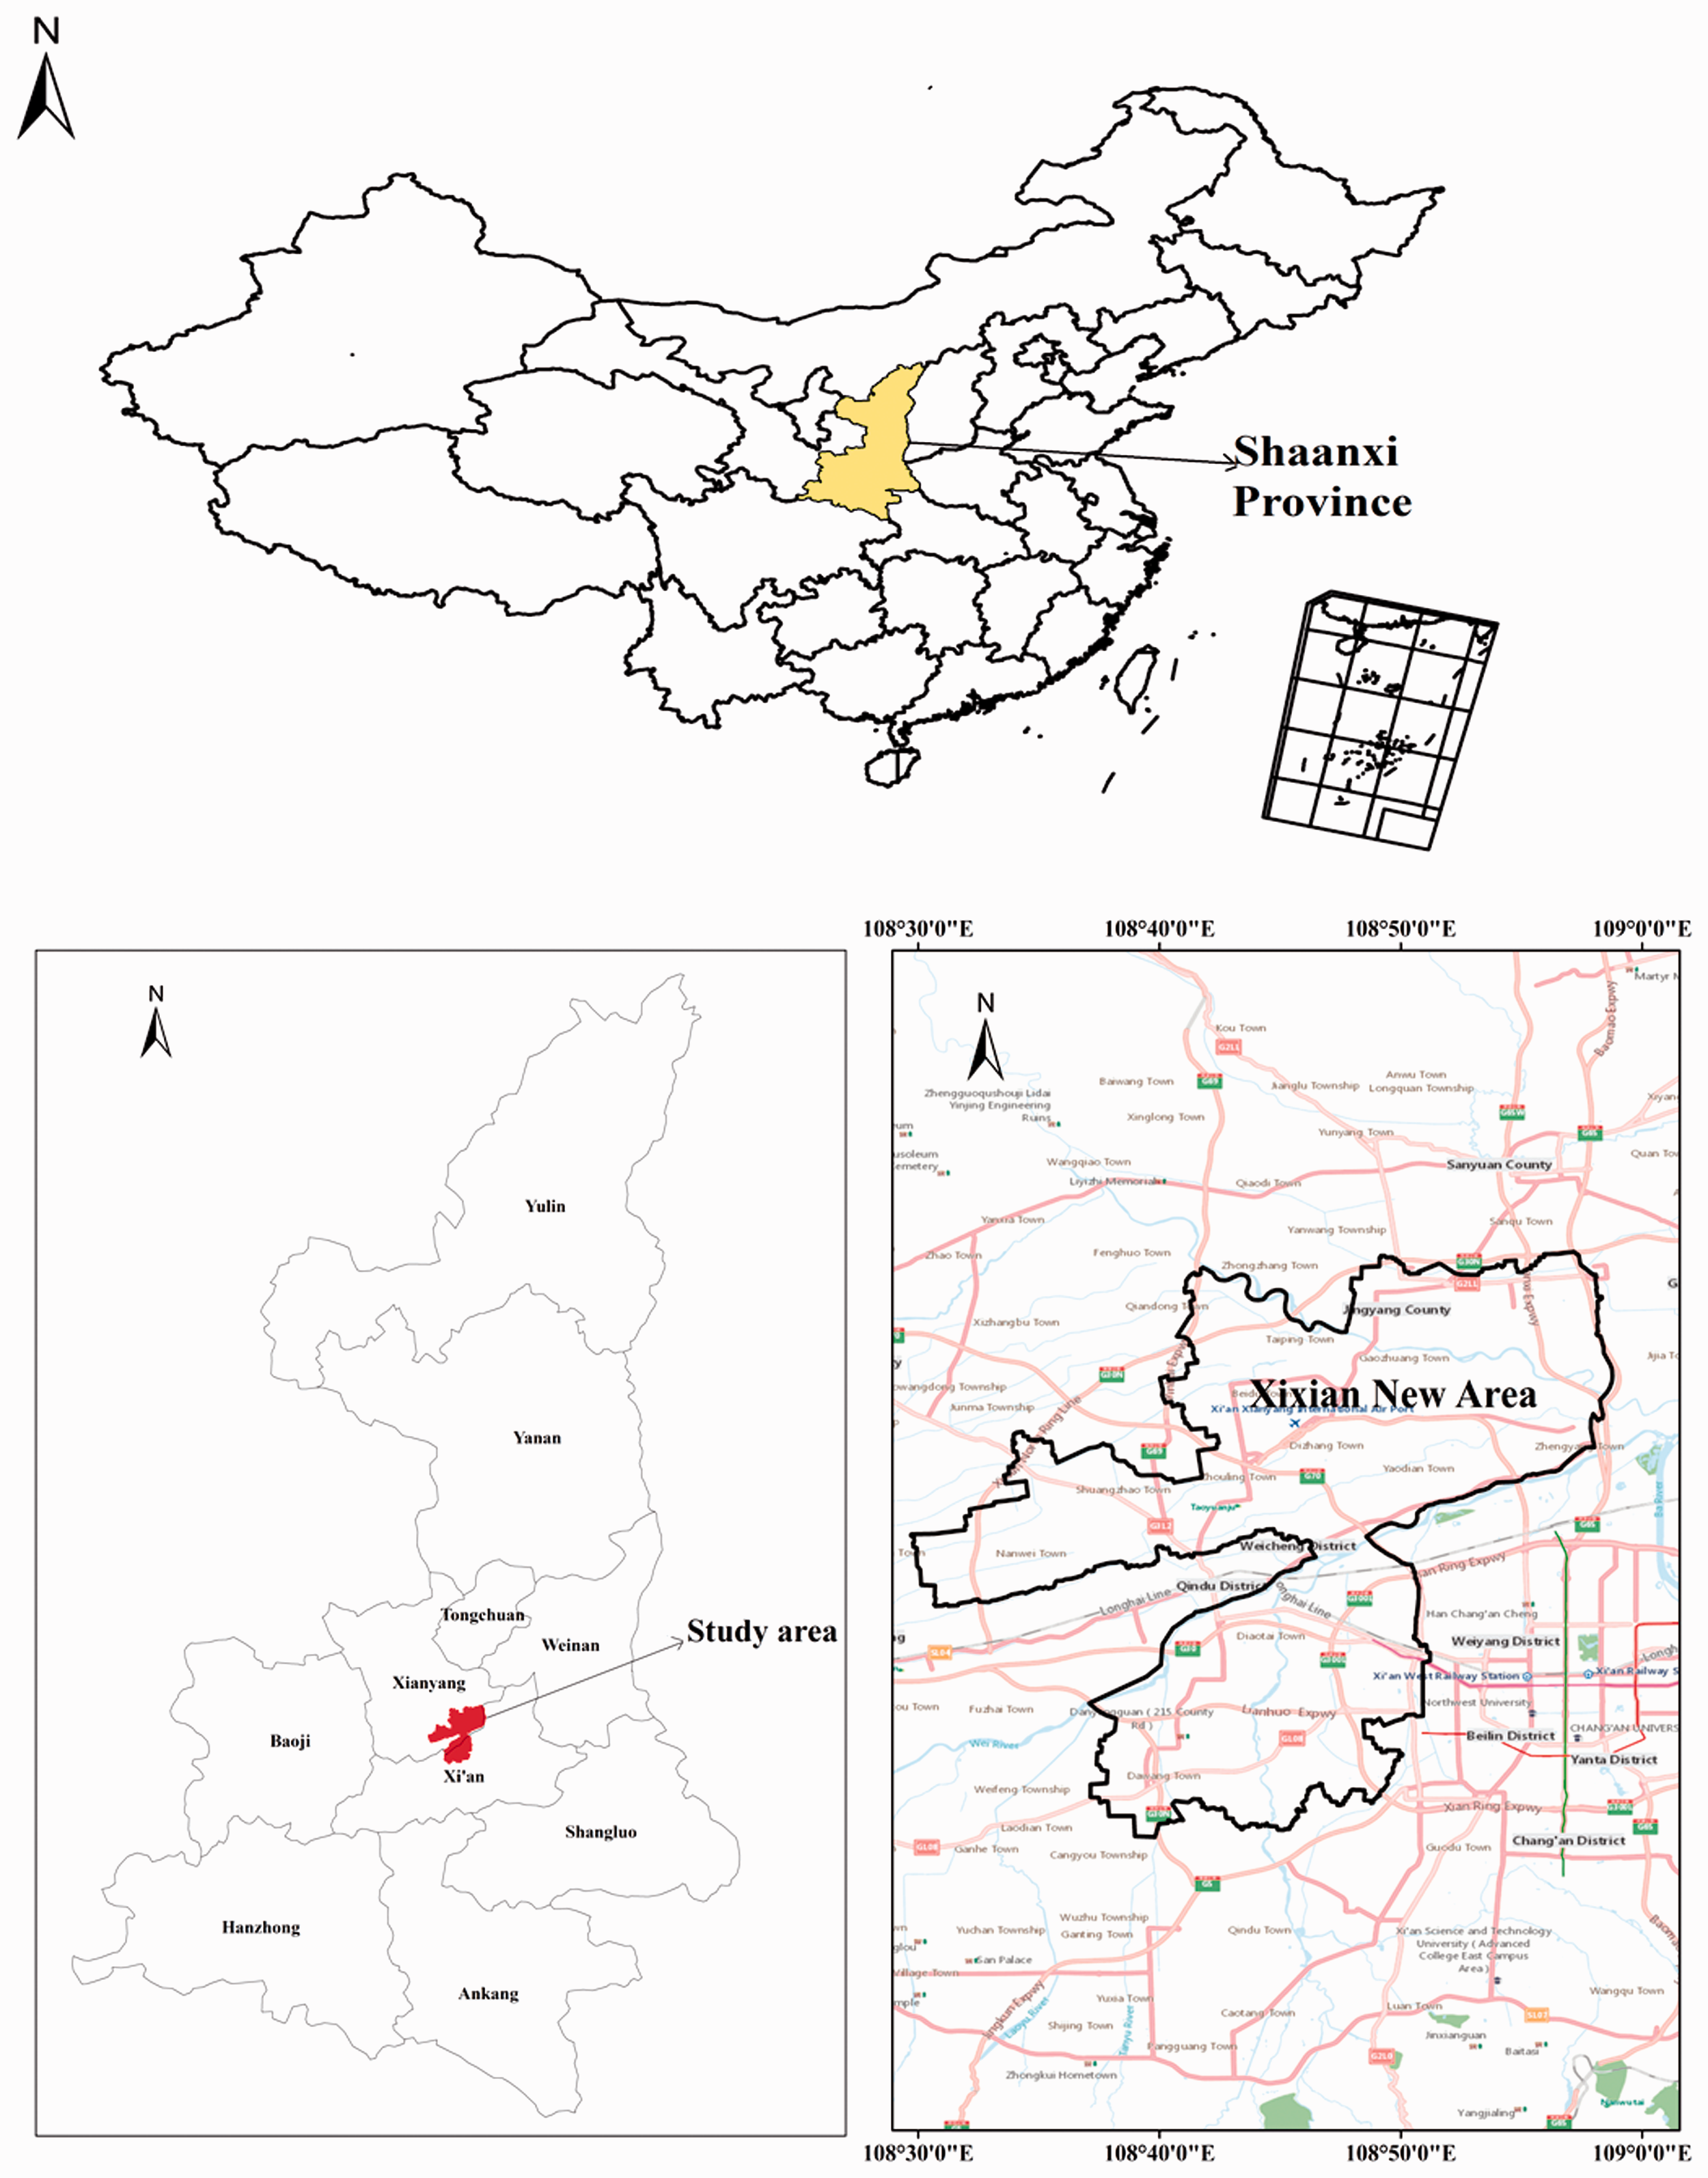
The location of study area.
Data sources
The remote sensing (RS) data of this study are from Landsat-5 and Landsat-8 satellite. Four periods in 1997, 2004, 2011 and 2016 were monitored. The data were downloaded from the geospatial data of the Chinese Academy of Sciences (http://www.gscloud.cn/) and United States Geological Survey (https://glovis.usgs.gov/), with a resolution of 30 m. Data acquisition time was from May to July. The serial number of the RS data was (12736). The map projection coordinate system was Universal Transverse Mercator. The cloud cover range of the RS data was below 3%.
Research methods
In this study, the RS images of Xixian in 1997, 2004, 2011 and 2016 were pretreated by splicing and cutting by using Envi5.1 software. Then, the RS image enhancement process was carried out. Finally, the images were classified by the maximum likelihood classification of the supervised classification that is the most common classification technique used in RS. 21 The main land use types were extracted, and the landcover mis-classification was modified according to geographical information systems (GIS) provided by Google Earth7. With the support of ArcGIS 10.3 software, the land reclassification, statistics analysis and plotting operation were carried out by interpreting the land use map of Xixian National New Area in 1997, 2004, 2011 and 2016. The land use change index model was established, and the spatial and temporal changes of land use in Xixian National New Area of Xi’an City were quantitatively studied. 22
The rate of land use change can be measured by the land use dynamic model, which can characterize the temporal change of single land use type and analyse the overall situation of regional land use and its regional differentiation as represented by equation (1).
23
Image classification and accuracy evaluation
Image classification
The maximum likelihood and visual interpretation in supervised classification were used, which are the most commonly used image classification methods in RS. Each type of statistics in each band would show normal distribution, and the calculation results as given were normalized to the maximum probability class. The classification operation was based on the known training area as a sample, and the discriminant function was established to classify each image. The training samples should be typical and representative.24,25 Then, the computer would classify the RS images according to the training samples, which is a typical interactive interpretation method.
Accuracy evaluation
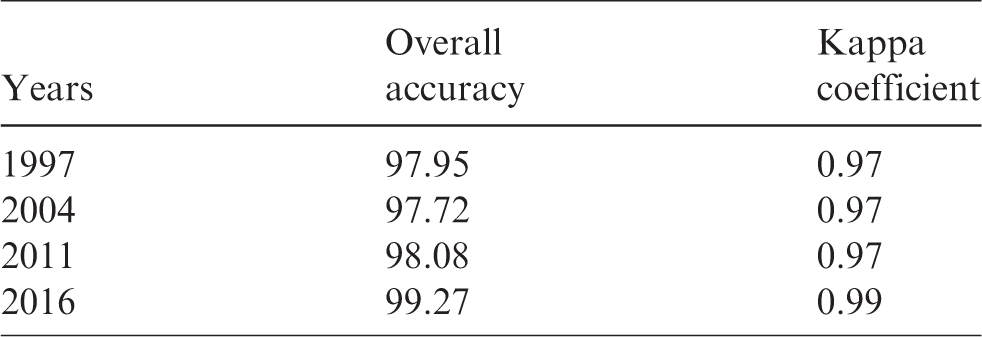
The classification results were compared with the actual data (land use map or ground survey data), and the accuracy of the land use classification was determined by the percentage of the total classification area. In the actual work, the sampling method was generally used to verify the accuracy of classification.26,27 Generally, the Kappa coefficient (K) of confusion matrix proposed by Cohen (1960) was used to evaluate the classification accuracy of the image. This method was developed as the main method to evaluate the accuracy of RS information extraction.28,29 The overall classification accuracy was used. The overall classification accuracy refers to the ratio of the number of pixels correctly classified and the total number of categories.30,31 The Kappa coefficient as defined by equation (2) was an indicator of the accuracy between images. The advantage of the Kappa coefficient is that it takes into account both the number of correctly classified pixels and the number of pixels that are not correctly classified.
32
It is generally believed that when the Kappa coefficient is greater than 0.8, the classification accuracy is very good.
In the above formula, Xii is the number of correctly sorted in row i and column i of the confusion matrix; Xi + and X + i are the sum of the total pixels of row i and column i, respectively; N is the need to verify the sample of the total number.
Results
Accuracy analysis
In this study, the overall accuracy and Kappa coefficients were used to evaluate the interpretation result of RS image. The greater the value of the two evaluation indicators, the closer the results of land use classification would be to the actual results. In general, the Kappa coefficient was greater than 0.8, which indicates that the classification accuracy is good. In Table 1, the overall accuracy is shown to be greater than 90%, so the interpretation results of RS images are good and consistent.
General interpretation of remote sensing image interpretation and Kappa coefficient in different years of Xixian National New Area.
Land use classification
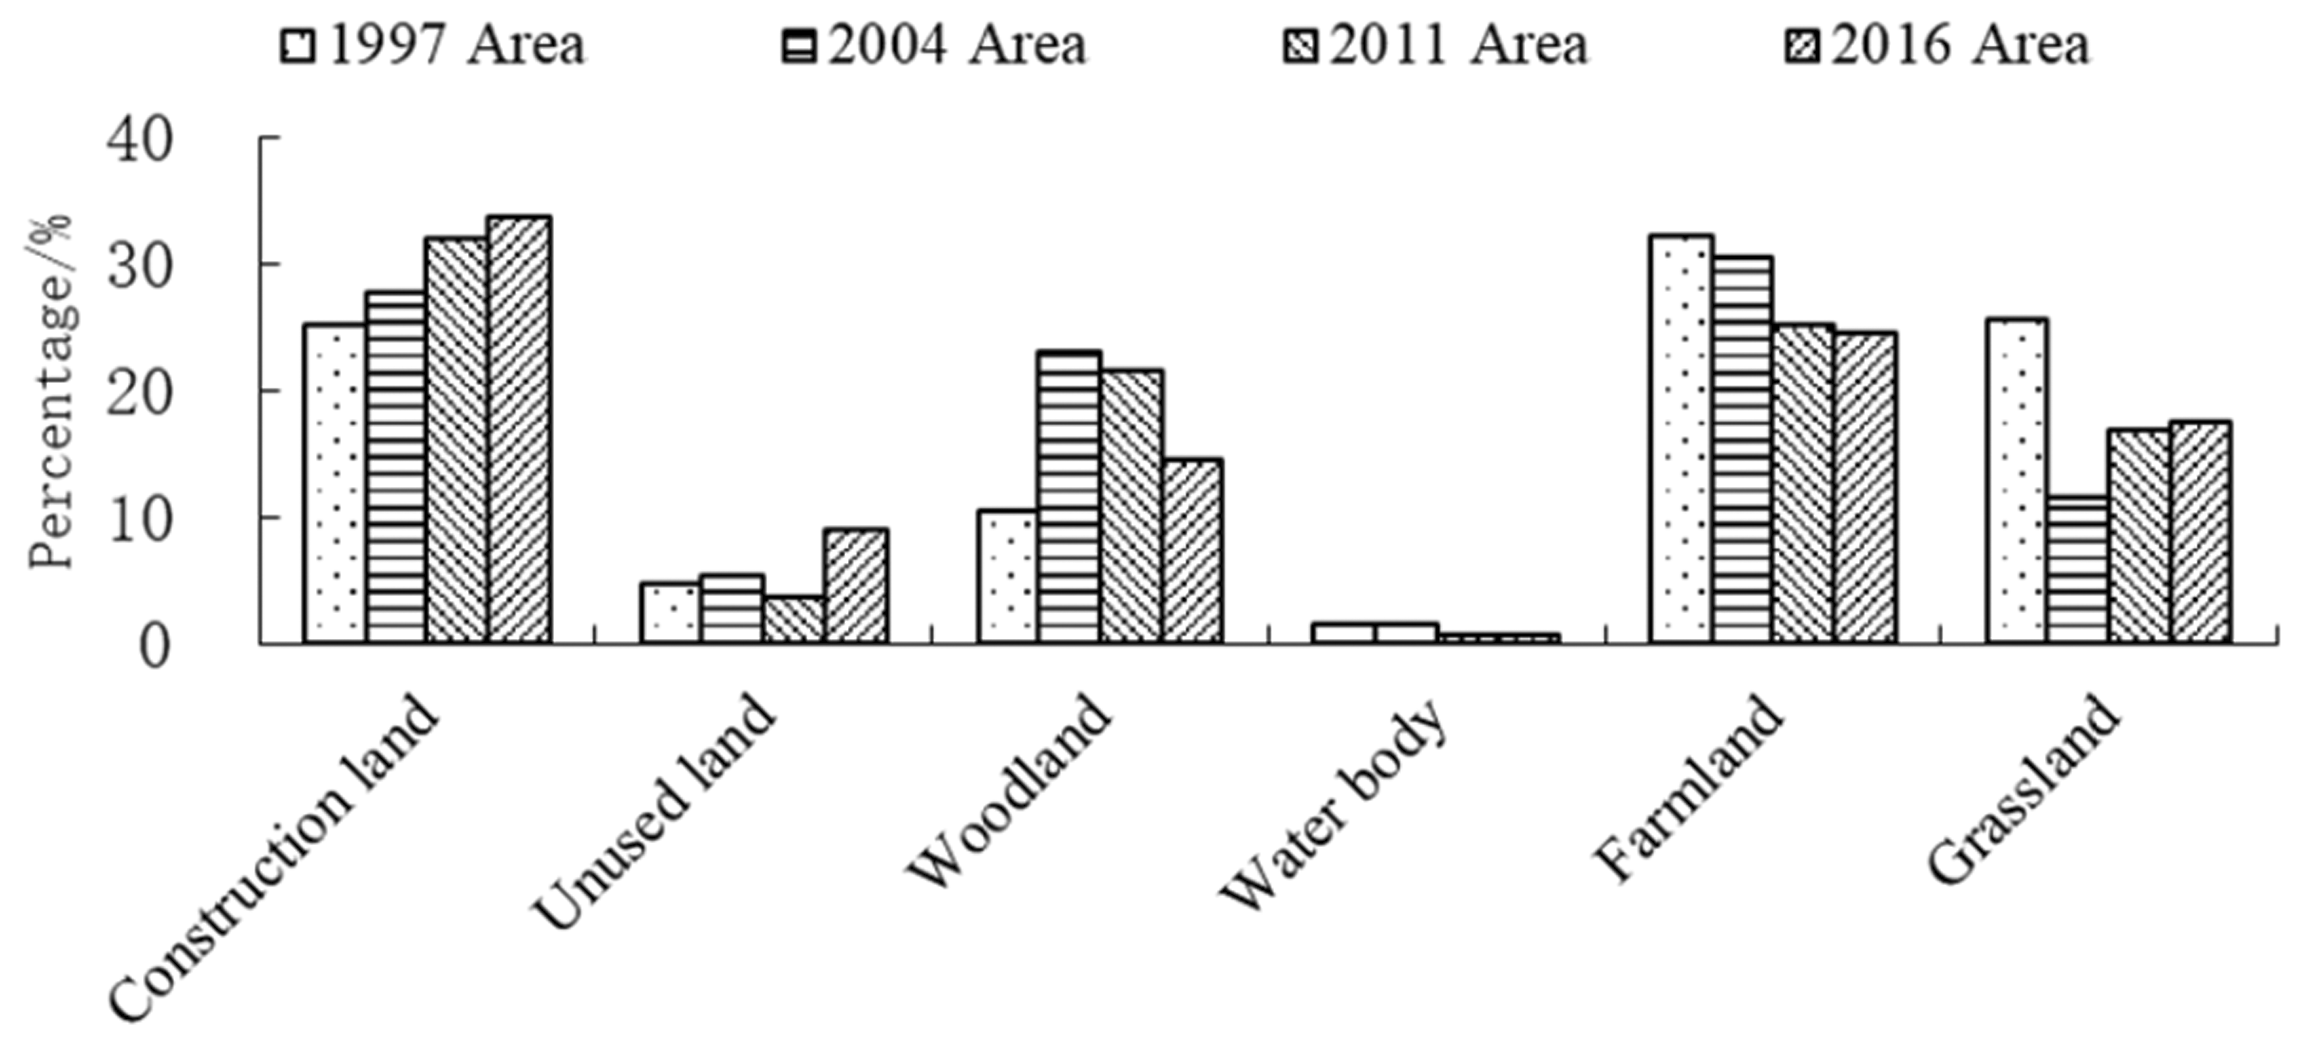
By interpreting the RS images of 1997, 2004, 2011 and 2016, it was found that the farmland was still the main land use type from 1997 to 2004 in the region. However, the construction land occupied the largest area from 2011 to 2016. Over the past 20 years, the area of water body was always the smallest in the study area. From 1997 to 2016, although there are some abnormal changes in the area of woodland and grassland, there is a significant increase in the area of construction land, unused land and woodland. During this period, the area of unused land was increased significantly, with an average annual increase of 4.79%. Then, the area of woodland and construction land was increased by about 30%. In addition, in 1997 to 2016, the water body, grassland and farmland were reduced by 52.52%, 31.73% and 23.84%, respectively (see Figures 2 and 3).
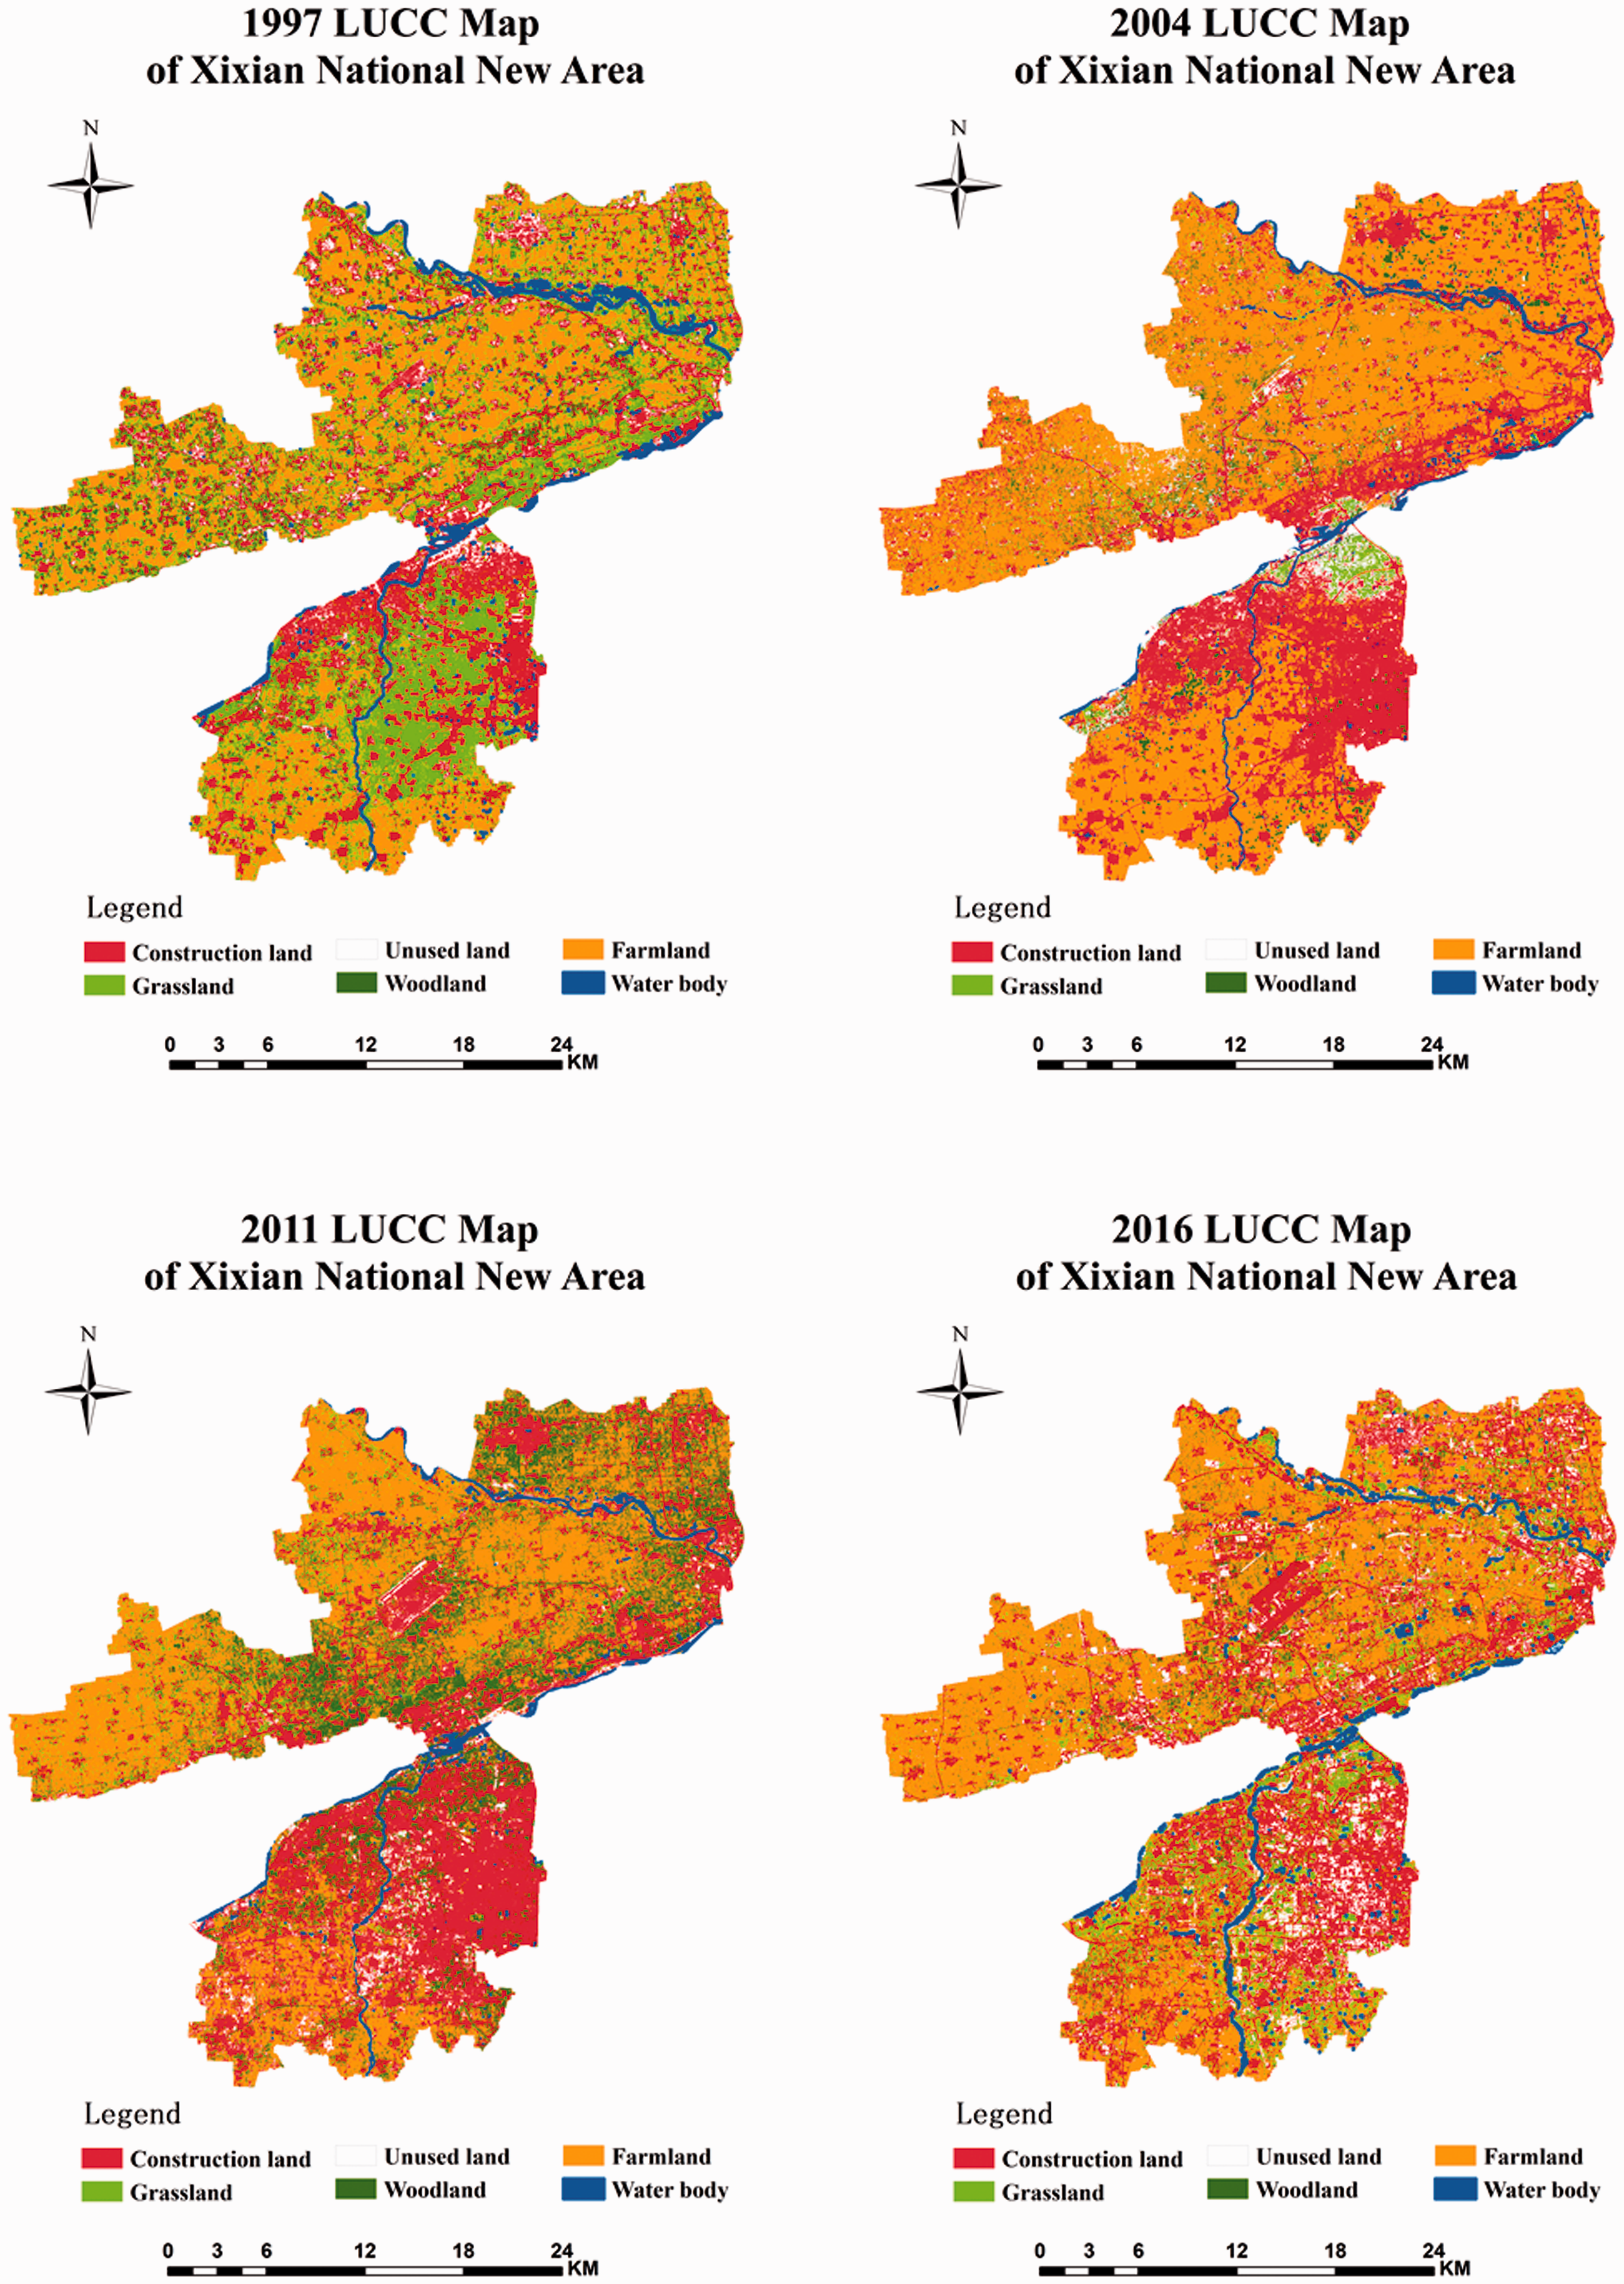
1997, 2004, 2011 and 2016 Xixian National New Area land use classification map.
Changes in land use types from 1997 to 2016 (%).
According to the classification of land use, the farmland area occupied the largest area, accounting for 32.22% of the total area in 1997, followed by grassland, with an area of about 25.66% of the total area. The water body area was the smallest, accounting for 1.56% of the total area. In 2004, farmland accounted for 30.61% of the total area, followed by construction land, accounting for 27.81% of the total area and the water body was the smallest, about 1.62%. In 2011, the area of construction land accounted for 31.98% of the total area, farmland area has been reduced, accounting for about 25.31% of the total area, there was a sustained growth of grassland area, accounting for 16.85% of the total area, water body was reduced in the largest proportion, accounting for 0.69% of the total area. In 2016, the construction land area was still the largest, accounting for 33.69% of the total area. Woodland area was reduced, accounting for 14.56% of the total area. Farm land area was also reduced, accounting for 24.54% of the total area. Unused land, grassland and water body, accounted for 8.96%, 17.52% and 0.74% of the total area, respectively.
Dynamic changes in land use
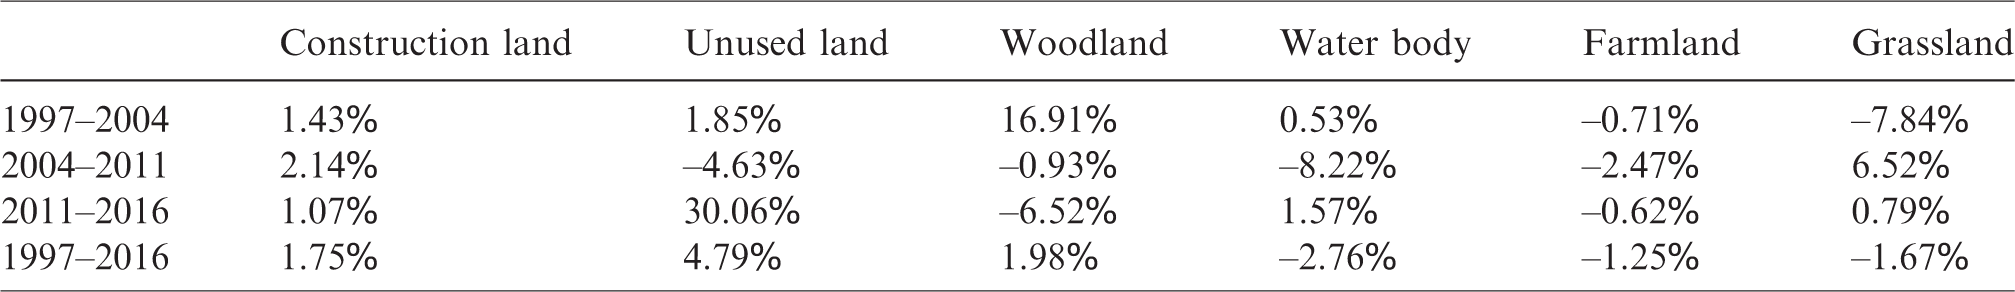
As shown in Table 2, from 1997 to 2016, the largest land use change in Xixian National New Area was unused land, and the average annual change rates of unused land were 4.79%. During 1997–2004, the area of grassland and farmland decreased rapidly, these were reduced by 54.91% and 4.99%, respectively, and the construction land and unused land were expanded rapidly, increasing by 9.98% and 12.96%, respectively. During 2004–2011 period, the areas of unused land, woodland, water body and arable land were reduced rapidly, decreasing by 32.41%, 6.53%, 57.55% and 17.30%, respectively. The construction land and grassland were expanded rapidly; these were increased by 14.99% and 45.65%, respectively. In 2011–2016, the woodland and farmland were reduced rapidly; these were reduced by 32.58% and 3.08%, respectively. The construction land, unused land, water body and grassland were expanded rapidly. Overall, in 1997–2016, there has been significant expansion in construction land, unused land and woodland. The unused land has the biggest annual growth rate of 4.79%. However, the water body, farmland and grassland had been significantly reduced in areas.
Average annual change rate in land use in Xixian National New Area from 1997 to 2016.
Discussion
In 1997, China's average urbanization rate was 31.91%, and it entered a rapid growth stage. 33 By 2016, the average urbanization rate was 57.35%. Compared with other parts of China, the development in northwest China is relatively slow. 34 Xixian National New Area’s urbanization process was relatively slow in 1997, but in 2016, it had the highest level of urbanization. From 1997 to 2016, the annual growth rate of construction land use in Xixian National New Area of Xi'an was 1.75%.
In 1997, the area of construction land accounted for 25.29% of the total area, 27.81% in 2004 and 31.98% in 2011. By 2016, the area of construction land accounted for 33.69% of the total area. Through the construction land map (Figure 4), the construction land area was increased significantly from 1997 to 2016. Xixian New District is located between the built-up areas of Xi'an and Xianyang in Shaanxi Province. It is the core area of Guanzhong–Tianshui Economic Zone with obvious advantages in location, good economic foundation, profound historical and cultural background, good natural ecological environment and accelerated development conditions and strength.
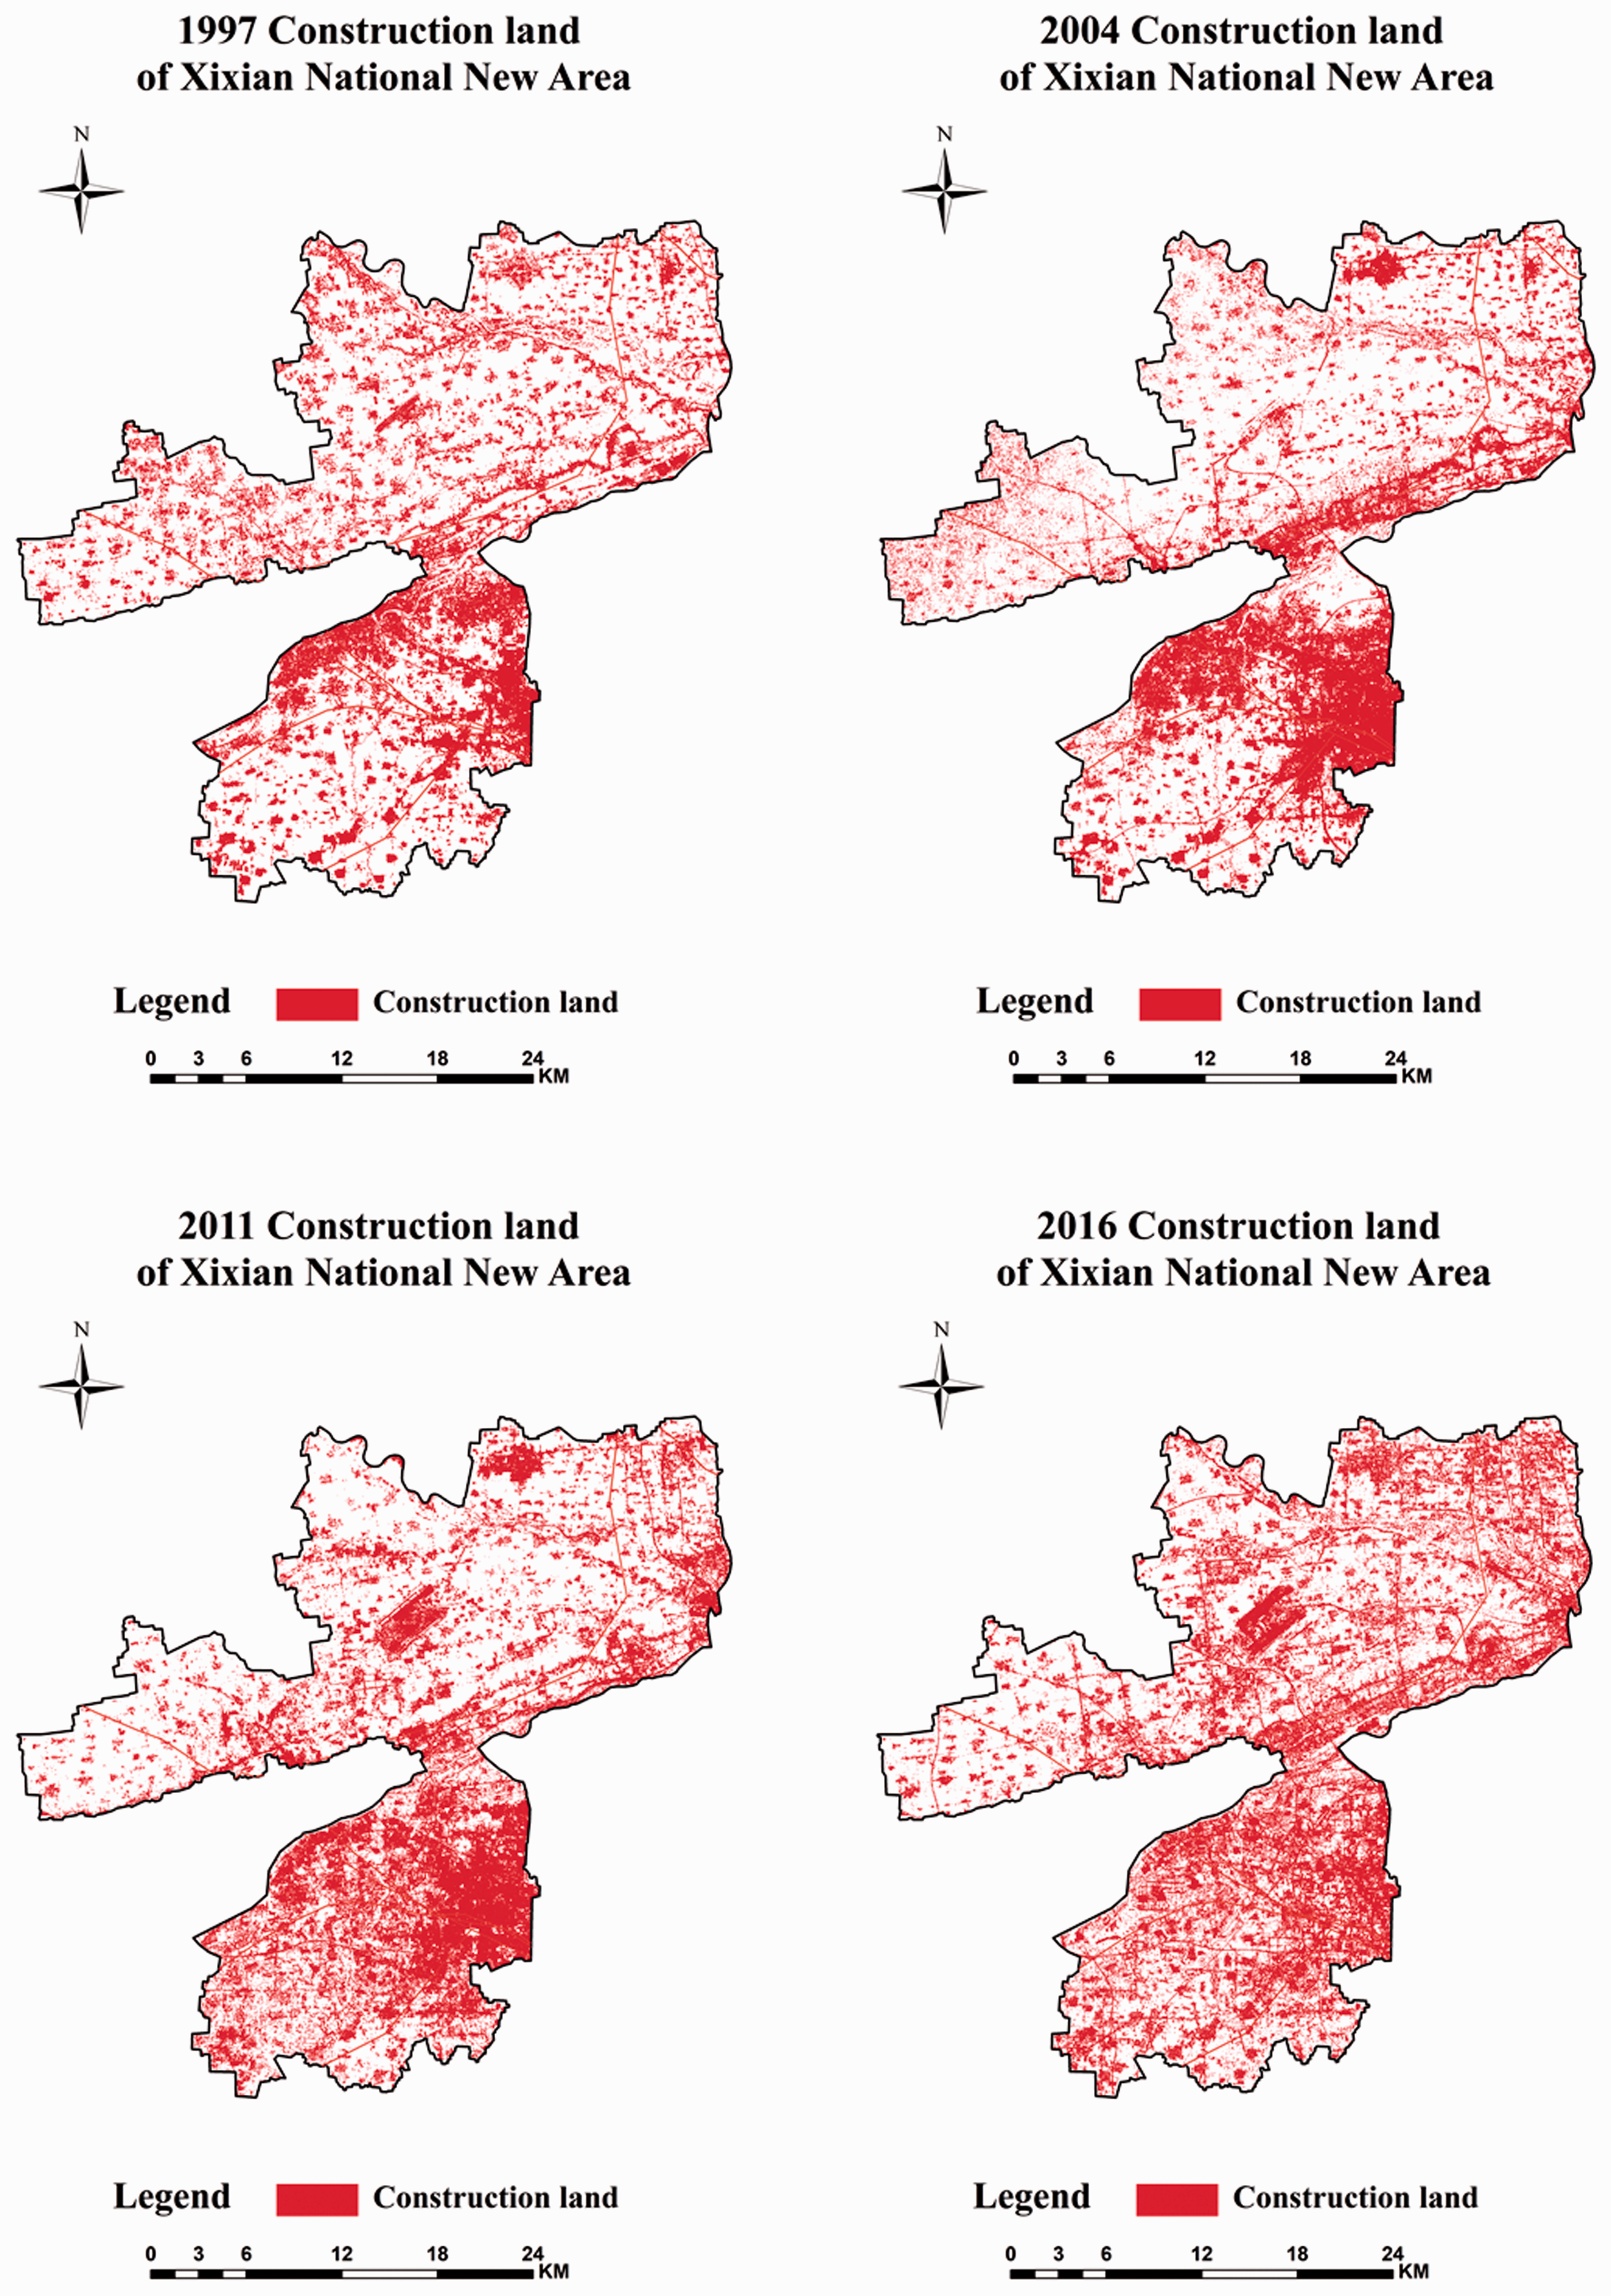
The construction land of Xixian National New Area in 1997, 2004, 2011 and 2016.
As shown in Figures 4 and 5, a large number of gathered construction land obviously appeared in the southeast area of Xixian National New Area which has the relatively flat terrain. Although the geographic location of the southeast area close to Xi’an main district is an important factor, the relatively flat terrain conditions are also necessary for its rapid urbanization. Terrain conditions have the important potential limitation to locations of urbanization by making some places inaccessible or unstable for buildings. So, it is obvious that the urbanization in the southeast area is faster than the northwest area. To clarify the relationship between terrain and urbanization, future studies should examine in multiple regions.
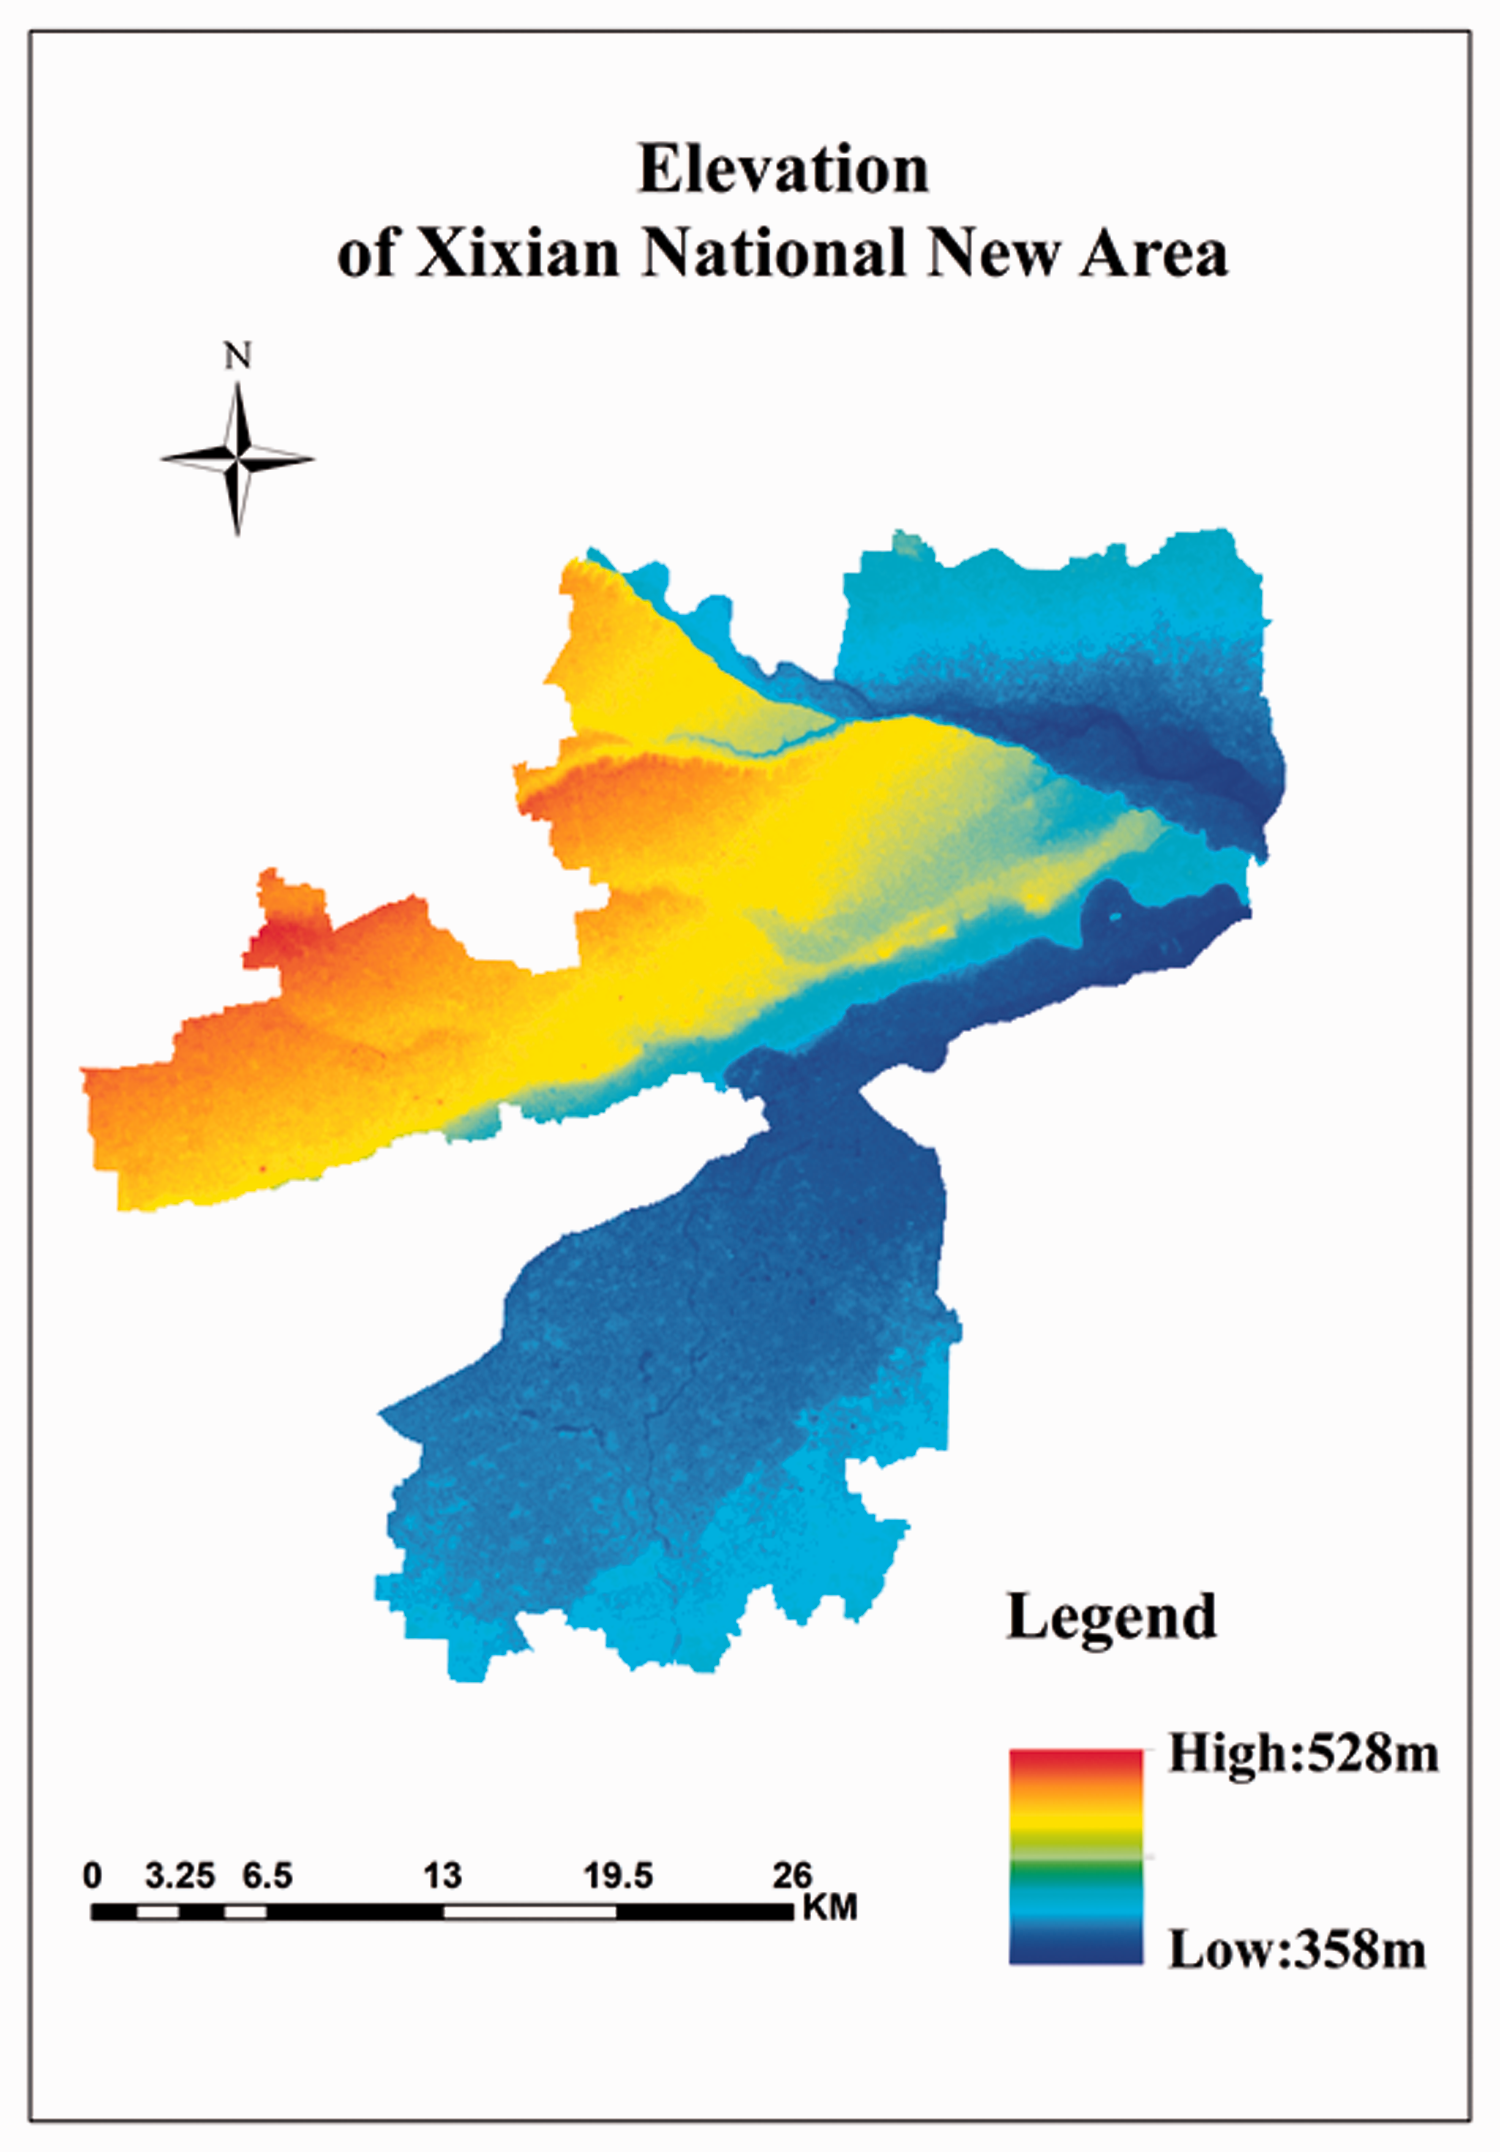
The elevation of Xixian National New Area.
The findings show that during the past years (1997–2016), the increasing trend of unused land in the Xixian National New Area was obvious, and the average annual change rate was 4.79%. Especially from 2011 to 2016, the unused land in Xixian National New Area was expanded by an average annual rate of 30.06%, which was the largest expansion in all land use types, and this was accompanied by a large reduction in woodland and farmland. The startup and implementation of Xixian National New Area was from 2010 to 2015. Therefore, a large number of other types of land were converted into unused land to prepare for the comprehensive upgrading of Xixian National New Area. These were reserved for construction land. In the early stage, the area of unused land was 4.69% and 8.96% in the later period. Since the 1990s, this part of the region was the crossing point of urban and rural areas. This was an industrial area of factories, and due to policy reasons, in the 2010–2015, all factories were transferred to places outside Xixian National New Area, at the same time, some rural construction land was also demolished for urban development, so that a large area became unused land. That is why the unused land in the region has increased significantly. Therefore, the terrain, policy and geographical location factors are the main driving forces for the change of land use and urbanization.
The changes in land use and land cover in the process of urbanization have posed an important influence on the local ecosystem and urban environment. Urbanization in the Xixian National New Area had led to two broad types of changes: localized changes in land cover and landscape structural changes. The localized changes in land cover such as the continuous reduction of farmland and water body (Figure 2) have seriously affected the biological living environment and biodiversity. It also changes the original ecosystem, but the ecological effects of urbanization are not easily determined. The landscape structural changes that mainly manifested in the increase of relative topography due to the construction land could affect the urban wind ventilation in the Xi’an main district. 35 Then the increase in construction land will enhance the intensity of the regional heat island. 36 With the development of urbanization, the temperature of the main district of Xi’an city has been increasing year by year, and this has greatly reduced the comfort of human settlements. So, the planning of Xixian National New Area’s building environment should be integrated with the Xi’an main district. 37 For example, due to the effect of terrain, the prevailing wind in Xi’an is the northeast. The main city area could affect the urban wind environment in Xixian National New Area, so the construction of the ventilation corridor is necessary. Then, the early planning of Xixian National New Area can also change the layout of the thermal circulation in accordance with the ground so as to improve the wind environment in Xi’an main district. This can improve the urban environment of the two regions and be good for the sustainable development.
Conclusions
This study analysed the dynamic changes and driving forces in the urbanization from 1997 to 2016 of Xixian New Area. The results showed that the increasing unused land during this recent period was the biggest with an annual growth rate of 4.97%. The quantitative analysis of the dynamic changes of land use in the urbanization could provide scientific reference data for the sustainable development of Xi’an city. Large reduction in farmland needs to be controlled. The impact of urbanization on rural residents’ economy and education should also be valued by the government.
The terrain, policy and geographical location factors are the main driving forces for the change of land use. The planning of Xixian National New Area’s building environment should be integrated with the Xi’an main district to improve the urban environment and the sustainable development in the two regions. The findings confirmed the applicability and effectiveness of the combined method of GIS and RS for revealing the notable spatio-temporal features in the dynamic changes in the land use and land cover changes. The future research should provide more social economic and ecological environmental quality assessment data so as to quantitatively analyse the impact of urbanization process.
Footnotes
Authors’ contribution
All authors contributed equally to this work. All authors reviewed and edited the entire content and approved the final article.
Acknowledgements
The authors would like to thank the anonymous reviewers for their constructive comments on this article. The authors appreciate Prof Chuck Yu of the International Society of the Built Environment (UK) and an Overseas Distinguished Professor of Xi’an Jiaotong University, for his review and revision of the language use in the modified paper.
Declaration of conflicting interests
The author(s) declared no potential conflicts of interest with respect to the research, authorship, and/or publication of this article.
Funding
The author(s) disclosed receipt of the following financial support for the research, authorship, and/or publication of this article: This work was funded by the Ministry of Science and Technology of the People’s Republic of China (2013FY112500).