
Abstract
The atrium is one of the most preferred design features in modern large buildings, but the thermal performance of an atrium space is a growing concern. Computational fluid dynamics (CFD) and field measurements have usually been employed to assess the complex thermal performance in an atrium. However, these conventional approaches require significant effort. This paper presents a simplified approach employing the thermal response factor method for prediction of temperature distribution in a mechanically ventilated atrium. Full scale measurements were performed in an existing atrium building over a summer period and were used for validation of a CFD simulation. As a result, the thermal response factors obtained by the simplified numerical method were applied to predict the thermal behaviours in the mechanically ventilated atrium. Moreover, airflow patterns were identified by Archimedes Number.
Introduction
Globally, the energy efficiency of buildings is a primary concern because it constitutes a large part of energy demand. Thus, significant attention has been paid to energy reduction and environmental impacts. However, reducing energy consumption is very complex and many issues should be taken into account.1–3 Many studies of building energy efficiency have employed passive design strategies. Among the latter, the atrium is an important design feature in large modern buildings from perspectives of aesthetics, daylighting and solar heating.4,5
An atrium is generally a large enclosed space connected to a building with at least one transparent façade and of considerable height. 4 Currently, the atrium has become a trend in the architectural design of commercial buildings, where natural light penetrates into the central space of buildings to create a central point of trade and social activities.6–10 In addition, an atrium provides natural ventilation from its upper openings that remove heat. 11 The design of an atrium has various parameters which create unique and complex interrelationships with each other. 12 A properly designed atrium can utilise the natural environment for energy saving, whereas a poor atrium design can cause uncomfortable thermal environments and require additional heating and cooling loads for thermal comfort.4,13–16
Heat transfer through glazed roof and walls can cause thermal stratification within the atrium space, which is very difficult to control.15,17–20 Due to aesthetic reasons, the negative effect of solar penetration through glazed building envelopes has been often neglected in atrium spaces. 21 In order to improve the thermal condition within atrium spaces, a number of studies have been conducted which consider design parameters, including geometric factors, solar radiation and natural convection. Daylight performances in atrium buildings have been investigated by measurements and simulations.8,9,22–24 In addition, numerical and experimental studies have been carried out for analyses of complex airflows within atrium spaces.18,19,25–29
Generally, a numerical analysis such as computational fluid dynamics (CFD) simulation and field measurements have been applied to predict temperature and velocity fields inside atriums.17,19,28,30 Similar approaches have been utilised for the investigation of thermal stratification within atrium spaces, but it is still difficult to apply CFD simulation for the analysis of building energy consumption because the numerical model has a focus on aero-thermal behaviours.31–33 Moreover, building energy simulation cannot fully predict the heat distributions in the atrium space because the heat from mechanical systems is difficult to mix perfectly within the relatively high ceiling height of an atrium space.17,34 Taking into account the above limitations of both simulations, many attempts have been made to study thermal performance in buildings with a coupled approach of building energy simulation and CFD simulation. Although significant development has made with CFD methods, a CFD analysis is still complex and requires considerable knowledge of computational conditions when applied to building investigations.12,35–38 In order to more efficiently estimate the temperature distribution in indoor spaces using CFD simulation, Hiyama et al. 39 proposed a method that calculates the heat response in a static flow field, which can be integrated as a factor into energy simulations targeting a building with a high ceiling.
This paper aims to predict temperature distributions in a mechanically ventilated atrium building using the thermal response factor method. For this purpose, monitoring of the air temperature of indoor and outdoor locations and solar radiation were performed for a summer period of six days for an atrium building located in Incheon, South Korea. The results obtained from the measurements were also utilised for validation of numerical methods. After that, the thermal response factor method was applied to the mechanically ventilated atrium. Moreover, the airflow patterns by the CFD analysis are identified by Archimedes Number.
Full-scale measurements
Building description
The atrium building was located in Incheon, South Korea and comprised of two four-storey office buildings joined by an enclosed linear atrium, as shown in Figure 1. The total floor area and the building area were about 5548 m2 and 1937 m2, respectively. The southwest-facing atrium had a floor area of 257.4 m2 with a 25 m height. A staircase and an elevator were located on the perimeter of the atrium. The atrium was the main entrance to the building, providing a view of adjacent offices and forming a common area for people. The roof surface of the atrium was covered with building-integrated photovoltaic panels and the south façade has double glazing in a steel frame, providing daylight.

The atrium building and experimental setup. (a) Atrium building and the interior view, (b) Experimental setup in a plan and section.
Experimental setup
The full scale experimental tests were conducted for six days from 27 August to 1 September 2014 at the above atrium. During the period, indoor air temperature and solar radiation were measured. In order to determine direct radiation effects, the average radiation intensity of the outer surfaces of the roof were measured hourly from 08:00 to 18:00 h with a TES 1333R Solar Power Meter (TES Electrical Electronic Corp., Taiwan) which had a 400–1100 nm wavelength range. The accuracy of the sensor was ± 5% hourly radiation totals with a resolution of 0.1 W/m2. Within the atrium space, temperatures were measured by thermocouples (T-type) with an accuracy less than ±0.1°C. Thermocouples were connected to a datalogger which recorded at intervals of 10 minutes. The thermocouples were placed at 17 vertical locations along a central line inside the atrium space. A schematic of the atrium indicating the locations of the thermocouples and the inside of the atrium with equipment are shown in Figure 1(b). During measurement, all air-conditioning units were turned off. For the outdoor condition, the averaged outdoor air temperatures in Incheon collected at Korea Meteorological Administration from 2005 to 2014 were used.
Solar radiation and air temperatures throughout measurements
Figure 2 presents the solar radiation on the outer surface of the atrium and outdoor/indoor temperatures during six days of measurements. The average outdoor temperature was 24.6°C and the highest solar radiation on the outer surface was observed on August 30, which was about 860 W/m2. For 27–28 August, all openings in the atrium remained closed in order to observe the heat gain through solar penetration. The openings, including windows and the entrance door in the atrium, were opened from August 29 to September 1 to allow heat escape through the openings. With these conditions, Figure 2 shows that indoor temperatures at 1.5 m were increased with the increase of the solar radiation. In addition, a similar trend is shown between the indoor air temperature at 1.5 m and the outdoor air temperature. The indoor air temperature at 23 m was relatively high because the thermocouple was very close to the roof glass. On 30 August, the indoor air temperature at 23 m was relatively low when the highest solar radiation was observed, possibly due to heat escape through the upper openings.
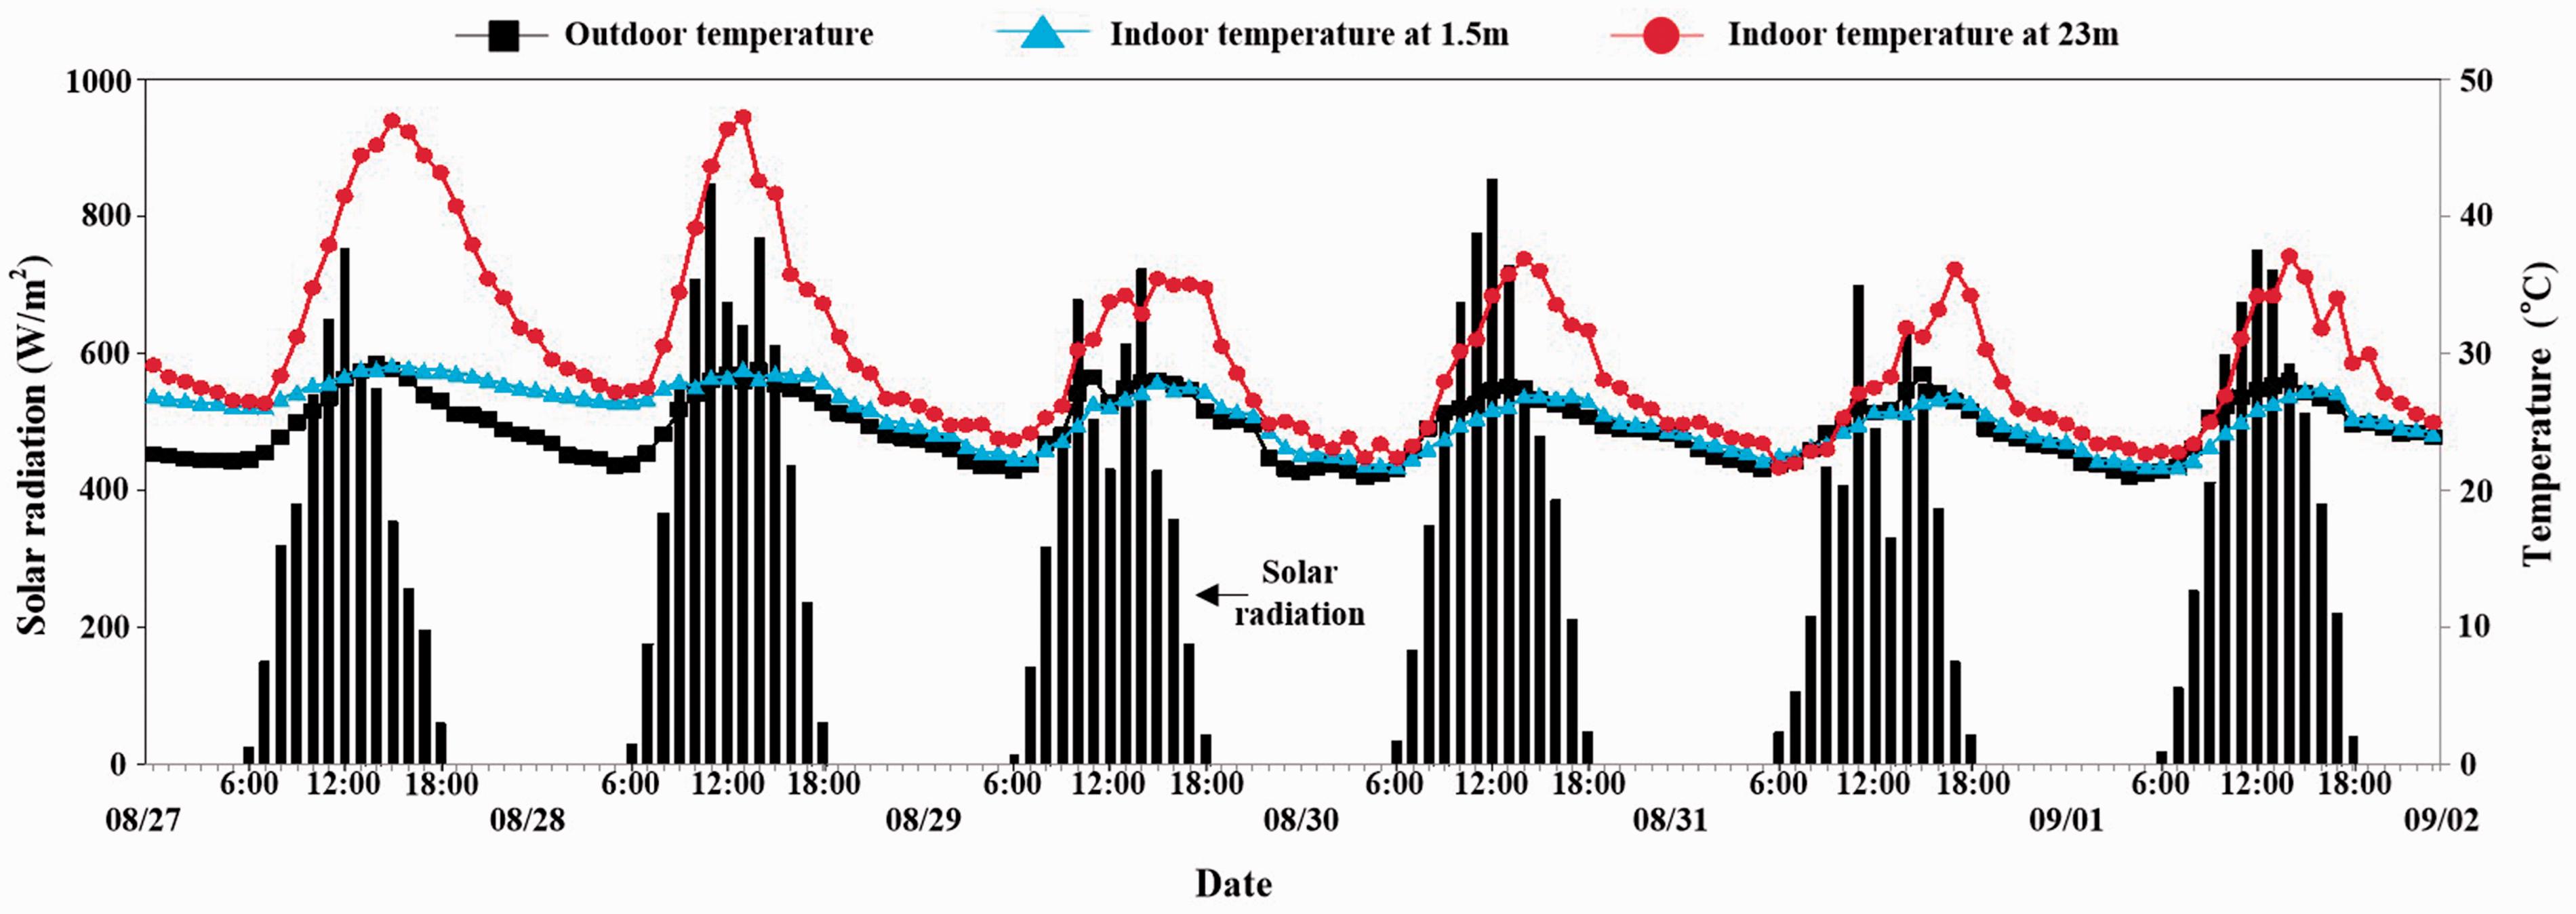
Outdoor/indoor air temperatures and solar radiation.
CFD simulation: computational model, domain, grid and solution parameters
Computational model and domain
For the computational model, the atrium with two neighbouring office buildings was constructed explicitly, as well as adjacent buildings near the atrium building. Based on the atrium building height H, upstream and downstream domain length, and the height of the computational domain was set for CFD simulations with the prevailing wind direction on 30 August 2014, as recommended by COST. 40 In addition, the upstream and downstream lengths were set to about 5H from building surroundings and the computational domain height was 400 m as shown in Figure 3.
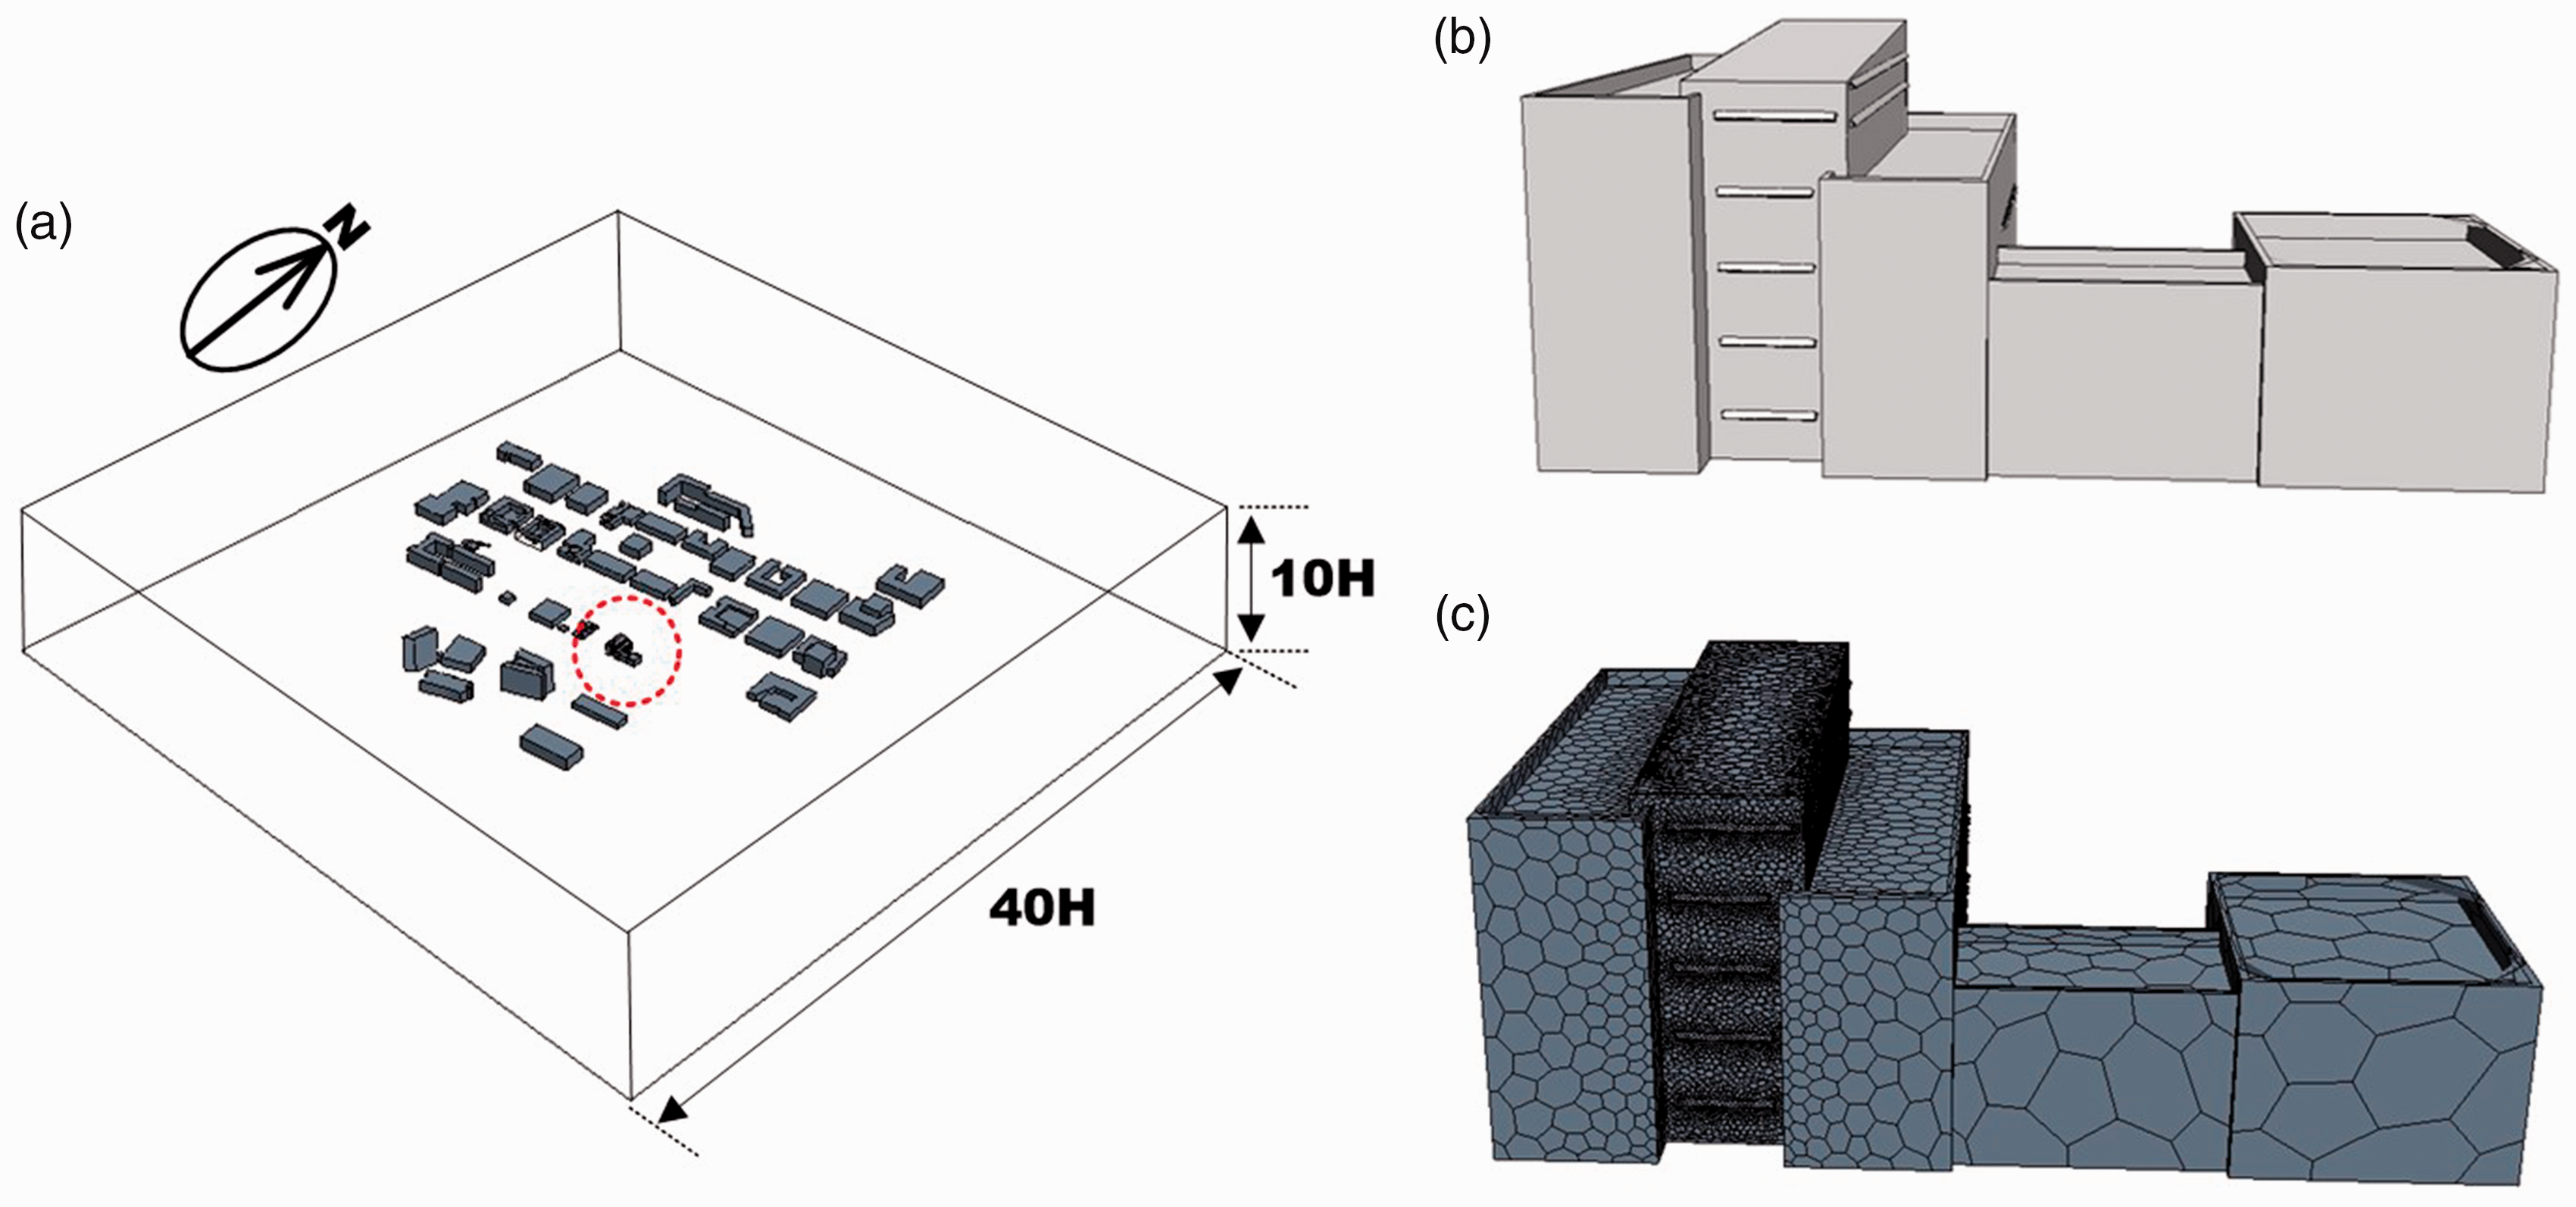
Computational conditions including a domain and grids. (a) Computational domain, (b) Computational construction of the atrium building, (c) Mesh generation.
Computational grids
Special care must be taken in constructing high-quality grids. 41 As in Figure 3(c), polyhedral cells were employed, and 1,586,400 cells for the whole computational domain were created based on the grid-convergence analysis. In this domain, 417,633 cells were created for the targeted atrium building. For the analysis, two additional grids were constructed, which were a coarser grid with 1,158,100 cells and a finer grid with 2,252,700 cells. 42 Simulations were performed with these grids for the prevailing south-west wind direction. With the comparison of measurement data of temperature distribution, the differences between the coarse grid and the basic grid were significant, whereas the differences between the basic and the finer grids were small. Therefore, a reference grid was chosen for the study due to a consideration of computational costs.
Turbulence model
Numerical studies for atrium buildings were performed with the Reynolds Averaged Navier–Stokes (RANS) models showing successful validation results between the simulation and measurement data. Most studies have employed the RNG k-ε model because the performance of the RNG k-ε model is better than that of the Standard k-ε model for more complex flow and room ventilation modelling.13,28,43,44 While the RNG k-ε model can provide a greater accuracy, the Standard k-ε model was employed for the present study since it is still used in the vast majority of CFD simulations and is reliable for prediction of wind flows in and around buildings.41,45
Boundary conditions
The present study focuses on the internal airflow within the atrium space resulting from interaction between the outdoor and indoor environments. Thus, CFD simulation was performed with the average outdoor conditions in Incheon in South Korea. For the inlet, the wind profile with an exponent (α = 0.28) was employed by using a power law. In addition, we assumed that the atrium space was naturally ventilated by heat gains caused by the solar radiation through glazing façades in the atrium building, while other walls of offices in the atrium were assumed to be adiabatic. Other internal heat sources such as people and equipment were not considered. Also, standard wall functions 41 were applied for boundary surroundings of the building.
Other computational parameters
The CFD simulations were performed using the commercial CFD code STAR-CCM+ v10 and 3D steady RANS equations. 46 Pressure-velocity coupling was allowed for by the SIMPLE algorithm. Pressure interpolation was second order. Second-order discretisation schemes were used for both convection terms and viscous terms of governing equations. In order to deal with the buoyancy effect, the Boussinesq approach was adopted. The iterations were terminated when scaled residuals did not show any further reduction with increasing number of iterations. The convergence of the CFD simulation was assumed to be obtained when the minimum residual values were at a minimum of 10−4 for x-, y- and z-velocity, k, ε and continuity. 47
A comparison of CFD model with measurements
The CFD results for the atrium space were compared with measurements of 30 August where all openings in the atrium were open. Figure 4 shows the mean velocity magnitude and the air temperature distribution across a vertical plane located 18 m from the entrance and horizontal planes of 3 m, 8 m, 13 m and 17 m from the ground floor, which represent the centre of each floor. An airflow caused by the buoyancy effect is shown. In the case of air temperature, vertical and horizontal thermal stratification is also seen although temperatures near openings are affected by the airflow. At the ceiling, the air temperature is cooled due to the airflow through the upper opening.
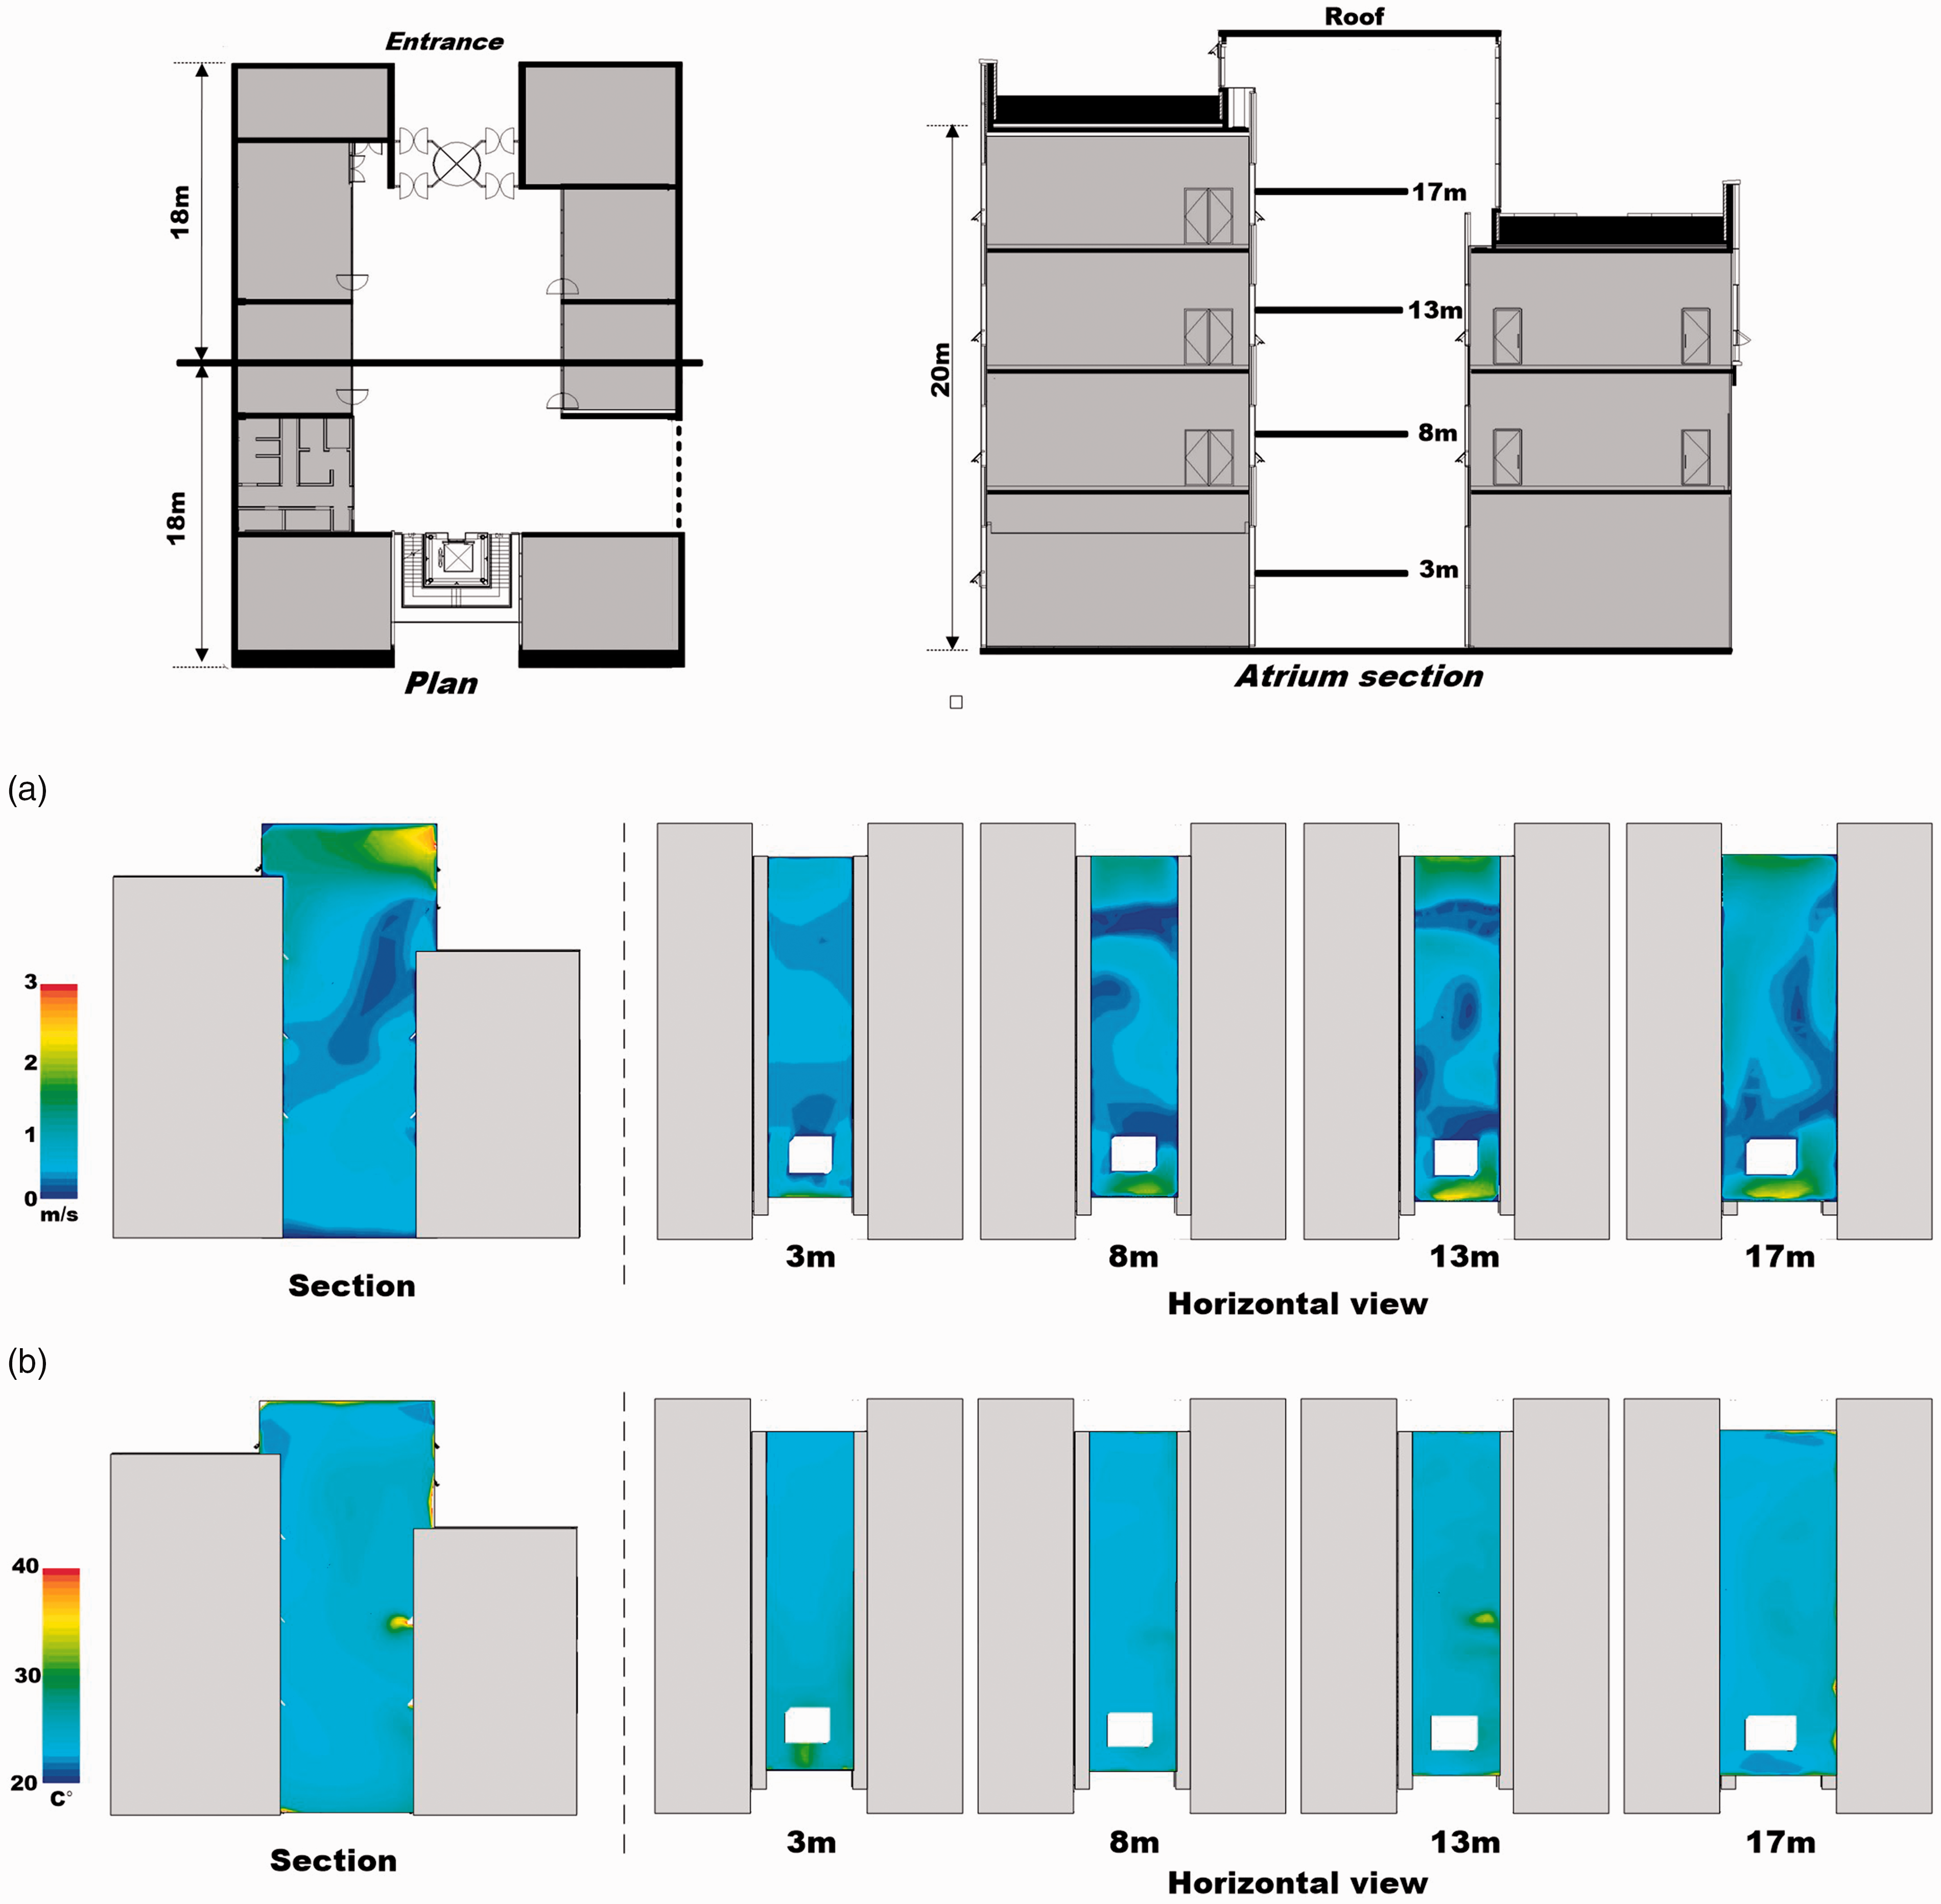
CFD results of air temperature and velocity distributions in the section and four horizontal planes. (a) Mean velocity magnitude, (b) Air temperature distribution.
For model validation, the average air temperature along a vertical line in the atrium space is shown in Figure 5. The measurements showed a rise in the air temperature inside the atrium from 27°C (the ground) to 32°C (15 m) and the highest temperature occurred at 13 m. From 15 m to the roof, the air temperature was cooled due to airflow from openings at the upper area of the atrium. In the CFD analysis, the air temperature was 34°C at 15 m, which was the highest temperature. Note that there are some discrepancies especially at the middle and top regions, where CFD overestimated temperature. This may be due to the airflow through the upper opening, which was interrupted by two buildings connected to the atrium. Overall, the prediction obtained by CFD simulation was generally in agreement with measurements.
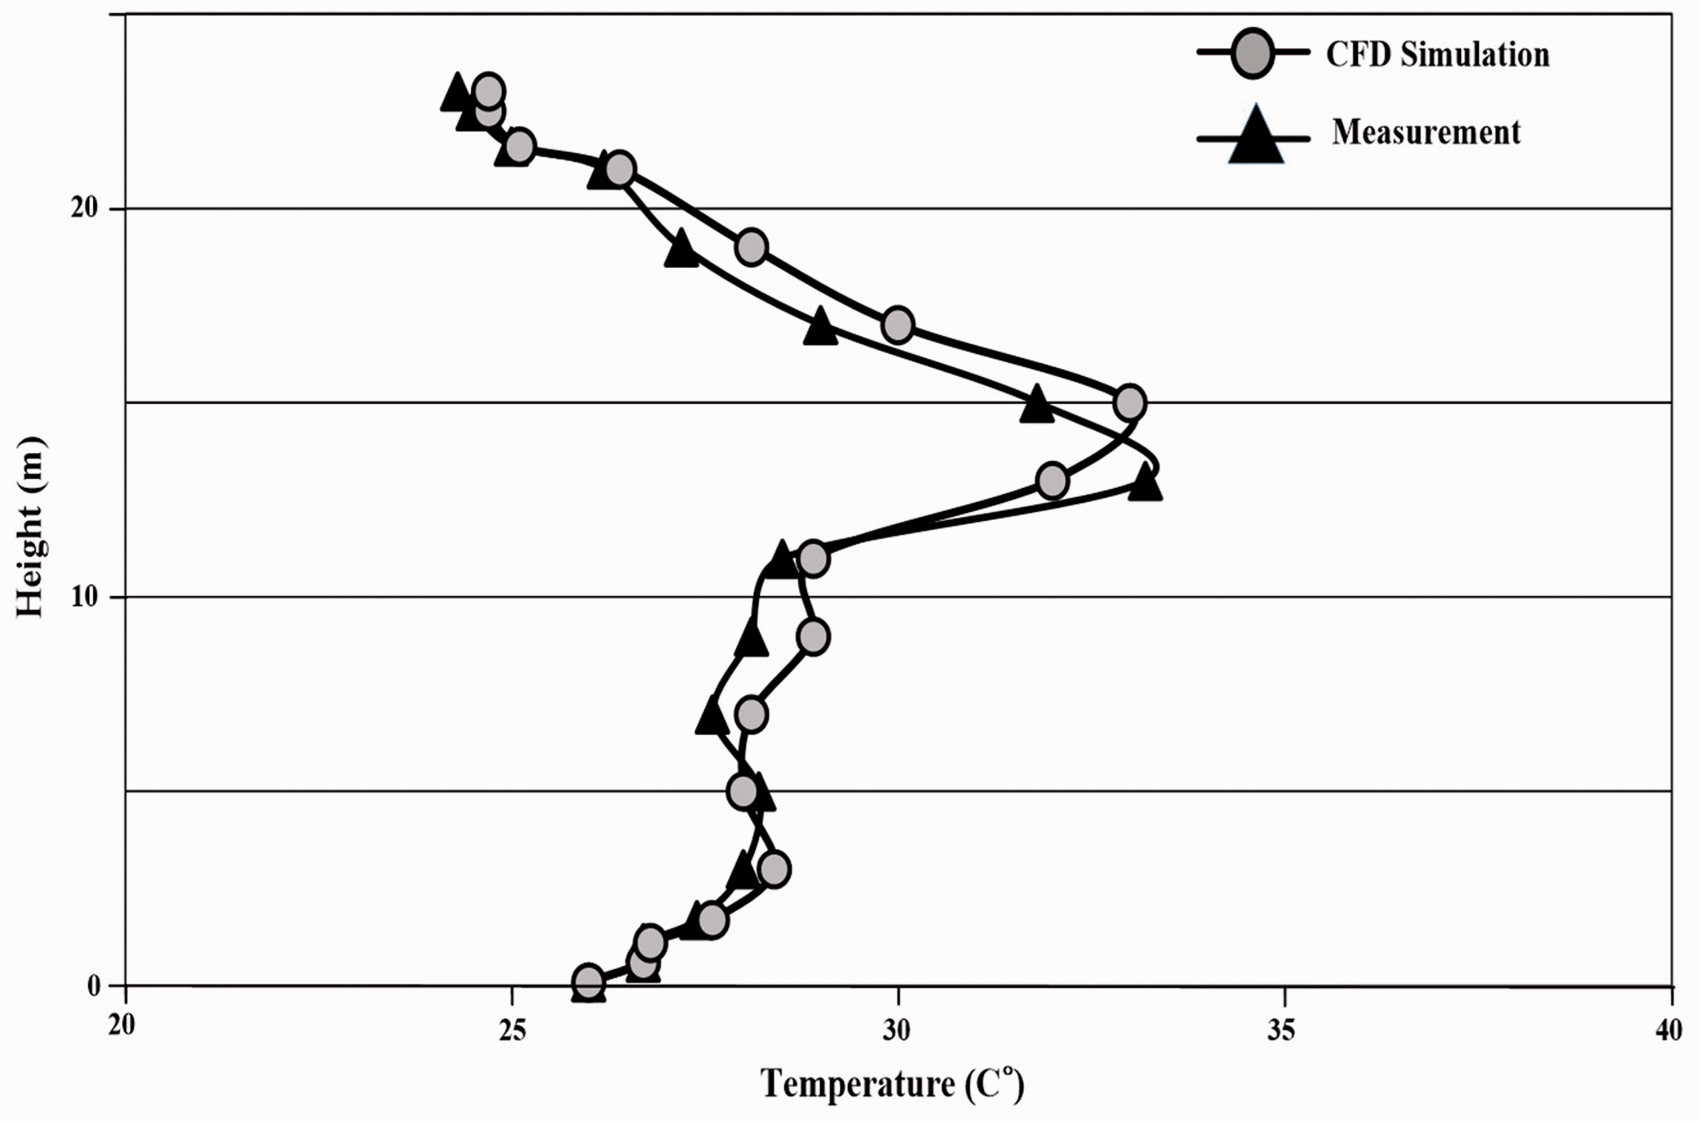
Validation result of the vertical air temperature profile from CFD and from measurement.
Prediction of temperature distributions in the mechanically ventilated atrium space using the thermal response factor method
As presented above, the air temperature and velocity distribution in the naturally ventilated atrium were investigated by full scale measurement and CFD analysis. In this section, the heat transport within the atrium was calculated using the thermal response factor method, where mechanical control for cooling was applied. For this calculation, the heat transmitted through the walls and roof glazing was applied for the heat generation. Moreover, the airflow patterns of the flow fields were identified by Archimedes Number.
Outline of the thermal response factor method
According to studies reported by Hiyama and Kato
34
and Hiyama, Kato and Ishida,
39
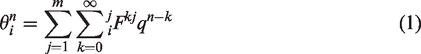
the thermal response factor method calculates the heat flux response from the unit pulse by each heat source within a room. With an assumption that the advection and diffusion equations for the rise in temperature are linear in a static flow field, the basic equation of the thermal response factor method is as shown by equation (1)
34
A simple 3D CFD model for the thermal response factor method
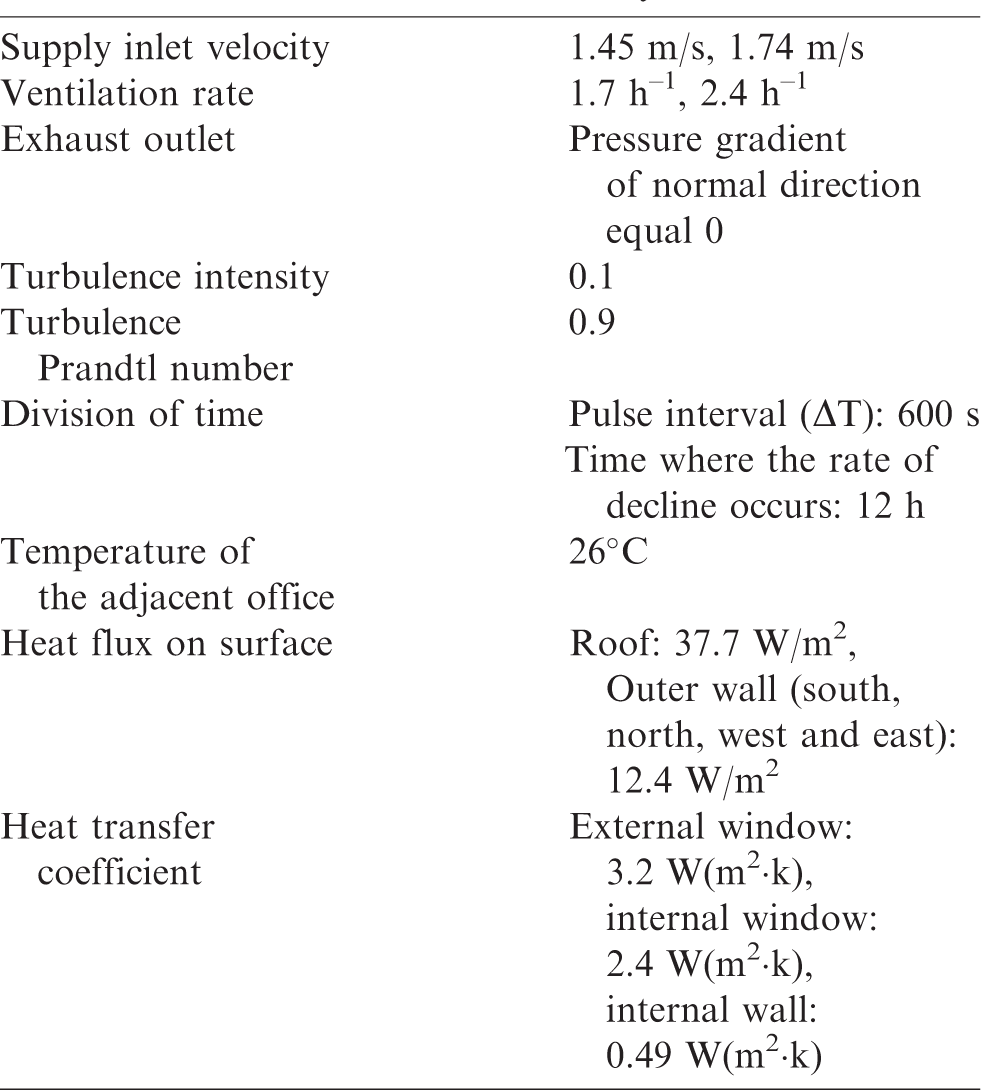
In order to obtain the thermal response factor, a 3-dimensional (3D) CFD simulation was used. For the analysis, the atrium space was simplified and modelled with dimensions of 36 m × 10 m and a height of 36 m. The roof and the south and north facades of the atrium were covered with glazing. In addition, the east and west walls from the top to 5 m were fitted with glazing and the rest of these walls were adjoined to offices (Figure 6). For the air-conditioning equipment, five supply inlets and five exhaust outlets were located on both east and west walls at a height of 3 m and 34.8 m from the floor, respectively. Each opening area was 0.1 m2 (length: 0.5 m and width: 0.2 m). To estimate airflow patterns, two air velocities of 1.45 m/s and 1.74 m/s were set for supply inlets and ventilation rates for these air velocities were 1.7 h−1 and 2.4 h−1, respectively.
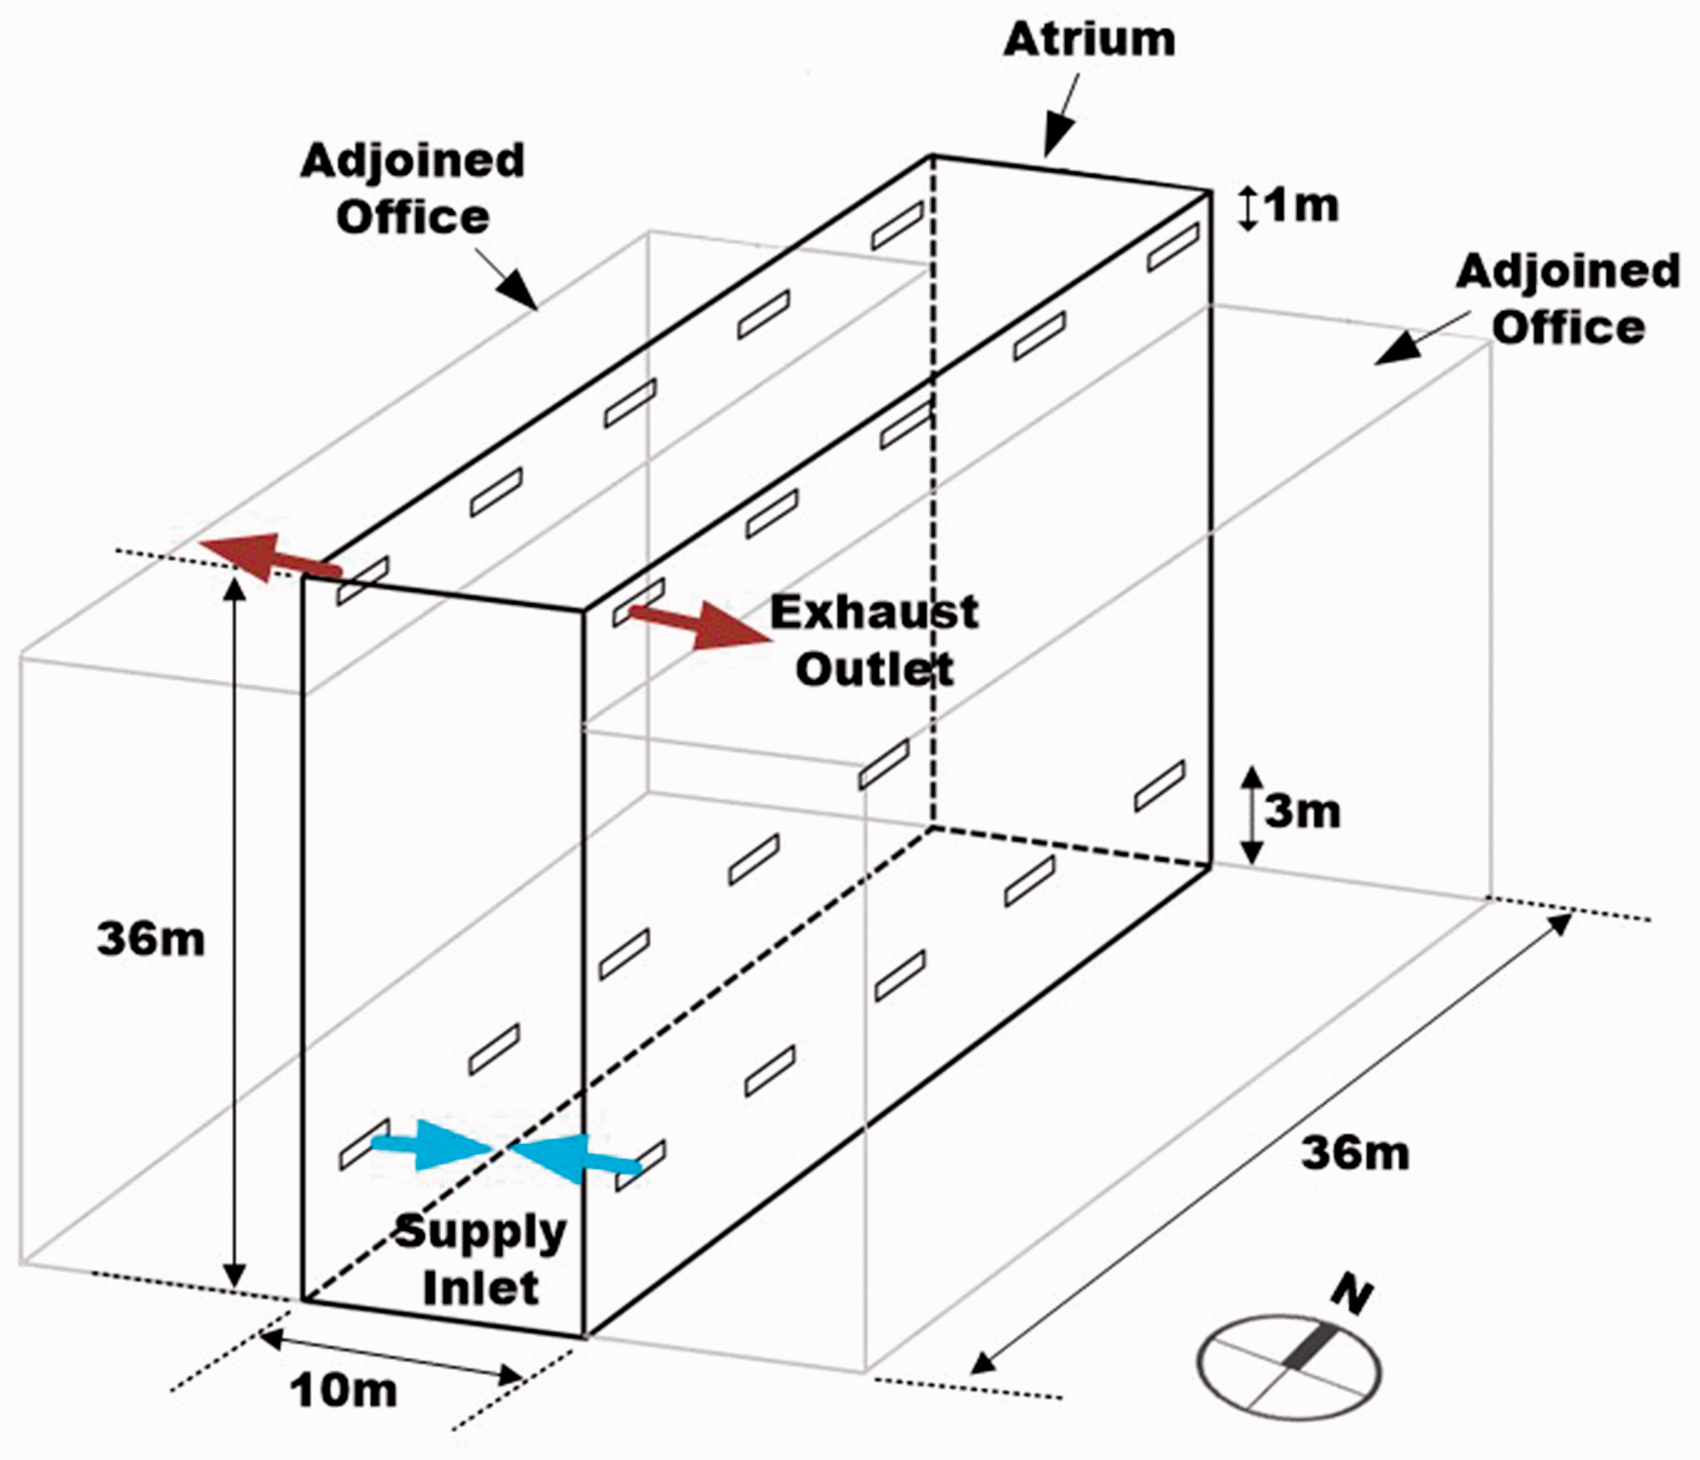
Geometry of the atrium and the position of inlet and outlet openings.
The heat loads were made up of solar radiation transmitted through the roof and wall glazing by using equation (2)

For the CFD analysis, 72,000 computational grids were created. Because of the occurrence of the heat transport from the reference temperature, non-steady-state calculation was conducted with the standard k-ɛ model. 34 The reference temperature inside the atrium was set to 26°C. The detailed conditions are presented in Table 1.
Parameters of the CFD analysis.
CFD results of the air temperature and airflow distribution within the atrium space
We have two cases of study with air-conditioning ventilation rates of 1.7 h−1 and 2.4 h−1. Figures 7 and 8 show the air temperature and airflow distribution along the vertical plane at 9 m from the south wall (Figure 7(b)). In Figure 8, the better temperature distribution across the vertical plane with a ventilation rate of 2.4 h−1 is shown compared to that at 1.7 h−1. For the velocity field, both cases show that the airflow went down from the inlet at the lower part of the atrium. However, the upper part of the atrium showed a divergent airflow since it was little influenced by the forced convection system.
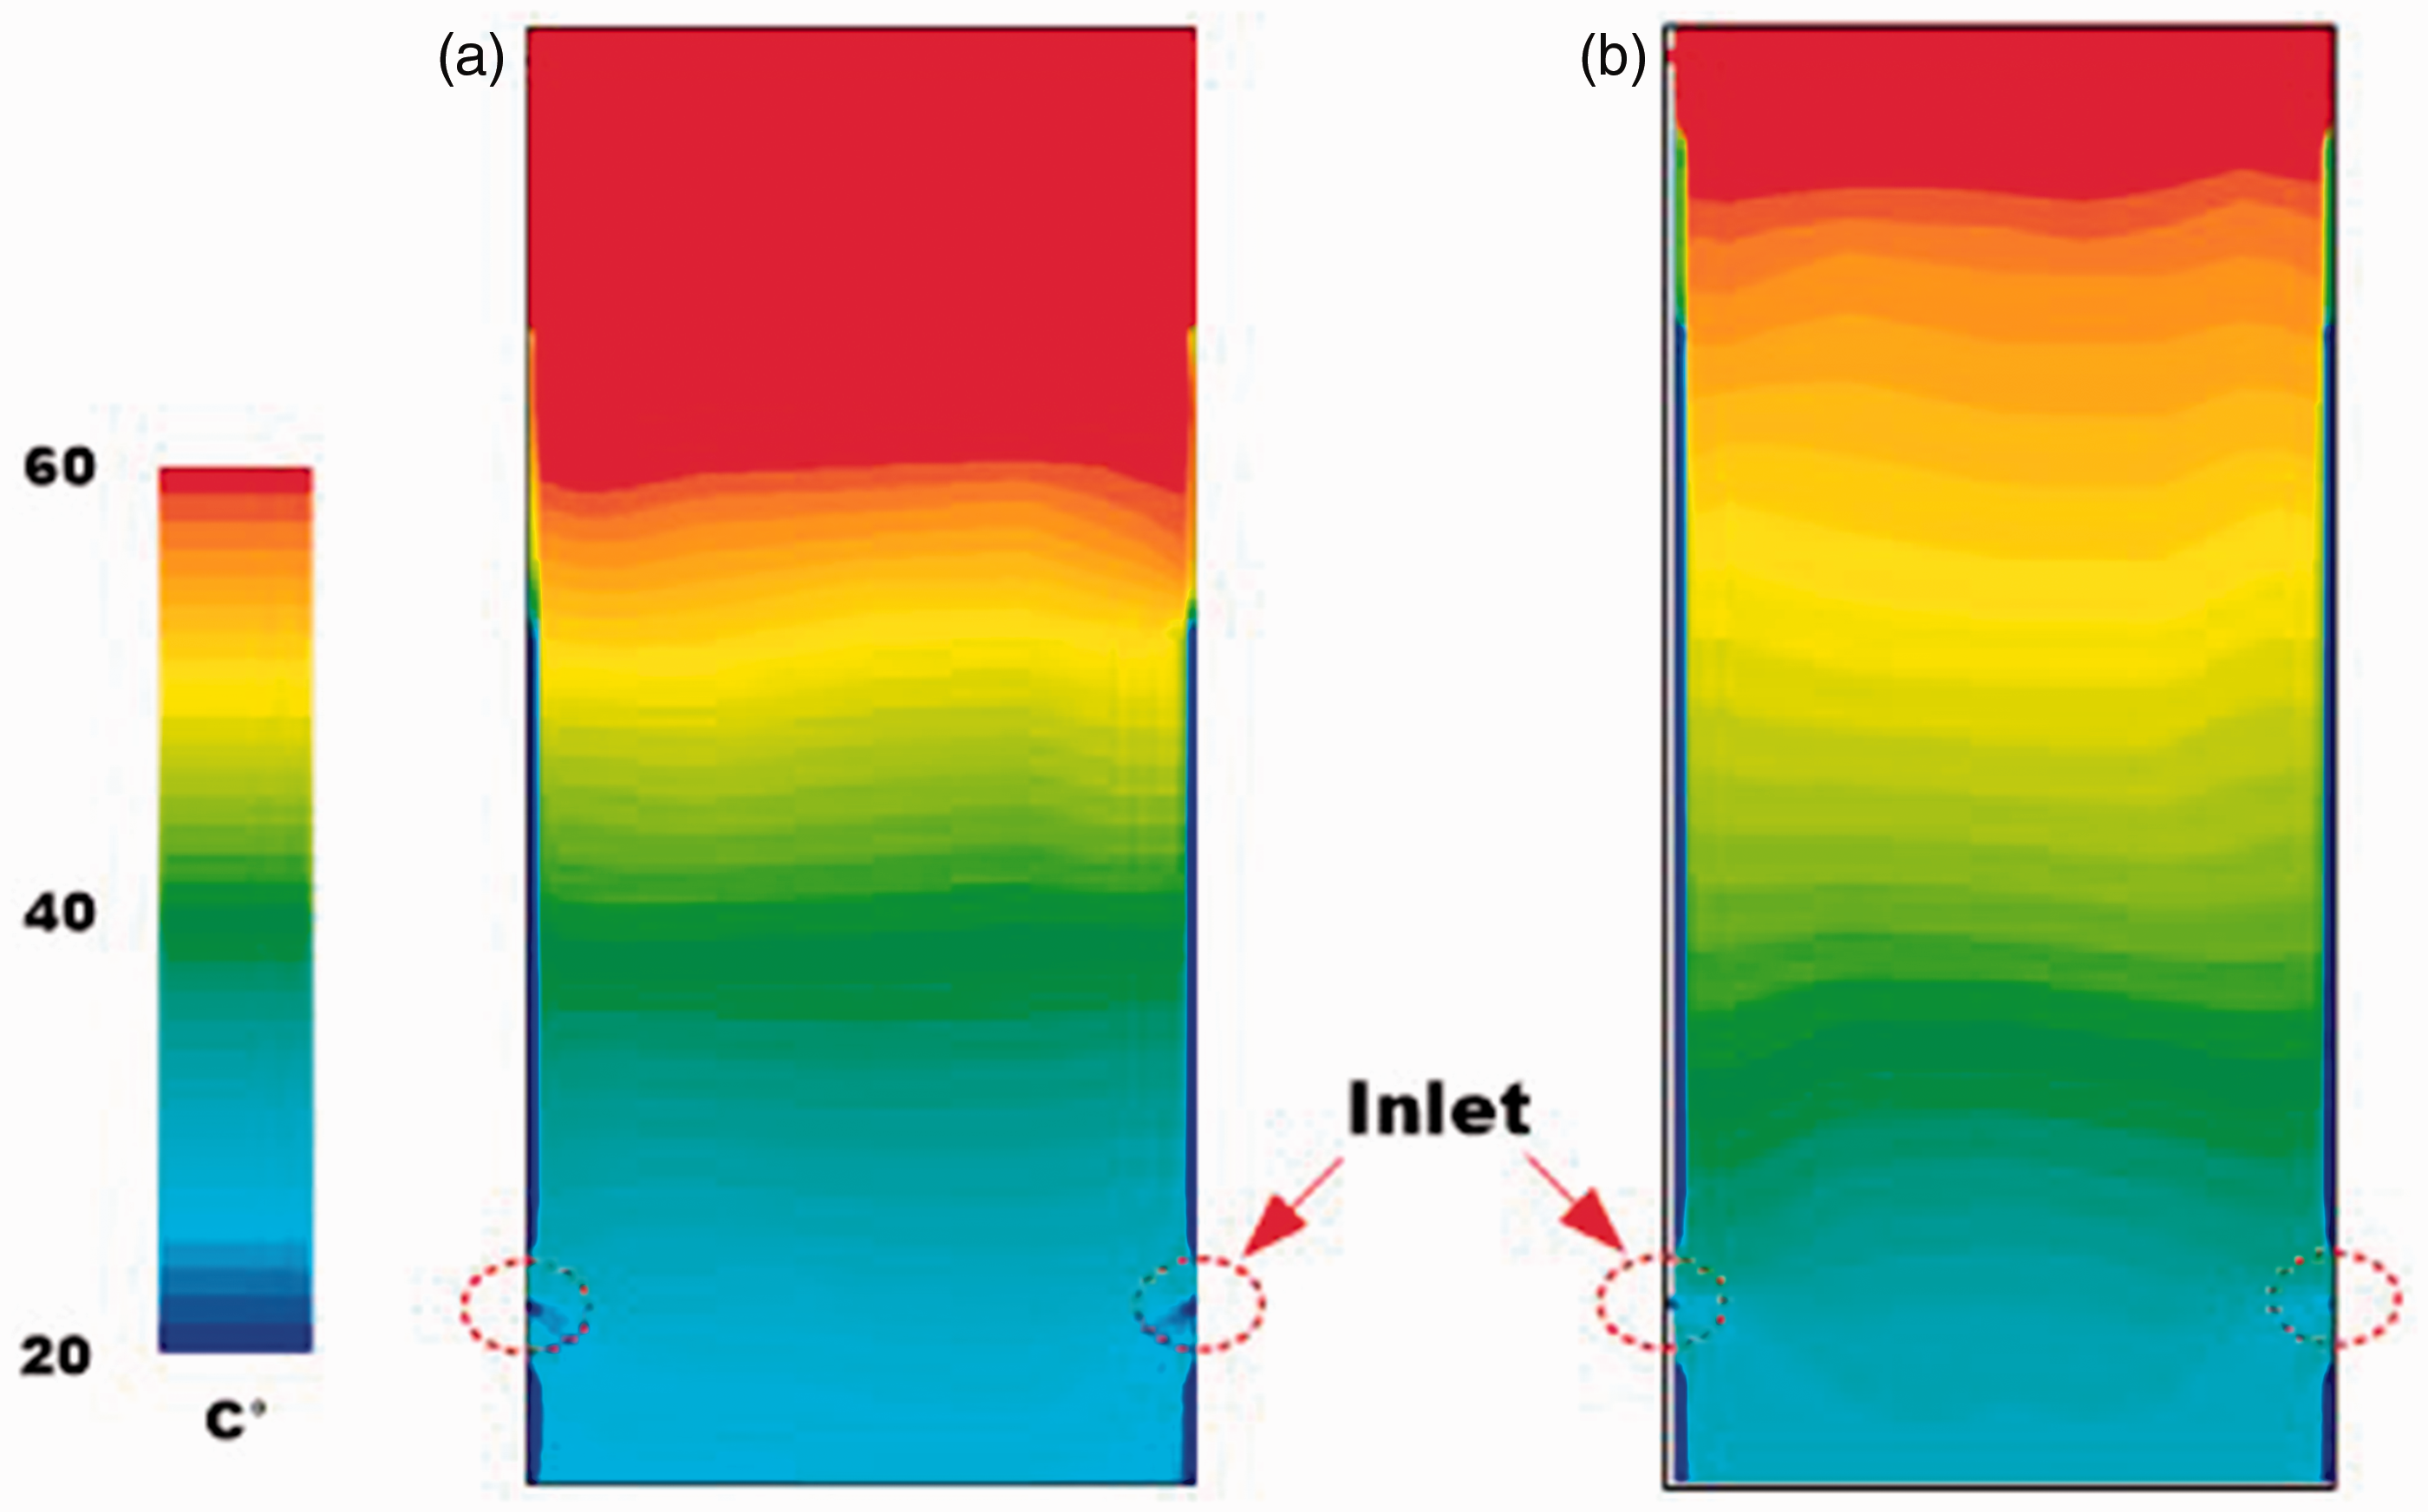
The air temperature distribution along the vertical plane at 9 m from the south wall.
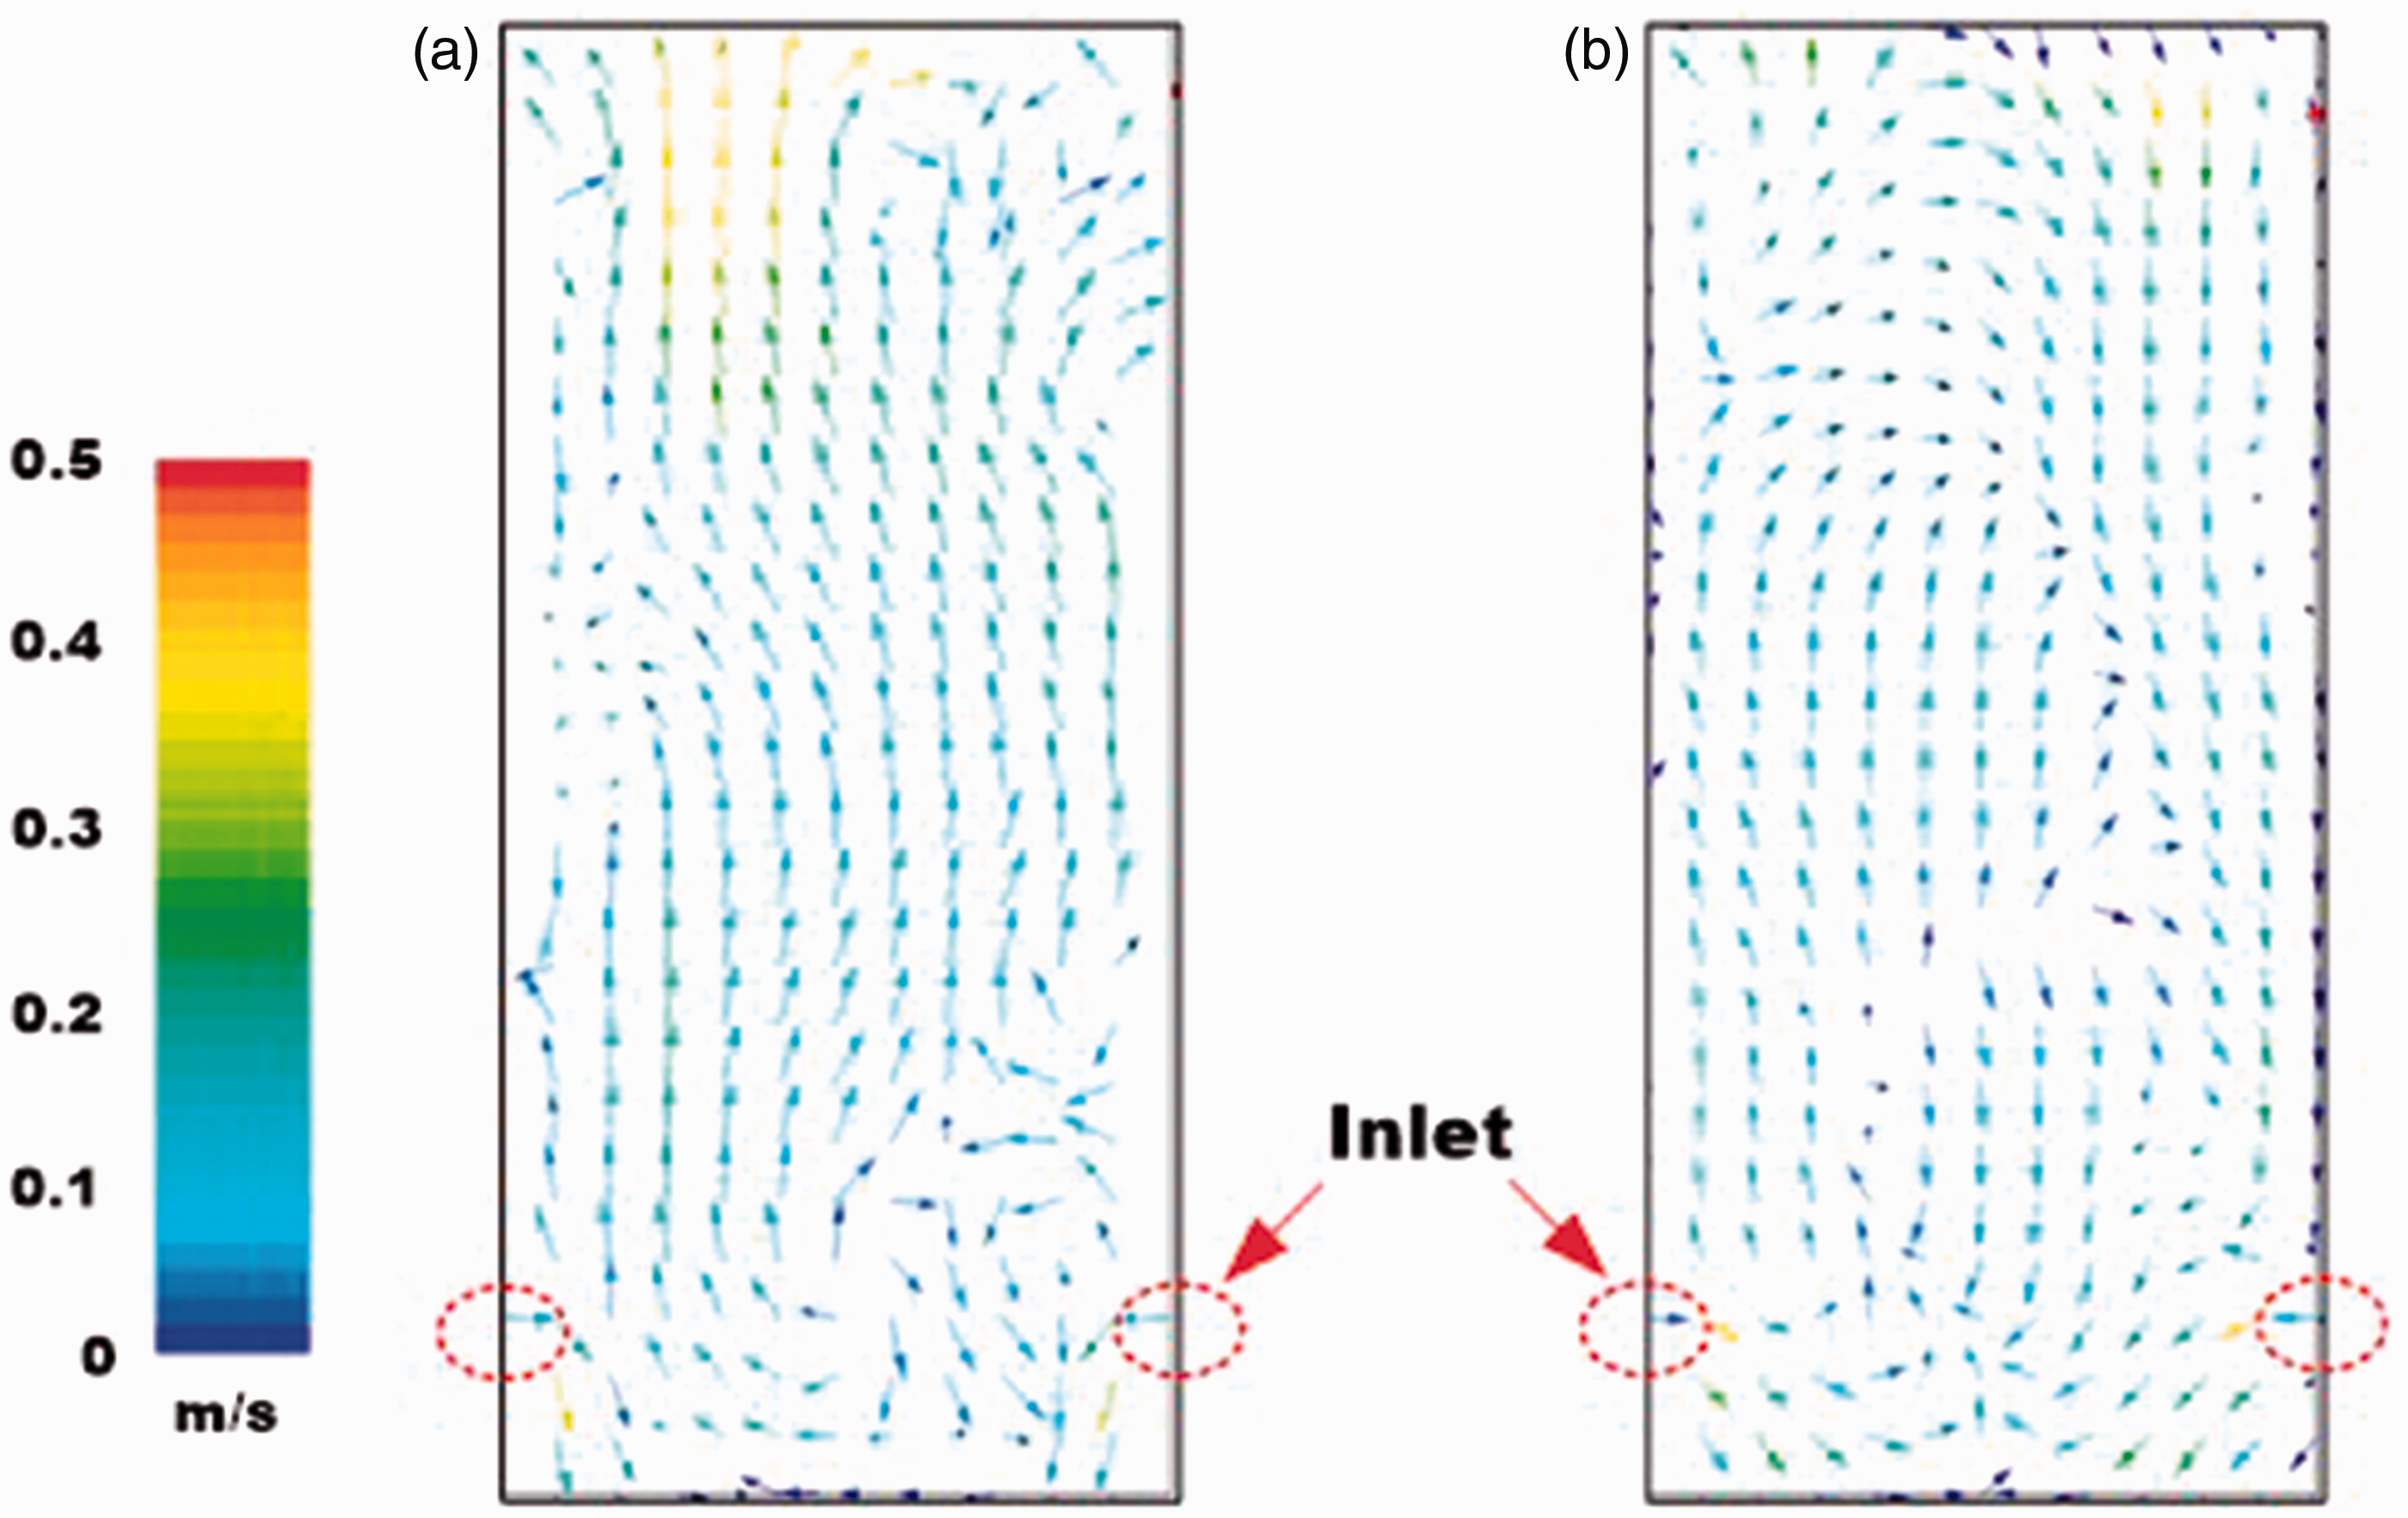
The velocity vector along the vertical plane at 9 m from the south wall.
Calculation of the thermal response factor
In the study of Hiyama, Kato and Ishida, 39 the heat flux generated from any given heat source was calculated by the thermal response factor. Therefore, once the heat flux from the outer wall is known, the heat distribution into the inner space can be predicted. In the atrium, five heat sources including the roof and four outer walls were considered and calculated by CFD analysis to estimate the flow field and the temperature rise of each case. 39 The input heat of each source and the reference point are presented in Figure 9(a) based on the solar radiation on 30 August 2014. The heat flow field of five heat sources was calculated using equation (1). The time series of responses of each case at the reference point (x: 5 m, y: 18 m, z: 1.5 m) is shown in Figure 9(b). Regarding the reference point, Figure 10 shows the calculated response factors of each heat source.
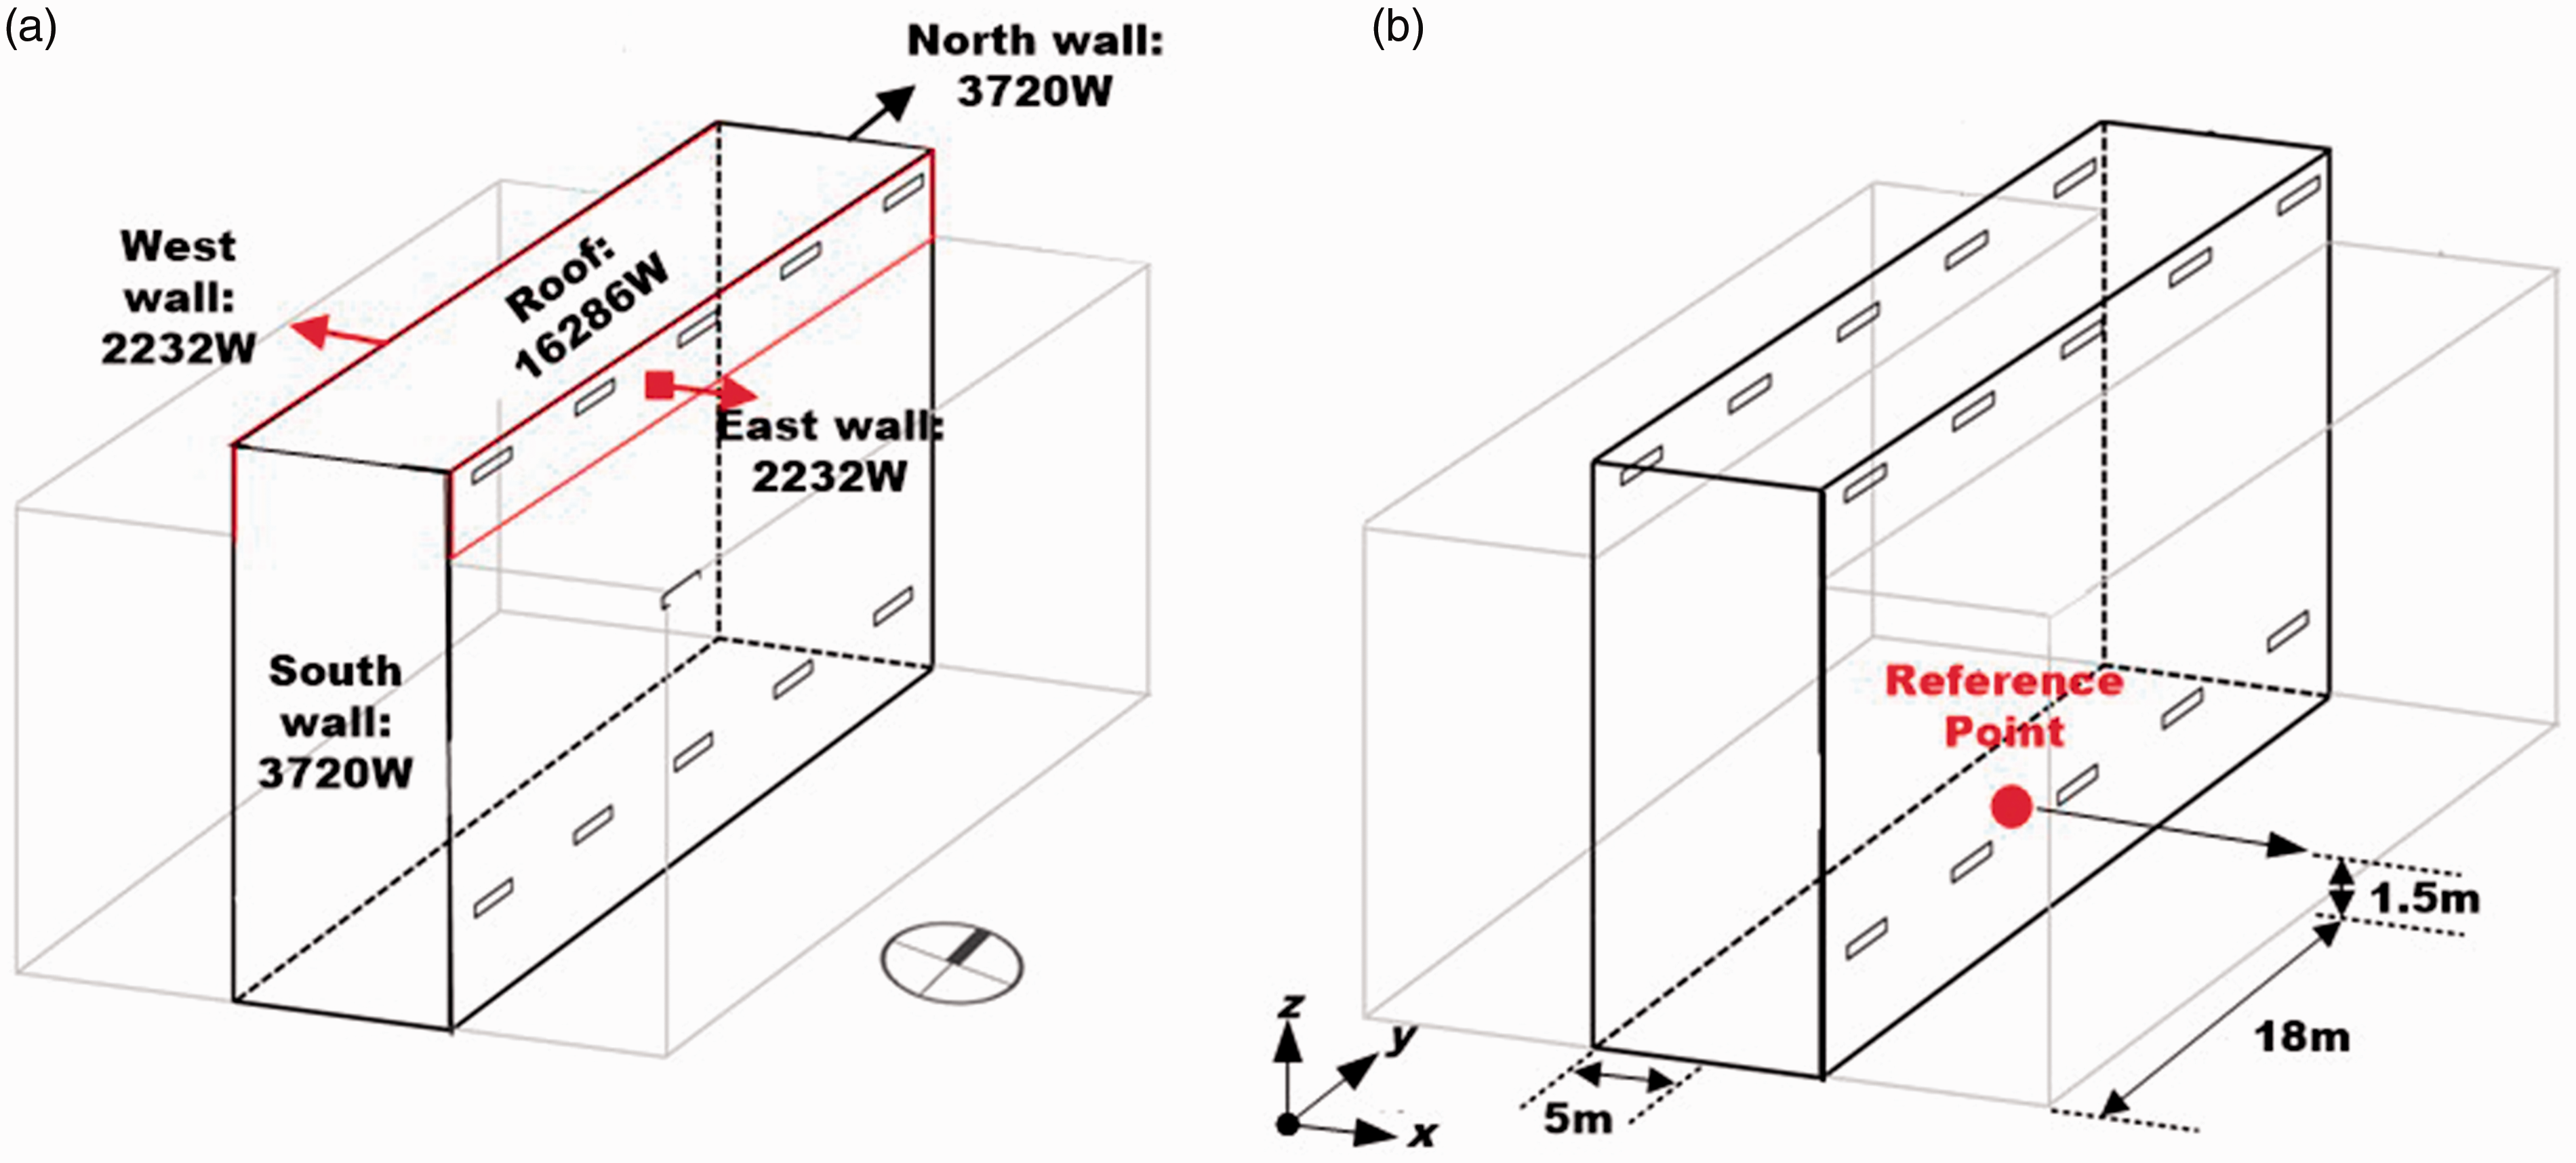
Heat sources and the location of the reference point. (a) 5 heat sources at outer walls, (b) The reference point.
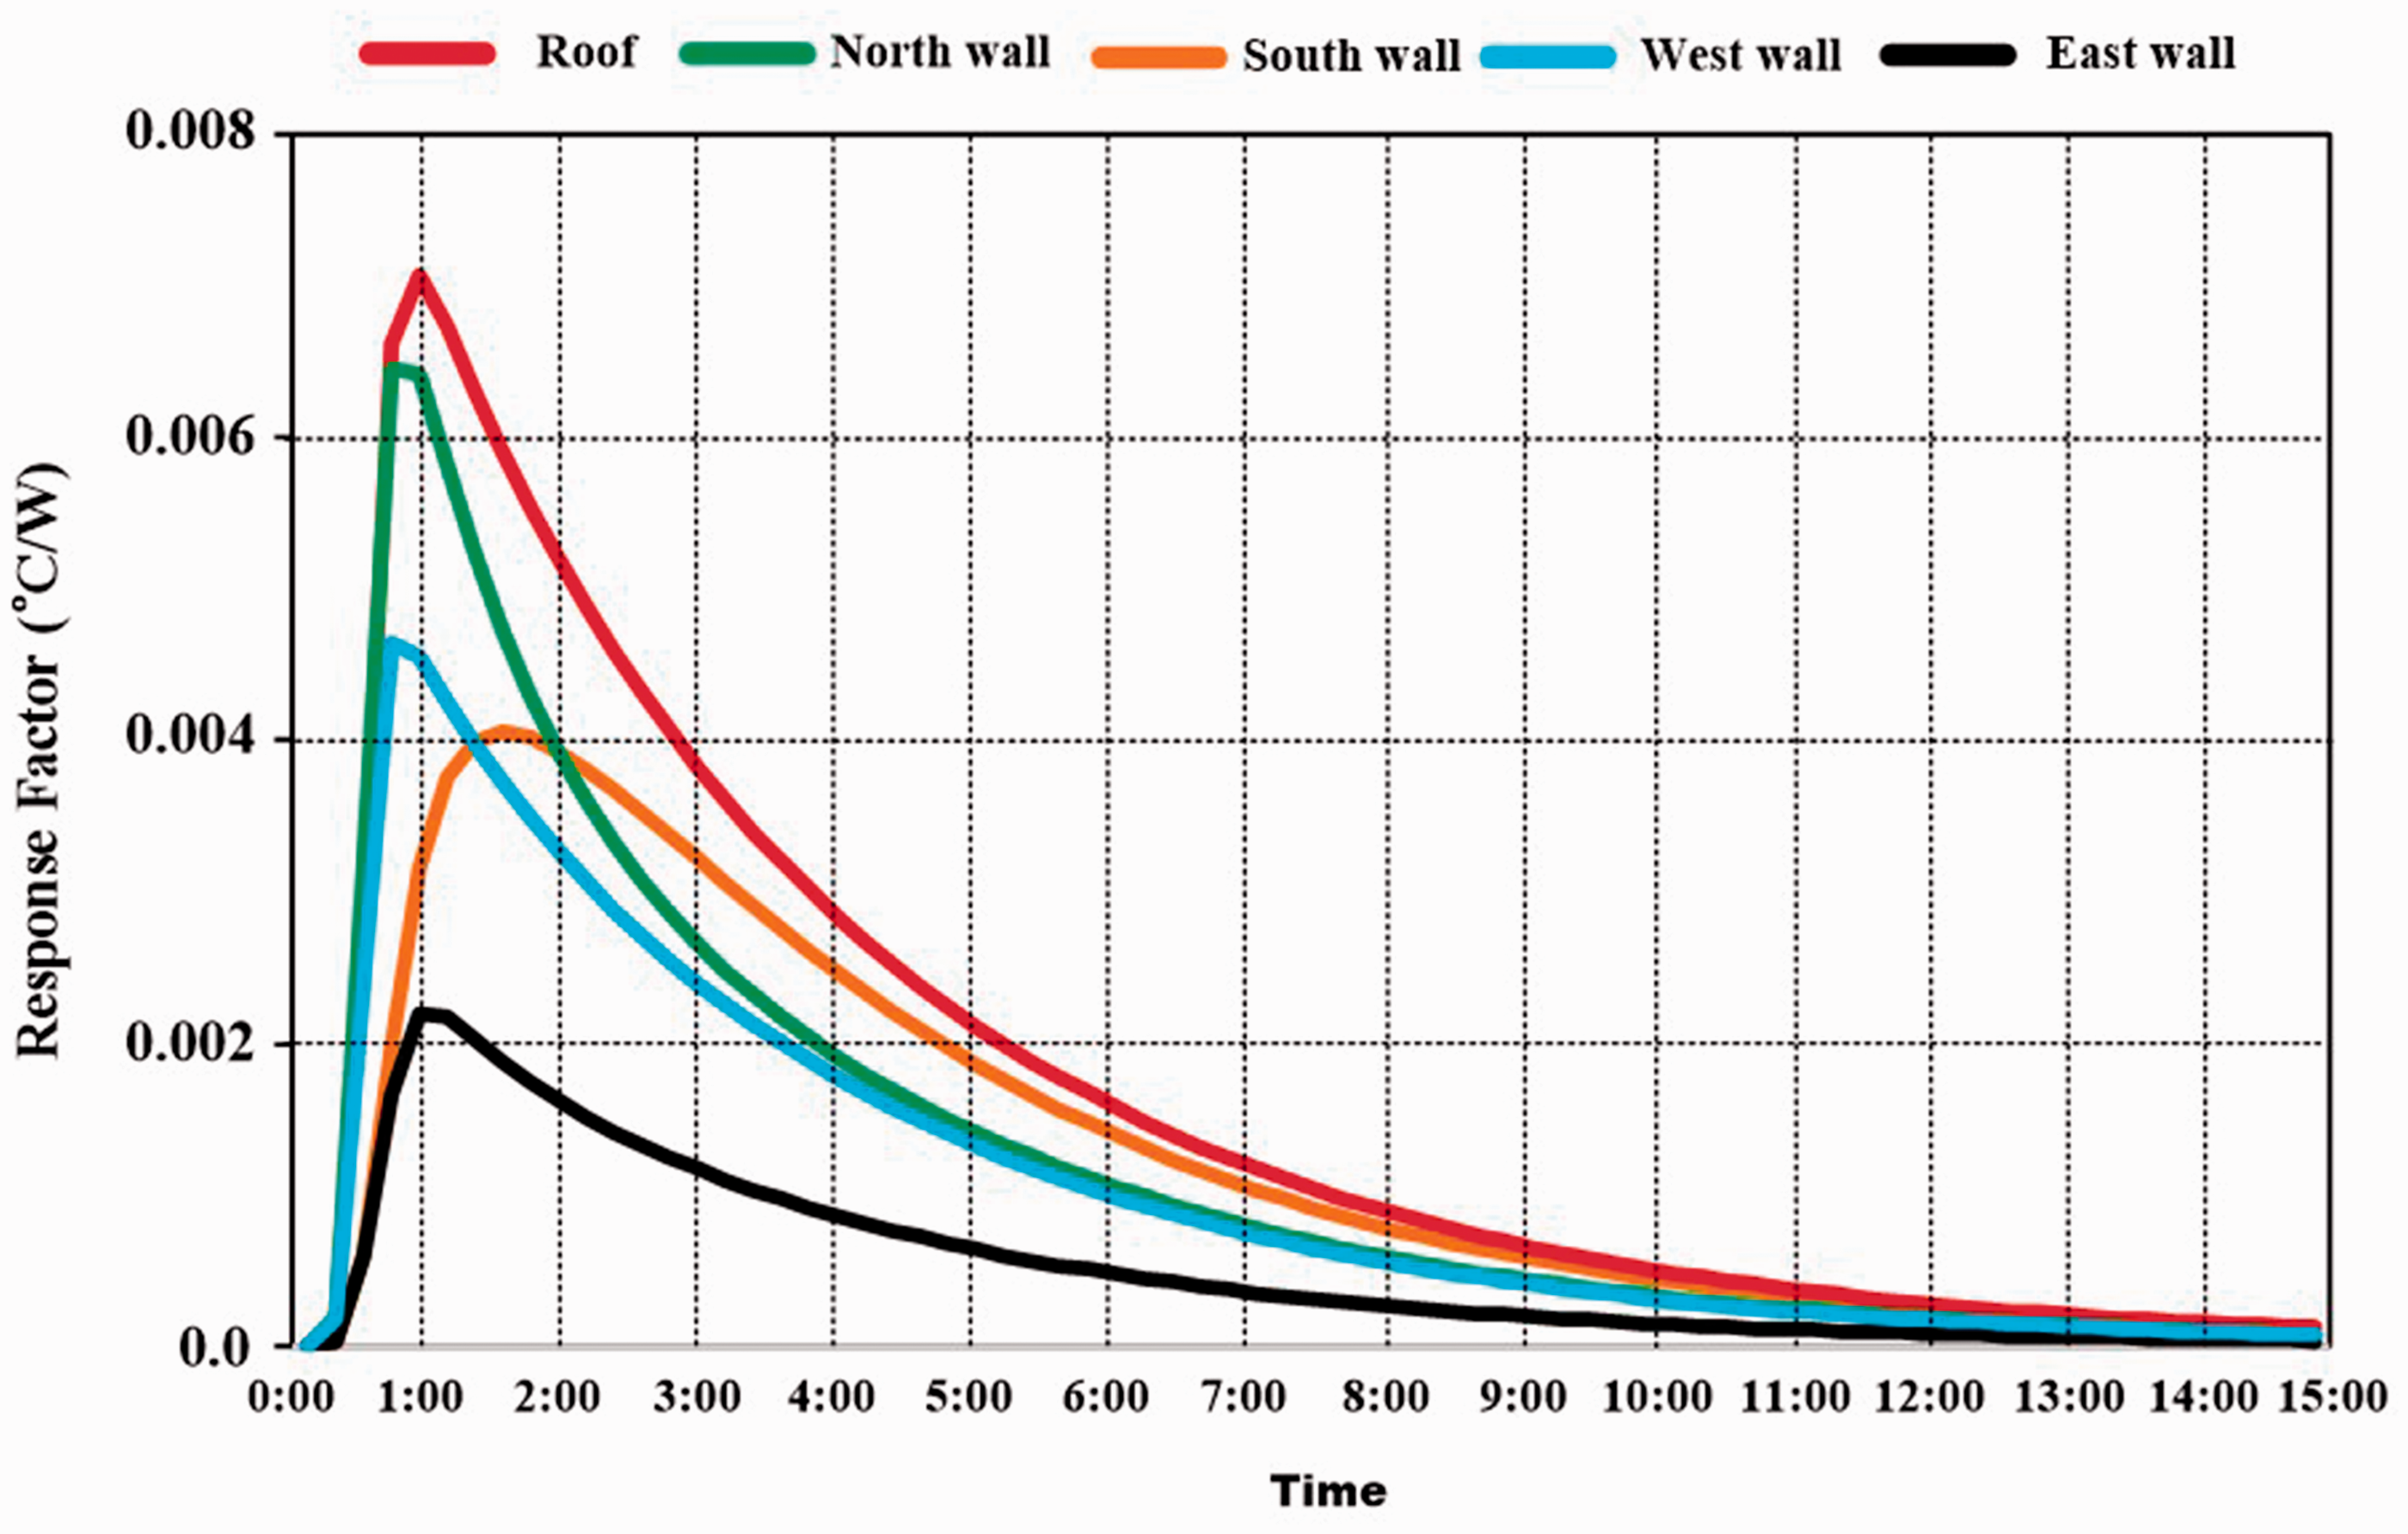
Thermal response factor at each heat source.
As shown in Figure 10, each heat source at the reference point showed the time series of calculated response factors from five surfaces. From this figure, the response factors of the north and west walls reached maxima before 1 h, whereas the response factors of the roof and east wall reached maxima at 1 h. A maximum for the south wall was reached at about 1.5 h. After obtaining the heat response factors from each heat source, the calculation of the change in the time series (based on the temperature at the reference point) was carried out using the method proposed by the study of Hiyama, Kato and Ishida. 39
Application of the thermal response factor method for temperature prediction in the atrium
The temperature distribution of the indoor space was predicted by the thermal response factor method. The temperature at the reference point was set at 26°C. Figure 11 shows the calculated results obtained using the thermal response factor method with the solar radiation from 7:00 h to 18:00 h on 30 August 2014. The predicted highest temperature was reached at 13:15 h, while the solar radiation was highest at 13:00 h. Even though there was a delay in time, the results obtained by the thermal response factor method show a similar trend of temperature distribution from radiation received at the wall surfaces. Therefore, it was possible to predict the air temperature distribution using the thermal response calculation. In addition, it was determined with a simple CFD model that required less computational time than conventional CFD analysis.
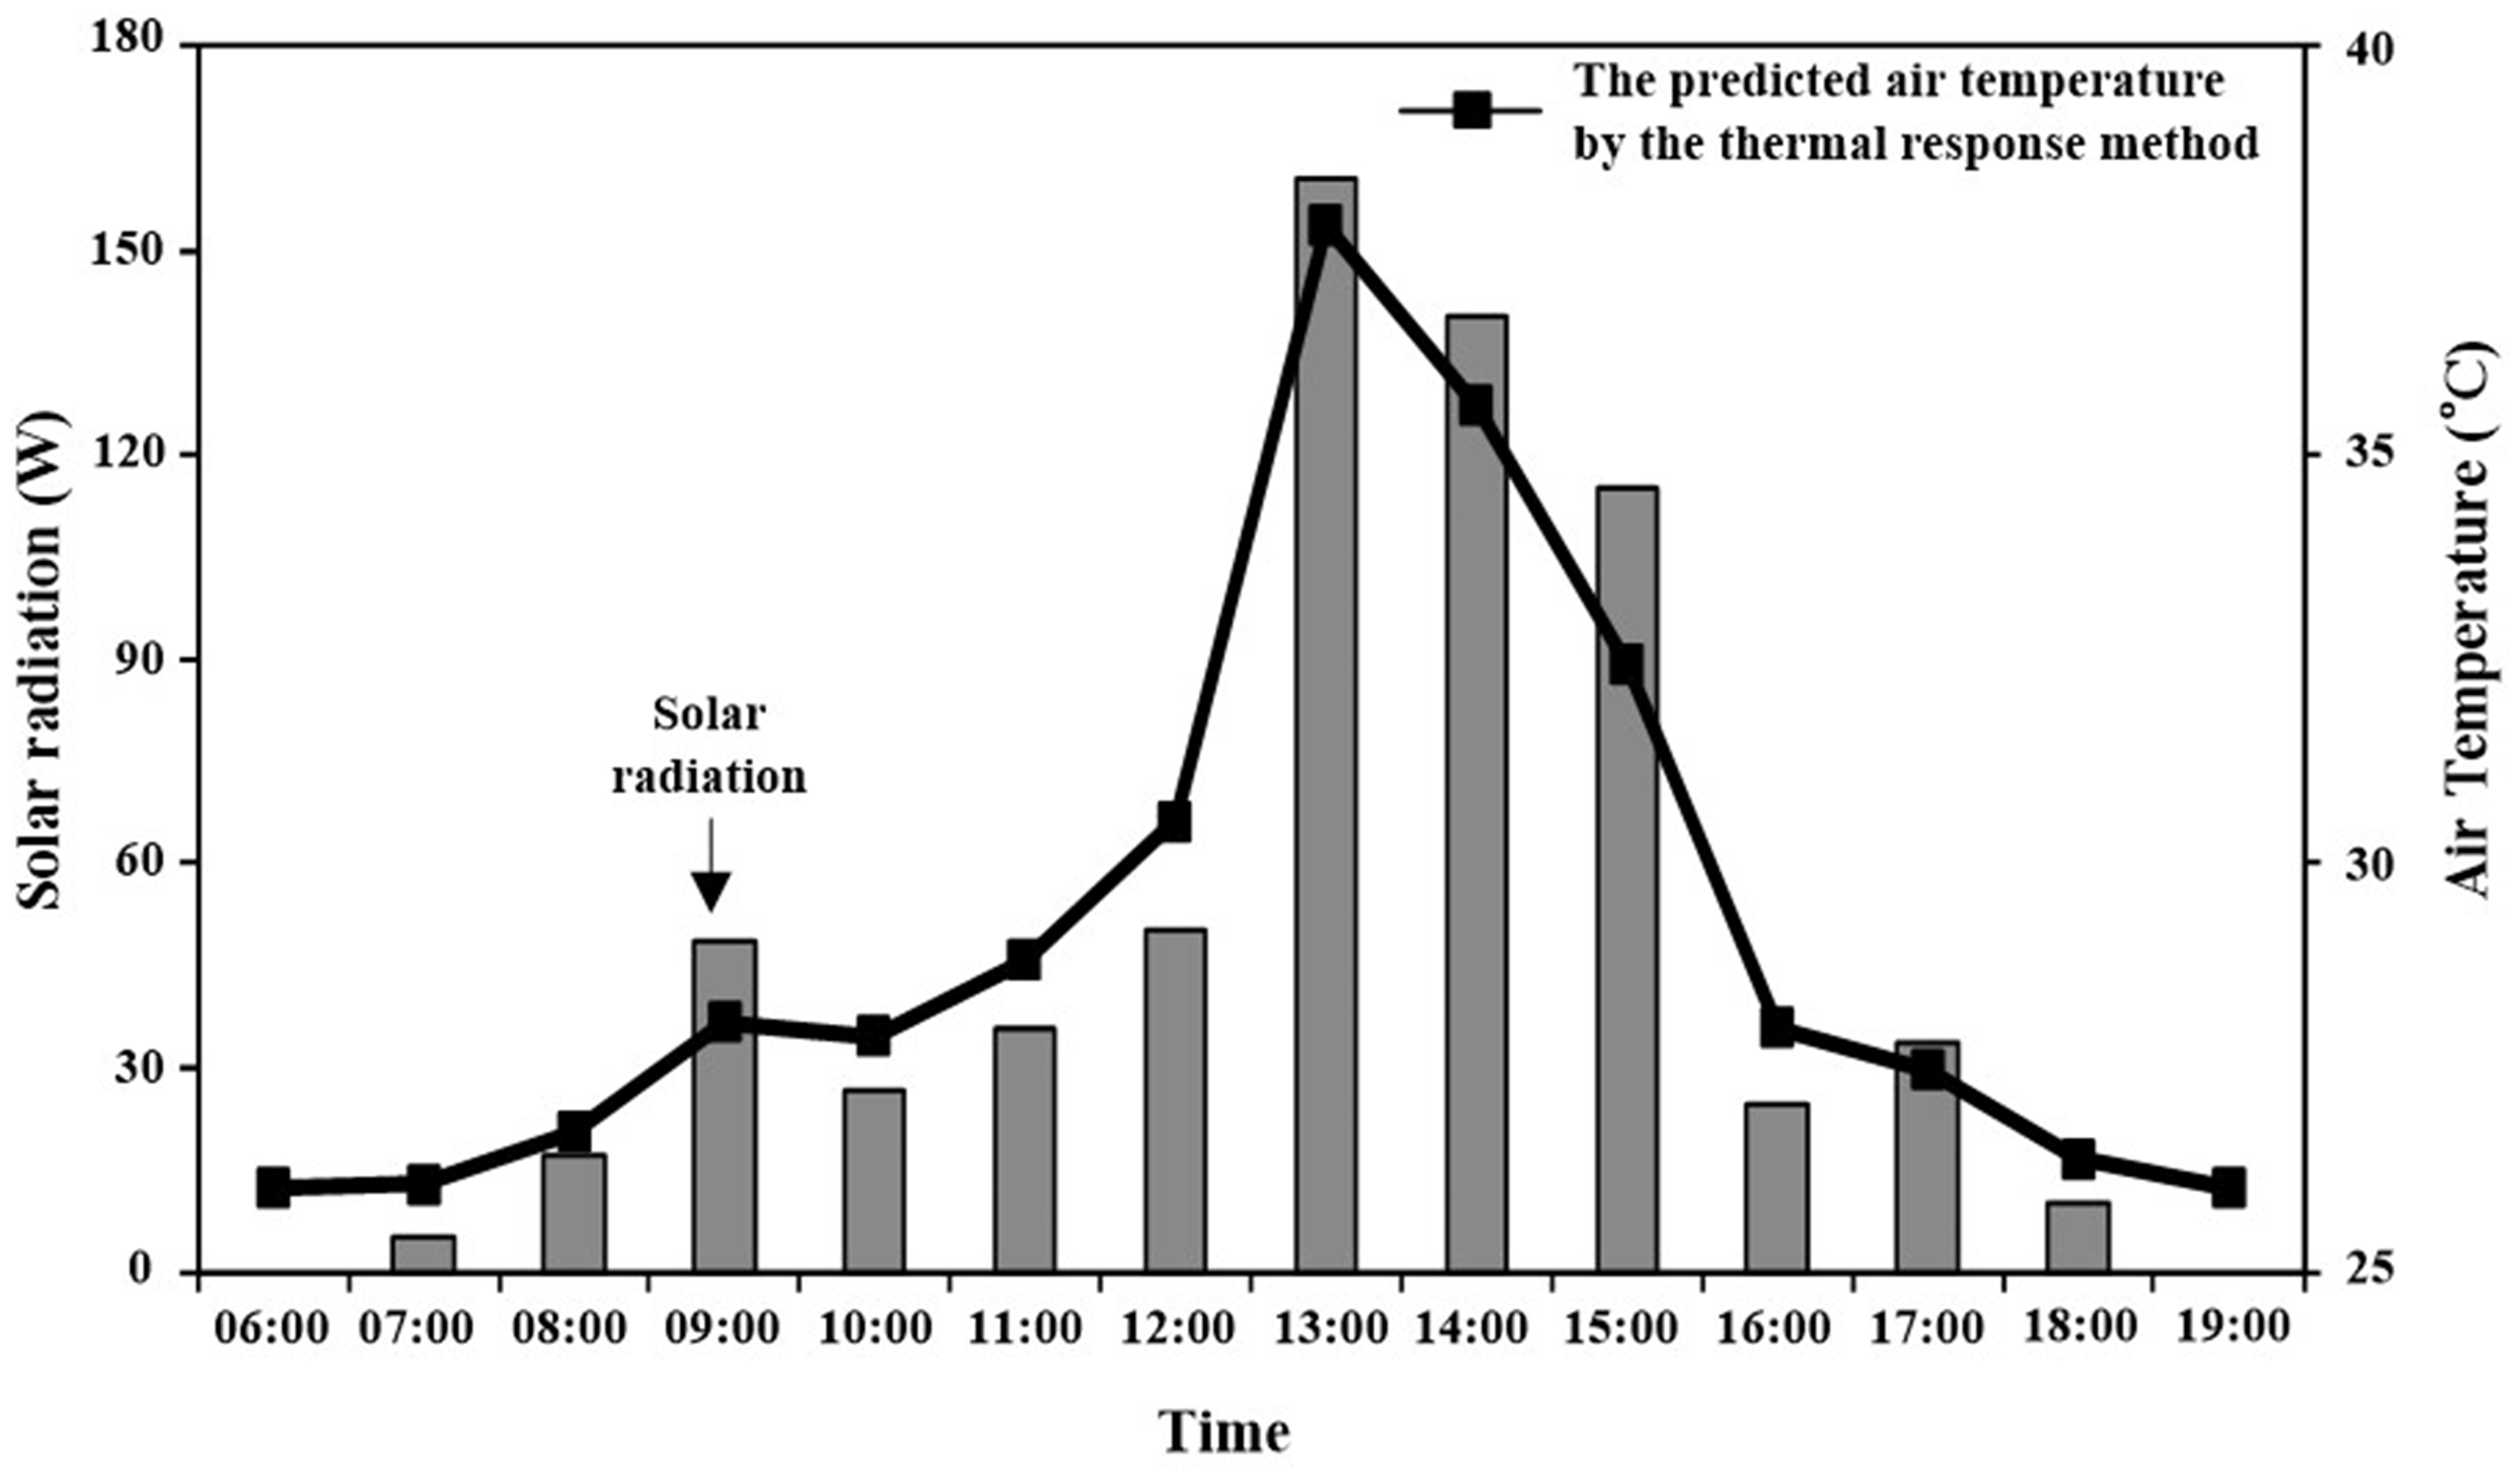
The comparison between the solar radiation and the prediction of air temperature in the atrium by the thermal response factor method.
Airflow patterns by Archimedes Number
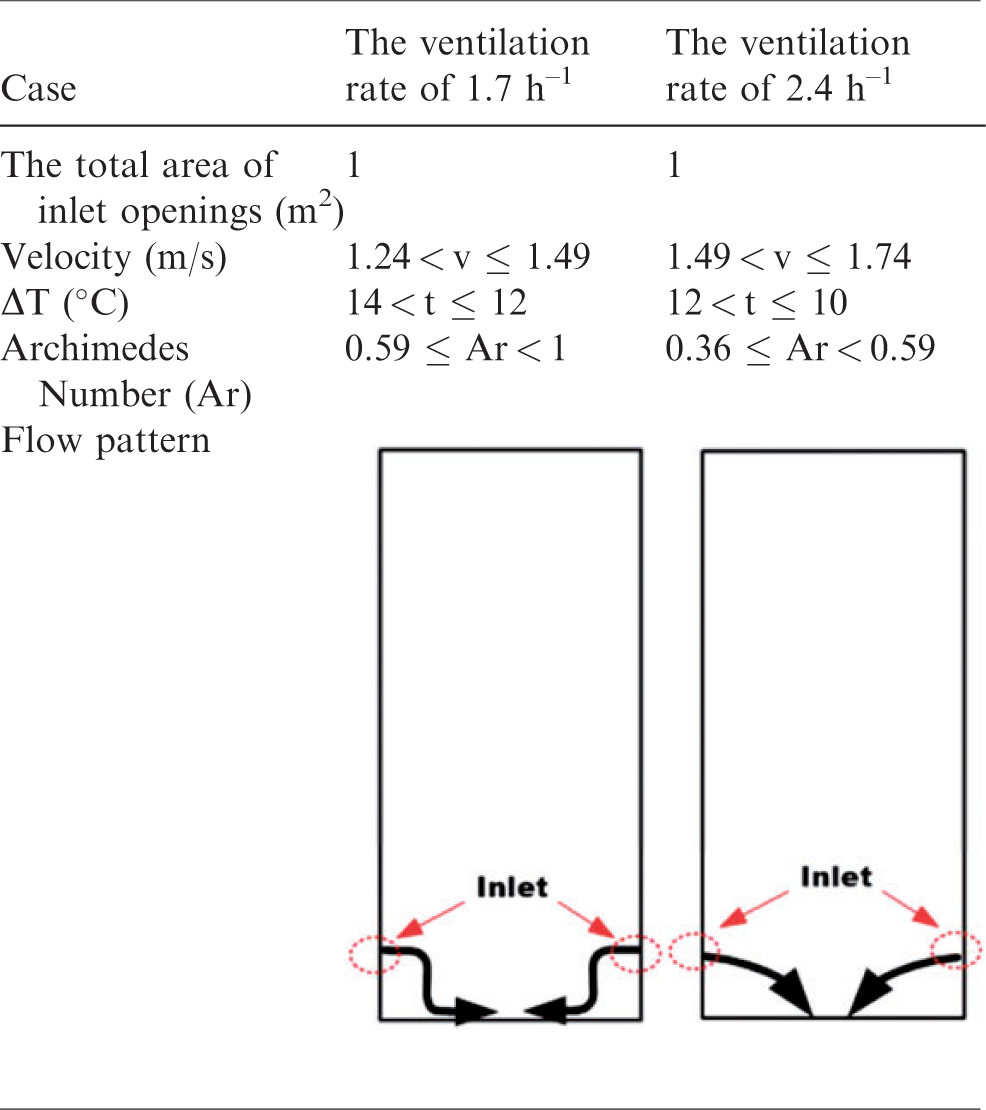
In addition to the thermal response factor calculation, Archimedes Number was applied to identify airflow patterns in the atrium space. Because an airflow pattern is a function of the Archimedes Number,48,49 the velocity vector field of both cases can be characterised by the value of Archimedes Number. Since it was only assumed that airflow was provided through the inlet at the lower part of the atrium, only the airflow occurred at the lower part of the atrium space was considered. Based on the CFD simulation results, the airflow patterns for two ventilation rates were presented in Table 2. For a ventilation rate of 1.7 h−1, the airflow declined rapidly along the vertical wall, while in the case of a ventilation rate of 2.4 h−1, the airflow from the inlet was strong and reached a relatively further distance and declined smoothly across the atrium. Since the same Archimedes Number has the same distance of airflow projected out from the inlet and the Archimedes Number is related with the temperature difference and the velocity of the air stream, the airflow patterns can be predicted using Archimedes Number, once climatic conditions and the set-point temperature of the systems are known.
The airflow patterns by Archimedes Number.
Research findings and limitations
To design atrium buildings considering both energy efficiency and thermal comfort, there is a need to evaluate the thermal phenomena (such as the heat gain and stratification) within the atrium space, especially thermal stratification. To correctly model thermal stratification in the atrium, numerical simulation such as CFD has been generally used. However, it is difficult to use CFD for the analysis of thermal stratification in the atrium for a year or less due to limited computational resources. Even though the use of energy simulation such as EnergyPlus can be performed over a 1-year period, it also has a limitation for the investigation of thermal performance of atrium buildings.
In the present study, we employed the thermal response calculation method with an assumption that the airflow in the atrium was perfectly mixed 34 by the mechanical system. The thermal response factors were calculated by considering heat loads of the outer walls through the CFD analysis. The comparison result showed a 15 min delay of the predicted data to the measured data of temperature distribution. Moreover, the results obtained were also utilised to estimate the airflow patterns from the inlet with different ventilation rates in the atrium space using Archimedes Number. In summary, the temperature performance at each heat source was calculated by the thermal response method, which was analysed for the understanding of thermal behaviour in mechanically ventilated atrium buildings with less computational resource and time than that of the conventional CFD approach. Moreover, the information of predicted temperatures at heat sources using this approach can be used as inputs for energy simulation to predict the thermal performance within atrium more accurately.
While obtaining the thermal response factors from each heat sources, some parameters were not fully considered. In addition, there were some limitations while conducting the full-scale measurements and CFD analysis:
The simple CFD analysis was conducted to calculate thermal response in order to integrate them into the energy simulation. Because of the perfect mixing assumption of the response factor calculation model, the temperature in the atrium was set uniformly.
34
During the field measurement, the mechanical system controlled the cooling demand for the inner spaces of neighbouring offices. However, the transmission of heat from the offices to the atrium was not considered. Also, the insulated walls of offices allowed transmission of little heat from outside and the operation of air-conditioning was differently applied for offices. The indoor conditions of those neighbouring offices were adiabatically set in the CFD simulation. Further research is thus needed to evaluate the impact of the thermal performance from neighbouring spaces into the atrium. For the thermal response calculation and the airflow pattern obtained by Archimedes Number, only one point at 1.5 m from the ground floor was considered, where the heated airflow has an impact on occupants. Further research is needed to explore the impact of other points at different height to neighbouring spaces in the atrium for better understanding of the complex thermal phenomena created in the atrium space.
Conclusion
Conventionally, both field measurement and numerical simulation are required for the determination of the temperature distribution within an atrium space. This paper contributes to the prediction of temperature distribution using the calculation of thermal response factors 34 by CFD simulation.
For this study, measurements were performed in an atrium building in order to determine the thermal behaviour of the building. The vertical temperature profile, the transmitted radiation, and solar radiation on the outer surfaces were analysed. Then, the thermal parameters from measurements were compared with the CFD simulation in order to validate the CFD analysis. The results obtained by the CFD analyses were compared and agree well with measurements.
In conclusion, this approach using the thermal response factor method and airflow patterns by Archimedes Number can provide information of thermal performance in mechanically ventilated atrium buildings.
Footnotes
Authors’ contribution
All authors contributed equally in the preparation of this article.
Declaration of conflicting interests
The author(s) declared no potential conflicts of interest with respect to the research, authorship, and/or publication of this article.
Funding
The author(s) disclosed receipt of the following financial support for the research, authorship, and/or publication of this article: This work was supported by ‘Human Resources Program in Energy Technology’ of the Korea Institute of Energy Technology Evaluation and Planning (KETEP), granted financial resource from the Ministry of Trade, Industry & Energy, Republic of Korea (No. 20174010201320) and the National Research Foundation of Korea (NRF) grant funded by the Korea government(MSIT) (No. 2017R1A2B3012914).