
Abstract
The purpose of the paper is to evaluate the shadow impact factor of buildings on building-integrated photovoltaic (BIPV) system efficiency and to determine optimal building configurations: shapes and orientation; to ensure BIPV efficiency based on the sun-shading effect. Also considered were the height, tilt angles, orientations and array spacing as well as different shapes of the podium building for BIPV system. A parametric design software called grasshopper and plug-in ladybug were used for the simulation. Model cases were built according to statistics of high-rise buildings in Shanghai. The simulation condition was based on the winter solstice of 21 December. The results show the best shapes for high-rise buildings are circle and square, to ensure the best BIPV system efficiency. The BIPV should be located on the roof and the ‘U’ type podium building is the best shape for mounting the BIPV system to provide a good sunlight exposure no matter what the high-rise building shape is. For PV panels, the best height is 0.618 m, the optimum tilt angle and array spacing is 30° and 1.214 m, respectively. The best orientation is southward followed by southeast, southwest and with the BIPV tilting upward at 30°. Therefore, to maximize the solar energy generation, architects should consider square and round high-rise buildings and ‘U’ type podiums for mounting BIPV systems in commercial complex buildings.
Keywords
Introduction
There are two photovoltaic (PV) systems used on buildings: building attached PVs (BAPVs) and building-integrated PVs (BIPVs)1–4 depending on the mounting method of the system. BAPVs have no function on a building structure. 2 However, BIPVs are PV modules that can be integrated on the roof or a façade of a building by replacing conventional materials. 5 Therefore, BIPVs can be considered as an integral part of an energy system of the building and could have some structural impacts on buildings. Solar PV technologies are divided into silicon based and non-silicon based. They are usually applied on the roof or integrated onto the façade of the building. The BIPV can be divided into four categories: foils, tiles, modules and solar cell glazing. 2
In modern society, due to pursuant of high standard of building thermal environment comfort, the energy consumption of buildings for heating, ventilating and air conditioning (HVAC) have been growing rapidly. In China, building energy consumption accounts for 40–50% of the total energy consumption. 6 This would restrict economic growth in certain degree and could also generate a great pressure on the ecological environment, the development of renewable technology is urgent to generate clean energy to replace the conventional fossil energy. BIPV strategy is one of the alternatives for energy strategies to contribute to the energy efficiency of buildings.
In BIPV system, the subject is the building and the object is the solar power system. BIPV system has many advantages: it could realize the perfect incorporation in buildings without affecting the architectural appearances. In architectural lighting, double glass components made of smooth super white toughened glass are used in BIPV buildings. 7 Meanwhile, particular light transmittance can be achieved by adjusting the arrangement of cell or by using punched silicon cell. The integration of BIPV into a building can be achieved without additional cost of more land use. There has been many research in BIPV systems. Initially, majority of research focused on components of the BIPV system. Over the last two decades, there have been some research efforts on thin-film technologies to reduce manufacturing cost.8–12 Following the growth of thin-film technologies, another PV device was invented: dye-sensitized solar cells (DSCs) with low-cost fabrication and versatile applications as flexible or light-weight products. 8 Grätzel solar cells could achieve 13% energy conversion efficiency on small devices. 9 Fathiet et al. 11 studied the new material and found the use of polymethyl methacrylate (PMMA) on silicon solar cells could reduce the cost, and also increase the power production efficiency. Beyond that, aesthetic sky-blue colour was best for opaque back contact (OBC) module with 7.2% efficiency.10--12 Peng 13 designed a novel mounting structure to solve problems about maintenance and replacement of PV components. He concluded that the cost, function, technology and aesthetics were more important than integration. He also found that the lifetime expectance of PVs is lower than building, simple maintenance and replacement of PV modules are important conditioning load.
There have been many research on the utilization efficiency of BIPV system. Omer et al. 14 compared two different BIPV systems which has two different tilt angles. The first system was a thin film PV façade application formed with a tilt angle of 58° compared with the second system with a tilt angle of 52°. They found that these two systems were not cost effective at the price in 2002. Yang et al. 15 investigated the performance of the first BIPV system. They concluded that the roof was the best position for maximum power output. Santos and Rüther 16 investigated a BIPV/BAPV system for the existing 496 single-family residential buildings and concluded that the BIPV/BAPV system would produce 40% of the per person annual energy demand. Drif et al. 17 studied a way to assess the energy loss related to shading of BIPV systems.18–20 In addition, shading effect also had important effects on the ambient temperature, the direction of the building and the PV’s tilt angle. Different shading caused by different gaps could also influence the ventilation. The study about BIPV efficiency mainly focused on the module. There is also an issue with a lack of installation method of components of BIPV.
There are also studies on the digital simulation software and models. Chow 21 simulated a 260 m2 BIPV system mounted on a building with an air gap of 250 mm using ESP-r building energy software. He found that the power generation could be improved to 47% by changing the azimuth and shading effects through simulations.21--23 Mulcué-Nieto 24 found that the façade application was not suitable for places below the 7° latitude. Three models of BIPV were evaluated to determine the performance of a system, and the solar radiation and climatic data were important to predict the energy output. 25 Through simulation method, the large, shade-free and typically horizontal construction has been proven to be an ideal position for installation of BIPVs. 26 Simulation method have been proven to be a credible way to simulate the BIPV system based on local weather data.
In summary, BIPV system is important for the building energy efficiency. Research done so far, has been focusing mainly on the study of BIPV system equipment and simulation method. At present, there have not been research on the building shading effect to optimize the performance of a BIPV system for solar energy utilization in high-rise buildings.
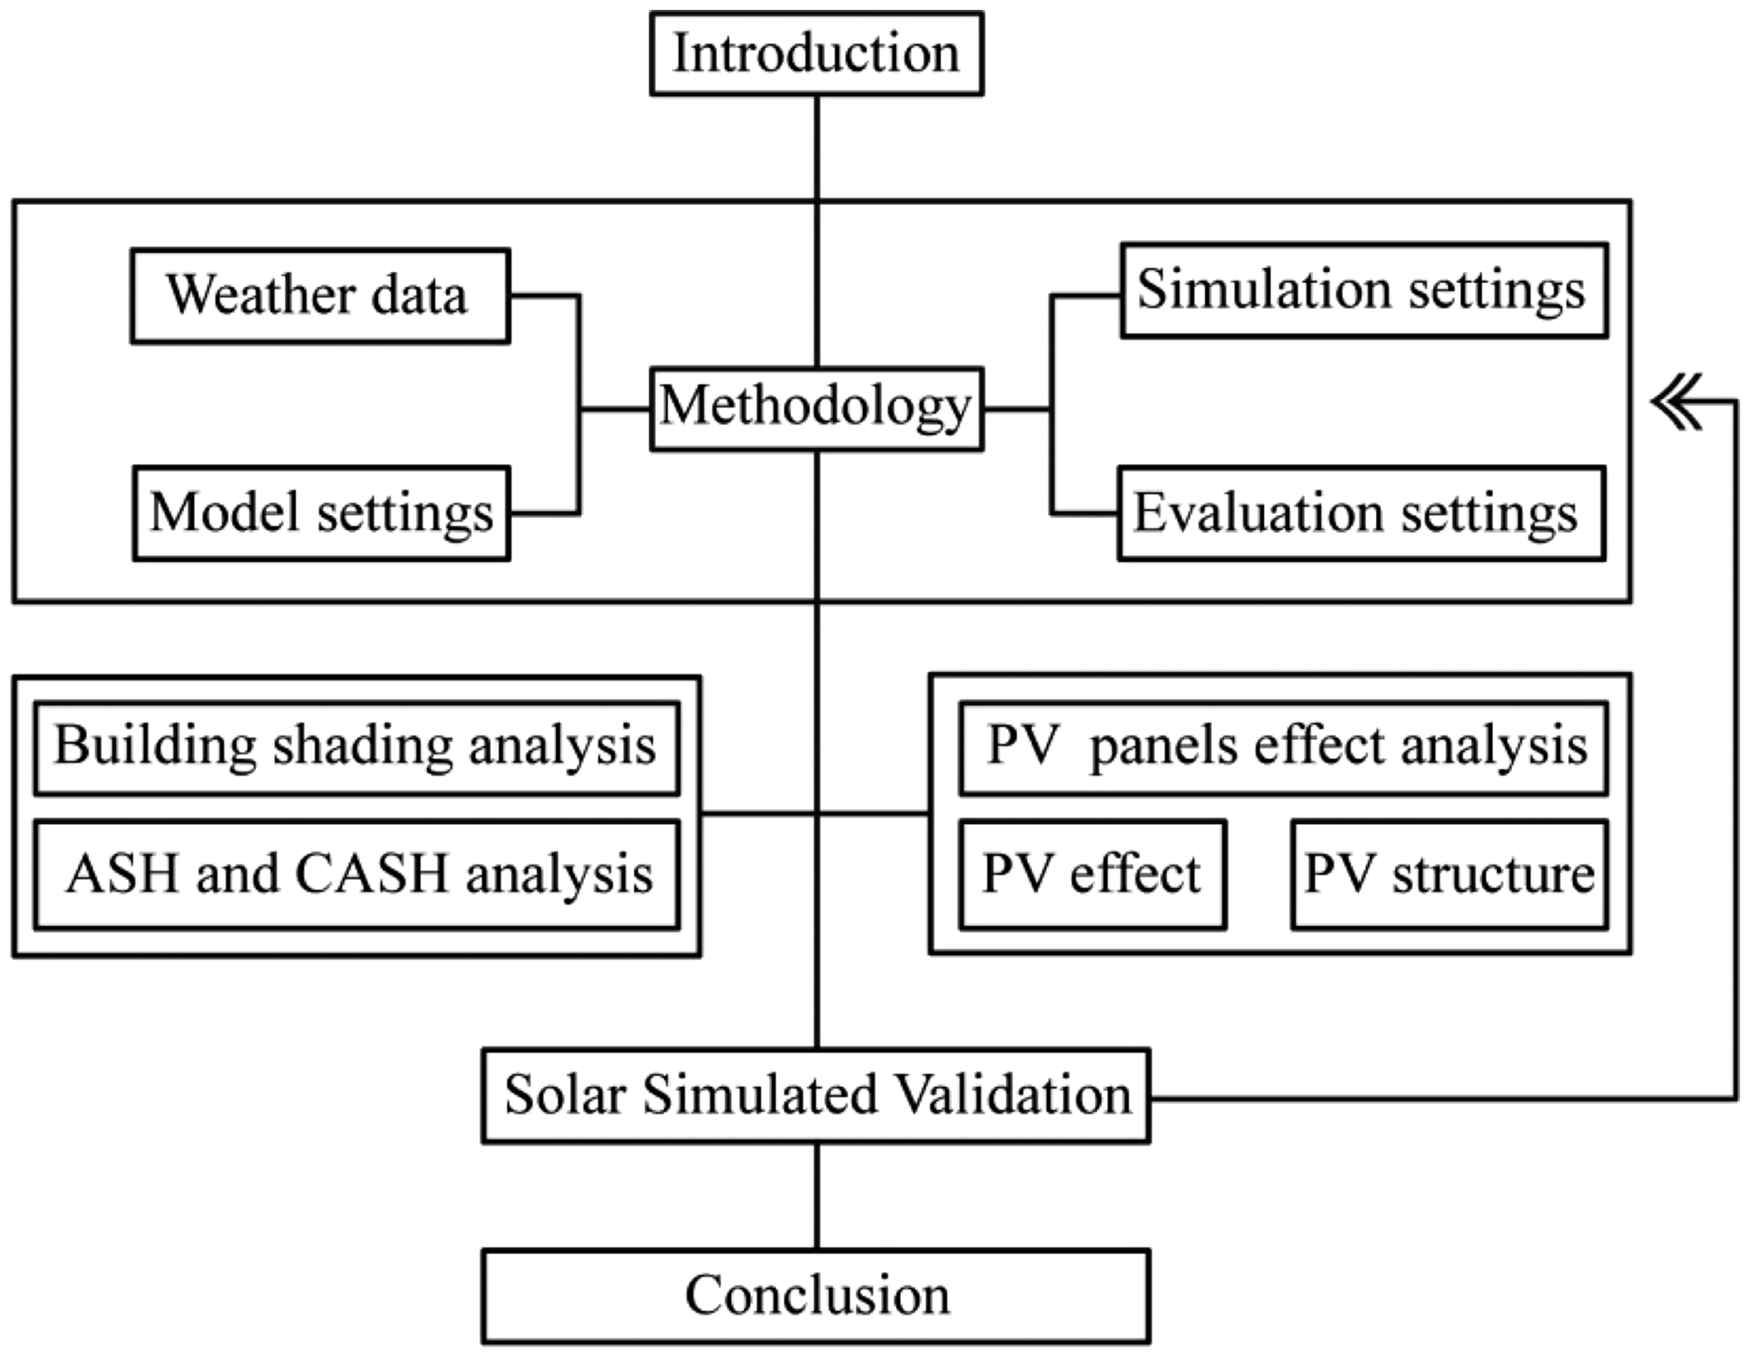
This paper aims to study the impact of building shadowing effect on the BIPV system efficiency in buildings, based on the traditional building energy saving technology. The study uses the energy saving design concept of ‘Generalized Building Energy Efficiency’ that was first proposed by the author. 27 Six podium configurations for mounting support of BIPV and seven high-rise building configurations (mainly shapes) were selected as study objects. The podium refers to an outbuilding that connects to a high-rise building and has a height of no more than 24 m, outside the main projection of the high-rise building. As the podium roof has a larger space, therefore PV system was usually installed on the roof.28,29 The parametric design software Rhinoceros 3D embedded grasshopper plug-in was used to simulate the building shadow condition. Due to the difference in solar elevation angles in different seasons, the winter solstice was chosen as the simulation time in order to explore the most unfavourable situation. Based on the final simulation results, the area ratio of different sunshine time period would be defined as the evaluation criterion. High efficiency of BIPV system could be conducive to save electricity in the building, which in turn would affect the energy consumption of buildings such as the indoor lighting, heating and cooling.
Methodology
Weather data
Tongji Union Square located in Yangpu district of Shanghai was chosen as the site of the study. Geographical position of Shanghai is: 118°46'E, 31°54'N, an average altitude of 7 m, GMT + 8. The related meteorological data were downloaded from the meteorological data stored in the United States NASA Astronomical Database. 30 Shanghai has a northern subtropical and East Asia monsoon climate with four distinct seasons. It has a moderate and mild climate with abundant rainfall, sufficient sunshine. The annual average temperature is 15.8°C. 30 The annual average sunshine hours is 2102 hours. The annual average relative humidity is 77–82%. The annual meteorological data of Shanghai are shown in Tables 1 and 2.
Meteorological data of Shanghai. 30
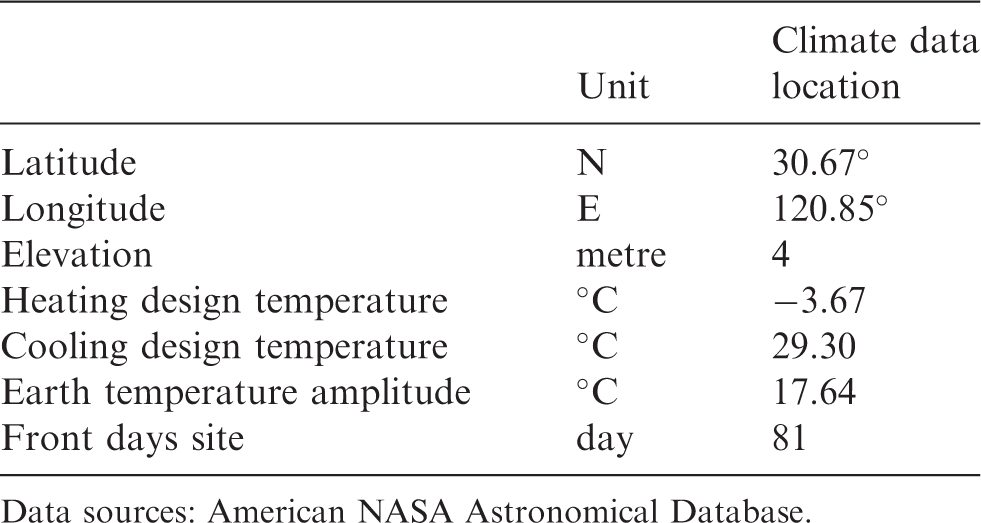
Data sources: American NASA Astronomical Database.
Shanghai's monthly weather data. 30
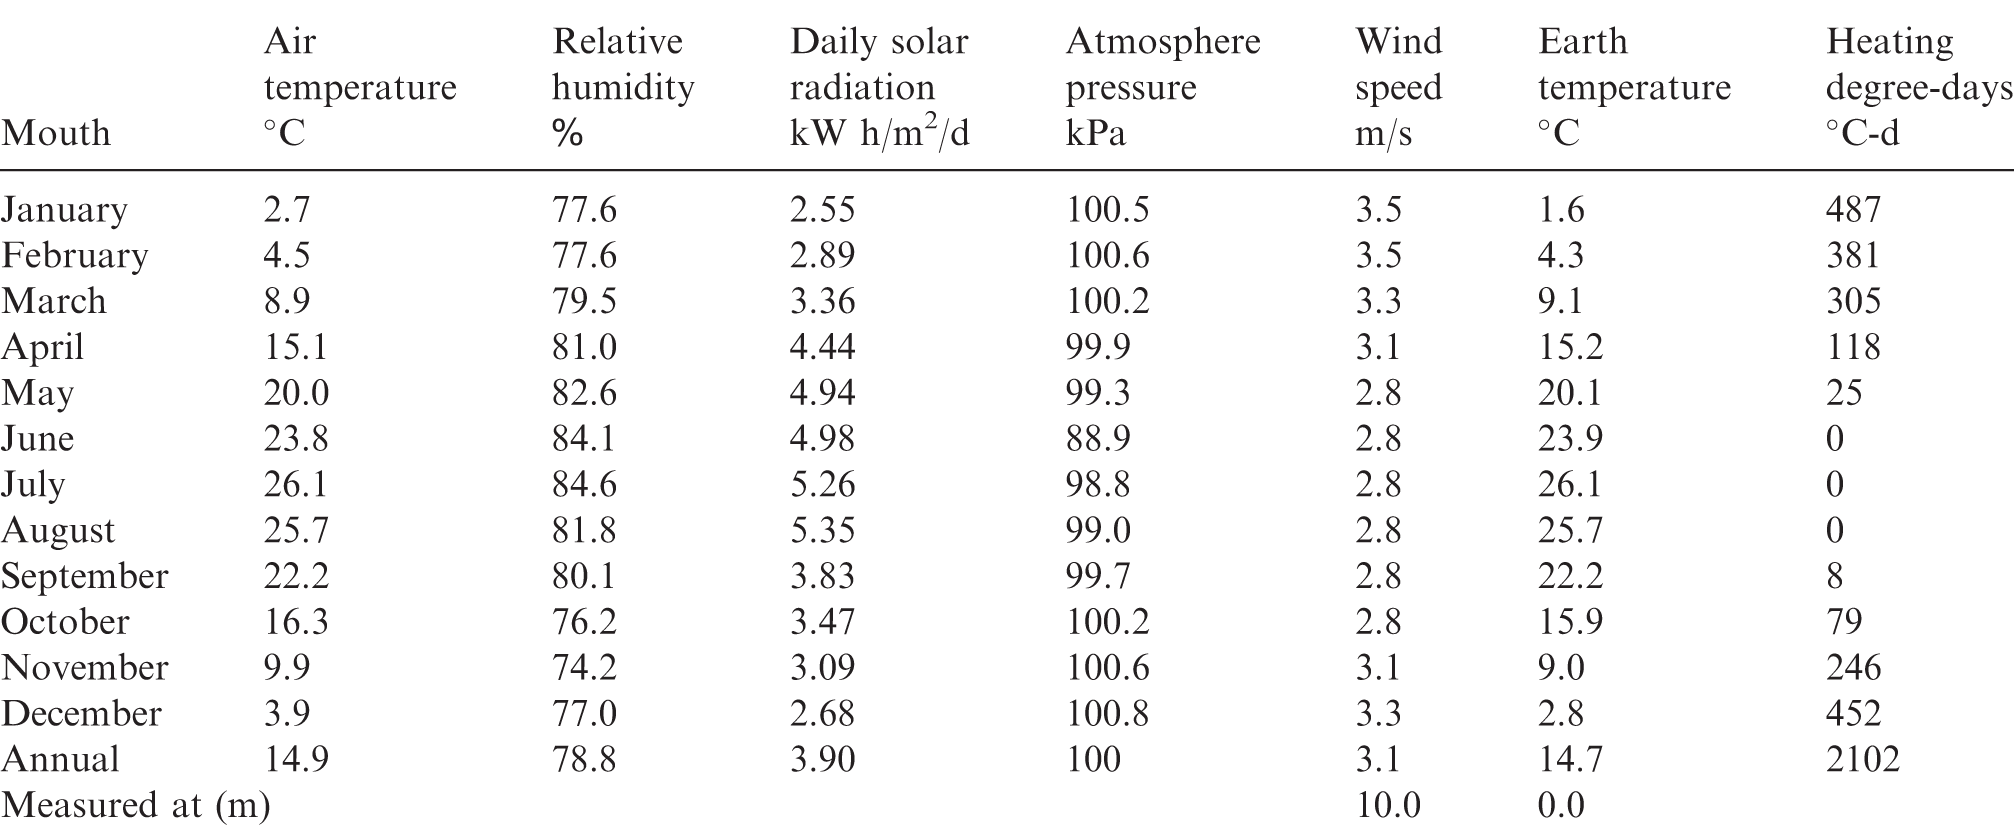
From the above data, the daily average peak sunshine of Shanghai is 3.90 hours, which is similar to the North America. Therefore, it has a potential to exploit and utilize solar energy in Shanghai and is suitable to install solar power system in this area. The highest sun radiation intensity is in May and the value is 184.3 kWh/m2. The lowest sun radiation intensity is in January and the value is 94.4 kWh/m2. The sun radiation all the year round is 1711.2 kWh/m2. The results are consistent with the data from the NASA astronomical database.30,31
As this paper focuses on the building sunshade effect, the winter solstice was chosen as the simulation data. During the winter solstice day, extended period of building shadow with a minimum sun shading effect would occur. Under this most unfavourable circumstance, the sunlight effect between different models was compared.
Model settings
The commercial complex at Tongji University Union Square is the object of this research due to its huge power consumption and building volume. Different combinations of shapes of podium and high-rise buildings were simulated to determine the optimum configuration to maximize efficiency of BIPV system to be mounted on the roof of the building.
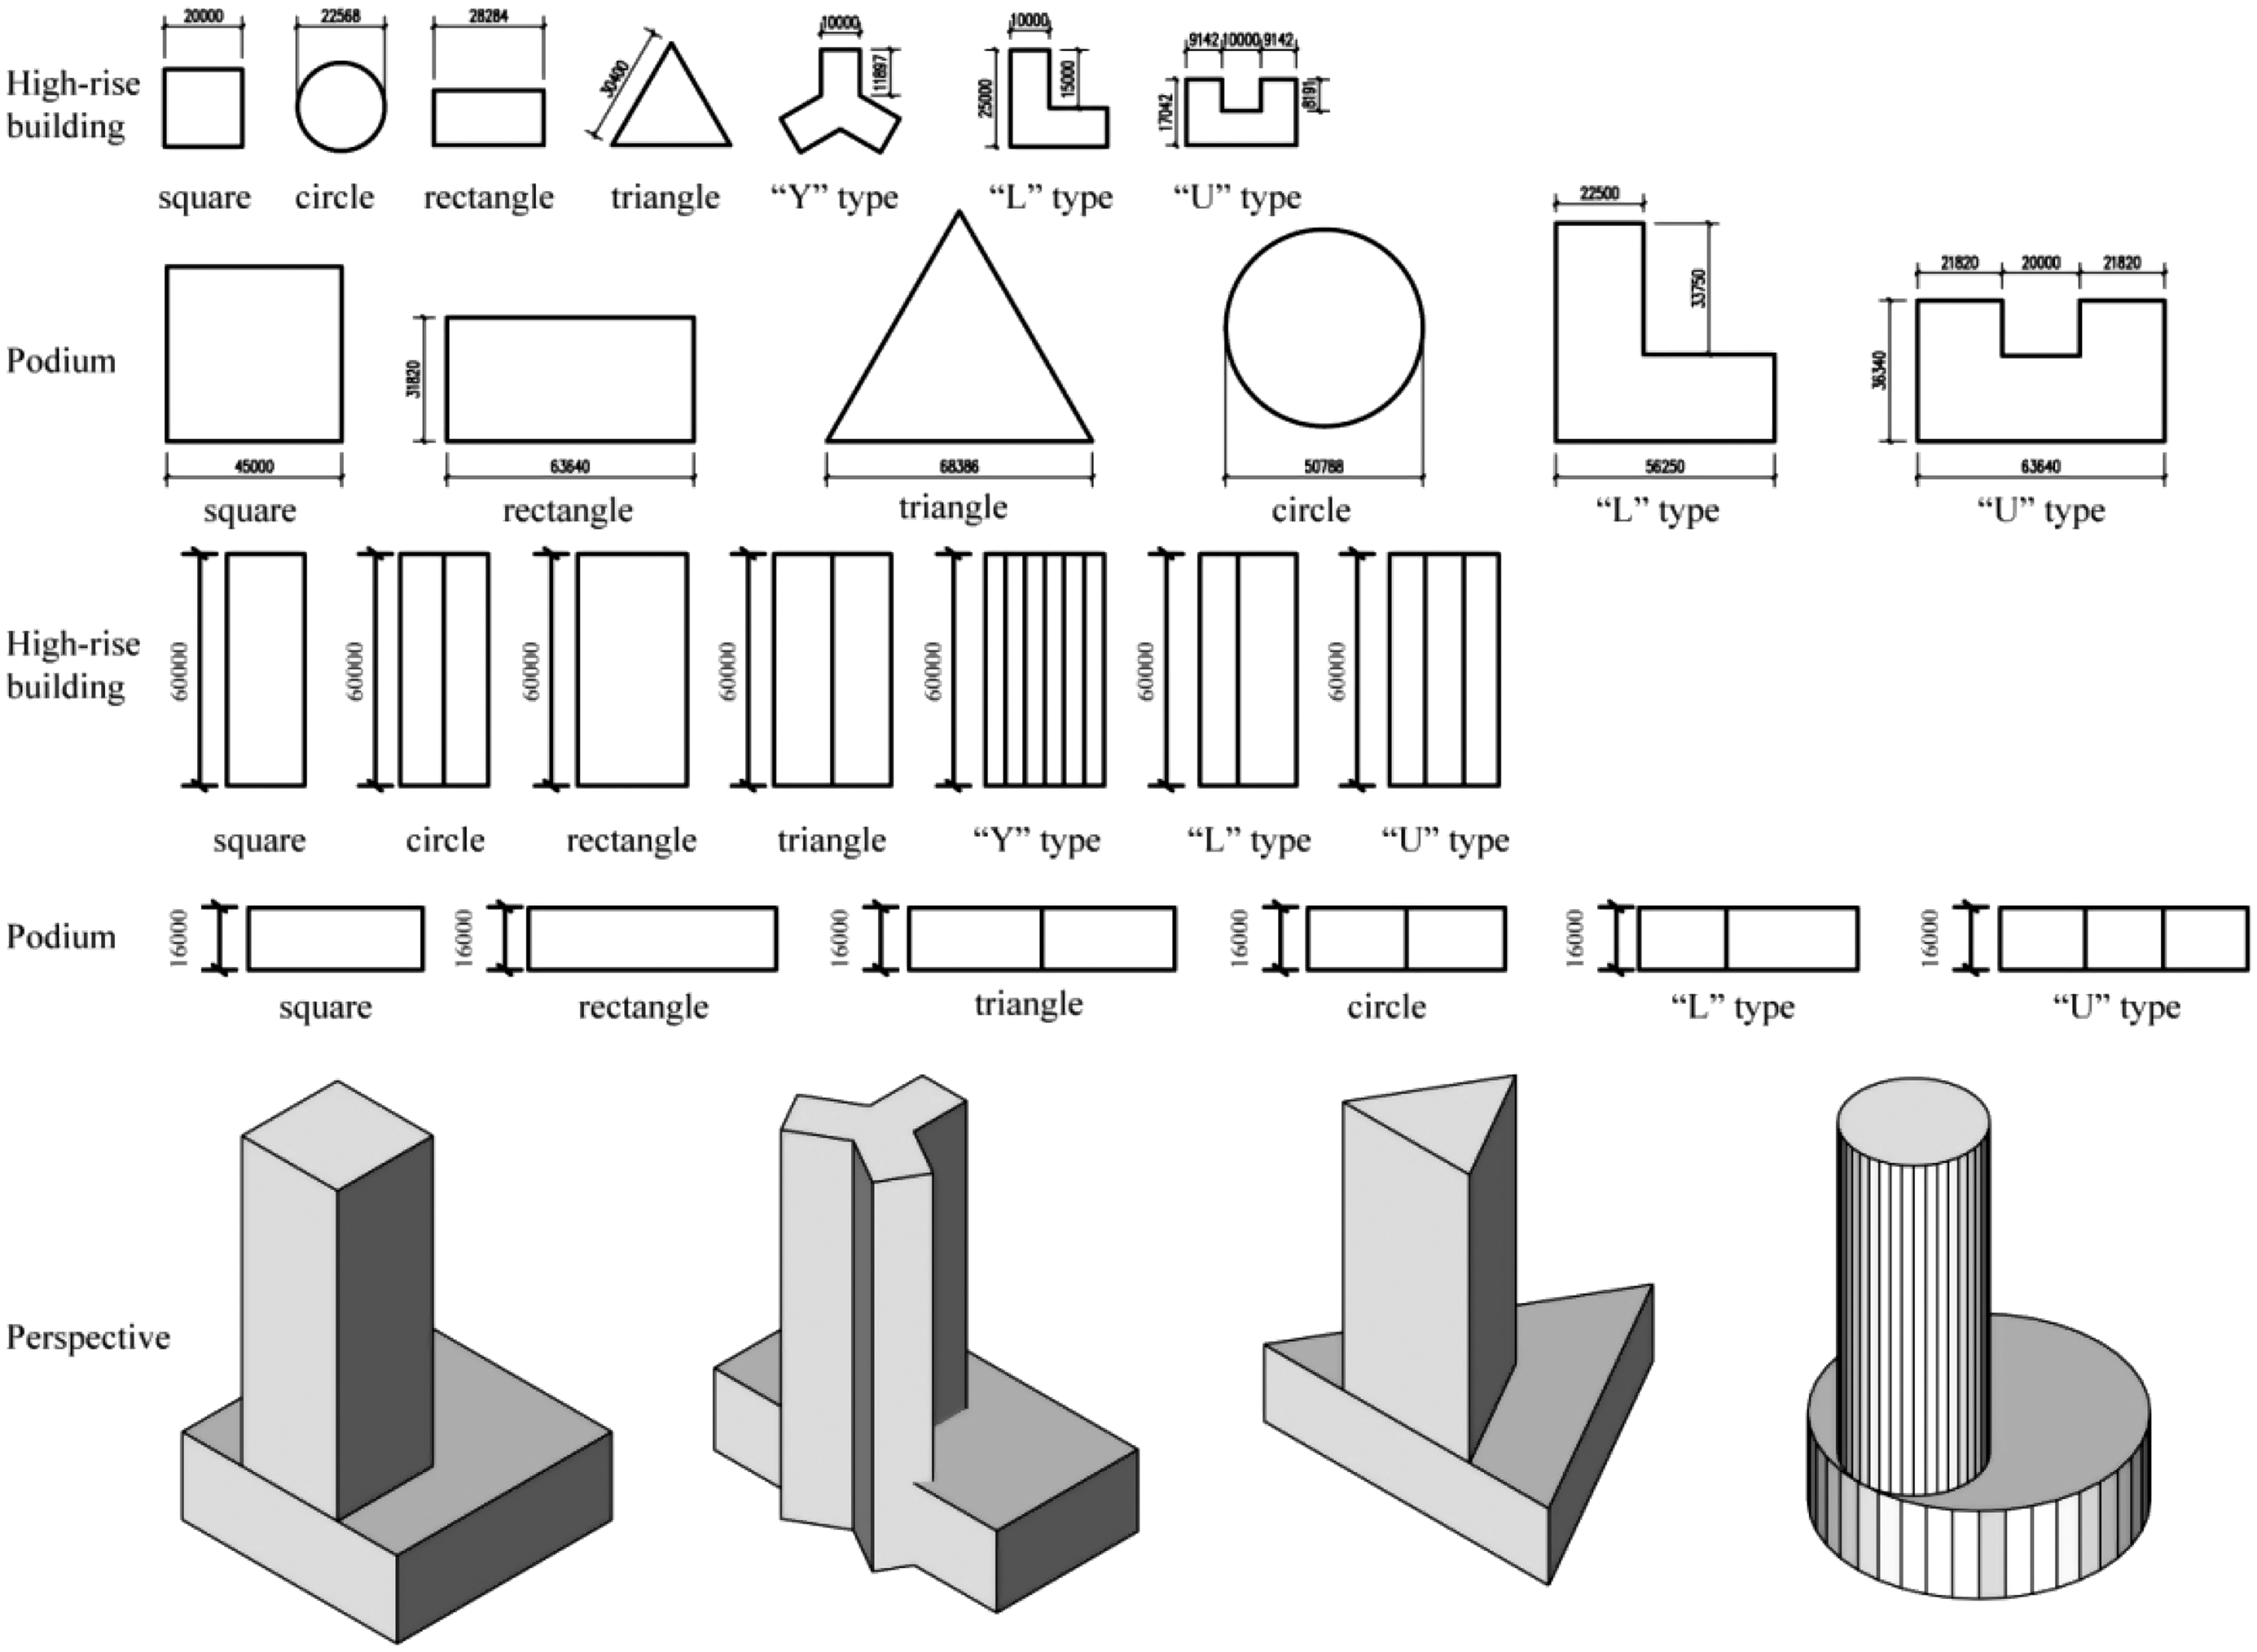
This paper primarily studied the impact of shading on installation of photovoltaic system on a flat roof which is the main roof configuration of the commercial complex. Generally speaking, the commercial complex is a combination of two components which are the high-rise building and the corresponding podium at the bottom of the complex. The podium configuration can be mainly divided into two types which are centralized and transition. These are as shown in Figure 1. On the other hand, these two types can be further divided into six forms such as square, rectangle, triangle, circle, ‘L’ type and ‘U’ type. Apart from the above, high-rise buildings can be separated into seven configurations according to plan shapes that are square, rectangle, triangle, circle, ‘Y’ type, ‘L’ type and ‘U’ type. All simulation cases were a combination of the above podium with different shapes of high-rise building and these are illustrated in Figure 1.
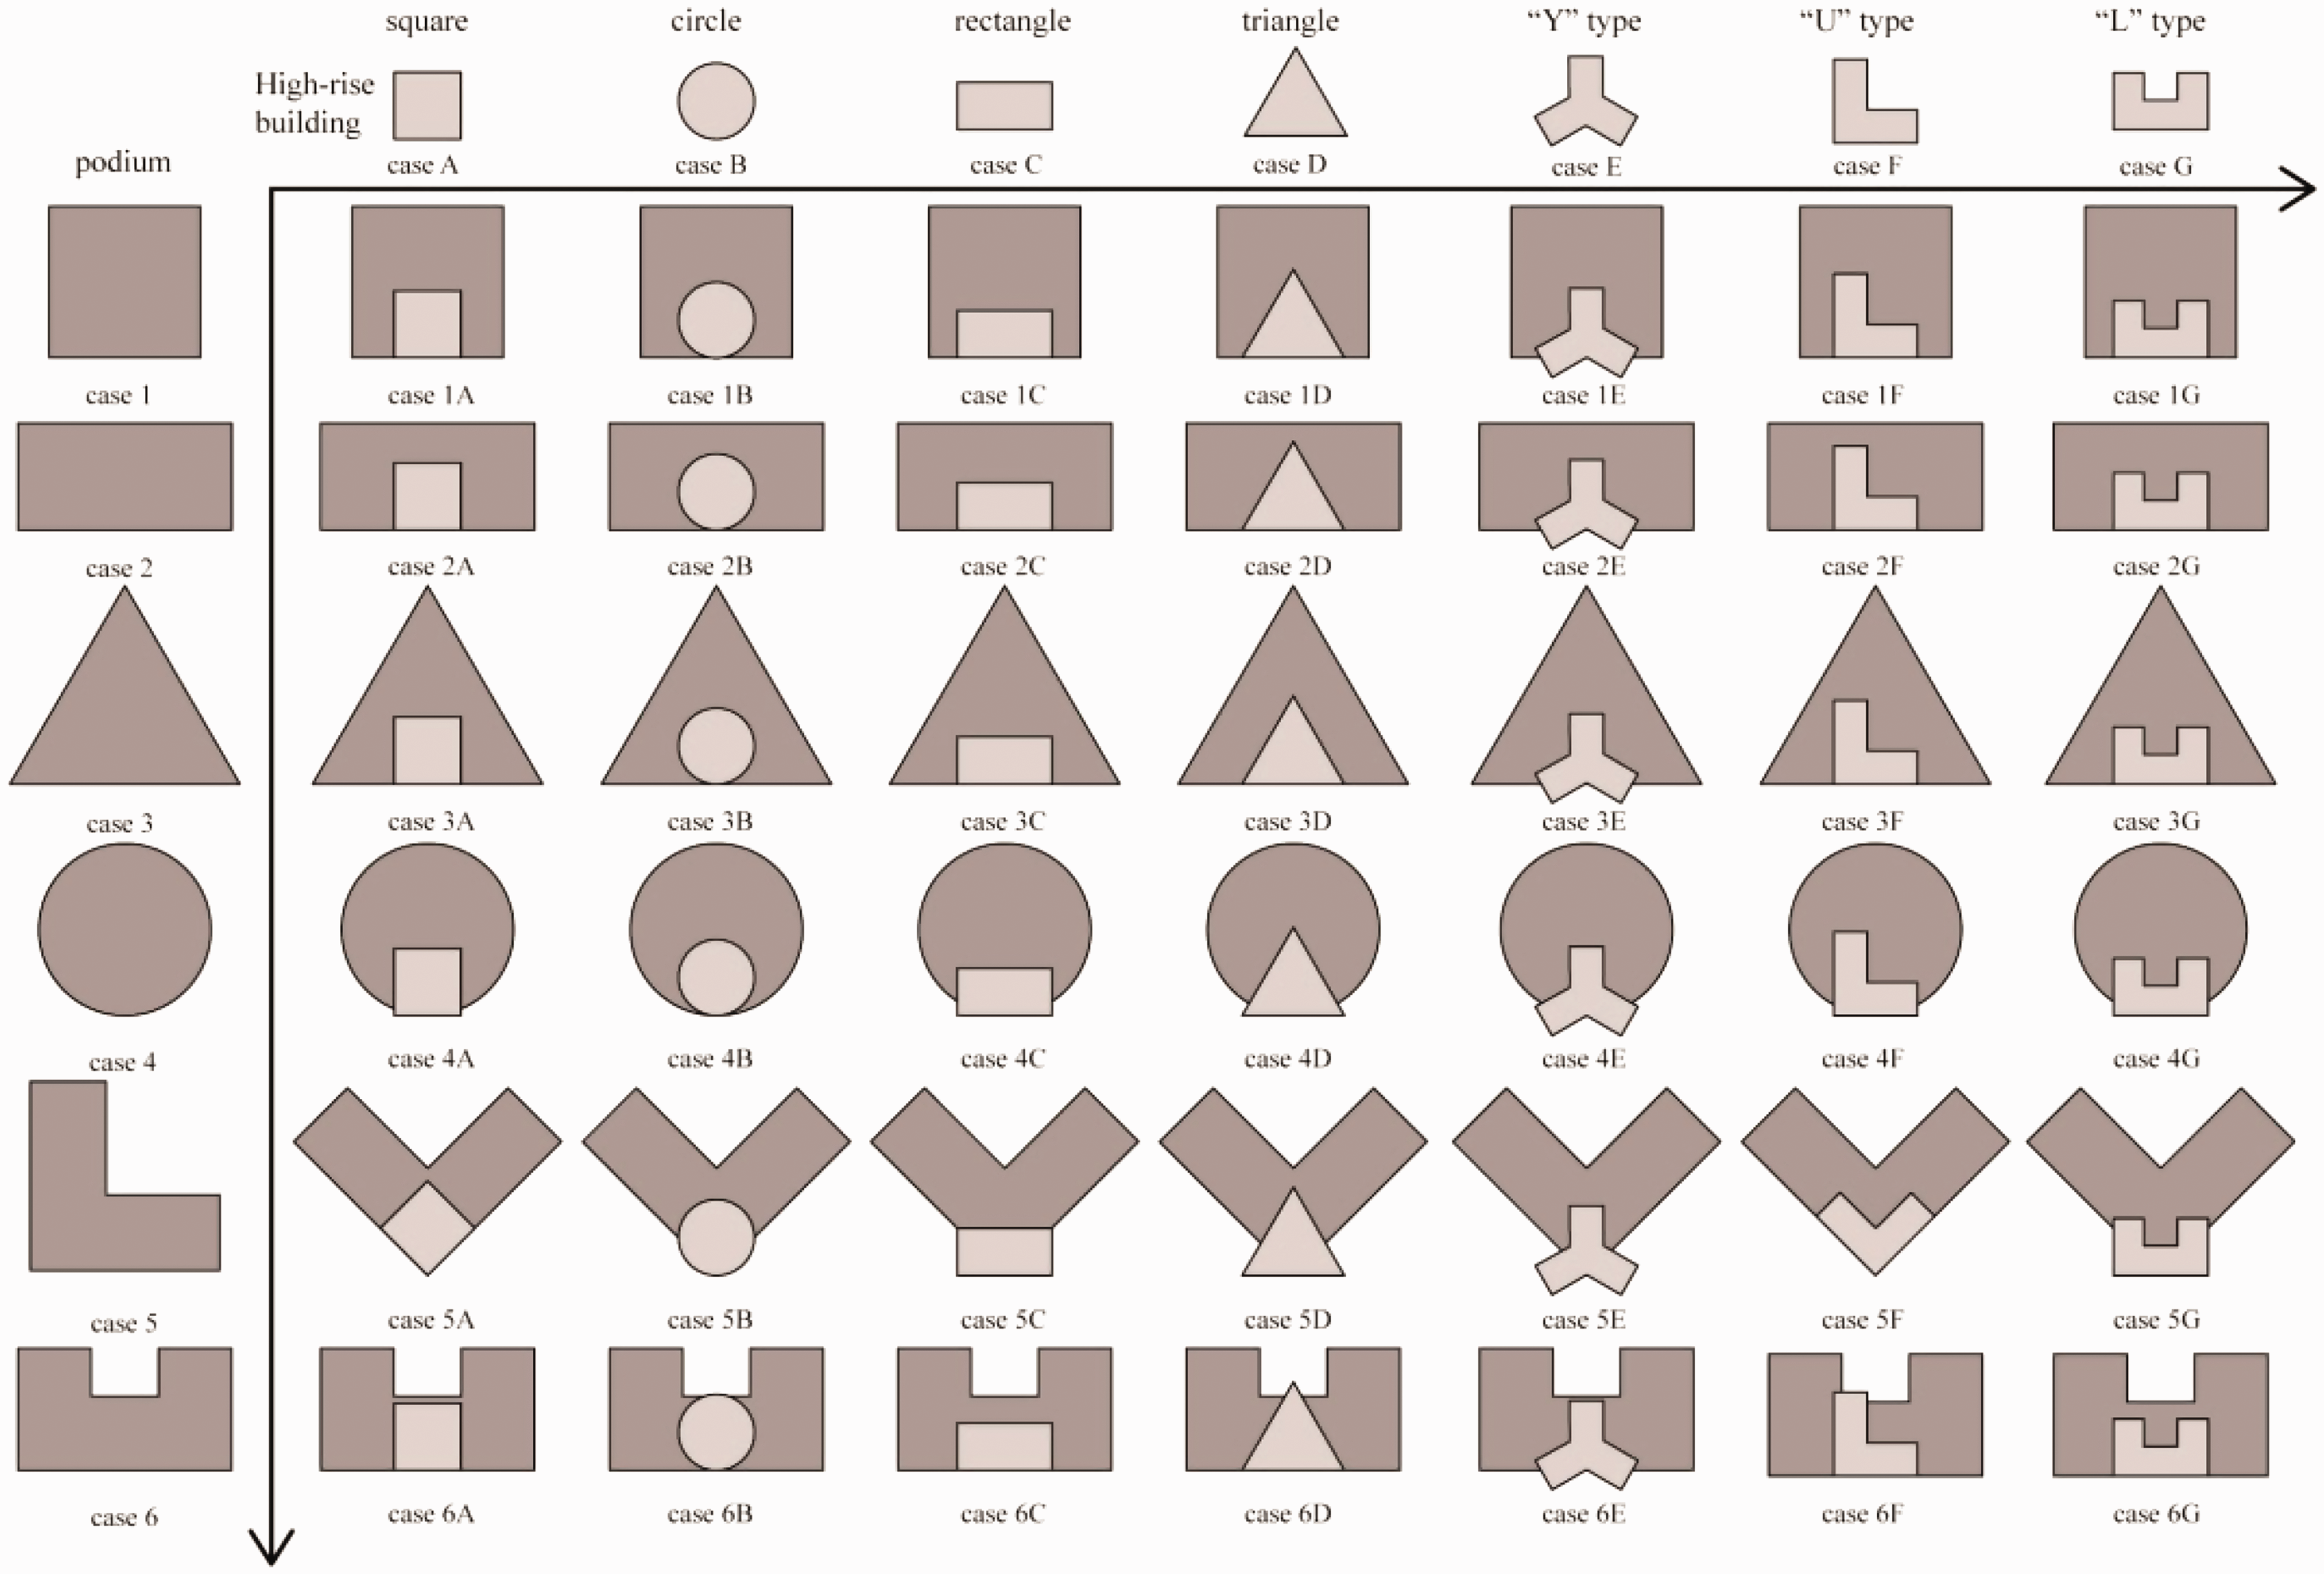
Simulation cases of different combination of the building and podium shapes for BIPV efficiency in a high-rise building.
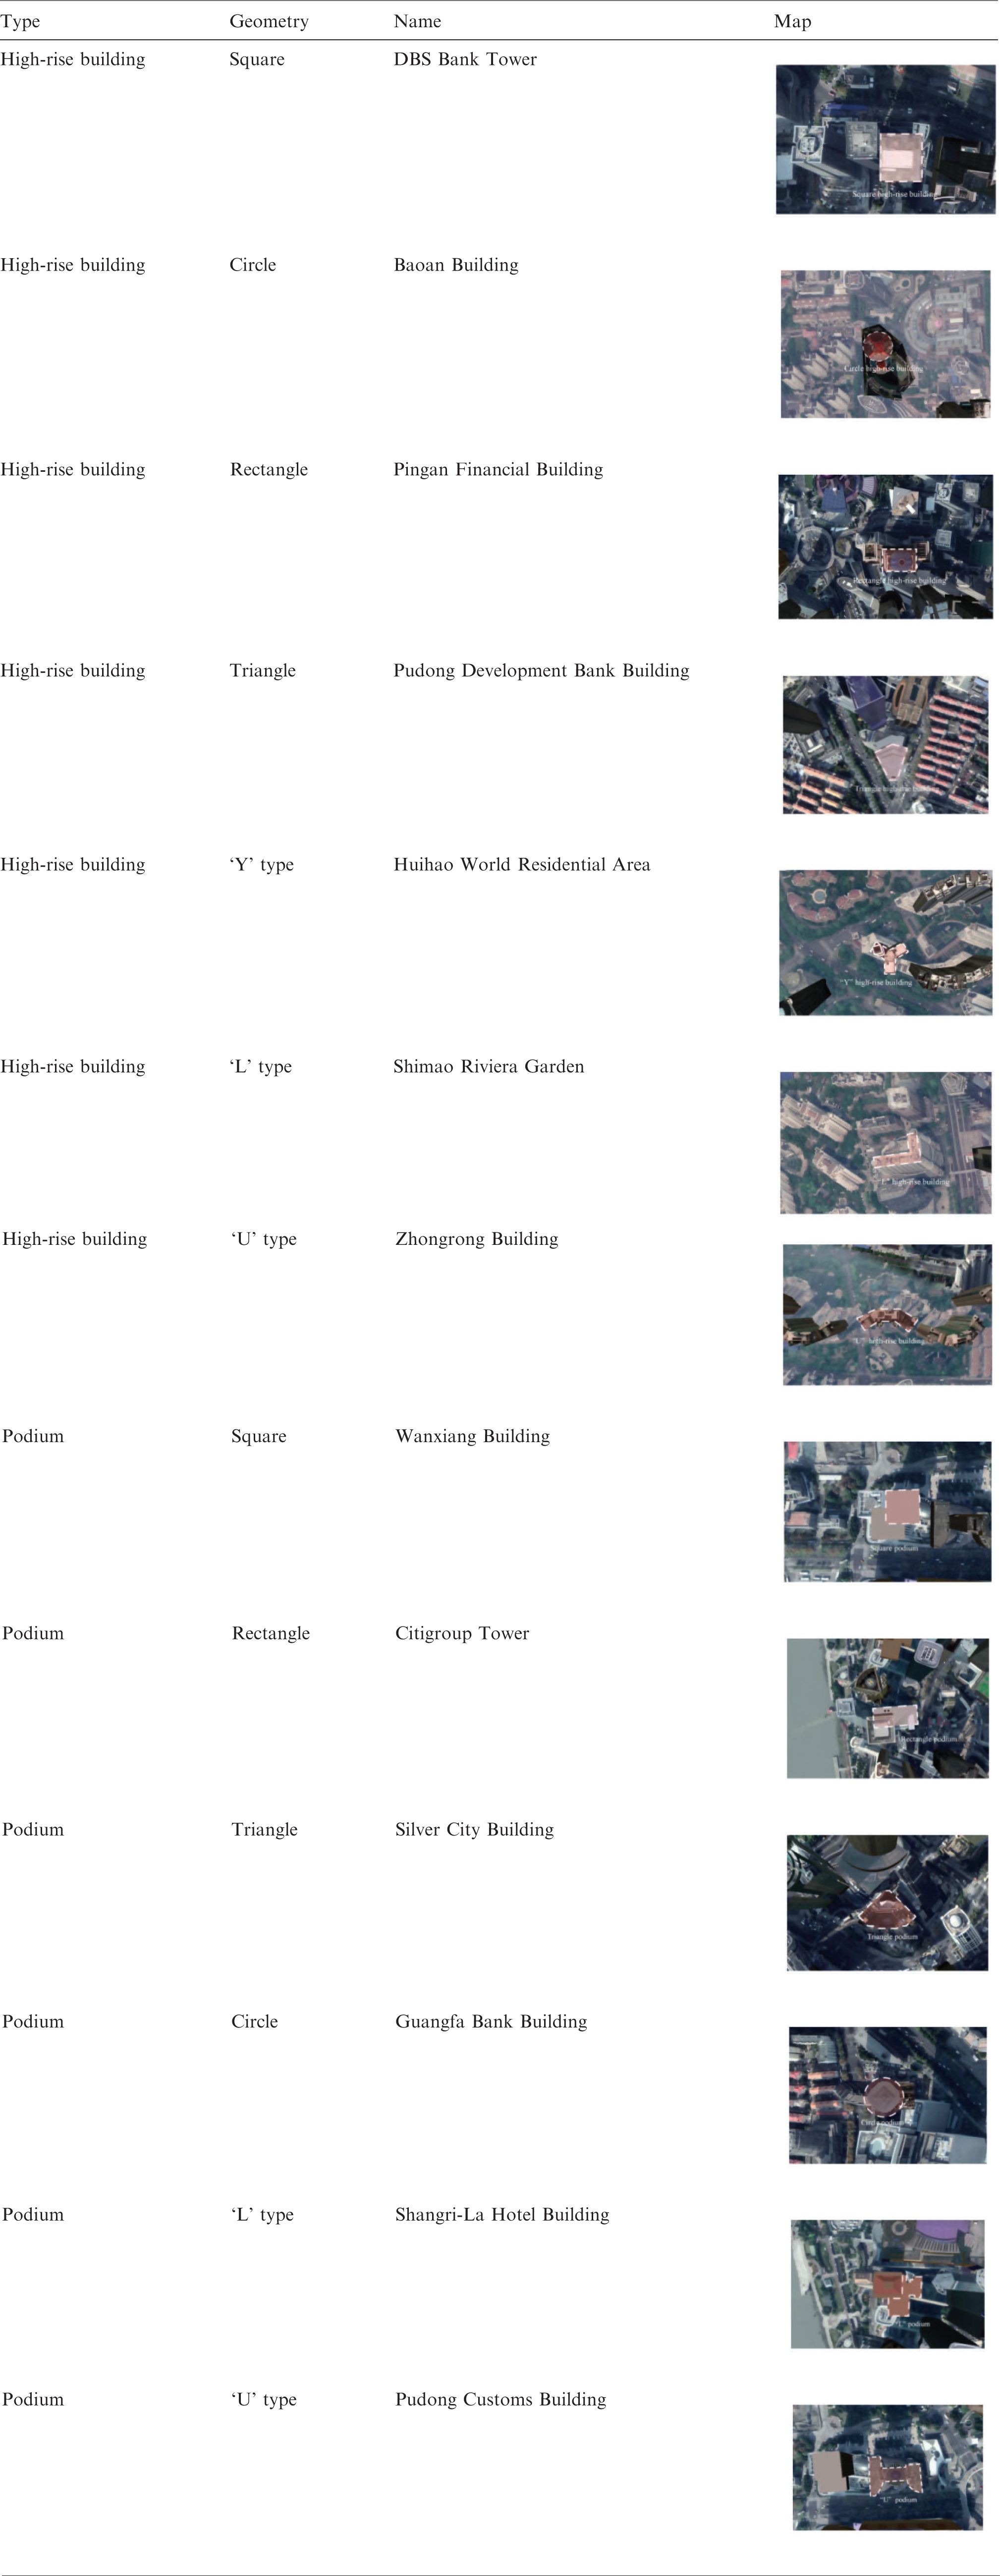
These cases are designed basing on the shape statistics of commercial complex in Shanghai. In order to study more efficiently and comprehensively, all shapes of the high-rise building and podium were simplified to approximate geometry shapes. Table 3 displays some typical architecture shapes of buildings in shanghai. Although actual buildings may not be completely the same with these shapes, architectural configurations could be approximately regarded as one of the above forms. Therefore, other research could replicate and utilize these results after simplifying the building's form. Finally, solar utilization efficiency can be studied by different complex configurations comparison.
Some typical actual architecture shapes in Shanghai.
In addition, based on the statistics of the relationship of floor levels and podium area in the commercial complex as represented in Figure 2, the sizes of different cases for the study were set as shown in Figure 3.
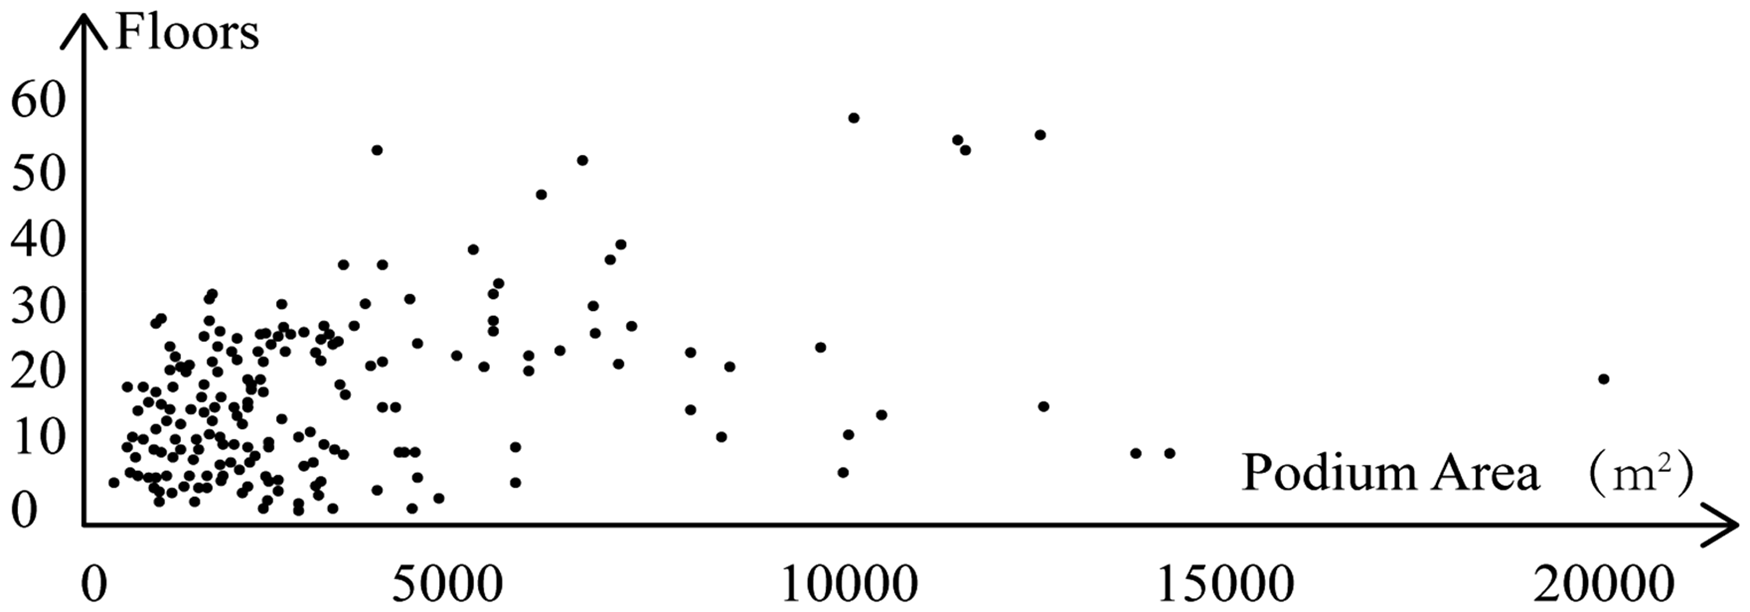
The relationship between high-rise building floor levels and podium areas.
Specific size of every building.
As shown in Figure 1, the podium was divided into six configurations of square, rectangle, triangle, circle, ‘L’ type and ‘U’ type. Furthermore, high-rise buildings areas were divided into seven shapes as shown in Figure 1, which are square, circle, rectangle, triangle, ‘Y’ type, ‘U’ type and ‘L’ type. The types of podium were named as case 1 to case 6 and the high-rise buildings were divided into case A to case G. Therefore, there were 42 configurations of buildings formed by different combinations of different shapes of high-rise buildings and podiums, which were divided into case 1A to case 6G. The purpose of this article is to study the different high-rise building shading effects on a variety of podiums. Taking into the consideration of this purpose, each of the high-rise buildings should have the largest cross-section while ensuring the maximum overlap with the podium, to produce the most shadow effect. Hence, every high-rise building was located at the middle of the southernmost part of the podium while ensuring the most overlapping and cross-section area with podiums.
The relationship between high-rise building floor levels and podium area is shown in Figure 2. Most of the high-rise commercial complexes have around 20 floor levels (storeys), and most of the podium areas are between 0 and 5000 m2. According to the above, the model was set to have 20 floor levels for a high-rise building with a 2000 m2 podium area to simulate the sun shading effect. The specific sizes of every building are presented in Figure 3.
In order to study the shading effect accurately, podium areas and high-rise building heights were set the same as each other, which are 2000 m2 and 60,000 m, respectively. Apart from this, all high-rise building areas were about 400 m2 and podiums heights were 16,000 m. Although the high-rise buildings and podiums are different in shape, they are definitely identical in area and height. In this case, the sun shading effect on podium roof due to different shapes of high-rise buildings can be studied and would avoid interference by other impact factors.
Simulation settings
The software Rhinoceros 3D (Rhino) embedded in plug-in grasshopper (GH) and ladybug were applied in this study to simulate the sun shadow conditions. Rhinoceros 3D (Robert McNeel & Associates, USA) is an industrial modelling design software based on the NURBS (Non-Uniform Rational B-Splines), which is different to software of sketch up for designers, architects and students. The grasshopper is a ‘graphical algorithm editor’ plug-in for Rhinoceros for the parametric design. The mechanism of GH operation is to use nodes to store and cope with virtual data, and then connect nodes to form flow to control the modelling process. The generative modelling procedure was based on data link and arithmetic module, which is controlled by a graphical algorithm editor closely combined with modelling software Rhinoceros. The graphical algorithm editor in GH can be divided into two types as follows which is shown in Figure 4.
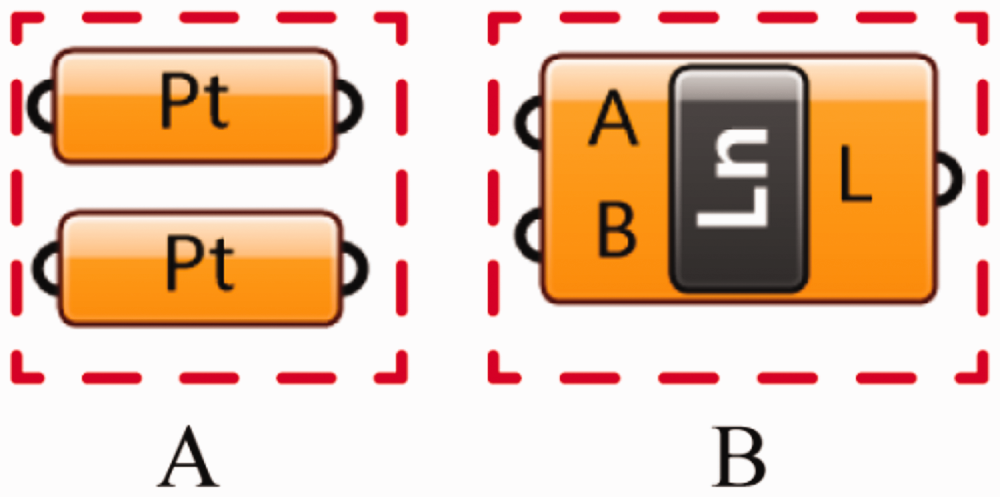
Graphical algorithm editors. (a) Parameters (b) Components.
The parameters editor is responsible for the storage of data and the components editor is responsible for processing data. 32 In the operation process, the data were input into the parameter editor at the beginning, and then the data were calculated using the components editor which finally output results. A parameter is imperative for the whole process which controls the important properties of generated results. The parameter can be a data type such as geometry, numeric, Boolean (True/False), or a string. Apart from this, GH can also be embedded in some plug-ins in order to simulate the building energy efficiency issues such as Ladybug which was employed in this study.
Ladybug 33 is a plug-in of GH for environmental analysis. This facilitates the process of environmental design analysis by integrating weather data analysis and precise simulation in a parametric way. Through this plug-in, it can visualize the weather data and also analyse the radiation and sunlight hours condition. Energy and daylight modelling can also be evaluated by using validated simulation engines such as EnergyPlus, RADIANCE 34 and Daysim. 35 The computational flow of this paper was made up of various parameters and components and is illustrated in Figure 5.
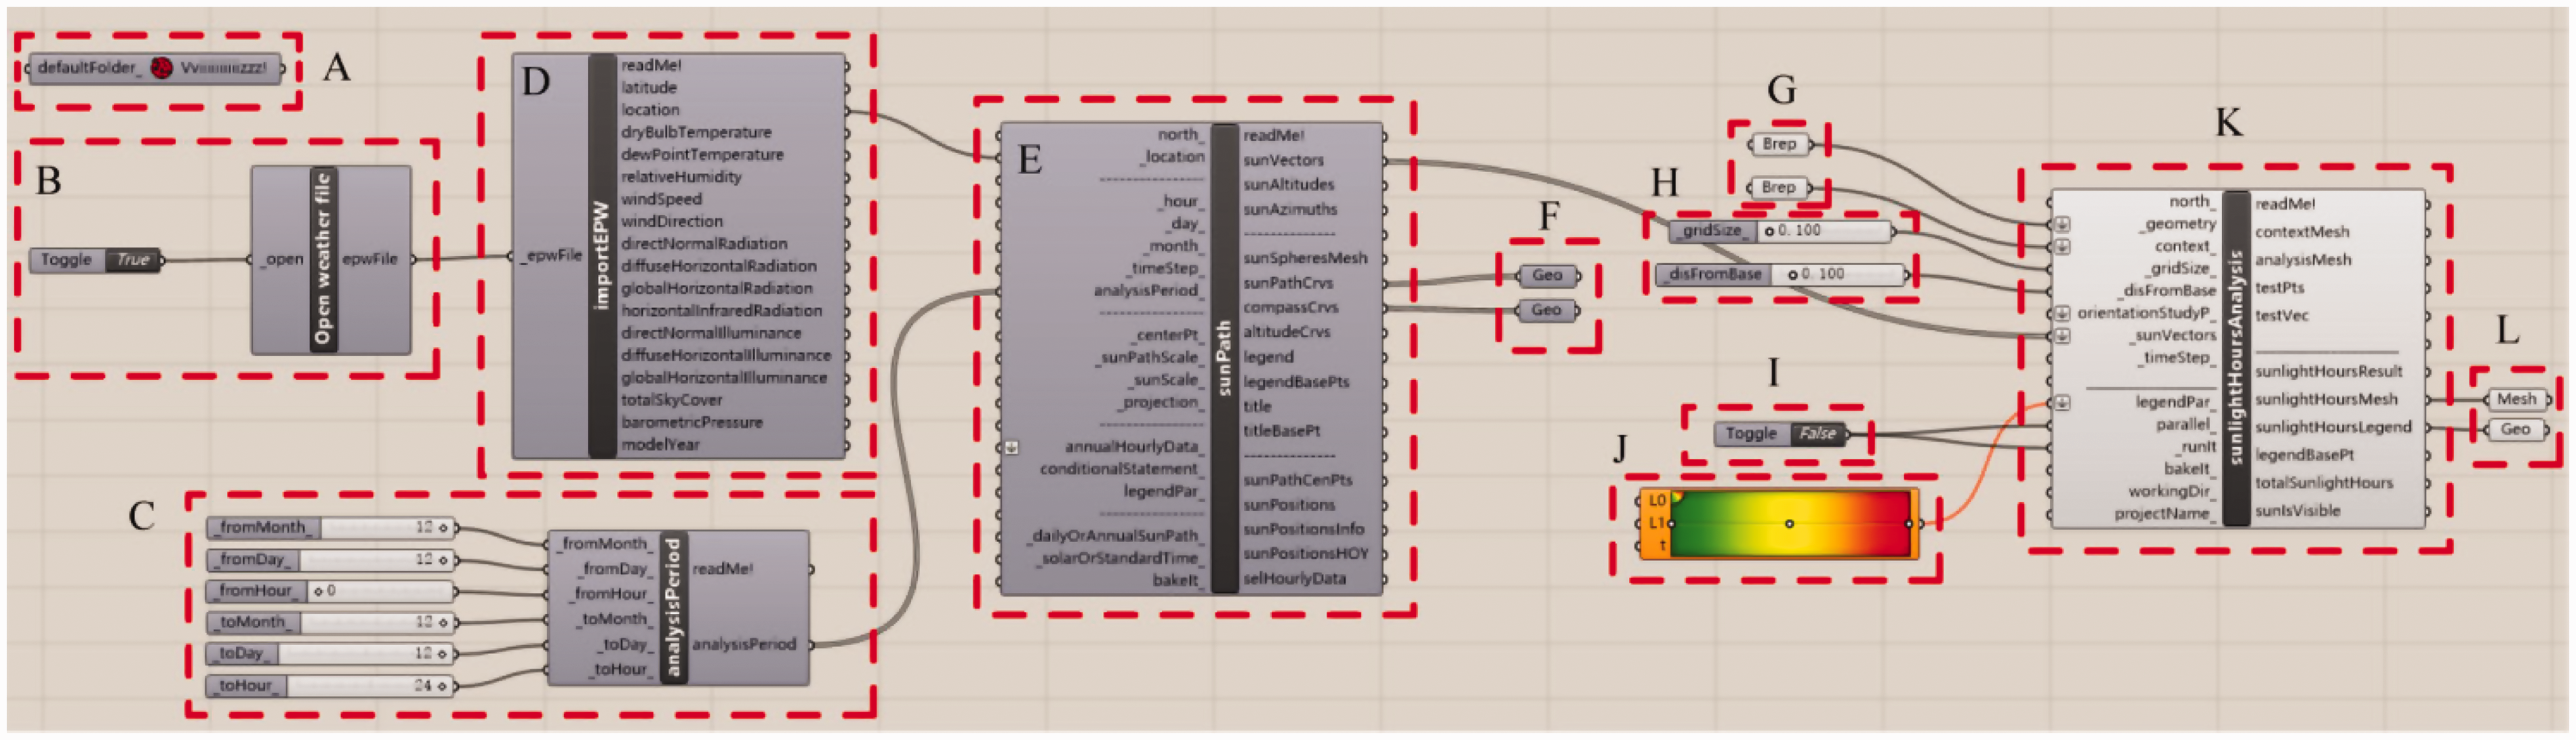
Whole computational flow and every battery function.
Every battery function given in Figure 5, is detailed as follows.
A: Main switch B: Import the weather data C: Set calculation period D: Load weather data information E: Sun path calculation equipment F: Sun path information visualized G: Buildings H: Analysis accuracy I: Running switch on/off J: Legend colour display setting K: Sun hour analysis calculator L: Sun hour calculation results visualized. All of the above consist of the whole computational flow to calculate the sunlight time of different models under various building shadows.
Evaluation settings
All calculations are guaranteed to be authentic and the software is accurately verified. Therefore, all compute results illustrate a high-level of credibility. The analysis method of results utilized a CFD (computational fluent dynamic) methodology and based on a correlative assessment standard, which has been proven to be an efficient analytical method.36,37
To evaluate the sun shadow effects, this study used the sunlight hours as the measurement standard. The sunlight hours can be considered as the cumulative time of the day when a point on the roof is illuminated by the sun. However, taking the consideration of this research problem, this study defined a new concept as the area ratio of sunshine hours (ASH). It represents the area ratio of sunlight hours in each time period on the roof and was calculated as shown in equation (1)

In order to compare the mean sun shadow effect of different models, the cumulative area ratio of sunlight hours (CASH) was defined and calculated by equation (2)

ASH can reflect the distribution of sunlight hours under different time period and CASH represents the overall sun shading effects of different models. The time period for ASH measurement is one hour (1–2 hour, 2–3 hour, 3–4 hour….). Moreover, the time slot for CASH measurement is lower than some hours (<1 hour < 2 hour < 3 hour….). When the percentage of CASH is bigger, the sun shadow effect is better and then the PV efficiency is worst. According to statistics of ASH and CASH, the comprehensive sun shading effect for models could be efficiently studied.
In order to elaborate research results more precisely, a technical route image was added in methodology as shown in Figure 6.
Technical route.
Results and discussion
ASH comparison
Generally, from Figure 7, all cases were shown to have different sunlight shadow characteristics on the square podium building. Among them, there is no area where the sunlight time is below 3 hours under case 1D and in other cases, the sunlight time area started from 0 hour. The analysis of the ASH condition under these cases shows the ASH distribution condition of case 1A is similar with the case 1C, in which ASH is mostly under 5 hours. However, ASH of case 1B is different with case 1A and 1C and the most sunlight hour is 6 hours and the ASH under 10 hours is also bigger than the above two cases. Apart from this, case 1F and 1G ASH under lower sunlight time are bigger than the ASH with a longer sunlight time period. Furthermore, ASH in cases 1D and 1E mainly lie in the range of more than 4 hours of sunlight time. Thus, from Figure 7, for square podium, the ‘L’ and ‘U’ types high-rise building are not conducive to the PV efficiency. The PV should be located on the podium roof as a result and that the sunshine time distribution would be relatively uniform; and the shorter sunlight time period would account for a larger area under this situation of ‘L’ and ‘U’ types high-rise building. In contrast, other types of high-rise buildings can be conducive to the efficiency of BIPV since most area of the podium roof would be exposed to the sunshine in a better situation.
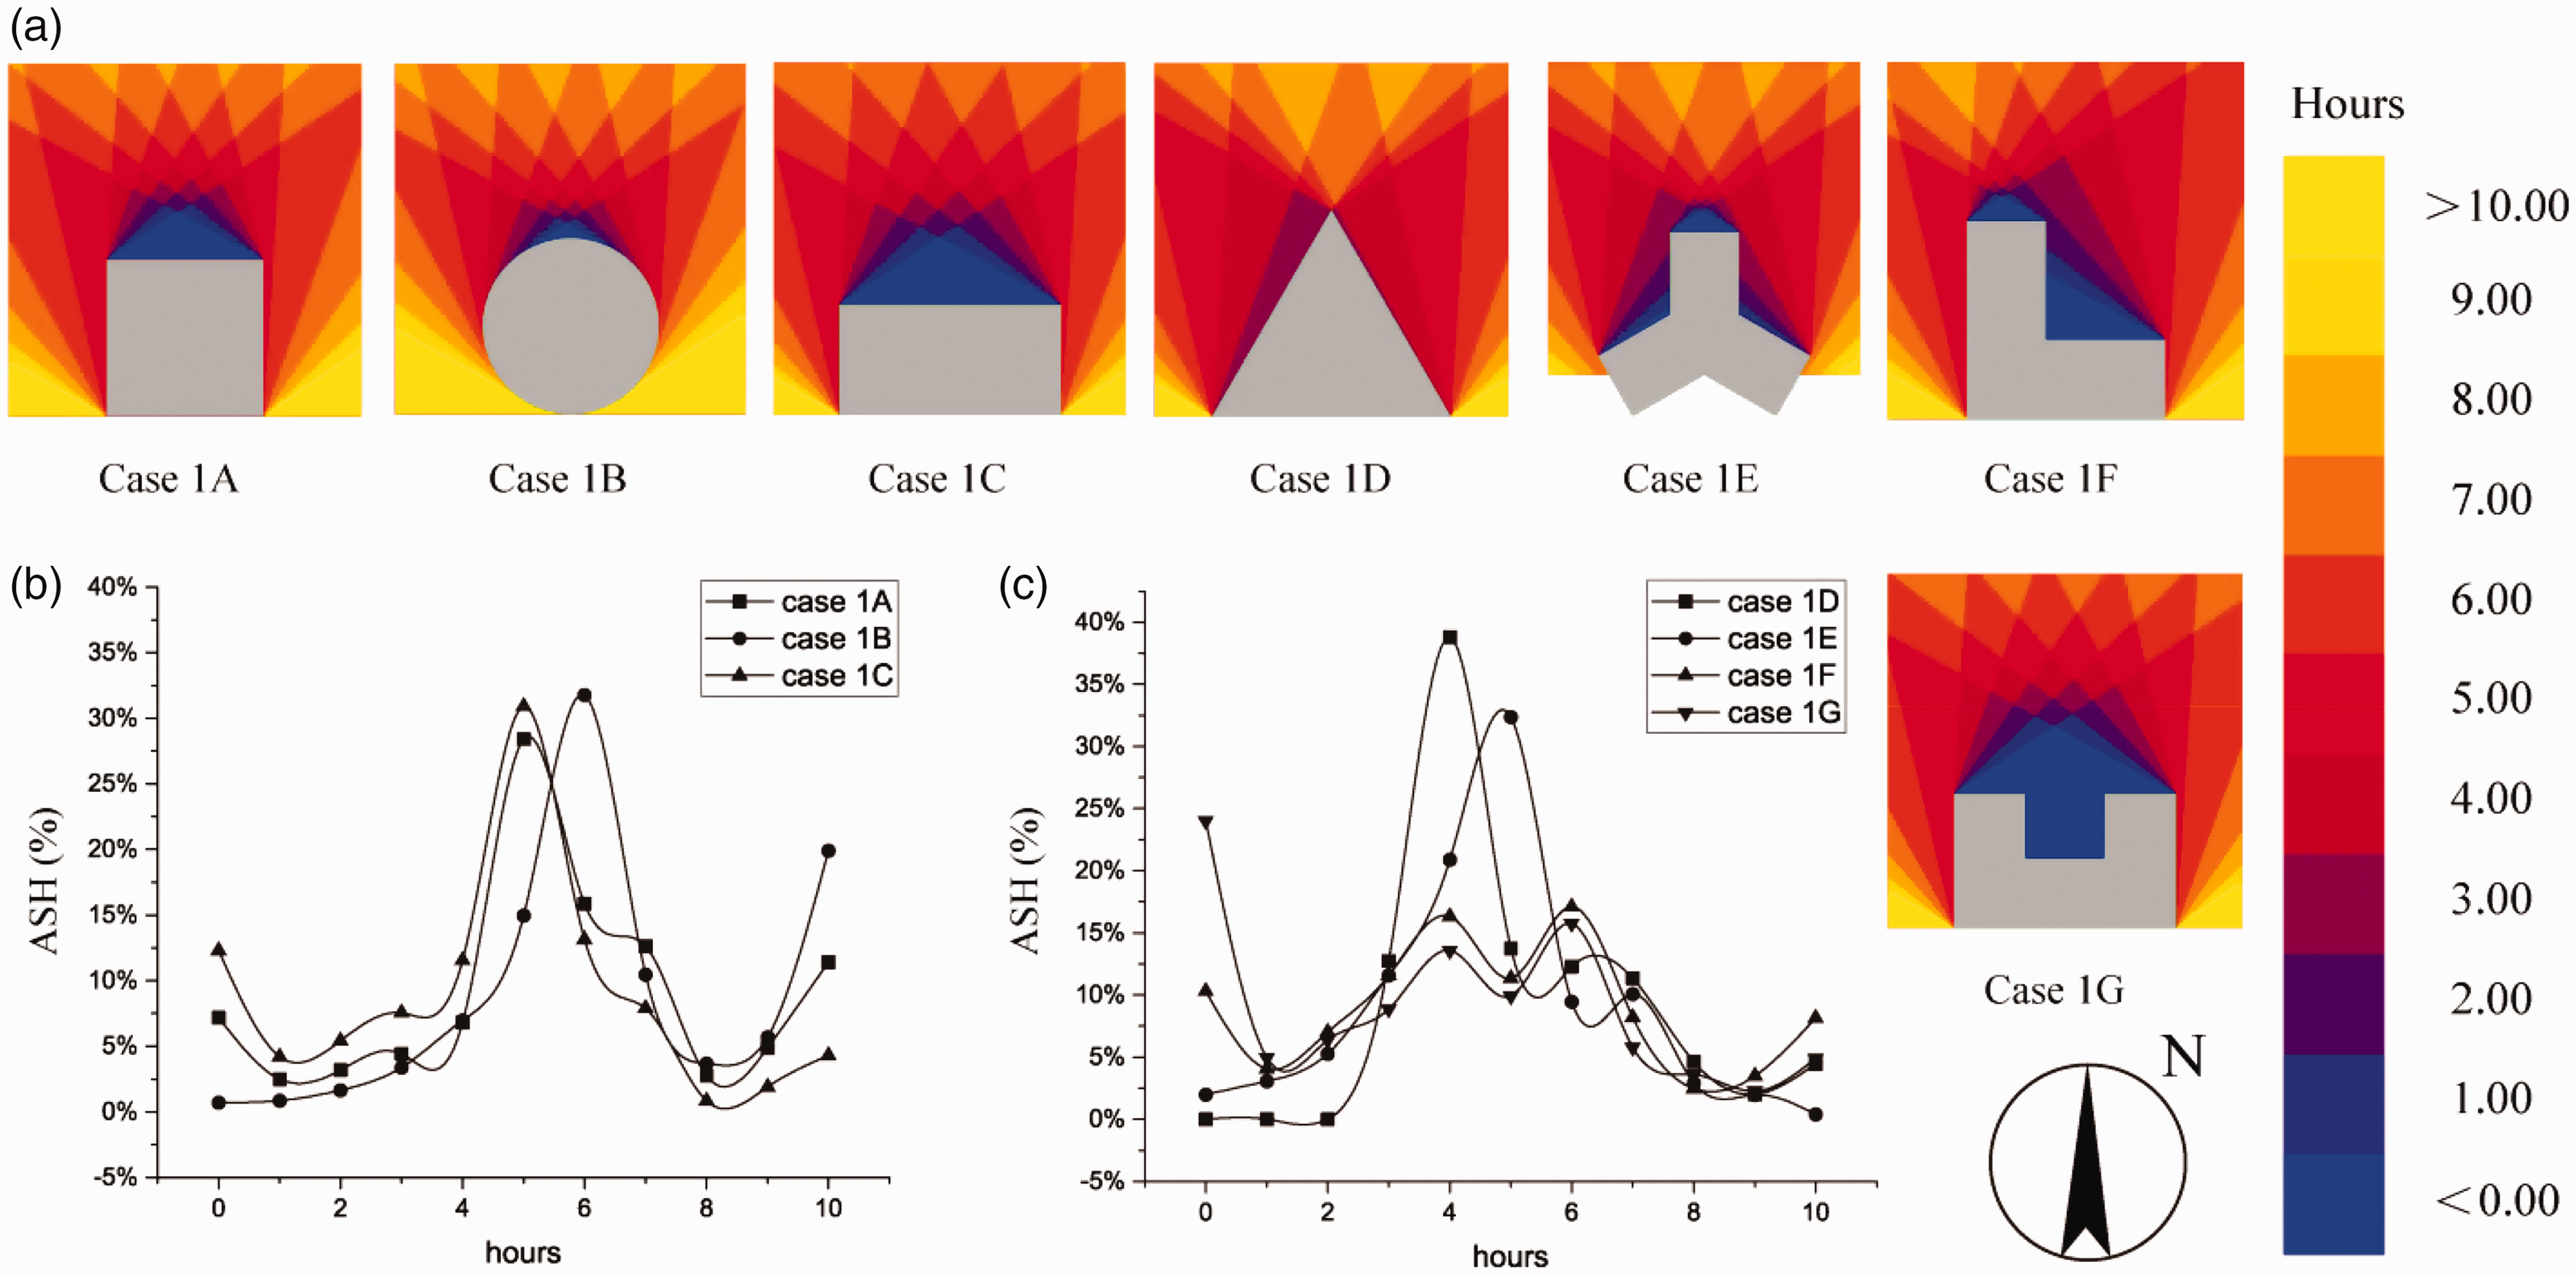
ASH condition of case 1. (a) Sunlight condition, (b) ASH condition from A to C and (c) ASH condition from D to G.
Figure 8 shows the comparison of ASH condition of high-rise buildings under rectangle podium. From Figure 8(a), the sun shading situation of case 2 was observed to have a more sunlight time overall than case 1 because the side length of the rectangle on the south is larger than that of the square podium under the same area. As shown in Figure 8(b), the ASH of case 2B is primarily 10 hours and there are also some areas, which are under 6–8 hours period. Furthermore, sunlight time period in case 2A and 2C are mainly 6 hours, therefore, the sun shadow area of case 2B is smaller than the case 2A and 2C. This can be explained by the high-rise building shape effect.
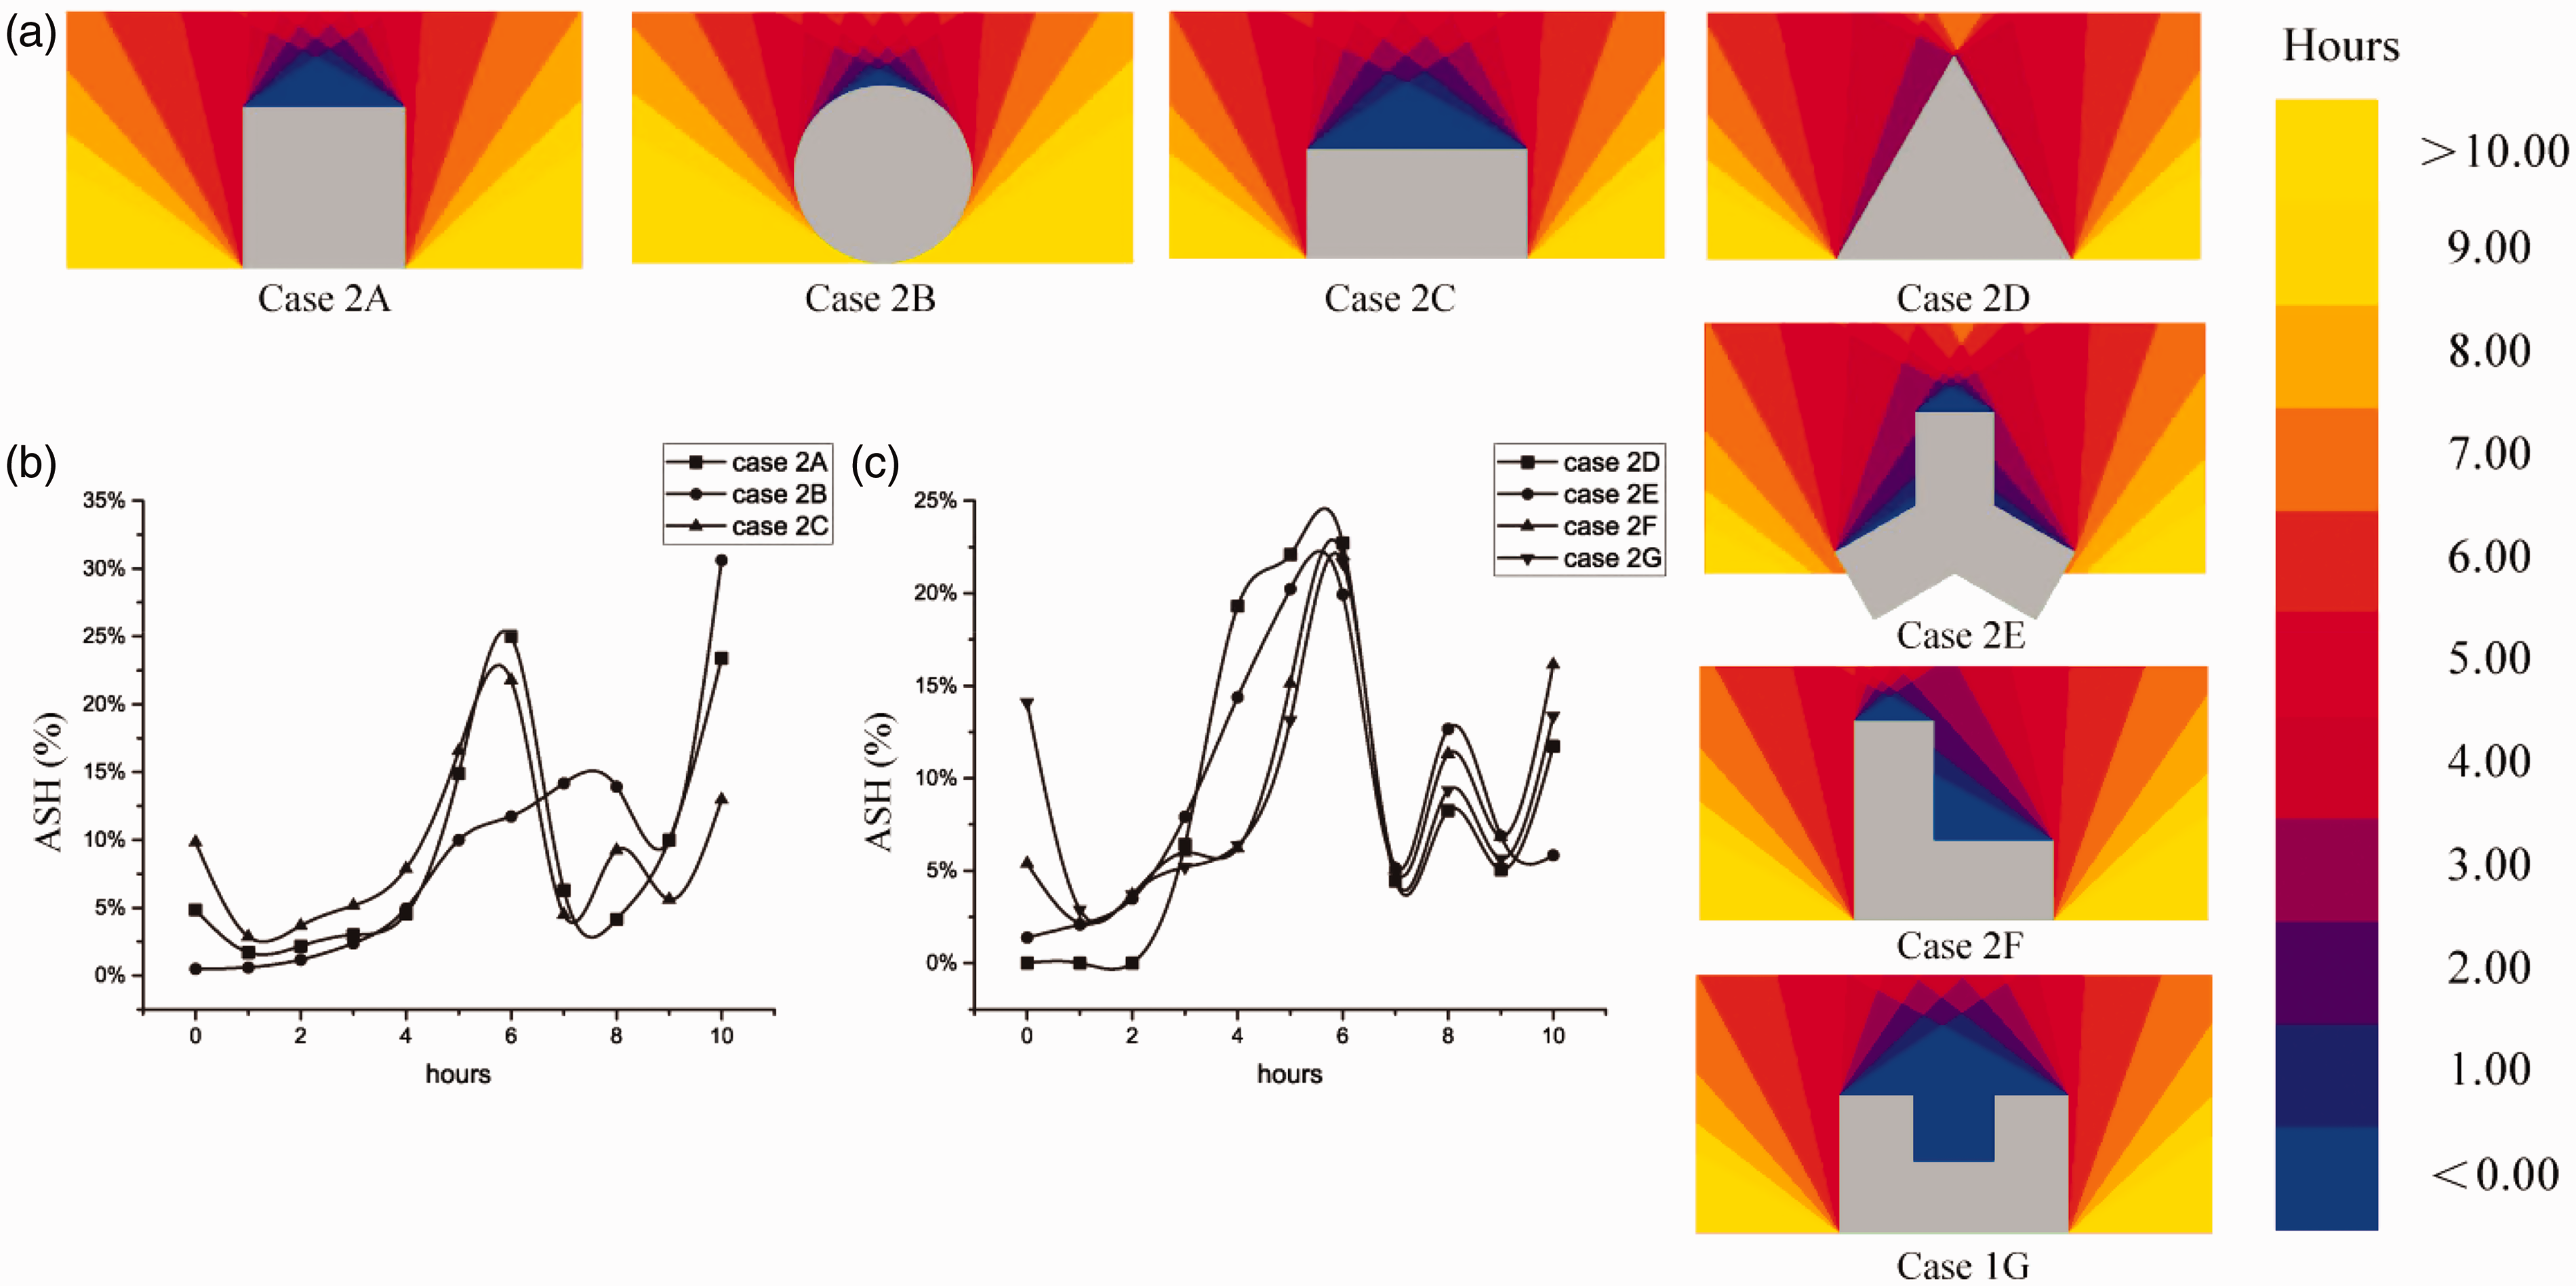
ASH condition of case 2. (a) Sunlight condition, (b) ASH condition from A to C and (c) ASH condition from D to G.
According to Figure 8(c), due to the special shape of the triangle, there is no area that has a sunshine (sunlight) period under 3 hours and most areas are between 4 and 6 hours. In case 2E, the sunshine period mainly was between 3 and 7 hours, however, ASH under 10 hours is not enough for PV efficiency. In cases 2F and 2G, although the main sunlight time period were 6 to 10 hours, there are still some areas could not be exposed under the sun due to the corner shadow effect of these two shapes. Therefore, the results suggest that for rectangle podium, regardless of the shape of the high-rise building, the overall sunlight distribution is similar with each other, in addition, the square, circle and rectangle type of the high-rise building have the best sunlight distribution condition since most areas of podium roof are under 10 hours of sunshine which is conducive to the solar energy utilization.
The ASH conditions in case 3 are presented in Figure 9(a). From Figure 9(b), these three cases are similar with each other in ASH distribution condition, which are mainly approximately 6 hours. The triangular podium shape produced a longer sunshine depth comparing to the square and rectangle. ASH in cases 3D to 3G are shown in Figure 9(c), as the building shape of the high-rise building of case 3D is triangle, the most area of podium roof is under 3 to 6 hours of sunshine and the ASH of 0 to 3 sunlight period is 0% because of the Spindle characteristics of the triangle type. Comparing to case 3D, the sunlight distribution periods in cases 3E, 3F and 3G are 4 to 8 hours. Apart from this, part of the podium under these three cases could not be irradiated by the sun. Therefore, the square, circle and rectangle high-rise buildings all could be conducive to the solar energy utilization, with most areas of these podium roofs can achieve a good sunshine period. The triangle type high-rise building could enable sunshine exposure on the podium roof all under the sun, but the sunshine period would be shorter in comparison to others.
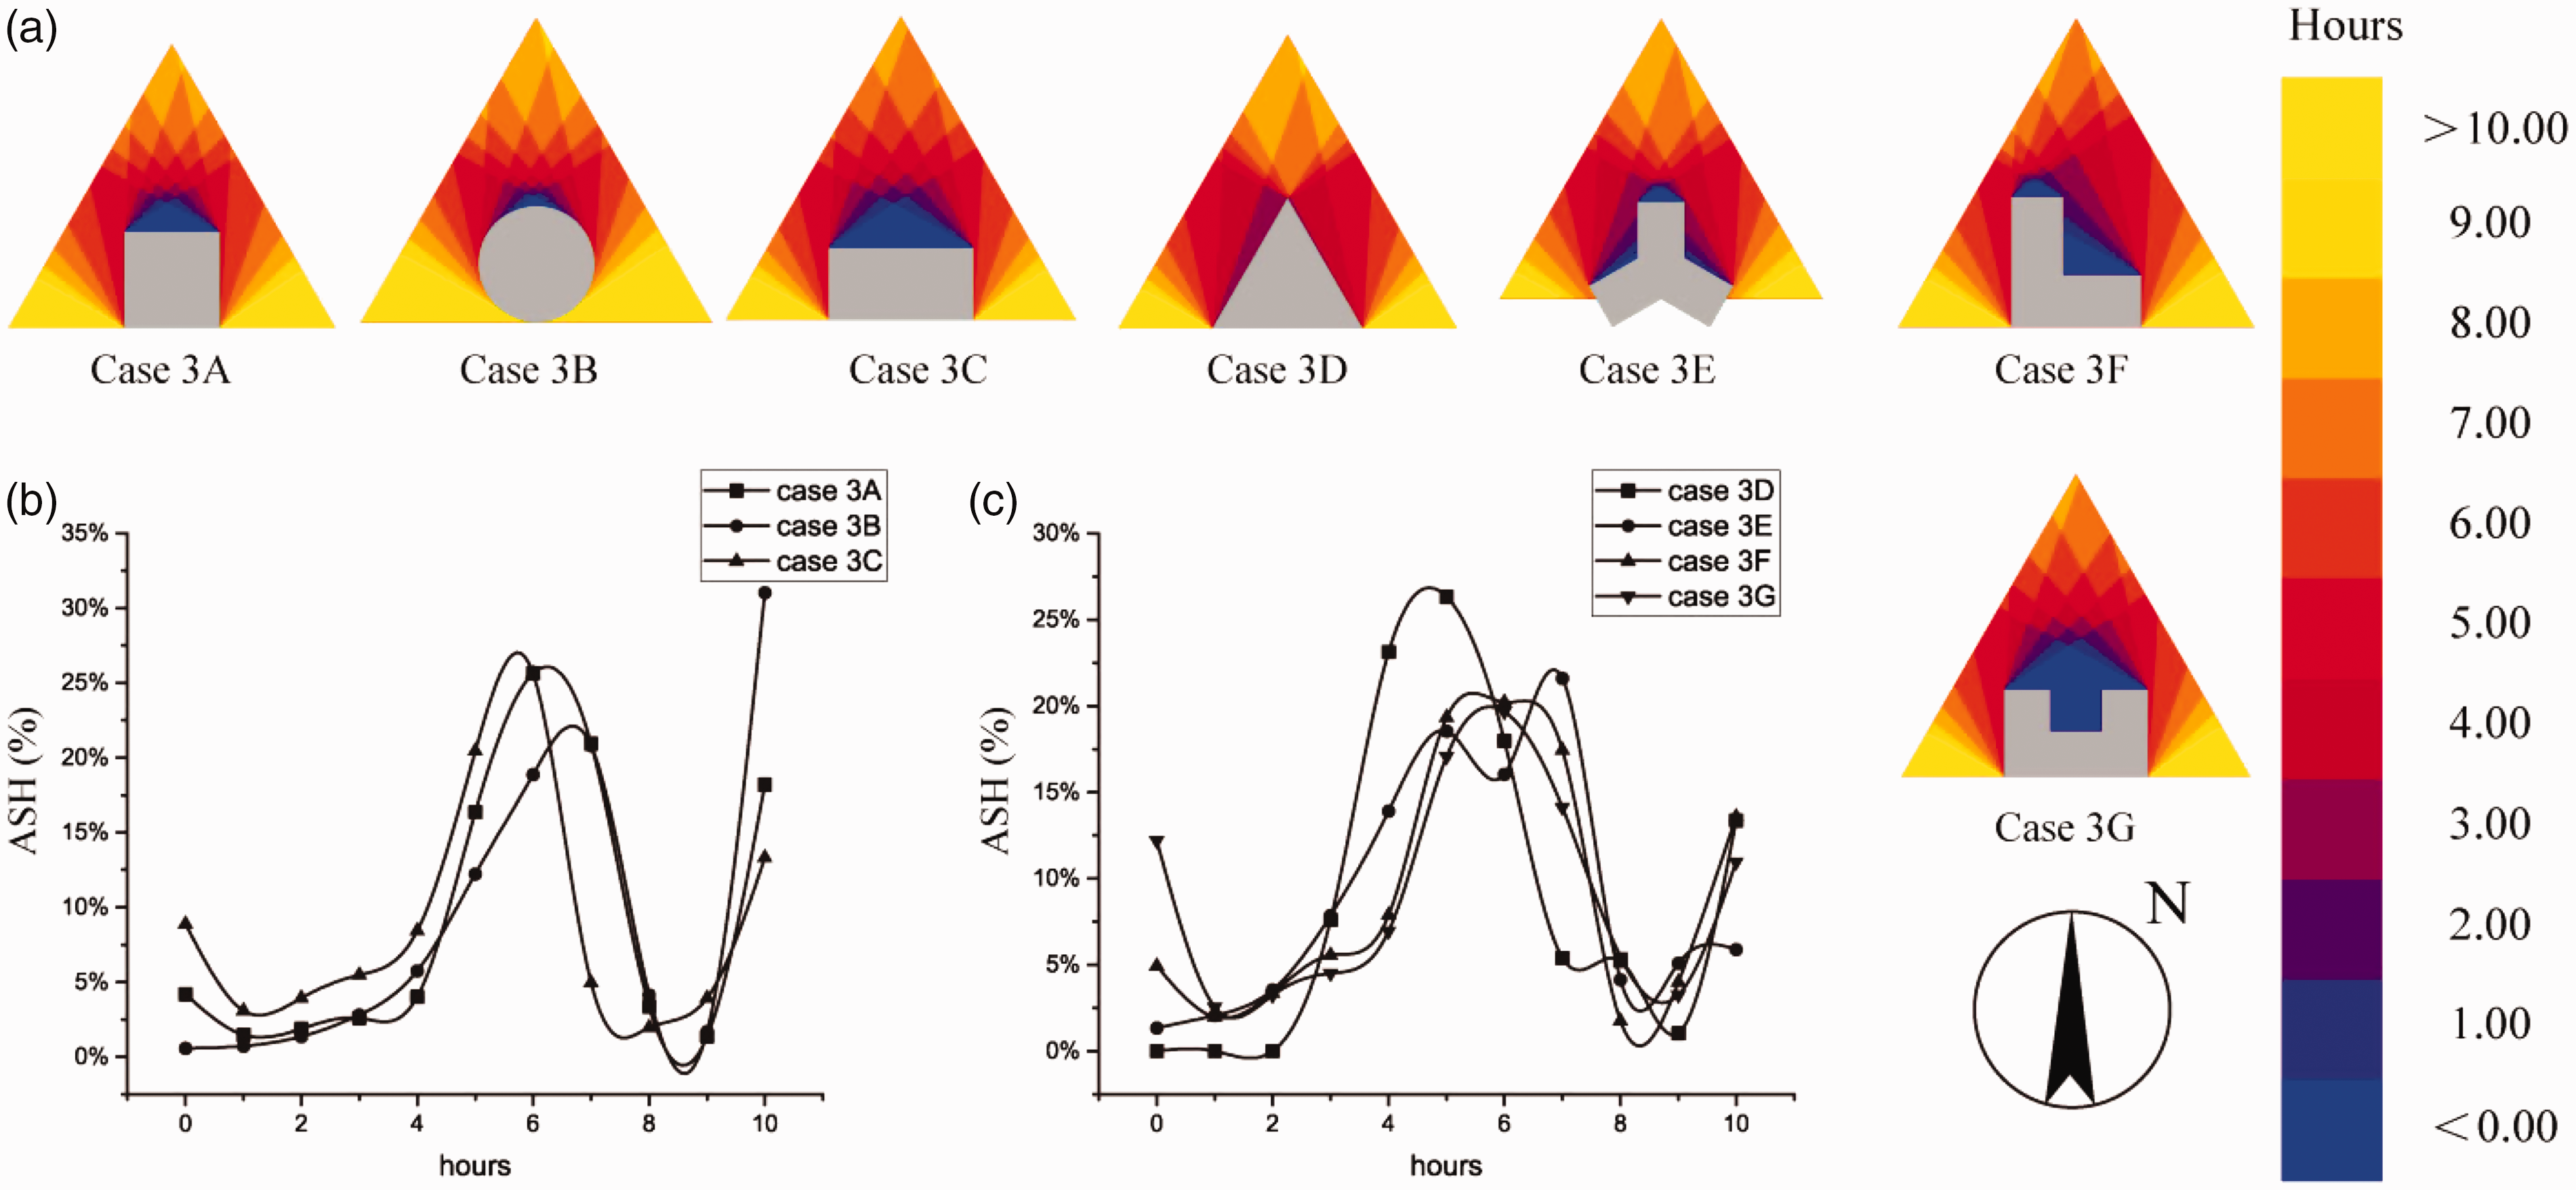
ASH condition of case 3. (a) Sunlight condition, (b) ASH condition from A to C and (c) ASH condition from D to G.
Figure 10 shows the sunshine situation of case 4 and statistics of ASH condition under different models. According to Figure 10(a), as the circle podium has no straight side facing the north, in all cases, the sunshine period would be restricted to 10 hours. Figure 10(b) presents the sunshine time distribution of case 4C, which is the worst among these three cases because of the longest straight side of the rectangle which could produce the most sunshine shading. Figure 10(c) shows the sunshine situation in case 4D is still the only case which could lead to the whole podium roof under the sunlight without shadow. Additionally, case 4F and 4G have a large shadow area due to the corner configuration. In case 4E, the sunshine situation is better than the other two cases due to the special shuttle shapes which give rise to shading of the sunlight. Finally, for the circle podium, the best sunshine distribution cases are square and circle; and the worst sunlight distribution is case 4F due to the long width and depth.
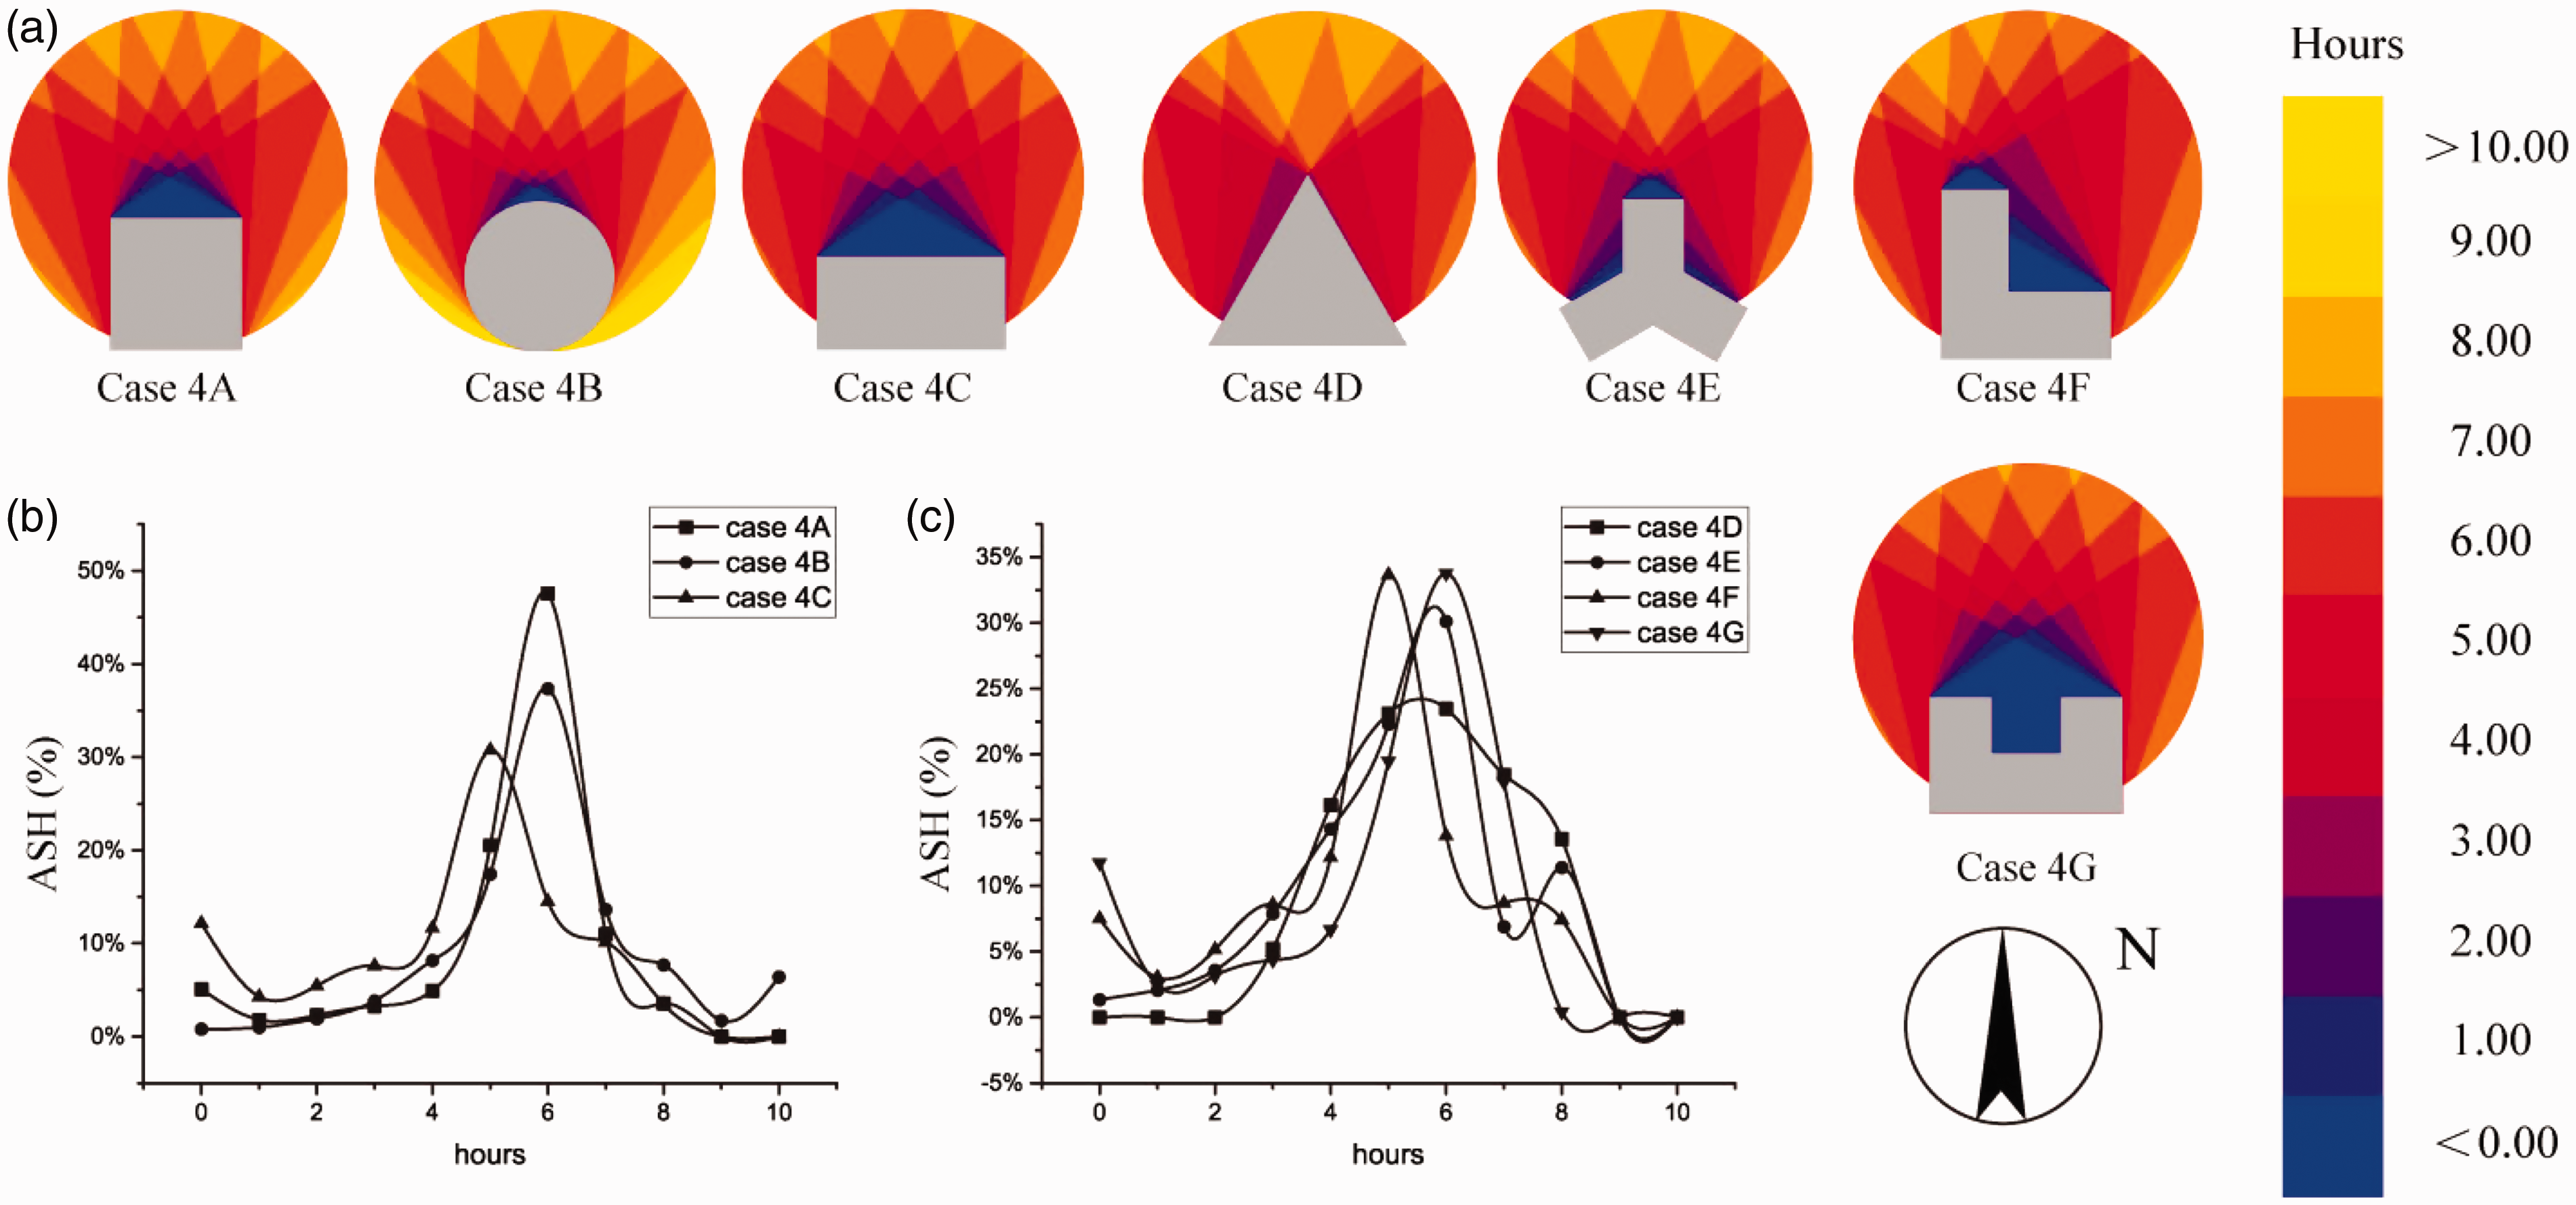
ASH condition of case 4. (a) Sunlight condition, (b) ASH condition from A to C and (c) ASH condition from D to G.
Figure 11 displays the ASH condition when the podium shape is ‘Y’ type under different types of high-rise buildings. First of all, no cases could reach more than 10 hours of sunshine exposure as a result of the special ‘Y’ type that has no straight side facing to the south. Secondly, all cases are similar with each other in the sunlight distribution situation which is shown in Figures 11(b) and 10(c) and cases 5A and 5B are little better than the others. For ‘Y’ type podium, all cases are similar and there are no cases that can achieve 10 hours of sunshine, no matter what the shape of the high-rise building.
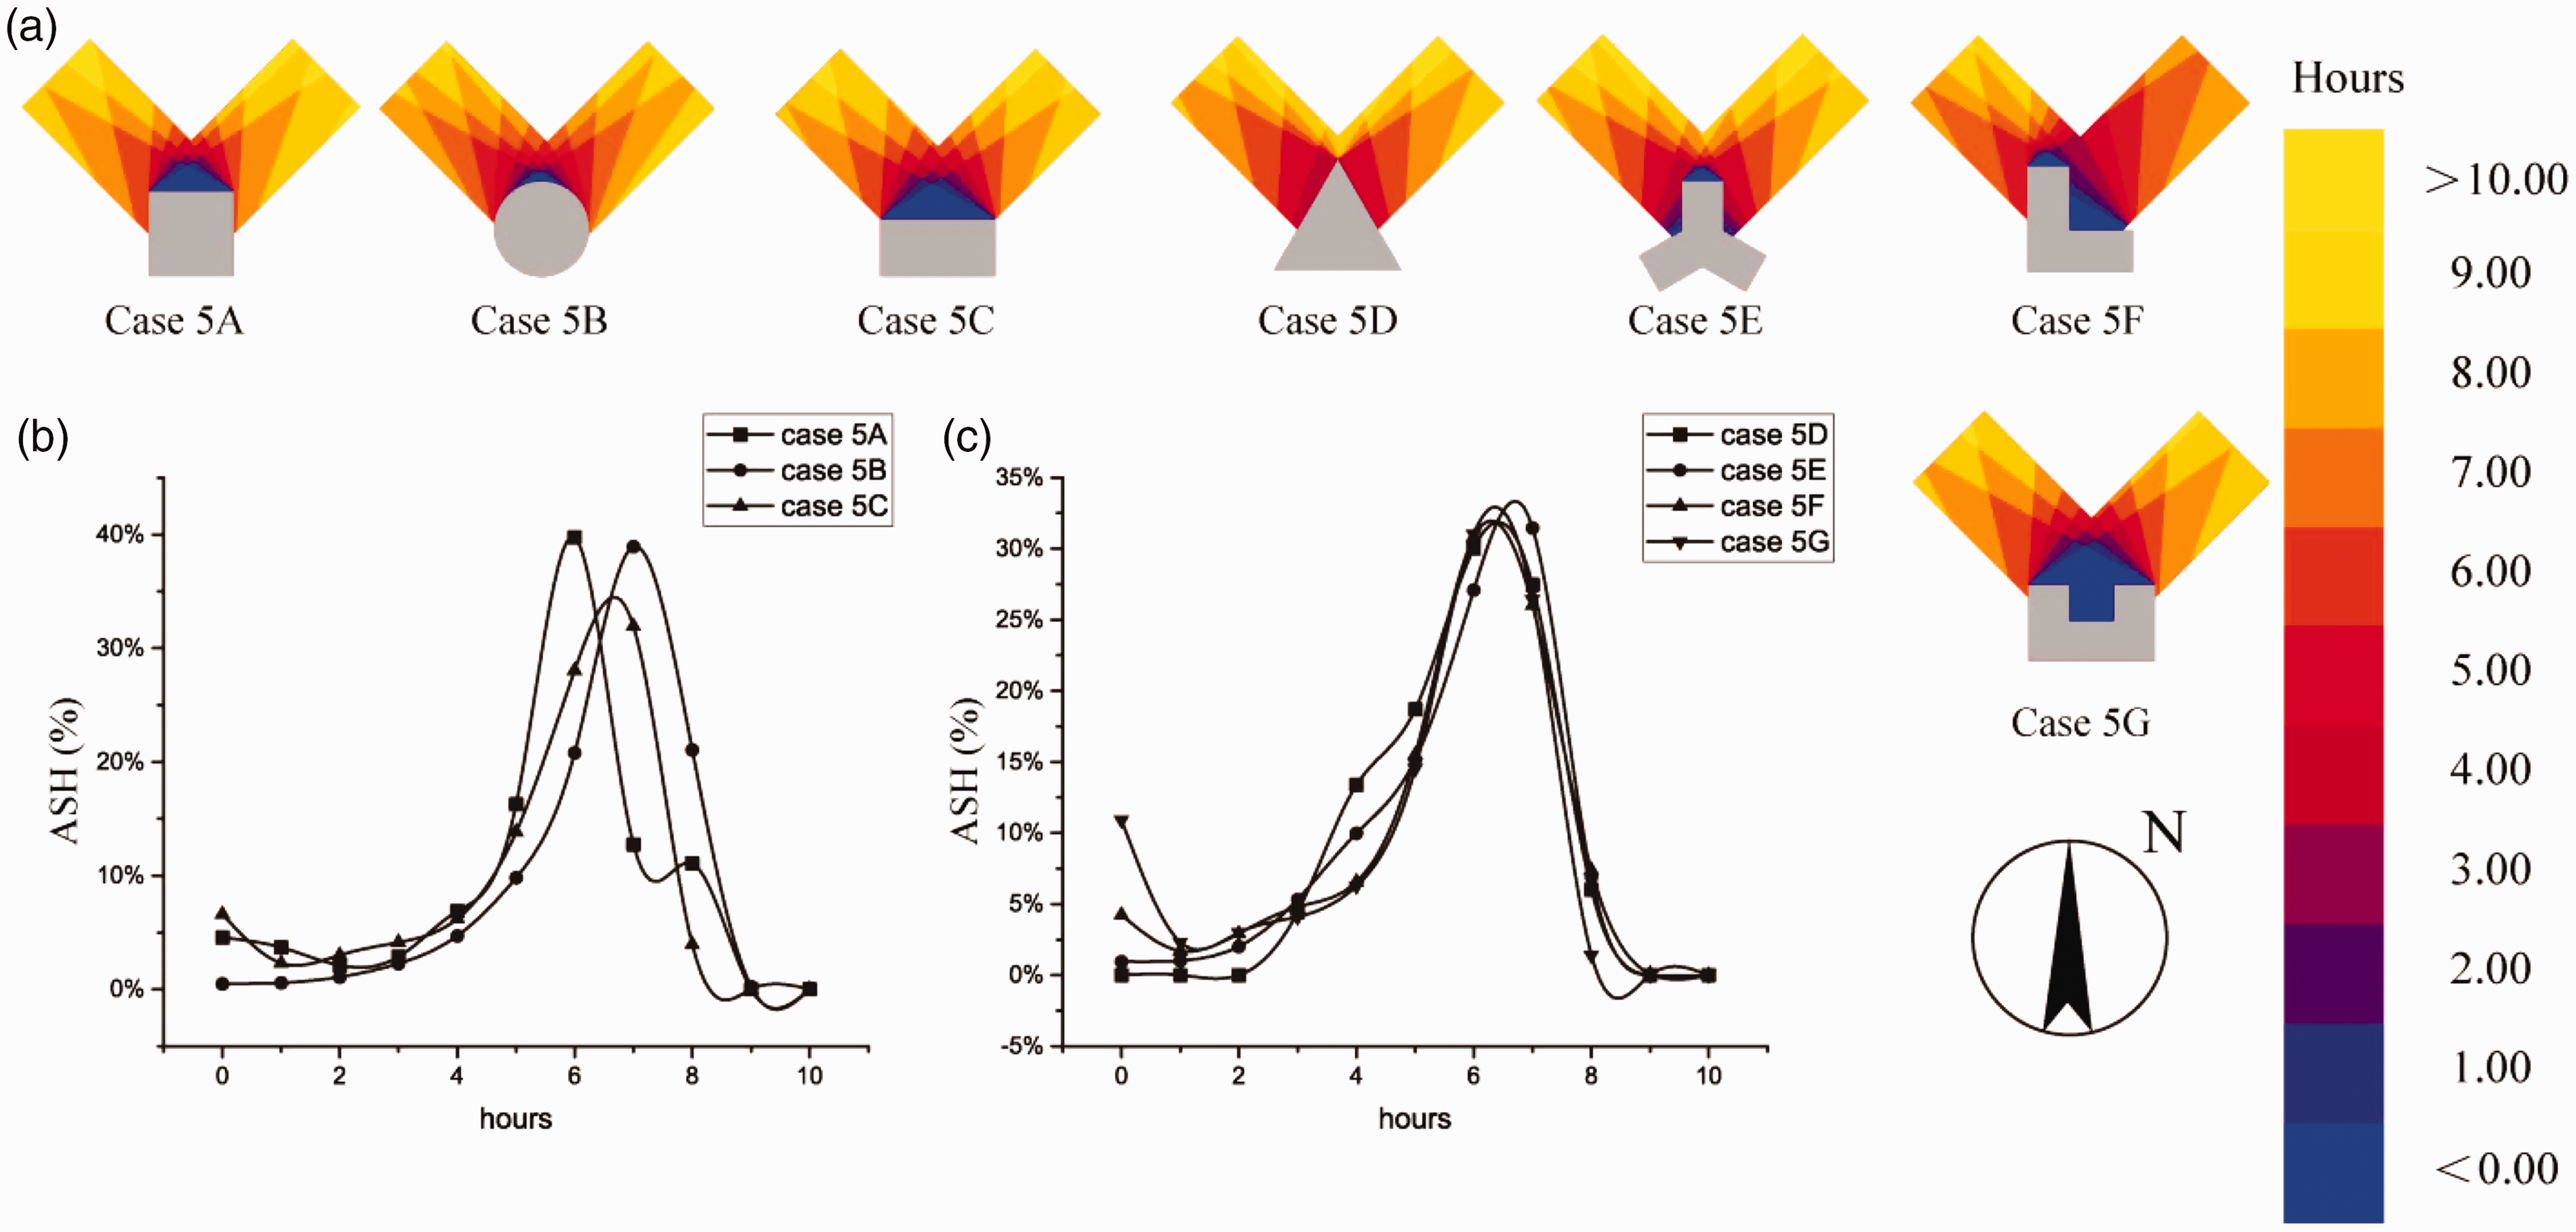
ASH condition of case 5. (a) Sunlight condition, (b) ASH condition from A to C and (c) ASH condition from D to G.
In Figure 12, the sunlight distribution condition of case 6 is shown. In Figure 7(b), ASH of case 6B is obviously better than cases 6A and 6C where most ASH of sunshine period is 9 hours. Figure 7(c) shows the condition of ASH of other cases are similar to each other, however, in case 6G, it has the biggest area (17%) under shadow in comparison to the others, this is mainly influenced by the width and depth of ‘U’ type high-rise building. Hence, for ‘U’ type of podium, the circle is the best shape for high-rise building for sunshine distribution that has an effect on the BIPV system and the worst is ‘U’ shape. Apart from this, under this circumstance, most of the cases are under 5 to 6 hours of sunshine time.
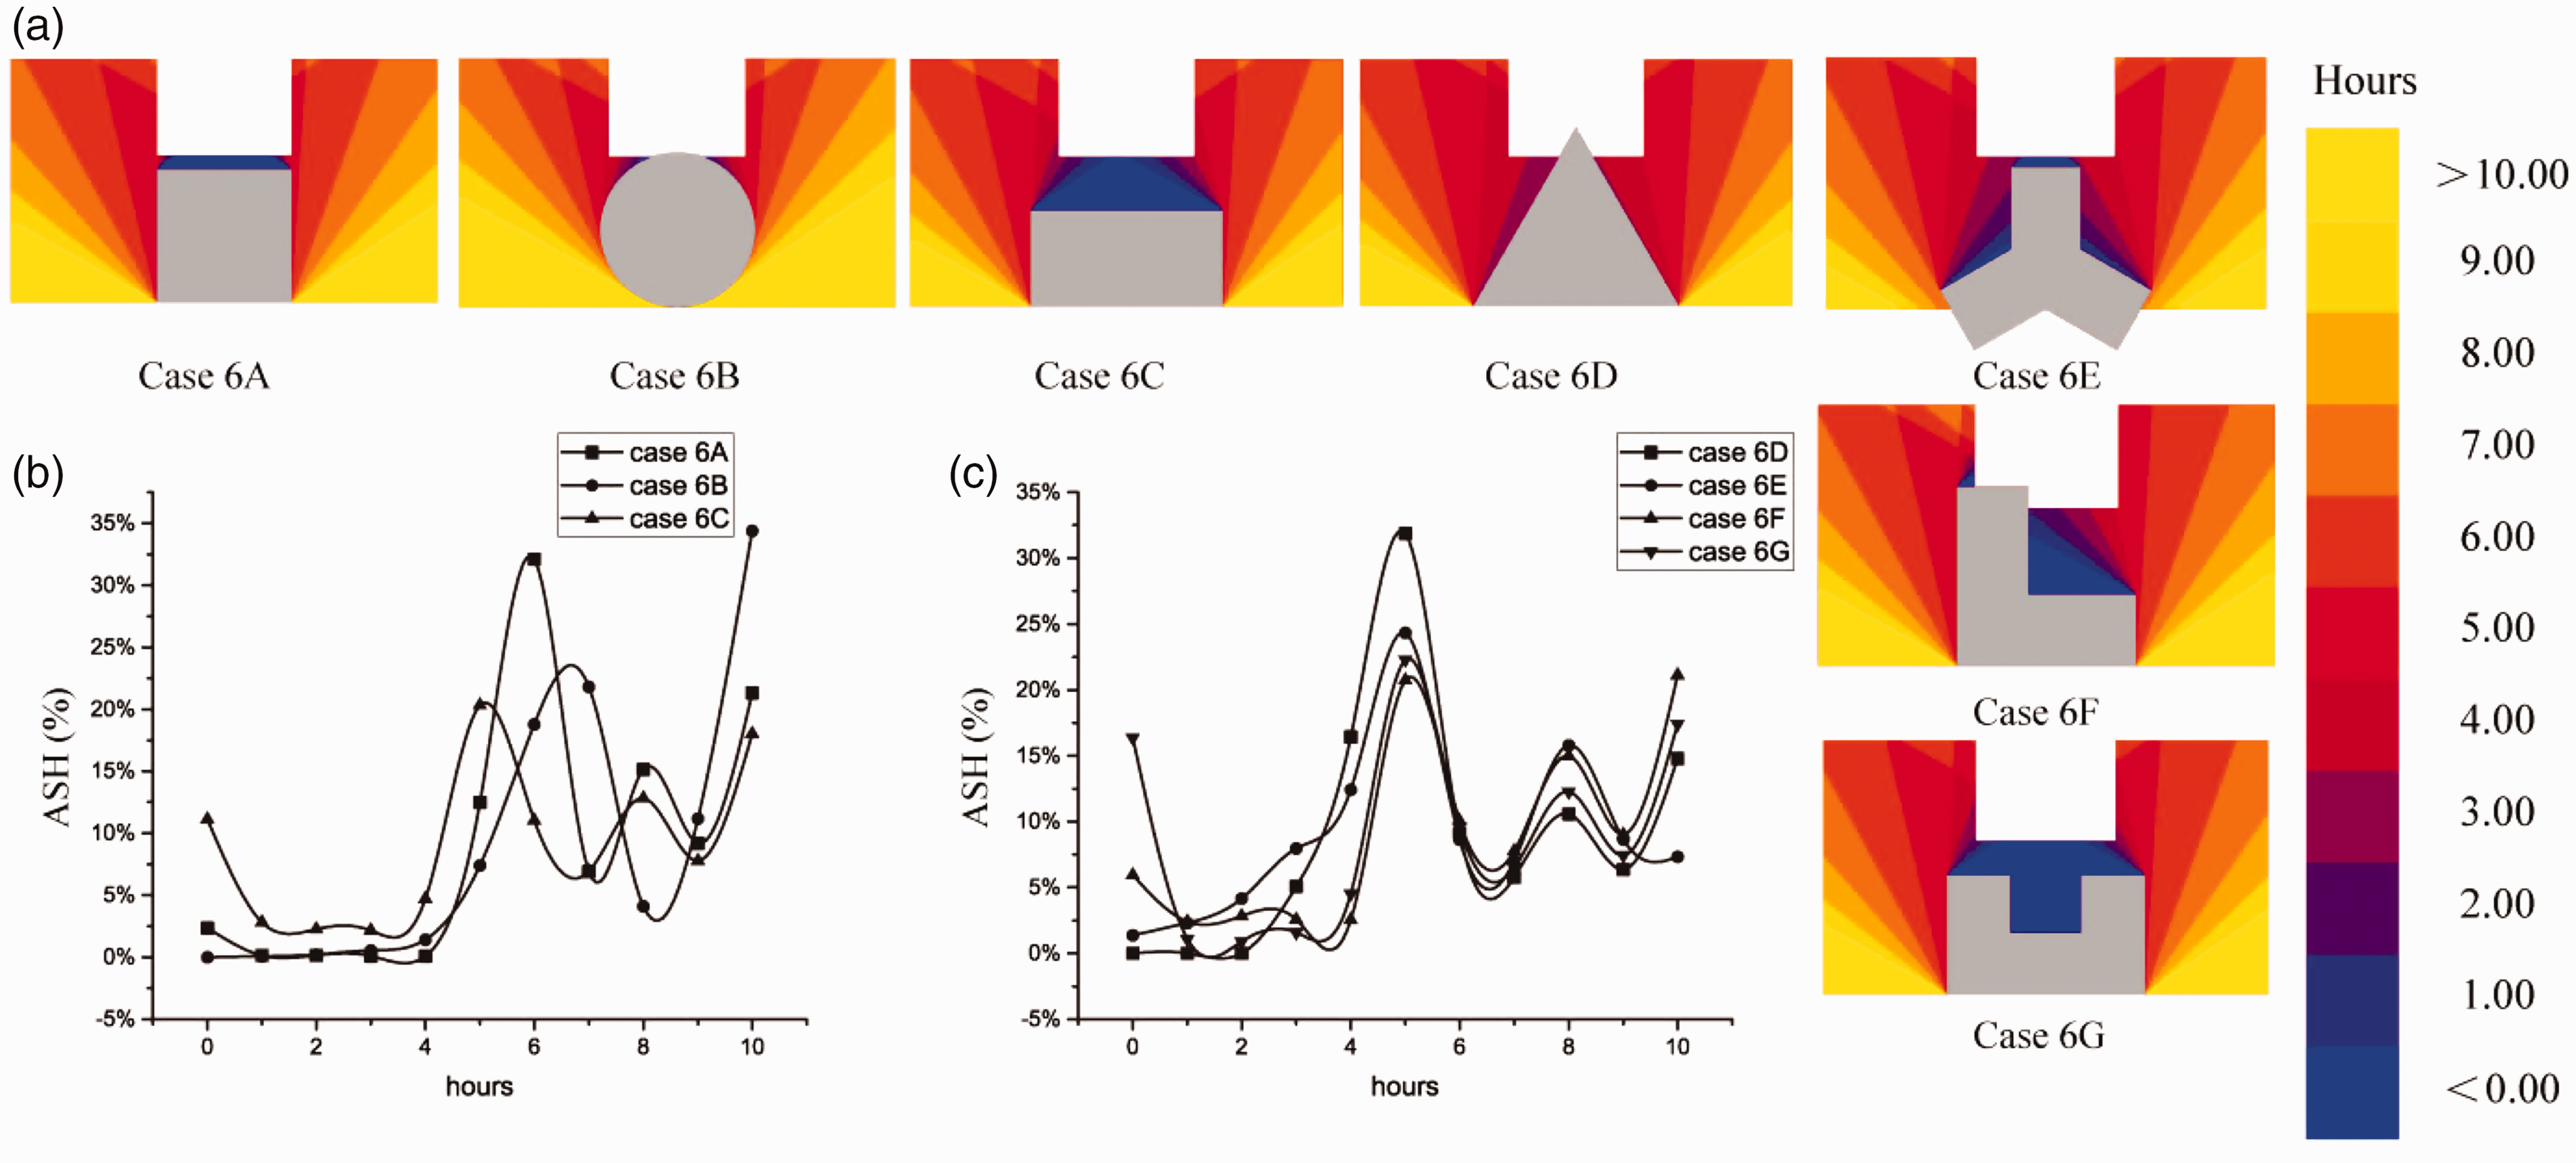
ASH condition of case 6. (a) Sunlight condition, (b) ASH condition from A to C and (c) ASH condition from D to G.
From analysis of the ASH, different high-rise shapes could have different sun shadow effects for different podiums according to the shape characteristics. The main roof area sunshine time is concentrated for around 5 hours in most cases and some high-rise buildings have a better shape to receive sunshine condition such as circle and square. Nonetheless, there are also some cases where the sunlight distribution is relatively poor such as when the high-rise building shapes are ‘L’ and ‘U’ because almost no roof areas can be exposed more than 10 hours. ASH can present the sunshine distribution condition in different cases, but the intensity of sunshine period should be measured by CASH.
CASH comparison
Figure 13 shows the CASH condition under different cases in order to study the whole sunshine time intensity situation. The lower the CASH value, the better the sunshine time intensity.
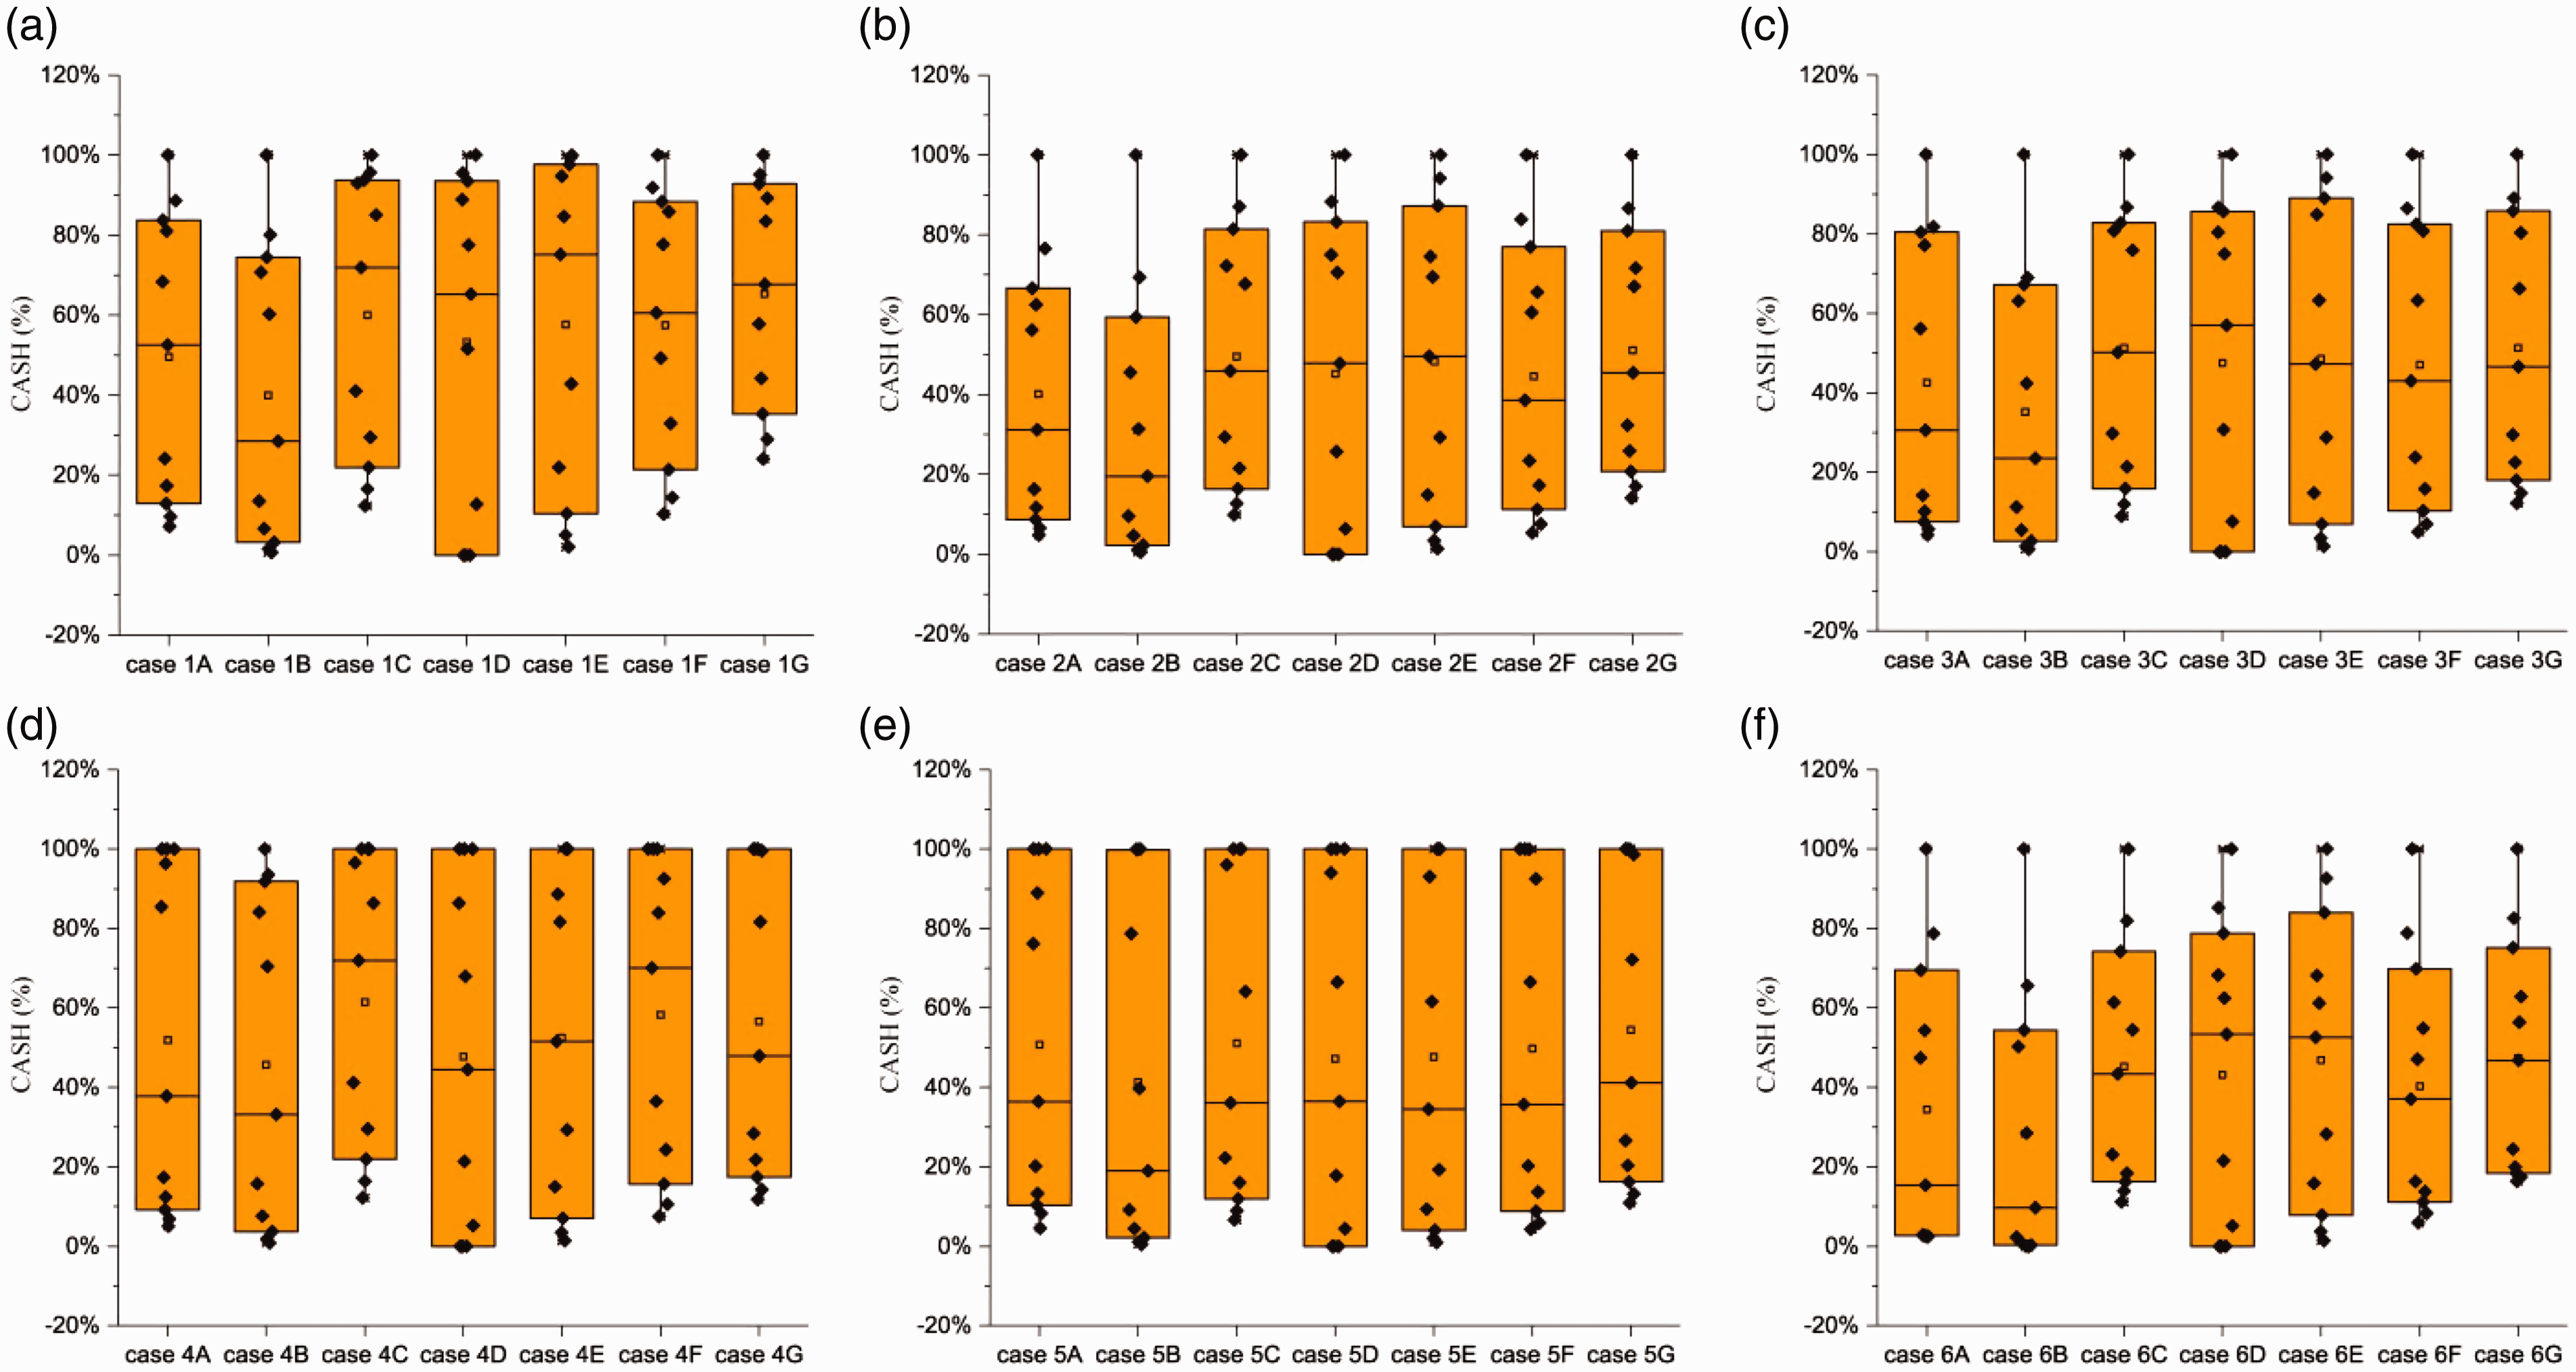
CASH condition of cases. (a) CASE 1, (b) CASE 2, (c) CASE 3, (d) CASE 4, (e) CASE 5 and (f) CASE 6.
From Figure 13(a): CASH condition of case 1 is apparently different with each other. According to the sunshine time distribution condition analysis and Figure 13(a), case 1B has the best sunlight condition for solar energy utilization while the worst case for sunshine time intensity is case 1C and 1E. Therefore, the circle shape for high-rise building would have the most beneficial function for sunlight condition on square podium and square high-rise buildings are also good for sunshine. Although the ‘L’ and ‘U’ shapes for high-rise building could cause the largest shadow area, these buildings would have a better sunlight time intensity. The worst shapes for high-rise building for BIPV are rectangle and ‘Y’ type.
From Figure 13(b): In case 2, overall sunlight time intensity is similar with case 1. The shapes of high-rise building which is the most conducive for BIPV efficiency are square and circle. Rectangle, triangle and ‘Y’ type are the most unfavourable configurations for the use of solar energy. Apart from this, although the sunlight distribution condition of ‘L’ and ‘U’ type is not as well as in other cases, solar energy can be better utilized by these types comparing to rectangle, triangle and ‘Y’ types. Hence, for rectangle podium, square and circle are the best shapes for high-rise building to produce sunshade effect for BIPV system.
From Figure 13(c): For triangle podium, square and circle are still the best configuration of high-rise building for solar utilization. However, in this case, the triangle is the most unfavourable shape for a high-rise building for solar utilization. The rectangle, ‘Y’, ‘U’ and ‘L’ types of shapes would allow good exposure to sunshine condition for the podium roof.
From Figure 13(d): With the circular shape podium, the rectangle and ‘L’ type building would have the maximum shading effect of the sun, which would seriously affect the rooftop utilization efficiency of solar energy. The sunlight time intensity of BIPV system installed on the roof of triangle, ‘Y’ and ‘U’ types of buildings are similar with each other and are better than rectangle and ‘L’ types giving a longer sunshine period. Apart from the above, the square and circle are still the best shapes among all the cases.
From Figure 13(e): With respect to sunlight time intensity, all the cases are similar with each other with the ‘Y’ type podium except in case 5B which is the most optimum situation for sunlight exposure. The reason for this phenomenon is that the special podium shape of ‘Y’ type has no straight side exposure towards the sun, thus poor sunlight exposure in most cases.
From Figure 13(e): When the podium shape is ‘U’ type, the sunlight time intensity condition is similar in cases 1–3 and the square, circular type of high-rise building would provide the best sunshine environment for the podium roof. Triangle and ‘Y’ types buildings would have the worst effect on the BIPV system while ‘L’ and ‘U’ type would have a slightly better effect comparing with the above two cases.
According to the above analysis, the sunlight time intensity is different to the sunlight time distribution. Square and circle are two shapes of high-rise buildings which are most conducive to solar utilization. Rectangle, triangle and ‘Y’ types could not contribute to the podium’s full utilization of solar energy in most cases due to the building’s shadow effects. For ‘L’ and ‘U’ shapes of high-rise buildings, despite most areas of podium roof in these two cases could not be fully exposed to the sun during higher sunshine period, the overall sunlight time intensity are better than the sunlight time in other high-rise buildings of other shapes which are circle, rectangle, triangle, square and ‘Y’ types; which would have a positive effect on the solar energy utilization.
Analysis of different orientations of PV
By the application of ‘Solar Radiation Analysis Module’ in simulation software and by using Shanghai meteorological data, different angle solar radiation arrays were drawn; and the solar radiation was analysed. In Shanghai, when the tilt angle is 30°, the largest cumulative solar radiation can be achieved, and the value is 1300 kW h/m2. 30 As the main factors affecting the photovoltaic power generation from the sunlight, the installation of photovoltaic panels should be towards the direction of the sun where there is the largest amount of sunshine. Assuming when the photovoltaic array is facing the south and the tilt angle is 30°, the power generation is 100%. The orientation of the PV array would be east, west, south, southwest 30°, southeast 30°. The tilt angle would be 0°, 30° and 90°.
Table 4 shows the relative power generation efficiency of PV panels from simulation of different building orientations in Shanghai.
Power generation efficiency of BIPV with different orientations.
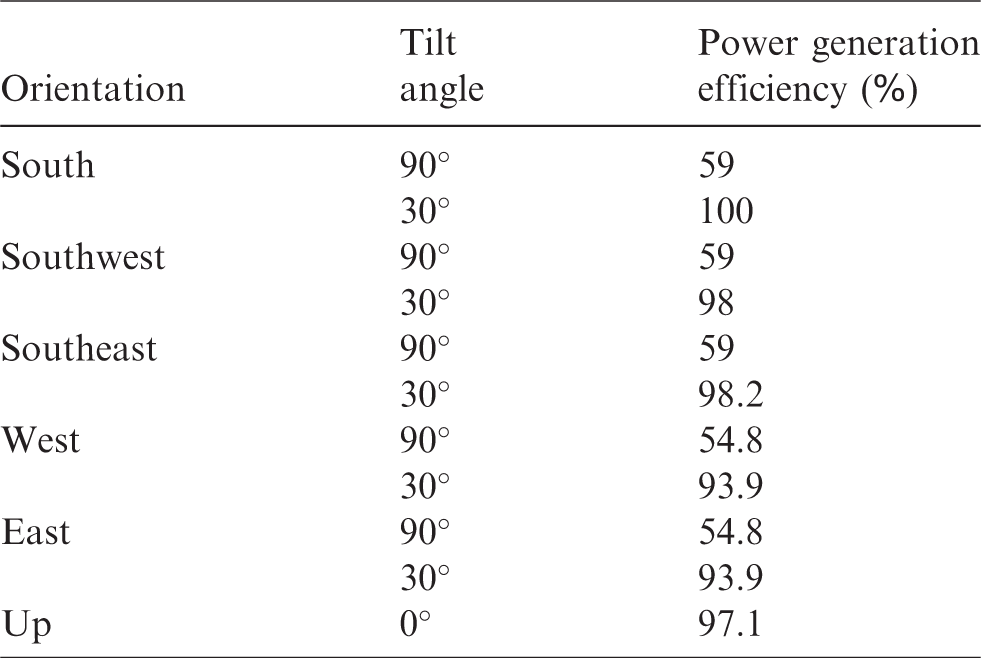
Figure 14 shows that the relative power generation efficiency of BIPV installed at different building orientations with two tilt angles of 30° and 90°. When the tilt angle is 30°, the best orientation of the BIPV is towards the south and the second is towards the southwest which account for 17.21% and 16.86% of relative power generation efficiency of BIPV, compared to other orientations respectively. The worst orientation is towards the southeast; therefore, this orientation should be avoided for the installation of BIPV in the commercial building complex. When the tilt angle is 90°, the up orientation of the BIPV would produce the best relative power generation efficiency, which is much higher than the other orientations. The worst orientation is towards the east and west. So, the orientation towards the east and west is bad for the PV power generation. The PV power generation efficiency of BIPV installed with an orientation towards the south is 0.31% higher than the orientation towards the southeast which has the lowest power generation efficiency with a 30° tilt angle. When a tilt angle of 90° was used, the BIPV facing upward to the sky is the best orientation and is 11.03% higher than orientations facing the west and east, which are the worst. (Figure 15)
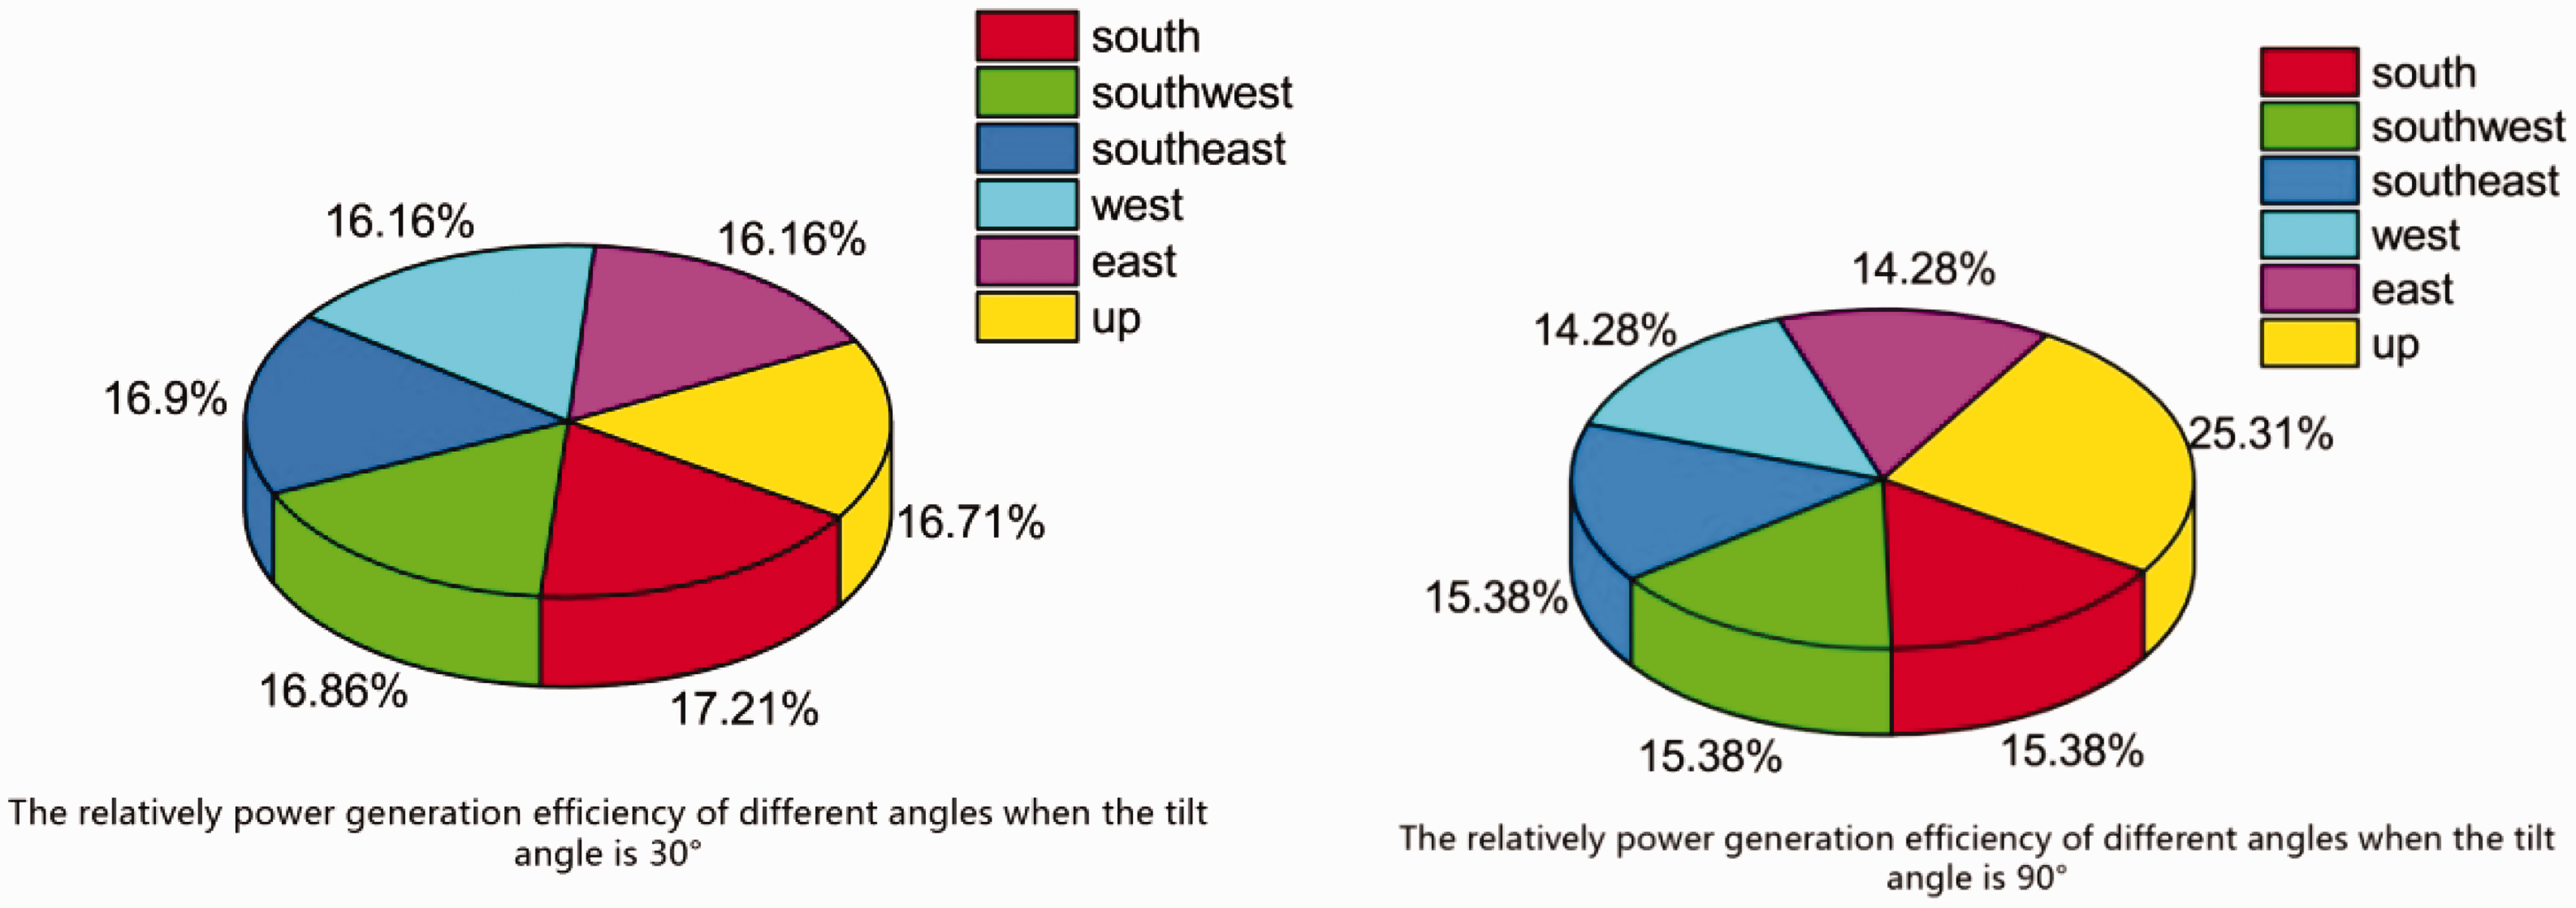
The proportion of relative power generation efficiency of BIPV with different orientations at two tilt angles of 30° and 90°.
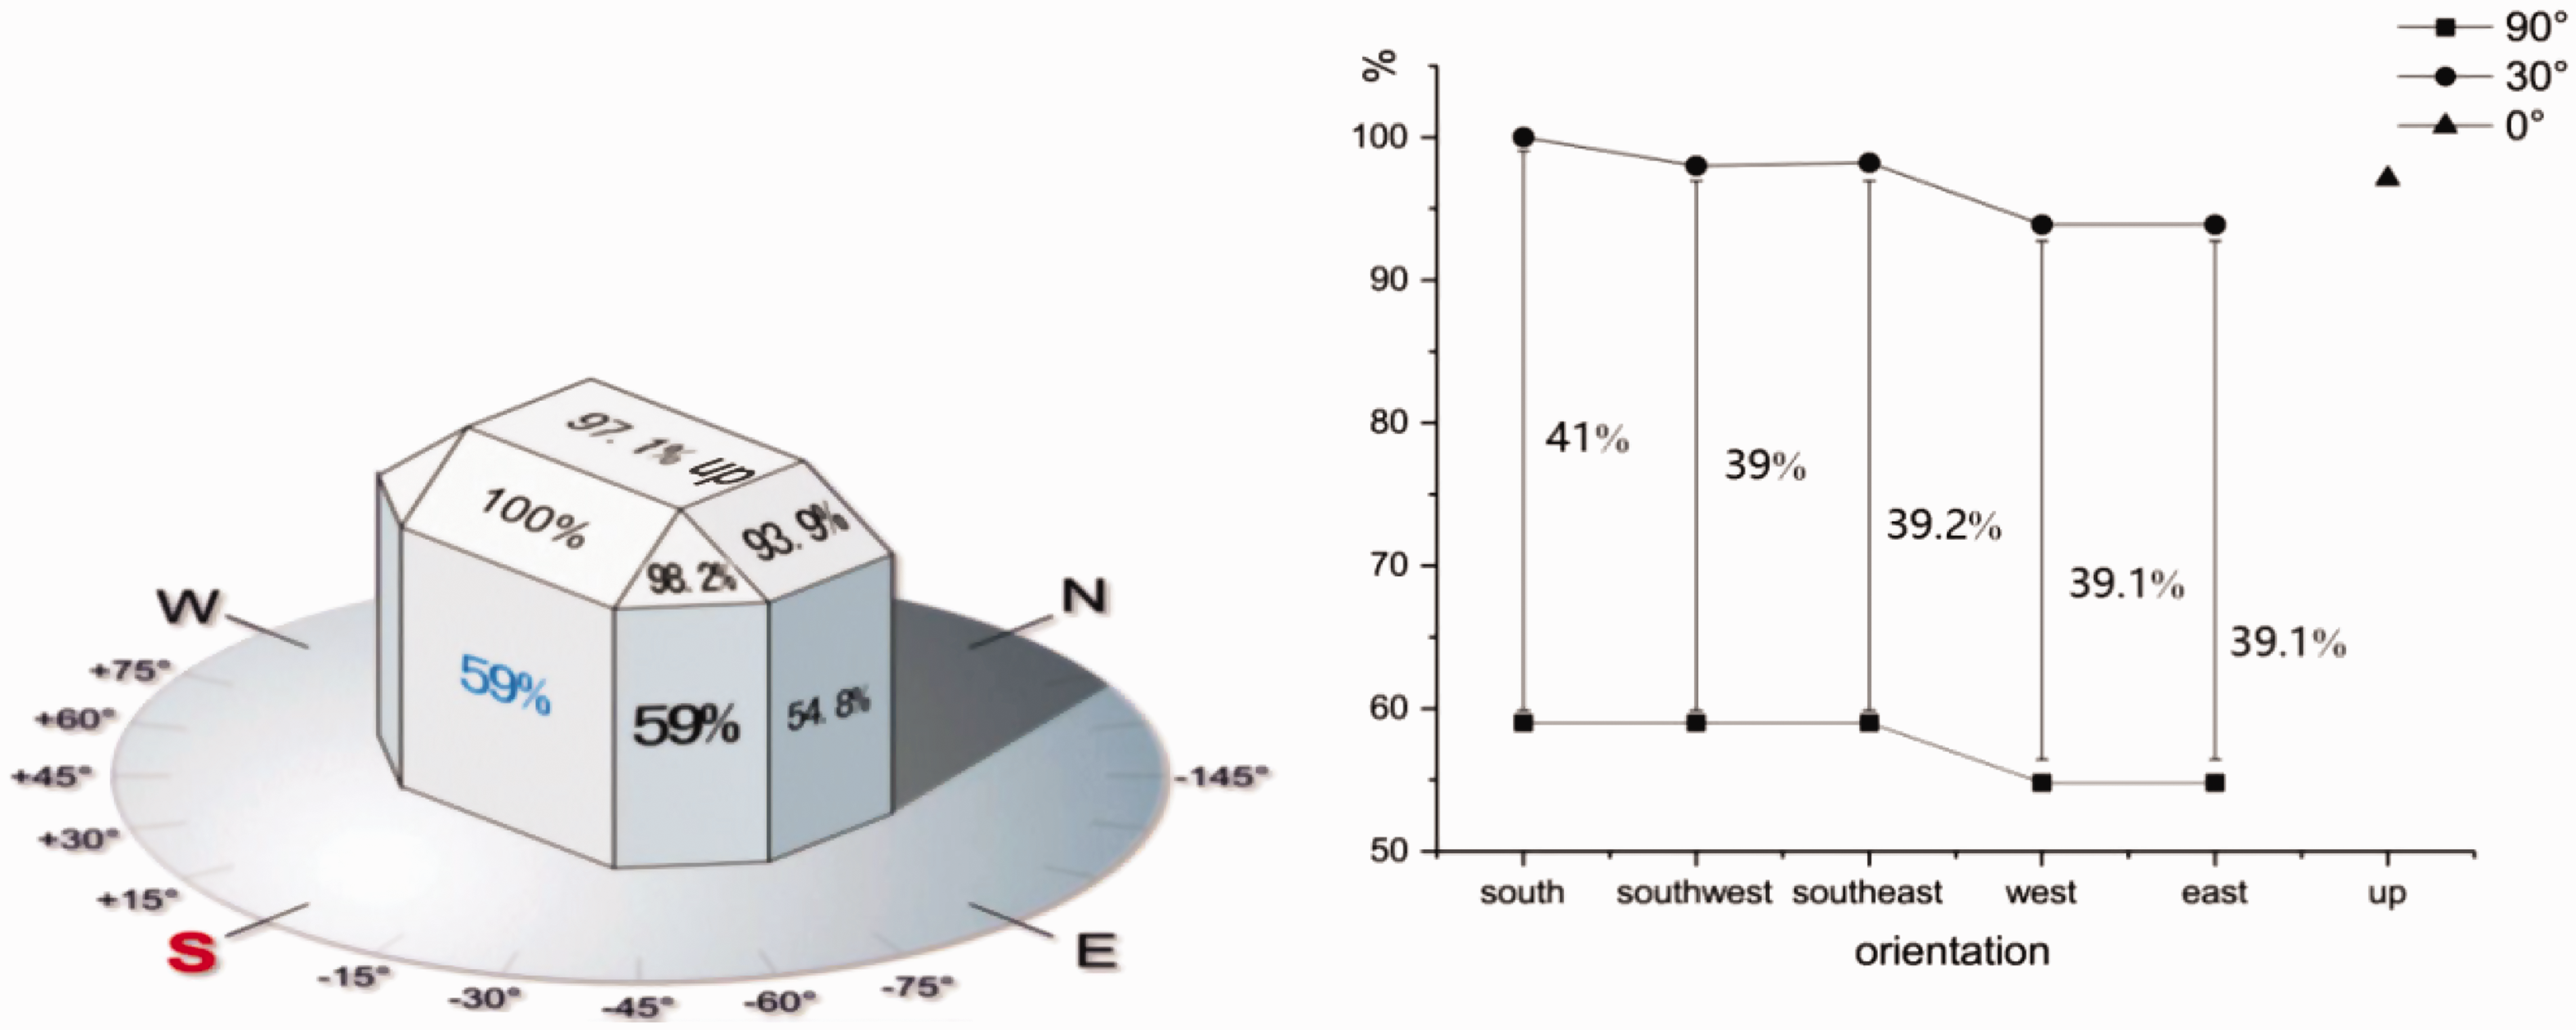
The relative power generation of BIPV for different orientations of photovoltaic arrays in Shanghai.
According to the above simulation results, the power generation capability of the BIPV panel in different orientations is similar with each other with a 30° tilt angle. Moreover, this capability would vary greatly in different directions with a tilt angle of 90°. All orientations would produce a good power generation efficiency with a tilt angle of 30°. Relatively speaking, the up orientation is the only direction that can achieve a good power generation efficiency as compared with other orientations with a 90° tilt angle. According to Figure 15, the most suitable orientation for power generation is the south and the second orientation is upward facing to the sky and towards southeast.
The above study focused only on the relative relationship of BIPV install with different orientations. From Table 4, the power generation efficiency is at the highest when the orientation is towards the south with a tilt angle of 30°. When the tilt angle is 30°, no matter which direction the orientation is, the relative power generation efficiency is higher than that could be achieved with a tilt angle of 90°. The best tilt angle is therefore 30° and it is almost 40% better than the 90° in different orientations except with the BIPV facing upward to the sky. The power generation efficiency of BIPV facing upward to the sky is 97.1%.
In summary, the best tilt angle for solar panels is 30° which is much better than 90°. The best orientation is southward followed by southeast, southwest and upward facing the sky. The difference between the power generation efficiency produced by different orientations is less than 1%.
Analysis of PV panels array spacing
In the configuration scheme of PV panels, array spacing must be calculated precisely to maximize the efficiency of solar panels. If the distance between two arrays is too long, instalment area would be wasted. If the distance is too short, the back array would be blocked by the front, so it is also not appropriate. To study the best distance between two arrays, Winter Solstice Day was used, because the sunshine time is the shortest and the shadow is longest on Winter Solstice Day all year-round. In principle, BIPV panels arrays should not be blocked, so 9 a.m. to 15 p.m. is necessary for sunlight exposure. This time period refers to the sunlight time which is specified by the national standard in the shortest sunshine time of winter solstice day.
38
For the PV system, panels array spacing D was calculated using equation (3).

φ means latitude (positive in the northern hemisphere, negative in the southern hemisphere);
H means height difference between marginal of blocked component and PV arrays or shelters. 39
In this system, the latitude is 32°, H is 0.618 m. Through calculation, D is 1.214 m. The plan sketch is shown in Figure 16.
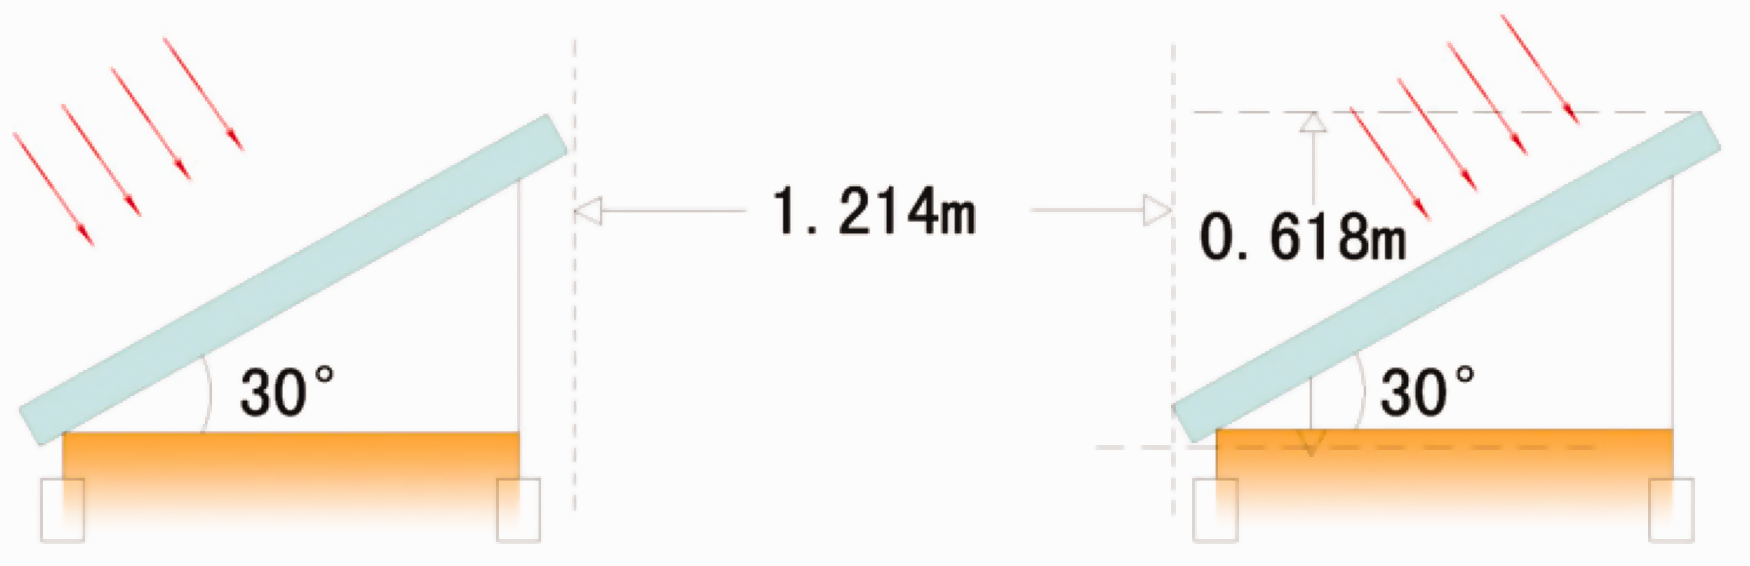
Plan sketch of PV array spacing.
Then, the calculated result would be checked by simulation software. The latitude would be set as 32° and H as 0.618 m, work time is 9 a.m. to 15 p.m. on Winter Solstice Day. Given the calculation errors and measuring errors, the simulation result is consistent with the calculated result.
Array effects of PV panels
According to the analysis of tilt angle and array spacing above, the roof system was arranged in accordance with results given by the simulation. In this system, 401 SE. 185 components were used, and the installed capacity was 70.35 KWP.
Integration between roof structure and BIPV
According to the building plan and the PV pattern, the roof was designed by a consideration of the solar system installation before the building construction. The integration structure between the roof structure and BIPV is shown as Figure 17.
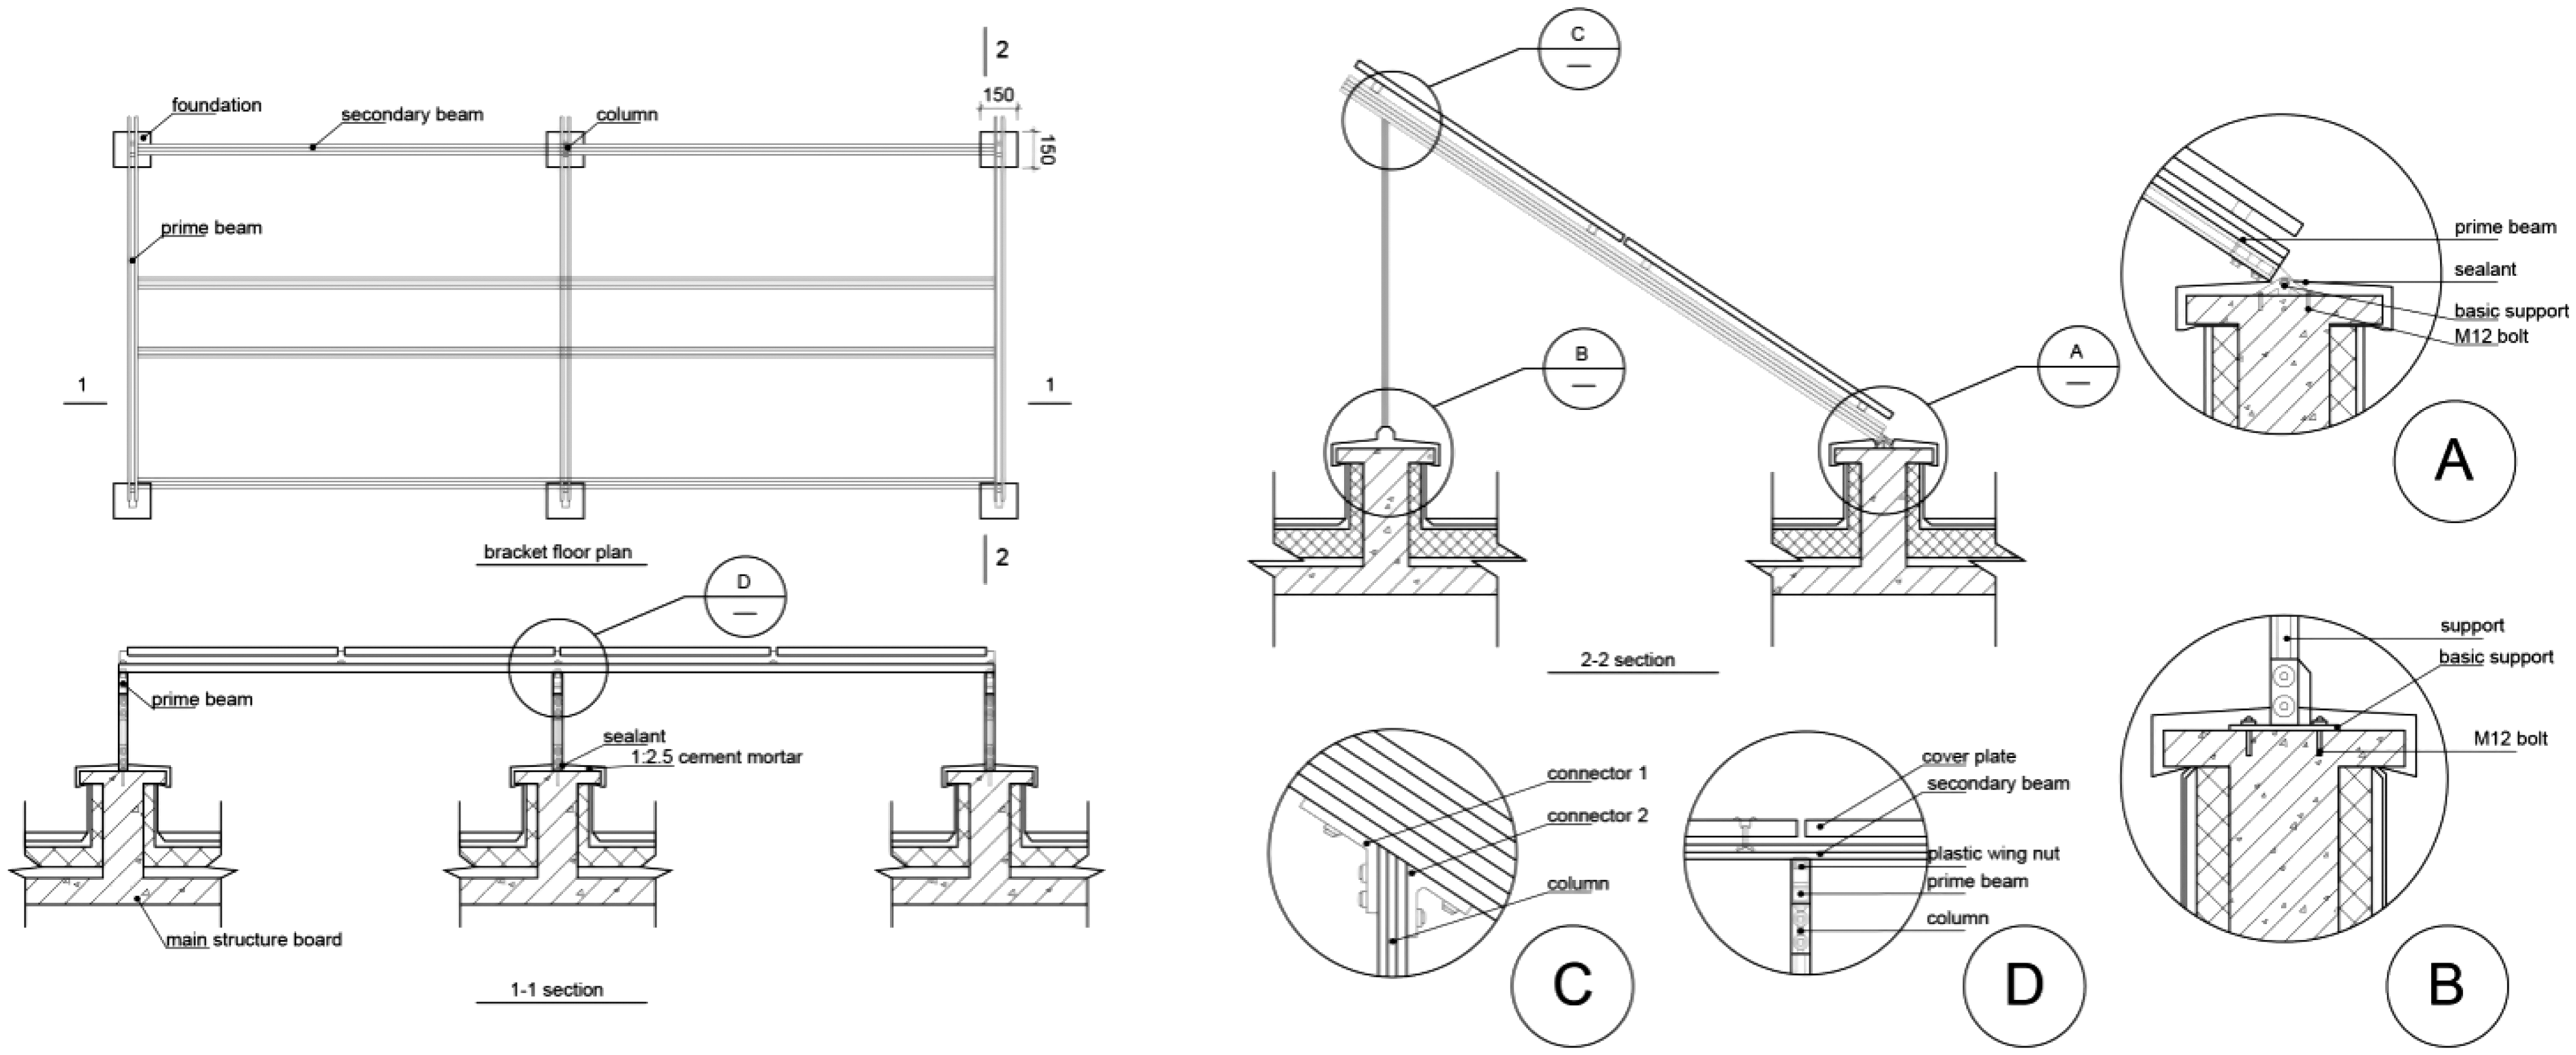
Connection of roof structure and solar system.
The basic support positions of solar panels were decided by the solar power system before the building was constructed. Every basic support was designed to integrate the BIPV with the roof structure. The size of the BIPV panel was 150 mm × 150 mm. The cover plates of PV were supported by the prim and secondary beams which were placed in crossed pattern. These beams were supported by metal columns. The connection of plate and beam was by using small connectors. This whole system was fixed by M12 bolts on connectors which were in the internal roof structure. The integrated design of photovoltaic was comprised of the roof and the solar system.
Energy efficiency comparison
In order to verify the above research results, the Tongji union square commercial complex were chosen to simulate its sunlight condition and compared sunlight situation between it and the other pattern of buildings. Figure 18 shows the satellite map of Tongji union square commercial complex. The complex consists of two main buildings which are combined by a podium and a high-rise building. Moreover, the photovoltaic panels are installed on the roofs of the podium and high-rise building.
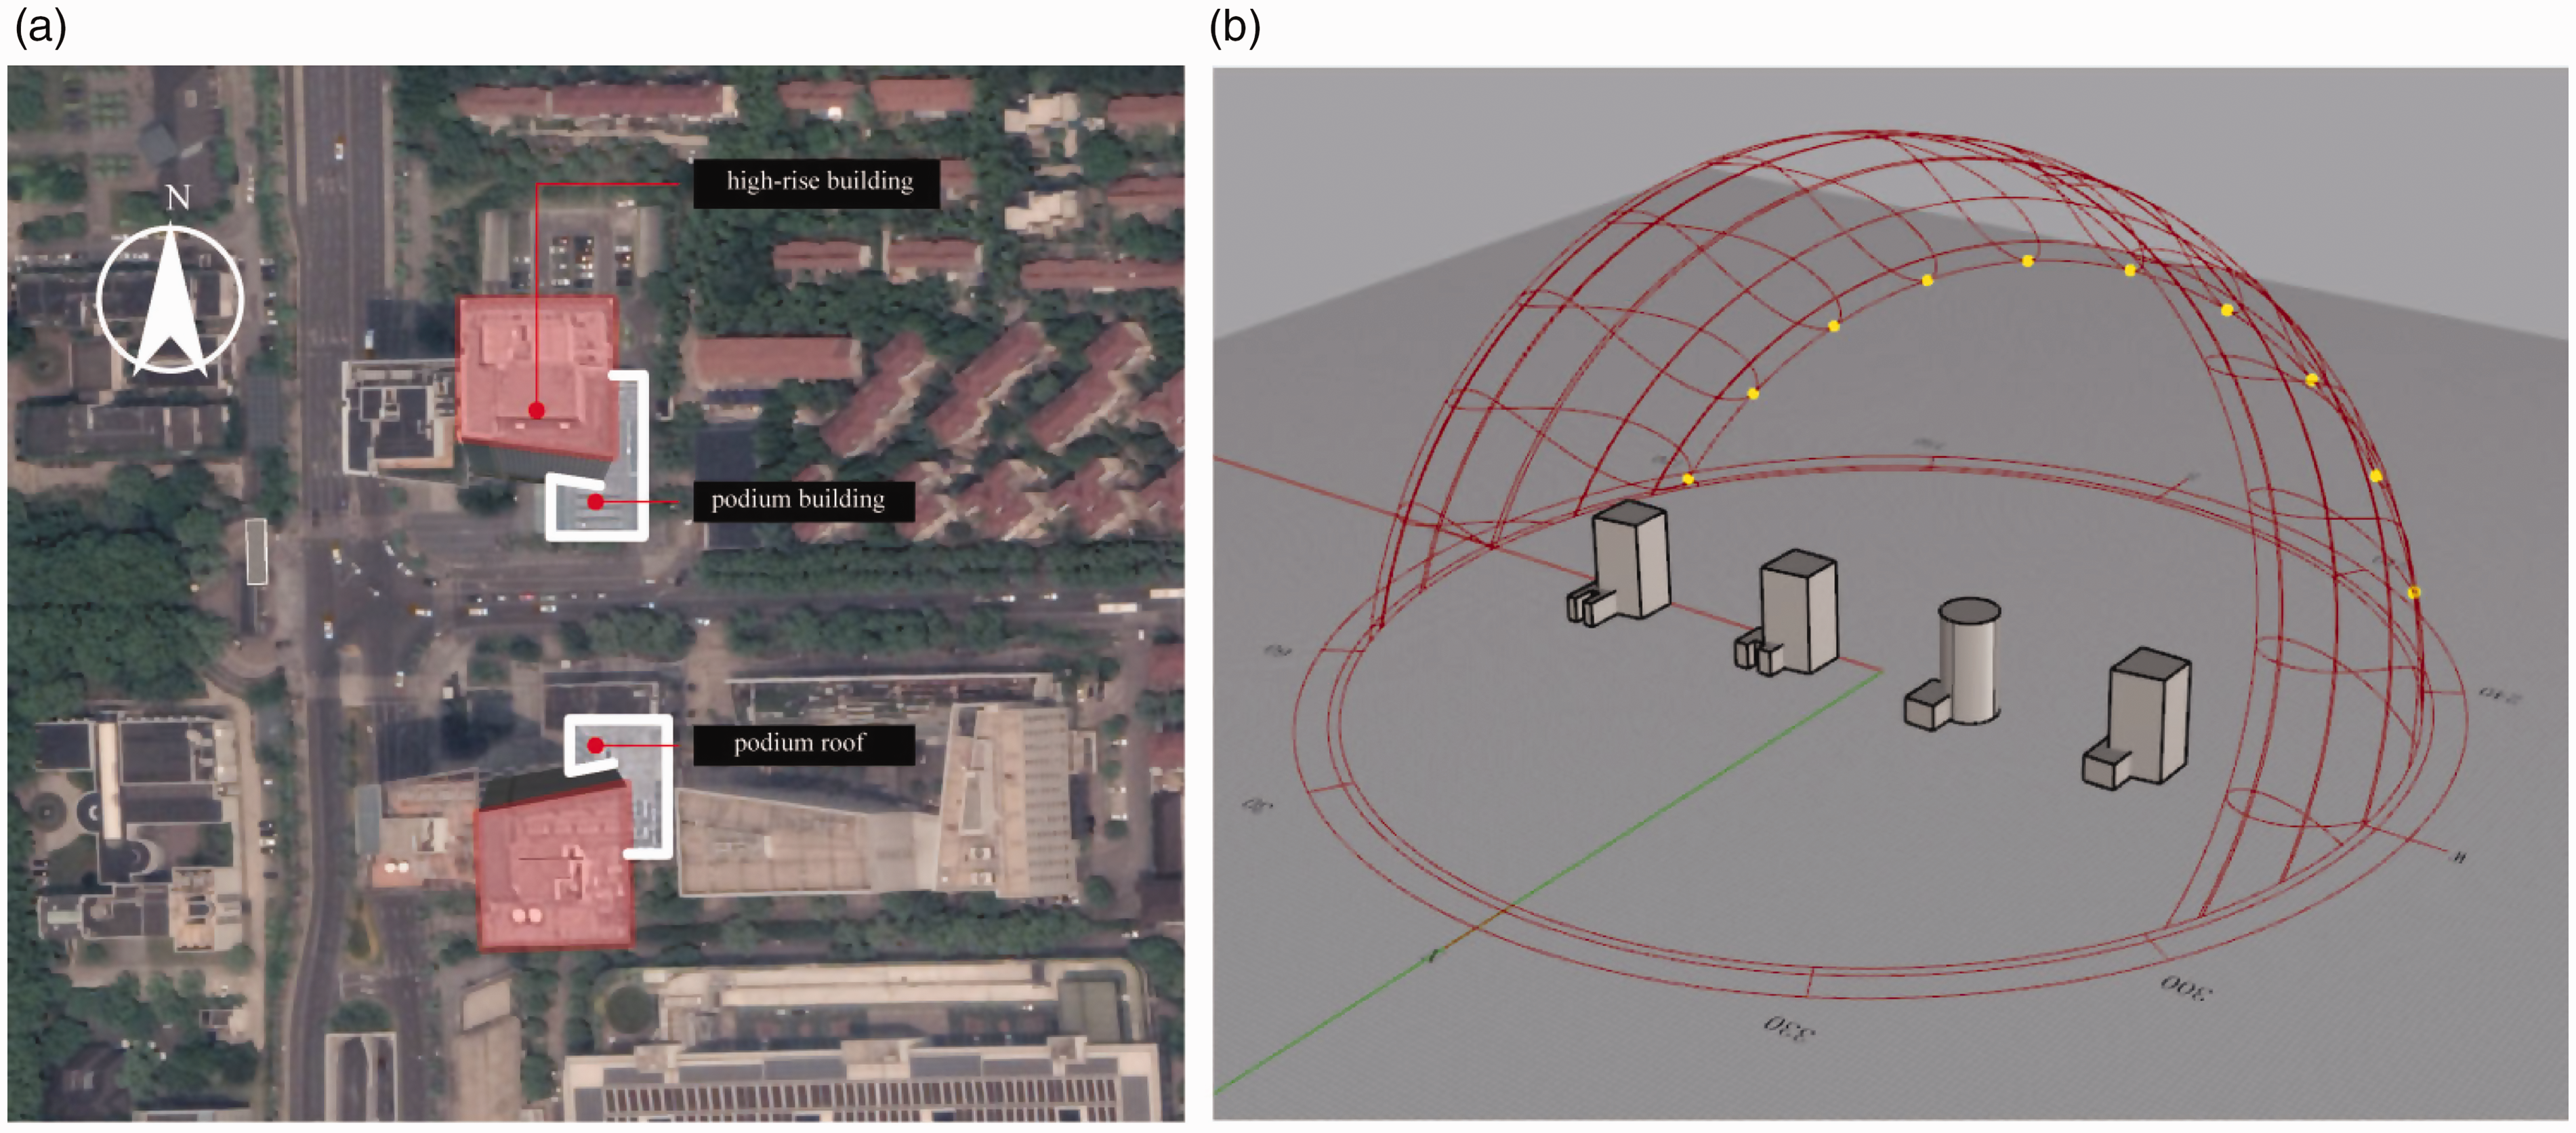
Satellite map and model graph of simulation. (a) satellite map of tongji union complex square and (b) Simulated model under shanghai weather data.
According to the research results, the best shape of high-rise building is circle and podium is ‘U’ type. Different modelled cases were performed as shown in Figure 19 and specific sizes of the model are shown in Figure 19(a).
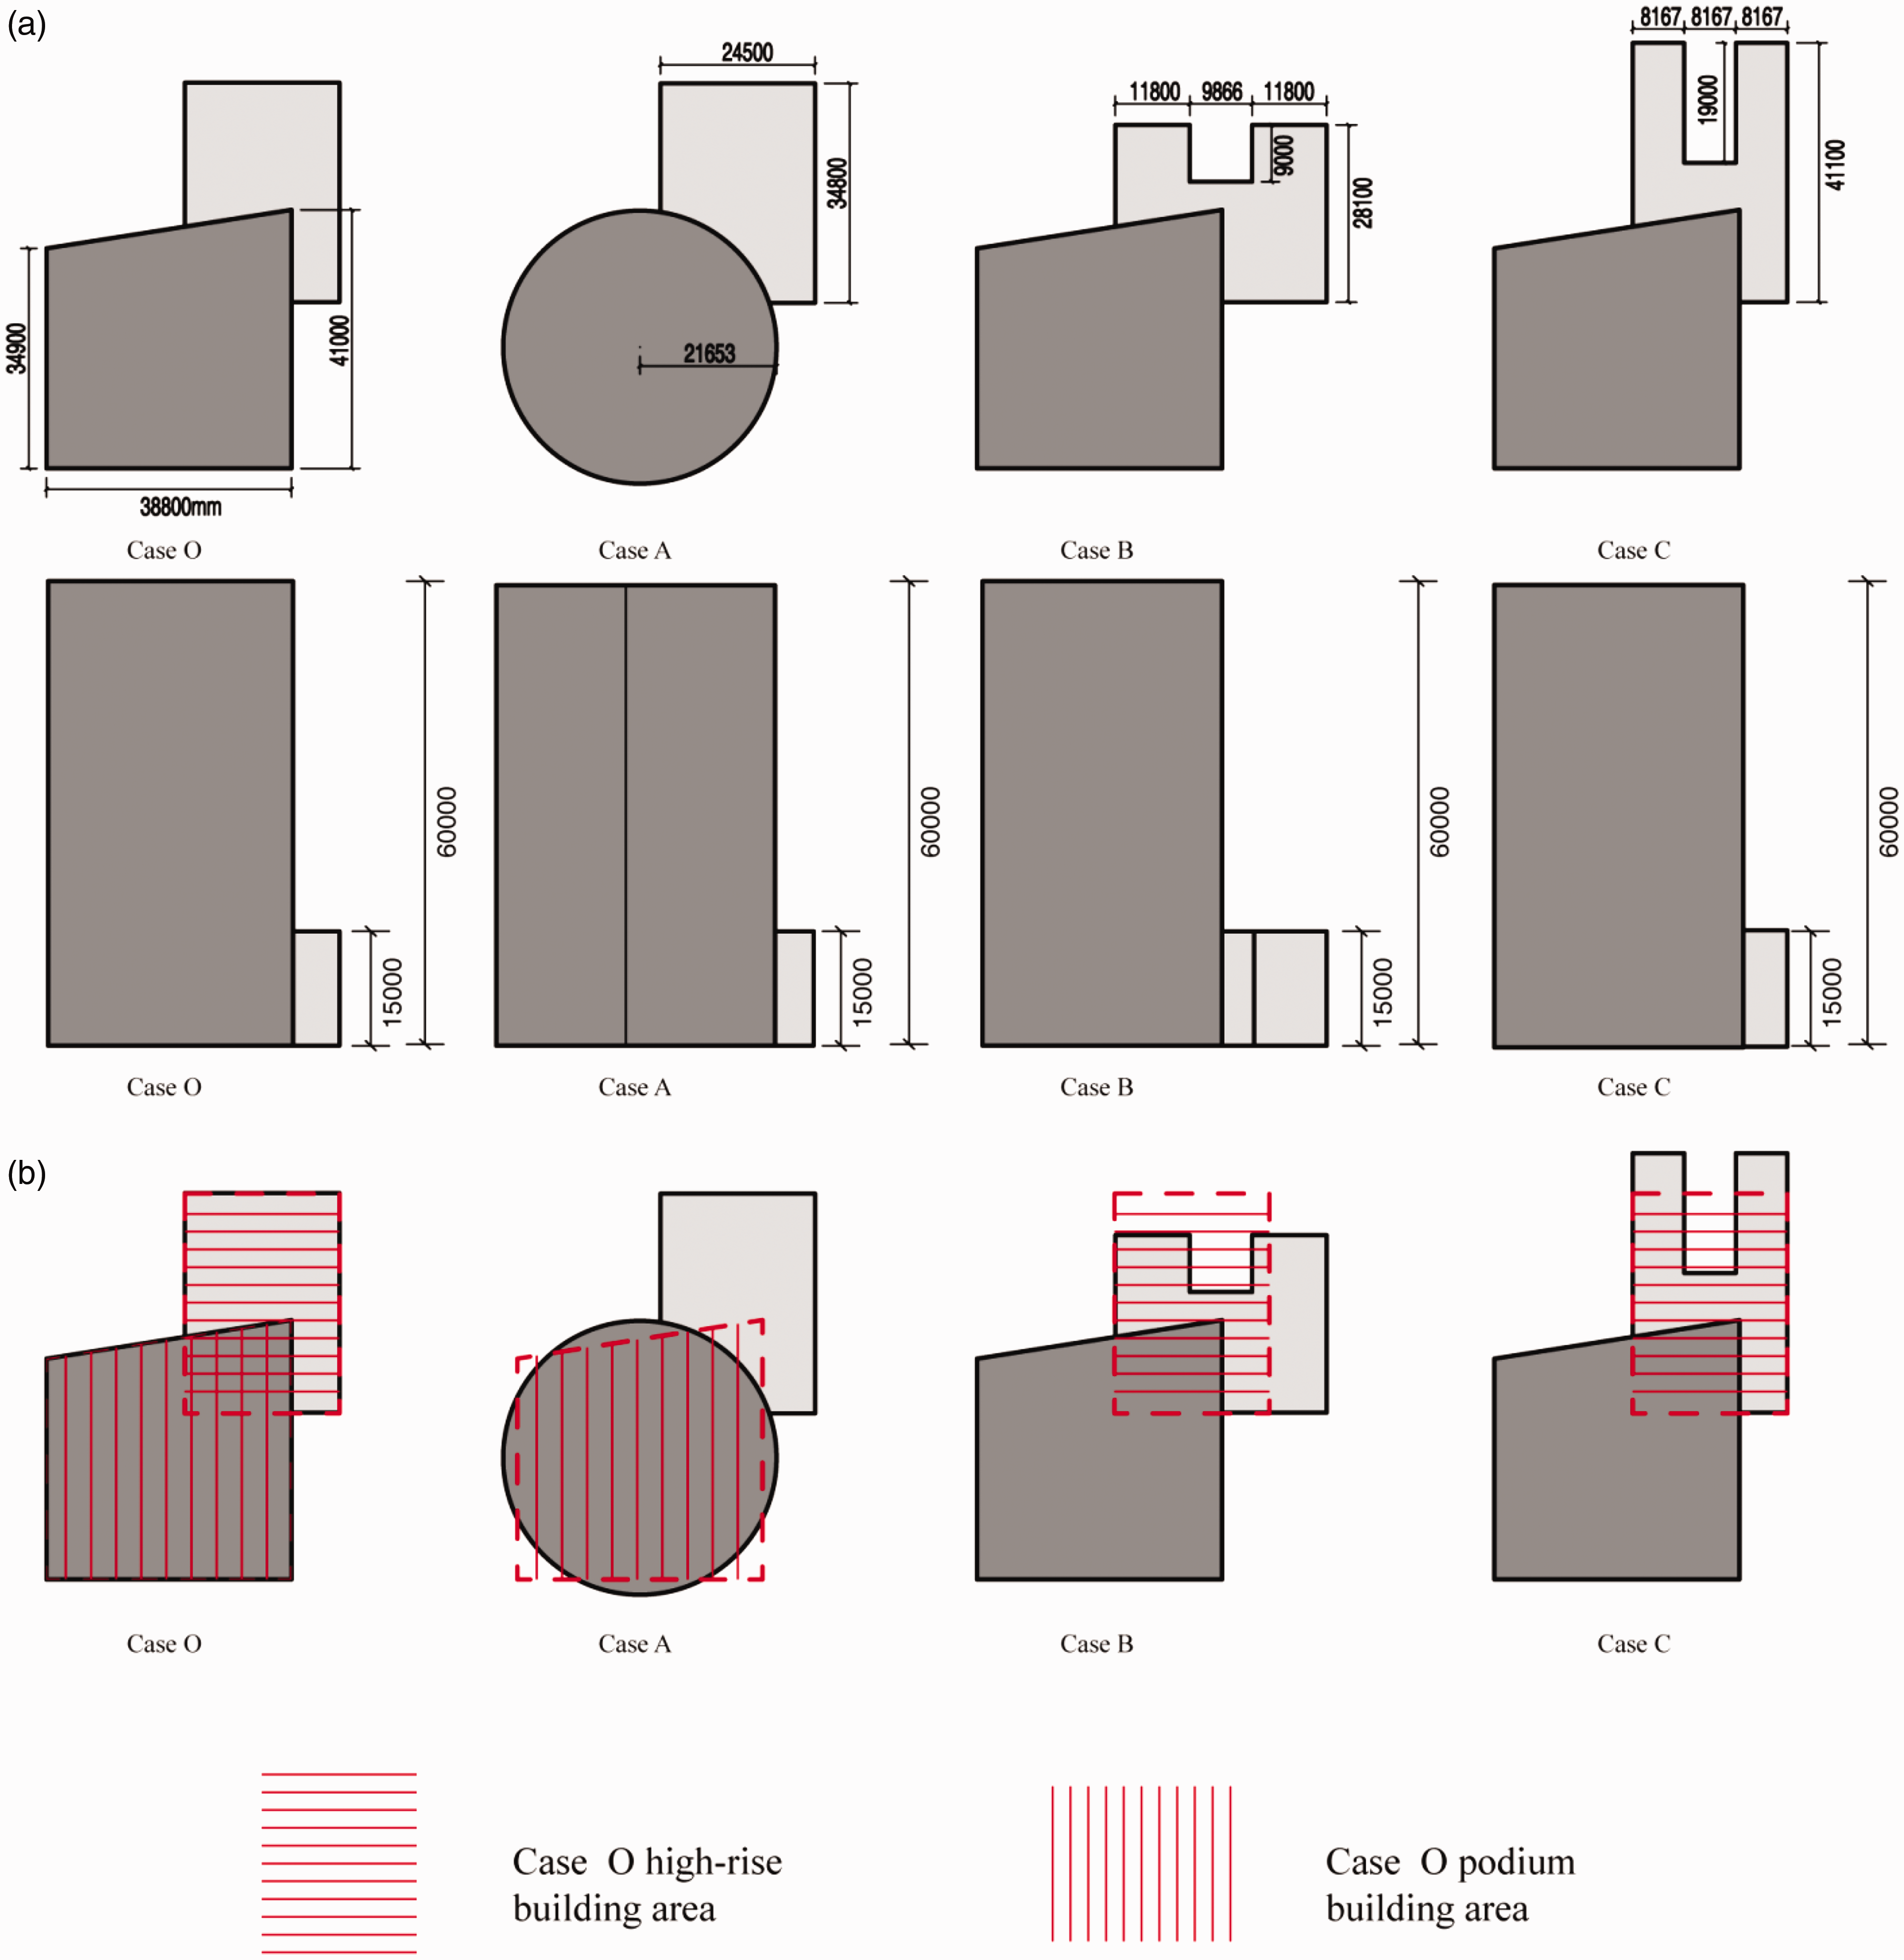
Graphical presentations of different cases: (a) Plan and elevation of different cases: all sizes of different models are shown in the Figure. (b) Area comparison between different cases: red colour lines represent the same area but with different shapes of the high-rise building or podium.
From Figure 19(b), the case O (original) is the model that was based on the actual size of the complex. The shape of case A high-rise building is circle having the same area as in the case O high-rise building. The case A podium is the same as in the case O. Apart from this, case B and case C high-rise buildings are the same as in the case O. Furthermore, podium shape of cases B and C are ‘U’ type with the same area as in case O. As the purpose of the study is to compare the sunshine effects of different shapes of buildings, cases A, B and C only change the shape of the high-rise building and podium but have the same area of complex.
All cases were simulated in winter solstice day in which the sunlight effect is the worst in a whole year under Shanghai weather data by software ladybug. Figure 20 shows the simulated results and ASH statistics of these cases. Comparing the case O with case A, Figure 20(a) illustrates that the amount of sunshine (sunlight time) of case A is better than case O. ASH of case O is much bigger than case A and the sunlight time is 0 h. The largest ASH of case O is 33.89% with 6 hours sunlight and case A has the maximum ASH, which is 35.88% with 5 hours sunlight. However, case A podium can be still irradiated with 7 hours sunlight time. The main sunlight time was between 4 and 7 hours, which are much higher than case O. Therefore, sunlight condition of case A, where the high-rise building has a circle shape is better than case A. This can be explained by the circle shape high-rise of the building block which would have less sunlight exposure comparing to case O.
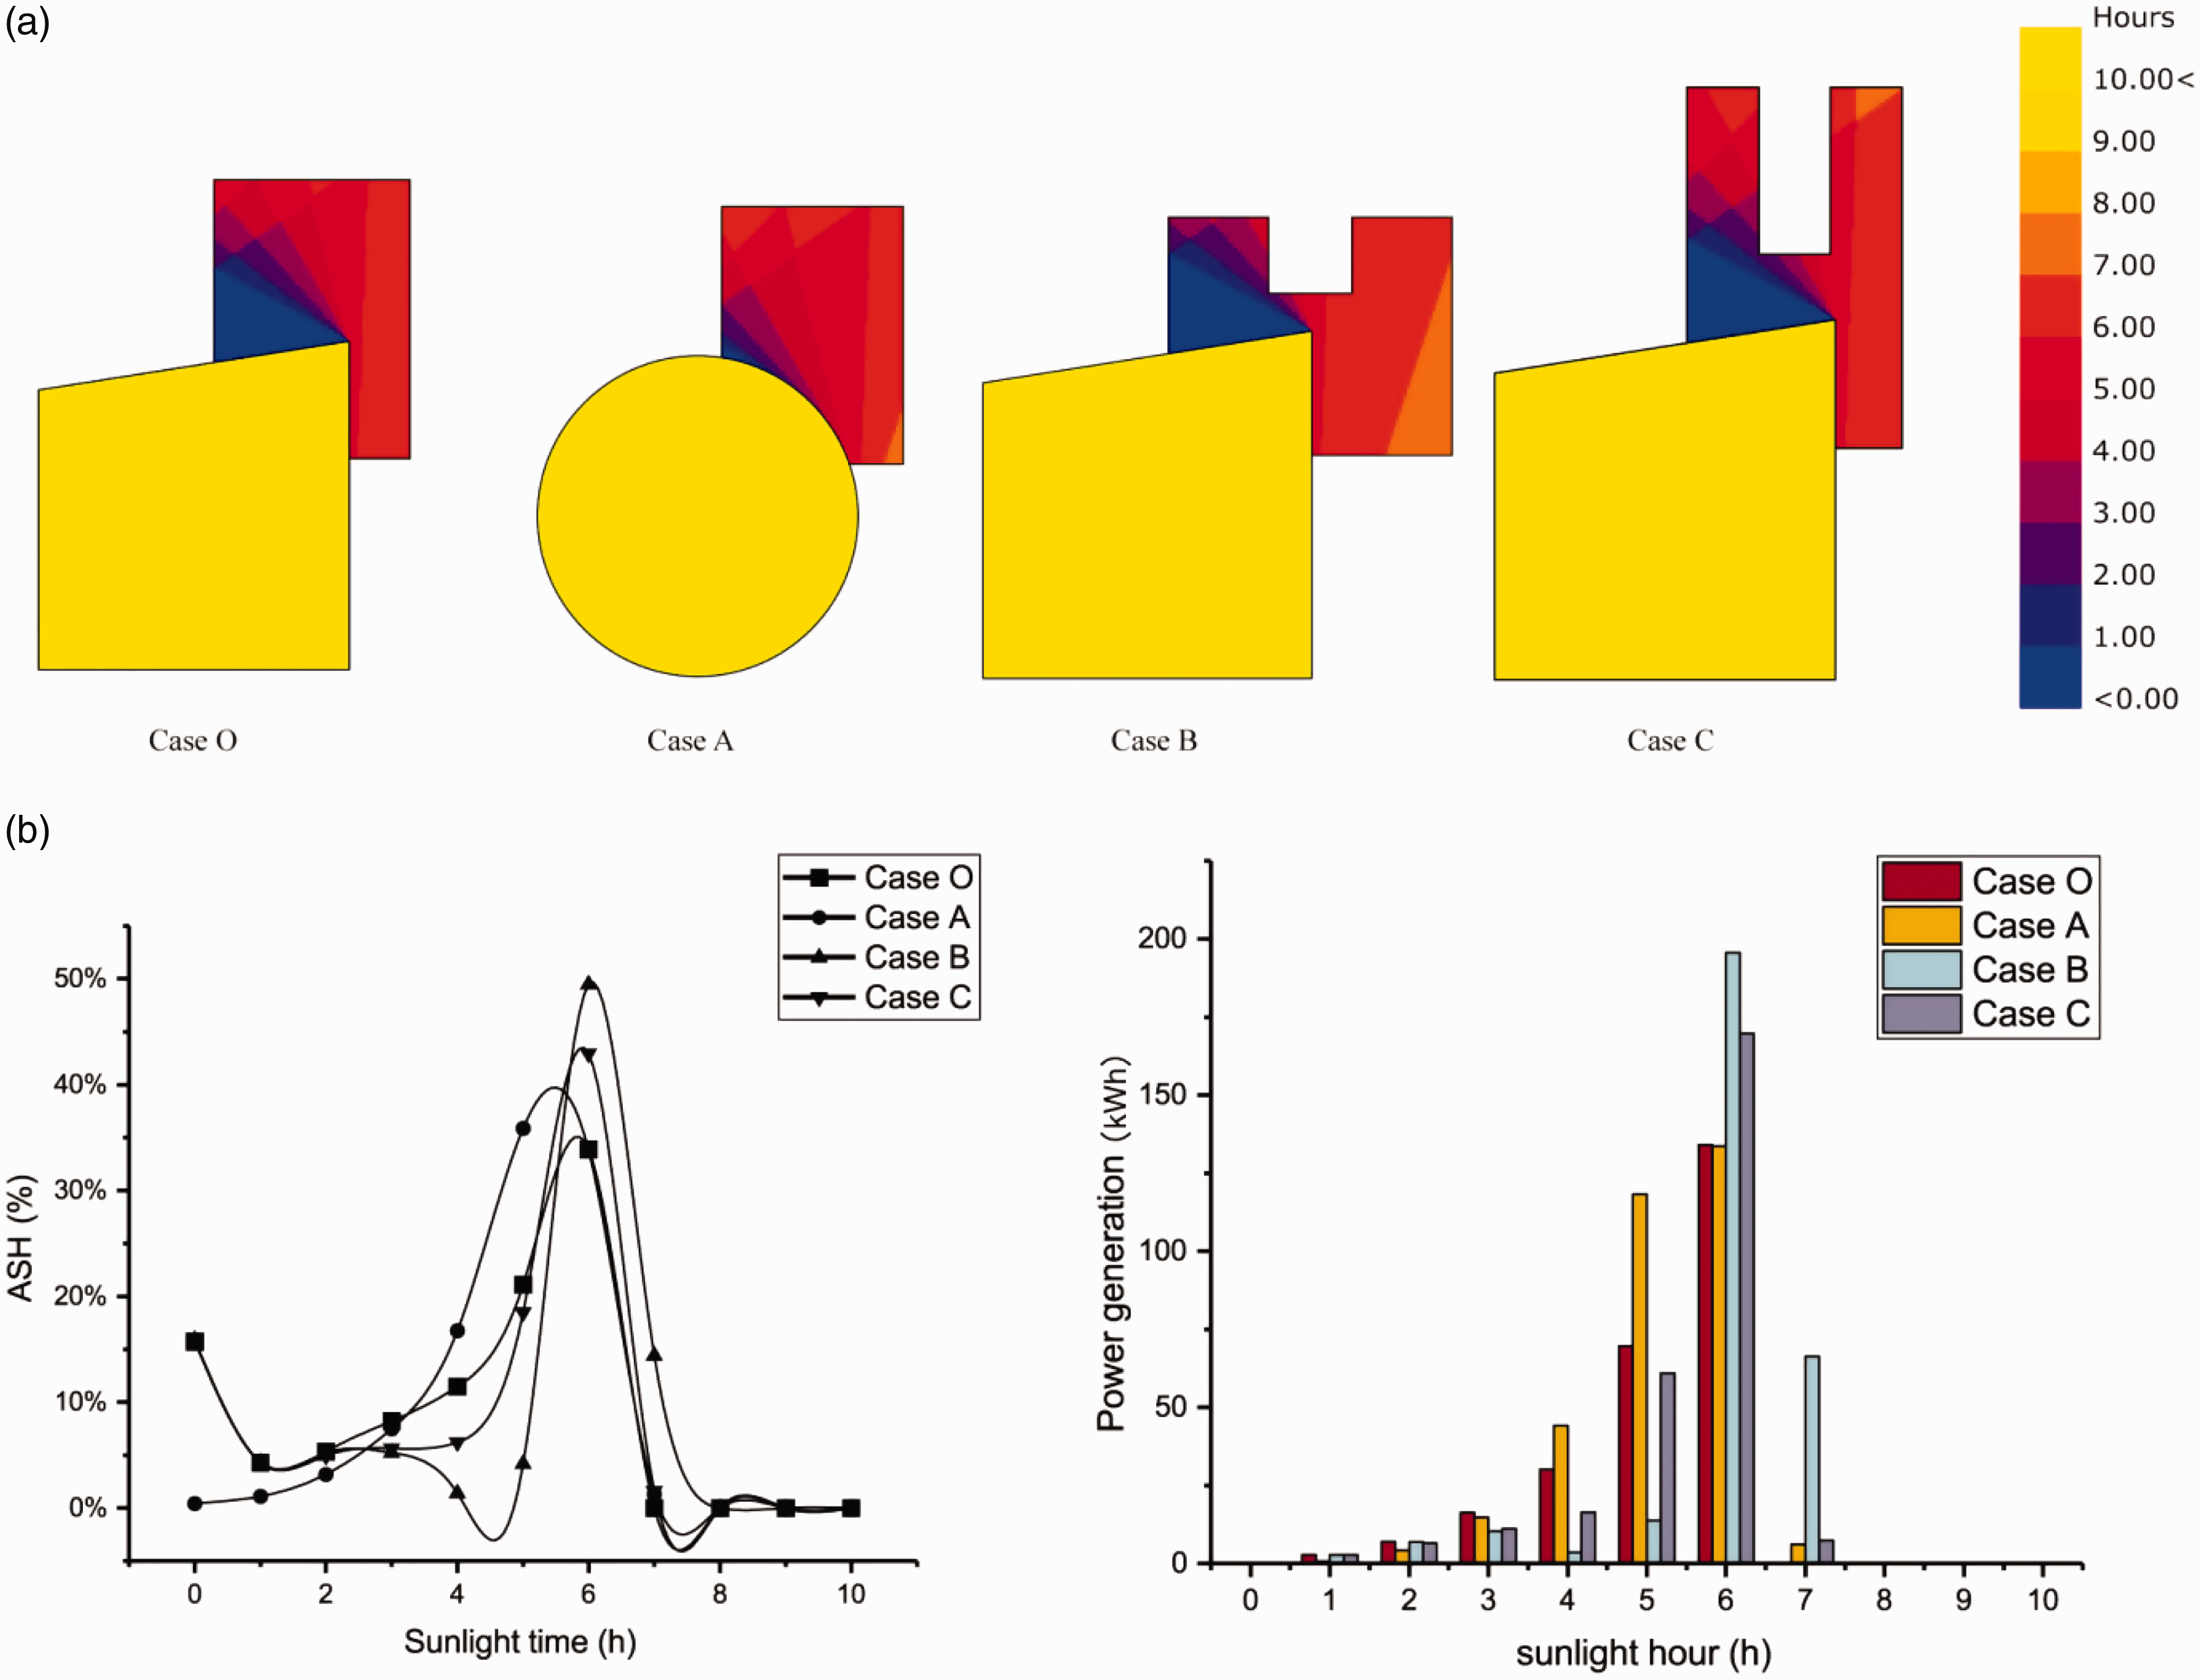
Sunlight simulation: (a) Sunlight simulation conditions of cases; (b) ASH condition and power generation of different cases: all areas of different podiums and high-rise buildings are equal with each other although the shapes of them are not the same.
Figure 20(a) illustrates the simulated distribution condition of sunlight in cases B and C, which has a ‘U’ type podium shape and has the same podium area as in case O. Additionally, high-rise buildings were kept the same in the simulation in the three cases of cases O, A and B.
From Figure 20(b), although under the ASH condition not being exposed to the sun, these three cases are similar with each other, however, when the sunlight time is 6 hours, the ASH peak value would be apparently different in each of these cases. Obviously, the sunlight situation of case A is the best and case O is the worst when the sunlight time is 6 hours. As shown by the result, the ‘U’ shaped podium would be more conducive to making more solar panels to receive sunlight in comparison to the square type of podium.
To analyse in details the effect of sunlight conditions on power generation, these were computed, and the results are as shown in Figure 20(b). The relationship of power generation effect between cases was shown to almost in correspondence with the sunshine effect. Basing on parameters of the PV system which was installed on the roof of Tongji complex building, the power generation was calculated by equation (4), as follows

As shown in equation (4), A is the power generated and the unit is kWh. SR (m2) is the area of podium where the PV panels were installed. The podium roof area is 627.6 m2. P (W) is the solar photovoltaic panel power that was used. This was 150 W, which was generated by the solar power system in Tongji complex building. E represents the utilization efficiency of PV panel which was 70% and T is the corresponded sunlight hour.
In all cases, the biggest power generations were produced with 6 hours of sunlight and in case B, the electric production was the highest among all cases under this situation. Case A's has 5–6 hours of power generation and was always at a high level. In addition, regarding case A, the overall power generation was inferior to the other cases and is the only case that could not produce electricity after 7 hours of sunshine.
Figure 21 shows the amount of power generated in all four cases. Case A was shown to generate the most power, which was 321.88 kWh per day comparing to other cases. Case O produced the least power, which was 259.88 kWh. Other cases of B and C produced 299.28 and 274.92 kWh power respectively. These were slightly lower than case A. Hence, circle shaped high-rise building can save almost 23.85% of power energy comparing to the building complex in Tongji Union Square. When the podium has a ‘U’ shaped pattern, more than 10% of power energy can be saved than is currently produced in the Tongji complex.
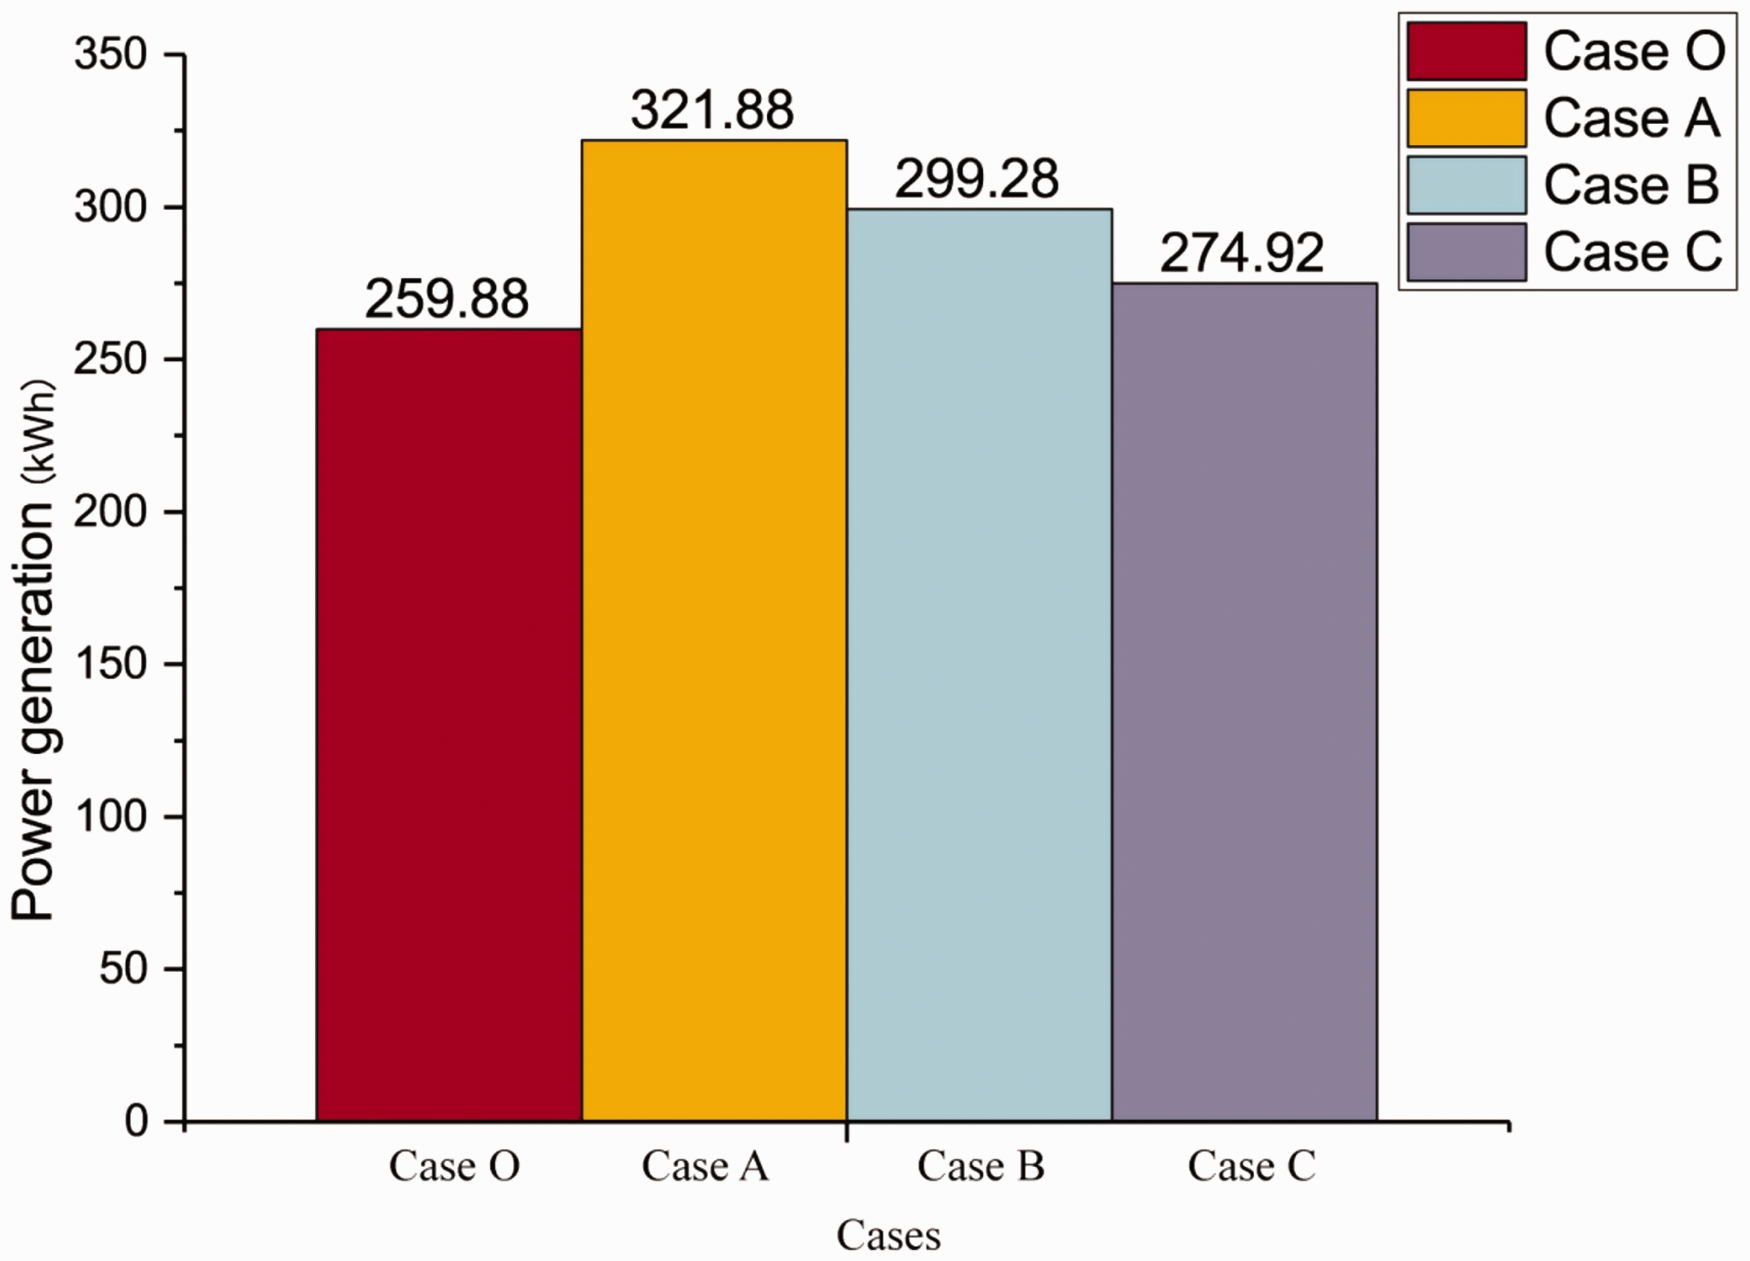
Amount of power generation in different cases.
This article studied the shading effect problem based on the specific location of the building in Shanghai. For other regions, although the sun's altitude angle is different, the relative sunshine shading relationships between buildings, would remain no difference in comparison to Shanghai. The only difference is the variation in the absolute sunshine intensity. Therefore, researchers could use the results to design and compare building shape that can be beneficial for the BIPV system.
Conclusions
The BIPV system can make full use of solar energy, which would help to maximize energy efficiency and also would contribute to the improvement of indoor built environment quality. This paper mainly studied the building shading effects which is one of the main impact factors for BIPV. The ladybug tool was used in this paper in order to simulate the sunshine hours more efficiently and ASH, CASH were used to assess the final results of various cases. The main conclusions are as follows:
The best shape of a high-rise building for BIPV system to be installed on the roof of the podium building is circle and square while triangle, rectangle and ‘Y’ types are worst shapes of high-rise buildings for BIPV system. ‘L’ and ‘U’ types of building shape can be beneficial for BIPV in some cases when the shapes of the podium building are square, rectangle, triangle and ‘U’ types. The best shape of the podium building for BIPV system is ‘U’ type. This type would allow good sunlight exposure on the roof of the podium building no matter what the high-rise building shape is. The worst shape of the podium building for mounting the BIPV system is square which would prevent most area of the roof of the podium building to receive enough sunshine. There can be different sunlight distribution situation in different cases. Generally speaking, when the high-rise buildings are square and circle, the sunlight distribution has a best condition since most areas of the podium roof in these cases would enable BIPV to absorb the sunlight in more than 10 hours. When the high-rise building is ‘L’ or ‘U’ type, the sunlight distribution condition would be the worst because the shadow area would be the biggest in these two cases. Apart from this, the triangle shape of the high-rise building can lead to all podium roofs to be exposed under the sun whatever the podium pattern is. Although the sunlight time intensity would not be relatively high under this case. The optimal height, tilt angles, orientations and array spacing for best power generation efficiency: the best tilt angle for solar panels is 30°, which would produce the best power generation efficiency much better than the 90° tilted angles. The best orientation is southward followed by southeast, southwest and upward facing the sky. The difference between power generation efficiency of orientations is less than 1%.
BIPV system can be conducive to create a better indoor built environment. Highly efficient BIPV could contribute to energy efficiency, which in turn would affect people's power saving behaviour. This helps to extend the use of lights, air conditioners and so on, thus would create a better indoor environment quality.
Footnotes
Authors’ contribution
All authors contributed equally in the preparation of this manuscript.
Declaration of conflicting interests
The author(s) declared no potential conflicts of interest with respect to the research, authorship, and/or publication of this article.
Funding
The author(s) declared the following potential conflicts of interest with respect to the research, authorship, and/or publication of this article: This work was financially supported by National Science Foundation of China (Grant No. 51378365).