
Abstract
A total of 45 households were selected to participate in a study to assess indoor exposure to particulate matter (PM) and total volatile organic compounds (TVOC) while cooking a widely consumed Ethiopian traditional stew sauce (Wot, in Amharic). The geometric mean (GOM) concentrations of PM1, PM2.5 and PM10 when electricity, kerosene and charcoal fuel sources were used during the wet season ranged 11.4–151 µg.m−3, whereas the GOM concentrations during the dry season ranged 7.7–222 µg.m−3. The GOM of TVOC during the wet and dry seasons using electricity, kerosene and charcoal fuel ranged 350–812 µg m−3. The health risks associated with exposure to PM2.5, PM10 and total suspended particulate matter (TSP), either as a single pollutant or cumulative based on the hazard quotient (HQ) or hazard index (HI) calculation by U.S. Environmental Protection Agency, indicate that exposure to PM2.5, PM10 or TSP while cooking Wot using electricity, kerosene and charcoal fuels may not cause health problems to a healthy adult. However, long-term exposure to high levels of PM10 emissions when charcoal fuel is used is considered to be unsafe. The exposure to all the emitted pollutants during the use of any of the three fuels sources may also pose a human health impact to individuals near the sources.
Introduction
More than 40% (>3 billion people) of the world’s population rely on unprocessed solid biomass fuels (wood, charcoal, agricultural residues and animal dung) for their daily household energy needs.1,2 Such types of fuel use are much higher in developing countries than in developed countries. Studies in Sub-Saharan Africa have shown that 90–95% of domestic energy (for cooking, lighting and heating) depends on the biomass fuels, with cooking having a significant share. In Ethiopia, more than 90% of the population use biomass fuels for cooking, heating and lighting, of which 99% is derived from firewood, charcoal, crop residue and leaves.3,4
Exposure to high levels of air pollution has been consistently associated with different types of diseases, such as the risk of respiratory tract infections, exacerbations of inflammatory lung conditions, cardiac events, stroke, eye disease, ischaemic stroke, tuberculosis and cancer.5–14 However, the type of diseases caused by air pollution depends on the pollutant concentration in the air, the type of pollutants, the composition of pollutants (which is affected by its sources) and the length of time that an individual inhales the pollutants. Thus, chronic exposures to low levels of pollution might result in an equivalent dosage to a person who undergoes acute exposures to a high level of air pollution. For example, according to WHO, women exposed to biomass smoke for 2 to 4 h during cooking can inhale total suspended particulates (TSP) and benzo(α)pyrene in an amount equivalent to smoking 40 cigarettes in 24 h. 15
Generally, among the substances in polluted air, particulate matter (PM) with different aerodynamic diameters and total volatile organic compounds (TVOC) are major components and they are a health concern in the world nowadays.16,17 Carbon-based compounds that have high vapour pressures and significantly vaporize and enter the atmosphere are called volatile organic compounds (VOCs). 18 TVOC and PM with different aerodynamic diameters released during the combustion of biomass fuel and traffic emissions are a significant problem for the developing world in general and Ethiopia in particular.19,20 The comprehensive exposure assessments of PM with different aerodynamic diameters and TVOC are used for estimating the health burden of people, for assessing the contribution levels of various sources and for developing strategies for management.
Thus, several studies have been carried out around the globe on the exposure assessment of different pollutants in different scenarios. The exposure assessment to indoor air PM and TVOC during different activities is very important for estimating the contribution of each activity to the total daily exposure. Moreover, recently, the studies also focused on identification of high pollutant-emitting activity and personal exposure assessment, which are used to design and take the intervention at the individual level.21–25 Likewise, in Ethiopia, very few cross-sectional and pilot studies have been conducted on exposure assessment for both indoor and outdoor air pollution. Hence, different researchers have reported concentrations of CO, NO2, PM10, PM2.5 and TSP in indoor and outdoor air at different parts of the country (Gonder, Butajira area, Shebidino wereda, rural area of Tigray, Kebribeyah, rural area of Jima, rural area of Wellega and Gimbie and Addis Ababa). Most of the levels of indoor air pollution exceeded United States Environmental Protection Agency (US EPA) and WHO guidelines.26,27 This might be due to living in crowded and poorly ventilated housing, and to limited access to separate cooking and living areas in rural and urban homes, which is a common feature of living conditions in Ethiopia.2,6,15,28–32 In general, the air pollution and its health impact were studied by the measurement of air pollutants at a fixed place, which does not predict accurate exposure assessment for pollutants. Thus, using personal exposure data at different microenvironments rather than fixed monitoring data is the better method in exposure assessment and in identifying the role of each microenvironment to personal exposure.33–35 However, almost all exposure assessment studies for PM in Ethiopia have been based on 24-h measurements at fixed sites for indoor and outdoor air, which might not show the real exposure of a person. This is because the person does not stay in the home or outdoor for 24 h. Although acute exposure to a high level of PM has been shown to cause health problems, studies conducted in Ethiopia lack information on quantification and assessment of short-term exposure (from one to several hours) to PM from different activities.20,36,37 There are a limited number of rigorous studies conducted in Ethiopian households that quantify indoor microenvironment TVOC levels from everyday activities and that assess the health impacts of short-term exposures.
Consequently, real-time personal monitoring coupled with individual activity data are required for assessing the exposure risk of population groups and the level and frequency of exposure. This type of measurement should be carried out at the microenvironment level, especially where high exposure occurs. 38 Nevertheless, none of the Ethiopian studies conducted so far measured at specific microenvironments. Among the cooking activities using biofuels in Ethiopia, cooking of the most widely consumed sauce called Wot is the major activity. People cooking such type of stew have used different kinds of fuels, namely electricity, kerosene and charcoal, which are widely used fuels for cooking Wot in urban areas. Among these fuels, charcoal is the most widely used fuel. 39 Also, the level of PMs and TVOC emitted from different fuel types in preparing Wot might be different. Hence, measurement of such pollutants is vital for selecting the better fuel type and estimating the health impacts of the Wot cooker. However, to the best of our knowledge, no studies have been carried out for quantification of PM and TVOC while cooking Wot using charcoal, kerosene or electricity in households at Addis Ababa or anywhere in Ethiopia.
Therefore, the present study focuses on (a) assessing short-term exposure to PMs and TVOC during the cooking of Wot in 45 individual households using different biomass fuel types, (b) comparing the level of emissions during the cooking of Wot using charcoal, kerosene and electricity and (c) estimating the health risk to the person cooking due to lifetime exposure to PM2.5, PM10 and TSP during the cooking of Wot.
Material and methods
Description of study area
Ethiopia is the second most populous country in Africa with a population of 102.4 million in 2016, while the population is predicted to reach 108.1 million by the end of 2018. The metropolitan city of Addis Ababa has a population exceeding three million and has been growing at a rate of 2.1% from 1994 to 2010. 19 The city is situated at the centre of the country at an altitude between 2200 and 2800 m above the sea level, between latitude 9.0300°N and longitude 38.7400°E. Average minimum and maximum annual temperatures range from 9.53 to 23.2°C. 40
Since the level of outdoor pollution can influence the personal exposure to indoor air pollution, the selection of sub-cities before the selection of households is important. Thus, three representative sub-cities (Arada, Gulelle and Akaki Kality) were selected as sampling sites based on differences in altitude, socioeconomic activities and population density. Arada is mainly characterized by high population density, medium traffic intensity and no industries; Gulelle has very few industries, medium traffic intensity and lower population density than Arada, whereas Akaki Kality is marked by lower population density than all the sub-cities, heavy industrial activities and high traffic congestion. Arada, Gulelle and Akaki Kality were selected as sampling sub-cities for the measurement of indoor air pollutants during the cooking of Wot using different fuel types in both the wet and dry seasons. Most of the time, the type of Wot selected for this study was prepared and consumed by low and middle income people. The households considered in this study were similar in their construction materials (wood wall, ceramic floor and roof of corrugated iron). Such houses are typical for low and middle income people in Addis Ababa and also in most Ethiopian cities. The fuel type they used and the willingness of families to allow the researcher into their house for measurement were also considered during the selection. In total, 45 homes (15 from each sub-city) were selected randomly due to a generally similar procedure in the cooking of Wot.
Wot preparation techniques
Stew/sauce (Wot, in Amharic) is one of the main constituents of dishes for Ethiopians. From simple observation, the stews of lentil (Misir, in Amharic), pea (Shiro, in Amharic) and potato (Dinich, in Amharic) are most widely used stews. Powdered chilli pepper (Berbere, in Amharic), onion and salt are the primary ingredients used for the preparation of lentil (Misir), pea (Shiro) and potato (Dinich) Wot. Besides these, garlic, tomato paste and turmeric are optional ingredients.
The name given for each Wot is based on the major ingredients it contains. Thus, lentil sauce (Misir-Wot) contains lentil in large proportion. Similarly, Shiro Wot and potato sauce (Dinich Wot) contain a large proportion of powdered pea and chopped potato, respectively. The cuisine of such stew is similar, besides the difference in the major ingredients. Moreover, these types of stew are a popular staple food for many Ethiopians.
PM and TVOC measurement methods
The levels of TVOC during the cooking of Wot using three different types of fuel were measured in 45 individual households with an easy-to-use and portable sensor (AEROQUAL series 500; Aeroqual Limited, Auckland, New Zealand) with a 2-min interval. The sampler was calibrated according to the manufacturer's procedure, at a flow rate of 0.03 m3/h (0.5 l/min). The instrument used a photoionization detector (PID). Once the sampled air is passed through the inlet, ionization of the VOCs molecules by UV absorption occurs, and the ions are counted by a detector. These ions produce a current that is amplified and displayed on the meter as ‘ppm’. The instrument has a detection range of 0–1000 ppm. The measurements for both PMs and TVOC were carried out between 1 July and 30 September 2015, for the wet season and 15 November 2015 and 10 March 2016, for the dry season, in two rounds each. The two seasons (wet and dry) were selected for this study because the concentration of pollutants may depend on seasonal variations. Also, the moisture content of the biomass fuel used for baking is usually different in the wet and dry seasons. Usually, the Wot cook remains near to the stove until cooking is completed. Hence, the sampler was put 1 m above the ground and 1 m from the stove during cooking of Wot, in order to simulate the breathing zone of the cook. During the sampling time (Wot cooking time), all other activities were stopped to prevent their interference. The measurements were started 10 min before starting the cooking and continued until the cooking ended.
The level of PM while cooking Wot was measured by a portable sensor AROCET531S (Met One Instrument, Inc. Grants Pass, OR 07526, USA). The instrument contained an ambient air inlet nozzle which reduces turbulence in air sampling. It was calibrated at a flow rate of 0.1698 m3/h (2.83 l/min). It also measured the room temperature (RT) and humidity. The PM instrument used zero count test calibration, which was performed weekly. The detection limit of the instrument was 0.1 µg.m−3. The measurement of particles was based on the counts and sizes of particles in eight different size ranges, with a proprietary algorithm to convert count data to mass measurements (µg.m−3). The instrument calculated a volume for each detected particle and then assigned a standard density for the mass conversion. The standard density value was augmented by a K-Factor setting to improve measurement accuracy. The instrument provided a separate K-Factor setting for each measurement range (PM1, PM2.5, PM4, PM7, PM10 and TSP). K-Factor values should be empirically derived via a comparison with a reference unit. If a reference unit is unavailable, the recommended K-Factor setting was 3.0. The instrument measured the PMs in the concentration range 0–1000 µg.m−3.
The PM sampling instrument was operated separately beside the TVOC sampling instrument and followed a similar sampling procedure.
Statistical package for the data analysis
A series of individual concentration measurements of PM (µg.m−3) and TVOC (mg.m−3) at 2-min intervals were made in the 45 individual households. The data were classified into three categories based on the type of fuel (charcoal, kerosene and electricity). Data were analysed by statistical data analysis using IBM SPSS version 20.0, Microcal™Origin version 6.0 (Microcal software, Inc., USA) and Microsoft Excel 2013. Initially, Shapiro-Wilks test was used for testing normality of the data. When the data were not normally distributed and concentrations were better described as log-normally distributed, the geometric mean (GOM) and geometric standard deviation (GSD) would be better for representation of data. 41
The Kruskal-Wallis sample test (used to compare all data) and the Kruskal-Wallis H independent sample test (used to compare pairs) were used to evaluate the significance of differences in PM and TVOC concentrations across fuel types and within a fuel type. Finally, the Wilcoxon signed-rank test was applied to evaluate the significant differences in the concentrations of PM and TVOC between wet and dry seasons. The significance level for all tests was set to 0.05.
Results
Description of households
Among the selected households, 15 households used electricity, 15 used kerosene and 15 used charcoal as fuel sources for cooking stoves. The demographic data ranged from one to six individuals per household, and the kitchen volume ranged 4.36–46.9 m3. The kitchen ventilation surface areas were in the range of 0.3–2.40 m2. As far as the location of the cooking place was concerned, 12 cooking sites were in a separated area from the living room and the rest were inside the living room. Table 1 shows detailed information of the kitchen characteristics including the fuel type, ventilation type, the volume of the kitchen and family size for selected households.
Some characteristics of kitchens in the selected households at different sampling sites.
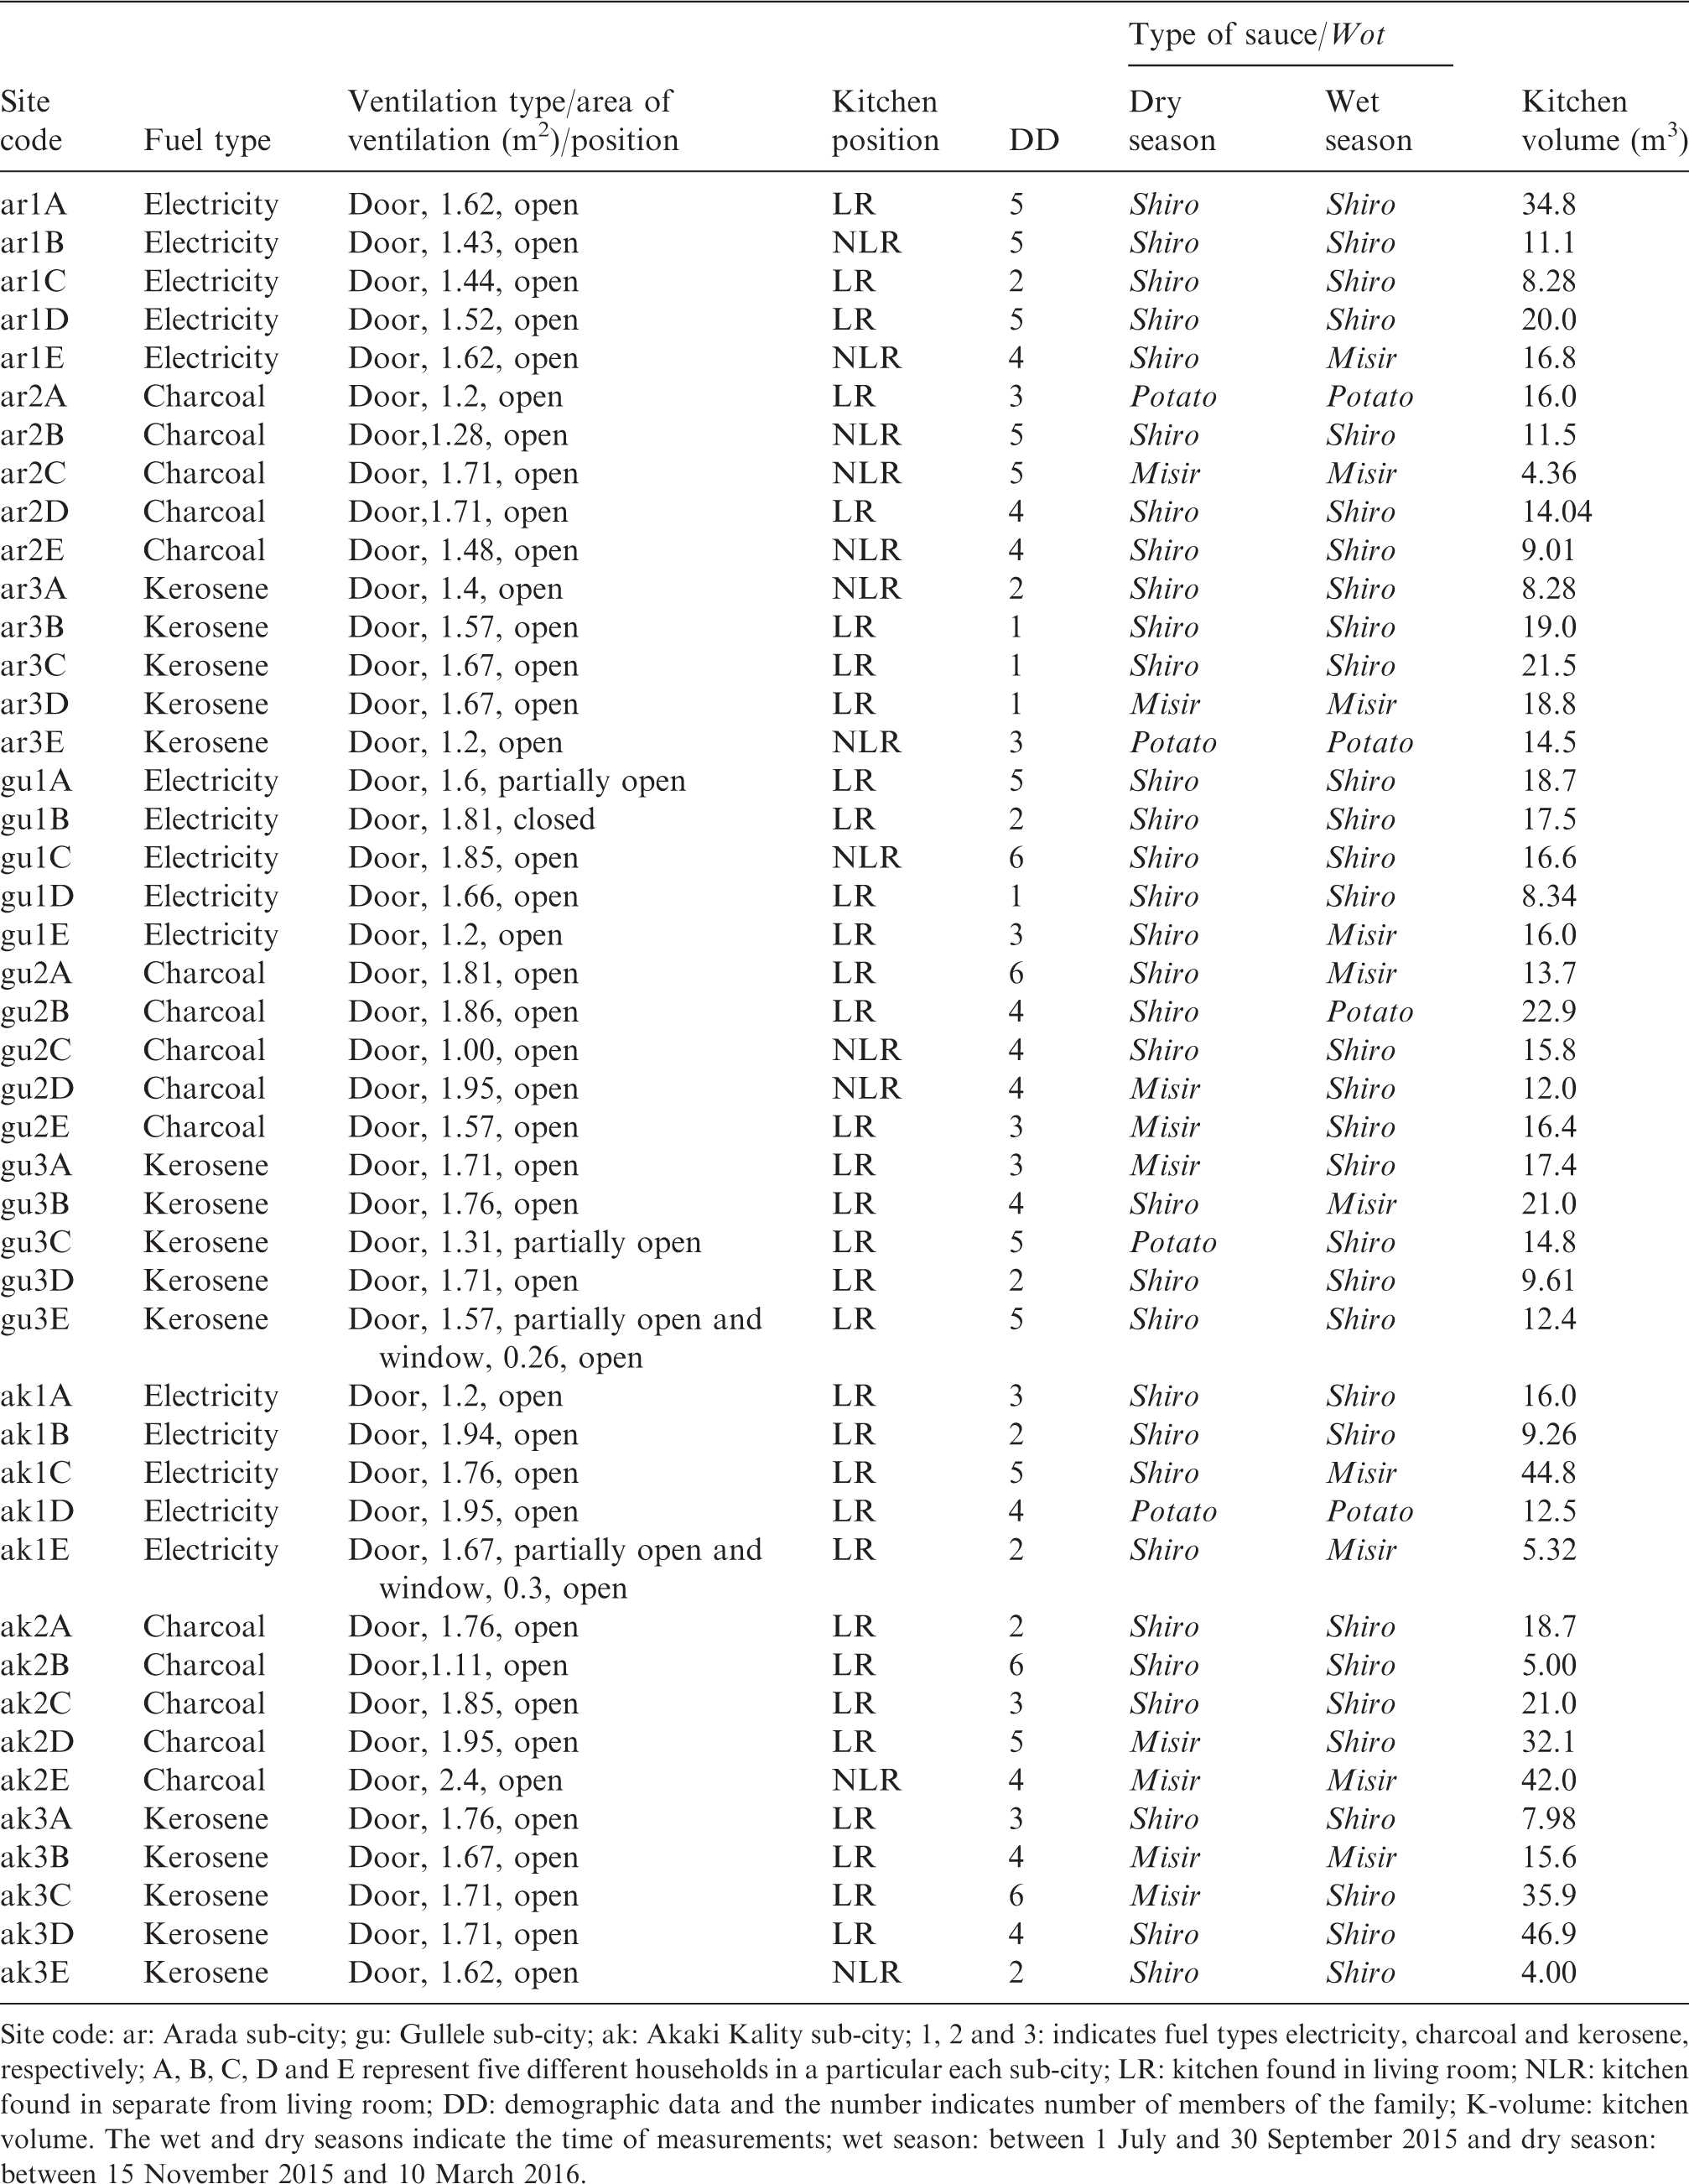
Site code: ar: Arada sub-city; gu: Gullele sub-city; ak: Akaki Kality sub-city; 1, 2 and 3: indicates fuel types electricity, charcoal and kerosene, respectively; A, B, C, D and E represent five different households in a particular each sub-city; LR: kitchen found in living room; NLR: kitchen found in separate from living room; DD: demographic data and the number indicates number of members of the family; K-volume: kitchen volume. The wet and dry seasons indicate the time of measurements; wet season: between 1 July and 30 September 2015 and dry season: between 15 November 2015 and 10 March 2016.
PM and TVOC levels
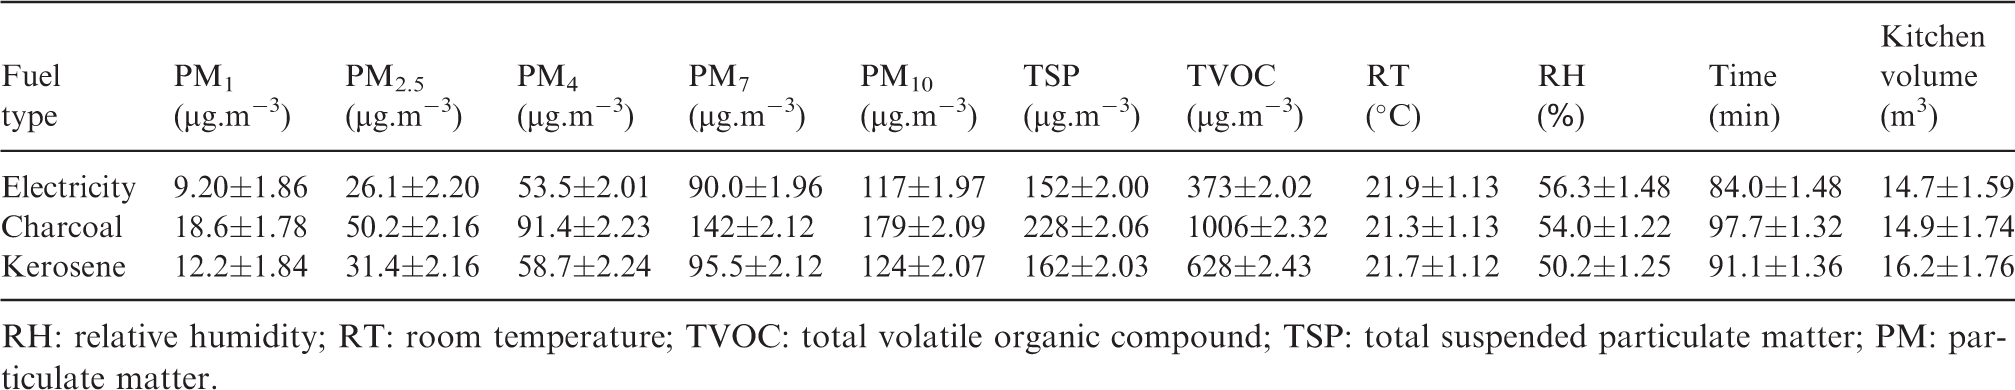
In this study, the concentration of PM and TVOC was measured during the cooking of Wot using electricity, kerosene and charcoal fuel. The Shapiro-Wilks test was applied to concentration data for each fuel type at different seasons, which showed that the data did not have a normal distribution. Hence, all concentration data are reported as GOM and GSD for both seasons. The GOM concentrations of PM and TVOC emitted while cooking using electricity, charcoal and kerosene for the wet and dry seasons are shown in Figure 1, and the data are summarized in Table 2. The room temperature (RT) and the relative humidity (RH) of the room were recorded during the cooking of Wot, and these results are also given in Table 2.
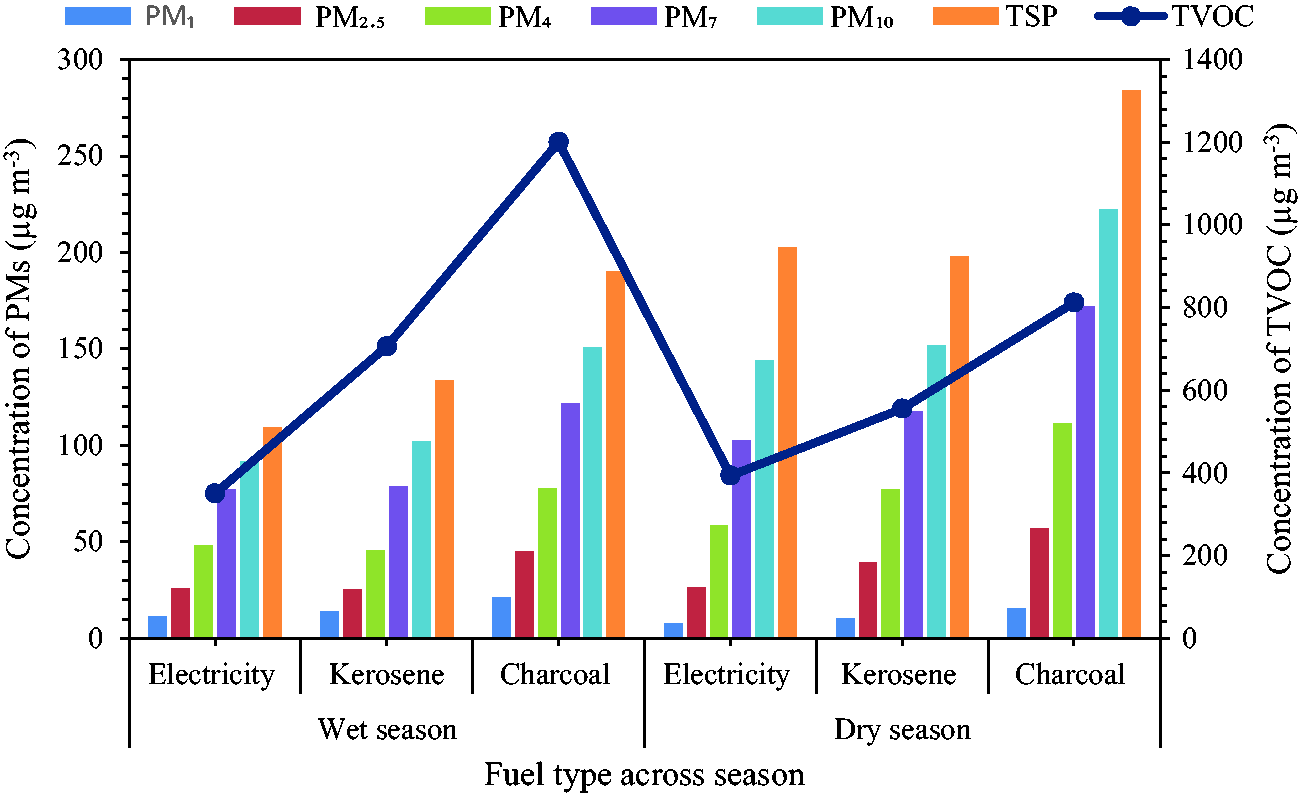
The levels of PM and TVOC during the cooking of Wot using different fuel types in dry and wet seasons.
The GOM concentration of PM and TVOC and mean values of RT (room temperature), RH (relative humidity of the room) and time period during the cooking of Wot using different types of fuels during the wet and dry seasons.
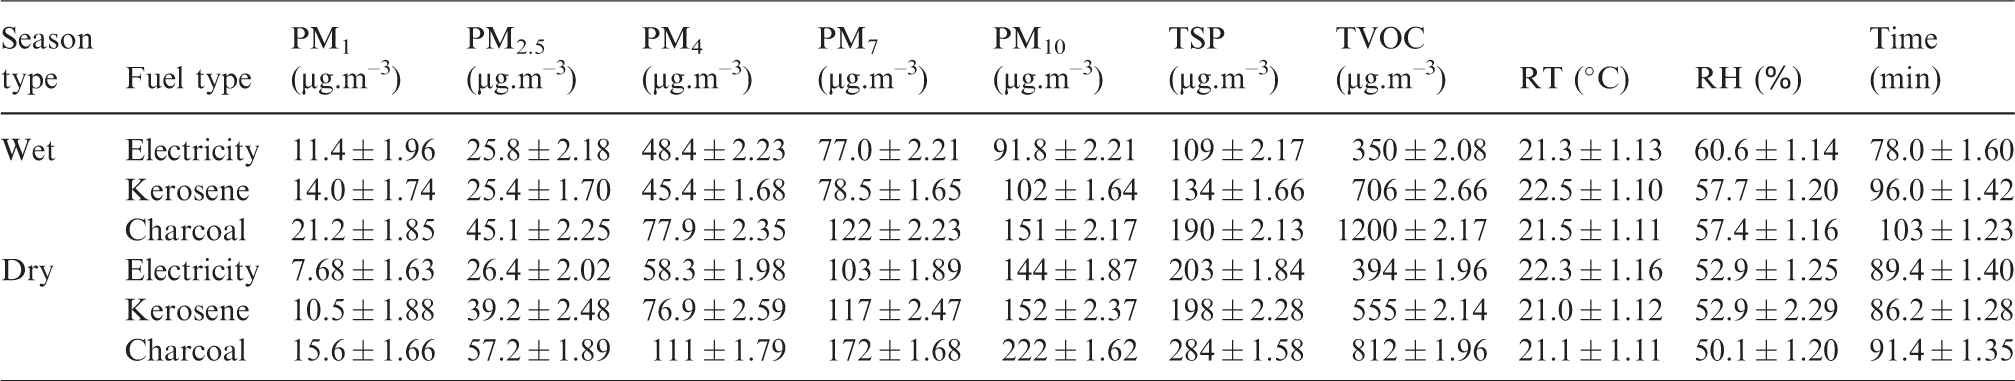
The GOM of PM1, PM2.5, PM4, PM7, PM10, TSP and TVOC measured for all fuels whilst cooking during the wet season ranged from 11.3–21.2, 25.4–45.1, 45.4–77.9, 77.0–122, 91.8–151, 109–190 and 350–1200 µg.m−3, respectively. The maximum concentrations of all types of pollutants were recorded while cooking using charcoal as a fuel source. By comparison, the minimum concentrations of PM1, PM7, PM10, TSP, TVOCs and PM2.5, PM4 were recorded whilst cooking using electricity and kerosene fuels, respectively. The levels of TVOC were much higher than levels of PM emission from each fuel type.
A Kruskal-Wallis test was applied to the data obtained for electricity, kerosene and charcoal fuel types, which showed that both PM and TVOC concentrations were significantly different across fuel types (p < 0.05). However, the difference was not recognized where it occurred, i.e. is it between the electricity and kerosene or between electricity and charcoal or between kerosene and charcoal? Hence, individual pair-wise comparison was necessary to determine the source differences. Therefore, Kruskal-Wallis H independent sample test was further applied by case selection. Thus, charcoal fuel was compared to electricity and kerosene fuels separately, and the result showed a significant difference in the concentration of emitted PM and TVOC (p < 0.05). Likewise, electricity and kerosene fuels were compared for the PM and TVOC concentrations, which showed a significant difference in their concentration (p < 0.05), but PM1, PM7 and PM10 did not show a significant difference (p > 0.12). Moreover, the average time taken for the cooking of Wot at the wet season using electricity, kerosene and charcoal fuels were 78.0, 96.0 and 103 min, respectively. Difference in the cooking time of Wot using electricity, kerosene and charcoal fuels might have also contributed to the differences in the levels of PMs and TVOC.
The GOM concentrations of PM1, PM2.5, PM4, PM7, PM10, TSP and TVOC for all fuels during the dry season were 7.68–15.9, 26.4–57.2, 58.3–111, 103–172, 144–222, 198–284 and 294–812 µg.m−3, respectively. For both PM and TVOC pollutants, the lowest concentrations were found using electricity fuel (except for TSP while using kerosene fuel). The highest concentration of TSP was found using charcoal fuel. As observed in the wet season, levels of TVOC in the dry season were also much higher than levels of emission of PMs from each fuel type. This showed that the general trend of emission of PMs and TVOC is the same in both the wet and dry seasons. The average cooking times of Wot using electricity, kerosene and charcoal fuel during the dry season were 89.4, 86.2 and 91.4 min, respectively. This shows that average cooking times of Wot were slightly shorter in the dry season as compared to the wet season.
Similar to wet season, a Kruskal-Wallis test was applied to the data for electricity, charcoal and kerosene fuel in the dry season, and this showed a significant difference in GOM concentrations of PM and TVOC across these three fuel types (p < 0.05). A Kruskal-Wallis H independent sample test was also carried out, such that charcoal was compared to kerosene and electricity fuels separately. This showed a significant difference in the PM and TVOC concentration (p < 0.05). Similarly, data for electricity and kerosene were compared, which showed a significant difference in both PM and TVOC concentrations with p < 0.05, except PM10 and TSP which did not show a significant difference (p > 0.199).
In general, as shown in Figure 1, the trend for GOM concentrations of PM during the cooking of Wot was in the order of charcoal > kerosene > electricity fuel during the dry season, whereas the emission pattern shifted to charcoal > kerosene ≈ electricity fuel, for the wet season. The patterns of TVOC were in the order of charcoal > kerosene > electricity fuel for both seasons. The variation in the concentration of PM and TVOC might be due to differences in the temperature and humidity of the room. Also, the moisture content of the charcoal fuel, the type of wood species that the charcoal was made from and the condition of the fire during measurements might be contributing to the concentration difference in PMs and TVOC in the wet and dry seasons using charcoal fuel. Also, the variation could be due to different types of ventilation, the position of the stoves from the ventilation location, the volume of the kitchen and the dispersion and deposition rates of different particles.42–44
Temporal variation of PM and TVOC
The temporal variations in the GOM concentrations of PM and TVOC were calculated using a Wilcoxon signed-rank test for electricity, kerosene and charcoal fuels, and the results are given in Table 3. The Wilcoxon signed-rank test showed a significant difference in the concentration of PM and TVOC for nearly all fuel types between the dry and wet season at p < 0.05. However, PM2.5 and TVOC did not show a significant difference for electricity as fuel. Although there is no difference in the cooking RT, the relative humidity of the cooking room and the cooking time of Wot showed a significant difference with seasons, which might affect resuspension rate or the dispersion of pollutants for the dry and wet season with fuel types. Consequently, this variation might contribute to the changes in concentrations of PM and TVOC between seasons. Also, the moisture content of the fuel, status of the fire and the formation of secondary pollutants (through condensation and coagulation) during measurements might also result in differences in PM and TVOC concentration. Another reason for the difference in the concentration of PM in wet and dry seasons could be due to the formation of secondary pollutants, which can be formed with pollutants released from the cooking process itself, without the involvement of any other pollutants emitted from other sources.45,46
Wilcoxon signed rank test result between the dry and wet season for emissions of PM, TVOC, RT and RH whilst cooking using electricity, kerosene and charcoal fuels.
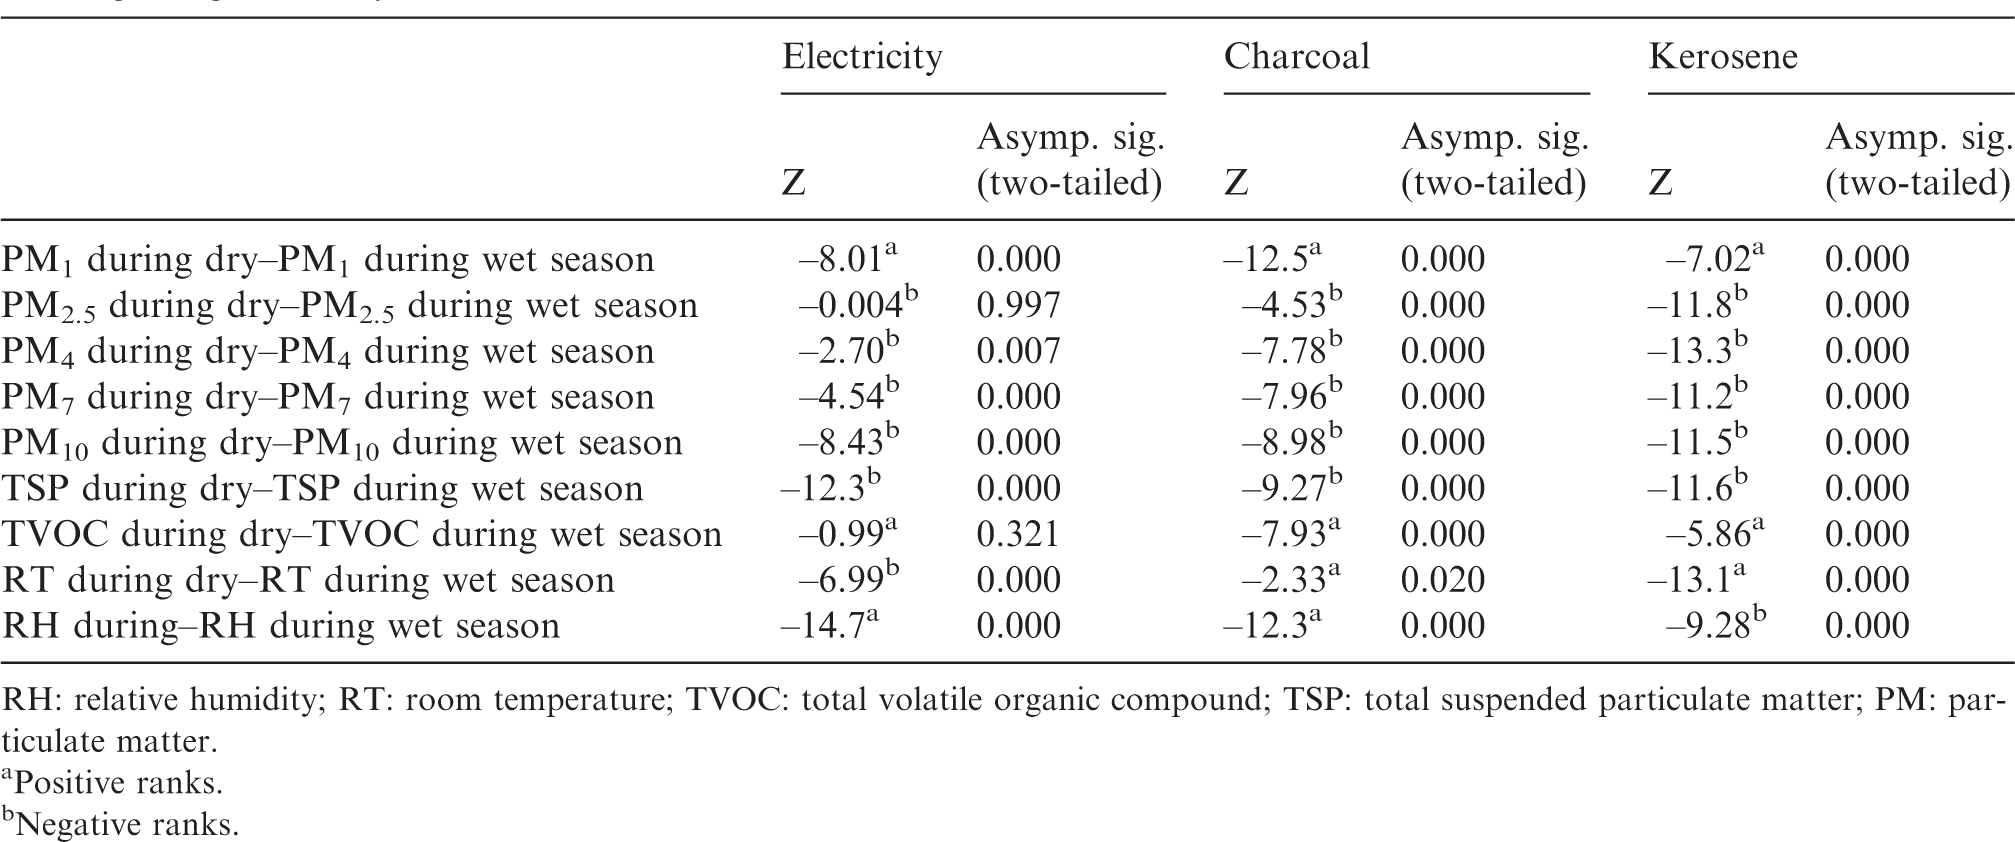
RH: relative humidity; RT: room temperature; TVOC: total volatile organic compound; TSP: total suspended particulate matter; PM: particulate matter.
aPositive ranks.
bNegative ranks.
Figure 2 shows the time-patterns of PM and TVOC concentrations during the cooking of Wot using electricity (ar1A), charcoal (ar2A) and kerosene (ar3A) fuels at Arada sub-city. The concentration of each pollutant was constant before cooking (for about 10 min) because the stoves were off and became elevated once the stoves were turned on for the cooking. This might be due to the fact that the level of pollutants during cooking varied with the status of fire (whether it was off, starting, burning or smouldering) and adding or removing fuel, the type of food and fuel. Previous studies have shown that the concentrations of pollutants become high when starting cooking using biomass fuel, afterwards with smouldering of the fuel to make a better flame, adding more biomass fuel and also due to frying of the food.43,47–49
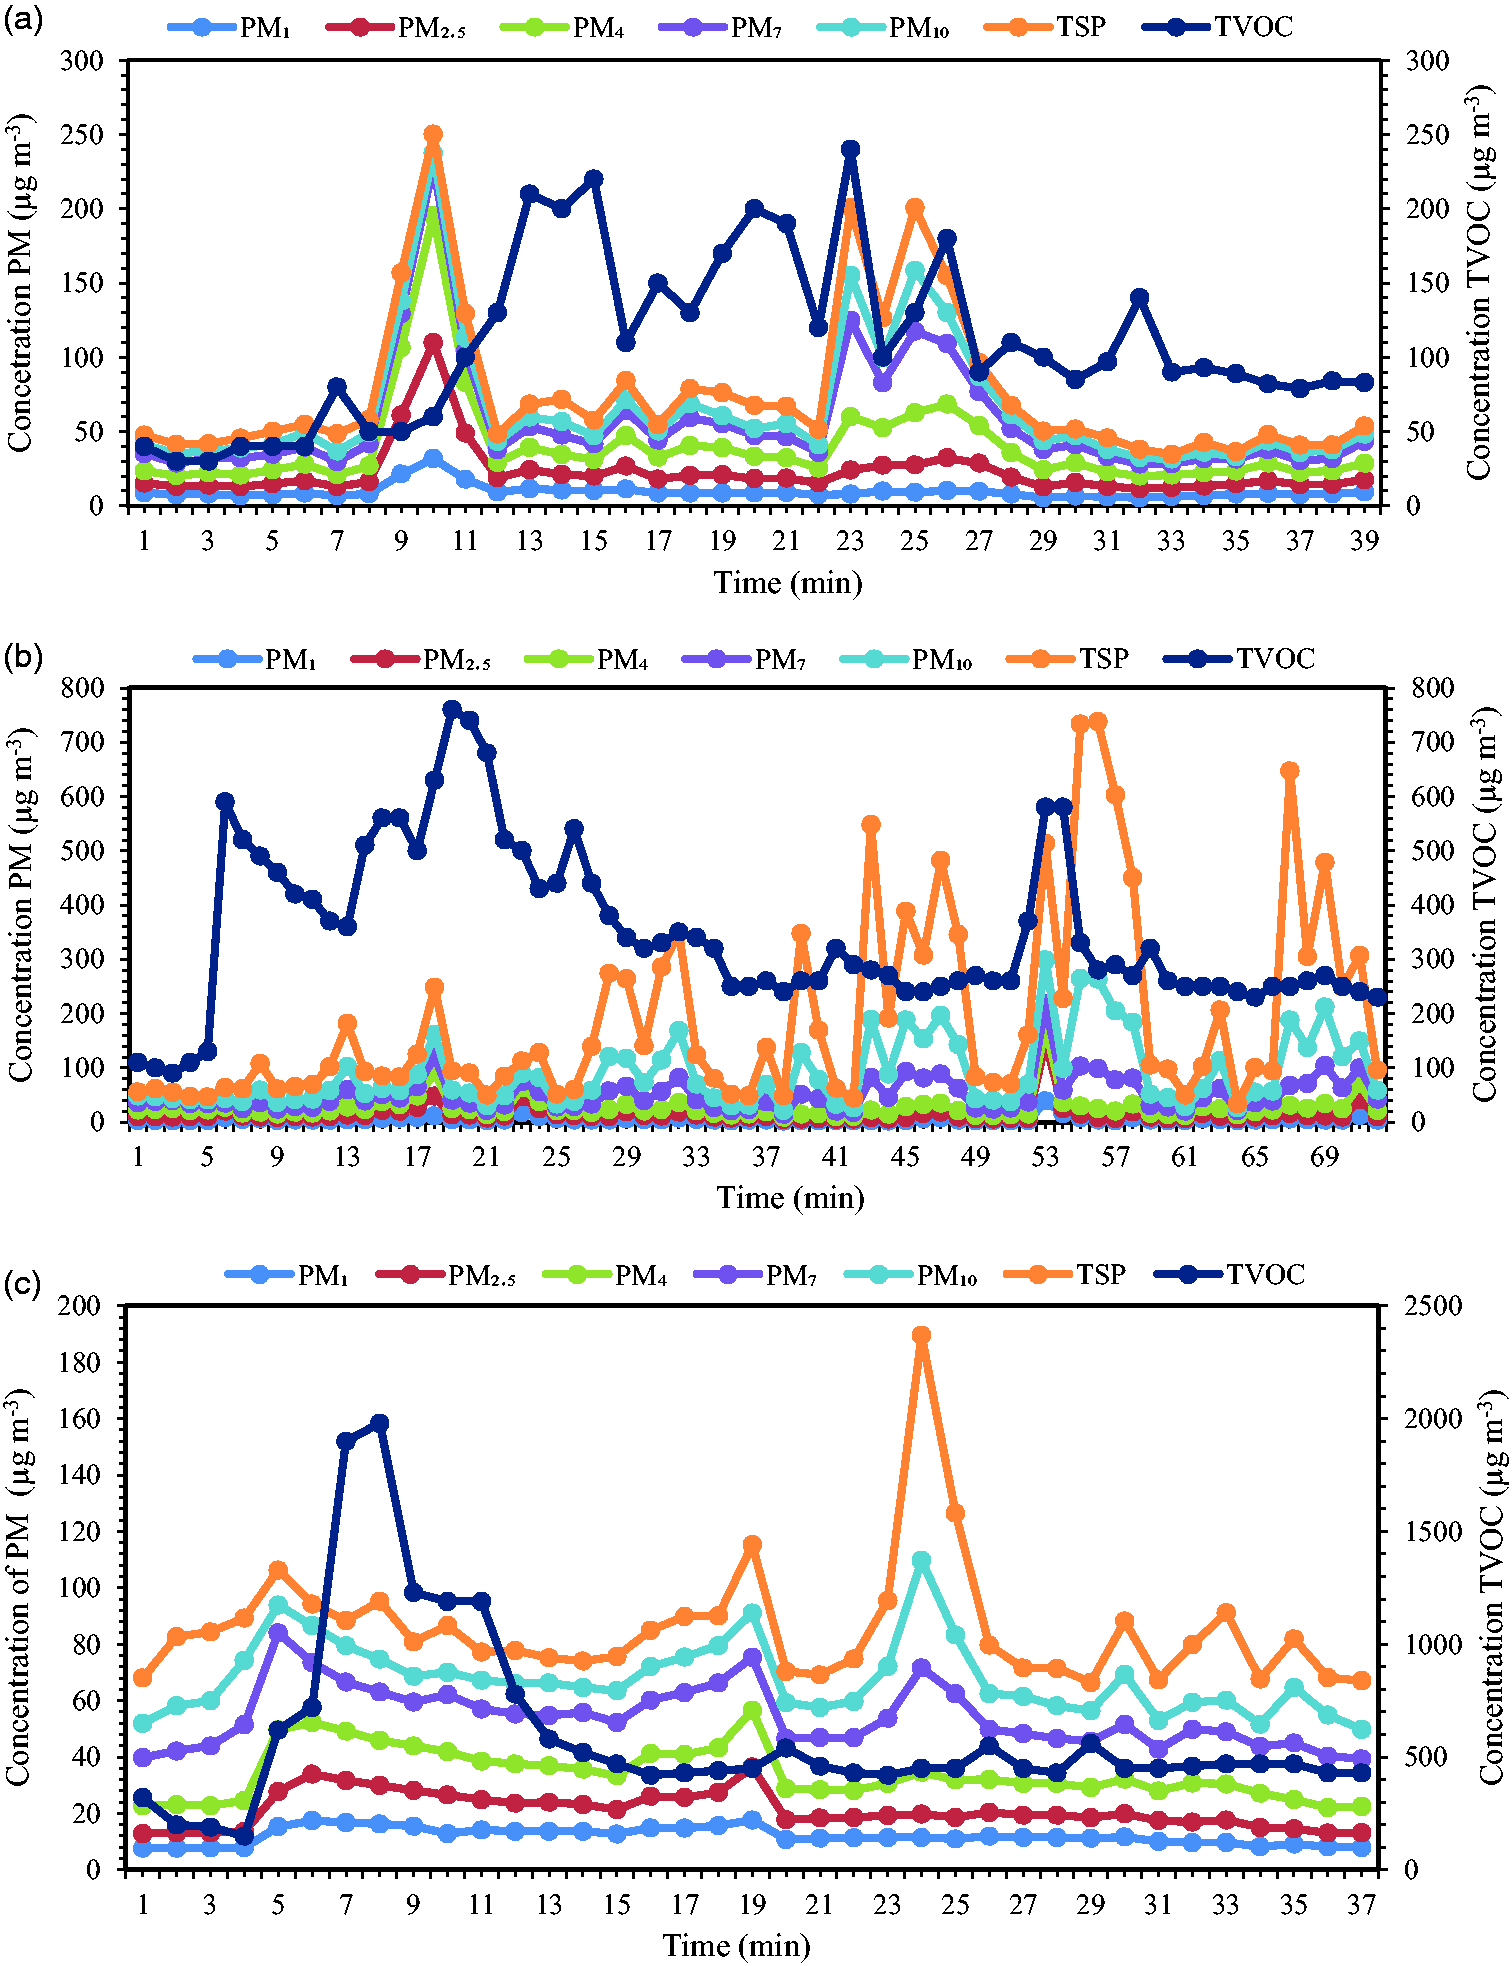
A typical time-pattern concentration of (i) PM and (ii) TVOC during cooking of Wot in Arada sub-city using electricity (a), charcoal (b) and kerosene (c) fuels during the wet season.
Discussion
In this study, we measured the indoor level of pollutants before and during cooking. We did not measure outdoor levels since the focus was to measure the pollutants in the indoor air during cooking.
Exposure assessment for different microenvironments is needed for estimating the health impact of the exposed person and to determine appropriate remedial interventions. Hence, this study is the first attempt to look at the indoor air pollution during the cooking of Wot using energy sources of electricity fuel, kerosene fuel and charcoal fuel at different microenvironments. The general trend showed the level of PM and TVOC found in the order of electricity < kerosene < charcoal fuel. The overall GOM of PM and TVOC regardless of the season is given in Table 4. The highest GOM concentration of PM and TVOC was recorded whilst cooking using charcoal, whereas the lowest values were measured using electricity.
The overall GOM concentration of PMs, TVOC, time, K-volume, RT and RH measured during cooking using different types of fuels.
RH: relative humidity; RT: room temperature; TVOC: total volatile organic compound; TSP: total suspended particulate matter; PM: particulate matter.
Even though recent studies have shown exposure to high levels of PM for a short time in the order of one or more hour can cause serious health risks, guidelines appropriate to stove emissions are not available.36,37
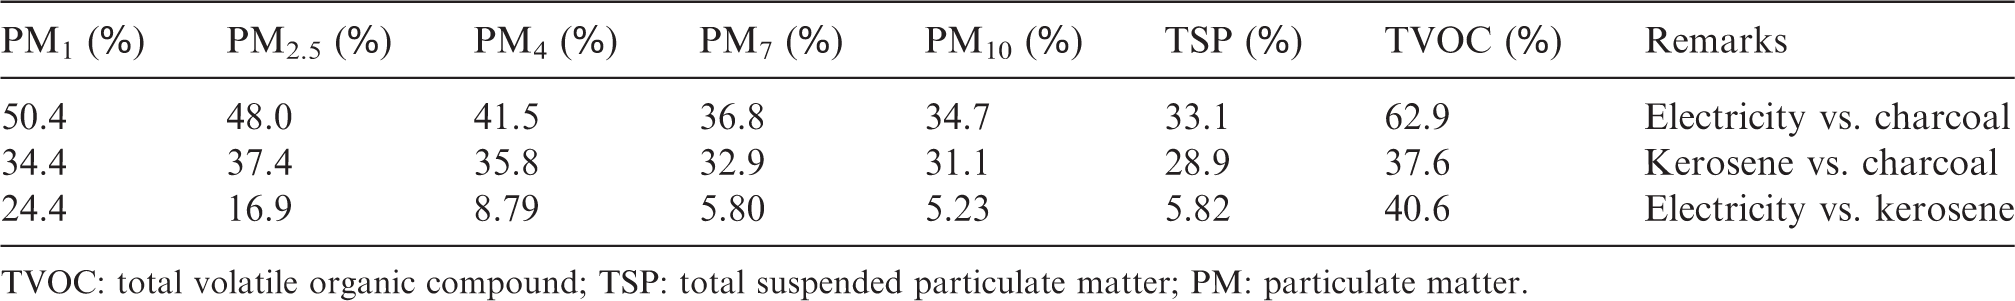
Furthermore, studies have shown that the use of clean fuels, such as electricity and kerosene instead of biomass fuel could reduce the total exposure while preparing foods. The amount of pollutant reduction depends on the type of food prepared, the type of ventilation (area, position either fully open or partially open), the location of the stove from the ventilation position in the kitchen and the type of biomass fuel used.42,43,50–52 This study presents the concentration variations measured during the cooking of an Ethiopian traditional Wot using the most common fuels namely electricity, kerosene and charcoal. Table 5 shows the percentage reduction of emission exposure using electricity and kerosene fuels as compared to charcoal fuel during the preparation of Wot. Similarly, emission exposure reduction using electricity fuel as compared to kerosene fuel was also estimated. Equations (1) and (2) were used for these calculations.


Comparison of the percentage emission exposure reduction to PM and TVOC by using electricity and kerosene fuel for cooking instead of using charcoal fuel; and electricity fuel instead of kerosene fuel for cooking.
TVOC: total volatile organic compound; TSP: total suspended particulate matter; PM: particulate matter.
Overall, Table 5 shows that cooking Wot using electricity instead of charcoal can reduce emission exposure by 33–63%. Likewise, a Wot cooker can reduce emission exposure by 29–38% by using kerosene instead of charcoal. Lastly, using electricity instead of kerosene can reduce exposure to PM and TVOC pollutants by 5–41%.
Table 6 compares the data of the present study to research in other countries on levels of indoor air pollutants in kitchens or during cooking using different types of fuels. The particulate concentrations recorded in the present study are comparable with some studies11,43,50–52 using kerosene (India, Andhra Pradesh and Bangladesh), whereas most studies43,50–53 reported much higher PM than the present study, using biomass fuel such as charcoal, wood and dung for cooking.
Summary of indoor air pollution in developing countries using different fuel types.
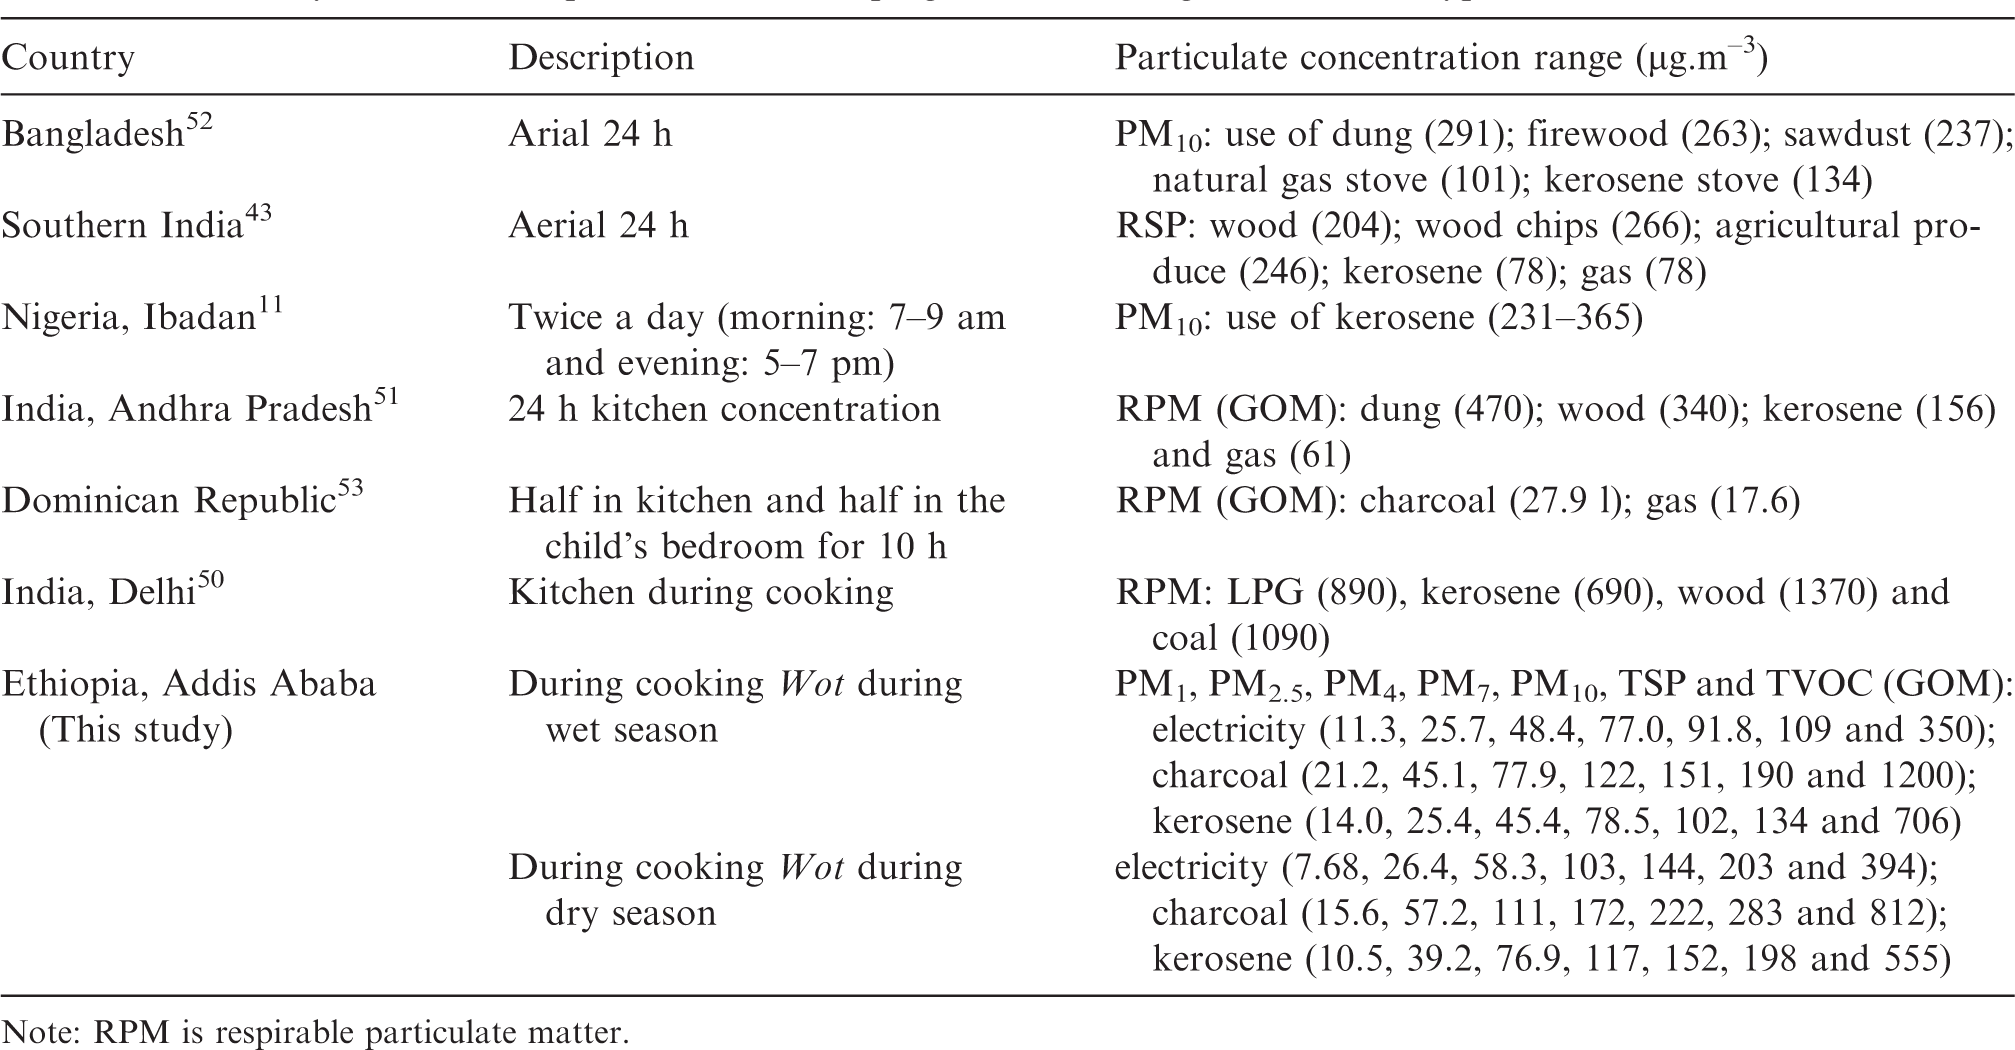
Note: RPM is respirable particulate matter.
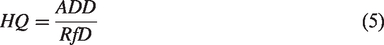
Furthermore, in this study, the health risk assessment due to the exposure to PM2.5, PM10 and TSP was considered. Human health risk assessment due to air contaminants depends on the type of pollutants and the extent of exposure. Hazard identification, dose–response assessment, exposure assessment and risk characterization are the main steps used in a health risk assessment.54–56 Each of these steps was used to estimate the health risk due to PM emitted during the cooking of Wot. Although all PM were identified as hazardous, only PM2.5, PM10 and TSP were considered due to availability of toxicity data. These data include the reference dose (RfD) values for pollutants which were used in the calculation of a hazard quotient (HQ), where HQ is the ratio of the potential exposure to a substance and the level at which no adverse effects are expected. In the second step, average daily intake (called chronic daily intake ADD (µg.kg−1.day−1)) was calculated using equations (3) and (4). The annual threshold values set by the World Health Organization (WHO) 27 and the US EPA 57 were used as the RfD in the dose–response step. Finally, the HQ was calculated and used in the risk characterization for different microenvironments during the cooking of Wot using charcoal, kerosene and electricity.54–56
In Ethiopia, women take responsibility for cooking the Wot and feeding the family. They usually start cooking at the age of 17 and continue until they are retired. Hence, only women's health impacts were estimated in this study. The current life expectancy for an Ethiopian woman is around 67, and so the total exposure duration of 50 years was taken for the calculation of HQ and ADD. The exposure frequency of 365 days/year was also assumed. The air intake rate for an adult is 20 m3 per day, and the body weight for adult Ethiopian women was assumed as the African adult weight of 60.7 kg.57,58 The times taken for the cooking of Wot were recorded during measurement of PM, and these were then doubled to estimate exposure times since the cooking was done twice a day. Thus, 2.8, 3.26 and 3.04 h.day−1 were used as exposure times for electricity, charcoal and kerosene fuel, respectively. The details considered in the HQ calculation are summarized in Table 7.
Exposure time, exposure frequency, duration exposure, exposure duration, averaging time (AT), intake rate (IR) and body weight (BW) for adult woman.
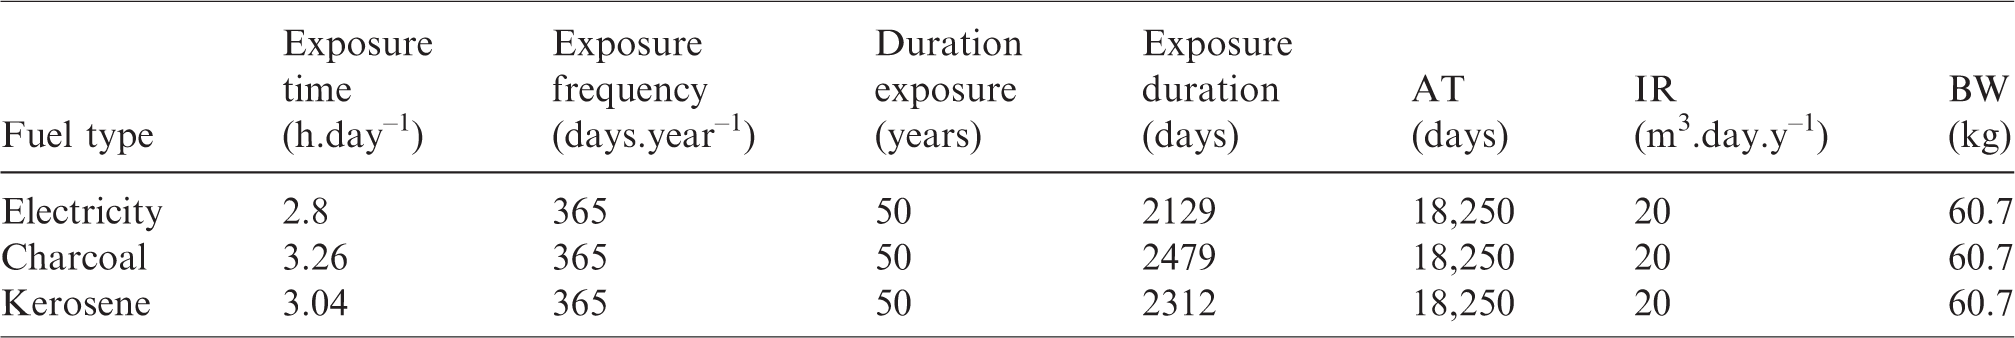
The exposure duration of this study is 2129, 2479 and 2312 days for the measurement of pollutants concentrations during cooking using electricity, charcoal and kerosene fuels, respectively, which are equivalents to 5.83, 6.79 and 6.33 years, respectively. The US EPA 57 classifies an exposure as acute for an exposure duration below two weeks, as sub-chronic exposure when the duration is above two weeks and below seven years, and as chronic for exposure duration above seven years. Thus, the exposure duration of this study falls in the category ‘above two weeks and below seven years’. Hence, it is classified under the sub-chronic type of exposure. Hence, RfDs for sub-chronic exposure are used to calculate HQ, which are the annual averages of PM2.5 (10 µg.m−3), PM10 (20 µg.m−3) and TSP (150 µg.m−3) values set by WHO and US EPA.26,27 The overall geometric means of PM2.5, PM10 and TSP (regardless of seasons) have been used for health risk assessments.
Equations (3) and (4) were used for the calculation of ADD and HQ to characterize the health risk due to PM2.5 and PM10.54,55


According to the US EPA, 57 if the calculated HQ is less than one, no adverse health effects are expected as a result of the exposure. If the calculated HQ value is more than one, long-term exposure to air pollution may cause significant human health effects, including loss of lung capacity and accelerated ageing of the lungs. It is also possible that individuals could develop diseases such as asthma, bronchitis, emphysema and cancer. 27 Hence, as seen in Table 8, using charcoal fuel alone can have a likelihood to induce health impacts for the exposed person from exposure to PM10, since its HQ value was larger than one. By comparison, the HQ values from the use of kerosene and electricity were below one for both PM2.5 and PM10, which indicates that the risks of health problems using these stoves are lower than for charcoal. However, this does not mean that their contribution to the total chronic exposure is low. Thus, cooking Wot using electricity or kerosene fuels can contribute to the total chronic intake of PM2.5 and PM10 about 30–101% and 11–17% for TSP. The highest and the lowest per cent contribution to the total chronic intake for all pollutants were due to the use of charcoal and electricity fuel, respectively.
ADD for PMs and TVOC and HQ for PM2.5 and PM10.
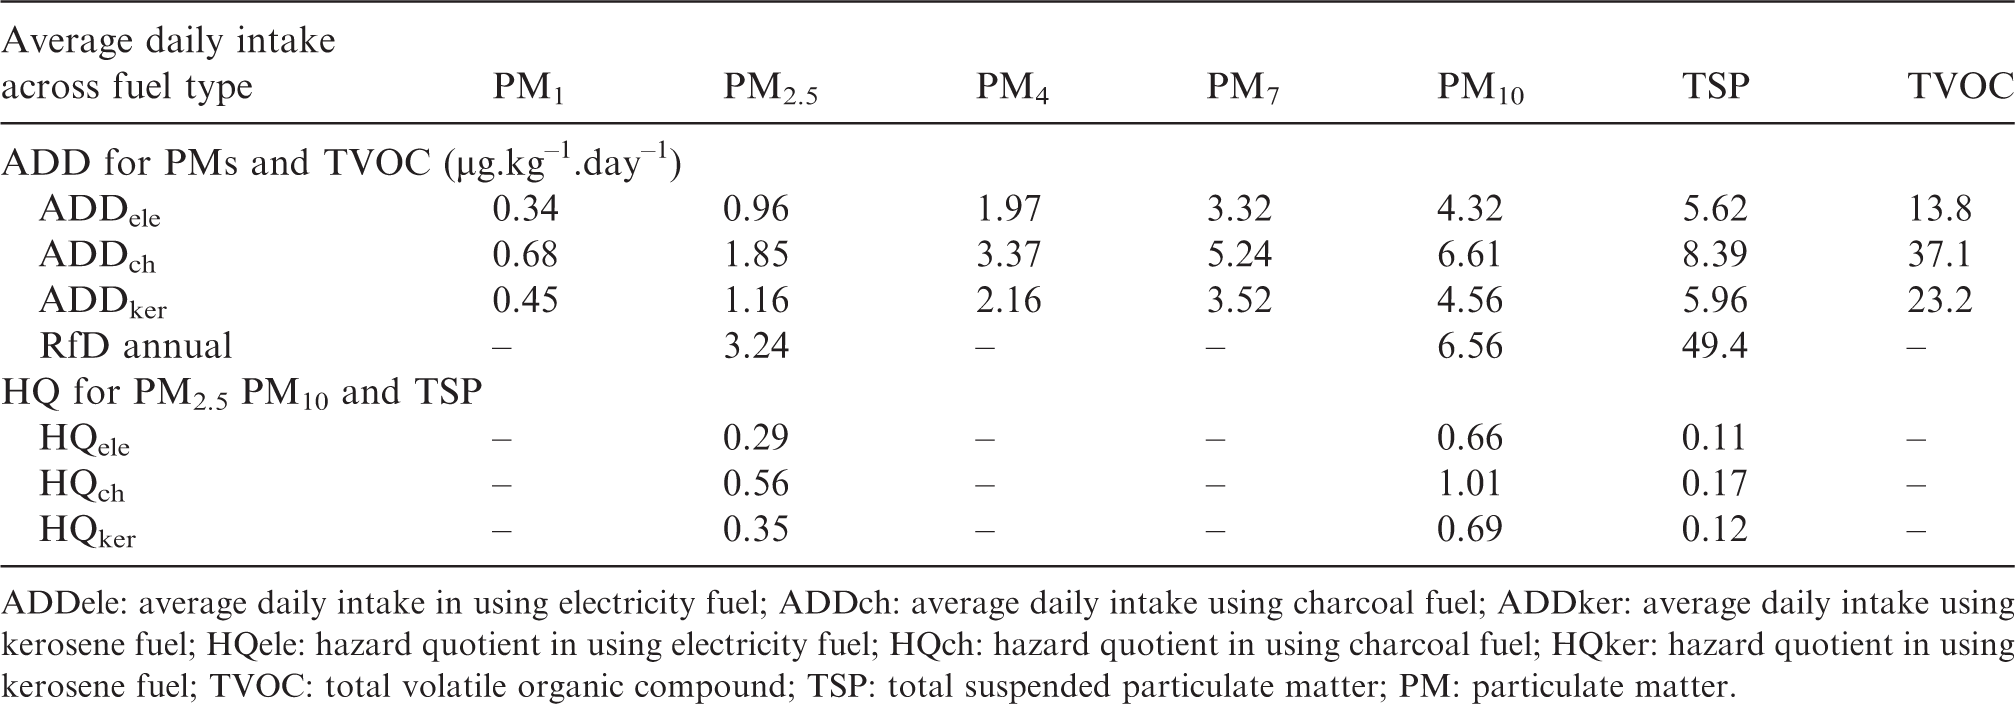
ADDele: average daily intake in using electricity fuel; ADDch: average daily intake using charcoal fuel; ADDker: average daily intake using kerosene fuel; HQele: hazard quotient in using electricity fuel; HQch: hazard quotient in using charcoal fuel; HQker: hazard quotient in using kerosene fuel; TVOC: total volatile organic compound; TSP: total suspended particulate matter; PM: particulate matter.
In addition to using HQ for health risk assessment, the HI, which is the sum of HQs of each pollutant, has been used to assess the cumulative effect of exposure to pollutants. 27 The US EPA 57 considers that if HI is greater than one, the exposed person can have health problems, whereas if HI is less than one, they may not face serious health problems. 27 Thus, the HI was calculated to determine the risk in the use of electricity, kerosene and charcoal as fuels. The HQ of PM2.5, PM10 and TSP was 1.06, 1.16 and 1.74, respectively. Thus, although individual pollutants (except PM10 during charcoal use) may not impose health impact to a woman who is cooking, their cumulative effect has a likelihood to induce non-carcinogenic health problems.
Cooking Wot is the most wide and daily practice in an Ethiopian home. However, preparing food using traditional stoves can increase the individual long-term exposure to PM and TVOC. Based on this study, a person who uses charcoal fuel for extended periods could face various health-related problems due to long-term exposure to PM.
In addition, urban firewood and charcoal demand have been destructive to forestry and caused environmental damage. Ethiopia generates more than 80% of its electricity from sustainable sources such as hydroelectricity. The government should make affordable electric stoves readily available to the community. However, electrical services are irregular and often do not reach the poor urban sectors. Further research should consider the adverse health, economic and environmental effects related to cooking along with the measurement of other pollutants. Little research has been done on the possible interactions of indoor air pollution due to cooking smoke and related health outcomes and pathogenesis of respiratory diseases among the lower socioeconomic sectors.
Although this study has provided information related to the exposure level due to the PM and TVOC during the cooking of Wot, it has some shortcomings. First, measuring the pollutant levels together with examination of different health outcomes was not performed due to the lack of a professional health worker (a medical technician or nurse). However, the results of this study could be used as a benchmark for future research on the examination of different health issues caused by indoor air pollution. Second, the amount and the type of chemical substances present in the smoke of charcoal fuel depend on the moisture content of the charcoal, the species of plant from which the charcoal originated and amount of charcoal used.59–61 Also, the chemical constituent of the smoke depends on the status of fire (such as smouldering compared to a good flaming condition). However, this study did not consider these aspects. Third, biomass fuel smoke can emit different pollutants other than PM and TVOC. TVOC measurement does not distinguish the individual levels of VOCs, such as low-volatility organics including polynuclear aromatic hydrocarbons. Further research should be carried out on the health aspects of chronic exposure to Ethiopian traditional cooking practices along with the measurement of different pollutants levels.
However, despite these limitations, this study has demonstrated the high level of exposure to selected pollutants when cooking Wot using charcoal.
Conclusion
This study is the first attempt to look at the indoor air pollution during the cooking of Wot using energy sources of electricity, kerosene and charcoal in different microenvironments. The general trend showed the level of PM and TVOC found in the order of electricity < kerosene < charcoal fuel. The highest GOM concentration of PM and TVOC was recorded using charcoal, whereas the lowest values were measured using electricity. Among the three fuel types, electricity was much better in the reduction of emissions to PM and TVOC. The health risk assessment indicated that using charcoal fuel alone had a likelihood to induce health impacts of women due to exposure to PM10 during cooking, since its HQ value was greater than one. By comparison, the HQ values for both PM2.5 and PM10 were below one when kerosene and electricity are used, which implies the risks of health problems using these stoves is lower. However, cooking Wot using electricity or kerosene fuels does not mean that their contribution to the total chronic exposure is low. The health risk assessment based on the HI values showed that any of the three fuel types could contribute to non-carcinogenic health problems to the Wot cooker due to the cumulative effect of PM2.5, PM10 and TSP, although individual pollutants (except PM10 during charcoal use) may not impose health impact to a cooker. Using charcoal fuel alone, the person cooking appears likely to experience adverse health impacts due to PM10, since its HQ value was larger than one.
Footnotes
Acknowledgements
The authors express their gratitude to the Department of Chemistry, Addis Ababa University for providing the laboratory facilities. Asamene Embiale is thankful to the Woldia University, Ethiopia, for sponsoring his Ph.D. study.
Authors’ contribution
The first author collected the data, conducted data analysis and primarily drafted this paper. The second author designed the research with all the required technical elements. The third author also helped in designing the research, contributed to the data analysis and critically reviewed and edited the article. The fourth author provided the devices, contributed to data analysis and revision of the article.
Declaration of conflicting interests
The author(s) declare no potential conflicts of interest with respect to the research, authorship, and/or publication of this article.
Funding
The author(s) received no financial support for the research, authorship, and/or publication of this article.