
Abstract
Hybrid ventilation is an effective approach to reduce cooling energy consumption by combining natural and mechanical ventilation. Previous studies of full-scale whole-building measurements of high-rise hybrid ventilation are quite limited due to the complexities of buildings and variable ambient conditions. As a result, validated and accurate whole-building simulations of hybrid ventilation often cannot be found in the literature. This paper reports a series of full-scale measurements of hybrid ventilation in a 17-storey high-rise building and associated whole-building simulations by 15-zone detailed and a 5-zone simplified multizone models. The paper is one of the first studies of using multizone models and real-world full-scale data and sharing key operational and performance experience and case studies of high-rise hybrid ventilation. Both the test data and the validated simulation models can be used for the comparison and validation of simulation models. The 5-zone simplified model developed from this study was able to model such a complex high-rise building by only a few zones, making possible the on-line model predictive control of a high-rise building. This was illustrated in this paper by an example of optimizing the uniformity of the hybrid ventilation on different floors by modifying inlet areas.
Introduction
The building sector, including residential, commercial and institutional buildings, accounts annually for about 41% of the primary energy usage, 47% of which is used by the space heating and cooling system in the US. 1 In Canada, more than 55% of the residential annual energy consumption is for space heating and cooling. 2 As one of the effective measures to reduce cooling energy consumption, hybrid ventilation combines the benefits of natural and mechanical ventilation and could reduce cooling load significantly when it is used appropriately,3,4 especially for buildings with high internal load, e.g. commercial buildings and high-rise buildings. 5 Building ventilation is also an effective approach for removing indoor containments and improving indoor air quality (IAQ)6–9 and thermal comfort.10,11
Because of these merits, hybrid ventilation has been widely studied and applied in different types of buildings in the world. Antvorskov 12 introduced hybrid ventilation systems for residential buildings in European Union (EU) with possible integration of renewable energy solutions. Turner and Walker 13 proposed a new hybrid ventilation system for residential buildings, which employs an intelligent ventilation controller to minimize energy use, while fulfilling short-term and long-term IAQ requirements, based on a computer simulation in 16 California climate zones. Heiselberg et al. 14 reported a survey on 22 low- to medium-rise buildings with hybrid ventilation systems from 10 countries. The control strategies in the survey are usually based on temperature control, and some of them (particularly schools) are also based on CO2 control. To promote hybrid ventilation as an energy efficient cooling solution to avoid building overheating, IEA EBC (IEA: International Energy Agency; EBC: Energy in Buildings and Communities) Annex 62 15 ‘Ventilative Cooling’ developed a database of ventilation cooling applications including a number of buildings with different ventilation systems in various countries.
To make a full use of hybrid ventilation, field measurement and numerical simulation are often used to study the performance of hybrid ventilation system in buildings. Brohus et al. 16 evaluated hybrid ventilation performance in a four-storey office building in the outskirts of the town of Struer, Denmark, by measuring temperatures, CO2 levels and energy consumptions. Turner and Awbi 17 investigated the thermal performance of hybrid ventilation system and assessed its potential to reduce cooling load through the experiments in a room. Menassa et al. 3 conducted a case study in a four-storey laboratory building with a hybrid ventilation system by on-site measurements under different control strategies. They found that the hybrid ventilation system could achieve an average of 56% energy savings with a best control strategy. To study the hybrid ventilation for low-energy building design in the southern sub-tropical climates of China, Ji et al. 18 conducted computational fluid dynamics simulation and dynamic thermal simulation on a four-storey office building with a basement. The simulation results showed that the hybrid ventilation is a feasible low-energy approach for non-domestic building design even for the sub-tropical climates. Yuan et al. 19 studied the limits of outdoor air temperature to maintain acceptable indoor thermal comfort based on measurements and simulations in the corridor of an institutional building.
As the literature review indicates, most of previous studies focused on single houses, low-rise buildings or middle-rise buildings at the most, few of them focused on high-rise buildings which consume more energy per square metre 20 and thus have more energy saving potentials when using hybrid ventilation. A full-scale hybrid ventilation study, especially on-site measurements in actual high-rise buildings, is rather limited. Although the IEA EBC Annex 62 15 includes a series of different buildings, there is still a lack of whole-building and full-scale data for high-rise buildings with hybrid ventilation. Due to the high internal and/or solar loads, a high-rise building often has more cooling load than low-rises not only during summer but also transitional periods or even in winter. Therefore, the applicable time of hybrid ventilation in high-rise buildings is longer and its potential of energy savings is expected more than other types of buildings. In addition, the huge thermal mass, e.g. the concrete building structure, of high-rise buildings could be coupled into the hybrid ventilation control system to reduce building energy demand and peak electricity load for space cooling through pre-cooling. However, the building structure and mechanical system in high-rise buildings are more complex so it remains a real challenge to optimally operate a high-rise hybrid ventilation system under variable weather conditions.
Predictive controls based on simulation models, i.e. model predictive controls (MPC), have been proven to be capable to optimize the control strategy of HVAC system regarding energy and cost savings, peak load shifting, transient response, thermal comfort and IAQ. 21 MPC has been shown very effective to ensure the performance of a hybrid ventilation system in high-rise buildings, especially under a variable ambient environment. 22 Hu and Karava 22 developed a transient detailed thermal and airflow multizone network model for energy and indoor environment prediction for offline hybrid ventilation control. However, when implementing MPC in a real building (so-called on-line MPC), it will be challenging to apply a detailed model considering the complexities of the building including interior structure, thermal mass, mechanical system, cooling/heating loads and weather conditions. MPC thus often requires many simplifications of the building, so it can be easily implemented for on-line controls. Therefore, there is a need of research to develop a relatively simple and practical model for MPC that can be easily calibrated while capturing the essential airflow and thermal physics for on-line operations of hybrid ventilation.
To address these research needs, this paper presents a full-scale measurement study in a 17-storey institutional high-rise building with hybrid ventilation system23,24 and the development of a simple hybrid ventilation model based on the multizone airflow network. The three-day measurements included mechanical fan flow rates, ambient temperatures and wind conditions, natural ventilation rates at different floors. For the simulation model, the building was first modelled by a detailed 15-zone multizone model using CONTAM, one of the most popular programs to model building ventilation.25–27 The detailed model includes five stacked three-storey atriums and all the floors with each floor as one zone except the 1st and 17th floors that do not have natural vents. Based on the detailed model, a simplified reduced-order 5-zone model was then developed and validated when compared to results of the detailed model and the measurement data. An example of using the simplified model was also illustrated for the optimization of the hybrid ventilation of the full-size building.
Methods
An institutional high-rise building with a hybrid ventilation system
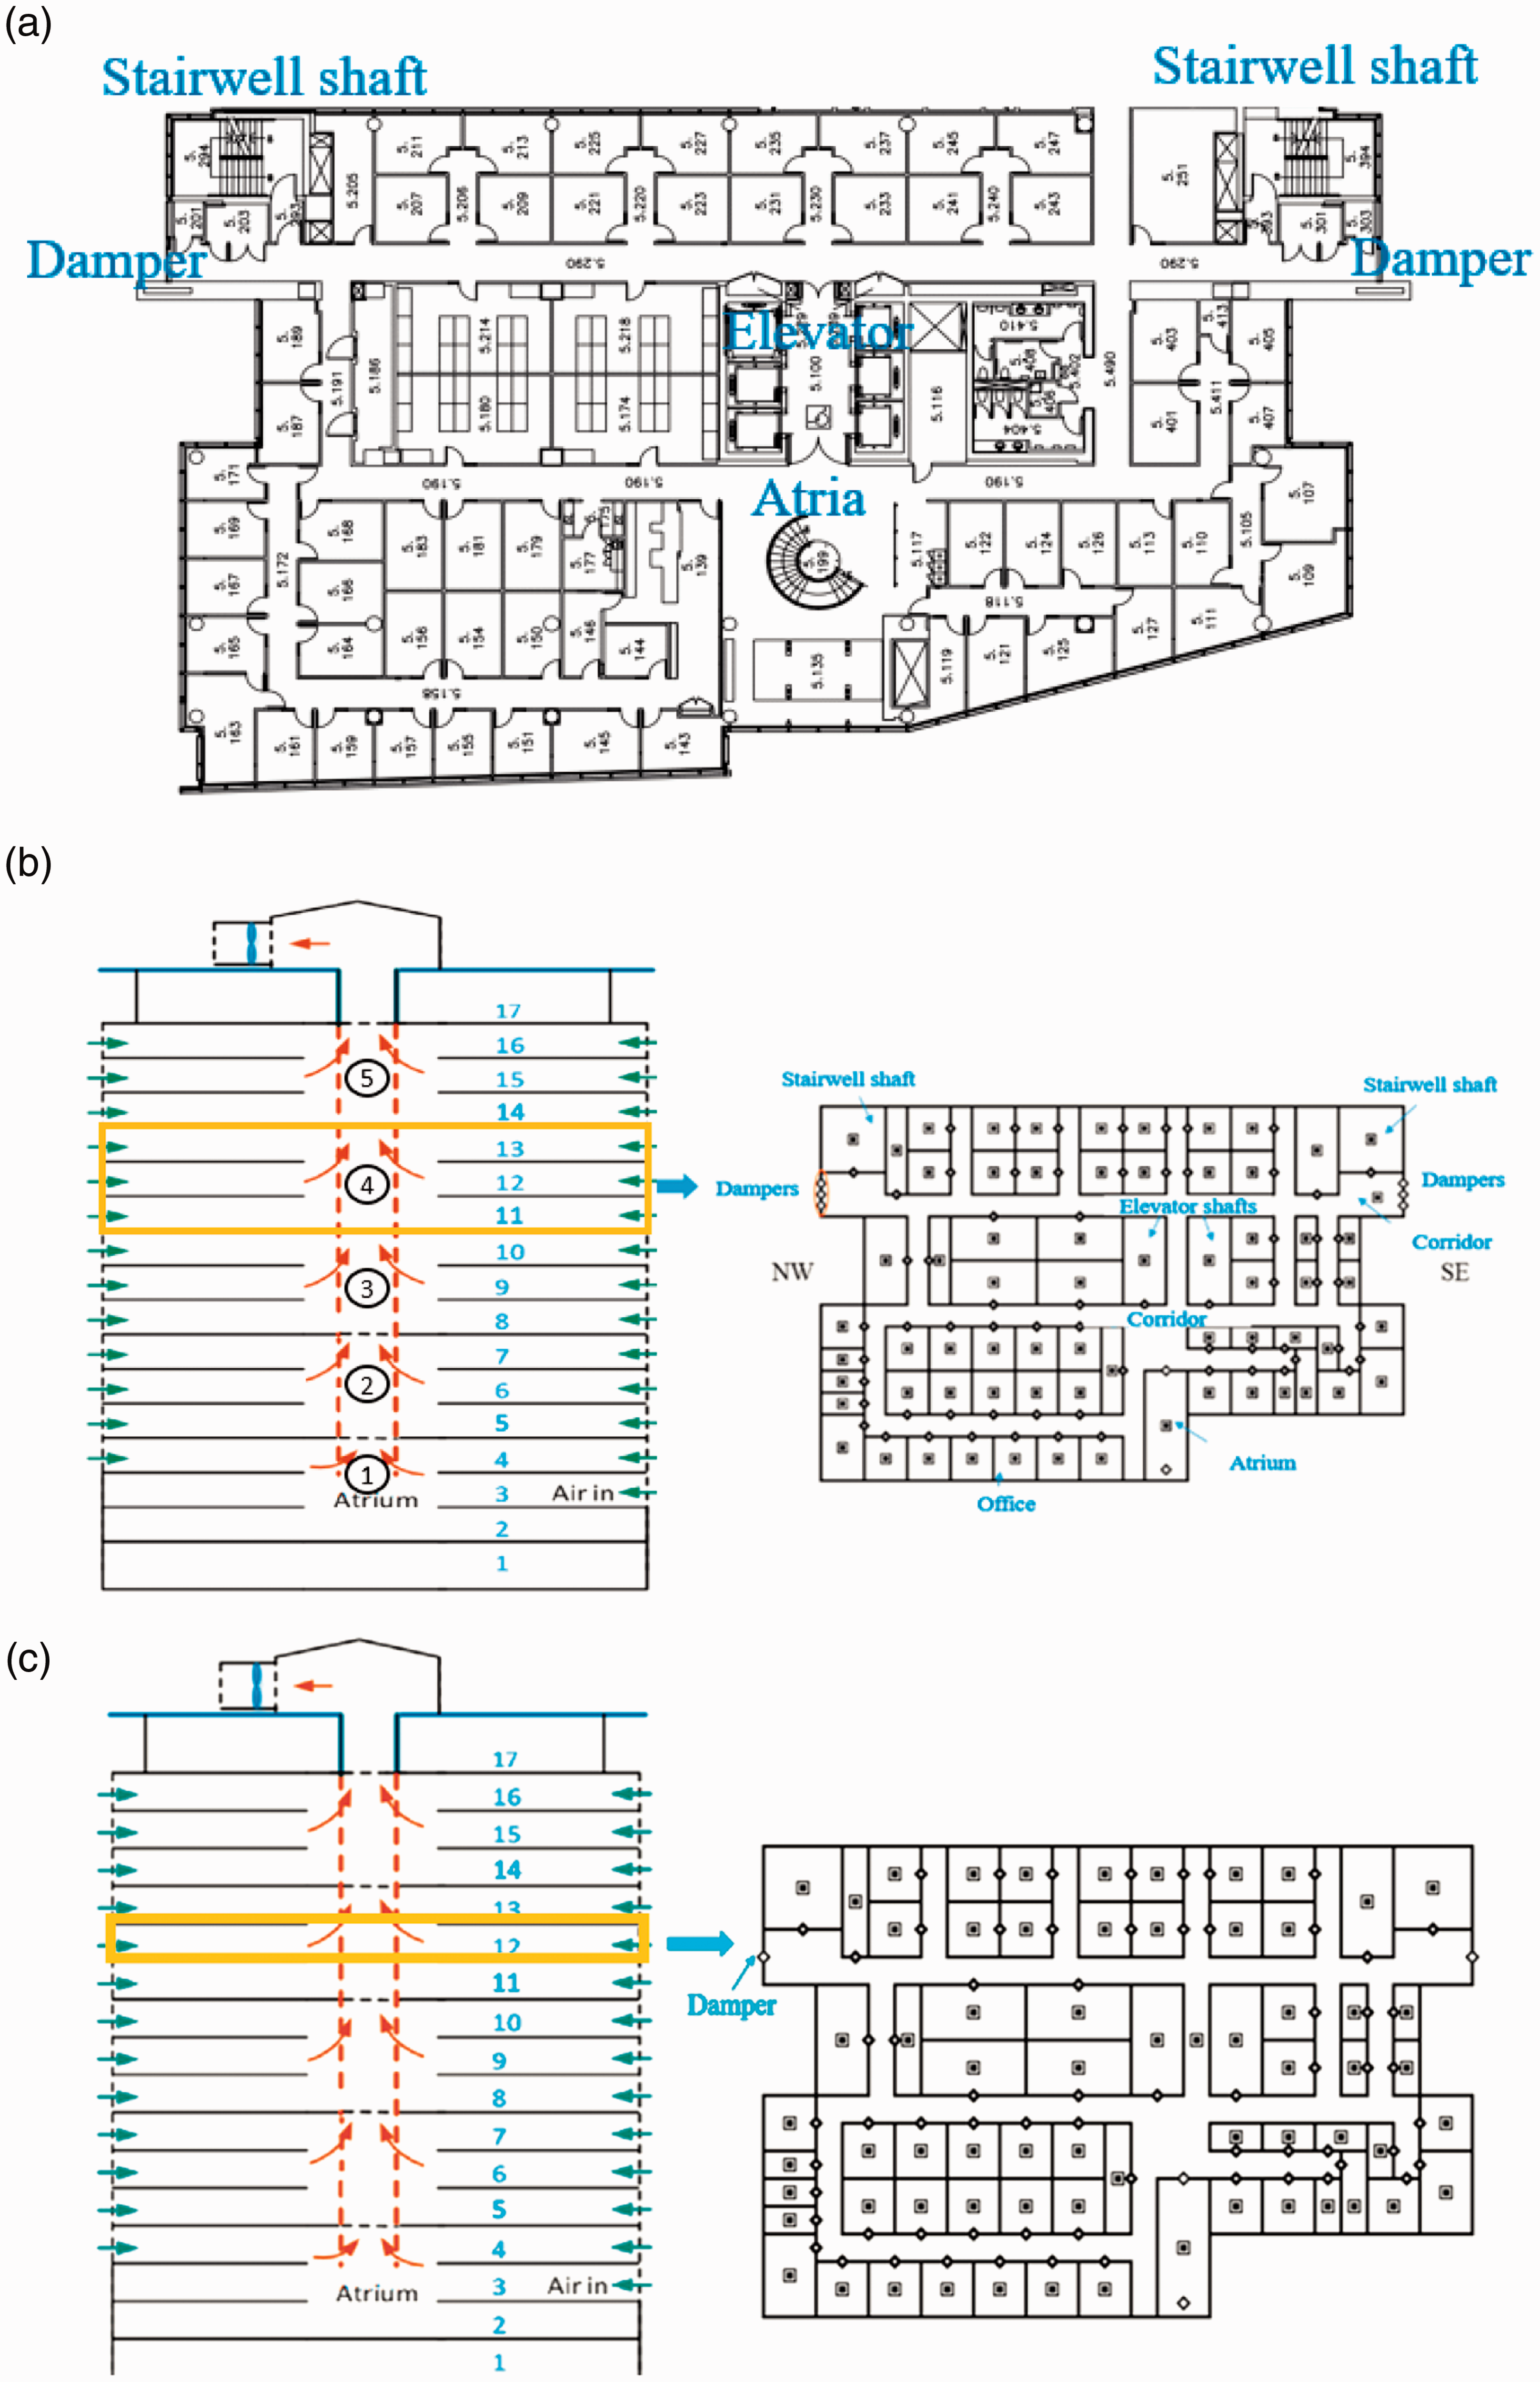
The hybrid ventilation system in this study is in a 17-storey institutional high-rise building, which is the Engineering, Computer Science, and Visual Arts Integrated Complex (EV building) of the Concordia University Sir George Williams Campus located at the downtown Montreal, Canada. The building is with a total floor area of 53,000 m2, comprising the office of professors and graduate students, and research labs at different floors. There are two main large facades facing approximately southwest and northeast, respectively (Figure 1(a)). The hybrid ventilation system includes five vertically stacked atriums, motorized inlet dampers at both ends of the corridor on each floor facing northwest (NW) and southeast (SE), and variable-speed mechanical fans at the roof (Figure 1(b)). The area of the inlet dampers is about 1.4 m2 when fully opened and adjustable by the motors. The five atriums span from the second to the 16th floor with every three floors for each atrium (note: the 17th floor is the mechanical room and the first floor is underground). Each atrium is 9 m (W) × 12 m (L) × 12 m (H) and separated from other atria by a floor slab with 4-m2 floor grilles with motorized dampers, which are kept open to create a solar chimney in the ventilation mode. 28 During the fire protection model, these dampers will be closed to avoid fire smoke spreading across floors.

(a) Location of an institutional high-rise building. (b) Schematic of the hybrid ventilation system in a 17-storey institutional high-rise building. 29
Full-scale measurements
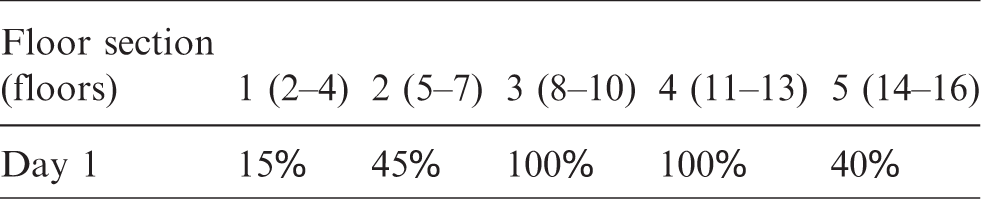
The measurements were conducted on three different days during autumn. Weather conditions, including wind speed and direction (wind sensor Vaisala WMT700; wind speed accuracy: ±0.1 m/s or 2% of reading; wind direction accuracy: ±2°), and outdoor temperature (model: Pt100 RTD Class F0.1 IEC 60751; accuracy at +20°C: ± 0.2°C, –40 to 80°C: ±0.4°C), were measured by a local weather station at the roof (Figure 2). The roof fan frequency varied from 20% to 80% in Day 1 and is 40% in Day 2 and Day 3. Although the outdoor temperature was as low as less than 2°C in Day 1, the cool air was warmed as it flows deeper into the building after mixing with the indoor air, so the indoor environment was around 22°C at the atriums. Since there were few occupants near the inlets, no comfort complaints were reported. Due to different weather conditions and potentially different stack effects, the airflow rate of the roof fans is different even at the same fan frequency, e.g. 40% fan frequency in Day 1, Day 2 and Day 3 (Table 1). Except the fan frequency, all the other data were averaged over time to obtain the ‘steady-state’ data. Table 2 shows the opening area percentage of the inlet dampers: they were fully open on Day 1 but closed for floors 2, 3, 14–16 on Day 2 and Day 3, due to the requirement of the ambient temperature by the labs on these floors.
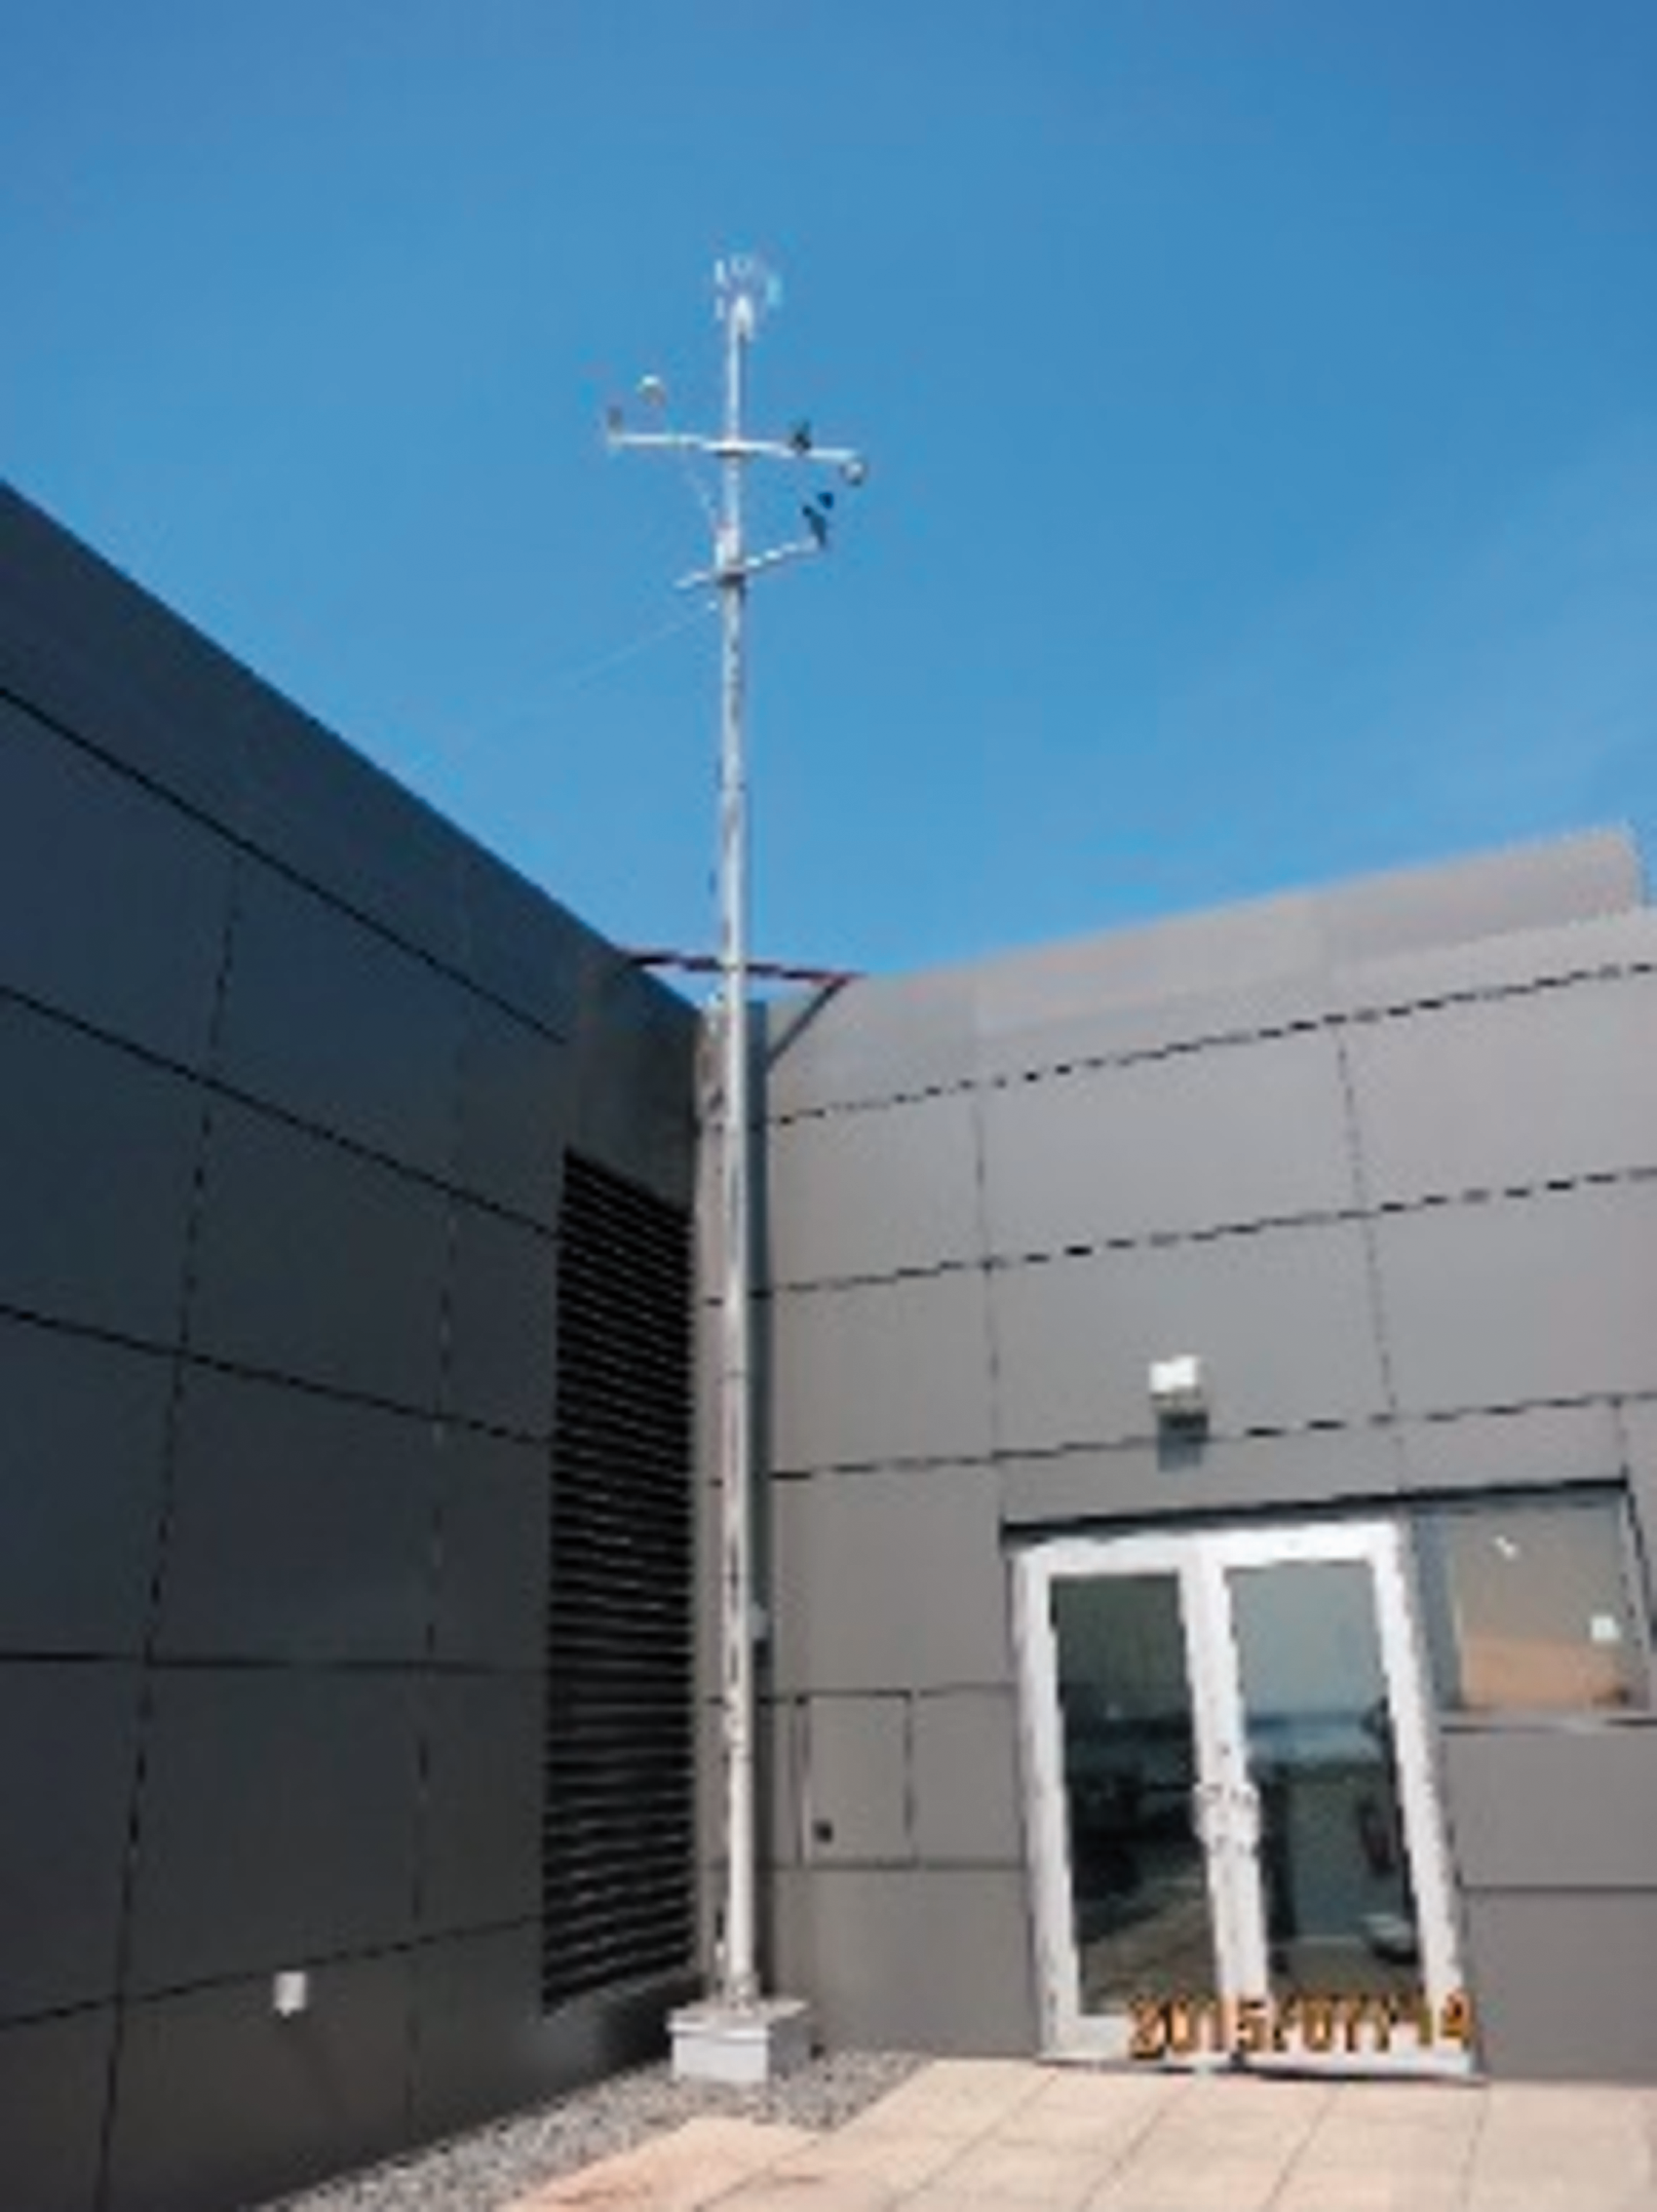
Weather station on the roof.
Measurement conditions.
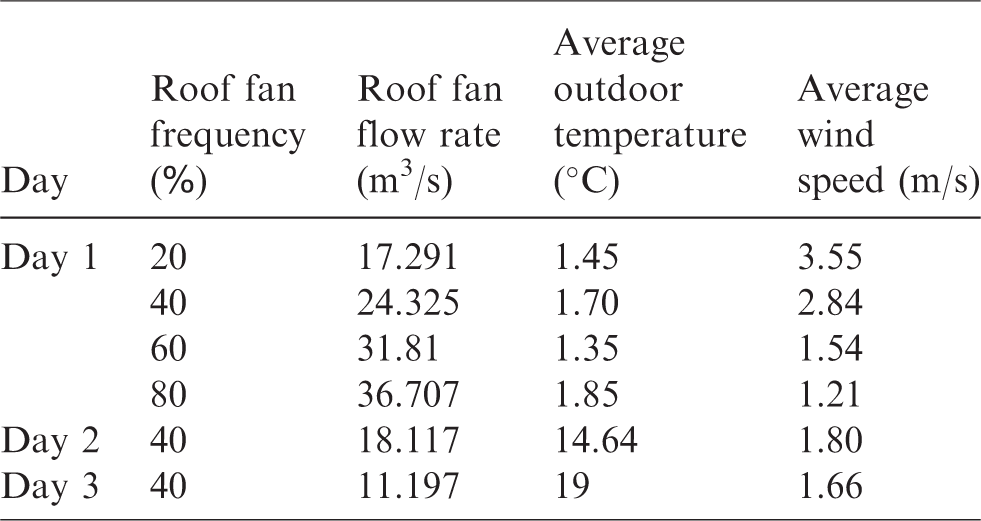
Opening percentage of the inlet dampers.
Dampers on floors 3, 14–16 were fully closed (0%).
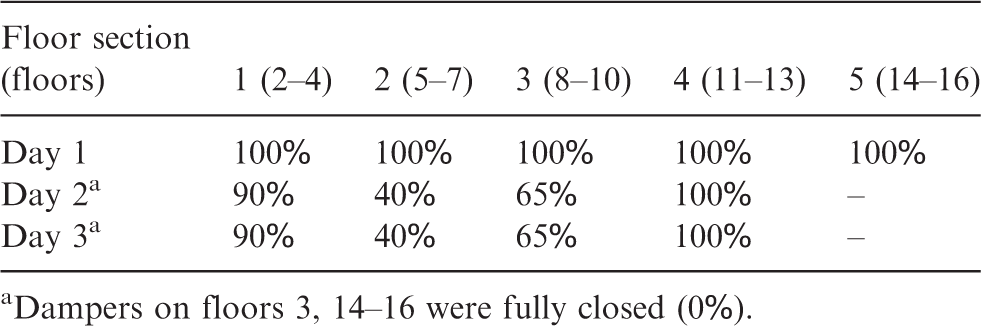
The ventilation velocities near the inlet dampers were measured by hot-wire anemometers with sampling time of 60 s and collected by a data logger (Omega HHF-SD1) as shown in Figure 3. The measurement range of the airspeed is 0.2–25 m/s and the accuracy is ±5%+0.1 m/s. The velocity was measured only on the 5th floor on Day 1, on the SE of 5th, 8th and 11th floors on Day 2 and on the SE of 5th, 10th, 13th floors and NW of 4th, 5th, 8th and 10th floors on Day 3. The velocity measurements were then used to calculate the mass flow rates through the inlet damper based on their effective opening areas.
Natural ventilation velocity measurement near inlet dampers.
In the full-scale measurement in high-rise buildings, the non-uniform and different directional velocities at large openings may lead to the challenge to determine the ventilation flow rate accurately. To investigate this issue, a preliminary measurement of airflow uniformity and direction was conducted at the inlet heights of 1 m, 2 m and 3 m for the 5th, 10th and 12th floor. Figure 4 shows that the air velocity tends to become more uniform at higher floors because higher floors are closer to the mechanical fans and less subject to stack effect than lower ones. On all floors, the measured air temperatures were close to the ambient air temperature at the time of this preliminary measurement, indicating the airflows were unidirectional inflows from the ambient. These results also show that it is therefore acceptable to determine the ventilation rate based on the measured velocity at the middle height of an inlet opening. In case of the air velocities at some large openings are not exactly uniform, extra measurement points would be needed depending on the requirement of the accuracy.
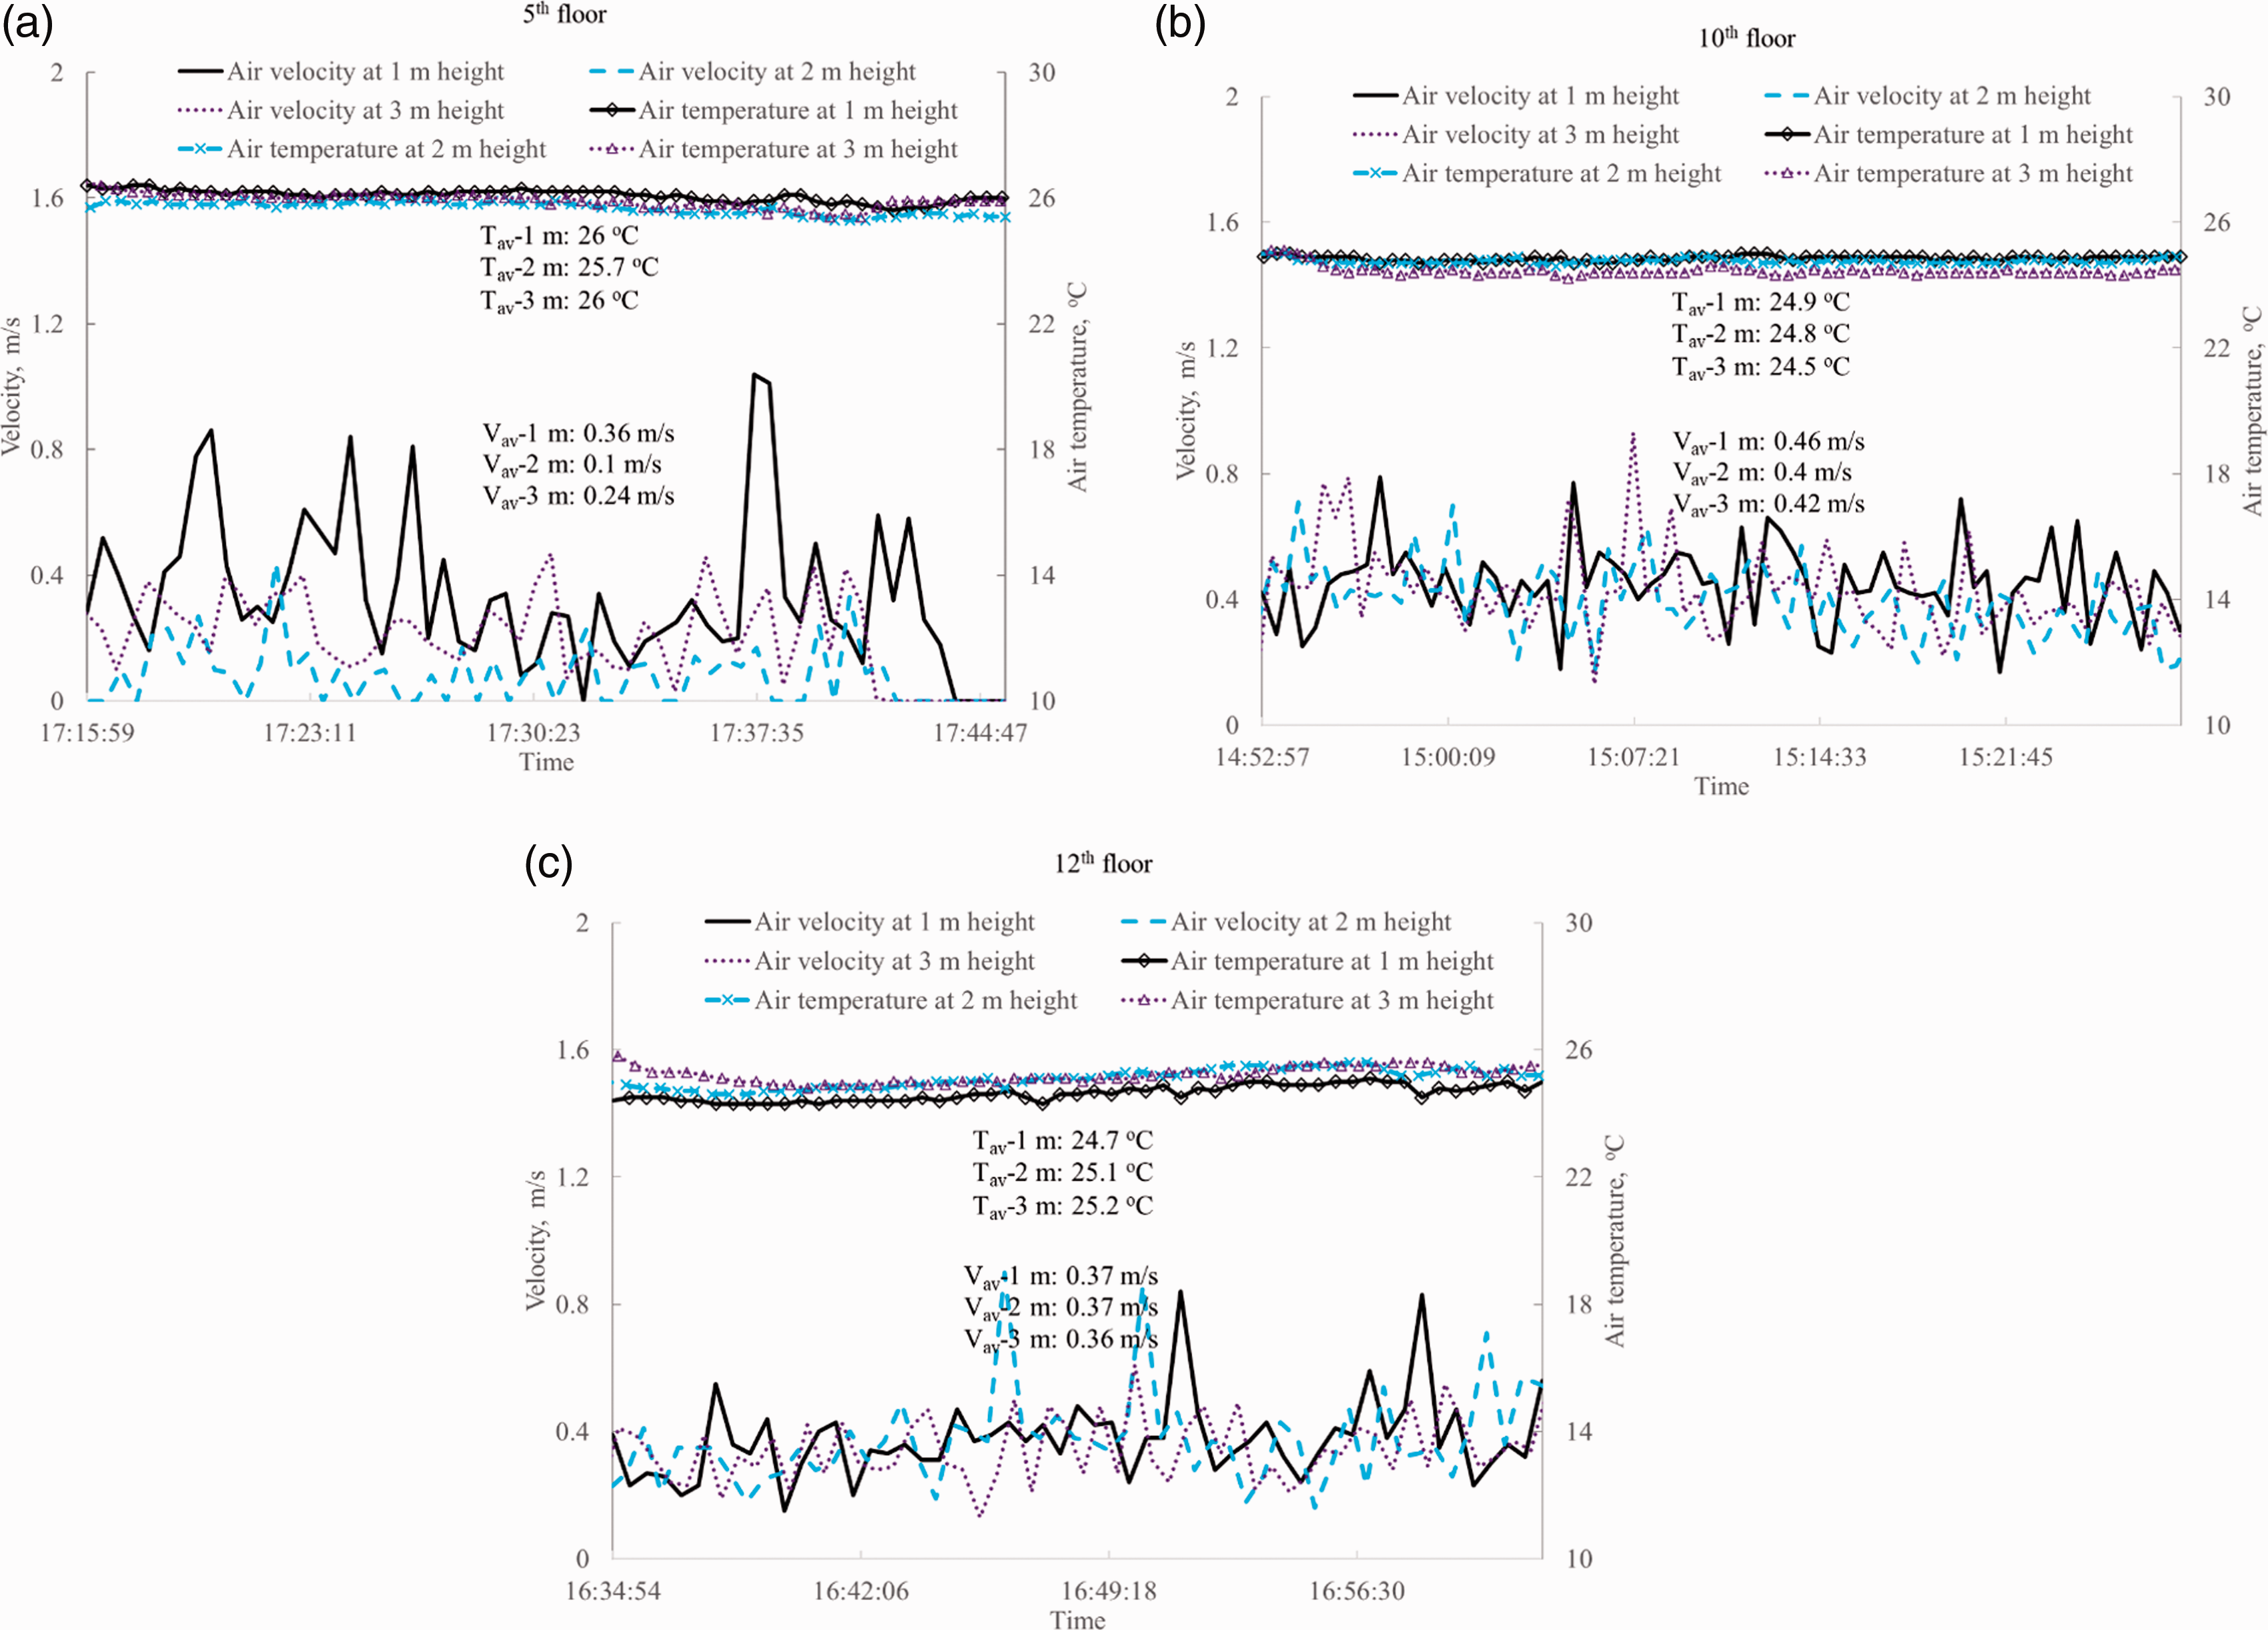
Measured velocities and temperatures at different heights of the inlet openings of different floors in the preliminary test to check flow uniformity and direction. (a) 5th floor; (b)10th floor and (c) 12th floor.
Figure 5 presents the measured data of a typical day, Day 2. During 12:30–16:45, the fan flow rate, air temperature and velocity near the damper was relatively under steady state. The average values of the data during the time were used as the inputs for the simulations.
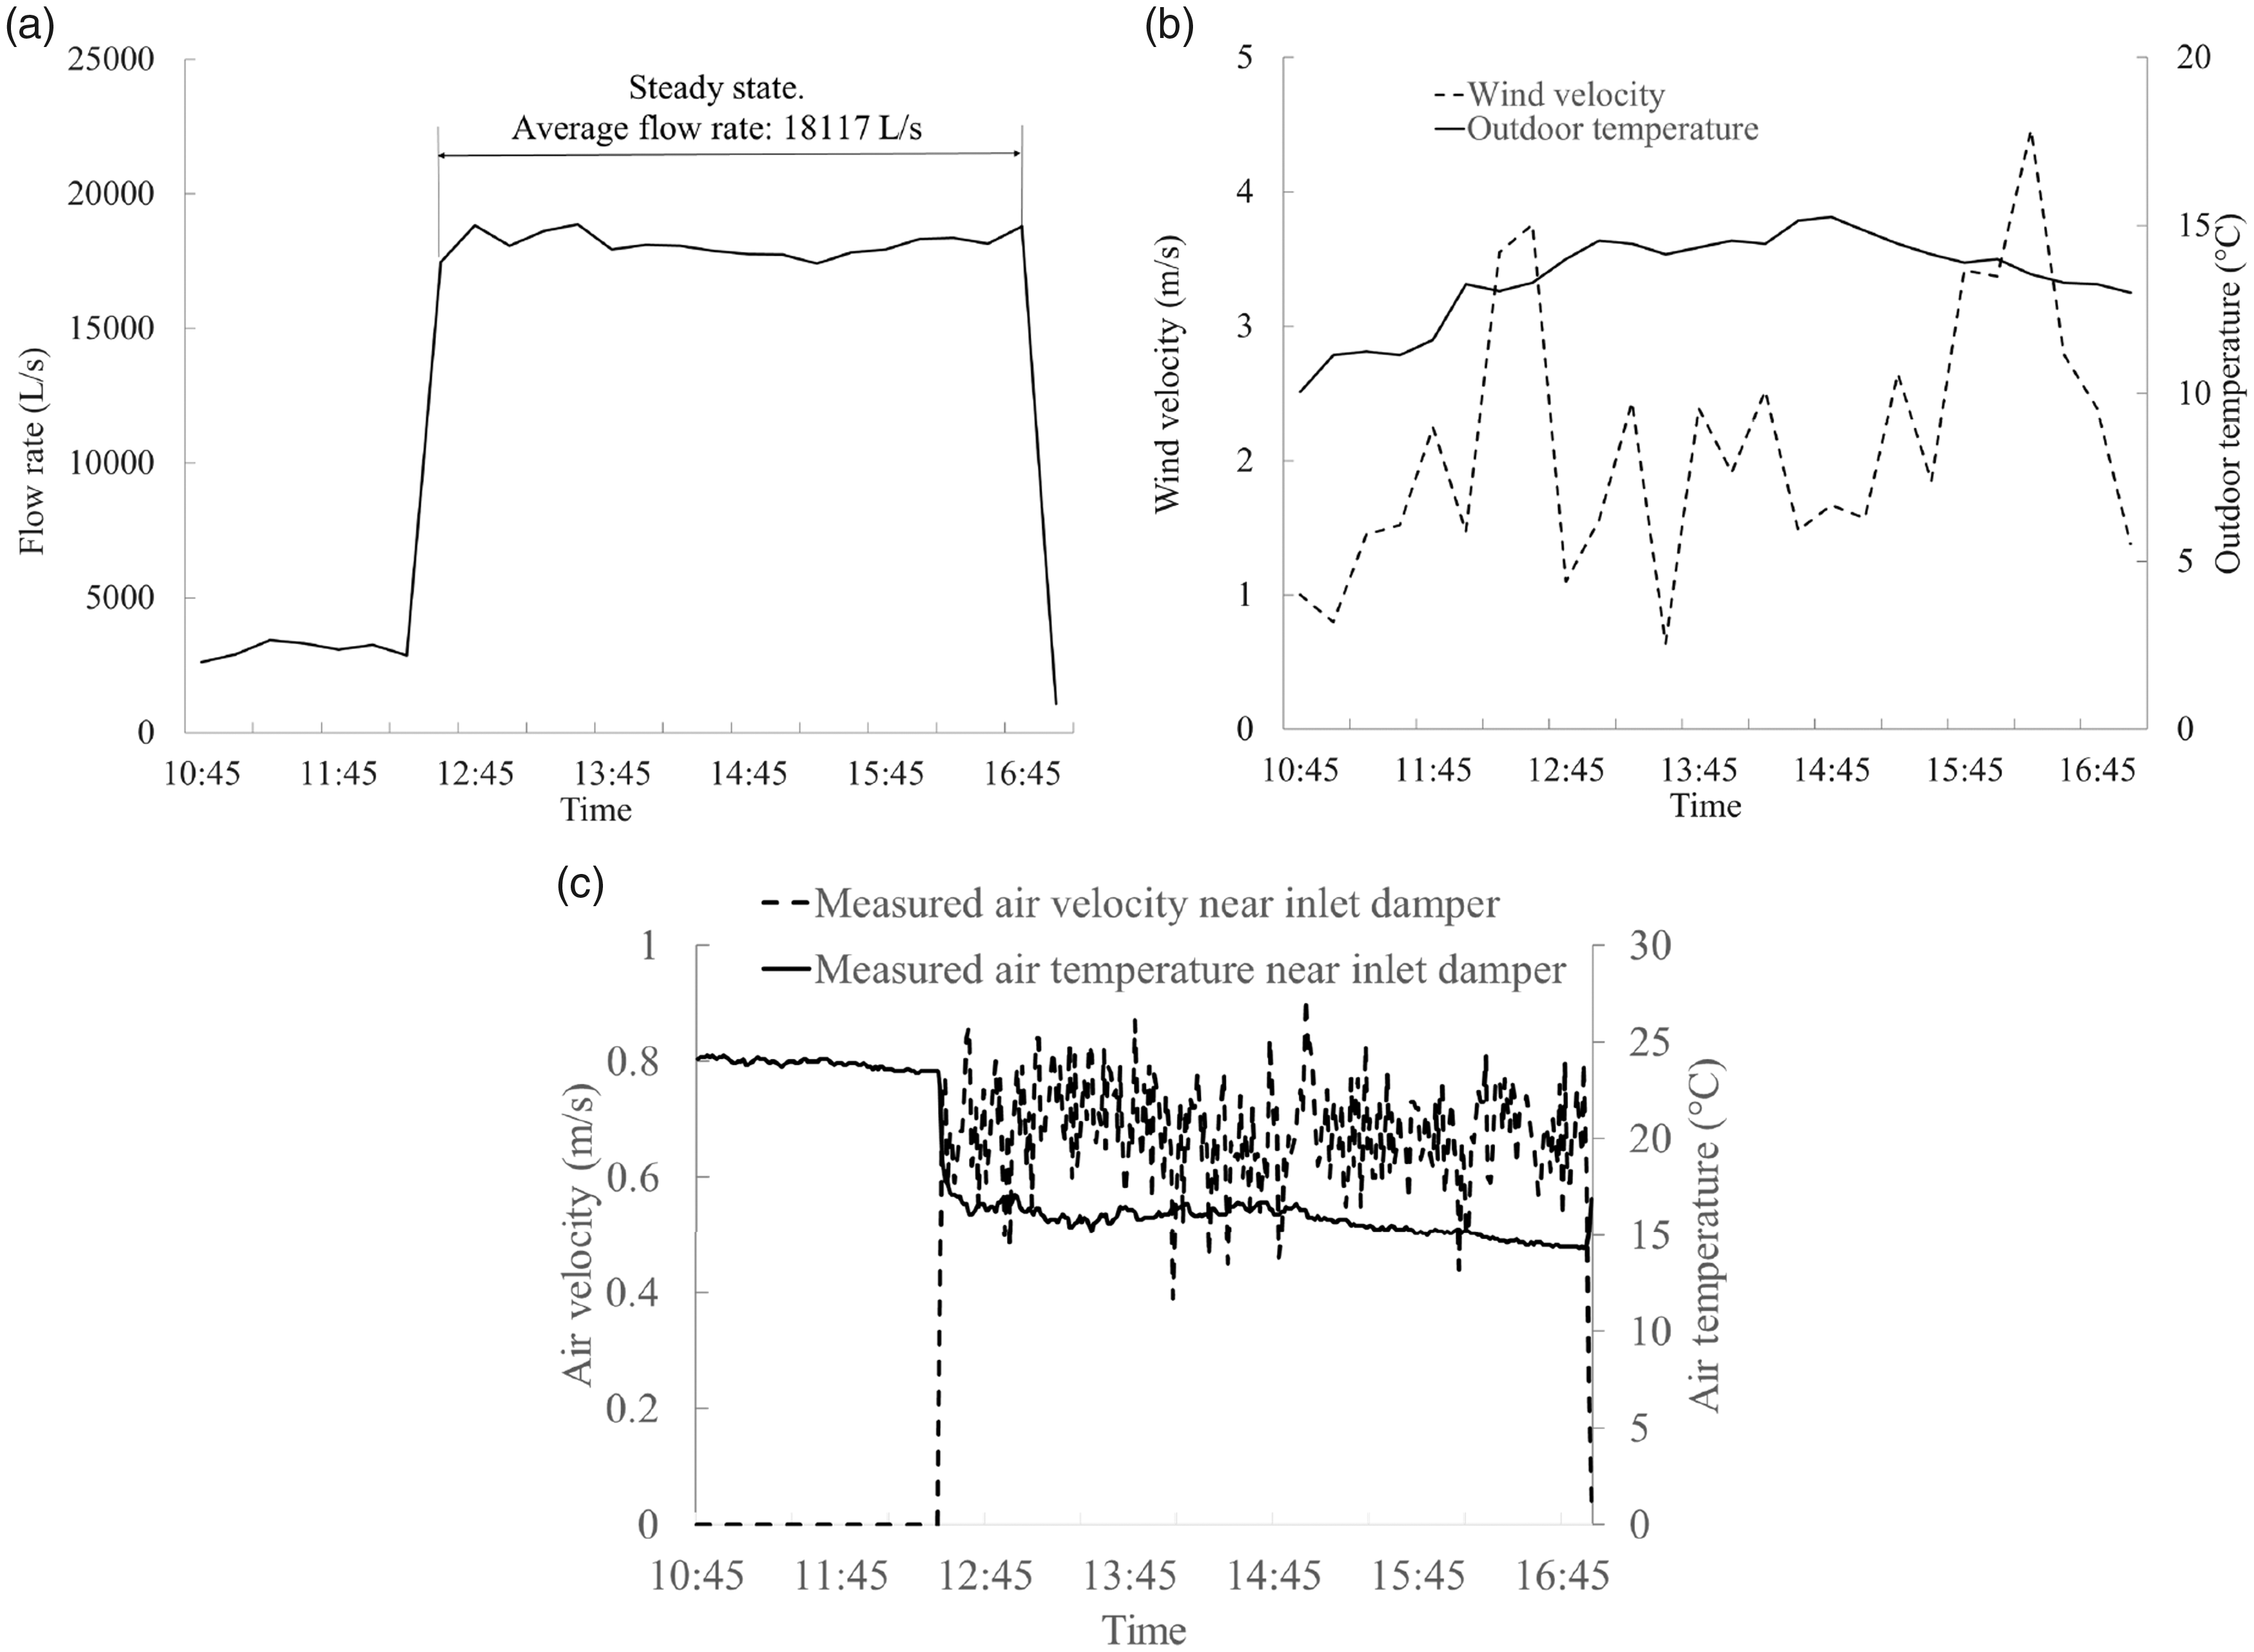
Day 2 measured data: (a) fan flow rate; (b) wind velocity and outdoor temperature; (c) measured air velocity and temperature near inlet damper (5th floor).
Modelling
The computer modelling includes the detailed model and the simplified model both using CONTAM, which is a multizone airflow network program developed by the US National Institute of Standards and Technology (NIST). CONTAM has been widely applied to IAQ analysis, ventilation design, building fire smoke control analysis for different building types. A recent study by Ng et al.30,31 used CONTAM for modelling the airflow and IAQ in different DOE (the US Department of Energy) reference buildings, including restaurants, offices, schools, stores, hotels, hospitals and apartments. Figure 6(a) shows the floor plan for a typical floor in the EV building and a corresponding detailed CONTAM simulation model including all corridors, dampers, offices, atriums, stairwells and elevator shafts. Since this detailed model was based on storey floors, there is a total of 15 zones (1st and 17th floors are not included since they do not have inlets). Based on the number of atrium sections, a simplified model was also developed to model each atrium as one zone for the five atrium sections to obtain the so-called 5-zone model.
(a) Typical floor plan. (b) The simplified CONTAM simulation model (5-zone). (c) The detailed CONTAM simulation model (15-zone).
The mass flow rate through each inlet damper is one of the key parameters for a hybrid ventilation system because it is directly related to the amount of free cooling and fresh air available from natural ventilation. In CONTAM, the mass flow rate through each inlet damper is modelled by the power-law flow model of equation (1)
32
with the flow exponent, n = 0.5 in this study. 
In the simulation, the wind velocity, direction and temperature were provided by the weather station on the top of the building. This information and the building location were used as the input data in the ‘Weather and Wind Parameters’ of CONTAMW SketchPad, where the wind profile and external pressure were calculated based on the wind model 25 of the software. The buoyancy effect was calculated using CONTAM based on the indoor and outdoor temperatures.
Results
Comparison between detailed model and simplified model
For modelling a complicated building such as the EV building in this study, the first and natural way is to include as many details as possible. Therefore, the detailed model included all the rooms and floors as shown in Figure 6(c). Then, to simplify the detailed model, the simple 5-zone model was developed and its results were compared to the detailed model to confirm its validity using the detailed model as a baseline. The flow coefficient, C, is 0.62 m2 for both detailed and simplified models, which was obtained by the calibration of the simplified model (see the next section Simplified model calibration in Day 1).
Figure 7 compares the simulation results of the detailed and simplified models under the weather condition of Day 1 for the fan frequency of 40%. Normalized root-mean-square deviation (NRMSE) was used to quantify the difference between the two models (equation (2)), which is often applied to compare different models or methods in building airflow analysis.8,33,34 The 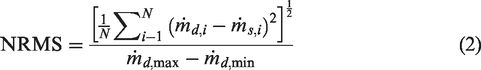
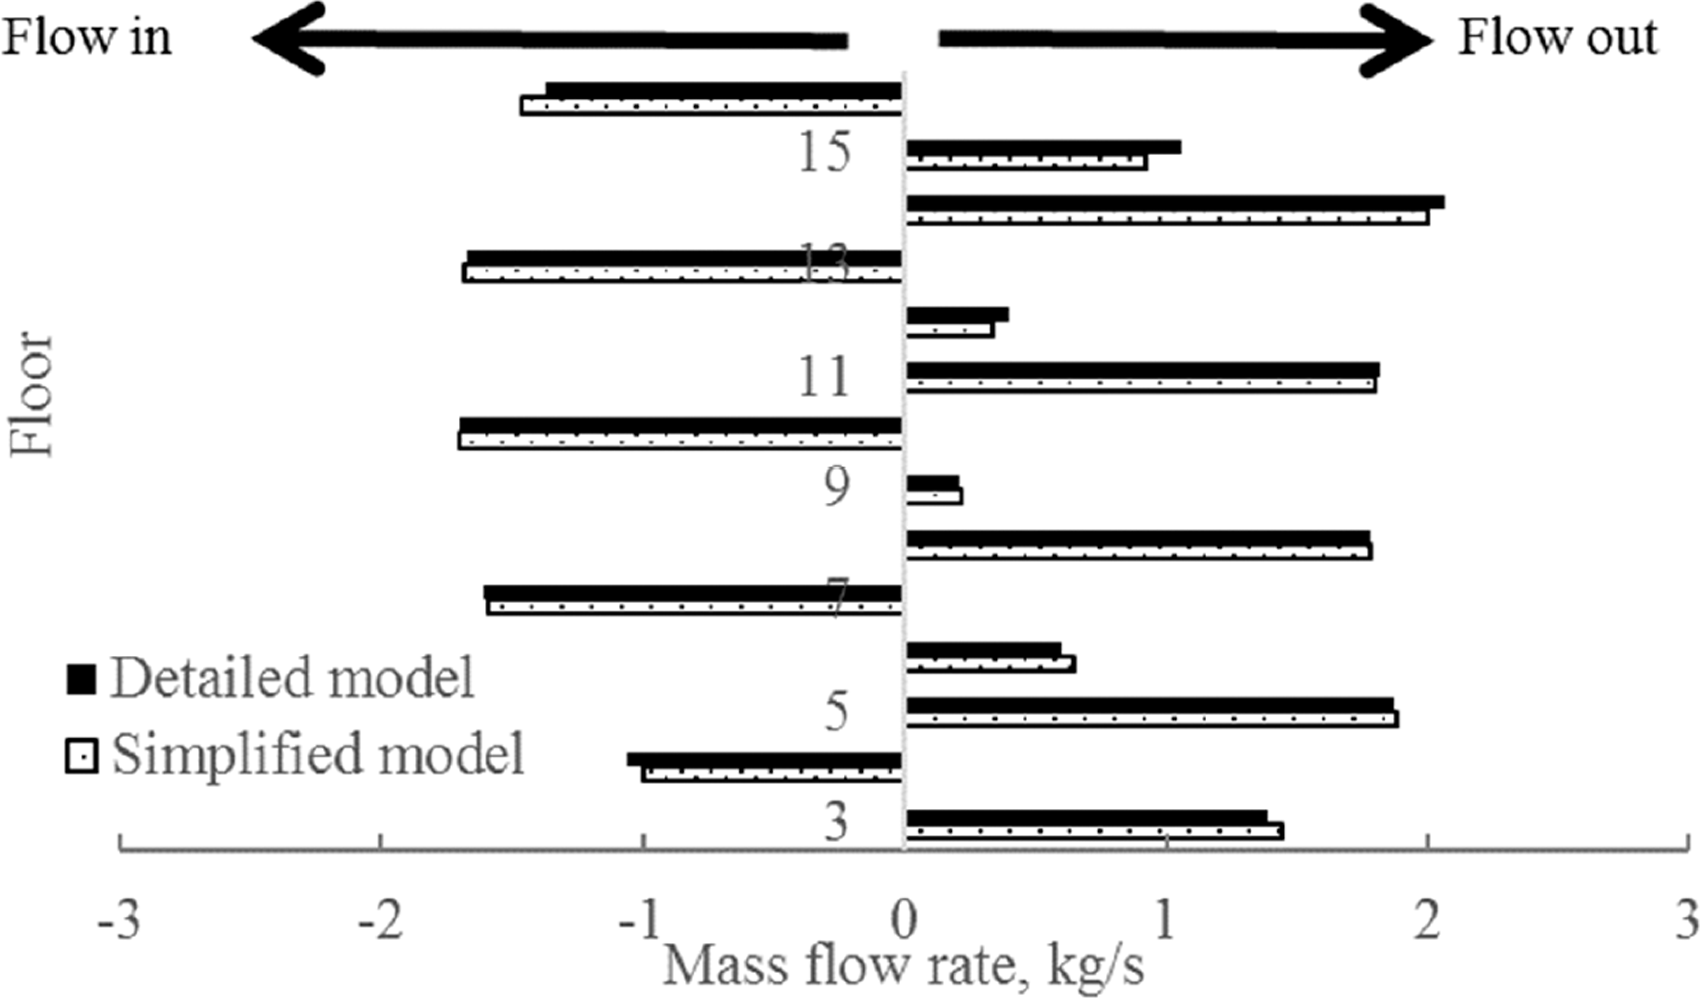
The comparison of predicted flow rates at the inlet dampers between the detailed and simplified models.
In some floors, the air flows in, and in others the air flows out (see Figure 7). The airflow direction was determined by the pressure difference across the inlet damper. As shown in Figure 8, on the 3rd floor, the indoor pressure was higher than the outdoor, resulting in an outflow. Due to the large flow resistance of the floor grills between the 3rd and 4th floors, the indoor pressure declined significantly, which led to negative pressure differences across the 4th floor inlet dampers, and the air become an inflow to the 4th floor. The same explanation applies to inflows on the 7th, 10th, 13th and 16th floors, and the outflows on other floors. Therefore, the ventilation flow in hybrid ventilation is quite complex due to the coupled impacts of stack effect, mechanical fans, building structure, outdoor weather conditions, etc.
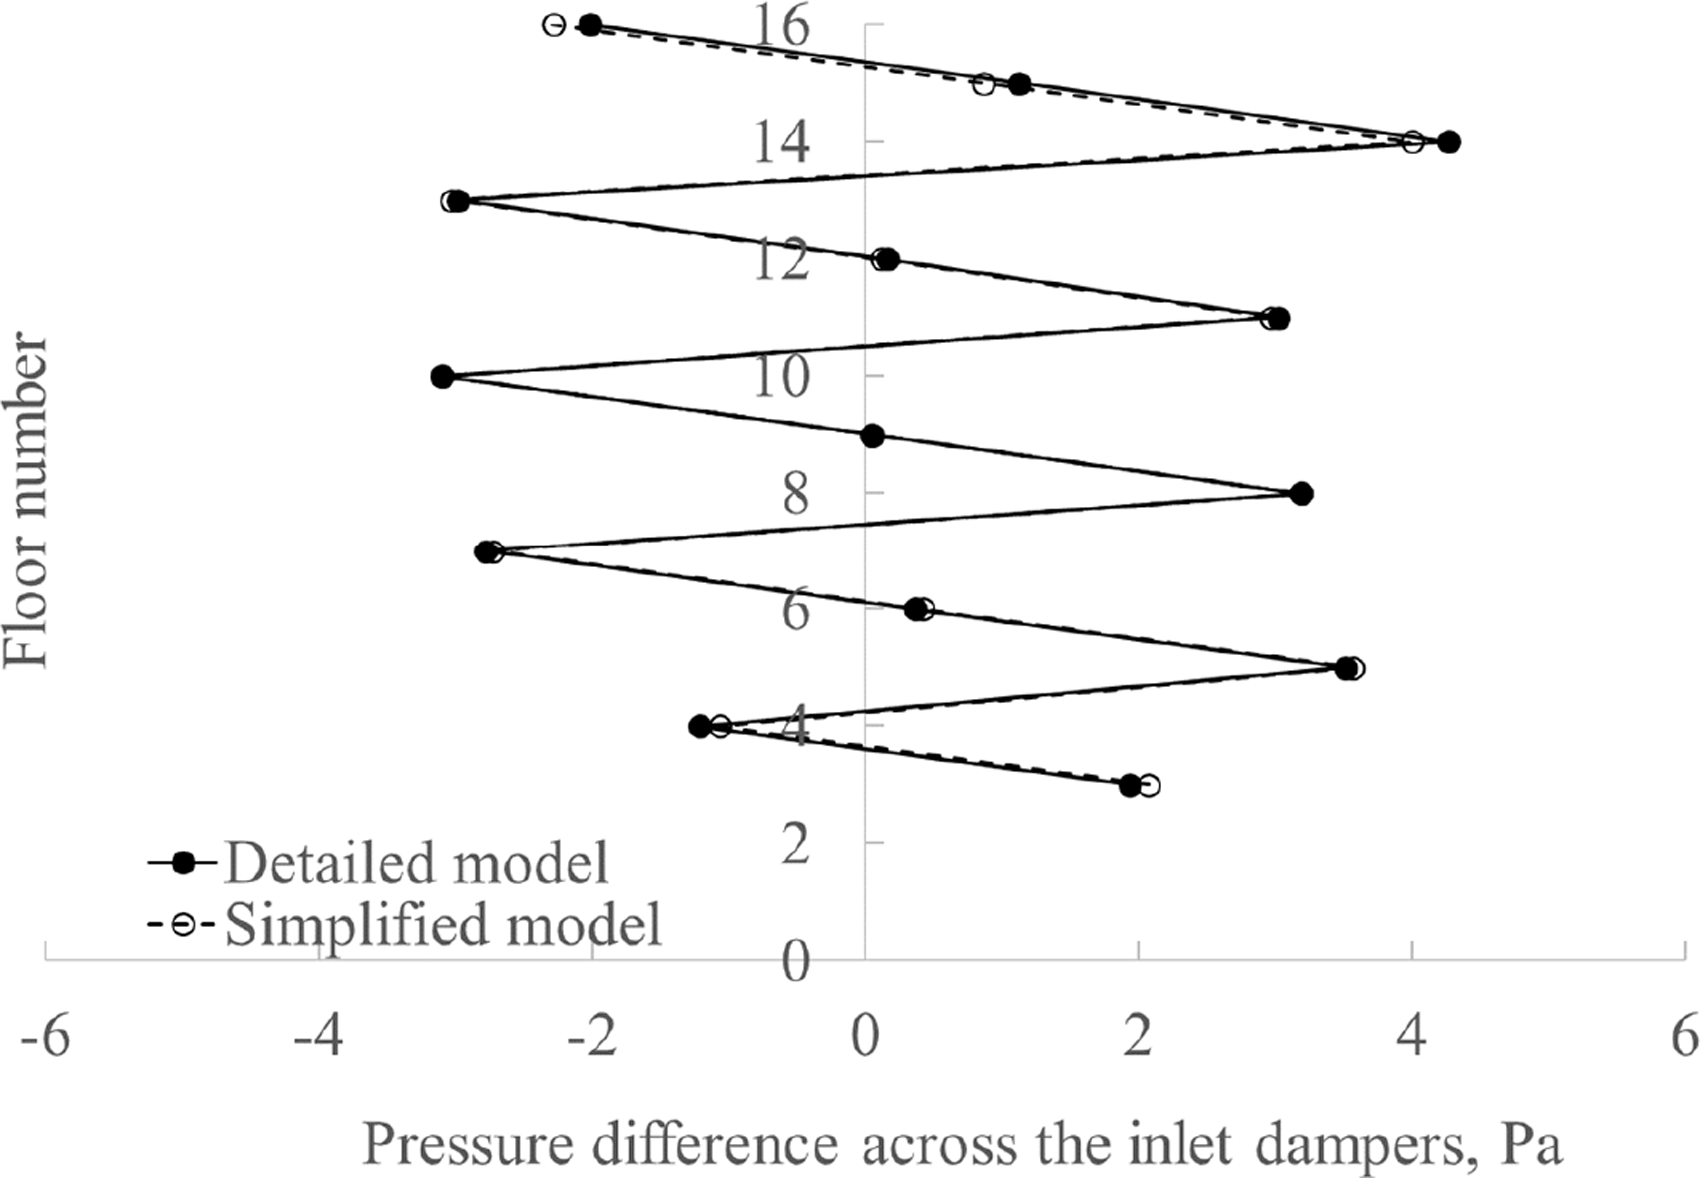
Predicted pressure difference across the inlet dampers of the detailed and simplified models.
Simplified model calibration in Day 1
On the other hand, to apply the 5-zone model to actual MPC applications, the flow coefficients of the inlet dampers, C, in equation (1) need to be calibrated against the measurement data. The flow coefficients could be variable with different operating conditions. In this study, they were calibrated using the measurement data from the three days of tests.
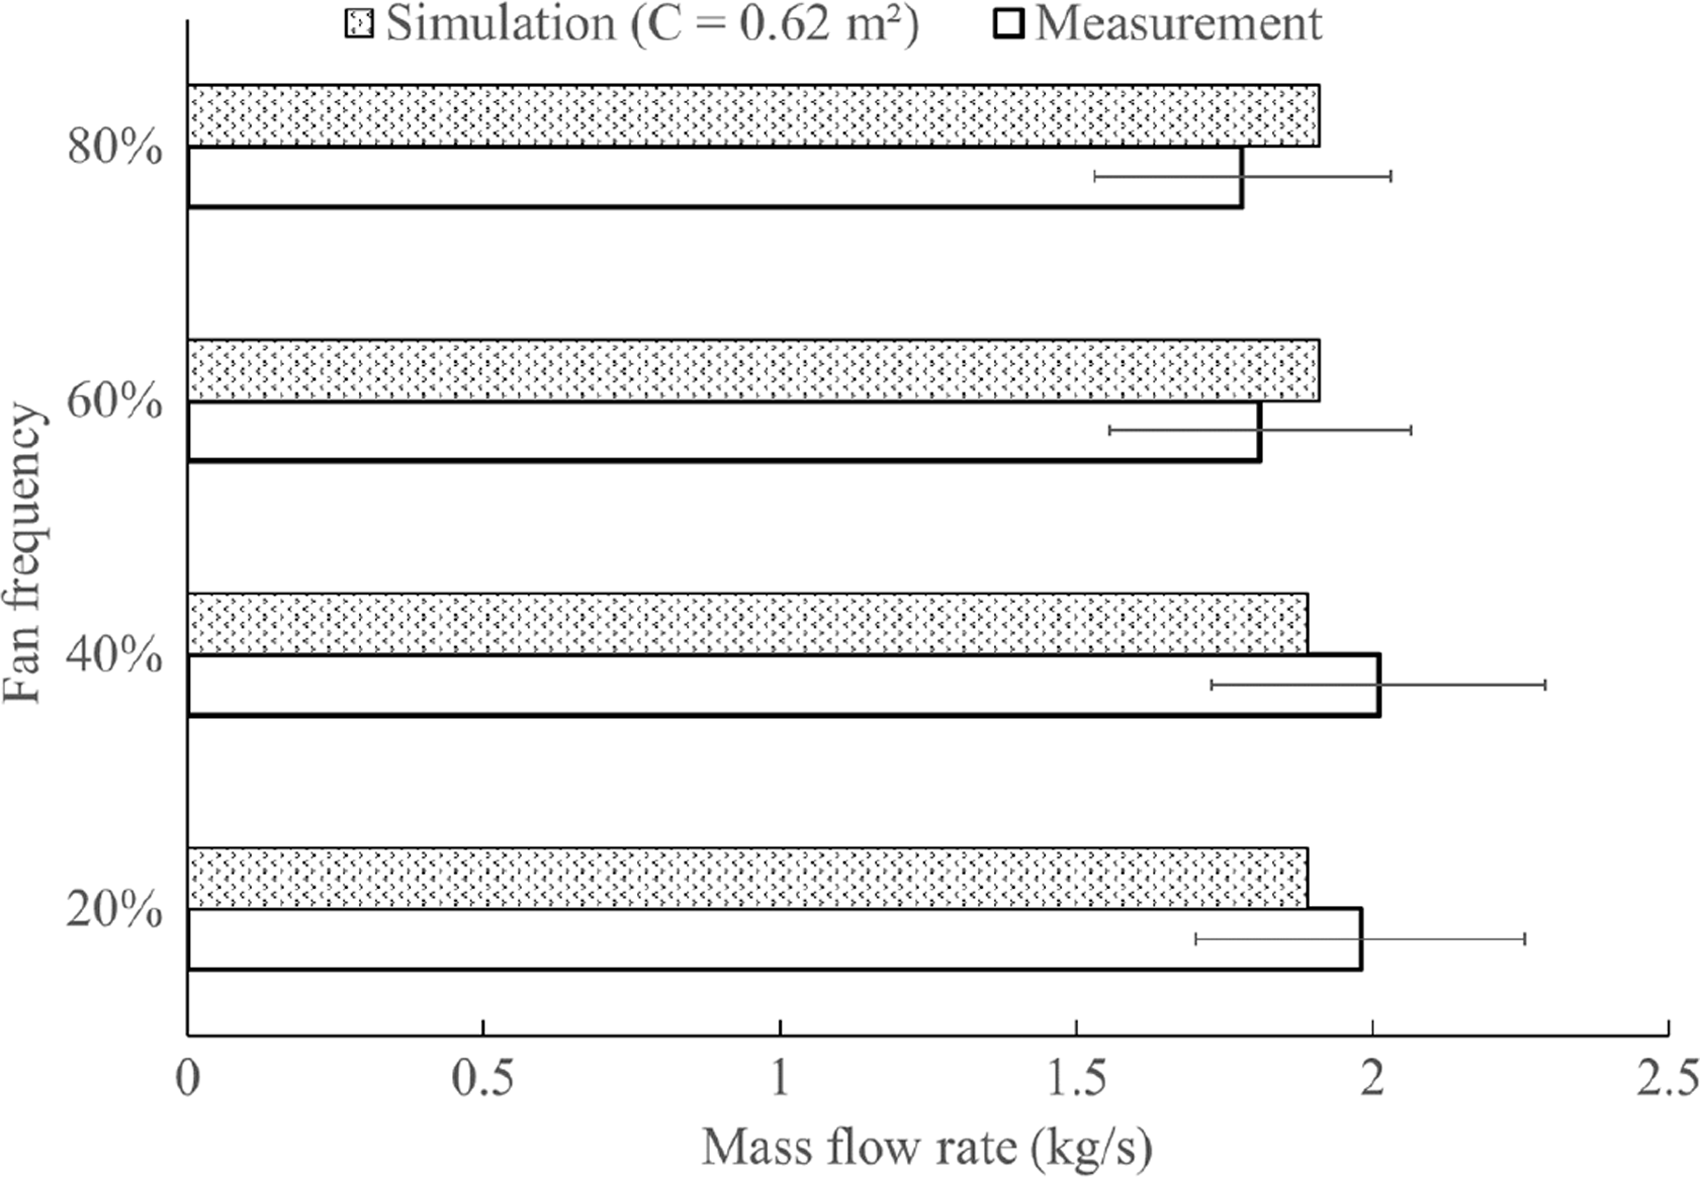
In Day 1, only the inlet damper of SE velocity on the 5th floor was monitored under different mechanical ventilation rates, i.e. different frequency setting of the variable speed drive of the roof fan. Figure 9 compares the corresponding inlet ventilation flow rates between the measurements and the simulations after calibrations under different roof fan frequency conditions. The calibrated flow coefficient, C, for the simplified model varied between 0.57 m2 and 0.64 m2 for different inlets with an average value of 0.62 m2 for all fan frequencies.
SE inlet damper flow rates on the 5th floor for different roof fan frequencies (20%–80%) and corresponding flow coefficients after calibration (Day 1).
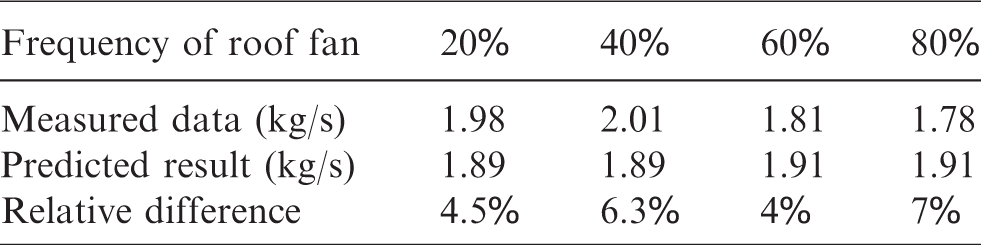
With the average flow coefficient, the predicted mass flow rates through the inlet damper on the 5th floor were compared to the measured data in Table 3. The relative difference is within 4% and 7%.
Predicted and measured mass flow rates through the damper on the 5th floor for different frequencies of the roof fan.
Simplified model calibration on Day 2 and Day 3
With the average value of the coefficient, C = 0.62 m2, obtained from the calibration on Day 1, we simulated the whole building on Day 2. Figure 10 shows a significant discrepancy of up to 80% between the simulation results and measurements of the mass flow rate through SE inlet dampers. Therefore, the flow coefficient needs to be re-calibrated for the new weather and operating conditions on Day 2. The values of C of the inlet dampers were thus adjusted for each atrium section as shown in Table 4. After the re-calibration, Figure 10 shows that the simulated flow rates on the 5th, 8th and 11th floors were more uniform and closer to the measured data than before the calibration.
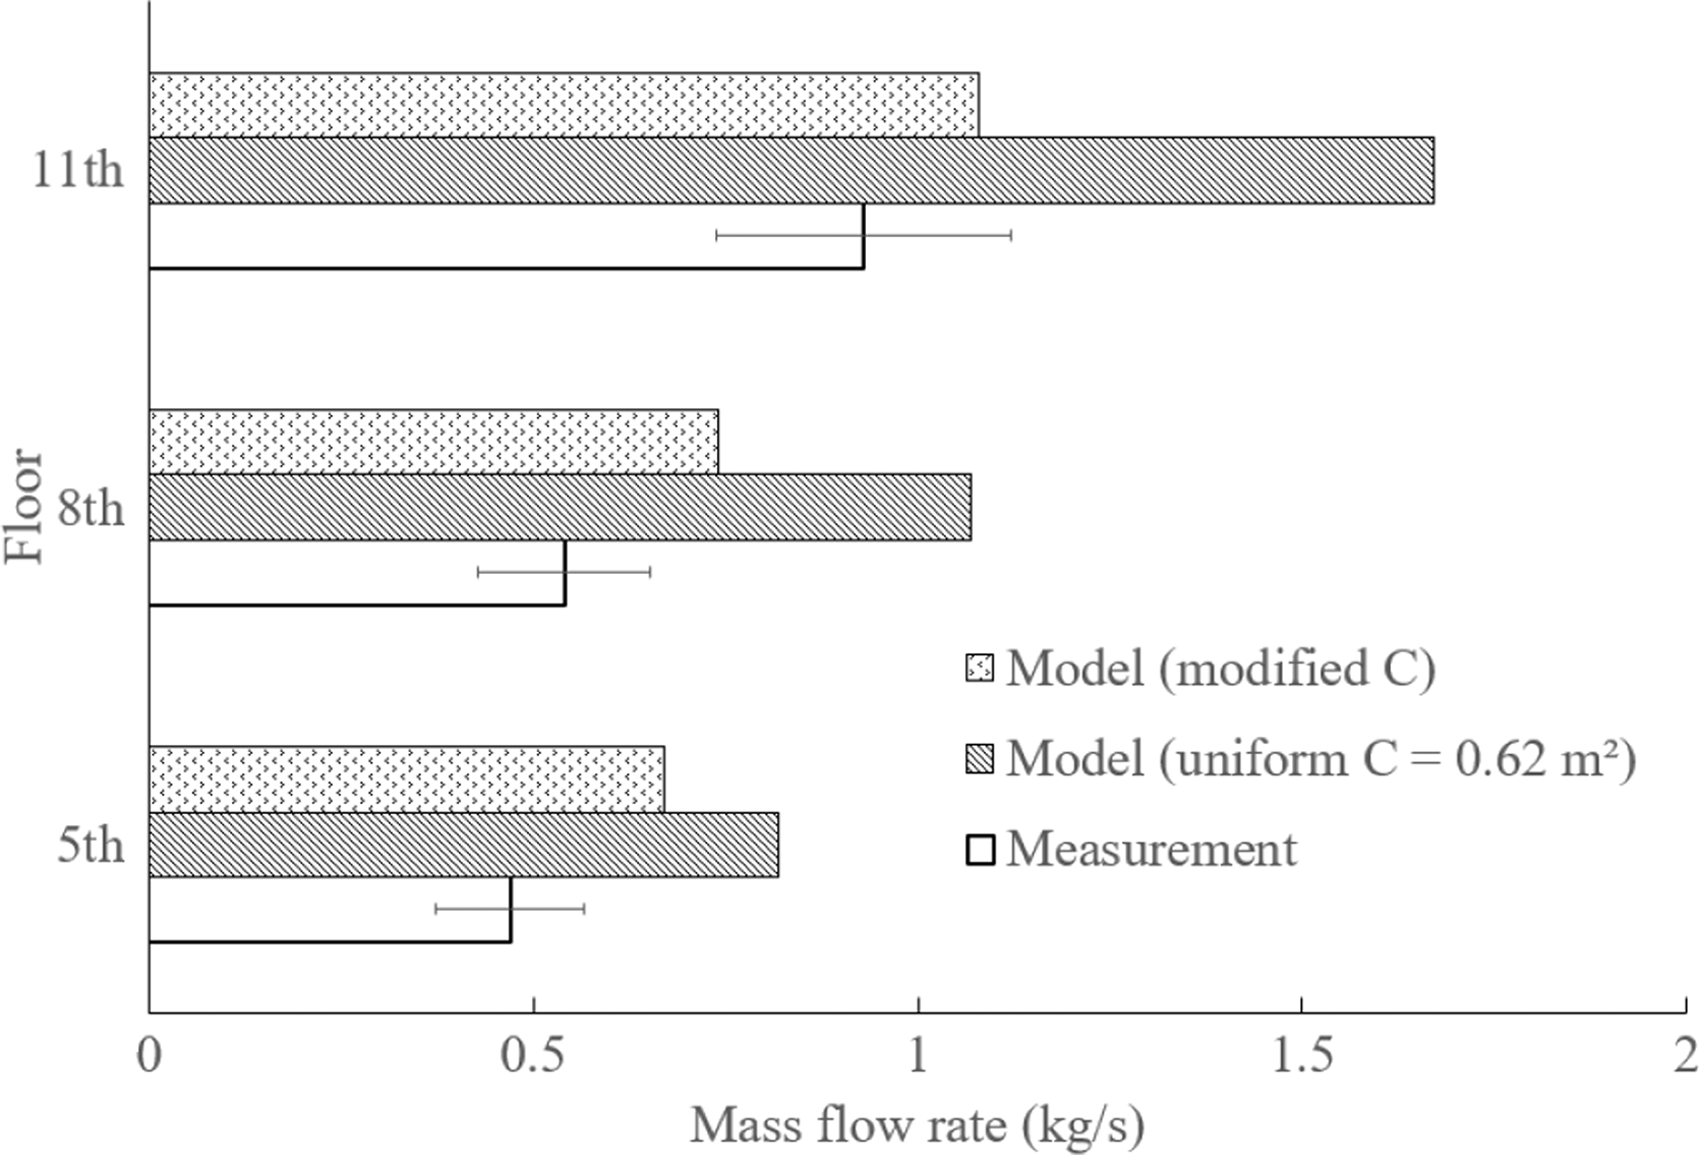
SE inlet damper flow rates on different floors and the calibrations of the flow coefficients (Day 2).
Modified value of flow coefficients, C, in the detailed CONTAM model (Day 2 and Day 3) (Unit: m2).
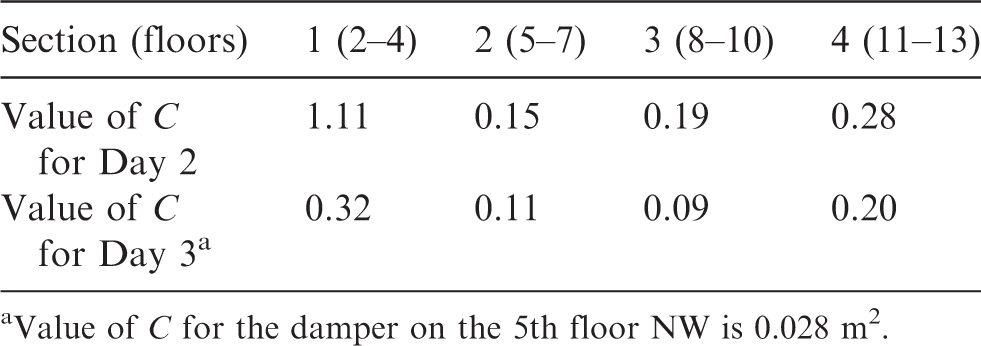
Value of C for the damper on the 5th floor NW is 0.028 m2.
The same method was applied on Day 3. After re-calibration, the simulated flow rates were closer to the measured data after adjusting the flow coefficient, C. The results are shown in Figure 11 and the values of C are listed in Table 4. The damper on the 5th floor (NW side) was half closed so the calibrated value of C was 0.028 m2, which is different from other dampers in the second section. The case studies on Day 1, Day 2 and Day 3 indicated that the values of the flow coefficient, C, for the dampers on different floors could vary at different time due to different outdoor weather and indoor conditions. Therefore, the values of C would need to be re-calibrated when implementing MPC in order to achieve accurate prediction and control hybrid ventilation in a high-rise building, which is our ongoing study. As the mechanics of the relations between the parameter C and the other factors are not clear at the current stage and beyond the interest of this manuscript, correlations of the C values were not obtained here.
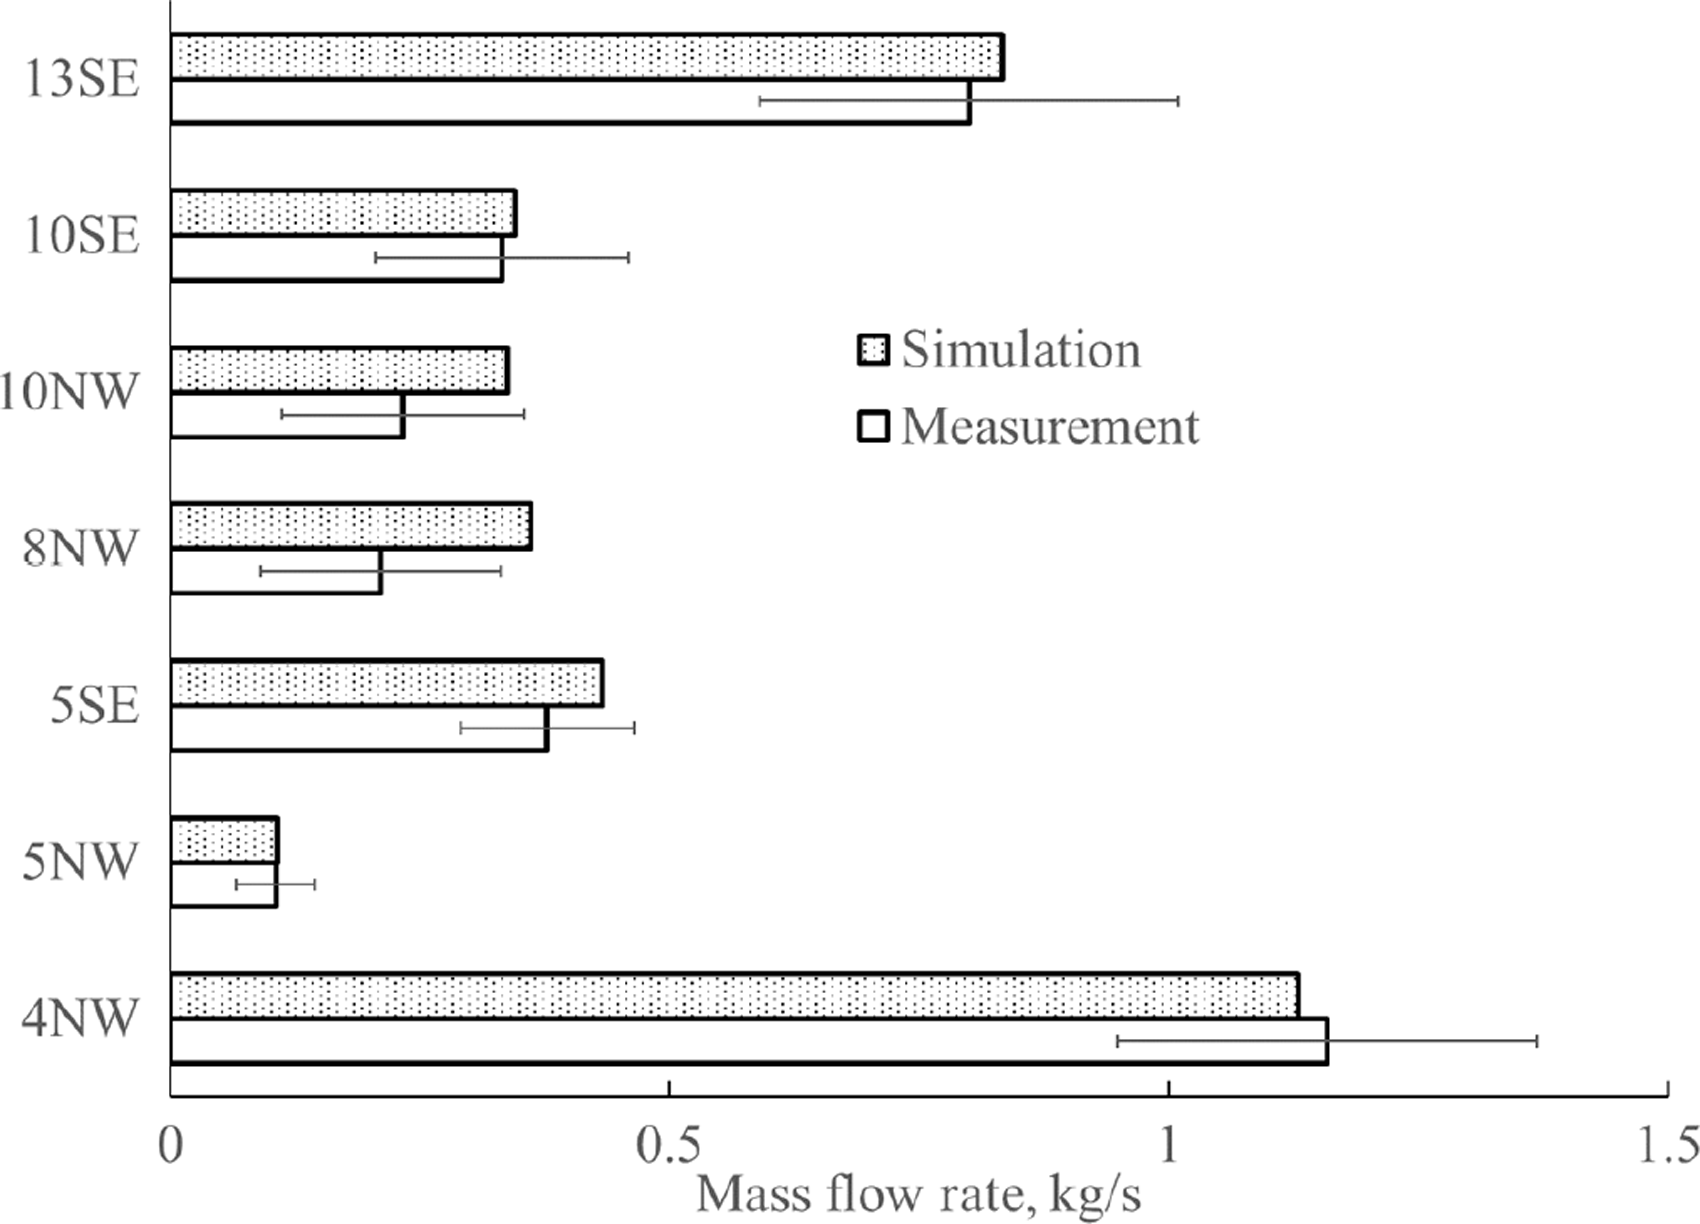
Inlet damper flow rates on different floors (Day 3).
Except the value of C, the accuracy of the ventilation rate measurements could also affect the difference between the simulation and the experimental results. In this study, the velocity uniformity test was conducted to check the accuracy of the measured ventilation rate, so that calibration of C based on the measured ventilation rate would contribute to the accurate prediction of hybrid ventilation.
Application – Optimization of the hybrid ventilation system
Due to the calibrated 5-zone model, the operational decision to control the hybrid ventilation system is possible. Here, to demonstrate the simplified model for potential use for predictive control applications, an example was used to achieve evenly distributed natural ventilation flows through all the inlet dampers on different floors so as to naturally cool all 15 floors at the same time. This is realized by adjusting the damper opening areas.
Figure 12 presents the flow rates under the weather conditions of Day 1 for the fan frequency of 40% (i.e. desired flow rate about 40% of maximum). The flow rate was quite non-uniform when all the dampers were fully opened. The flow rates of the 1st, 2nd and 5th sections were much greater than the middle sections because there was more stack effect on the low section (1st and 2nd sections) and more effect from the roof fan on the higher section (5th section). In order to make all floors equally benefit from the natural cooling, the inlet flow rates were distributed evenly by adjusting the damper opening sizes to reduce the opening percentage of sections with high ventilation rates, i.e. 1st, 2nd, and 5th sections as shown in Table 5.
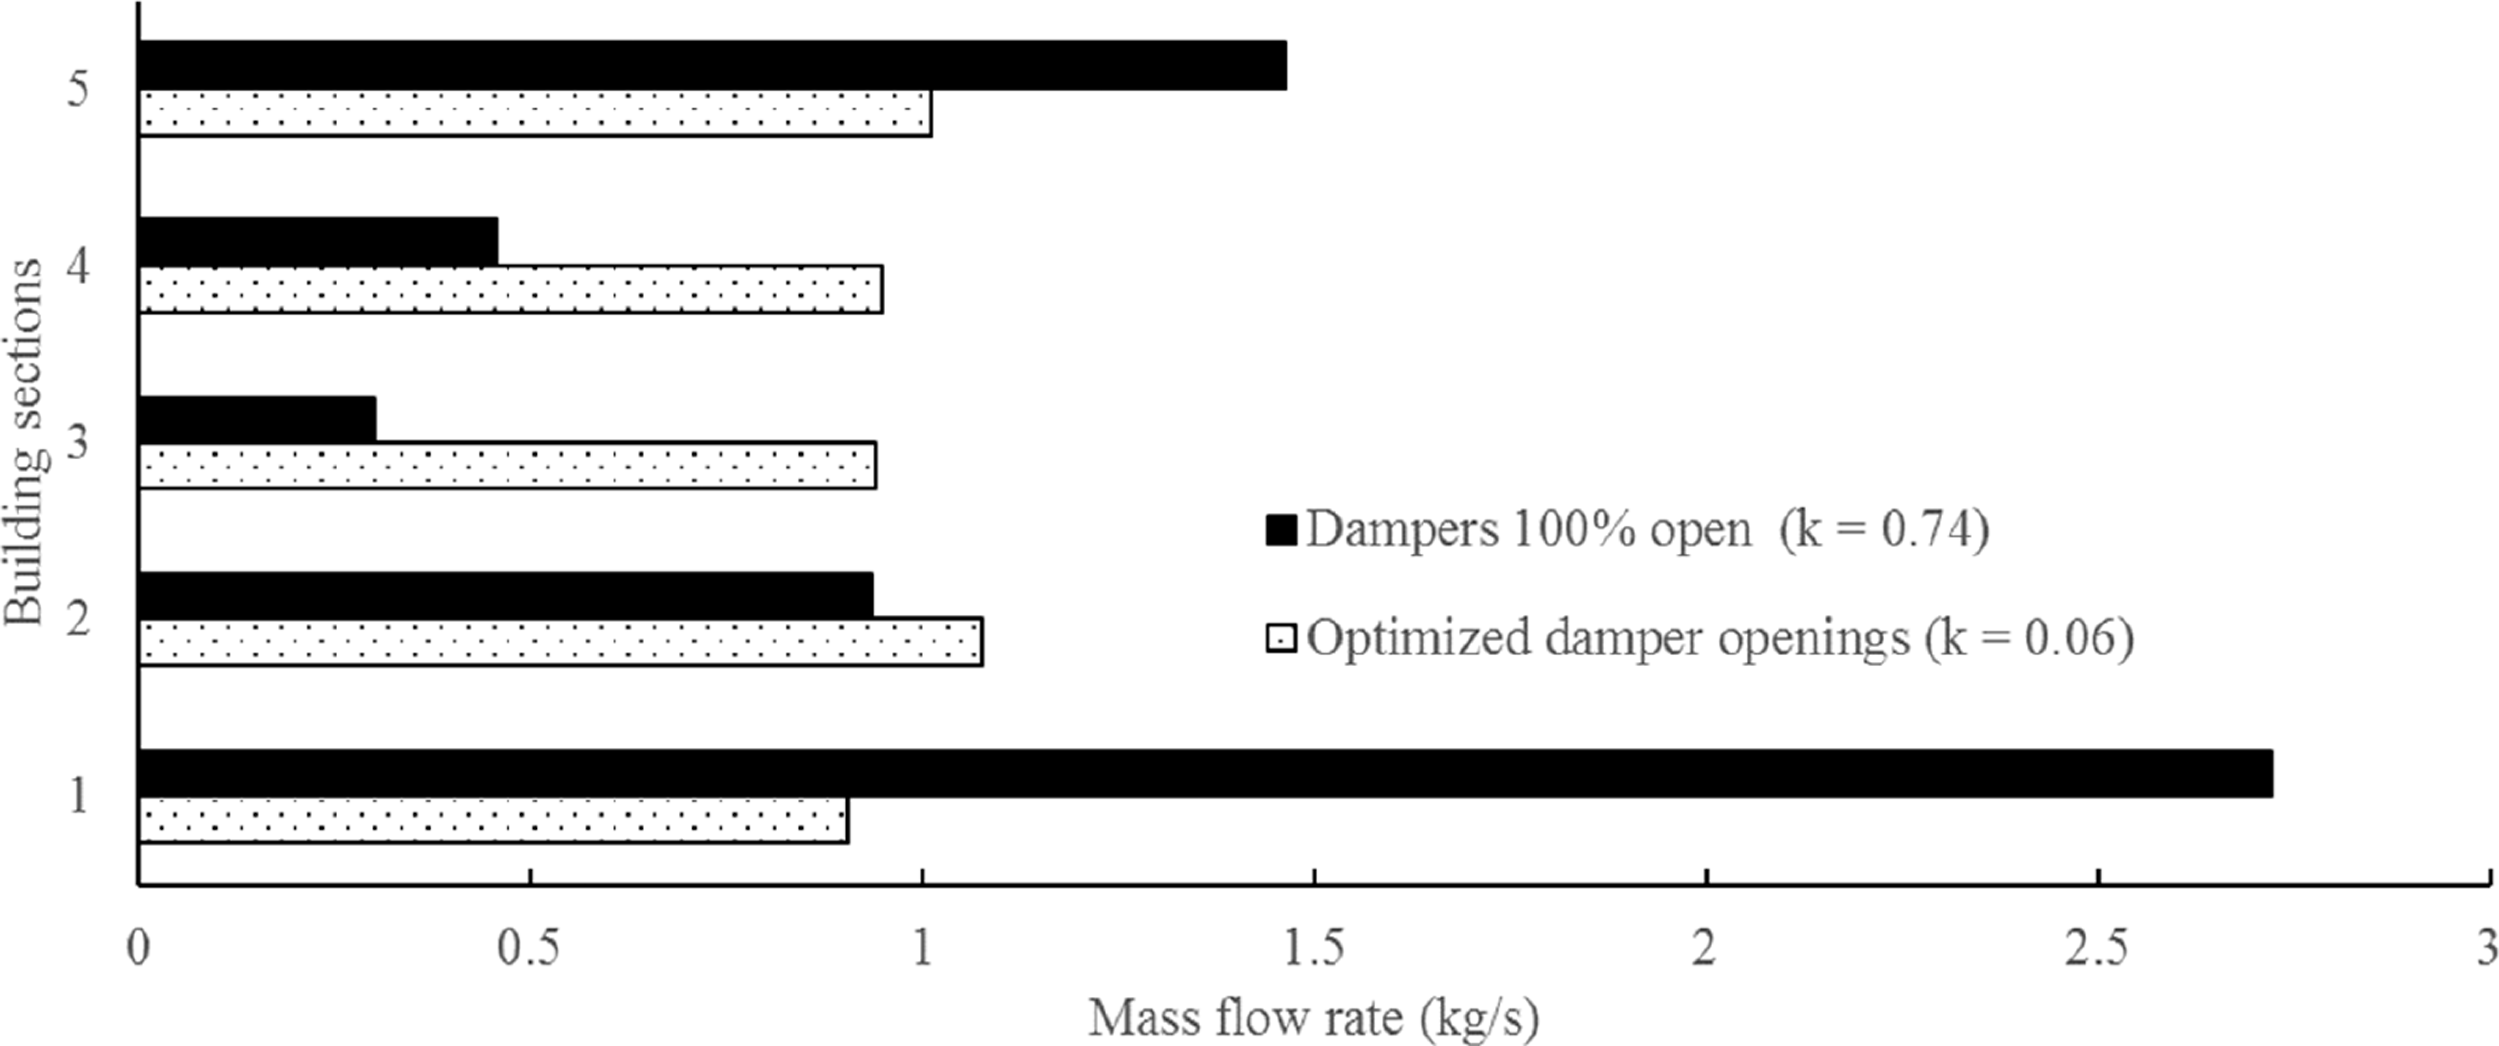
Comparing the natural ventilation inlet flow rates when all dampers are fully opened and when the damper openness are adjusted to achieve a better uniformity at fan frequency 40% (Day 1).
Damper opening percentage after the optimization.
The effect of the optimization can be shown by quantifying a non-uniformity factor of the flow rate, the non-uniformity coefficient, k, as defined by equation (3).
35
Here, 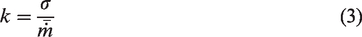
The C values may change as the opening percentage changes. However, the relations between C value and the opening percentage are not clear which requires long-term measurements. In this study, we assume the C values are constant as the opening area changes, which is a limitation and will be improved on in the future.
In the future, the simplified model will be implemented for actual on-line MPC applications of the building. The simplified model will also be further developed to include energy balance calculations for thermal mass analysis for future MPC applications of thermal storage for the building. More measurements will collect more data under different weather conditions, which will be used for further analysis of hybrid ventilation systems in high-rise buildings and validation of the simplified model with the energy balance equation.
Conclusions
This paper reports a series of full-scale measurements of hybrid ventilation in a 17-storey institutional building and associated whole-building simulations using both the 15-zone detailed and the 5-zone simplified multizone models. Full-scale measurements were conducted in three different days with significantly different ambient weather conditions. Mechanical fan flow rates at different fan frequencies, mass flow rates through dampers at different floors, outdoor temperature and wind conditions were measured. The simplified model of the whole building was calibrated by the measured data for the three days. The simulated results were also compared to a detailed model of the building using CONTAM. To illustrate the optimization of the high-rise hybrid ventilation system using the simplified model, an example was also provided.
This study shares many essential experiences of full-size high-rise building measurements and whole-building simulations. For example, the variations of weather conditions and their dynamic interactions with hybrid ventilation systems can be accounted for by flow coefficients in the simplified model of the building. Although the simplified model only needs five zones, the difference of the predictions between the detailed and simplified models is within 10%, indicating that the possibility to model the whole building in a simple way for the future on-line MPC applications of this high-rise building. The demo case study in the discussion section shows that the optimization of the damper opening area is an effective approach to achieve uniform natural ventilation flow through dampers on different floors.
Footnotes
Authors’ contribution
Dahai Qi and Jun Cheng conducted the experiments and numerical simulations. Ali Katal was involved in the experiments. The work was under the guidances of Prof Liangzhu (Leon) Wang and Prof Andreas Athienitis.
Acknowledgements
The support of Concordia’s Facilities Management, Daniel Gauthier and Harry Vallianos are acknowledged.
Declaration of conflicting interests
The author(s) declared no potential conflicts of interest with respect to the research, authorship, and/or publication of this article.
Funding
The author(s) disclosed receipt of the following financial support for the research, authorship, and/or publication of this article: This work was partly supported by the Natural Sciences and Engineering Research Council of Canada (NSERC), Hydro Quebec, Regulvar, Natural Resources Canada, and Concordia facilities management through an NSERC Industrial Research Chair. It was also partly supported by the US NIST Grant of ‘A Multizone Airflow Network Model with Addition of Energy Conservation Equation for Solving Coupled Thermal Airflows in Buildings – the Verification Study’ (Grant No. 60NANB15D286) through the Indoor Air Quality and Ventilation Group.