
Abstract
The purpose of this paper is to explore the influence of enclosed auditorium types on the wind ventilation environment inside a large semi-outdoor stadium. Stadia can be divided into three basic forms: all enclosed type auditorium, two sided and three-sided type auditorium. Different forms could have different effects on the wind environment inside a stadium, and the wind environment could have an impact on the competition in the stadium. In this study, a computer simulated hydrodynamics technology was used to model the stadium in different enclosed auditorium types. The wind environment in the stadium under different ventilation angles was simulated. The study found that for all round type stadia, the best inlet wind angle for the stadium ranges from 75° to 90°, which would avoid high wind velocity influences. For two-sided auditorium type stadia, 100 m sprinting track should be placed at the position near the auditorium. For inlet wind direction, 60° to 90° are the best inlet wind angles most favourable for sports competition. Hence, different stadium forms correspond different optimal inlet wind angles, while sport competition would also be impacted by the wind flow condition inside stadium.
Introduction
A modern stadium is a multi-purpose building that stages different types of sports, culture and religious activities. Some stadia have become symbols of the city and generate important income for the city. The purpose of a stadium is mainly to provide a platform stage and facility for the designated sports. Therefore, the comfort of athletes in a stadium is an important consideration and the design of a stadium should ensure the comfort and the best condition for athletes’ performance.
Stadia generally are classified into different types of semi-exterior spaces. Spagnolo and de Dear 1 represented a transition of thermal comfort between spaces in indoor and outdoor environments. Research done so far primarily focused on spectators’ comfort and rain shelter patterns. The spectators are sheltered to some extent by the roof and walls of the stadium to protect against the natural climatic environment and prevent the effect of wind. These factors could be beneficial to the thermal comfort of the audience but may have a negative impact on competitors on the other hand. In order to enhance ventilation, the auditorium terrace can be divided by a vertical opening and to separate supporters. 2 Cropper et al. 3 studied the thermal response of Australian audiences and concluded that the photometric characteristics of the stadium roof could affect the thermal feeling of the audience. Semi-outdoor and outdoor spaces are connected by some factors such as sunshade elements, hard surface materials and the opening position for wind, which can modify the actual level of air temperature, solar radiation and wind layout.4,5 Bouyer et al. 6 found that the geometry of the stadium has a considerable impact on the thermal comfort of the audience by evaluating the physiological equivalent temperature (PET) indicators of two stadia based on the wind tunnel test method. Besides, airflow velocity is also an important factor that could affect the stadium’s environment that could be conducive to improve the thermal comfort of the audience. However, extreme wind speeds exceeding 3.6 m/s should be avoided7–9 to prevent wind from blowing off personal items. On the other hand, strong winds are not suitable for sports competition as it may influence an athlete’s performance record and direction of the ball being played. 8
Natural ventilation of interior environment is caused either by wind-induced pressure difference, or buoyancy-induced pressure difference, or both.10–18 Full-scale measurements, scale measurements and computational fluid dynamic (CFD) are the three main research methods for the evaluation of natural ventilation. Several ventilation assessment methods have been reviewed by Chen. 17 Full-scale measurements could study real-world architectural situations, taking into account the complexity of the problem. However, the actual measurement would only calculate the amount of fixed sensor point, air volume due to the field measurement equipment limitation. Reduced-scale wind tunnels can effectively control boundary conditions, but often it could only be made at limited spatial locations.
Furthermore, any location data in the flow field domain can be calculated and displayed using computational fluid dynamics (CFD) method. 19 This approach has increasingly been used to study a range of atmospheric and environmental issues,20–22 such as wind comfort at the pedestrian level and the spread of air pollutants,23–32 the wind safety of buildings,32–35 as well as buildings and streets’ wind environment.36–45 Van Hooff and Blocken41–43 used CFD simulation methods to study the natural ventilation of a large semi-enclosed stadium. Besides, they evaluated the effect of inlet wind direction and urban environment on the natural ventilation of the same stadium, indicating the apparent impact on the ventilation due to openings. 42
In addition, CFD can also be performed under full scale condition avoiding the scale variation problem of the wind tunnel testing. Nevertheless, the accuracy and reliability of CFD is very important. To solve this problem, validation with experimental data is necessary to meet important quality standards.44–48
The purpose of this research is to study the effect of wind flow condition due to different auditorium styles for a sport stadium. The research done so far on simulation environment for a sport stadium has been mainly focused on the auditorium pattern and roof. The thermal comfort of spectators has also been researched. The sustainable development of a sport stadium is an important consideration.49 However, there has been no research on the effect of auditorium enclosure pattern. This paper reports CFD simulations of the airflow field for different enclosure shapes of a sport stadium. Natural ventilation characteristics for the stadium with different patterns of auditorium stands were investigated and the results show that the various forms of a stadium envelope and approaching wind direction could have significant impact on airflow distribution in a stadium. The CFD model was validated using full-scale wind velocity measurements reported in the literature.
Methodology
Case description of the stadium and surroundings
In this study, simulations were performed for a single-zone isolated stadium with three possible types of auditorium patterns as shown in Figure 1. The stadium has dimensions of width (W) × depth (D) × height (H) =184 × 252 × 30 m3. In this study, three cases were considered corresponding to three auditorium styles which are different in the degree of surroundings under the same cover area. These building models can be classified into three cases as shown in Figure 1:
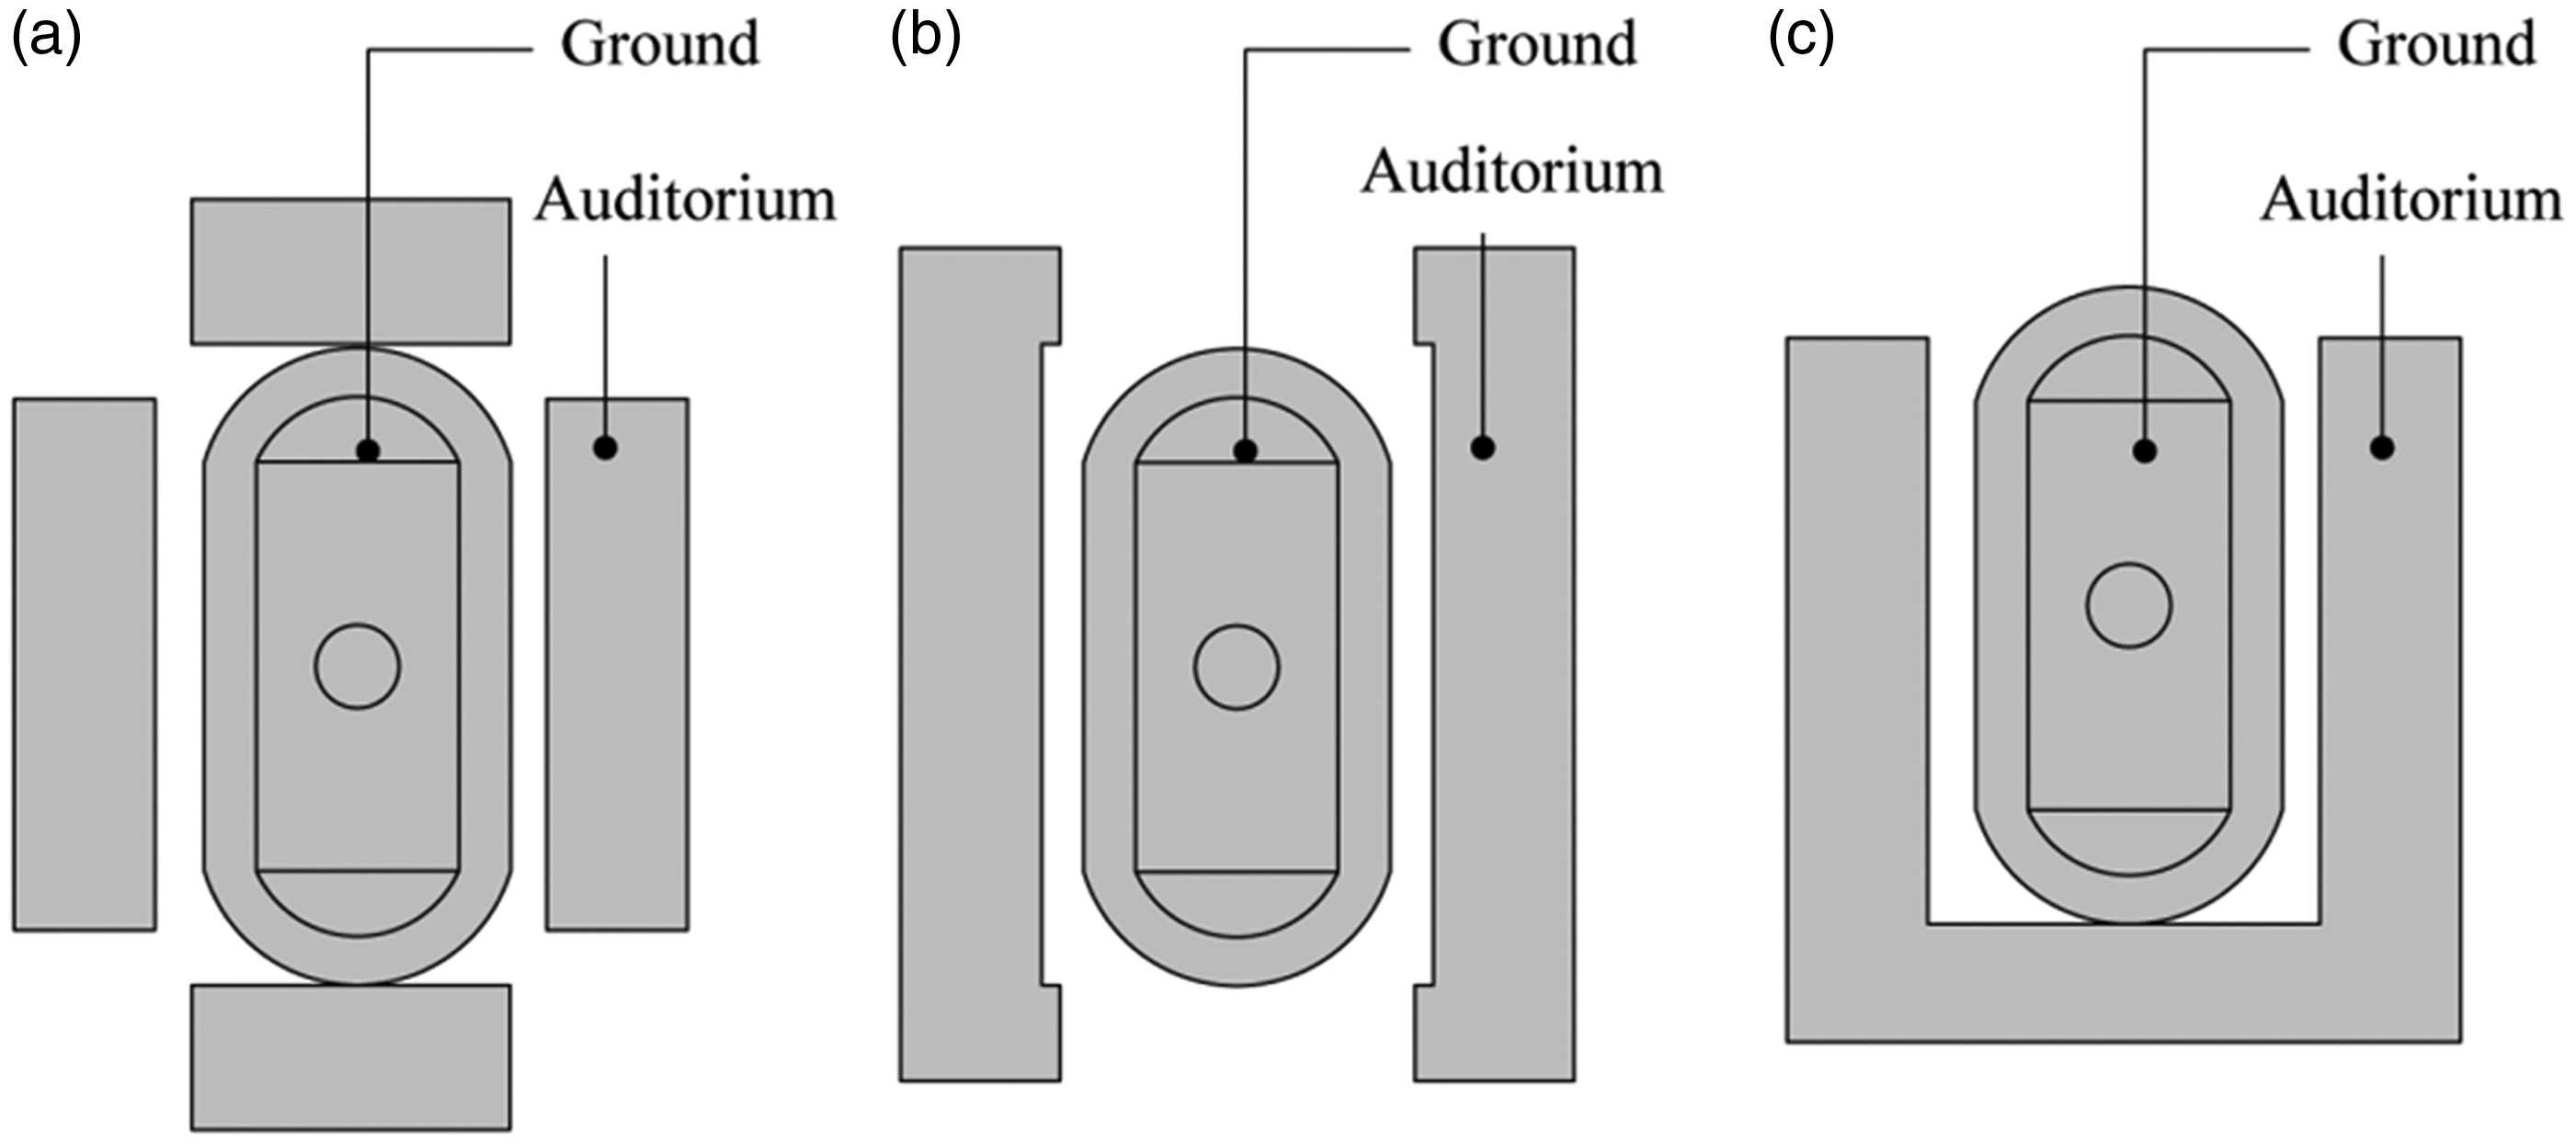
Three simulation model cases. (a) Case A, (b) case B, (c) case C.
Case A (Figure 1): This case evaluates the ventilation wind-flow in a fully enclosed auditorium type of a stadium. The auditorium of the stadium is positioned at the eastern, southern, western and northern sides of the building. The football field locates at the centre of the stadium with a running track around it. There are four entrances at four corners of the whole stadium and airflow mainly flows into the interior of the stadium through the entrance openings.
Case B (Figure 1): This case evaluates the ventilation wind-flow in a stadium that has two-sided auditoria. The two auditoria are located at two long sides of the stadium. Two openings of the stadium position at the short ends of the stadium building and the area of the stand is the same as case A. The wind flows into the building mainly through two entrance openings and the football field position as in case A.
Case C (Figure 1): This case evaluates the wind-flow in a stadium that is enclosed by the auditorium on three sides. The whole audience area is the same as in cases A and B. The wind can only flow into the stadium from the sole entrance opening at the northern side and the position of the football field is the same as in the above cases.
Boundary configuration
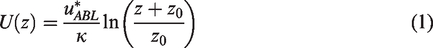
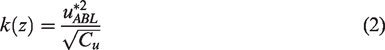
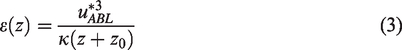
At the inlet of the domain, the neutral atmospheric boundary layer (ABL) inflow profile of the mean wind speed U (m/s), turbulent kinetic energy k (m2/s2) and turbulence dissipation rate ε (m2/s3) are defined as given by equations (1) to (3)
49
For the ground surface, the standard wall functions by Launder and Spalding with a roughness modification were used.51,52 The physical sand-grain roughness height ks (m) and the roughness constant Cs were determined by their consistent relationship with the aerodynamic roughness length z0.
53
For ANSYS/Fluent 12.1, this relationship is described by equation (4)
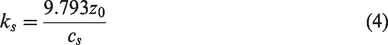
Standard wall functions were also used on building surfaces but with a zero roughness height ks = 0 (Cs = 0.5). Zero gauge static pressure was applied at the outlet plane. Symmetry conditions were applied at the top and lateral sides of the domain.
Solver setting
Isothermal CFD simulations were performed with 3 D steady RANS equations and the realizable k-ε turbulence model. 54 All cases were modelled under 7 approaching wind angle directions ranging from 0° to 90°. The whole computational process would be terminated if the scaled residuals declined to a minimum value of 10−7 for x, y, z momentum, 10−6 for k, ε and continuity. All computations were performed on an 8-core workstation (Intel Xeon E5 2680 v3, 2.7 GHz) with 16 GB DDR of system memory.
Computational grid and sensitive analysis
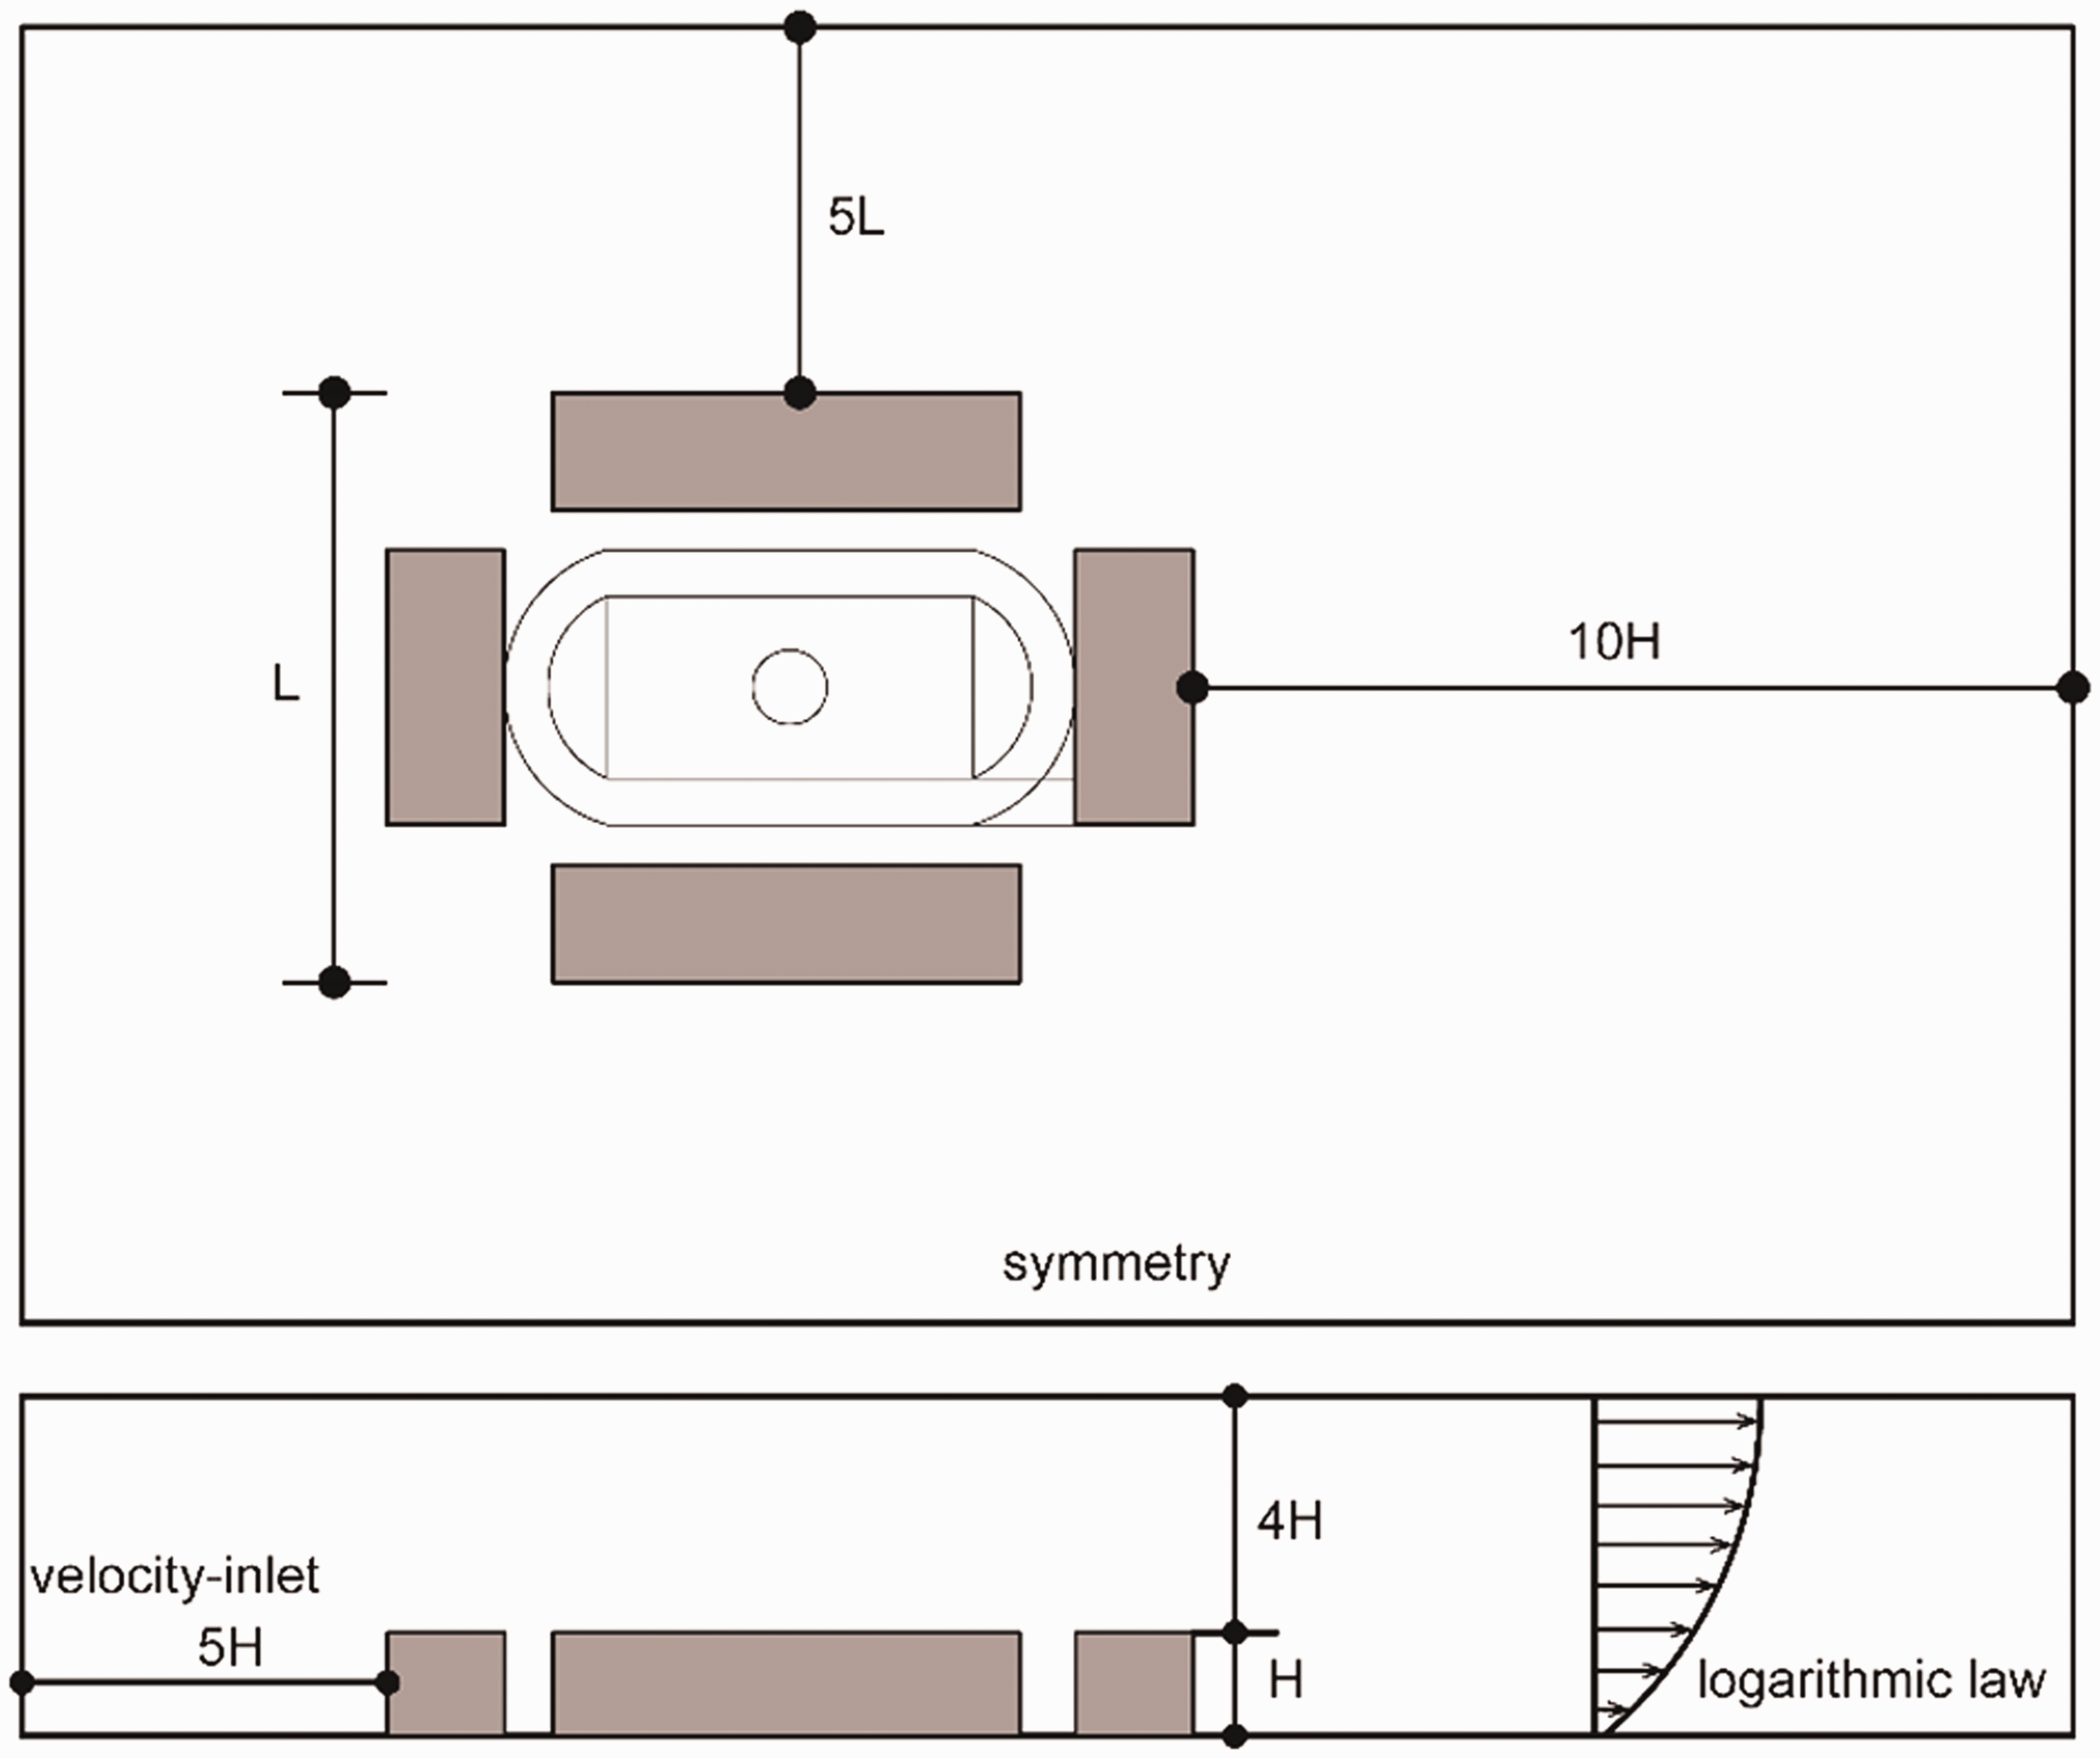
A computational model was produced for the stadium to create all outlet openings as presented in Figure 2. The upstream and downstream domain length was 5 H = 150 m and 10 H = 300 m, respectively. The resulting dimensions of the domain were W × D × H = 2024 × 852 × 150 m3 (Figure 2) and the maximum blockage ratio was 1.8% which is below the recommended maximum blockage ratio.23,24 The computational grid consisted of almost 7,000,000 hexahedral cells. High grid quality for the stadium surrounding is imperative to attain the precise simulation of the interior natural ventilation under ABL wind flow condition. However, the generation of such a high-quality grid for this stadium is not straightforward, due to the considerable fluctuation in the length scales in the computational domain. This study utilized the grid generation of grid extrusion operation method provided by van Hooff and Blocken. 47 Figure 3 presents the precise high-quality grids inside the building and openings.
Computational sized domain and inlet wind pattern.
Computational grid detail of the auditorium.
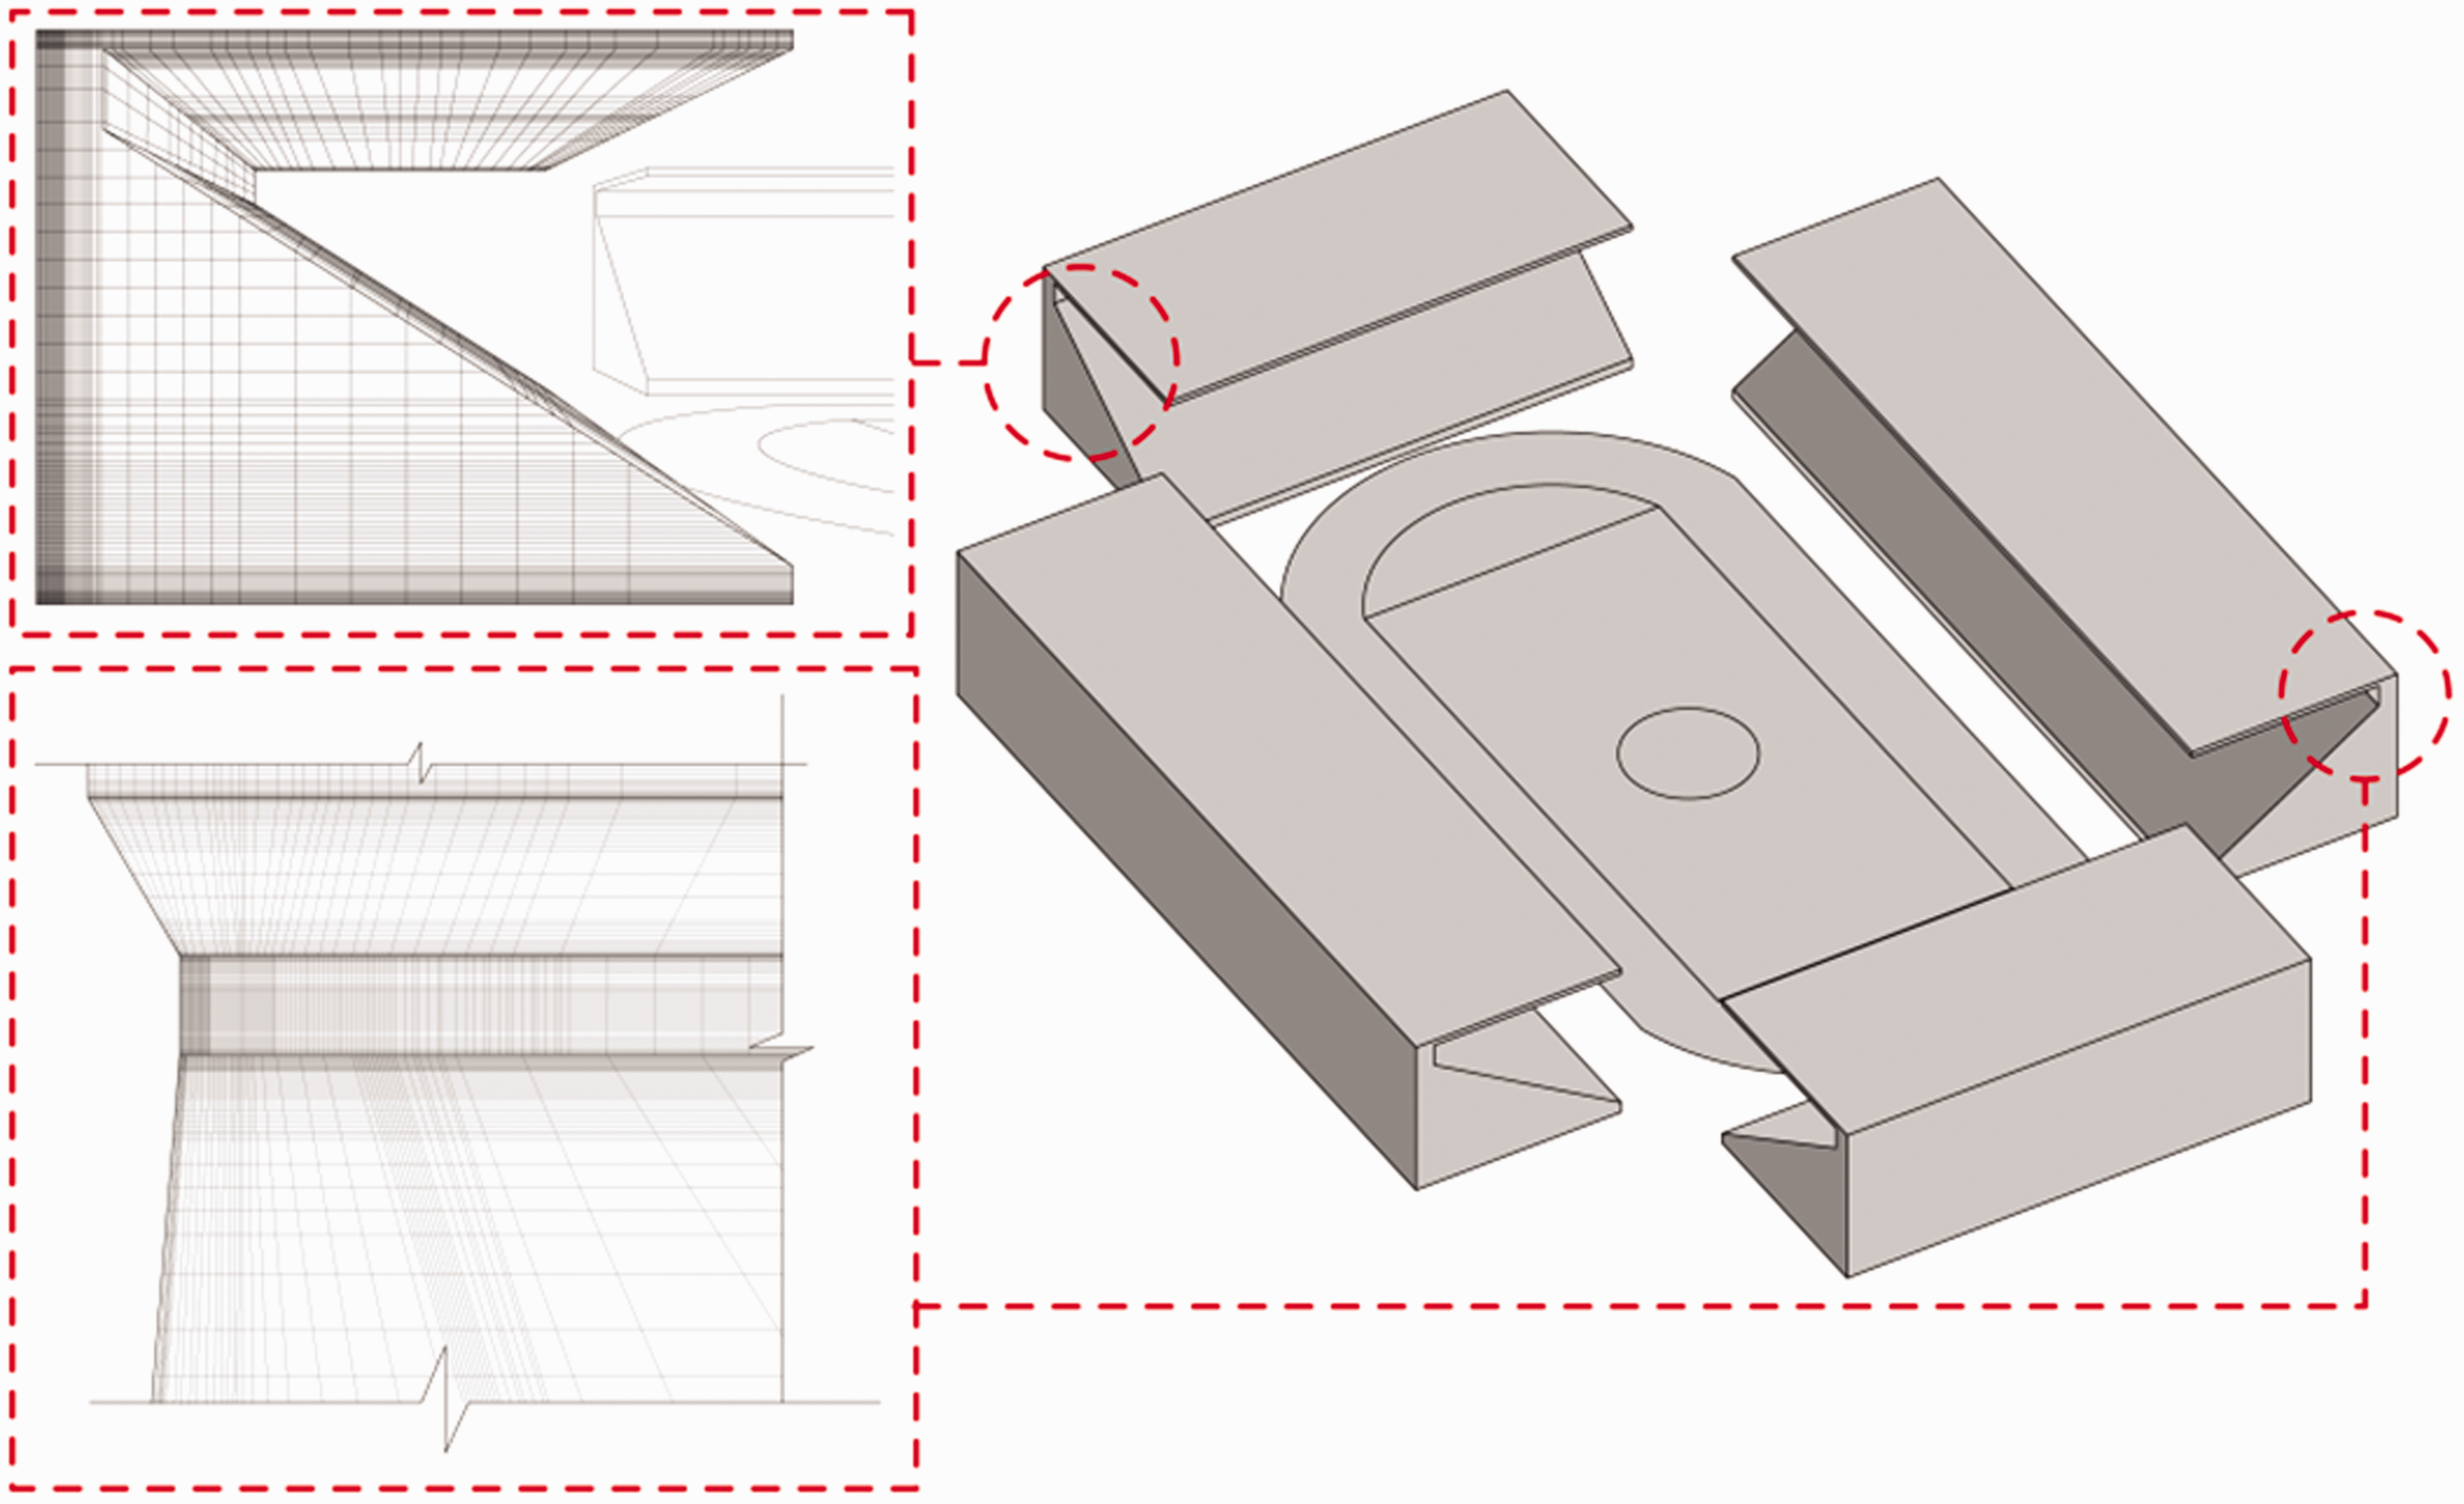
In this study, a grid-sensitivity analysis was performed to balance the discretization errors and the computational time. Figure 4 indicates the simulation results of three types of grids which are coarse, reference and fine. Different grids were divided into three types basing on a linear factor 2. The coarse type has 3.5 million grids and the fine has 14.0 million grids. In addition, the minimum mesh size corresponding to the above three types ranges from 0.040 m, 0.027 m and 0.01 m. Taking account of this research purpose to focus on ventilation characteristics, some monitor lines were set at openings and beside auditorium positions to compare results of different grids. The air velocity profiles along a vertical line at openings and a horizontal line beside auditorium were compared as shown in Figure 4 for these three types of grids. The results illustrate limited dependence on the grid resolution of calculation precision via wind velocity amplified (WVA) values. In this case, the average deviation between the coarse and the reference grid along these lines was 0.9% while it is 0.8% between the fine and the reference grids. Therefore, the reference grid was kept for further analysis.
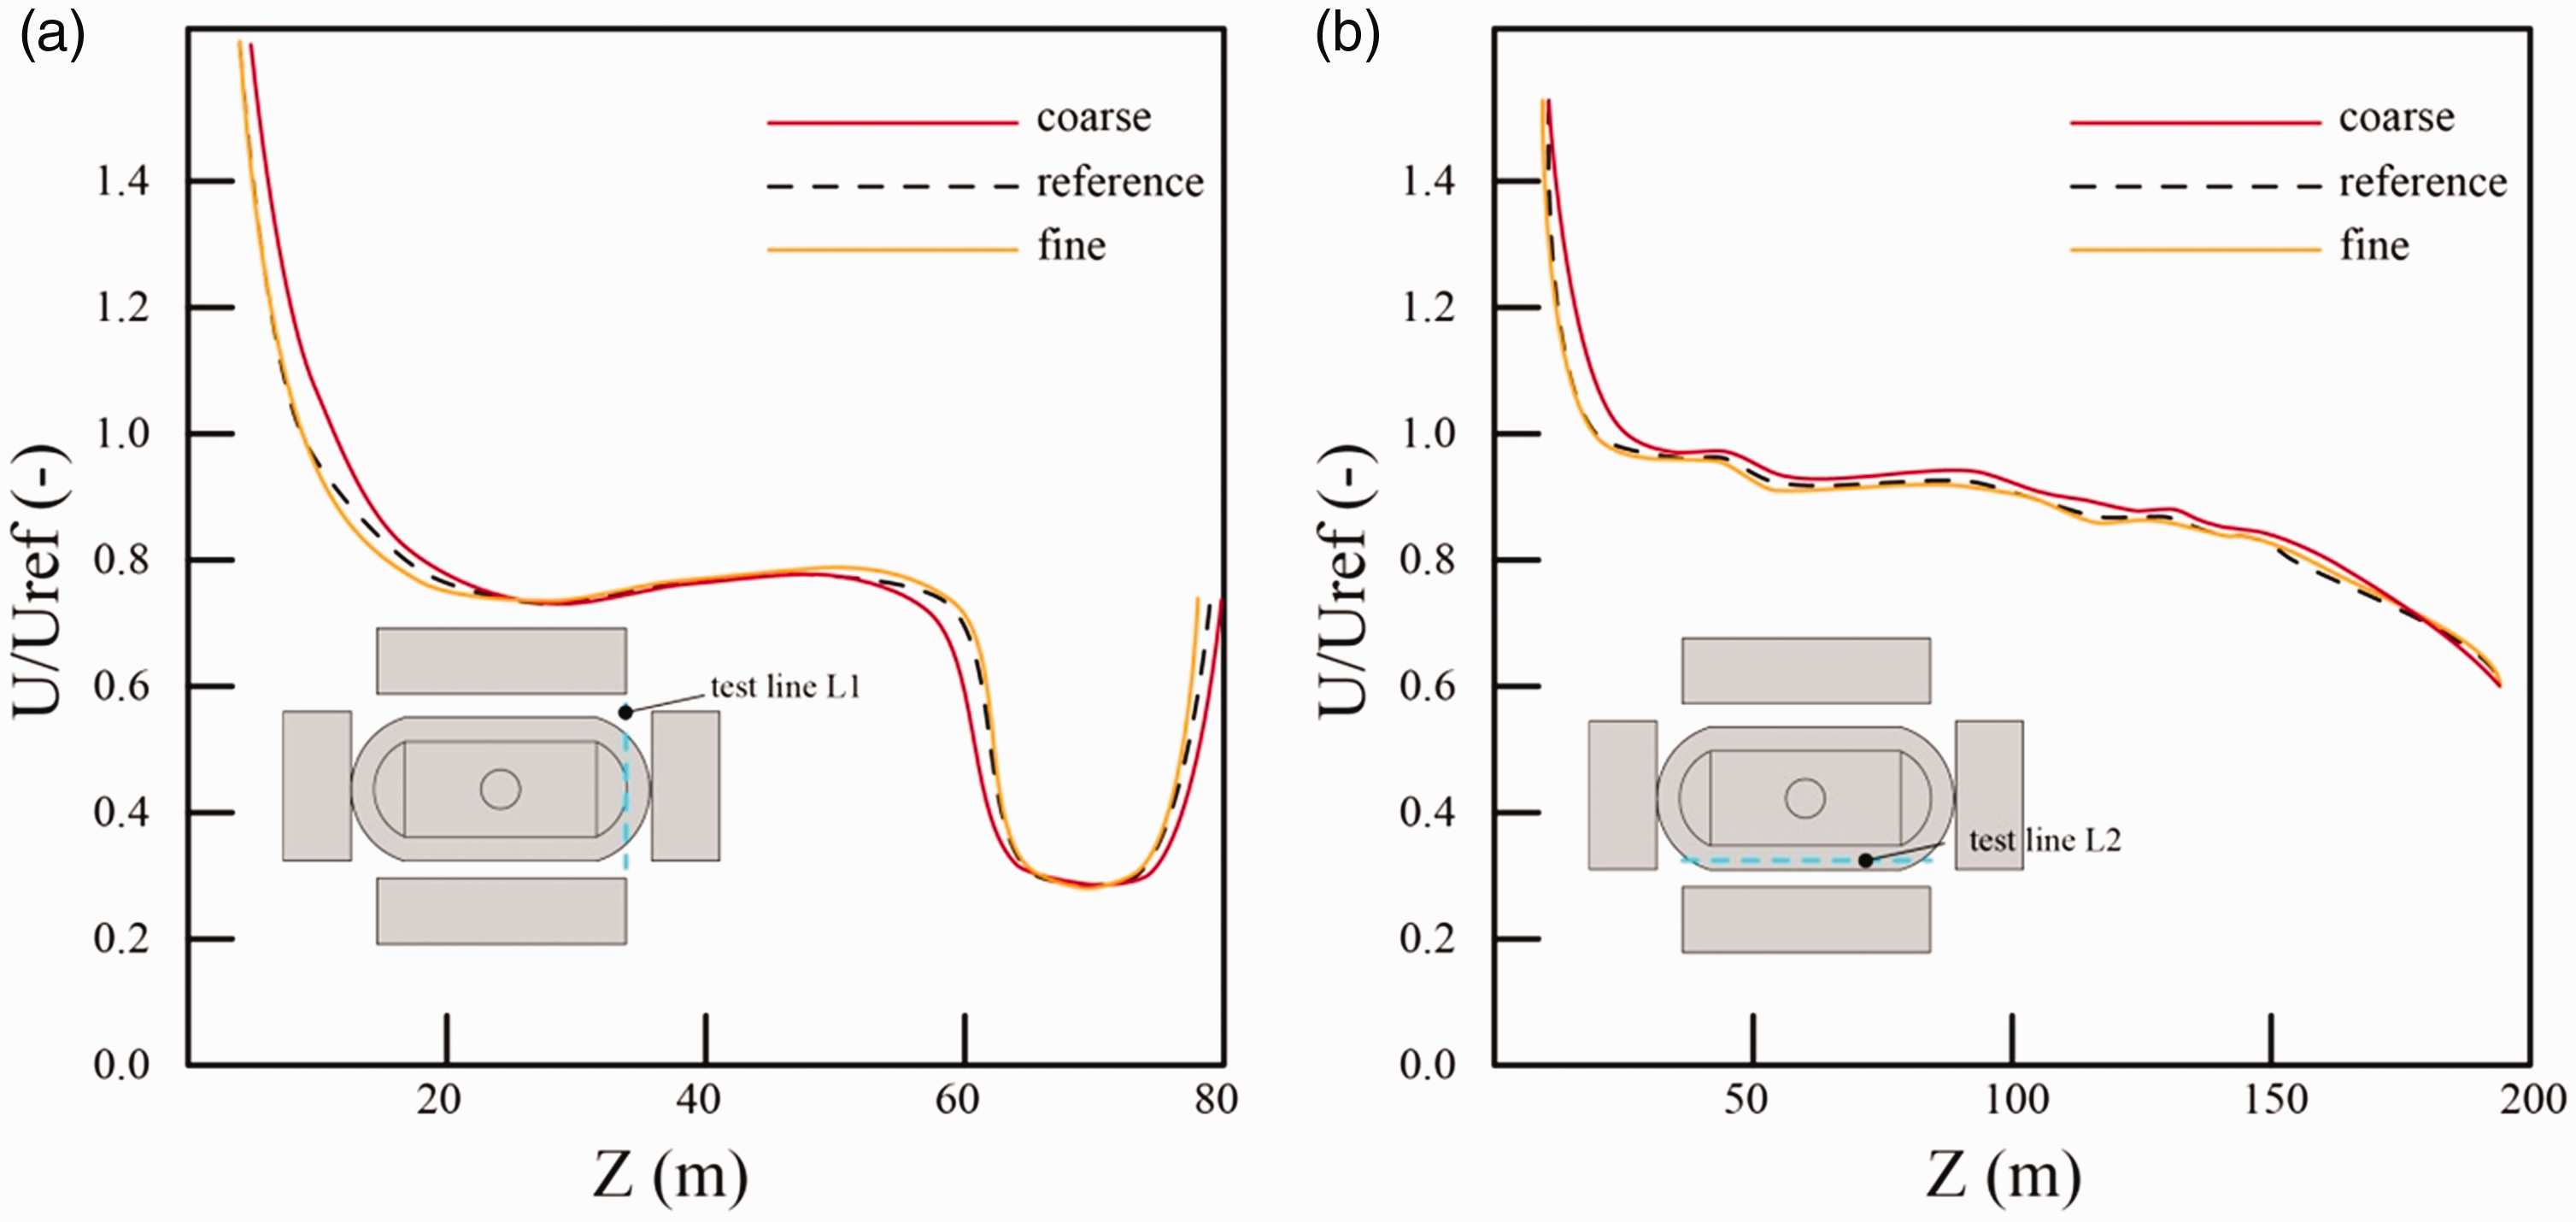
Results of grid-sensitivity analysis: profiles of air velocity along (a) test line L1 and (b) test line L2 for three types of grids.
The minimum and maximum cell volumes in the domain are approximately 2 × 10⁻⁸ m3 and 2.28 × 10⁵ m3, respectively. The length from the centre point of the wall-adjacent cell to the wall for the upstream, downstream, stadium roof and ground are all about 0.020 m. In the interior of the stadium, this distance ranges from 0.02 m to 0.03 m. This corresponds to y* values between 30 and 500. These values ensure the centre point of the wall-adjacent cell is placed in the logarithmic layer so as to fully utilize the standard wall function.
Assessment definition
Firstly, this paper assesses the wind environment using the mean wind velocity and a consideration of the wind velocity can effectively reflect the exceedance of wind increase and decrease. In order to quantitatively evaluate this effect, some concept was employed as follows. The amplified and diminished wind effects were determined as: WVA by equation (5). The area ratio of WVA was used to compare effects at pedestrian level, as this would quantitatively determine the variation of wind velocity in magnitude of variability. The area ratio of WVA and area proportion of wind velocity (APV) are defined by equations (5) and (6) as follows
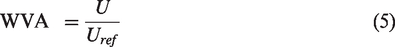

U represents the mean wind velocity at any place in the stadium; moreover, Uref is the reference mean wind velocity of the inlet wind at 10 m height, which is the data from the local weather station. Note that, APV refers to the area ratio of the value U/Uref. For example, if the value of U/Uref (WVA) is 0.2, the corresponded APV is the specific value of the occupied area for U/Uref by 0.2 to the entire stadium area.
CFD validation
Considering that there is no suitable previous research literature on wind-flow ventilation in a sport stadium, the field measurement results for the stadium wind environment was based on van Hooff and Blocken55–58 in this paper to validate grid independence.
Boundary condition
In van Hooff and Blocken’s work,55–58 the air velocity was measured during the period of September–November 2007 under a strong wind environment. The field measurement used ultrasonic anemometers, which were positioned on several mobile posts, at a height of 2 m above the ground at the Amsterdam Arena, A football stadium, see Figure 5. According to the measurement situation, a logarithmic mean wind speed profile was adopted for the neutral ABL and the aerodynamic roughness height was imposed with z0 = 0.5 m and a reference wind speed U10 of 5 m/s at a 10 m height. Based on the meteorological weather data, the wind direction was defined as 228° from the north. The physical sand-grain roughness height ks (m) and the roughness constant Cs were also decided by equation (4) and standard wall functions were utilized at the building surfaces but with zero roughness height ks = 0 (Cs = 0.5). Zero gauge static pressure was applied at the outlet plane. Symmetry conditions were applied at the top and lateral sides of the domain. A two-sided inlet opening was set to simulate the wind direction, which is not perpendicular to the stadium.
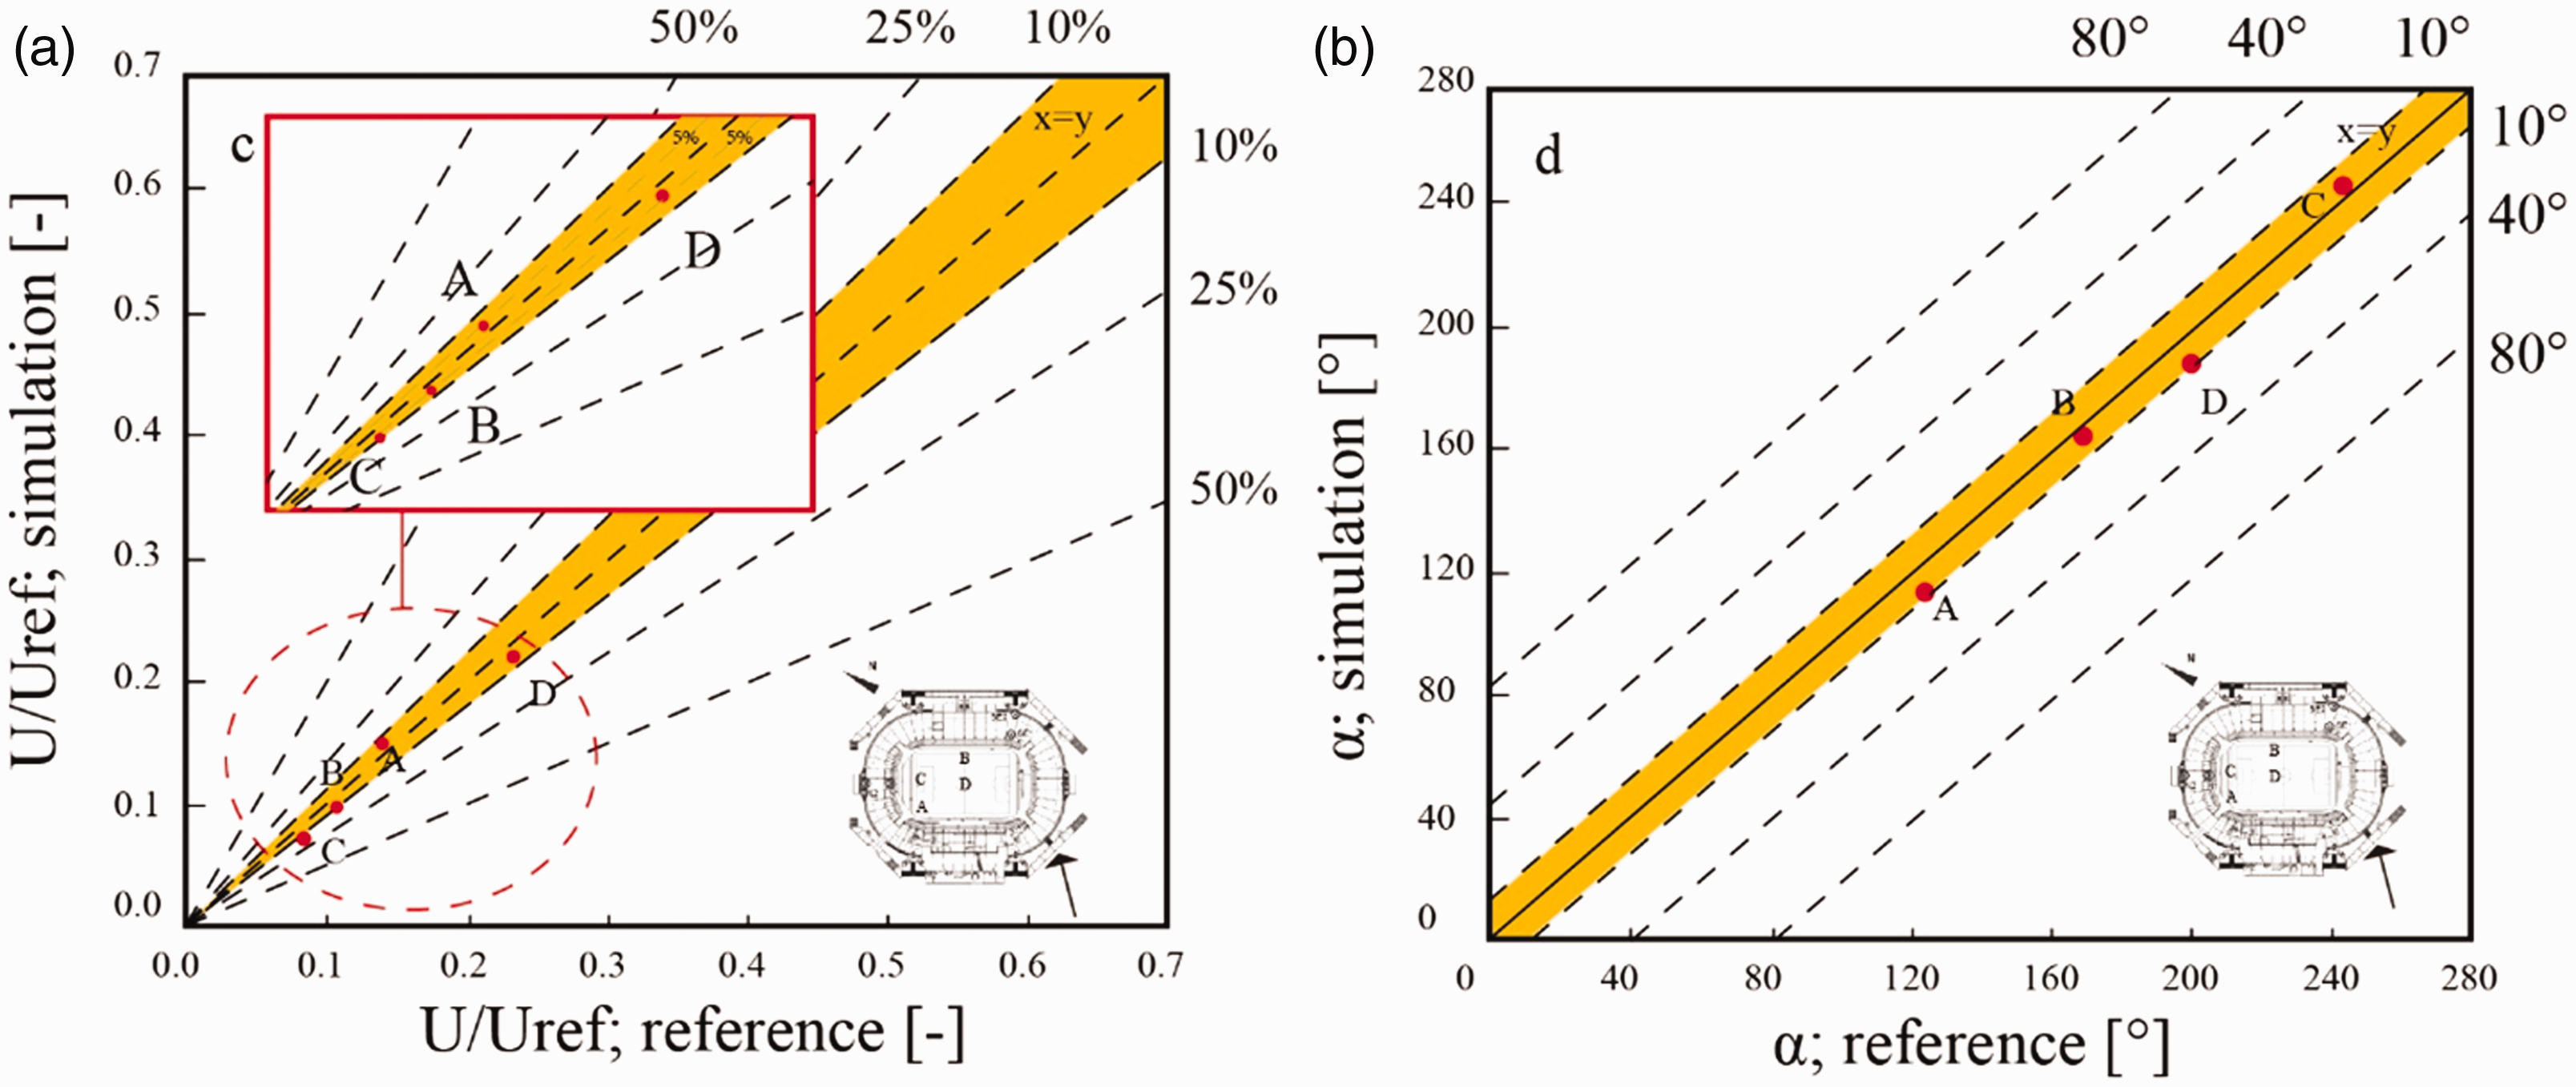
(a) Comparison of wind amplification at four measurement locations; (b) Comparison of wind direction at different measurement locations.
56
Solver settings
The realizable k-ε turbulence model was chosen as the turbulence computational model using the commercial CFD code Fluent 17. The SIMPLE algorithm was used for the pressure-velocity coupling and a second-order pattern was assumed for pressure interpolation. Second-order discretization schemes were used for convection and viscous terms. The whole computational process would be terminated if the scaled residuals were declined to a minimum value of 10−7 for x, y, z momentum, 10−6 for k, ε and continuity. All computations were performed on an 8-core workstation (Intel Xeon E5 2680 v3, 2.7 GHz) with 16 GB DDR of system memory.
Grid sensitivity analysis
A grid independent analysis was conducted among three resolution meshes of coarse, reference and fine level. A factor of 2 was used to produce the coarse grids with 3.8 million and fine grids with 13.6 million cells on the basis of reference grid with 7.0 million. All these three grid simulations require more than 5 CPU hours. Based on the simulated result performed by van Hooff and Blocken, 56 four gates were considered as measurement positions where the main inlet wind openings are situated in the stadium. The results indicated a limited dependence on the grid resolution for airflow velocity at these four measurement locations. In this case, the mean difference between the coarse and reference grids was 1.4%, while it was 0.9% between the fine and the reference grids. As the deviation between results obtained by the fine grid and the basic grid were minimal, the simulated results were independent of the computational grid. Hence, the reference grid was chosen for further analysis.
Validation of the simulation
Wind measurement were recorded using ultrasonic anemometers located at the gate. 56 Figure 5(a) shows the comparison of the simulated and measured mean wind amplified ratios 56 U/Uref under 228°. The measurement locations of A, B, C, D were positioned at the entrance openings and at the centre of the stadium. 56 The deviation of mean wind amplified ratios for these four points were all within 5%. Figure 5(b) presents a comparison of the simulated with the measured wind direction. 56 The results illustrate a good consistency of the simulated model compared with the measured data except for location C. This was mainly due to location C was situated at the corner of the entrance opening where the airflow may be influenced by the air stripping effect. Overall, these validation results are acceptable, and the reference grid could be used for the following simulation.
Results and discussion
Stadium ventilation condition analysis of case A
All round type auditorium wind simulation was performed to study the wind environment characteristics under a variety of inlet wind angles. Since the performance of the athletes could be greatly affected by the wind speed, the wind environment at the running track was evaluated. Figure 6 illustrates the flow field in the stadium under different wind directions, and these are described as follows:
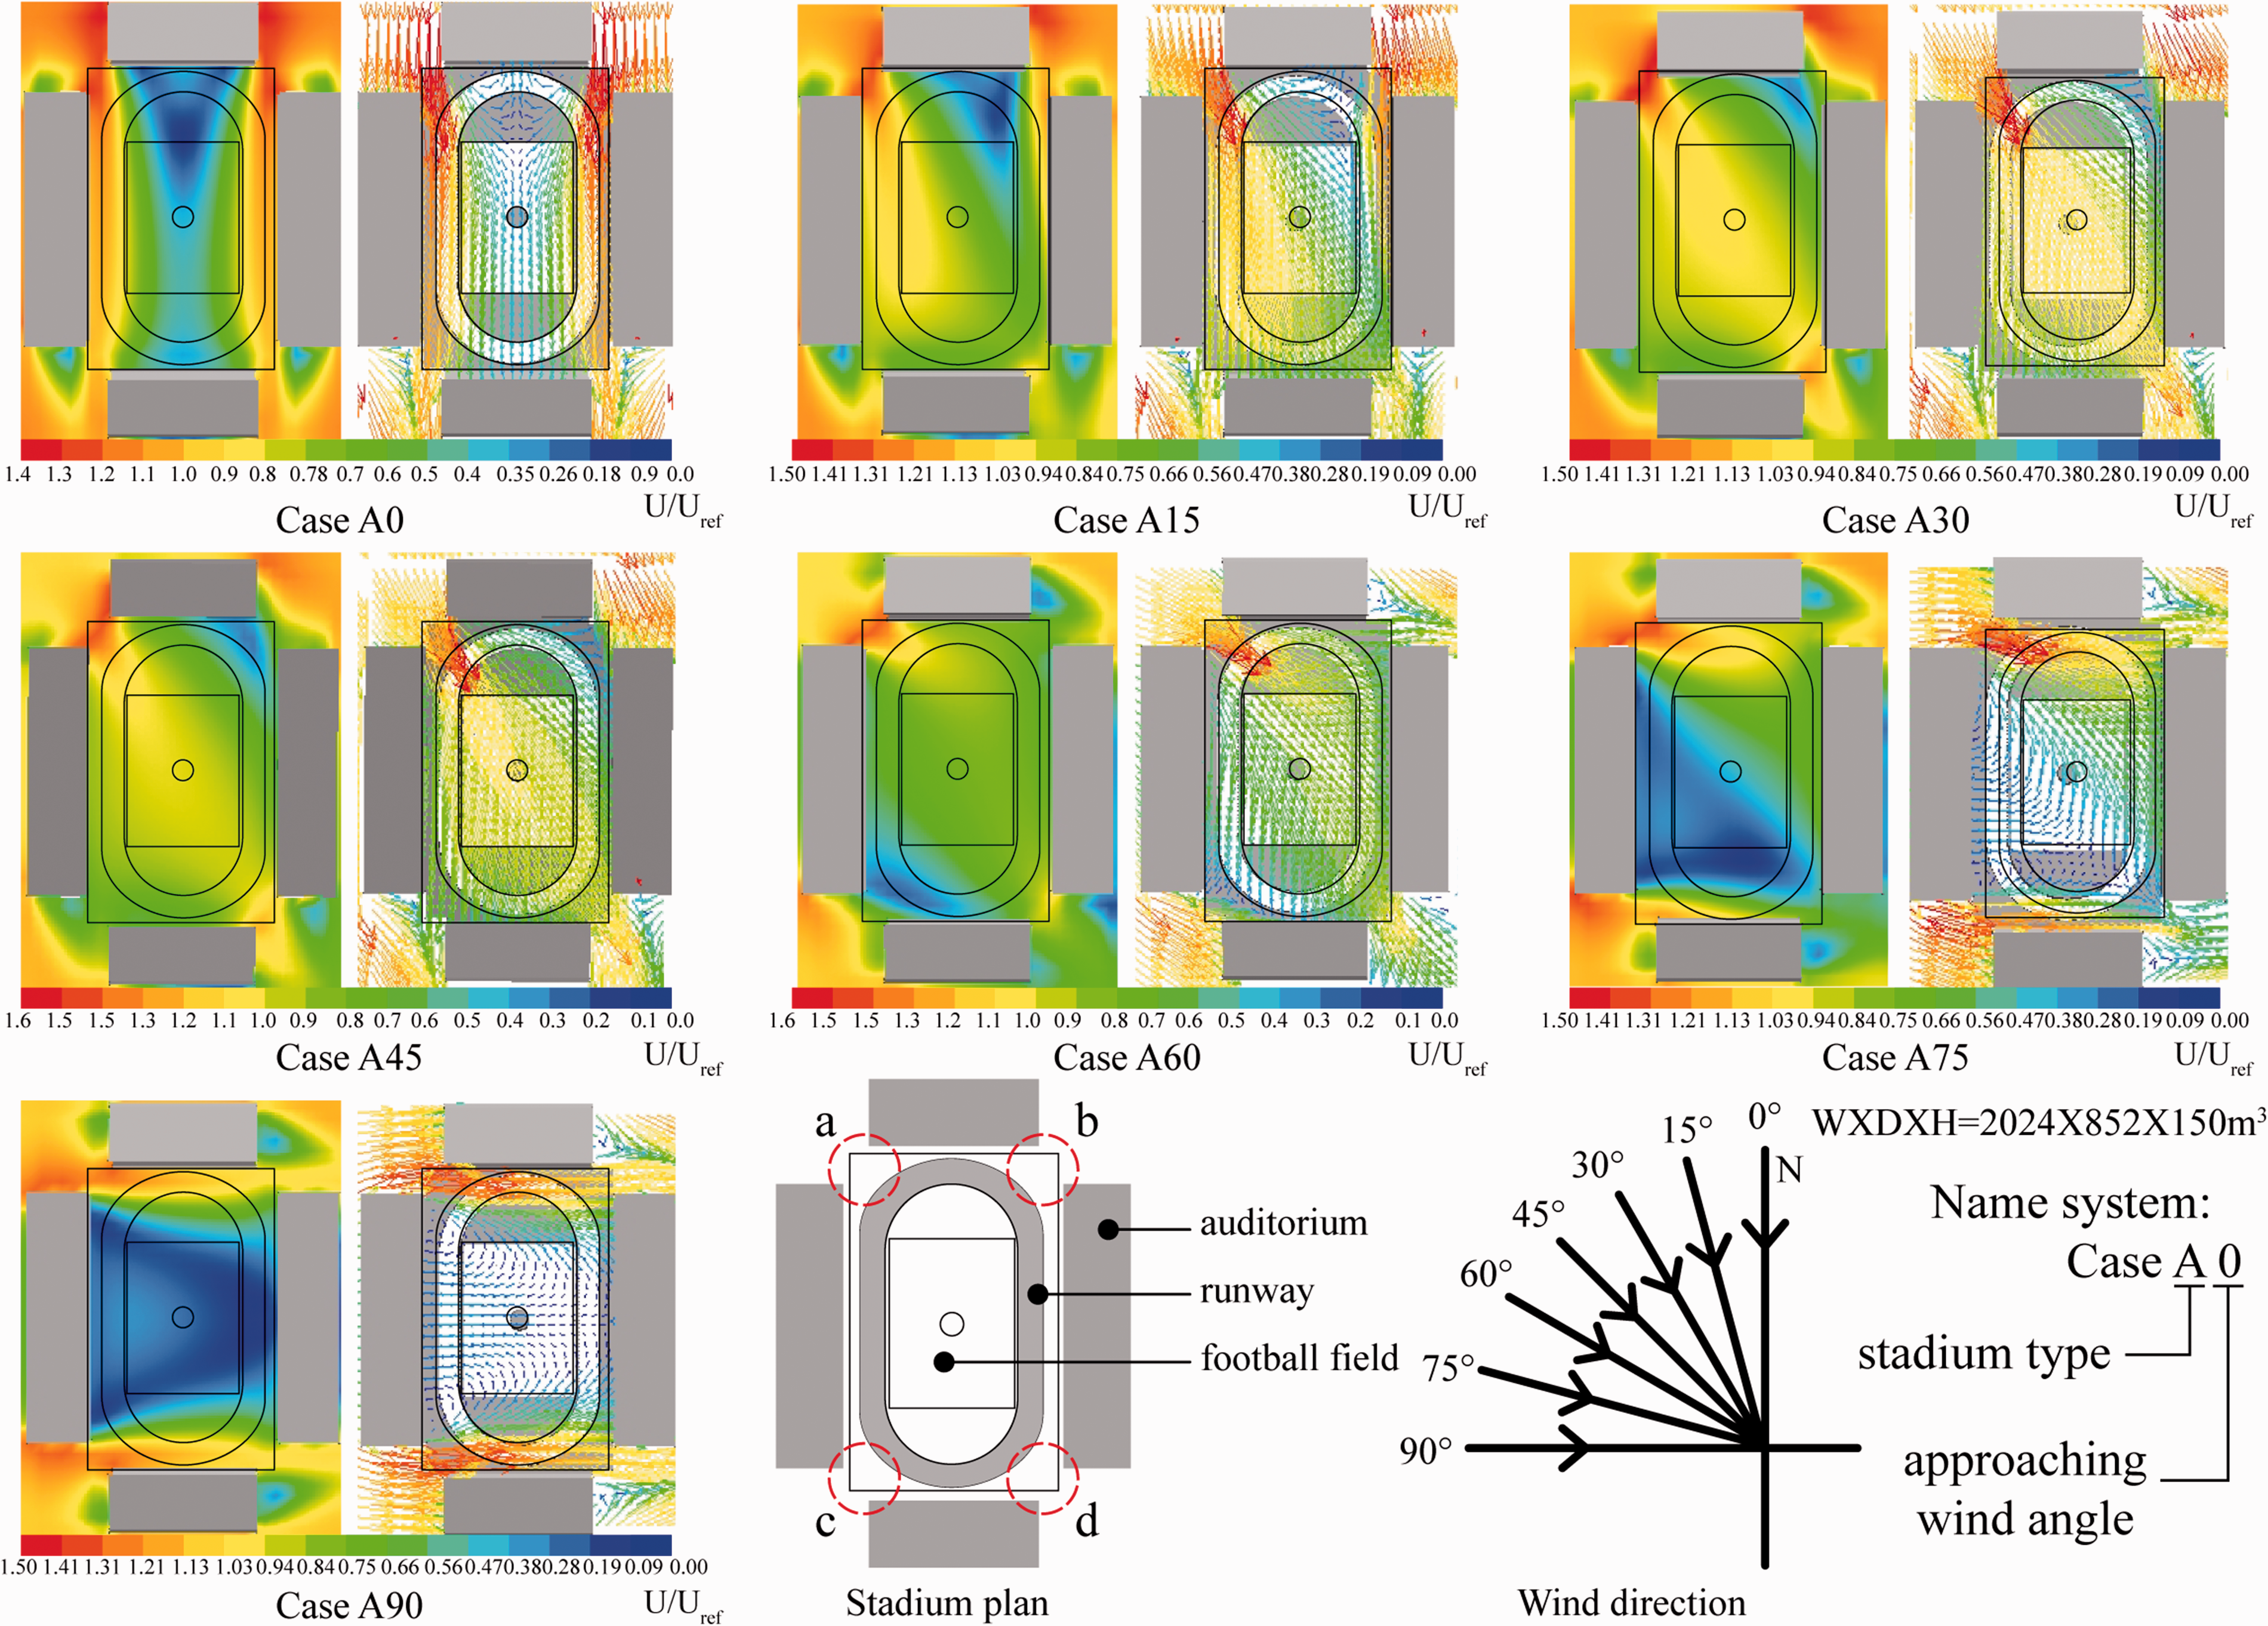
Wind simulation performances of case A under different wind directions.
Case A0: The figure shows the air would mainly flow through the stadium via four entrances A, B, C, D in this case. A high wind speed would exist at the air inlet locations A and B. Furthermore, the wind shadow area would mainly locate behind the auditorium on the northern side.
Case A15: The high wind amplified effect would appear at the entrance A, influenced by the inlet wind direction. The wind velocity at the western side on the running track would be amplified apparently under the effect of higher wind velocity amplification area. The wind shadow area would diminish apparently compared to the case A0.
Case A30: The highest WVA value would be situated at the entrance A and the area with a better wind environment would be mainly located at the diagonal of A–D. Under this wind direction, a wind galley would be shaped along the line A–D. A higher general wind amplification effect is shown in this case as compared to the above two cases.
Case A45: The overall wind environment is similar to case A30, as the wind amplification effect distribution resembles the above three cases. However, in this case, the wind speed amplification intensity would be reduced while the area of the wind shadow area on both sides of the diagonal line would be increased compared with case A30. The eastern and western running tracks are both under areas with smaller wind velocity amplification and would be less affected by the wind.
Case A60: When the inlet wind direction is 60°, wind amplification effect in the interior area of the stadium would be decreased apparently compared to case A45, which can be attributed to the wind blockage by the auditorium. The overall distribution of the wind speed is relatively uniform; and the main air inlet is at the entrance A.
Case A75: Under this wind direction, the air would be blocked by the western auditorium when it flows through the stadium, which forms a large wind shadow area below the diagonal. Apart from this, entrances A and C present a high WVA value condition and the wind direction mainly flows from A to B and from C to D.
Case A90: Most of the stadium areas would be under the wind shadow area which is caused by the blocking of the western auditorium. The main WVA area is situated at the A, B and C, D streamlines due to the cross-ventilation between entrances A, B and entrances C, D. Except for two streamlined areas on both sides of the northern and southern parts of the stadium, the rest of the stadium has a small wind velocity environment.
From the above analysis, the wind environment in the stadium could vary greatly under different approaching wind directions. Over 0° to 30°, the running track are located in areas with high WVA values; moreover, from 45° to 90°, the WVA values for running track gradually decrease to 0.00.
In order to further quantitatively study the stadium ventilation condition, the area ratio of the U/Uref inside the stadium was determined as shown in Figure 7.
Case A0: The area ratio proportions of different WVA values are similar with each other, which is around 15% except for WVA at 1.4. This indicates that wind environment of the stadium under this case is unstable and could adversely affect sporting events. Case A15: In this case, the wind environment of the stadium has a more stable condition than case A0 as almost 70% of the area has a WVA value ranging from 0.8 to 1. However, these WVA areas cover the running track area and therefore would not be suitable for the sprinting event. Case A30: Compared to the above cases, ventilation condition of case A30 is the steadiest, as over 55% of most areas would have a WVA value of 1.0. Furthermore, area ratio of the remaining WVA occupies less than 20% of the area. Hence, most of the stadium's area in this case can be effectively ventilated by the wind, including the running track. This would be conducive to the transmission of air pollutants and CO2. However, the high wind flow environment is not beneficial to sports competitions. Case A45: The distribution of WVA condition for case A30 and case A45 is similar. As over 50% areas have a WVA of 1.0, the ventilation situation is stable. Nevertheless, in this case, the proportion of areas with a WVA bigger than 1.0 are more than that in case A30. Therefore, clearly case A45 has a higher wind intensity environment than case A30, although the wind distributions in both cases are similar. Case A60: In case A60, the general ventilation condition remains stable when over 80% of the stadium’s area has a U/Uref value within the range of 0.8–1.0. The fluctuating wind environment would only be found at entrance A and most of the stadium are stable at low WVA values by smaller than 1.0. At the same time, the running track also in the main has low WVA values and the condition should be beneficial to competitions. Case A75: The wind flow stability of this case is worse than case A60 because the main area ratio is between 0.4 and 0.6 and less than 50% of the whole areas has a high U/Uref value of 0.8–1.5. The running track would be located under the wind shadow area due to the blockage effect of the auditorium at the long side of the stadium. In addition, areas with large WVA factors are located at the northern and southern entrances and the overall wind velocity condition is lower than in case A60. Case A90: When the approaching wind is perpendicular to the long auditorium, the stadium has the lowest WVA value that ranges from 0.2 to 0.8 among all cases. The auditorium has the strongest wind blockage effect and the main wind shadow area is in the middle of the stadium including the two running tracks. The four entrance locations show the greatest WVA effect simultaneously. So, in this case, the ventilation condition has a positive impact on the sporting competition and a negative influence on the pollution dissipation.
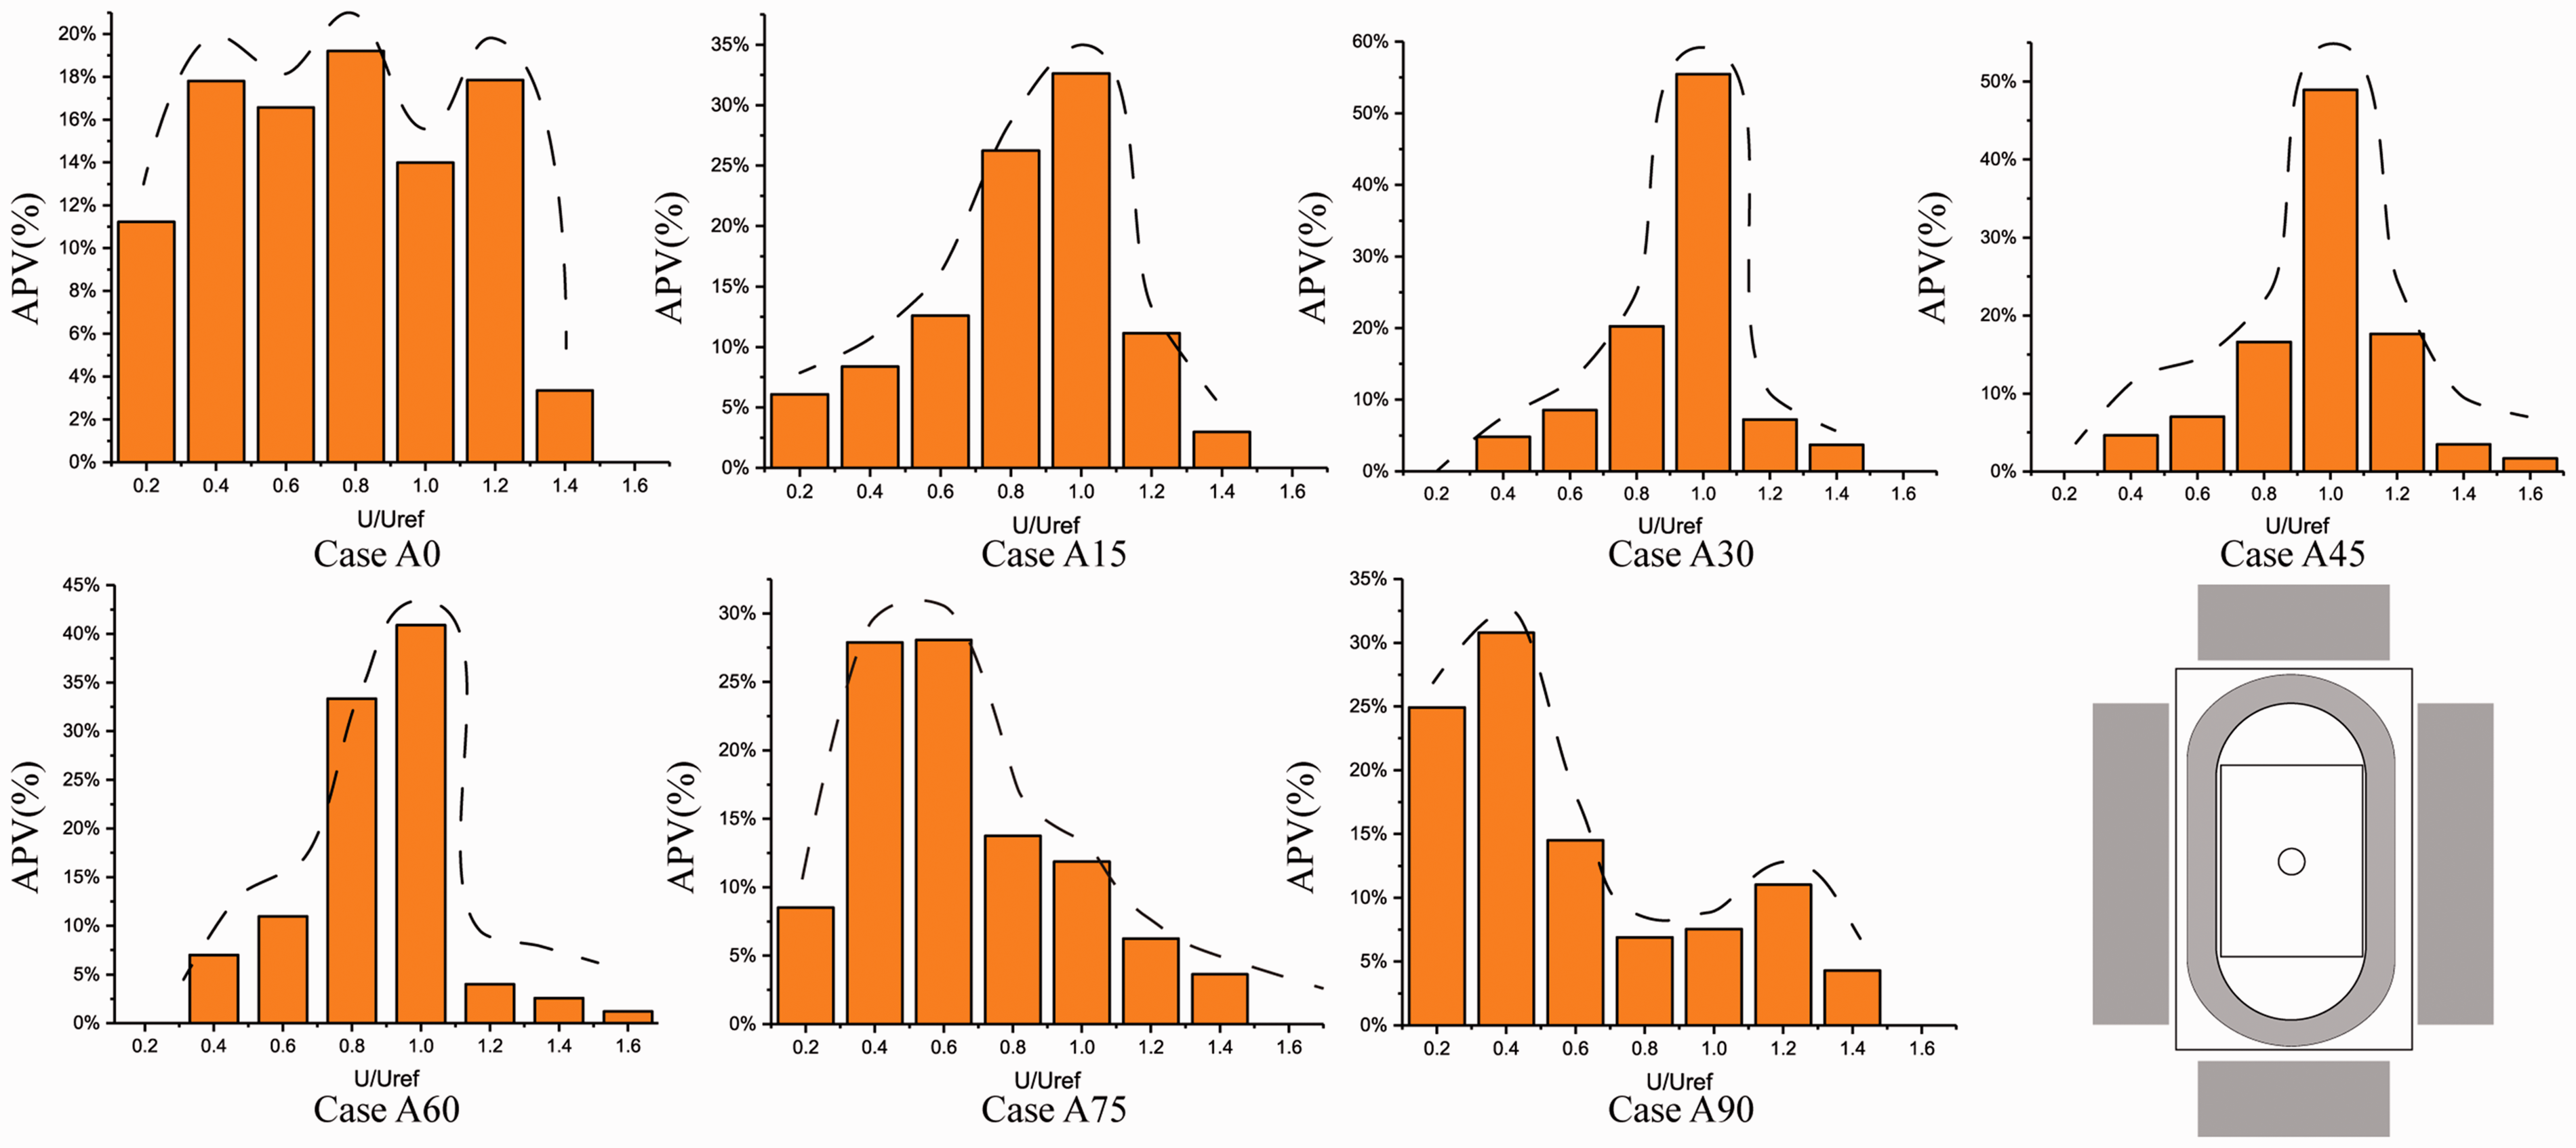
Proportion of area of case A under different approaching wind directions.
Figure 8 shows the accumulated APV condition and WVA situation under different inlet wind angles. The accumulated APV is calculated by the sum of APV value. For example, if WVA is 0.6, then accumulated APV is computed by the sum APV value under WVA from 0 to 0.6. Figure 8(c) is a type graph of box plot which presents all statistical accumulated APV values under different inlet wind angles such as maximum, minimum, high quartile, low quartile and averaged value. In this case, the averaged value of accumulated APV shows the performance of ventilation in stadium. Smaller averages indicate better ventilation condition with high velocity to promote pollutants dispersion. As shown in Figure 8(a), most areas under 15° and 30° are mainly within 0.6–1.0 WVA value ranges. Moreover, the general area with a 0° wind flow direction would distribute evenly throughout the whole WVA interval. Figure 8(b) shows the majority of the areas in the stadium under wind angles of 75° and 90° and has low WVA values ranging from 0.2 to 0.6. In addition, the general wind condition of 45° shows similar trend with 60° in APV condition. With a wind direction angle of 15° and 30°, most areas would have WVA values within 0.6 to 1.0. Figure 8(c) also illustrates that the general wind velocity is the highest under 30° and 45° wind angles. On the contrary, under 75° and 90°, the overall wind environment velocity is the lowest among all wind directions. According to the above analysis, the best inlet wind angle for sporting competitions to be held in the stadium ranges from 75° to 90°, which would avoid the high wind velocity influences. The wind environment conditions under wind angles of 0°, 30° and 45°, are worse than 75° and 90°. However, 45° to 60° are the least recommended wind angles which could produce high wind velocity environment that could have an impact on running competitions.
The APV condition under different wind directions. (a) APV condition of gymnasiuim under approaching wind direction 0°–30°, (b) APV condition of gymnasiuim under approaching wind direction 45°–90° and (c) APV condition of gymnasiuim under approaching wind direction.
Analysis of the stadium ventilation condition in case B
The wind patterns for different inlet wind directions of case B are presented in Figure 9 as contours of the wind speed ratio. Case B has the same auditorium area but has different numbers of auditorium as compared with case A. From this figure, even with a small change in the inlet wind direction, the overall wind pattern could vary considerably. Considering the symmetry of the stadium, the wind environment of the stadium under an inlet wind direction ranging from 0° to 90° was simulated to determine the ventilation condition under the whole approaching wind direction.
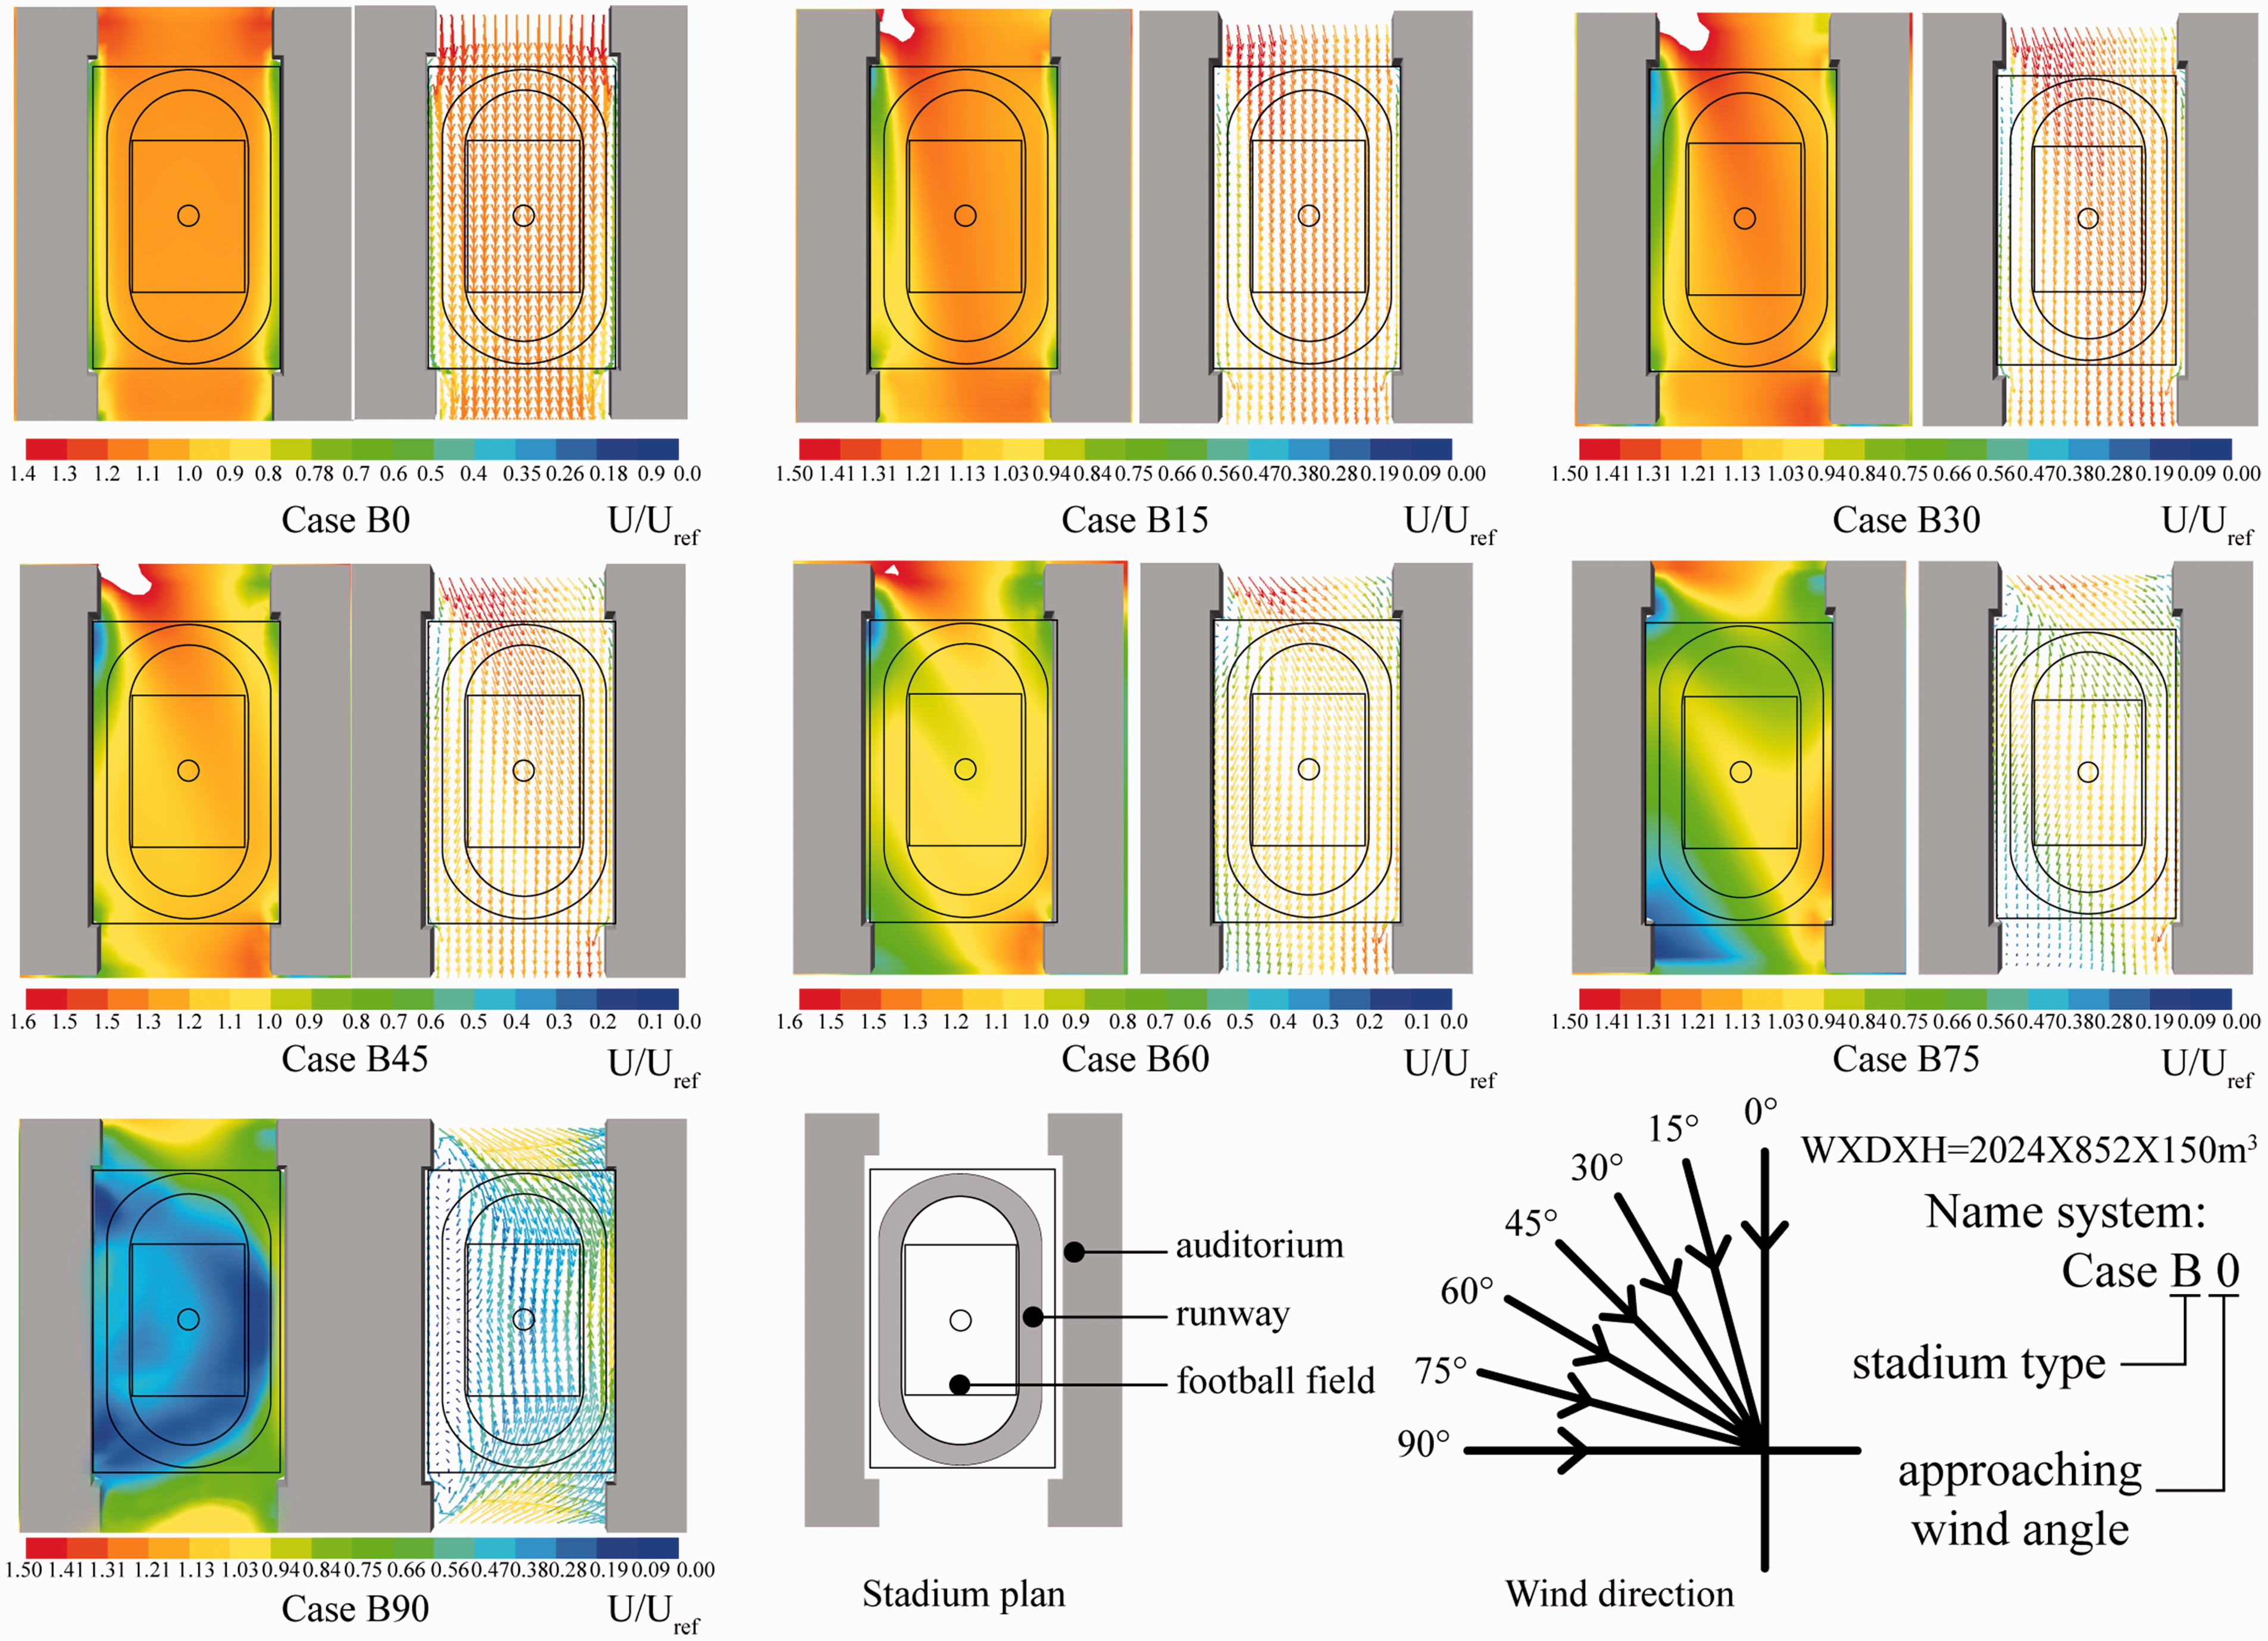
Wind simulation condition of different stadia with two-sided auditorium stadium.
Case B0: As shown in Figure 9, the overall wind environment is relatively stable, and all regional WVA values are greater than 1.0. Wind shadow areas would only occur at the auditorium corner locations where there is little impact on the running track.
Case B15: The main area with WVA, as represented by the red colour, has a wind environment that deviates differently under several wind direction angles as compared with case B0. As the inlet wind direction increased, the wind shadow area would gradually increase and the WVA value of the running track would decrease simultaneously.
Case B30: Similar to case B15, the general wind environment for case B30 is with WVA values greater than 1.0. In addition, the wind shadow area would become bigger than in above cases and small parts of the running track would become the wind shadow area, which would have a positive influence on sports competition.
Case B45: The area ratio with a high WVA value would indicate diminishing trend and the overall wind speed would gradually decline due to the inlet wind direction. All regions of the stadium except the wind entrance would have the WVA values under 1.0.
Case B60: The wind condition in the stadium presents different characteristics in comparison to above cases. Under this air direction, most airflow would be blocked by the eastern auditorium and would generate a wind shadow area. This would cause almost the whole stadium ground area to have a WVA of 1.0, as well as would cause the largest shadow area compared to these above cases.
Case B75: The wind flow field inside the stadium shows fluctuation status which is caused by the blocking effect of the auditorium. Half of the ground area has a WVA of 0.75 and the other area has WVA of 1.0. Apart from this, there are also several areas within the ground having a WVA ranging from 0.0 to 0.75. Due to the blocking effect of the western auditorium, the running track on the western side has a WVA of 1.0 that would not be conducive to sports competition.
Case B90: Most of the area positioned under the wind shadow area has a WVA smaller than 0.5. Overall wind flow field presents symmetry distribution feature. In this case, most areas are in the wind shadow, which is the largest among case B. Not only that, the other area also has a lower wind speed environment in comparison to other cases. This is due to the wind blockage effect as the inlet wind is perpendicular to the auditorium.
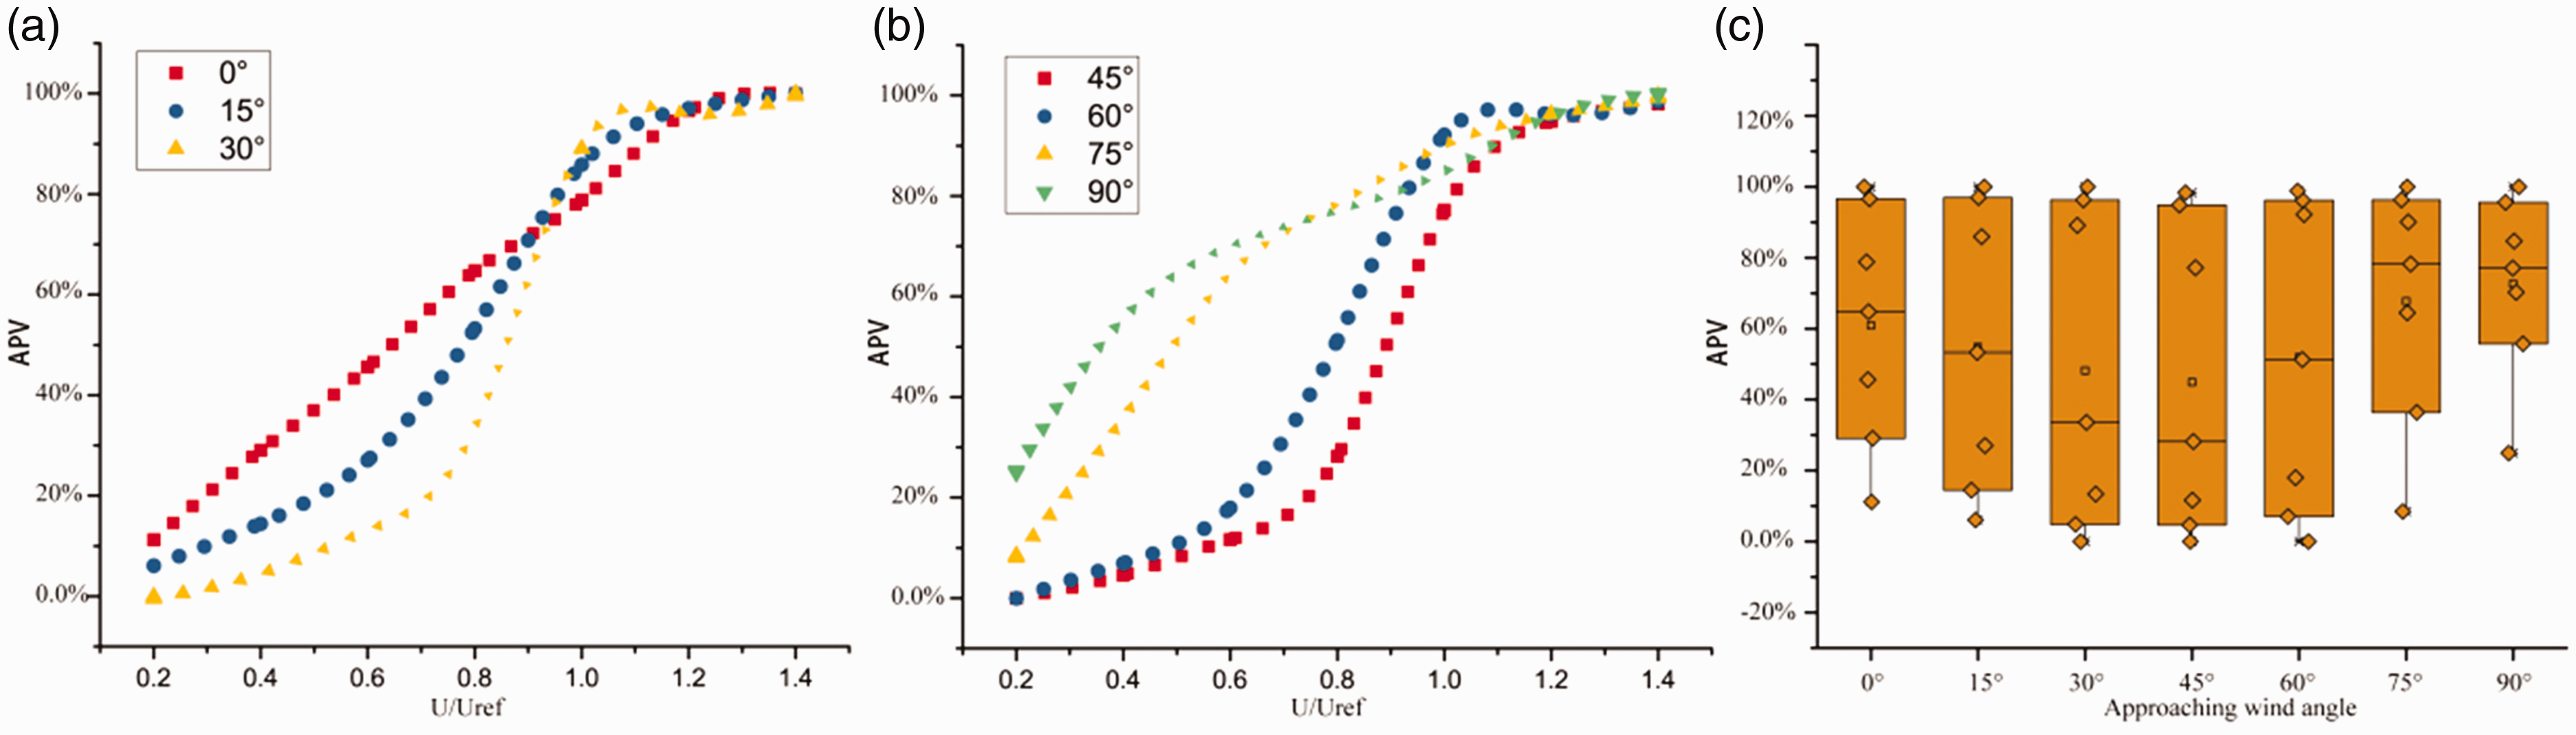
The specific wind amplification effect condition is shown in Figure 10. Figure 10(a) presents the ventilation characteristics of case B0, indicating that 60% of areas have a WVA of 1.31, which is the highest among all cases. There is almost no low-level wind amplified area with WVA less than 1.0 in case B0, which means that the wind direction of 0° is the best inlet wind direction for the pollution dissipation in a two-sided type stadium.
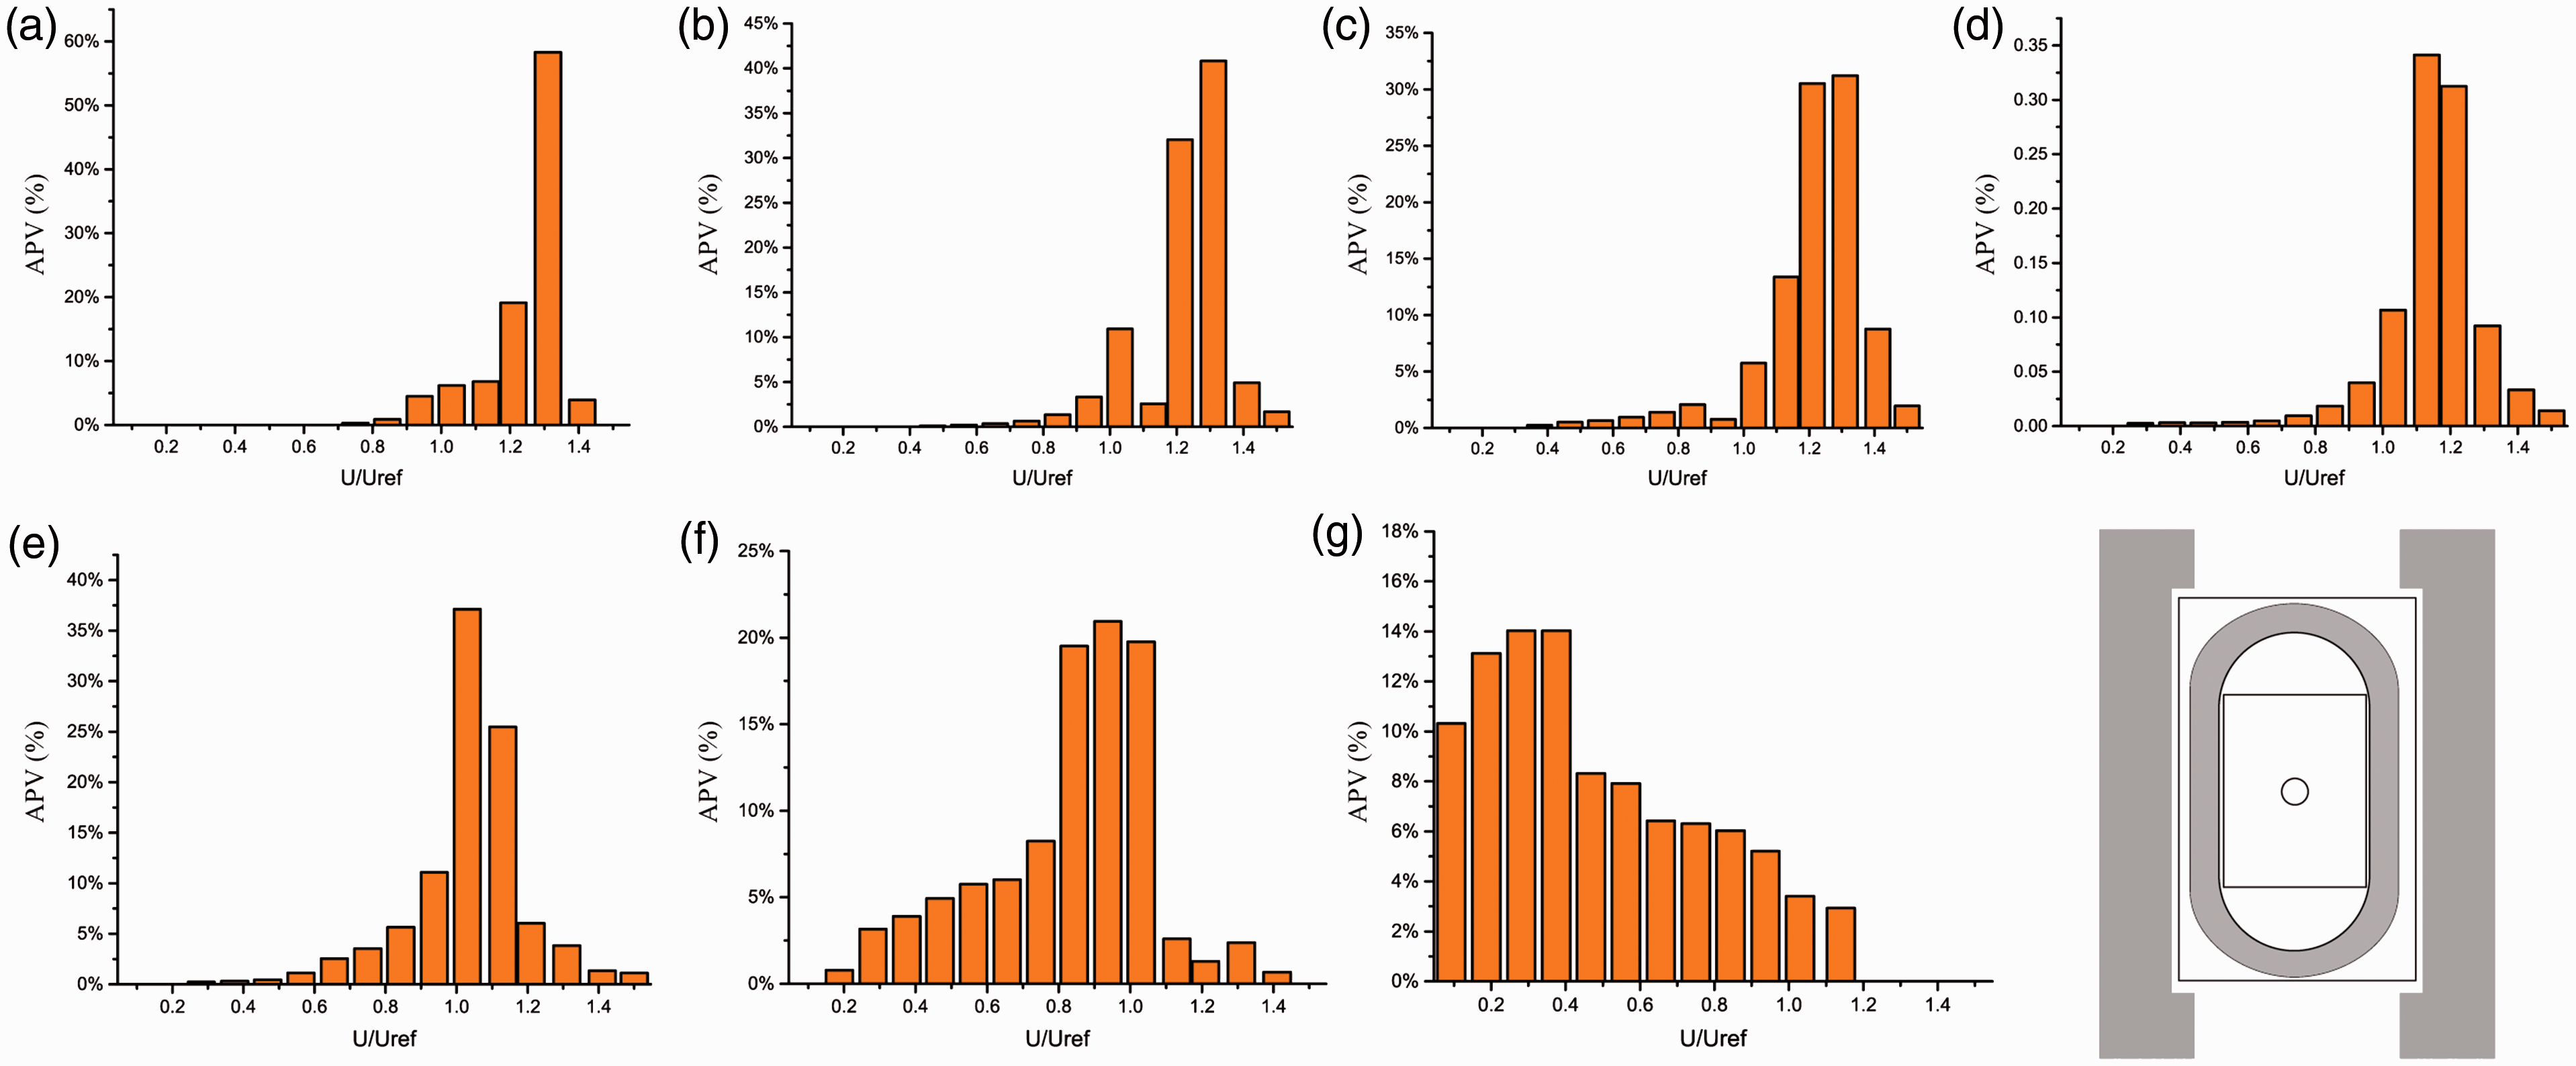
Proportion of area of case B under different approaching wind directions. (a) Case B0, (b) Case B15, (c) Case B30, (d) Case B45, (e) Case B60, (f) Case B75 and (g) Case B90.
From Figure 10(b) of case B15, as the inlet wind direction angle increased to 15°, the area ratio of WVA at 1.31 would be reduced to 40% and the proportion of the area with a WVA of 1.21 would be about 32%. The overall ventilation velocity would be reduced to a certain extent but the proportion of the area with a WVA less than 1.0 would remain almost unchanged. As for approaching wind directions at 30° and 45°, Figure 10(c) and (d) clearly shows that the general WVA distribution is similar in comparison with case B15. In both cases B30 and B45, the high wind amplified effect area would be in the main stadium region, which has a corresponding WVA value of greater than 1.0.
When the wind blows at 60°, the stadium has considerably different ventilation characteristics in comparison with other cases. The proportion of areas with a WVA of 1.0 is 37%, which is the highest under case B60 and the area with a low WVA ratio increased. Therefore, in case B60, the overall ventilation is not as good as the above cases, which are not conducive to the dispersion of pollutants. In addition, as the inlet wind angle increased, the overall stadium wind environment would become gradually deteriorated and the area with a reduced wind velocity would be larger than the area with a WVA of 1.0. For case B75, Figure 10(f) illustrates that over 70% of the area are in the WVA which is mainly between 0.8 and 1.0.
In case B90, the distribution of WVA condition indicates considerably more different features in comparison with other cases. Only 14% would reach a maximum WVA value of 0.4, which is the smallest WVA value with the largest area ratio among all cases. In addition, case B90 also displays WVA for almost all areas are under 1.0. In case B90, the wind velocity in the stadium is the lowest of all cases.
According to the quantitative assessment of case B, a comparison of different cases was drawn in Figure 11. As the approaching wind direction increases, the air velocity environment of the stadium would decline gradually due to the auditorium blockage effect. As the wind velocity environment could affect the sports competition, a low ventilation velocity is recommended for the stadium wind condition. However, small wind ventilation velocity would have a negative influence on the dissipation of pollutants especially in a stadium which has a large audience. For the wind flow field, as the angle of the inlet wind increases, the wind shadow area located behind the blockage auditorium would become larger. Therefore, the 100 m sprinting running track should be placed at the position near the auditorium, where the approaching wind is mainly blocked no matter which direction the wind would come from. For the inlet wind direction, 60° to 90° are the best inlet wind angles, most favourable for sports competition. Among these wind angles, 60° is the optimum approaching wind direction that would meet the sports game requirements and would also dissipate the pollutants in the stadium efficiently.
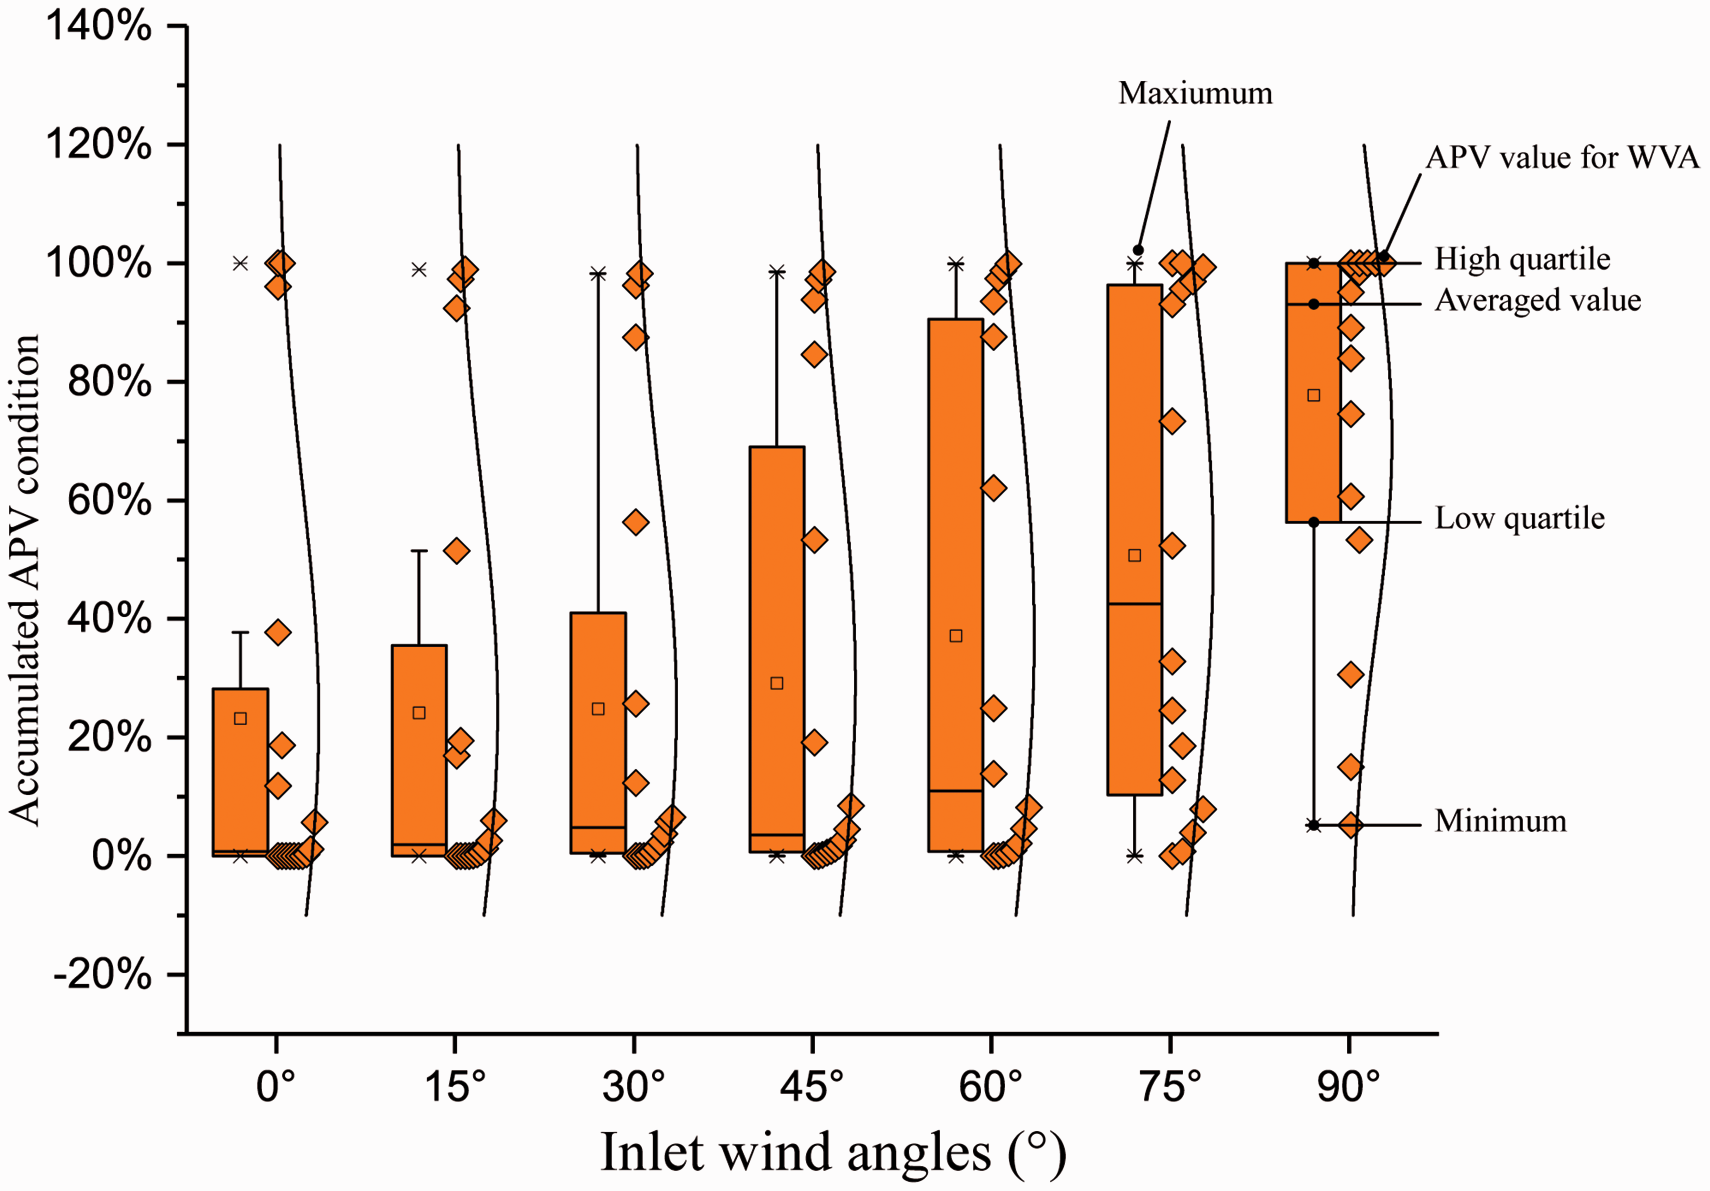
APV conditions under different wind directions in case B.
Analysis of the stadium ventilation condition of the stadium in case C
As shown in Figure 12, the wind condition of case C was investigated by CFD simulation under different wind directions. In case C0, most areas in the stadium would have a WVA value of around 1.0. The area with the smallest WVA appears in the innermost side of the stadium due to the blockage effect by the short side of the stadium. The wind flow field condition of case C15 would be different in comparison with case C0. The area with a WVA exceeding 1.0 appears at the corner of the stadium near the wind flow entrance and the smallest WVA would be in the area near the short side of the stadium. The simulation of case C30 and case C45 suggest similar ventilation situation as in case C15, which has the largest WVA value at the inlet wind corner and lowest area around the short side of the stadium. When the inlet wind direction is at 60°, the overall wind flow field distribution resembles those in the above cases. However, the area near the eastern side stand would be under the low WVA condition. This is mainly because the blockage of the eastern auditorium which could be conducive to the sprinting race due to the lower wind speed. As the inlet wind angles increase, the area with a low WVA is further amplified in case C75 compared to case C60 and areas with a high WVA would be reduced simultaneously. In addition, a silent area with no wind speed occurs at the south-eastern corner of the stadium. In case 90C, the wind blockage effect illustrates the strongest performance; most of the stadium areas would have a WVA value below 0.3. According to the above analysis, as the approaching wind direction varies, the general stadium wind flow field would be fluctuated. However, no significant changes can be observed on the southern area near the stadium, which always remains poorly ventilated. As a result, for the three-sided auditorium stadium, all the stadium area is relatively sensitive to the variation in the inlet wind direction except the short-edge area, which could be kept away from the approaching wind.
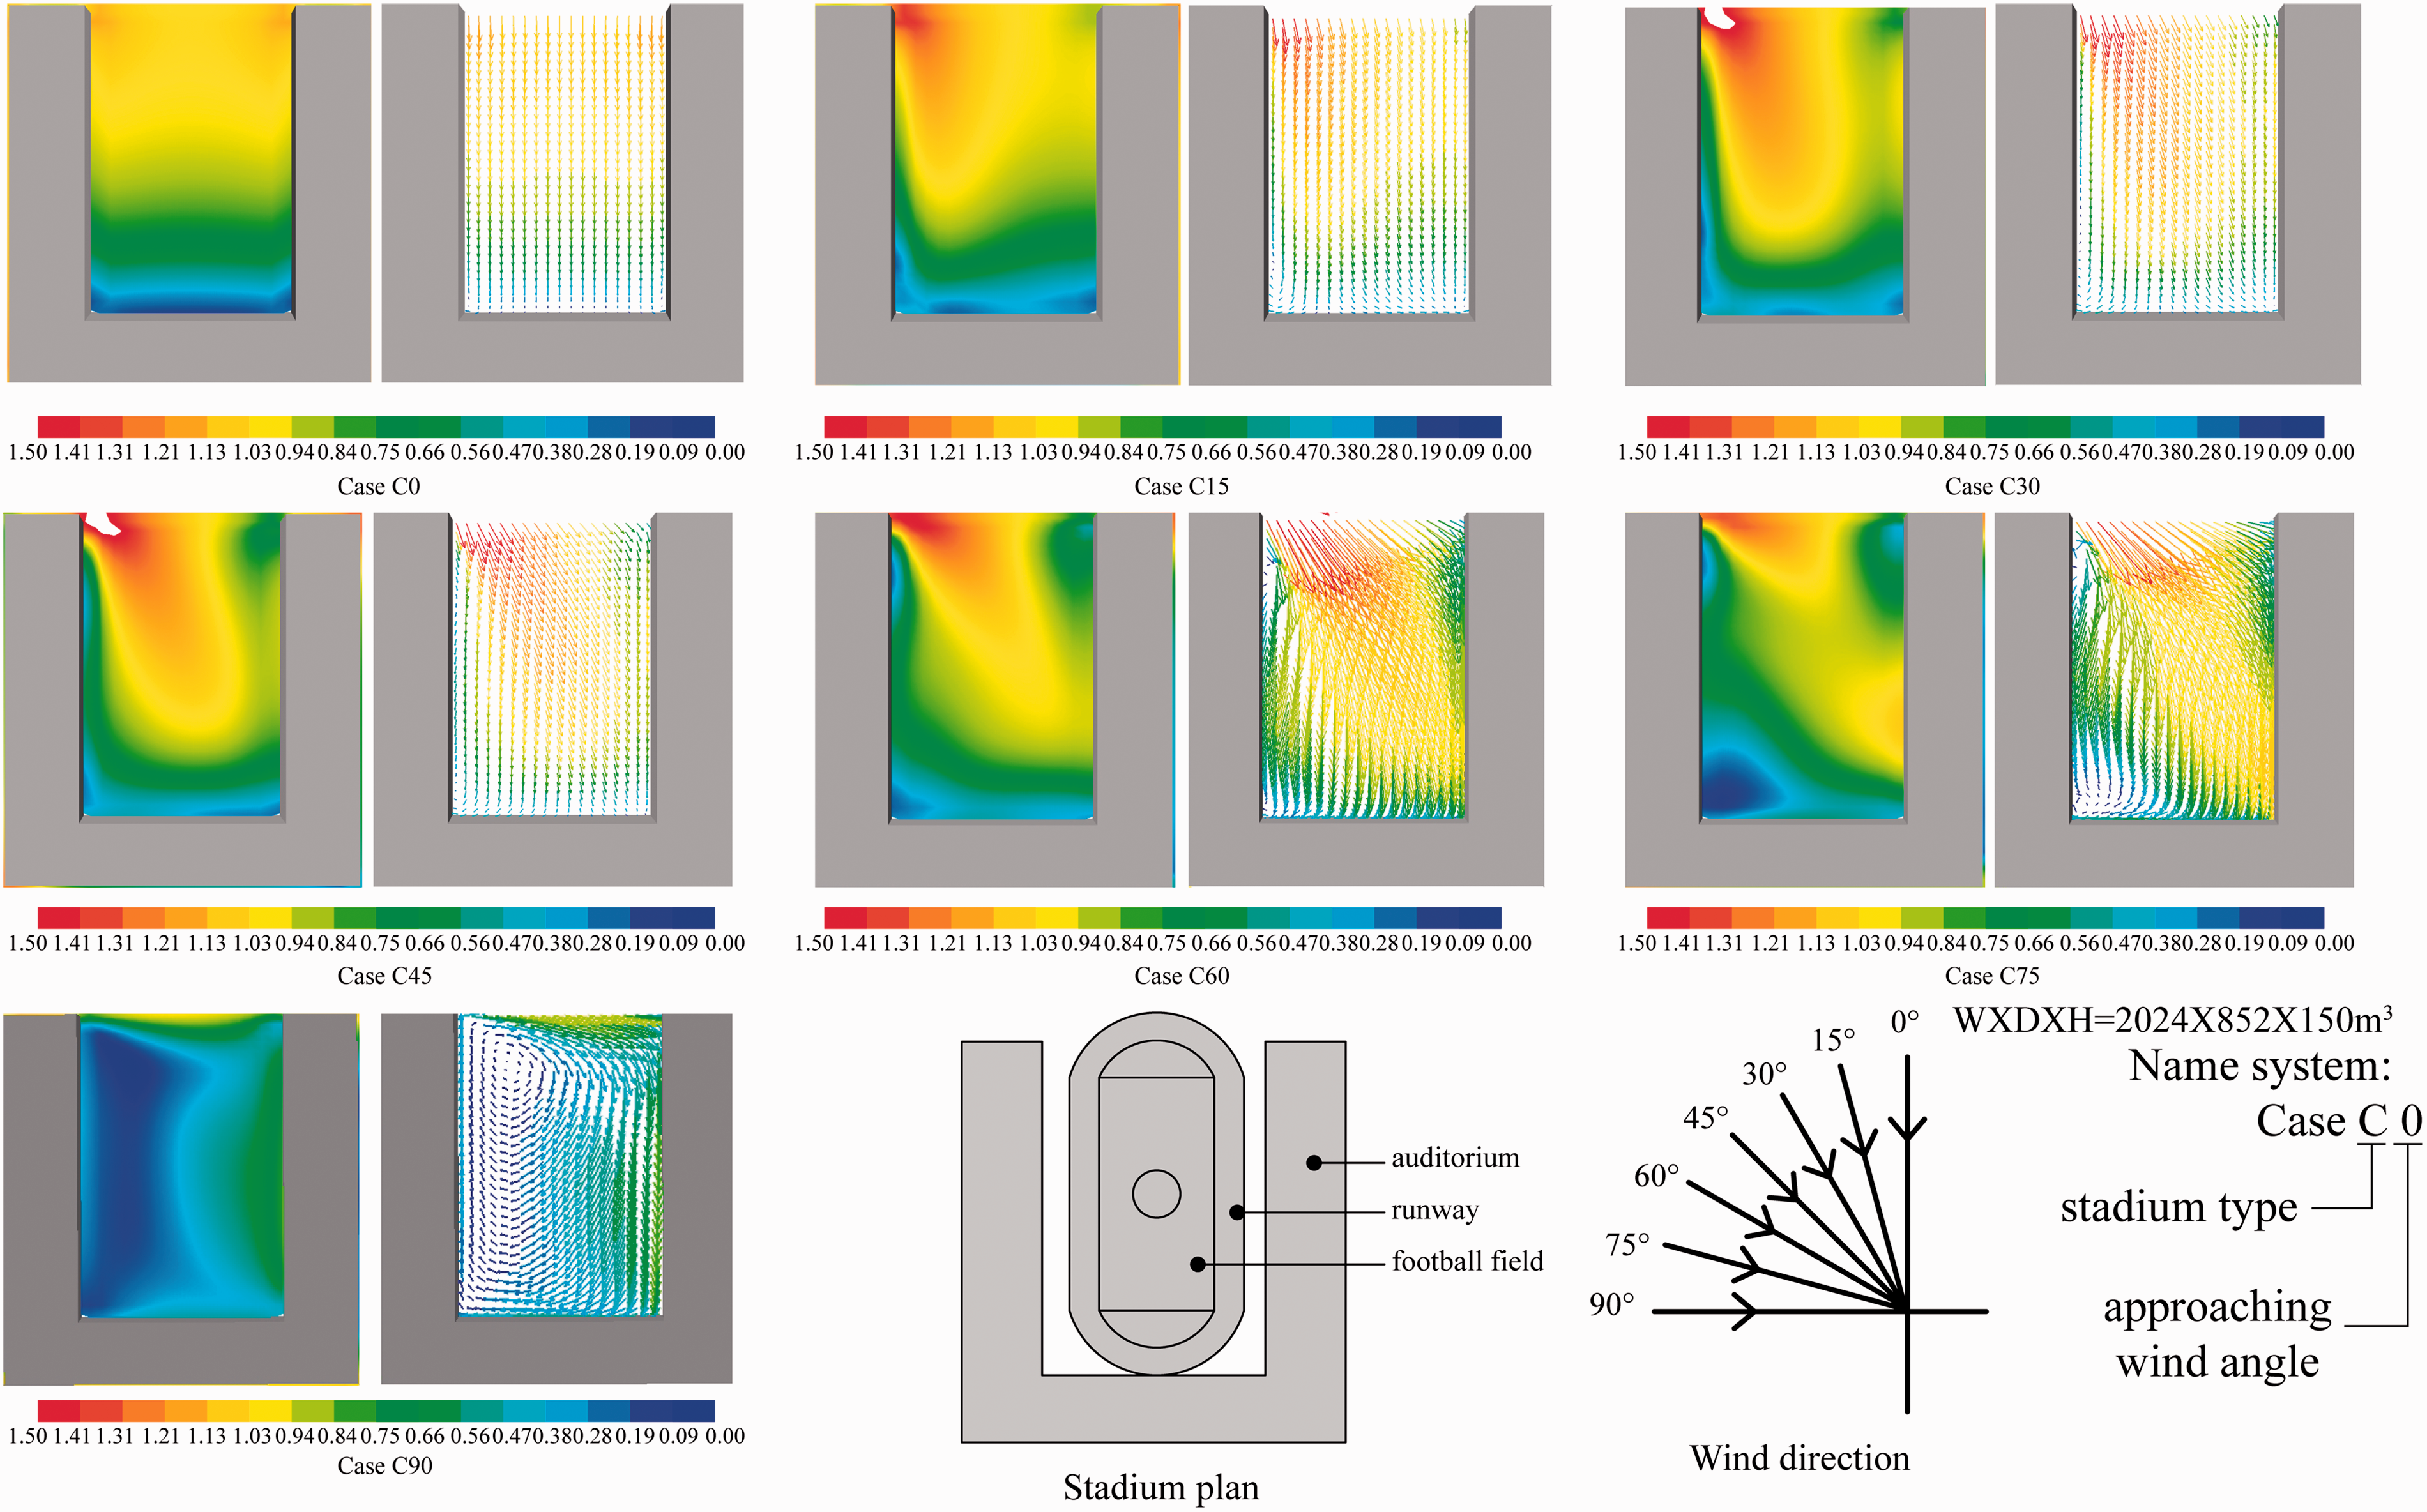
Wind simulation performances of case C under different wind directions.
Figure 13 shows the statistics of APV for different WVA values under different inlet wind angles. In case C0, a maximum of around 30% area ratio has a WVA of 1.0 and almost no area has WVA values larger than 1.3. Most area wind velocity distributed stably and concentrated in the range of 0.8 to 1.2 WVA. In case C15, as the wind angle increases, the wind flow field fluctuates. When the WVA value is between 0.4 and 0.8, all corresponding area ratios are in the range of 9–12%. This indicates that most ventilated area would distribute non-uniformly and fluctuates violently in case C15. This can be attributed partially to the blocked airflow by the eastern short side of the stadium near the approaching wind orientation. When wind flows at 30° direction, larger area (more than 80%) with a WVA ranging from 1.0 to 1.5, would produce the best ventilation condition among all cases. Therefore, compared to cases C0 and C15, as the wind angle increases, the wind velocity in more areas would be amplified in case C30. With the incoming wind angle continues to increase, cases C45, C60 and C75 would have similar ventilation situation as in case C30. However, the wind amplified area with WVA >1.0 would show a little decline as the wind angle increases. This is mainly due to the blockage effect of the western side auditorium, which would become more significant as the wind angle increases. Apart from the above, as shown in Figure 12, the wind direction in the area with a primary WVA value, deviates from the south to the south west which corresponds to the inlet ventilation orientation in cases C30 to C75. In these cases, the running track would not be influenced by the magnified wind speed due to the variation in the main ventilation direction. In case C90, the area ratio in Figure 13(g) suggests special air characteristics compared to other cases. The wind is totally obstructed by the western auditorium. This produces bad ventilation environment and most area has a WVA of 0.2. The condition would be suitable for the sprinting competition but is not positive for the pollutant dispersion.
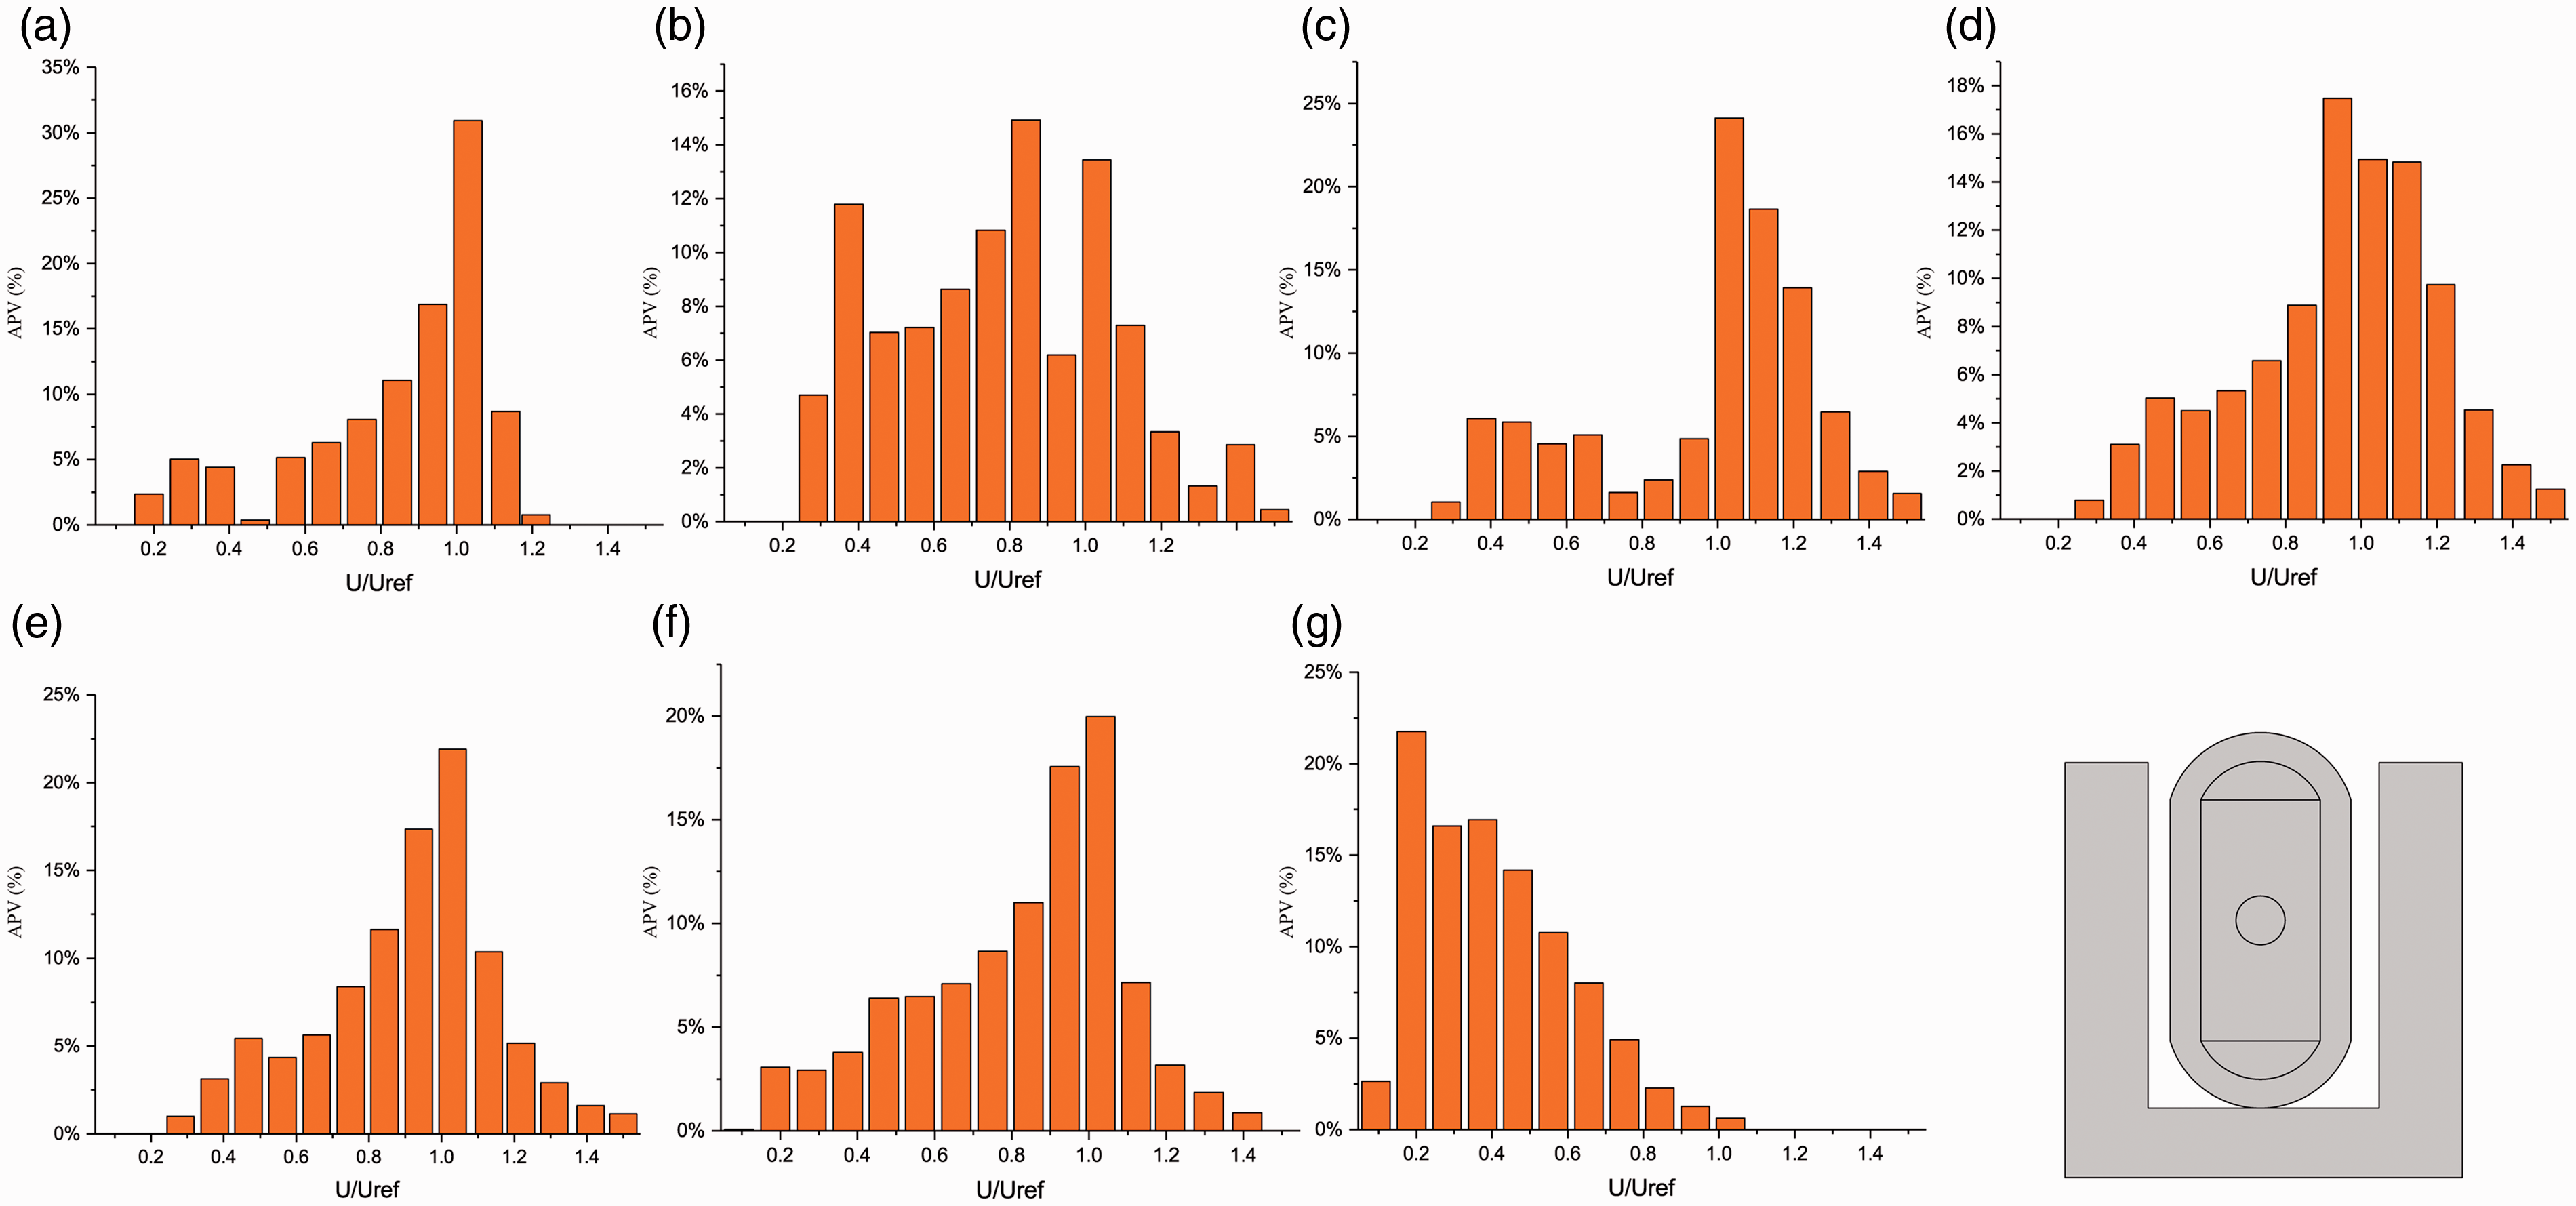
Proportion of area of case C under different approaching wind directions. (a) Case C0, (b) Case C15, (c) Case C30, (d) Case C45, (e) Case C60, (f) Case C75 and (g) Case C90.
To compare the overall wind environment between these cases, the accumulated APV in different cases is compared as shown in Figure 14. It represents the accumulated WVA area ratio rather than several WVA area ratio. The lower the value of accumulated averaged APV, the better the ventilation environment with a high airflow velocity. As shown in Figure 14, the ventilation condition in case C90 is the worst and case C30 is the best among all cases. Case C15 illustrates the second worst wind situation compared to others. From a wind angle direction from 30° to 75°, the ventilated condition of the stadium would produce a worse wind environment as inlet wind angle increases.
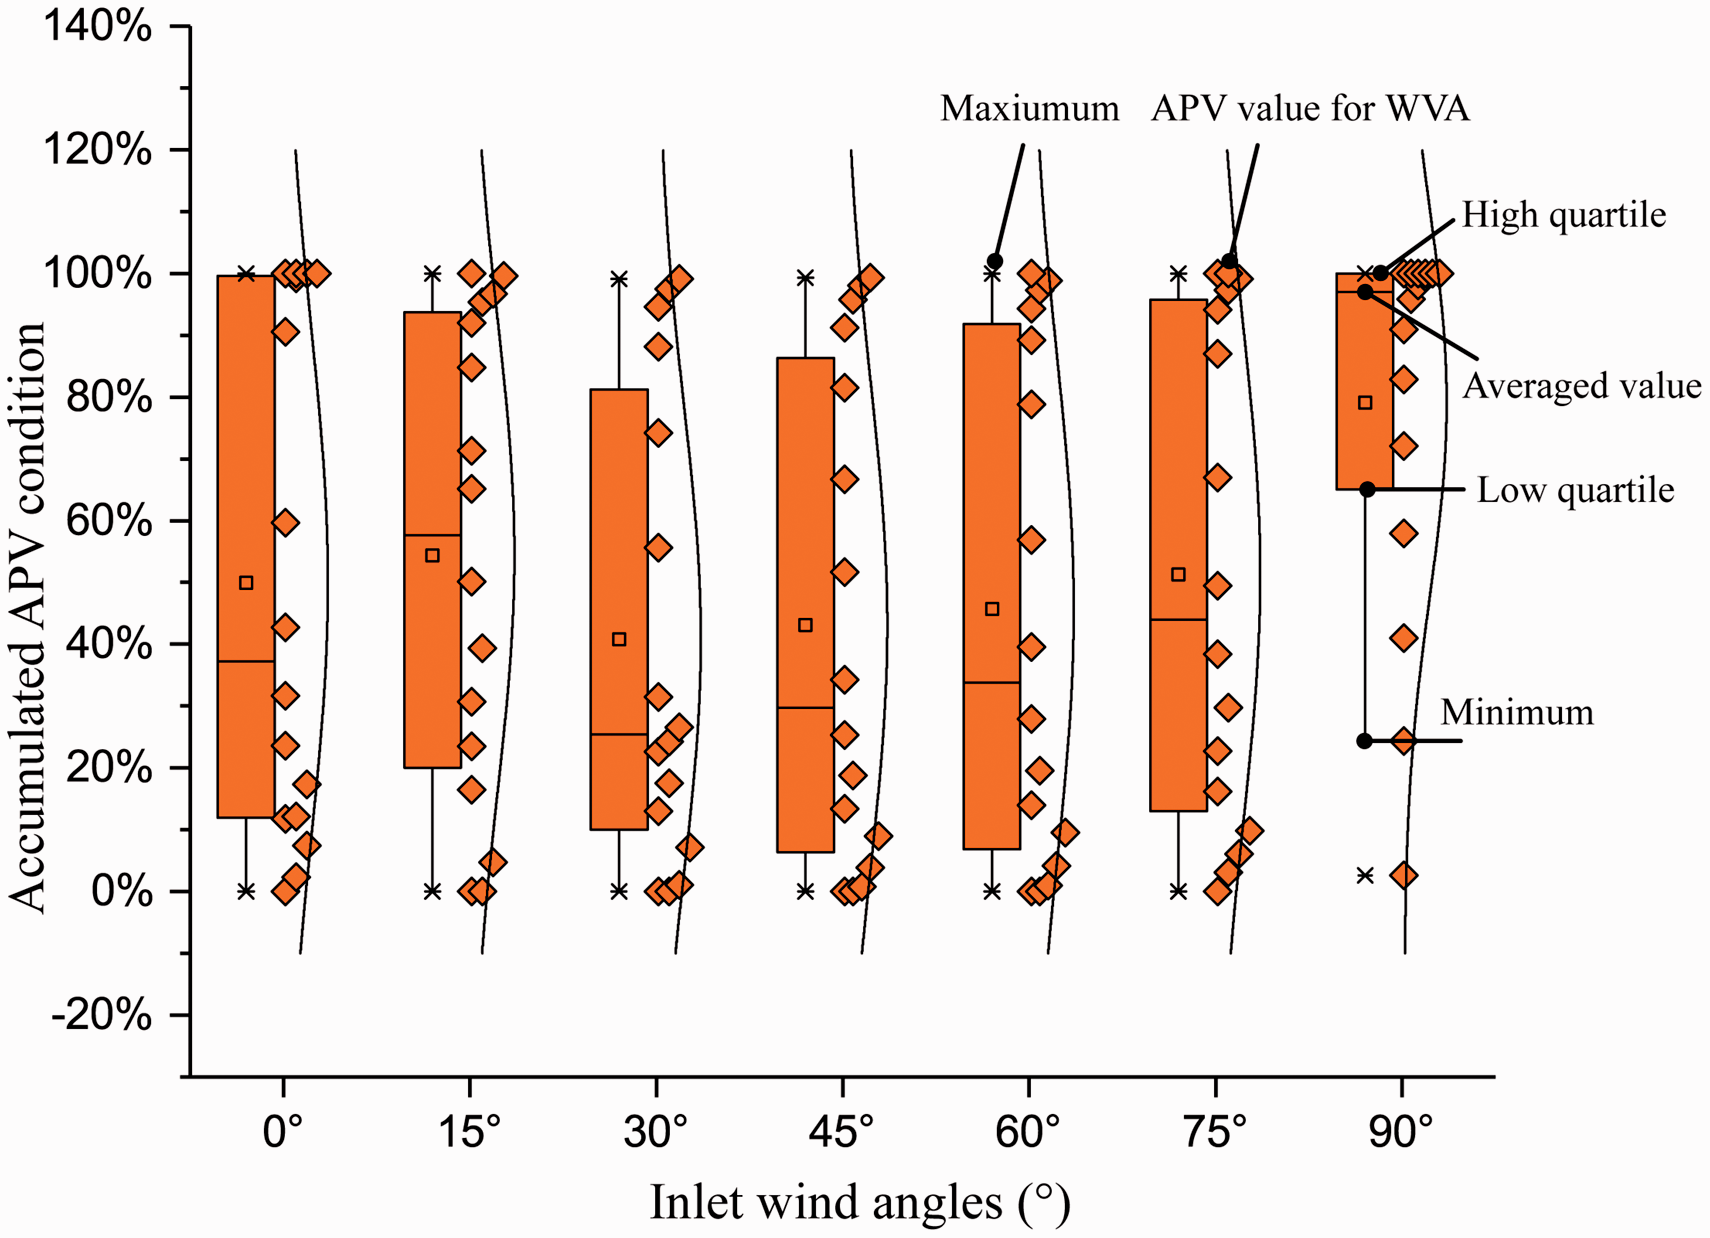
Comparison of APV in different cases.
Hence, in conclusion, for three-sided auditorium stadium, the best building orientation ranges from 30° to 60°, which not only enables the dispersion of air pollutants in the stadium but would pose little effect on sprinting race competition. In addition, the inner side of the stadium would have the worst ventilation performance around the short side and the corner of the stadium in any case. Although the running competition could not be impacted by the wind velocity under 90° direction, the stadium orientation of 90° should not be incorporated to the design due to the worst air pollutant dispersion effect.
Discussion
In this study, wind force is considered as the only driving force. Buoyancy force is another significant impact factor for ventilation. The WVA factor is normalized by the U and reference wind speed Uref at a height of 10 m, which is the meteorological data recorded from an observation at altitudes. WVA was used as the assessment measurement instead of pressure coefficients Cp due to its ability to readily incorporate a particular wind climate to determine the wind speed and wind flow field. For sport stadium, the huge number of spectators would generate a lot of heat load which in turn promotes the stack ventilation effect. Hence, further investigation should be performed to include the buoyancy effect for stadium ventilation.
The ventilation characteristics in the horizontal plane were investigated in this research. Nevertheless, the airflow distribution in the vertical section direction of the stadium could also be important. Hence, further research is needed to investigate the flow pattern on the stadium vertical sections, in which, the airflow could also be susceptible to the influence by the canopy shape.
In order to cope with variable climatic conditions, openable-closed roof has been increasingly incorporated to various types of stadium around the world. The variation of roof opening and closing could have a great impact on the wind environment inside the stadium. In this case, further research are recommended to investigate the interior ventilation characteristics for openable-closed roof stadium.
Conclusion
The wind environment in different auditorium configurations of a stadium was modelled and investigated. A stadium was selected as the study model prototype and wind flows around three types of stadium configurations were investigated under seven wind directions. The following conclusions are drawn from the results:
For all round type stadium, the best inlet wind angle for the stadium ranges from 75° to 90°, which would avoid high wind velocity influences. The wind directions of 45° to 60° are the least recommended for stadium design due to high wind velocity environment, which would cause an impact on sports competition. For two-sided auditorium type stadium, 100 m sprinting track should be placed at the position near the auditorium which blocks the approaching wind, no matter which direction the wind comes from. For inlet wind direction, 60° to 90° are the best inlet wind angles most favourable for sports competition. The 60° is the optimum angle for approaching wind to meet the requirement for sporting competition and would allow efficient dissipation of pollutants in the stadium. For three-sided auditorium style stadium, the best building orientation ranges would be about 30° to 60° as this would allow dispersion of air pollutants in the stadium and would pose little effect on sprints competition. The 100 m running track should be placed below the long-edge auditorium near the inlet wind direction for the three-sided auditorium style stadium.
For case C, the innermost short side stadium position would have the worst ventilation performance. Pollution sources such as the air conditioner outlet, dustbin, crowd, etc. should not be located at this place. The stadium orientation should not be placed at 90° to the wind direction in any circumstance.
Footnotes
Authors’ contribution
All authors contributed equally in the preparation of this manuscript.
Declaration of conflicting interests
The author(s) declared no potential conflicts of interest with respect to the research, authorship, and/or publication of this article.
Funding
The author(s) disclosed receipt of the following financial support for the research, authorship, and/or publication of this article: This research has received funding from the Welsh Government's Sêr Cymru (Stars Wales) fellowship programme.