
Abstract
Airport terminals are key infrastructures with rapid development currently, where the air-conditioning (AC) systems aim to guarantee the normal operation. This research investigated the AC systems in seven Chinese hub airport terminals by a large-scale on-site measurement. The average annual electricity consumption was 177 kWh/(m2 · year), in which 30–60% was consumed by AC systems. The terminal device of AC systems is one of the key components restricting the cooling performance. The commonly used terminal devices (i.e. air handling units) accounted for 40–74% of the AC electricity consumption. As an alternative, the AC system combining radiant floor and displacement ventilation could save 34% of the AC electricity consumption in one investigated airport terminal. Furthermore, the designed cooling capacities were 132–176 W/m2, while the measured values were only 43–90 W/m2. Thus, the AC systems, especially the terminal devices, should have the ability to adjust cooling capacity over a wide range to cope with this prevailing situation of low load rates. This study is beneficial for the design and operation of AC systems in airport terminals.
Keywords
Introduction
The civil aviation industry has maintained a rapid development throughout the world in recent years. More than 4 billion passengers chose to travel by air in 2017, in which China had the highest growth rate of 14% in top-ten countries or groups. 1 As critical infrastructures for civil aviation, airport terminals are experiencing rapid development in China. More than 70 new airport terminals are to be built and more than 100 airport terminals are to be retrofitted in the 13th five-year plan period (2016–2020). 2 Previous research indicates that the energy consumption of airport terminals is usually higher than that of common civil buildings,3,4 and 40–80% of the energy is consumed by heating, ventilation and air-conditioning (HVAC) systems.5–7 Even though with such a high level of energy consumption, the indoor environment in airport terminals is always less than satisfactory.8,9 Therefore, how to improve both indoor environment and energy efficiency is an urgent topic in the design and operation of the air-conditioning systems in airport terminals.
Airport terminals are public buildings with special functions to meet the requirements for civil aviation; 3 besides, they are generally designed to be large space buildings with high ceilings and large areas of glazing envelopes. 6 These characteristics differentiate them from common types of buildings (such as offices and residences), especially for the indoor environment. Researchers have investigated the indoor environment in airport terminals over the world and analysed the main reasons leading to thermal discomfort in summer, including high globe temperature caused by high-temperature envelopes, overheating/overcooling caused by air-conditioning systems, and high humidity caused by air infiltration.6,8–11 To create a satisfactory indoor environment, terminal devices of an air-conditioning system are significant in large spaces of airport terminals, which determine the airflow distribution and influence the cooling load. Jet ventilation with nozzle outlets is commonly used in airport terminals 6 and other large space buildings, such as a stadium 12 and a railway station. 13 Moreover, various types of new terminal devices were proposed and used in large spaces of airport terminals to improve the cooling performance, such as the displacement ventilation in the new terminal of Madrid Airport 14 and the radiant floor supplemented by displacement ventilation in New Bangkok Airport 15 and Xi’an Xianyang International Airport. 16 Previous research mainly focused on the indoor environment in the occupant zones of airport terminals; however, the indoor environment of the entire large spaces with various types of terminal devices has not been investigated and compared in detail, which is closely related to the cooling load of air-conditioning systems.
Furthermore, energy efficiency is the other significant aspect to evaluate the cooling performance of air-conditioning systems in airport terminals. The energy efficiency of devices in air-conditioning systems or a cooling plant as a whole is usually defined as an output–input ratio which refers to the ratio of cooling capacity and electric power consumption, such as coefficient of performance (COP) of a chiller and energy efficiency ratio of a cooling plant (EER).17,18 These indexes have been widely used to evaluate the energy performance of air-conditioning systems, such as benchmarking energy performance for cooling in large commercial buildings. 19 Based on these indexes, new forms of air-conditioning systems have been designed to improve the energy performance of airport terminals. Sun et al. 20 proposed to integrate the chilled water system of Hong Kong International Airport into neighbouring buildings, which improved the energy efficiency of the cooling plant in partial load conditions. Zhang et al. 21 utilised thermal energy storage (TES) equipment in the building cooling heating and power (BCHP) system of Qingdao International Airport, and then optimised the strategy to operate electrical chillers, TES equipment and absorption chillers in various load conditions. Moreover, the control method of air-conditioning systems is also important in actual operation. Fan et al. 22 presented an exergy analysis method to evaluate the operation performance of the HVAC system in an airport of Haikou, China, which could give directions for optimal control. Huang et al. 23 proposed a hybrid model predictive control (HMPC) scheme for energy and cost savings in Adelaide Airport T1, Australia, by which a considerable amount of energy has been saved without violating thermal comfort. Although many researchers have studied novel technologies and forms of air-conditioning systems in airport terminals over the world, there is still a lack of long-time and large-scale on-site measurements to reveal the actual operation situations of air-conditioning systems in current airport terminals and analyse common problems, especially in China with such a rapid development of airport terminals.
In this study, comprehensive on-site measurements from 2013 to 2018 were summarised to investigate the performance of air-conditioning systems in seven Chinese hub airport terminals. The results were analysed in detail to determine the key issues restricting the performance and possible solutions were also proposed. The present analysis would be beneficial to the construction and operation of air-conditioning systems in airport terminals.
Basic information of measurements
The cooling performance in airport terminals was determined by the indoor environment in terminal buildings and the energy performance of key devices in air-conditioning systems. On-site measurements were performed in seven Chinese hub airport terminals to give a comprehensive view of the cooling performance. Besides, the design parameters and measurement results of some other Chinese airport terminals in literature were also collected for comparison.
Air-conditioning systems in the measured airports
Table 1 shows the seven terminals of three Chinese hub airports (A, B and C) for the on-site measurements. For example, A1, A2 and A3 are three different terminals in the same airport, but they were constructed in different years, resulting in various forms of architectural spaces and air-conditioning systems. Figure 1 illustrates the outdoor temperatures for HVAC designs in the top 20 Chinese airports. 24 Although these airports are located in various climate zones of China, their design/extreme outdoor temperatures in summer are quite similar compared with those in winter. Thus, the on-site measurements in the selected airport terminals can reveal the typical cooling condition in Chinese hub airport terminals. A district cooling/heating system is commonly adopted in an airport area, as illustrated in Figure 2, which consists of terminal devices in an airport terminal, a distribution system and an energy centre.
Information of airport terminals investigated in this research.
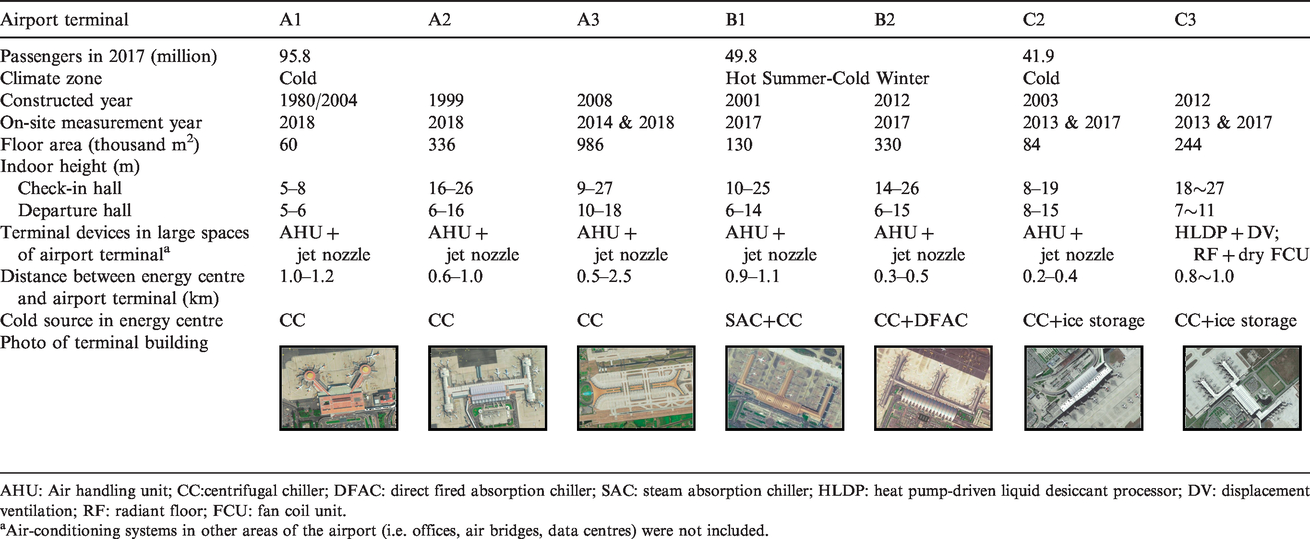
AHU: Air handling unit; CC:centrifugal chiller; DFAC: direct fired absorption chiller; SAC: steam absorption chiller; HLDP: heat pump-driven liquid desiccant processor; DV: displacement ventilation; RF: radiant floor; FCU: fan coil unit.
aAir-conditioning systems in other areas of the airport (i.e. offices, air bridges, data centres) were not included.
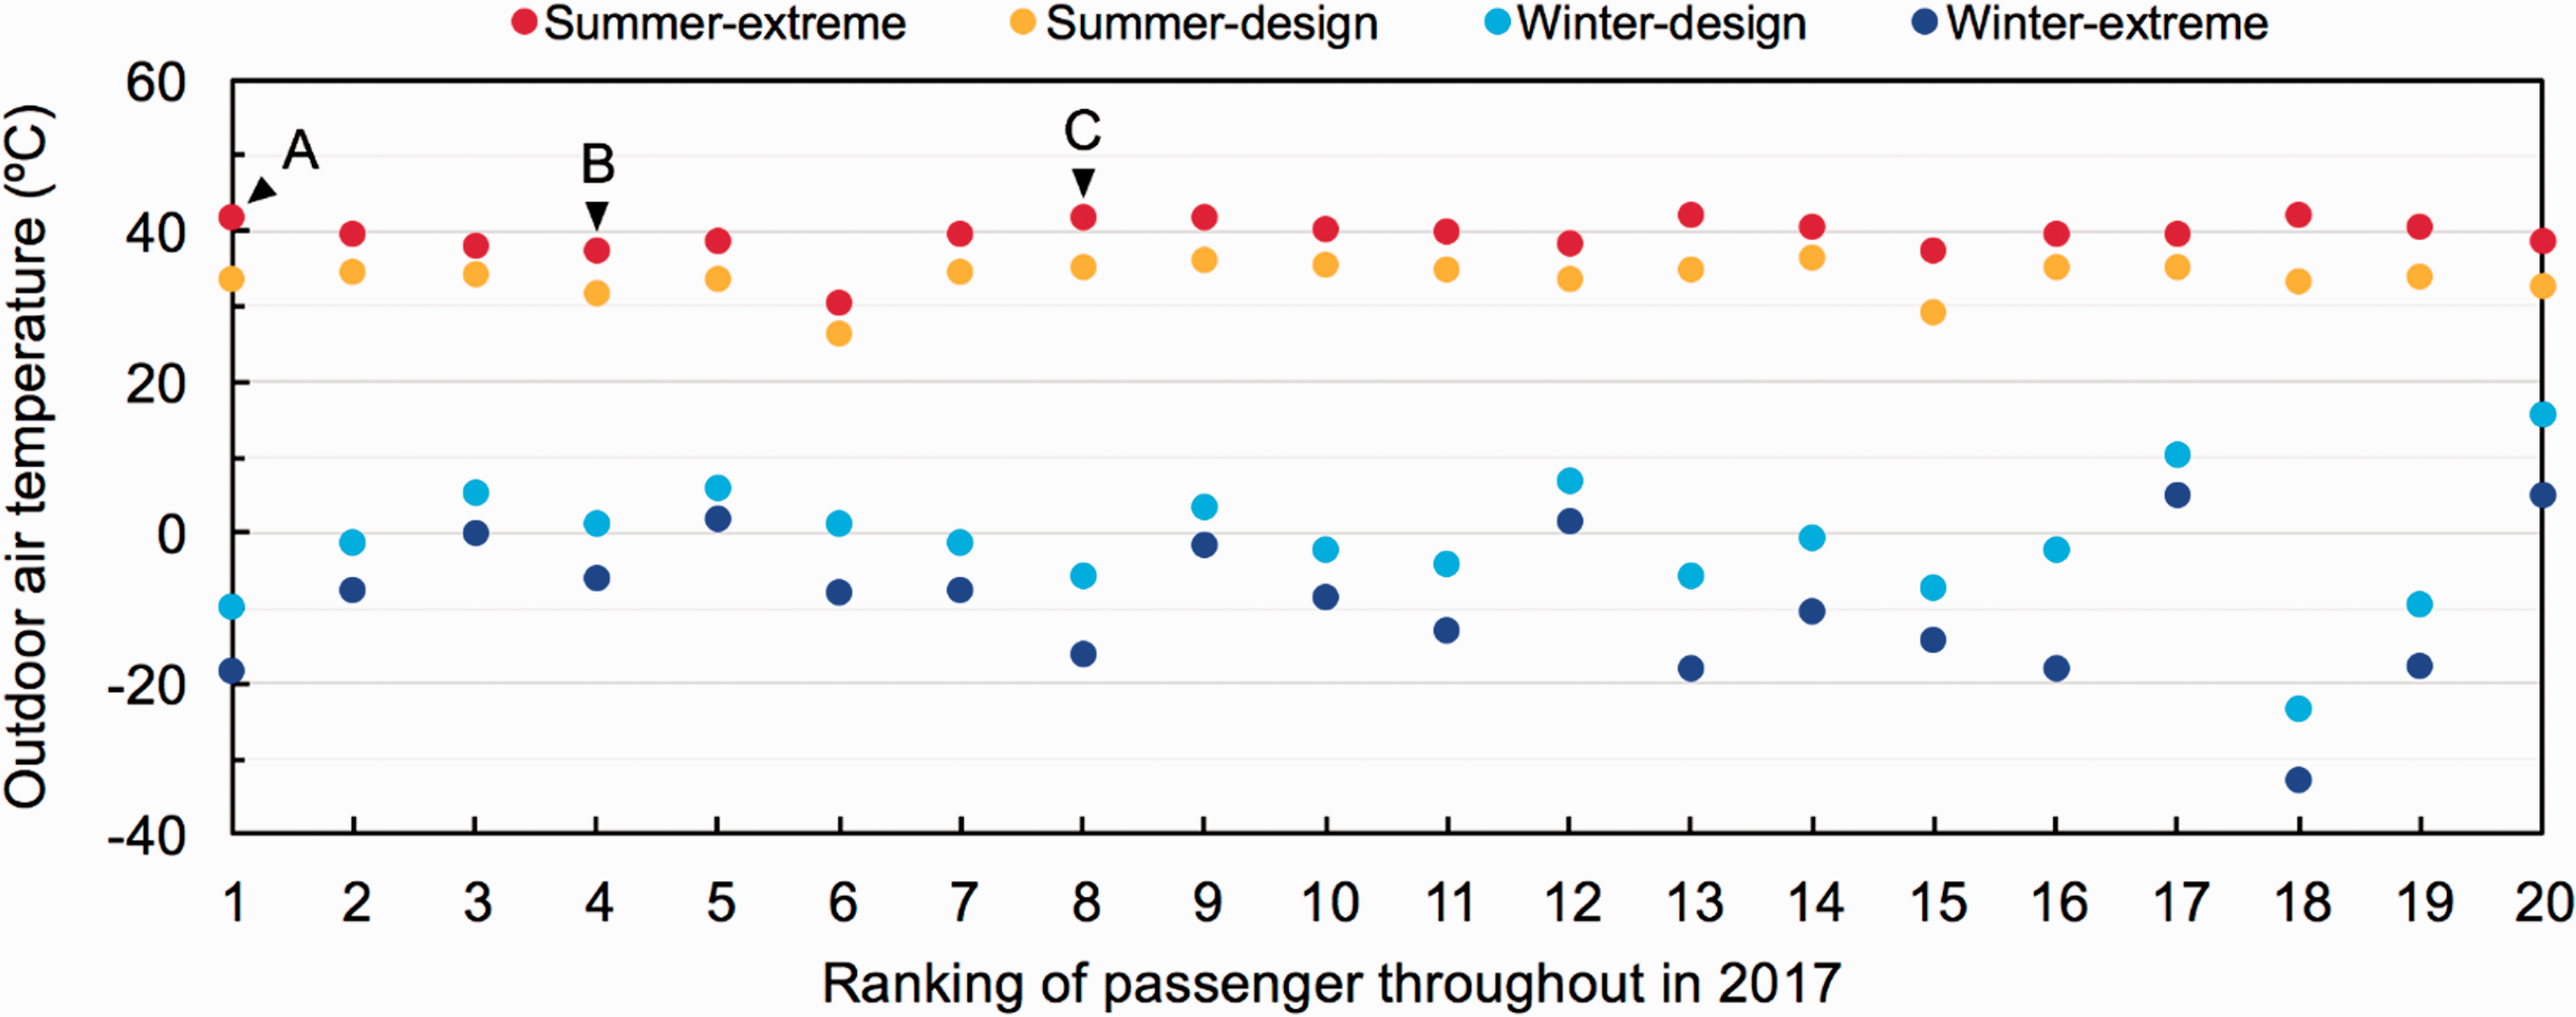
Design and extreme outdoor temperatures for the HVAC systems at the top 20 airports in China. 24
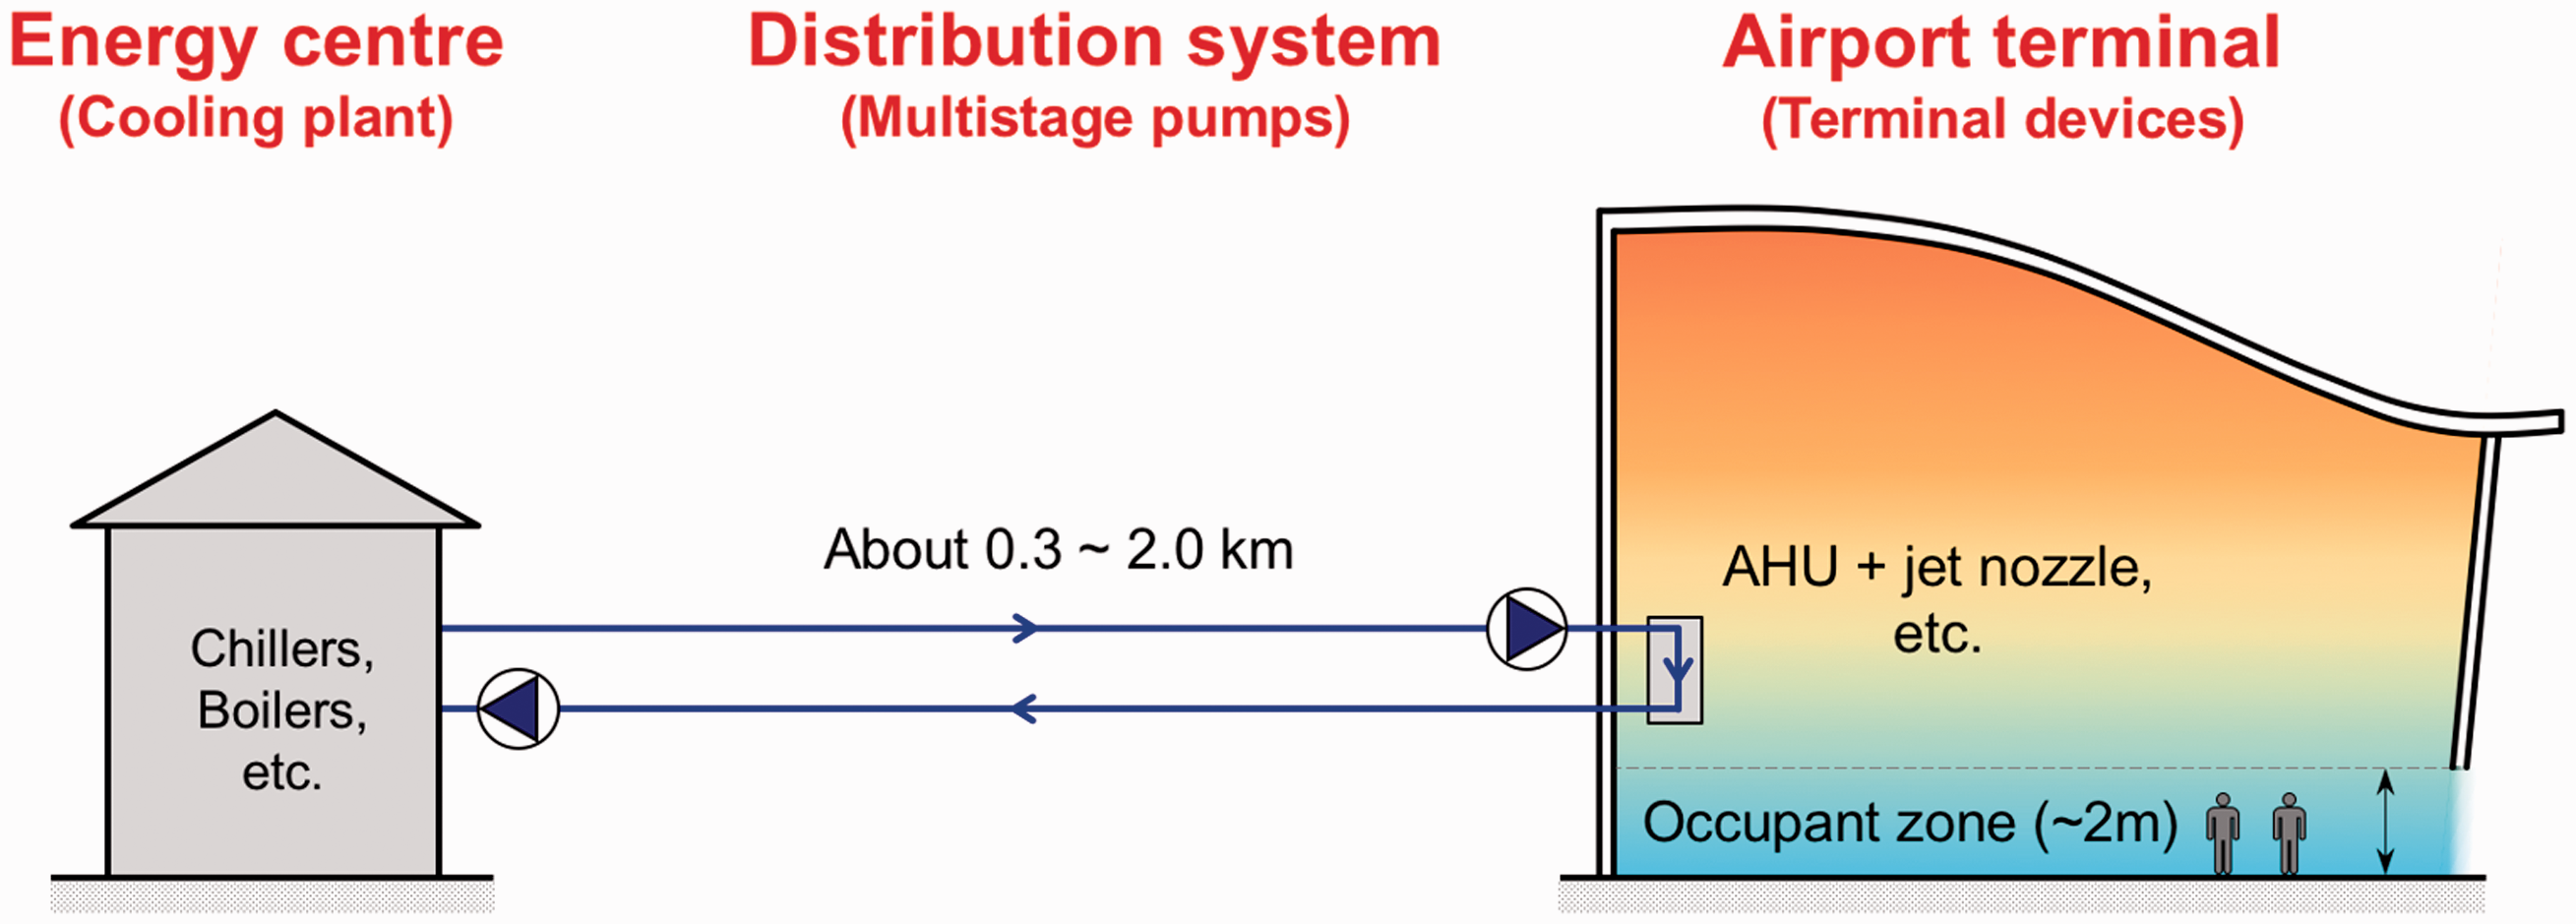
Schematic diagram of air-conditioning systems in airports.
In airport terminals, occupants’ activities almost occur in the space within about 2 m above the floor, while airport terminals are usually designed to be large space buildings. The maximal indoor height of the check-in halls in these measured airport terminals can reach 27 m, and that of the departure halls is 18 m (A3 in Table 1). There are three commonly used forms of terminal devices in large spaces of these airport terminals, as shown in Figure 3. The airport terminals, which were constructed in the early years, usually adopted the entire space air-conditioning systems, as shown in Figure 3(a), which means the entire indoor space is cooled. To reduce the air-conditioning controlled space for energy saving, the stratified air-conditioning systems, as shown in Figure 3(b), are most widely used nowadays in airport terminals. The jet nozzles are installed in the side walls (such as check-in counters), and the air-conditioning controlled space is 4–6 m high. Moreover, the occupant zone air-conditioning systems with the radiant floor (RF) and displacement ventilation (DV), as shown in Figure 3(c), have been introduced into large spaces of airport terminals, which can further decrease the air-conditioning controlled space to be about 2 m high.
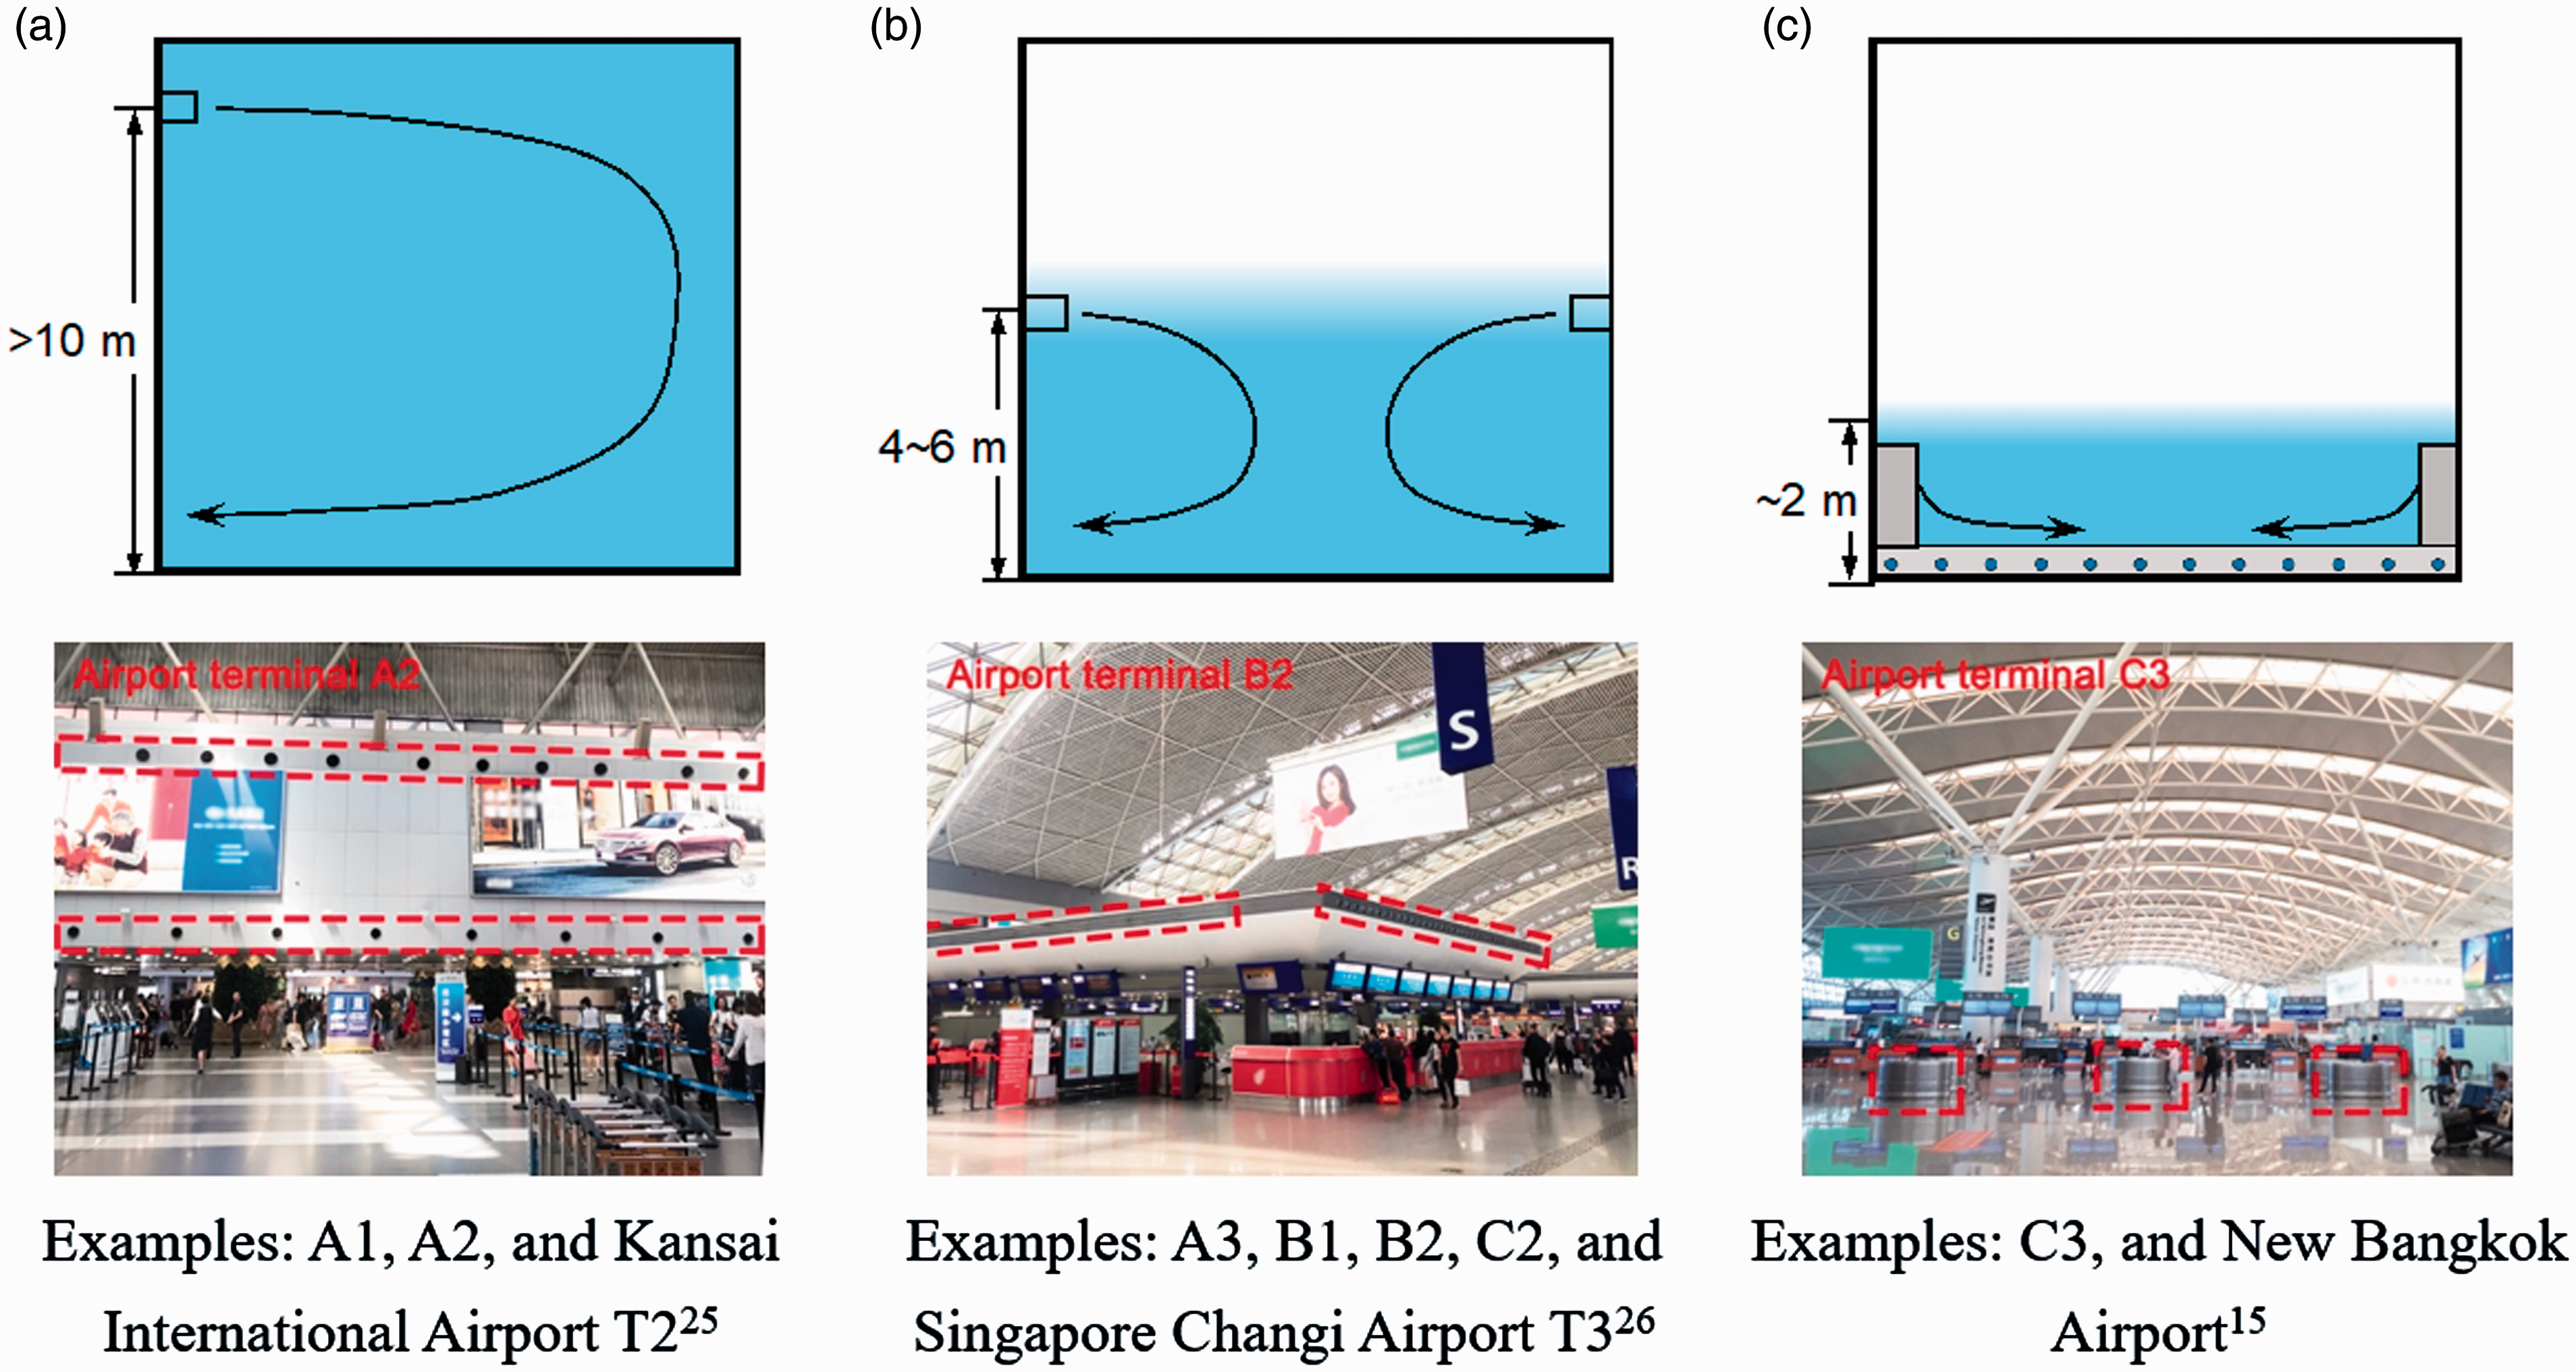
Typical terminal devices of HVAC systems in large spaces of airport terminals: (a) entire space air-conditioning (jet ventilation), (b) stratified air-conditioning (jet ventilation) and (c) occupant zone air-conditioning (RF + DV).
The cold sources of air-conditioning systems are usually located in the energy centre (i.e. cooling plant), as shown in Figure 2. Centrifugal chillers are often utilised as cold sources, which are supplemented by absorption chillers in some airports, such as B2. Besides, the ice storage technology is also applied in some airport terminals like C2 and C3, which aims to optimise the installed cooling capacity of district cooling systems. The energy centres are typically located 0.3–2.0 km away from their respective airport terminals. Therefore, multistage pumps are generally designed in the distribution system to supply chilled water from the energy centre to the airport terminal. Figure 4 illustrates the design parameters of typical cooling plants in the measured airport terminals and some other Chinese airport (i.e. D to J).27–33 The chilled water with a temperature difference of 5 K (i.e. 7 °C supply and 12 °C return) is commonly adopted, especially in those airport terminals built in early years. However, to reduce the energy consumption of chilled water distribution systems, the design temperature difference of supply and return chilled water increases to be 6–13 K in some airports, such as C2 and C3. Furthermore, the design cooling capacity per air-conditioning controlled area in these airports ranges from 122 W/m2 to 231 W/m2 with an average value of 169 W/m2, as shown in Figure 4(b), which indicates a high level of cooling demand in airport terminals.
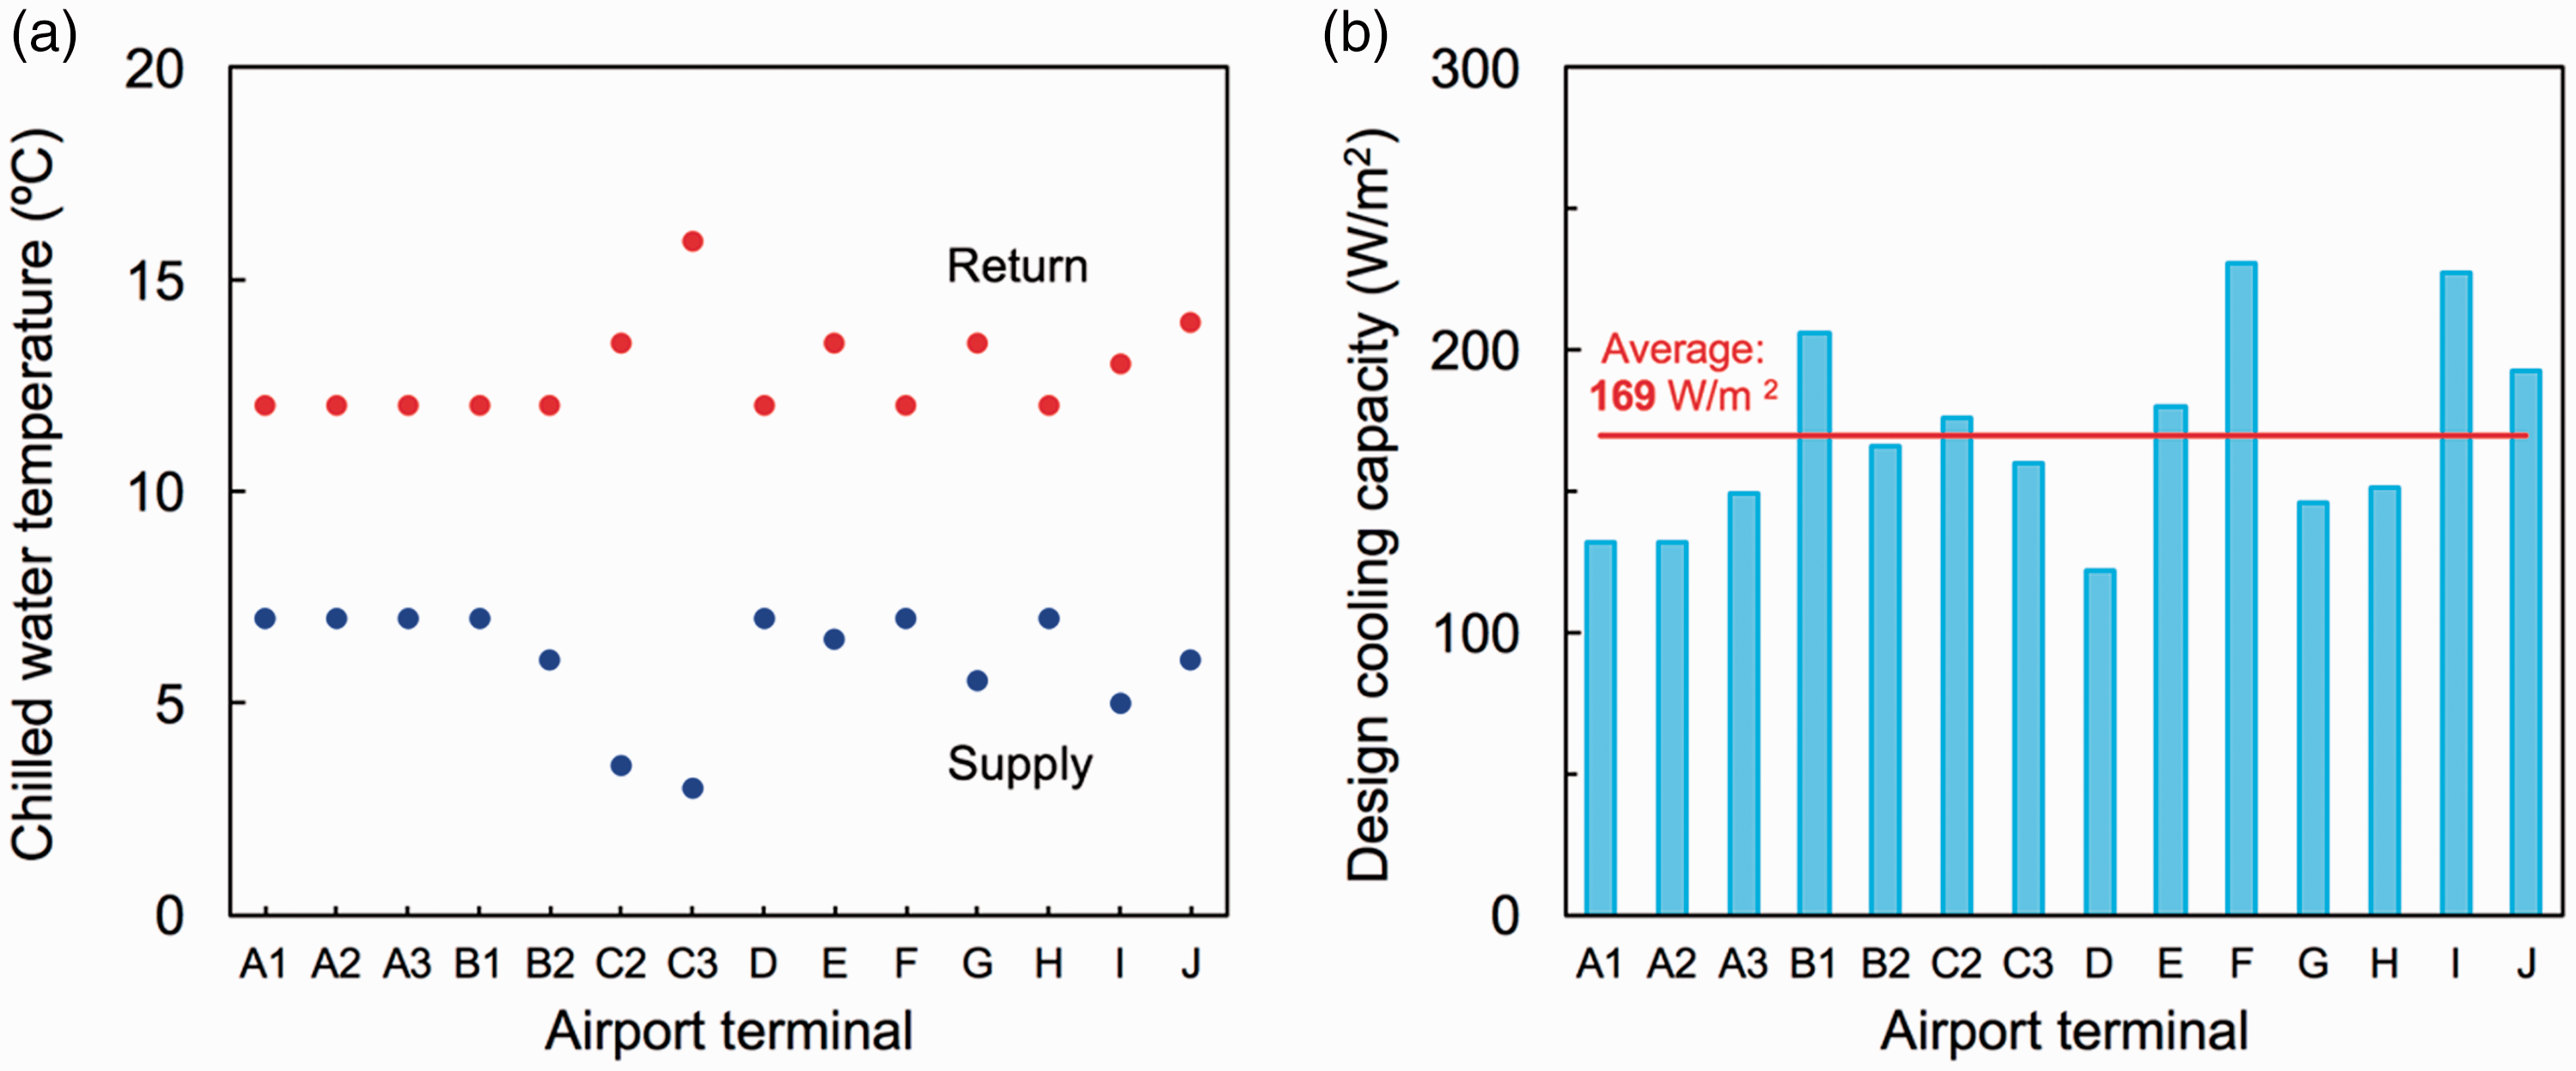
Design parameters of typical cooling plants in Chinese airport terminals: (a) chilled water temperature and (b) cooling capacity.
On-site measurement method
The time of on-site measurements in the seven airport terminals (shown in Table 1) was June, July and August of 2013, 2014, 2017 and 2018, which can represent the typical situation in summer. The on-site measurements were carried out simultaneously in the cooling plant and the terminal building of each airport terminal to investigate the indoor environment in these terminal buildings and the energy performance of key devices in their air-conditioning systems.
The indoor environmental parameters, including air temperature, relative humidity, air velocity and CO2 concentration, were measured in each of the airport terminals. For occupant zones, the indoor environmental sensors were located 1.5 m above the floor in typical areas of each airport terminal, including check-in hall, departure hall, arrival hall, security check area, baggage claim area, restaurant and shop. Besides, a series of sensors was hung in the centre of each check-in hall to measure the air temperature and relative humidity at different heights of large airport hall spaces. The previous research in airport terminal B26 has described the measurement method and locations of all sensors in detail, which is also applied to other airport terminals in the current research.
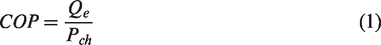
The key devices in air-conditioning systems include chillers, air-conditioning water pumps, cooling towers and air handling units (AHUs). The measurement methods of these devices are described in the online Appendix in detail. The energy performance of these devices can all be equally compared using the output–input ratio, which refers to the ratio of the cooling capacity to the electric power consumption. To be specific, the energy performance of chillers can be evaluated by the coefficient of performance (COP), which is defined as equation (1).
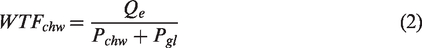
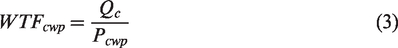
Similarly, the transport factors of other key devices can be defined as dimensionless ratios according to COP of chillers to indicate their energy performance. The water transport factors (WTF)18,19 of air-conditioning water pumps and cooling towers are defined as equations (2) to (4).

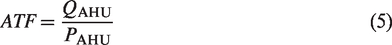
The energy performance of AHU was evaluated by air transport factor (ATF),
18
as shown in equation (5)
Moreover, the energy performance of the cooling plant as a whole was evaluated by energy efficiency ratio (EER),18,19 which is defined to be the ratio of the cooling capacity to the power consumption in a cooling plant, as equation (6).

All the parameters mentioned above were measured continuously at 10-min intervals during each period of the on-site measurement. The measurement devices and their accuracies are shown in Table 2. The air temperature and relative humidity were measured using a combined resistance temperature detector (Pt RTD) and a lithium chloride relative humidity sensor (LiCl RHS), by which the humidity ratio of air was also determined (relative accuracy within 10%). Besides, the energy consumption data and the electric power of the devices in the air-conditioning systems (such as chillers, pumps, cooling towers, and AHUs) were all obtained from the building automation system of each airport terminal. The outdoor meteorological parameters were collected from the weather stations in these airports.
Specifications of the measurement devices.
Indoor environment in large spaces
Thermal environment and indoor air quality are two essential factors of the indoor environment in airport terminals; thus, in this section, the on-site measurement results of indoor temperature, humidity and CO2 concentration are presented.
Temperature and humidity
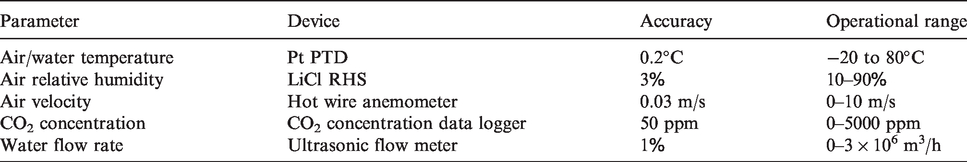
The indoor thermal environment in the airport terminals indicates the controlling performance of air-conditioning systems. Figure 5 illustrates the indoor temperature and humidity in the typical occupant zones of the measured airport terminals. The atmospheric pressures at airport B (95.75 kPa) and C (95.71 kPa) were very close; thus, the data of airport terminals B2, C2 and C3 were plotted in the same psychrometric chart. The measured data were compared with the Chinese thermal comfort standard, 24 which requires the indoor environment to be controlled within 24–27 °C and 40–70%. As shown in Figure 5, the requirement of temperature could be basically met except for over-heating sometimes in the restaurants and shops, and over-cooling sometimes in the departure halls and the arrival halls in these airports. Besides, the indoor humidity was not strictly controlled in these airport terminals. Airport terminal A1, A2, A3 and B2 were too humid while some parts of airport terminals C2 and C3 were over-dehumidified. The performance of dehumidification in airport terminals in summer is related to the temperature of chilled water, which were analysed and discussed in the ‘Discussion’ section.
Air temperature and humidity in occupant zones of airport terminals: (a) A1, A2 and A3 (atmospheric pressure: 99.99 kPa), and (b) B2, C2 and C3 (atmospheric pressure: 95.73 kPa).
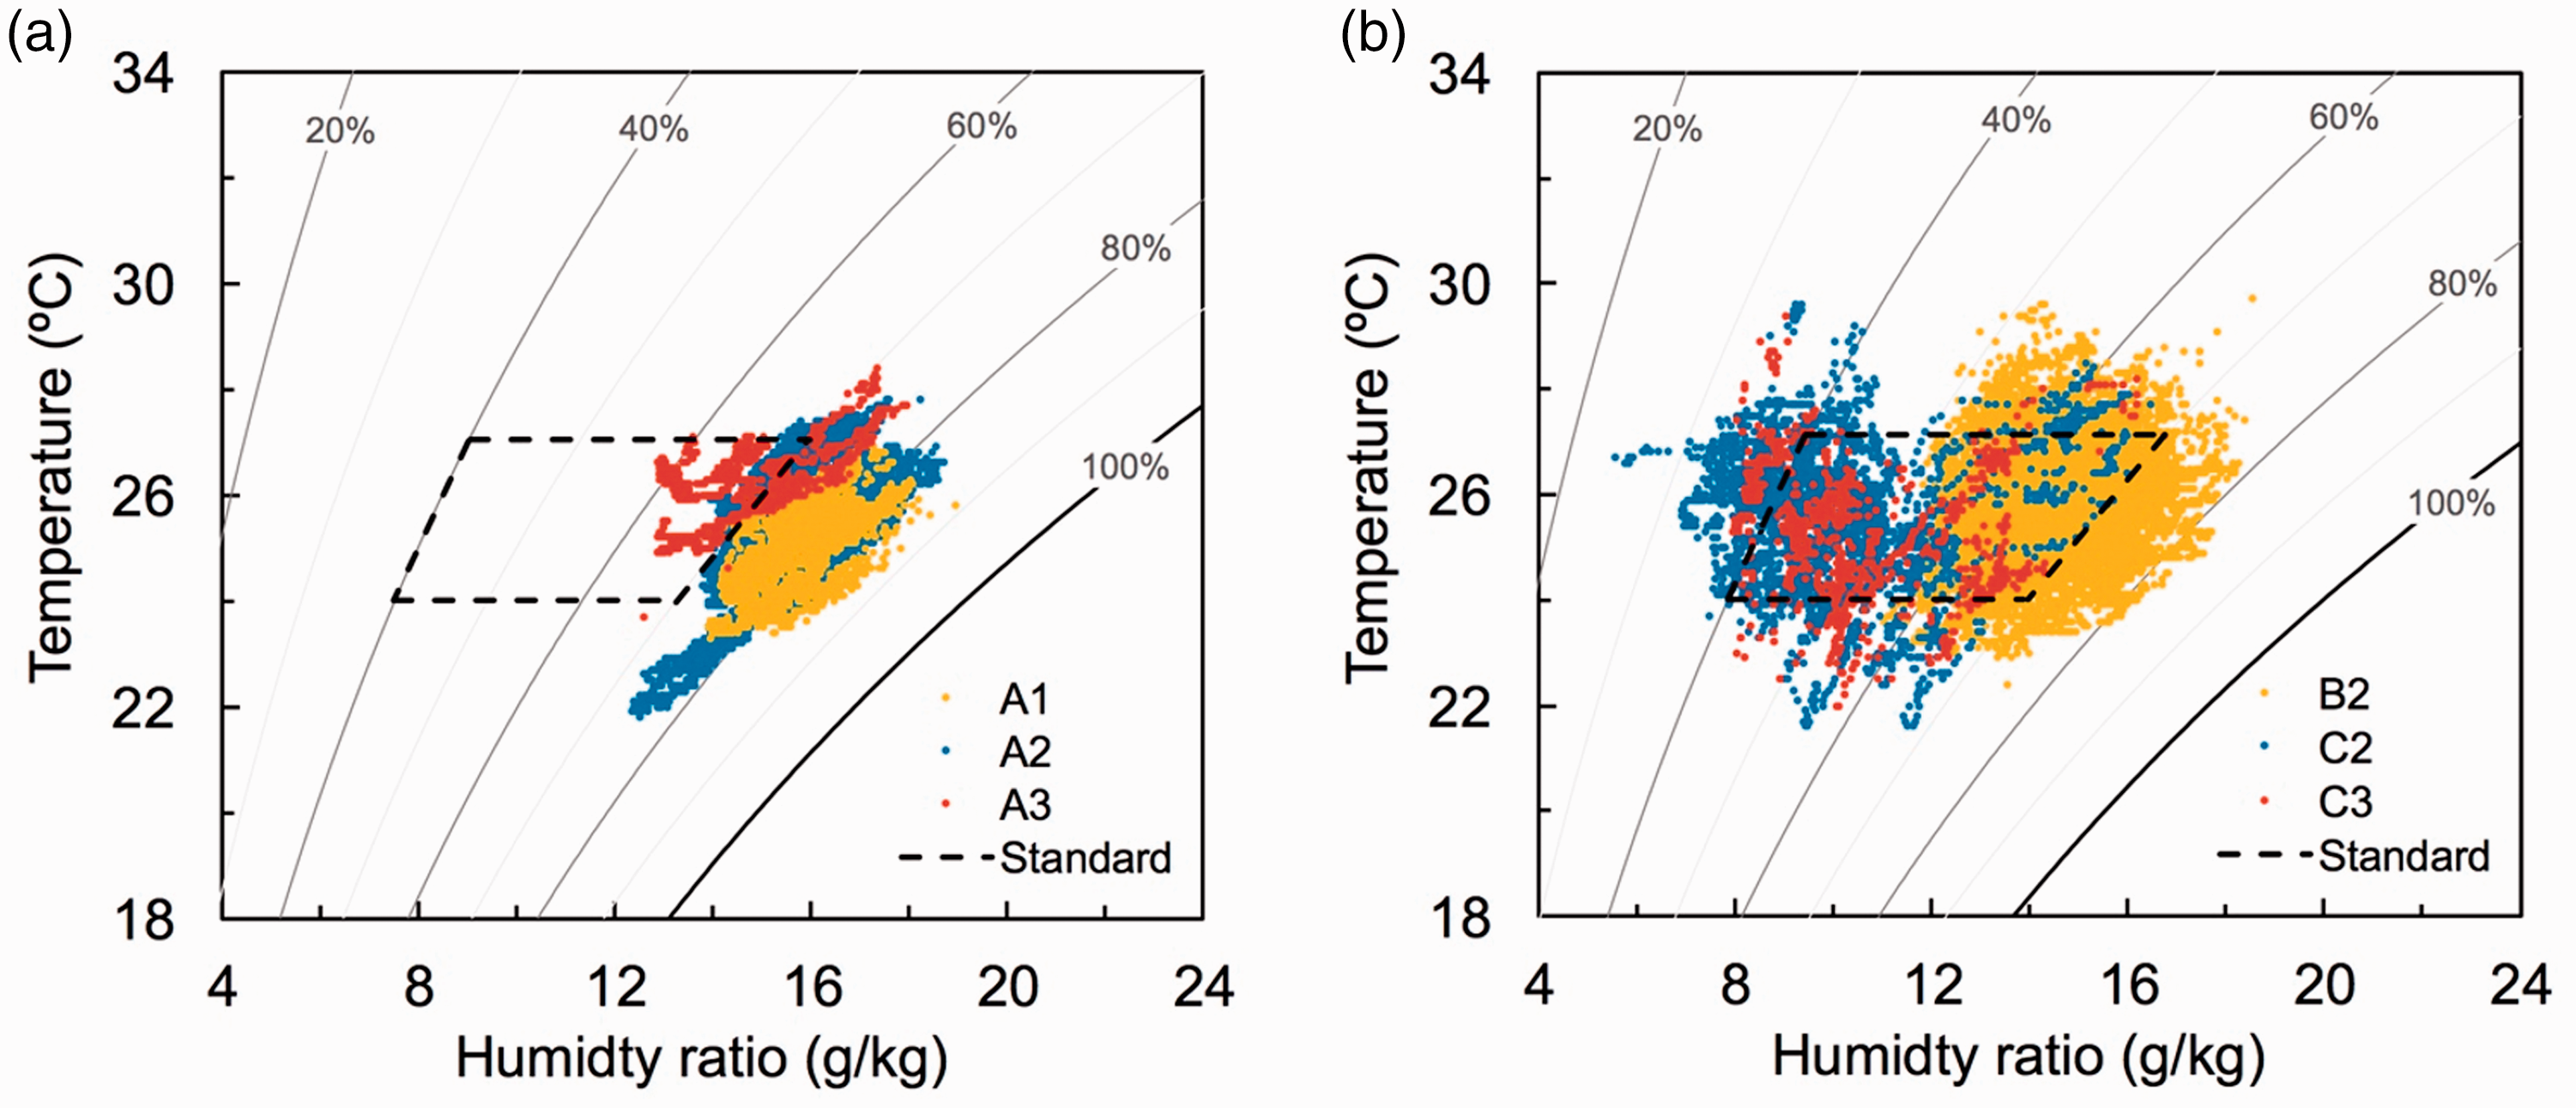
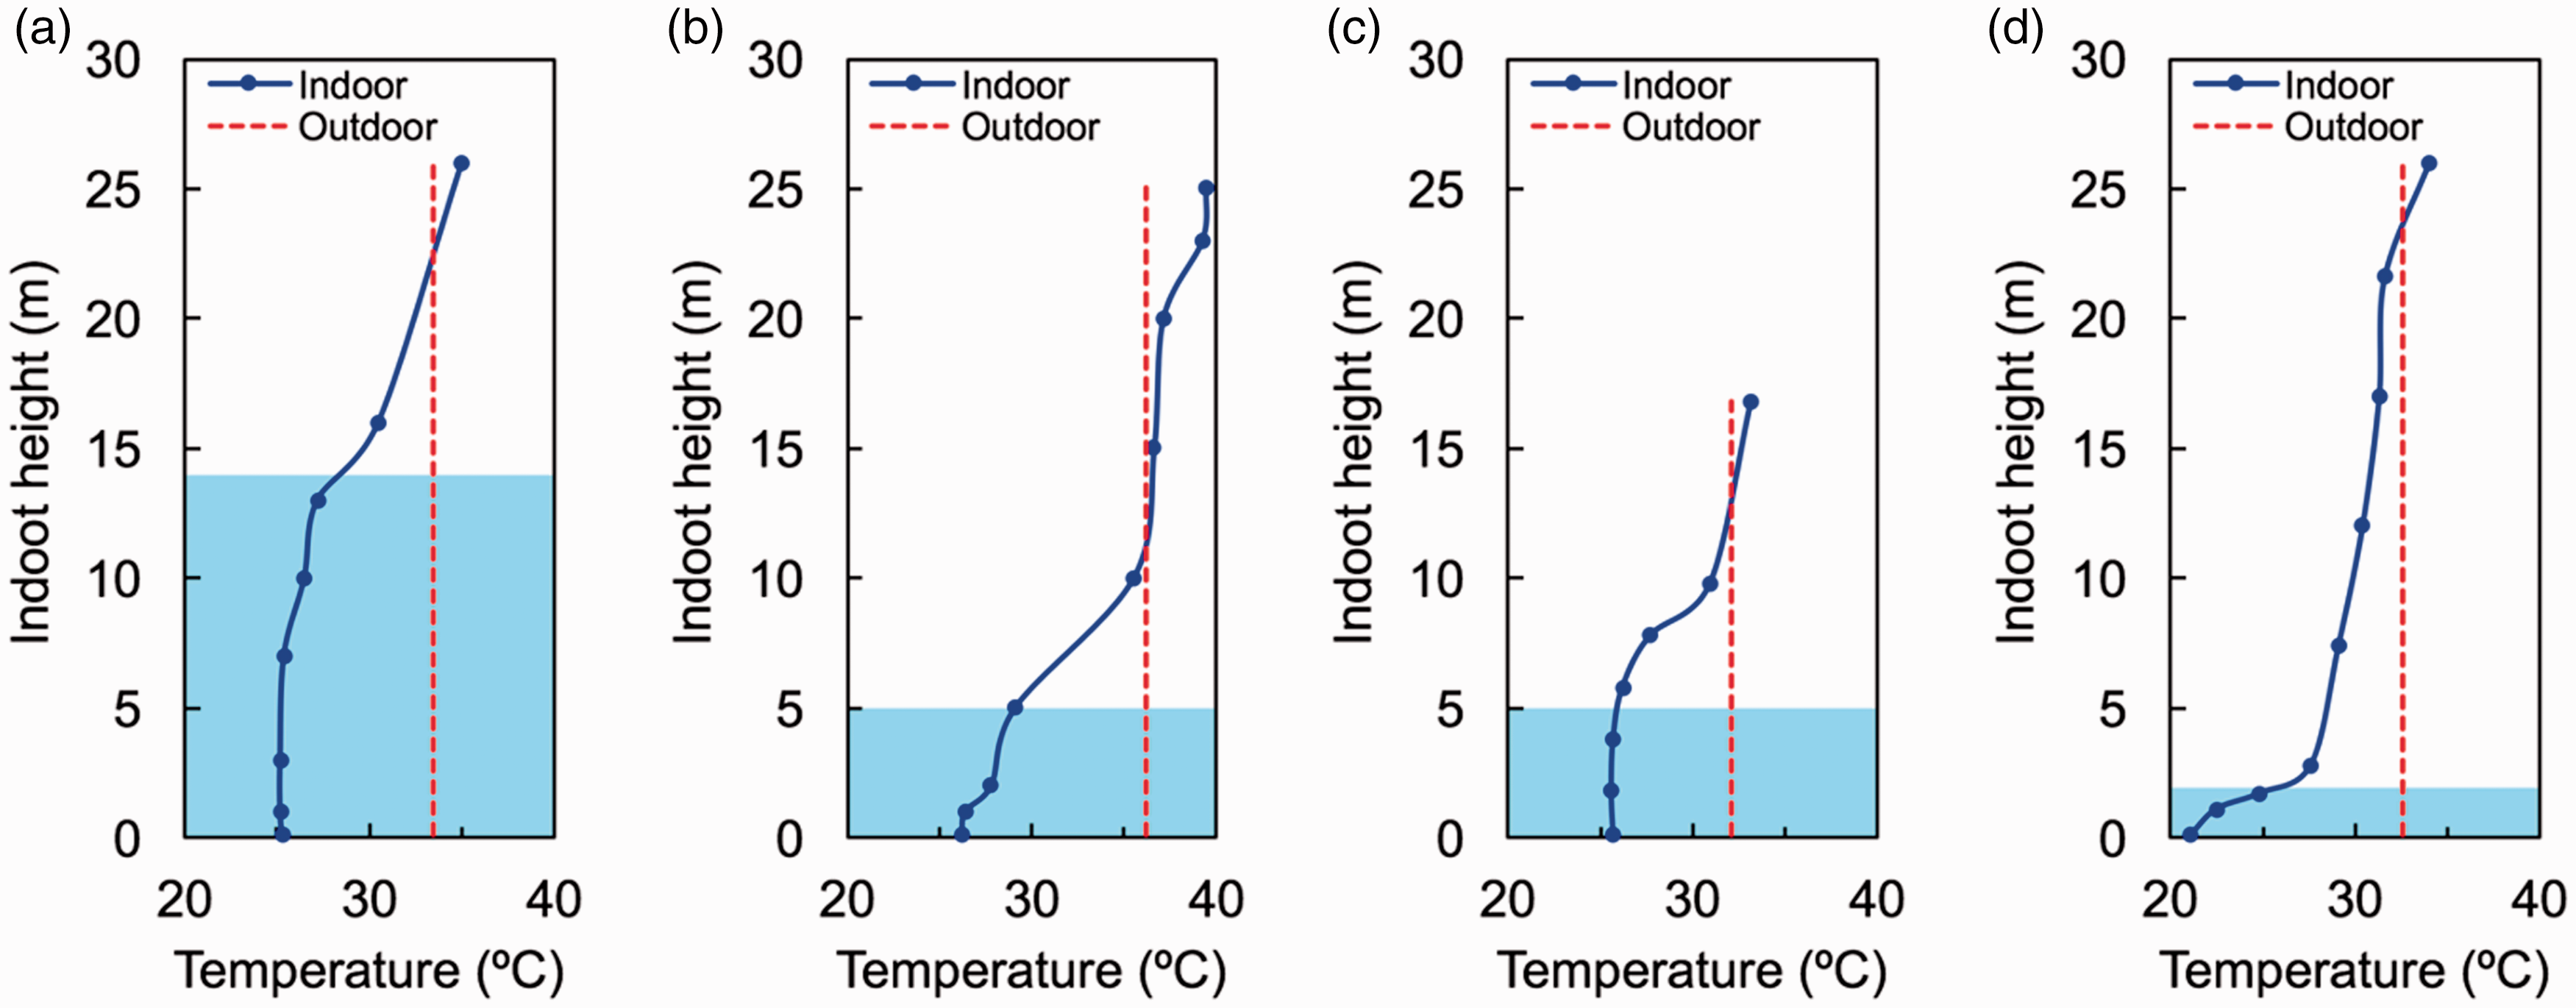
Figures 6 and 7 illustrate the vertical distribution of air temperature and humidity ratio in large spaces of the check-in halls, respectively. The air temperature and humidity were measured and recorded when the outdoor temperature was close to their respective design values during the on-site measurement. The light blue areas in these figures indicate air-conditioning controlled spaces in each check-in hall, which have been illustrated previously in Figure 3. Each of the large space has a non-uniform indoor environment in the vertical direction, which shows obvious thermal and humidity stratifications. The air temperature and humidity were relatively uniform in the air-conditioning controlled spaces in the airport terminals A2, B2 and C2, where the jet ventilation with nozzle outlets were applied in all these places. As for airport terminal C3 in Figures 6(d) and 7(d), the radiant floor and displacement ventilation, which directly produced cooling of the bottom of the indoor space, had created obvious thermal and humidity stratifications even in the occupant zones. Furthermore, the air temperature and the humidity at the upper space were all higher than those in the occupant zones and close to their respective outdoor values. These distributions had been explained in our previous research, that was due to the dominant buoyancy-driven flow of air infiltration in the large space of an airport terminal. 6 The research had confirmed that the outdoor air infiltrates through the walkway doors and skylights at the top and flows out through the opening gates on different floors in the space cooling condition. Besides, the air temperature at the upper space would be even higher than the outdoor air temperature, which had resulted from the solar irradiation on the roofs in the daytime and some heat sources (such as lights) in the upper spaces.
Vertical distribution of air temperature in the check-in halls of airport terminals: (a) A2, (b) B2, (c) C2 and (d) C3.
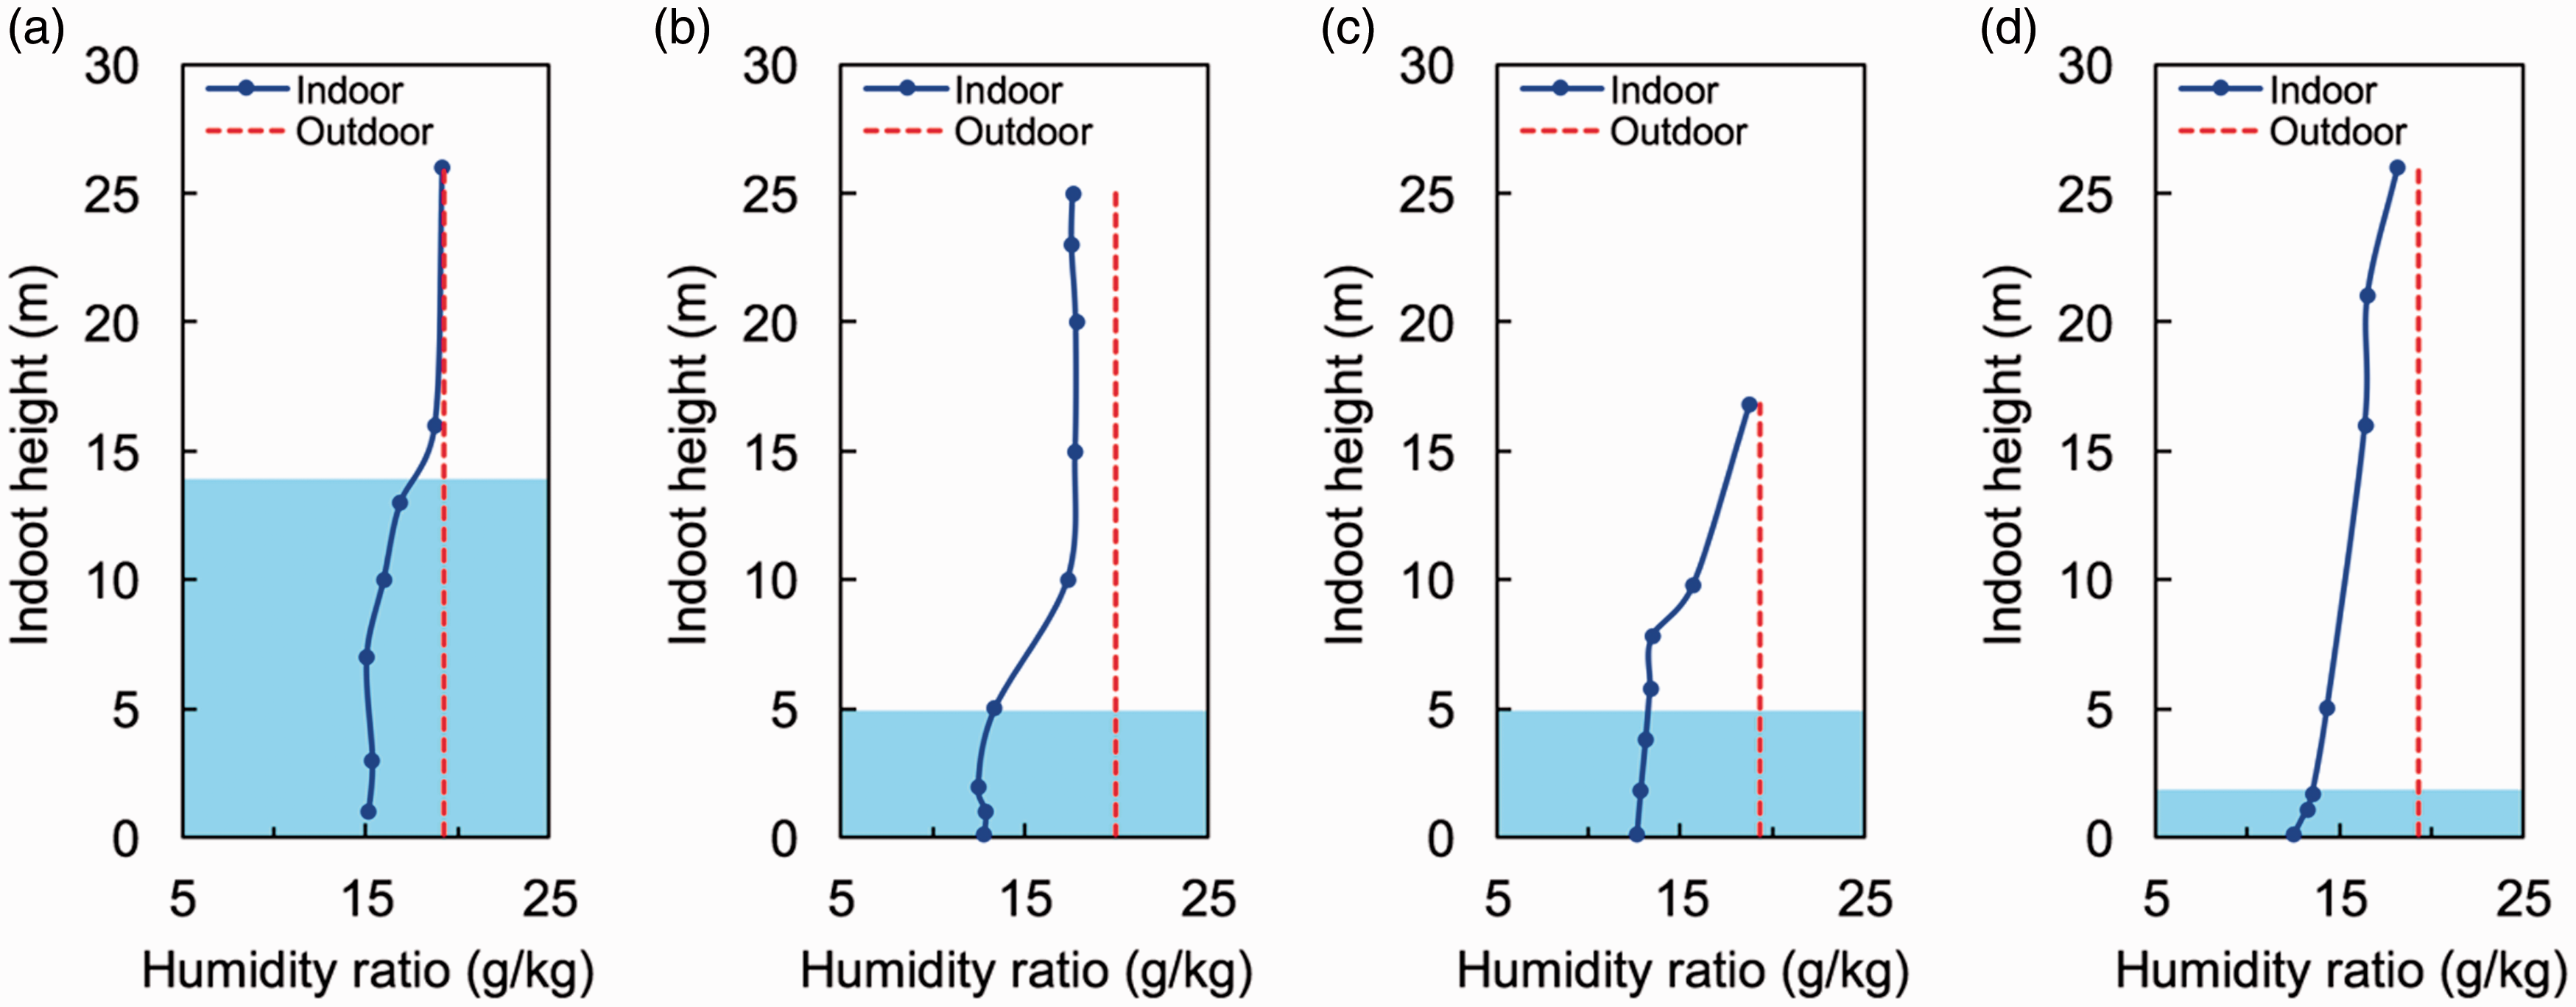
Vertical distribution of humidity ratio in the check-in halls of airport terminals: (a) A2, (b) B2, (c) C2 and (d) C3.
CO2 concentration
Figure 8 illustrates the CO2 concentrations in the typical occupant zones of the measured airport terminals during the operation time, which indicates the freshness of indoor air. The average values of CO2 concentration in the measured airport terminals were 563–688 ppm. During the majority of the time, CO2 concentrations were below the upper limit (1000 ppm) stipulated by the Chinese standard, GB50736–2012. 24 Those data exceeding the standard were measured in the security check areas which have high occupant densities. The common situation of low CO2 concentrations reflects the introduction of excessive outdoor air in these airport terminals. These on-site investigations showed that the opening of the mechanical fresh air valves in the AHUs almost maintained at a low level (0–15%). Thus, there was a considerable amount of unorganised outdoor air infiltrating into the airport terminals, which was also confirmed in the case study. 6
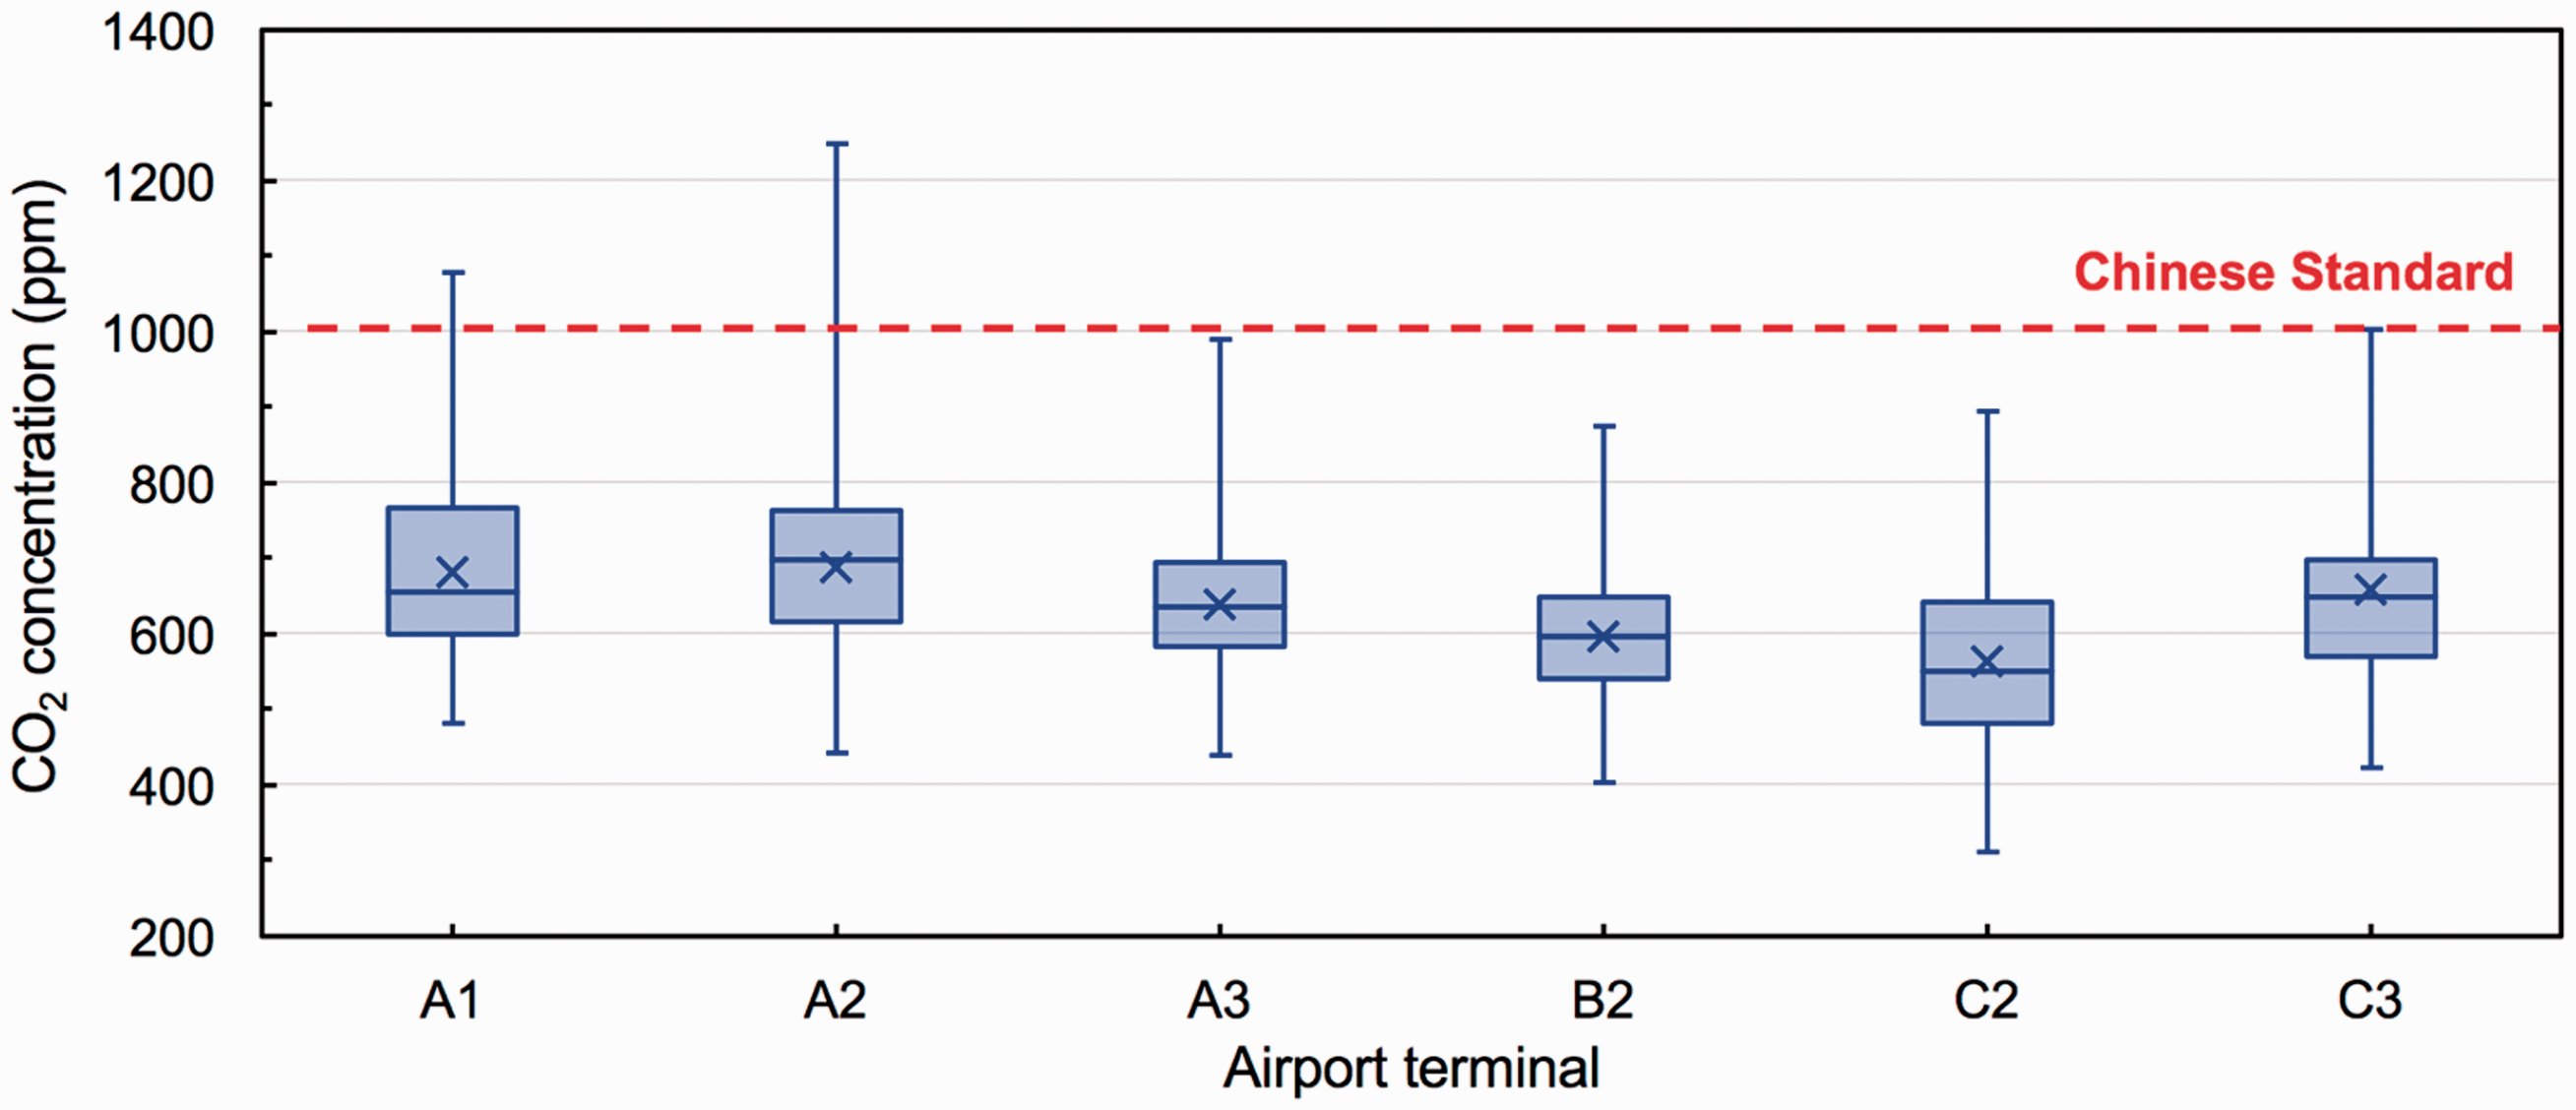
CO2 concentrations in the occupant zones of the airport terminals.
Energy performance of air-conditioning systems
Figure 9 illustrates the electricity consumption in the measured airport terminals. The average annual electricity consumption per floor area was 177 kWh/(m2 · year), which was 2.2 times the value of commercial office buildings in China. 34 About 30–60% of the total electricity was consumed by air-conditioning systems in these airports (i.e. the equipment in cooling plants and the terminal devices in airport terminals). Thus, the energy performances of cooling plants (i.e. chillers, air-conditioning water pumps and cooling towers) and terminal devices in large spaces of airport terminals were determined and evaluated during a typical week in the cooling season (Figure 10).
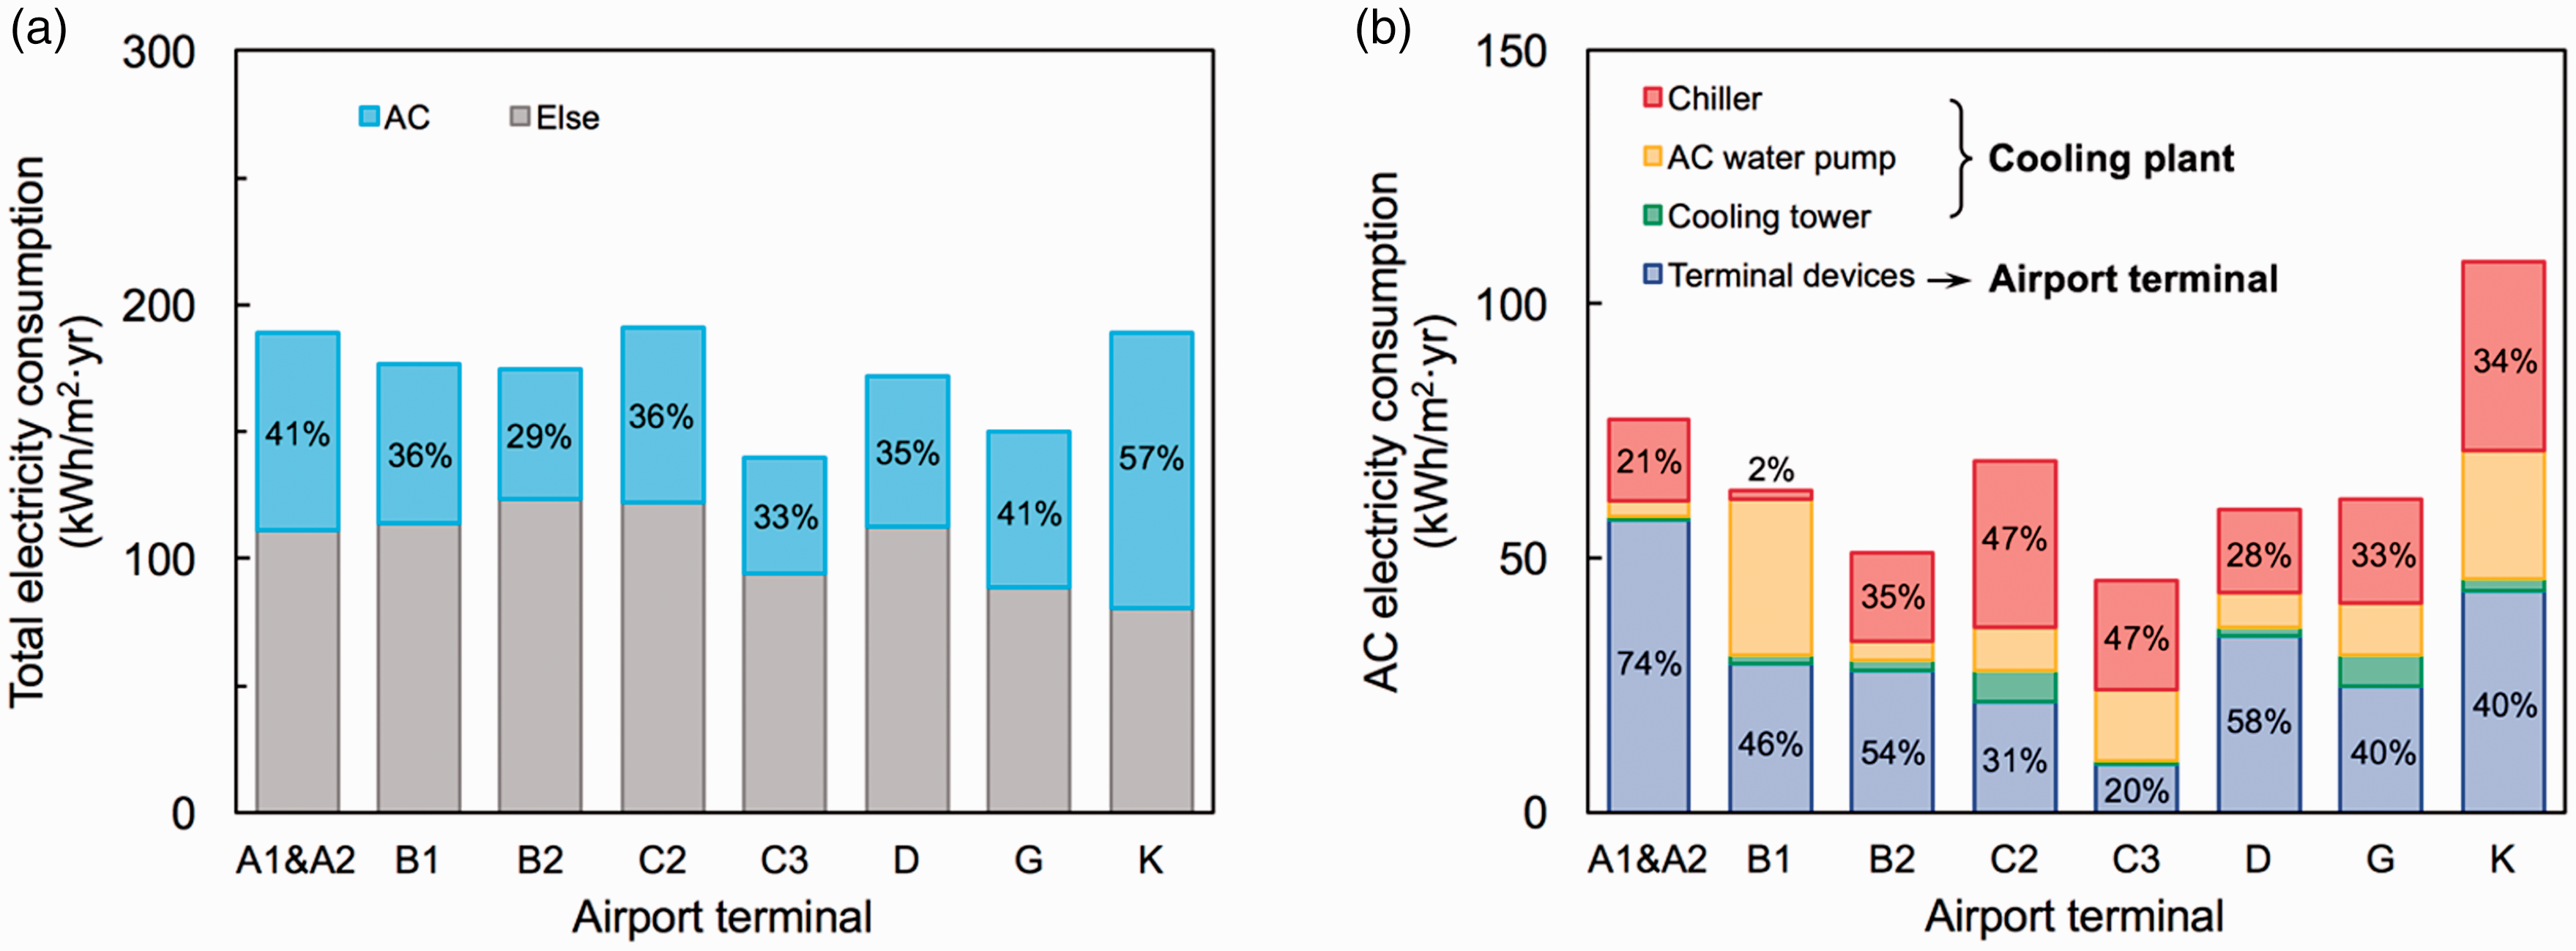
Annual electricity consumption in typical airports: (a) total electricity consumption and (b) electricity consumption of air-conditioning systems.
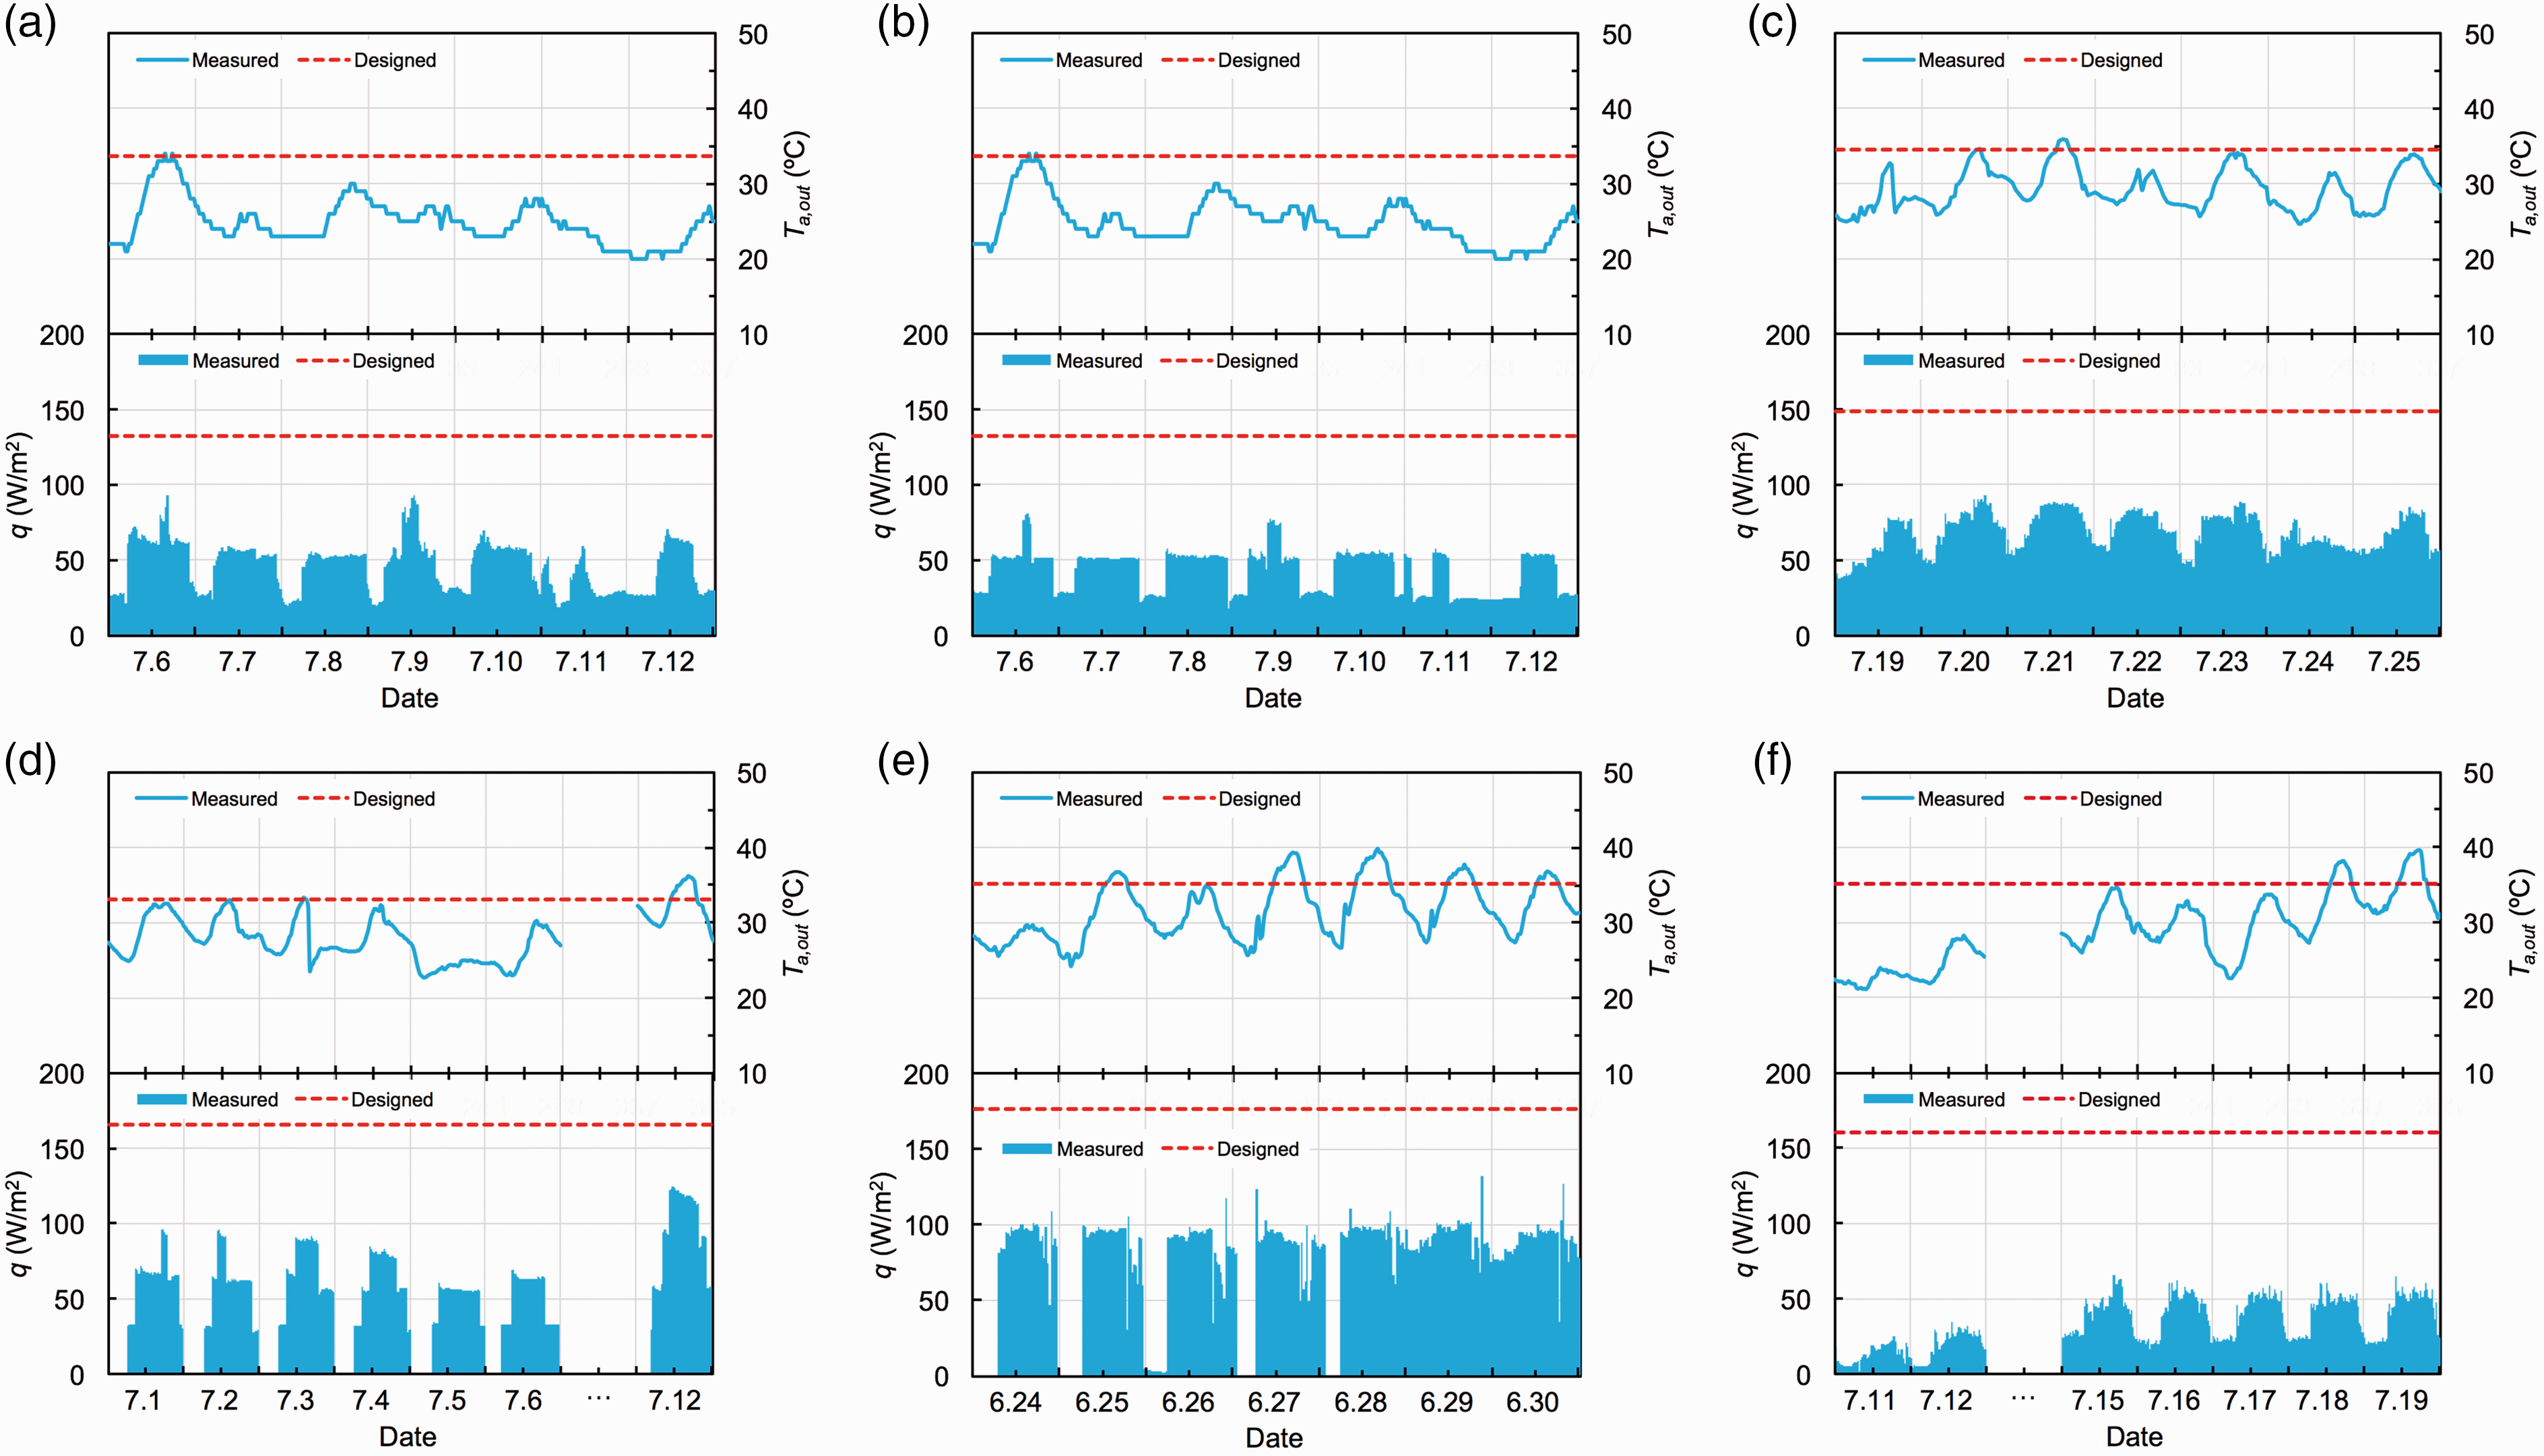
The outdoor temperature and total cooling capacity per air-conditioning controlled area in the measured airports: (a) A1, (b) A2, (c) A3, (d) B2, (e) C2 and (f) C3.
Key devices in cooling plants
The task of a cooling plant is to supply chilled water to its corresponding airport terminal; therefore, the chillers, as the cold source of air-conditioning systems, have an essential influence on the energy performance of cooling plants.
As shown in Table 1, centrifugal chillers are the most widely used type of chillers in the measured airport terminals. The COPs of the centrifugal chillers in the measured airport terminals are all listed in Table 3. The COP in the chilled water condition ranges from 3 to 7. Furthermore, the COP is closely related to the operating condition of chillers, especially the temperature of chilled water in evaporators and the temperature of cooling water in condensers. Figure 11 illustrates the influence of the chilled water temperature and cooling water temperature on centrifugal chillers’ COP in airport terminals A1, A2, B2, C2 and C3. The outlet temperature of chilled water was about 6–14 °C and the inlet temperature of cooling water was about 25–34 °C. An operating condition with higher chilled water temperature and lower cooling water temperature could increase the COP of centrifugal chillers. However, the designed temperature of supply chilled water was about 3–7 °C, as shown in Table 1, which determined the cooling and dehumidification ability of terminal devices in airport terminal buildings. Therefore, although a higher chilled water temperature has the potential to improve the performance of centrifugal chillers, it may burden the terminal devices in airport terminal buildings and influence the indoor thermal environment, which were further analysed and discussed in the ‘Discussion’ section.
Energy efficiency performance of main devices in air-conditioning systems of studied airports.
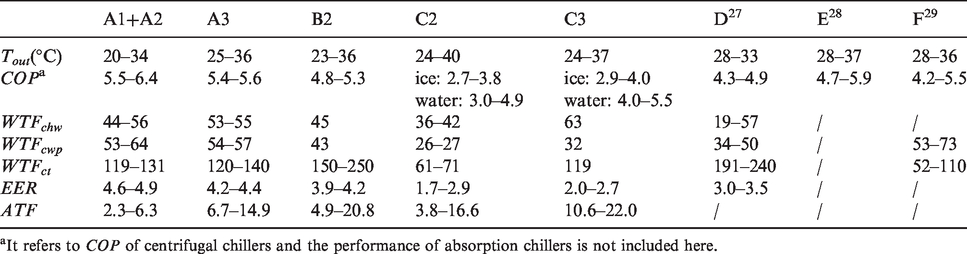
aIt refers to COP of centrifugal chillers and the performance of absorption chillers is not included here.
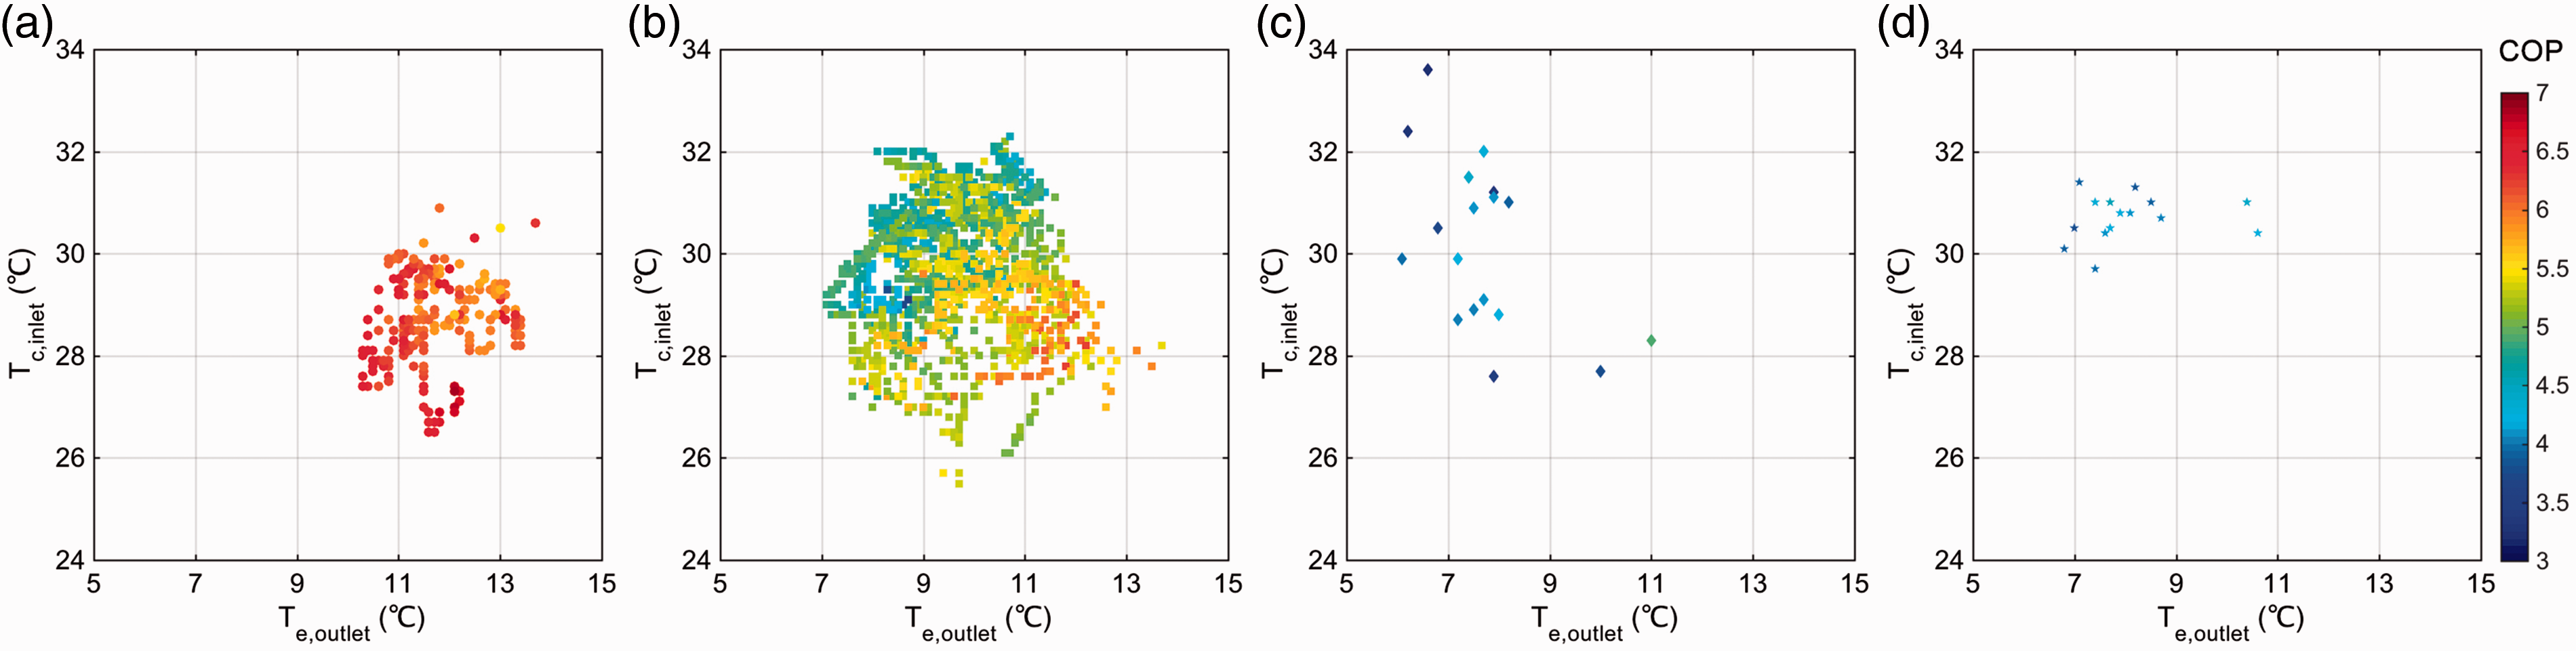
COP of centrifugal chillers in the chilled water condition in the measured airports: (a) A1 and A2, (b) B2, (c) C2 and (d) C3.
As for the ice storage systems (such as in C2 and C3), the COP of the chillers is only about 2–4 in the ice storage condition, as shown in Table 3. The outlet temperature of glycol (as the refrigerating medium) ranges from −4.9 °C to −0.1 °C in the chillers of C2 and C3. Thus, there is a lower evaporation temperature of chillers in the ice storage condition than that in the chilled water condition, which leads to a lower COP. However, the ice storage system has advantages in shifting power consumption at peak hours during the daytime to the nighttime and reducing the total installed capacity of chillers.
Since there is always a long distance between the cooling plant to the airport terminal building, the distribution system of the air-conditioning system also needs to be investigated in detail. The WTF of key devices in the measured airport terminals are also listed in Table 3. The WTF of chilled water pumps (chw) and cooling water pumps (cwp) were all about 20–70, which means the energy consumption proportions of these two parts are similar. Besides, according to the recommended standard,18,19 the minimum limit values of WTFchw and WTFcwp are 35 and 30 respectively, which means the air-conditioning water pumps in the measured airport terminals almost worked in good conditions. The WTF of cooling towers (ct) ranged from 50 to 250, which was obviously higher than those of the air-conditioning water pumps. Furthermore, all the WTF of key devices in the distribution systems were higher than the COP of chillers. Thus, the distribution system would have less influence on the total energy consumption of the cooling plant than the chillers.
Furthermore, the EERs of the cooling plants in the measured airport terminals are also listed in Table 3. The EER of these cooling plants ranges from 1.7 to 4.9. Concerning the recommended cooling plant efficiency in the literature, 35 the EER higher than 4.25 is at a good level, while those lower than 3.5 need to be improved. Airport terminals A1 and A2 shared a cooling plant, and their cooling plant efficiency was at a good level, because they supplied high-temperature chilled water (10.3–15.6 °C). Besides, airport terminals C2 and C3 were all installed with ice storage systems and had low COP of chillers, which led to an obvious lower EER of cooling plants than other measured airport terminals. Since chillers account for about 70–90% of the total electricity consumption in cooling plants of measured airport terminals, the improvement of the cooling efficiency of chillers is significant for energy saving in the cooling plants of airports.
Terminal devices in large spaces
As shown in Table 1, AHUs with jet nozzles are the most commonly adopted terminal devices in large spaces of the measured airport terminals. The performance parameters of AHUs in airport terminals A1, A2, A3 and B2 are illustrated in Figure 12, which takes the volume flow rate of air as the X-axis. The design overpressure of supply air (Δp) was about 400–900 Pa, which had resulted in the high electricity consumption of fans in AHUs. The designed ATF almost ranged from 5 to 30 while the measured ATF was lower (2–20); and the ATF in the recommended standard given by GB/T 17981–2007 18 is 8. The physical meanings of chillers’ COP and AHUs’ ATF are quite similar, but the ATF was close to or even lower than the COP in our on-site measurements, as shown in Table 3. Therefore, the energy efficiencies of chillers and AHUs are equally important for the energy conservation of air-conditioning systems in airports.
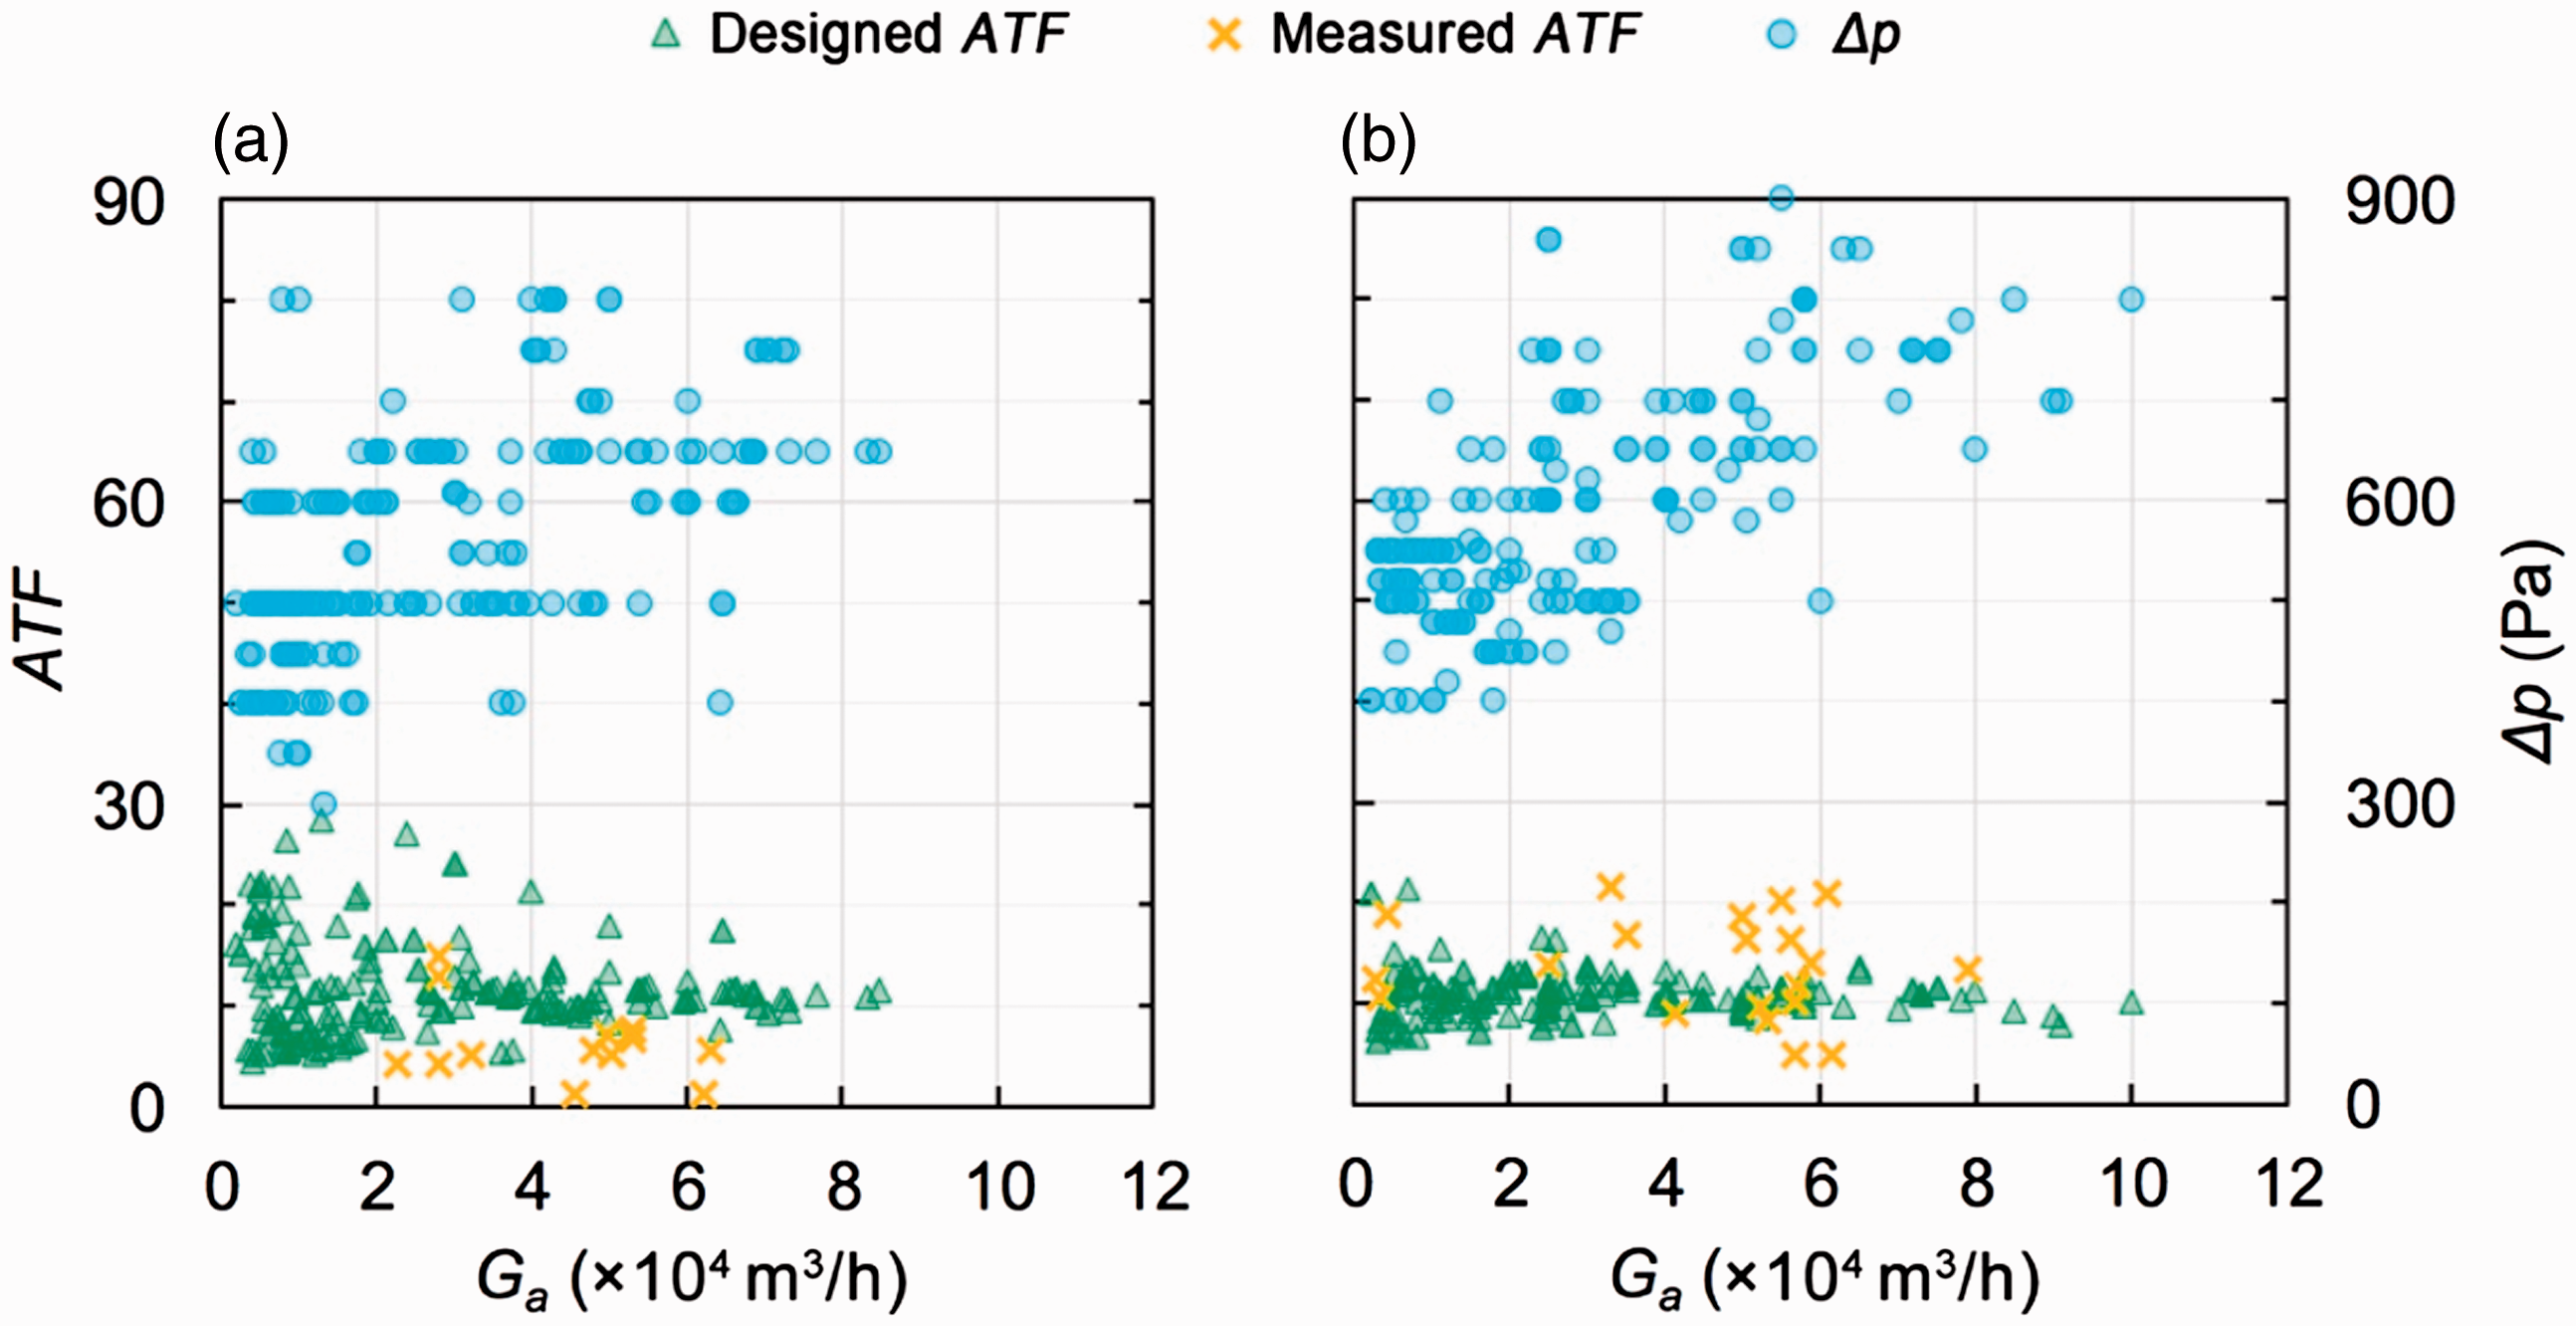
Performance parameters of AHUs in airport terminals: (a) A1, A2 & A3, and (b) B2.
Furthermore, the temperature of chilled water from the cooling plant can influence the performance of AHUs. Figure 13 illustrates the temperature of chilled water or glycol in various locations of the HVAC distribution systems. First of all, large temperature differences between outlet chilled water of chillers and inlet chilled water of AHUs generally existed in the measured airport terminals. The chilled water mixing (such as bypass water from non-working chillers and the balance pipe of the distribution system) raised the chilled water temperature from chiller and decreased the cooling and dehumidification ability of AHUs. The inlet chilled water temperature of AHUs in airport terminals A1 and A2 were 11.6–16.4 °C and 12.9–16.5 °C, respectively, while the design values were all 7 °C, as shown in Figure 4, which can explain the high humidity level of the indoor environment in these airport terminals, as previously shown in Figure 5. Besides, although the high temperature chilled water could benefit the COP of chillers, it reduced the cooling and dehumidification ability of AHUs, which resulted in extremely low ATF of 2.3–6.3. Therefore, there is a trade-off between the COP of chillers and ATF of AHUs, which is determined by the chilled water temperature.
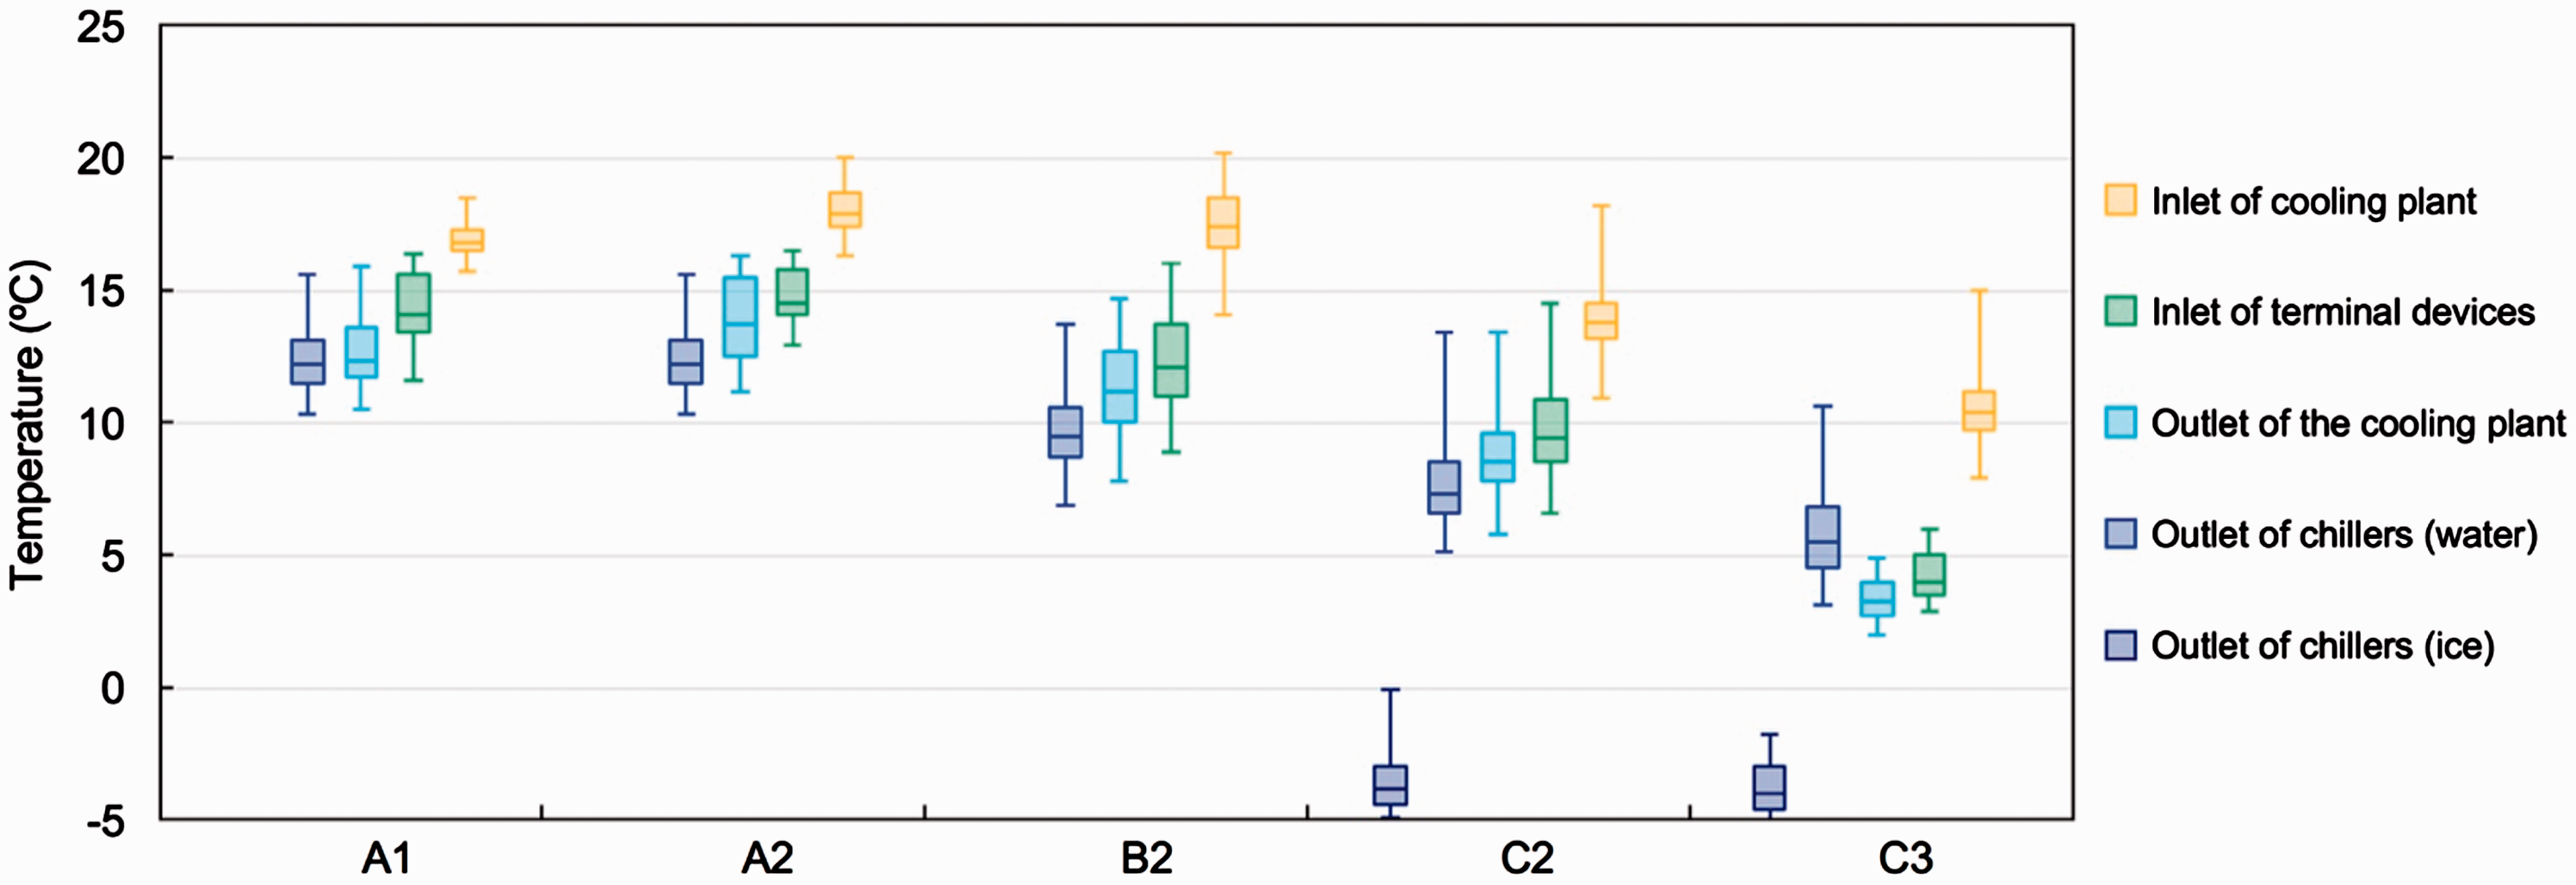
The temperature of chilled water (glycol) in various locations of air-conditioning distribution systems.
Discussion
Based on the on-site measurement of the indoor environment and the energy performance of air-conditioning systems, the typical operation situation of air-conditioning systems in airport terminals can be concluded, and some key issues need to be discussed further in order to improve the energy efficiency.
High energy consumption of terminal devices in airport terminals
Chillers are commonly believed to consume the largest proportion of electricity in air-conditioning systems. However, the terminal devices in airport terminals sometimes have higher electricity consumption than those of chillers. Figure 9(b) illustrates the composition of electricity consumed by air-conditioning systems in measured airport terminals and the airport terminals D, 27 G 30 and K7 from the literature. Except for airport terminal B1 which was predominantly cooled by absorption chillers, chillers accounted for 21–47% of the electricity consumption while terminal devices accounted for 20–74%. The most widely adopted type of air-conditioning system is the cooling plant with centrifugal chillers plus the jet ventilation with nozzles outlets in large spaces of the airport terminal building (A1, A2, B2, D and K), in which the terminal devices contributed 40–74% of the total electricity consumed by air-conditioning systems. Therefore, there is a need for a further consideration on the energy performance of terminal devices.
First of all, as was mentioned before, there is a trade-off between the energy performance of cold sources (chillers) and terminal devices (AHUs). For example, the cooling plant of airport terminal A1 and A2 supplied high temperature chilled water, and the electricity consumption of terminal devices is 57 kWh/(m2·yr), which is much higher than that of the cooling plant (20 kWh/(m2·yr)). As for B1, B2, C2, D, G and K, the electricity consumption of terminal devices is only 22–44 kWh/(m2·year). Therefore, the chilled water temperature in conventional air-conditioning systems of airport terminals should not be set too high. This would probably improve the performance of chillers, but at the expense of the energy performance of terminal devices (Figure 12) and even the indoor thermal environment (Figure 5).
Furthermore, new types of terminal devices, such as radiant floor and displacement ventilation, have lower energy consumption than the conventional type (jet ventilation with nozzle outlets). As shown in Figure 9(b), the electricity consumption of terminal devices in airport terminal C3 was only 9 kWh/(m2·year), which saved 34% of the air-conditioning electricity consumption compared with the average value. There are several reasons for this energy-saving potential. First, the radiant floor and displacement ventilation system only controlled the occupant zones, which could significantly reduce the air-conditioning controlled space in airport terminals, as shown in Figures 3 and 6. Besides, previous research
36
also pointed out that radiant floors could achieve outstanding performance, especially in operating cooling loads caused by solar irradiation and high-temperature envelopes, which are intensive in large spaces with glazing envelopes in airport terminals. Moreover, the essential difference between these two terminal devices is the flow medium to transport cooling capacity. Radiant floors use high-temperature chilled water to transport cooling capacity directly to the indoor space. On the other hand, the air in AHUs is cooled and dehumidified by the chilled water first and then supplied to the indoor space. Therefore, a similar definition of water transport factor of radiant floors (WTFRF), as shown in equation (7), can be used to perform a comparison of energy performance with the ATF of AHUs.

Because radiant floors only operate the sensible heat in airport terminals (avoiding condensation on their surfaces), the ATF in equation (6) is transformed into equation (8) under the dry condition for a fair comparison with WTFRF.
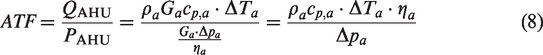
The parameters in equations (7) and (8) are listed in Table 4, which were based on the design parameters of airport terminal C3. 16 WTFRF is about 3–15 times of ATF, which means water has a higher transport capacity than air. Therefore, radiant floors have a high potential to reduce the energy consumption of terminal devices to operate the sensible heat in airport terminals.
Performance comparison of sensible heat handling devices transported by air (AHU) and water (radiant floor).
aωa = 12.6 g/kg.
Discrepancy of capacities between cold sources and terminal devices
In the design process of air-conditioning systems, the cooling loads of terminal devices in each area of an airport terminal were calculated respectively with the consideration of the worst condition (i.e. the most crowed, hottest, the most intense solar radiation). Then, these designed cooling capacities were directly summed up to obtain the designed cooling capacity of the cold source in the cooling plant. Figure 10 illustrates the measured and designed cooling capacity of a typical week in the cooling plants of airport terminals A1, A2, A3, B2, C2 and C3. The designed cooling capacity per air-conditioning controlled area ranged from 132 W/m2 to 176 W/m2, while the average values in the operation time were only 43–90 W/m2. When the outdoor temperature reached the design value, the actual cooling capacities were only 56–69% of their respective design capacity; even when outdoor temperature exceeded the design, the maximal cooling capacity values were only 61–75% of their respective design capacity. These results demonstrate that the measured cooling plants all operated in the partial load condition. Thus, the current design method mentioned above could have exaggerated the designed cooling capacity of the cold source.
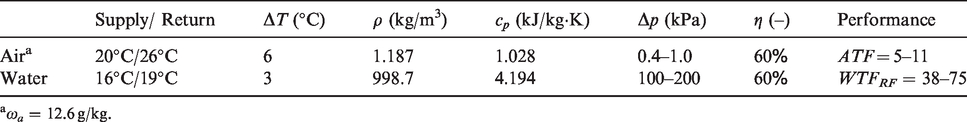
From the perspective of terminal devices in the airport terminal, Figure 14 compares the measured and designed cooling capacity of AHUs in typical areas of the airport terminal B2. The data were collected when the outdoor air temperature was 35.5 °C, which exceeded the design value of 33.1 °C. The ratios of measured and designed cooling capacities of AHUs ranged from 46% to 91%. Thus, the actual cooling capacities of AHUs vary over a wide range instead of always being the design capacities of the worst condition. The variation of AHUs’ cooling capacities mainly had resulted from the occupancy rates in an airport terminal, as was analysed in the previous research. 37 An airport terminal is not always fully occupied as it is in the design condition. Therefore, the uneven occupant distribution both in time and space would cause dramatic variation in the actual demand for cooling load.
Comparison between the measured and designed cooling capacity of AHUs in airport terminal B2. (when measured cooling capacity from the cooling plant was 120 W/m2 with outdoor air of 35.5 °C).
The on-site measurement results indicate a significant discrepancy of capacities between cold sources and terminal devices. The terminal devices operate according to their respective cooling demands in various areas of the airport terminal and achieve their design capacities at different time. However, the output capacity from the cooling plant is relatively constant and lower than each maximal capacity of terminal devices in the airport terminal. Therefore, the cooling capacity of each terminal device should have the ability to be adjusted over a wide range in order to match the varying cooling demand. Furthermore, the designed cooling capacity of the cooling plant is supposed to be reconsidered to cope with the prevailing situation of a low load rate. A partial load coefficient could be applied to reduce the designed cooling capacity of the cooling plant appropriately. Otherwise, chillers and distribution systems should also have the ability to be adjusted and should be operated with high energy efficiency even at a low load rate. Thus, the research into feasible strategies to cope with this discrepancy of capacities is still needed in the further.
Conclusion
Airport terminals have a higher level of energy consumption than common buildings, in which the air-conditioning systems account for the largest proportion. Large-scale on-site measurements were performed to investigate energy consumption and indoor environment in typical Chinese hub airports. This paper aims to analyse and compare air-conditioning systems in these airport terminals, with an emphasis on the cooling performance and their key restrictions. The conclusions are summarised as follow:
The average annual electricity consumption in the measured airport terminals was 177 kWh/(m2·year), in which the air-conditioning systems consumed 30–60%. The measured COP of centrifugal chillers was 2.7–6.4 in chilled water condition, while the ATF of AHUs was 2.3–22.0. The electricity consumed by AHUs accounted for 40–74% of the total electricity consumption of air-conditioning systems. Therefore, energy-saving technologies should be considered for terminal devices of air-conditioning systems in airport terminals. Temperatures in occupant zones were basically controlled within 24–26°C. The relative humidities in some airport terminals were consistently higher than 70% due to high-temperature chilled water supplied by chillers and chilled water mixed in the distribution system. The average CO2 concentrations were 563–688 ppm, which indicated a considerable amount of unorganised air infiltration. The thermal stratification commonly existed in large spaces in airport terminals; these are closely related to the terminal devices of air-conditioning systems. The energy performance of air-conditioning systems in airport terminals can be improved by reducing the total cooling demand and increasing the energy efficiency. The occupant zone air-conditioning system (i.e. radiant floor + displacement ventilation) is adopted in airport terminal C3. The air-conditioning controlled height could be reduced from 4 – 6 m to about 2 m, and the radiant floor has a higher transport efficiency that the commonly-used air handling unit. Thus, this system could save 34% of the air-conditioning electricity consumption. There was a significant discrepancy in the capacities between cold sources and terminal devices. In the cooling plants, the designed cooling capacities were 132–176 W/m2, while the average measured values were only 43–90 W/m2, and this was because each terminal device in the airport terminal could achieve its design capacity at different time. Therefore, the cooling capacity of each terminal device should have the ability to be adjusted over a wide range to match the varying cooling demand. Besides, the designed cooling capacity of the cooling plant is supposed to cope with the common situation of a low load rate.
Supplemental Material
IBE891645 Supplemental Material - Supplemental material for An investigation of the cooling performance of air-conditioning systems in seven Chinese hub airport terminals
Supplemental material, IBE891645 Supplemental Material for An investigation of the cooling performance of air-conditioning systems in seven Chinese hub airport terminals by Xiaochen Liu, Xiaohua Liu, Tao Zhang and Lingshan Li in Indoor and Built Environment
Footnotes
Authors’ contribution
XL conducted the on-site measurements, analysed the data and drafted the article. XL and TZ supervised the measurements, reviewed the manuscript and provided comments for revision of the article. LL participated in the on-site measurements and analysed the data of the airport terminals A1 and A2.
Acknowledgements
The authors would like to thank Lin Lin for participating in the on-site measurements. The airport staff are gratefully acknowledged for their kind help during the on-site measurement.
Declaration of conflicting interests
The author(s) declared no potential conflicts of interest with respect to the research, authorship, and/or publication of this article.
Funding
The author(s) disclosed receipt of the following financial support for the research, authorship, and/or publication of this article: The research described in this paper was supported by the National Key Research Program of China (Grant No. 2018YFC0705001) and National Natural Science Foundation of China (Grant Nos 51878369, 51638010 and 51521005).
Supplementary material
The method for the measurement of the key devices in the air-conditioning system is given in the online supplementary material.
References
Supplementary Material
Please find the following supplemental material available below.
For Open Access articles published under a Creative Commons License, all supplemental material carries the same license as the article it is associated with.
For non-Open Access articles published, all supplemental material carries a non-exclusive license, and permission requests for re-use of supplemental material or any part of supplemental material shall be sent directly to the copyright owner as specified in the copyright notice associated with the article.