
Abstract
The influence of work groups (the number of occupants sharing an office) on occupant satisfaction with workplace environments was compared between commercial buildings and academic buildings. Using the Building Use Studies (BUS) methodology, a sample of 5000 surveys was collected over a 12-year period from 67 buildings around the world. In both academic and commercial buildings, solo offices (single occupant) obtained the best scores regarding productivity, overall comfort and health. Academics most disliked middle-sized open-plan offices (shared by 6 to 9 occupants), while in commercial buildings, office occupants most disliked large open-plan offices (shared by over 9 occupants). Occupants had higher productivity and perceived health in commercial buildings than those in academic buildings in all work groups. Productivity decreased as the number of occupants in the office increased in both academic and commercial buildings for all work groups except for middle-sized open-plan offices. Age had a significant influence on occupant perception in different work groups, when comparing commercial and academic buildings. Trivial differences regarding the effect of gender on occupant perception in commercial and academic buildings were also identified. The findings of this study points to the significance of office sharing in influencing high-performance working environments, especially in relation to open-plan layouts.
Keywords
Introduction
Considering building life cycle assessment, total salary costs of organisations far outweigh operational, capital and rental costs, which reinforces the importance of performance evaluation of buildings in use from occupants’ perspectives. 1 A positive correlation between occupant satisfaction with the working environment and employee work productivity has been reported in the past.2,3 As a result, occupant productivity and overall comfort should not be ignored. Occupant satisfaction with the working environment is particularly crucial for organisations to retain talented and skilled workforces. 4
Innovative and stimulating workplace environments are needed to accommodate rapid changes of working styles and support future office concepts. Cognitively complex, team-based and collaborative working styles have shifted the interests of organisations and building designers towards open-plan office layouts. 5 Open-plan offices, in contrast to traditional solo offices, contain a greater number of occupants at separate workstations, whereas solo offices accommodate one or two occupants in private rooms. 6 By eliminating walls, open-plan offices are intended to create a permeable set of boundaries between occupants and collaborating groups that can enable faster and easier communication. To increase occupancy density and reduce fixed overheads, many organisations prefer open-plan layouts over solo offices.6,7 While being aesthetically more pleasing, open-plan offices are also easier to reconfigure and promote collaboration and communication among co-workers. 8 Open-plan layouts may also be beneficial in terms of promoting social values and having all staff, including directors and employees working in a single open-plan office room. 9
Solo offices, on the other hand, enhance visual and auditory privacy, and provide more storage spaces for occupants.10–12 Some studies also reported higher employee concentration in solo offices due to enhanced privacy and fewer interruptions. 13 Due to the nature of open-plan layouts and shared offices, occupants have less control over their indoor environments for adjusting thermal, visual and acoustic comfort. Historically, any reduction of control over an indoor environment has been accompanied by reductions in occupant comfort and productivity.14,15 As a result, solo offices may outperform open-plan layouts in terms of satisfaction with indoor environment quality (IEQ) as a result of occupant’s reduced control in open-plan offices.9,16 In particular, the lack of control over noise and unwanted disruptions has been the main source of concern in open-plan offices. 17 Open-plan offices with high noise levels may impact cognitive performance by reducing concentration, motivation and memory performance. 18
In summary, previous research has shown that solo offices outperform open-plan offices with respect to occupant controls, privacy, noise and unwanted interruptions.10,19 Nonetheless, open-plan layouts may outperform solo offices in regard to factors such as space aesthetics as well as the ease of collaboration, reconfiguration and increasing occupancy density. 20
The dynamic psychological and physiological needs of occupants should be reflected in the design of workplace environments. 21 Previous studies have reported differences in requirements when comparing the nature of commercial to academic office occupational duties. 22 Teamwork is more important in commercial offices, where there is a higher chance of two or more employees working on a single project that requires the exchange of information and ease of communication provided in an open plan office. On the other hand, academics tend to require privacy, particularly in regard to research and publications. Despite these contrasting requirements, concentration and collaboration, the extent of issues related to open-plan office layouts in both commercial and academic buildings has rarely been studied previously. Occupants’ perception of workplace environments is affected by work groups regarding open-plan layouts and solo office environments. 23 However, due to the difference in the nature of the work, the applicability of open-plan layouts in commercial and academic premises should therefore be of critical interest to organisations.
As indicated by the literature review above, there is still a gap in the debate about what type of work groups is best for occupants in commercial and academic buildings. This research aims to investigate whether shared offices influence perceived productivity, comfort and health, and provide a satisfactory environment in academic and commercial buildings. In particular, the influence of environmental, operational and satisfaction scores are analysed using post-occupancy evaluation methods and the impact of office sharing, work groups and building use are scrutinised.
Methodology
To determine these influences and impacts, questionnaire surveys of occupants of a number of academic and commercial buildings were undertaken. Occupant behaviours and expectations from buildings are complex and possess different dimensions of comfort. 24 As a result, occupant satisfaction surveys are often criticised for being a subjective evaluation of building performance. However, as was stated by Gary Raw, ‘People are the best measuring instruments. They are just harder to calibrate’. 25
To minimise the bias from the subjectivity of occupant expectations and overcome the difficulty of calibration, a high response rate should be a target in occupant satisfaction survey studies. Research has shown that perceived satisfaction with indoor environments can significantly influence occupant health, comfort and productivity in many ways.3,26
BUS methodology
The survey consisted of a two-page paper questionnaire developed by Building Use Studies (BUS). 27 The questionnaire has evolved over several decades, from a 16-page format used for the investigation of sick building syndrome in the UK in the 1980s, to a more succinct 2-page version. 28 The BUS Methodology survey was considered relevant, having been effectively applied in various research works worldwide.29–31 The questionnaire consists of two major sections: Background Information and Satisfaction Scores. Background Information concerns basic participant information regarding the age, gender, the time they started working in the building, the location of participant offices in terms of distance to a window, work group, the duration of occupancy in the building, duration at desks and duration at visual display units.
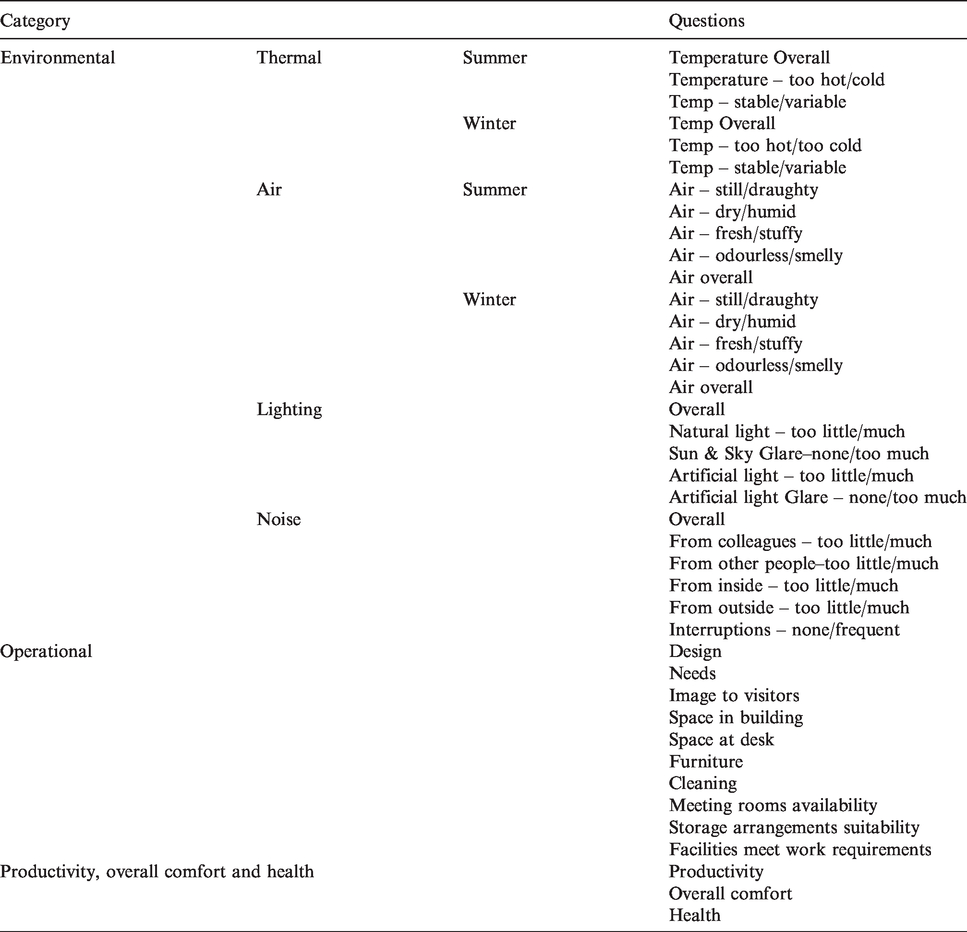
Satisfaction Scores, the second part of the survey, consists of 45 questions requiring scores on a 7-point scale for different building parameters including environmental, operational and productivity, overall comfort and health (Table 1). The 7-point scale response has been designed to cover a wide range of occupant experiences and satisfaction levels. 32 As shown in Table 1, a subset of the BUS Methodology Standard questionnaire has been adopted and this study consists of 40 occupant questions including environmental, operational and satisfaction parameters. 32 Environmental parameters include questions regarding temperature in summer and winter, noise and lighting. The operational parameters seek occupants’ perceptions regarding building image, design, space, safety, cleaning, the availability of meeting rooms and storage. Satisfaction questions address overall perception regarding comfort, health and productivity. A more detailed description and the full text of the BUS survey questions are included in Baird and Thompson. 33 The paper questionnaires were distributed in person to obtain a minimum 75% response rate from each building. A total of 5000 responses were collected from the surveyed buildings.
The subset of the survey questionnaire used in this study.
Data collection
Survey studies were conducted in 67 buildings by the authors and their collaborators over 12 years. The paper questionnaires were distributed in the buildings in person. The responses were collected from the buildings after a designated period of time between five and seven days. Responses were collected from at least 75% of building occupants to ensure results were representative.
Just over half of these buildings in our dataset were located in New Zealand (56.7%) while others were in a range of overseas countries. The number of occupants and building sizes in our dataset varied with the smallest building having 11 occupants and the largest building with 342 staff. The average number of occupants in our dataset was 74.6 (see Table 2). Our dataset consists of only commercial (72%) and academic buildings (28%). The main difference between commercial and academic buildings is that commercial properties are used primarily for business purposes and academic properties are used for university teaching, research and administration.
Studied buildings in the dataset and building specifications.
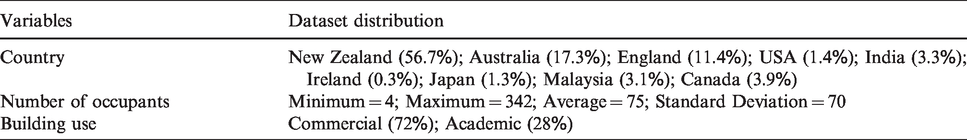
Demographic characteristics of survey participants are included in Table 3. The highest number of responses (37%) were from offices with nine or more occupants (over 9), followed by those in offices (22.6%) with a single occupant (solo). The least number of responses (8%) were collected from offices with two occupants (duo). Most of our survey participants had worked in their buildings (89%) and their offices (82%) for over a year (see Table 4). The majority of our participants worked 5 h a week and eight hours a day in the building.
Demographic characteristics and workstation parameters of participants in the database.

Working in building and at workstation characteristics of the database.
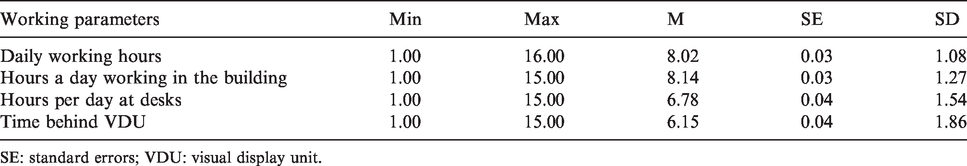
SE: standard errors; VDU: visual display unit.
Data analysis
The study investigates the influence of building use and work groups in occupant perception regarding various environmental parameters including productivity, overall comfort and health. Building use comprises academic and commercial buildings. Work groups consist of five categories as: (1) solo with single occupant, (2) duo with two occupants, (3) 3–4 with three or four occupants, (4) 5–9 with five to nine occupants, and (5) over 9 with more than nine occupants.
A descriptive analysis of all investigated BUS Methodology parameters included in our survey was conducted, which identified indicators such as mean, standard deviation, median, and first and third quartiles for work groups. One-way analysis of variance or ANOVA was then used to verify whether there were any statistically significant differences between the means of different groups in terms of building use and work groups. One-way ANOVA was used in Section environmental parameters, Section operational parameters and Section productivity, overall comfort and health parameters. F-tests were used to determine the equality of means in the two independent groups of commercial and academic buildings and look for differences between two independent groups, calculating associated p-value using a Monte Carlo method. 34 Results were considered statistically significant when p ≤ 0.05.
Sometimes statistical significance measured by p-values is a result of large sample sizes rather than any genuine significant differences. To avoid false interpretation of results, we calculated effect sizes to determine the magnitude of statistically significant differences. 35 Particularly, effect sizes were calculated in sections productivity, overall comfort and health, where the impact of building use and work groups on perceived productivity, overall comfort and health was analysed individually. Effect sizes are a quantitative measure of the correlation between two variables. Effect sizes were calculated using the Spearman rho (ρ) rank-correlation coefficient. The interpretation of the outcome was based on the thresholds given by Ferguson 36 as: ρ < 0.20 – negligible; 0.20 ≤ ρ < 0.50 – small; 0.50 ≤ ρ < 0.80 – moderate; and ρ ≥ 0.80 – large; ρ < 0.20 was considered non-substantive.
The Wilcoxon rank-sum test of pairwise comparisons, followed by factorial ANOVA were conducted considering various pairs of work groups for commercial and academic buildings. Then the effect of gender and age was investigated using factorial ANOVA in Section the effect of age and gender. All statistical analysis was performed using SPSS software version 24 and Jamovi.
Findings
A descriptive analysis of perceived environmental, operational and satisfaction parameters is presented and discussed in the following sections. The influence of both work groups and building use on perceived productivity, overall comfort and health for academic and commercial buildings are also discussed. Finally, the influence of gender and age on results has been studied in last section.
Environmental parameters
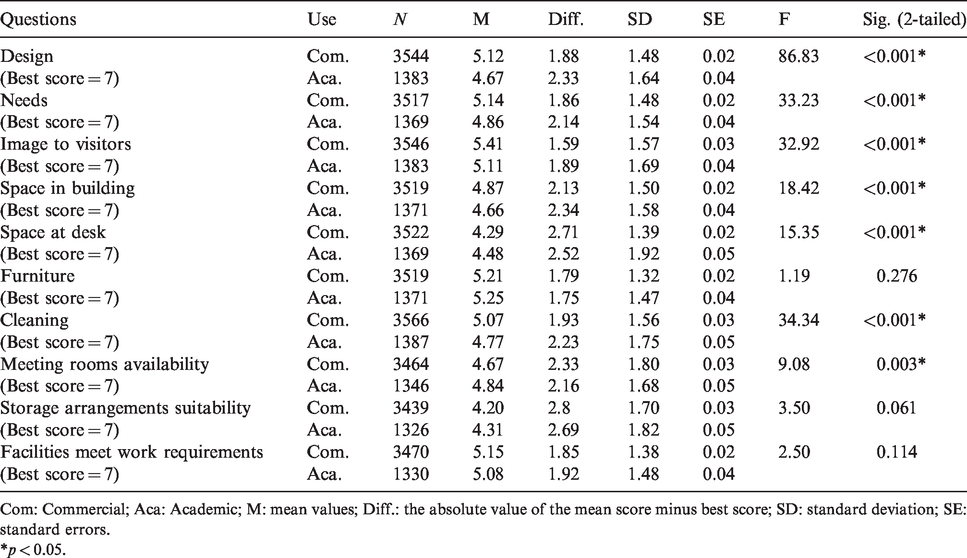
The descriptive and inferential statistics of perceived satisfaction with environmental parameters based on building use were analysed. A comparison of academic and commercial buildings, number, mean, standard deviation, standard errors, F-values and the significance of statistical differences between mean values is presented in Table 5. The absolute difference between mean values and best scores (Diff.) for each category were also calculated for both commercial and academic buildings. The smaller Diff. indicates that the mean score is closer to the best score in that category.
Comparing environmental parameters in commercial and academic buildings.
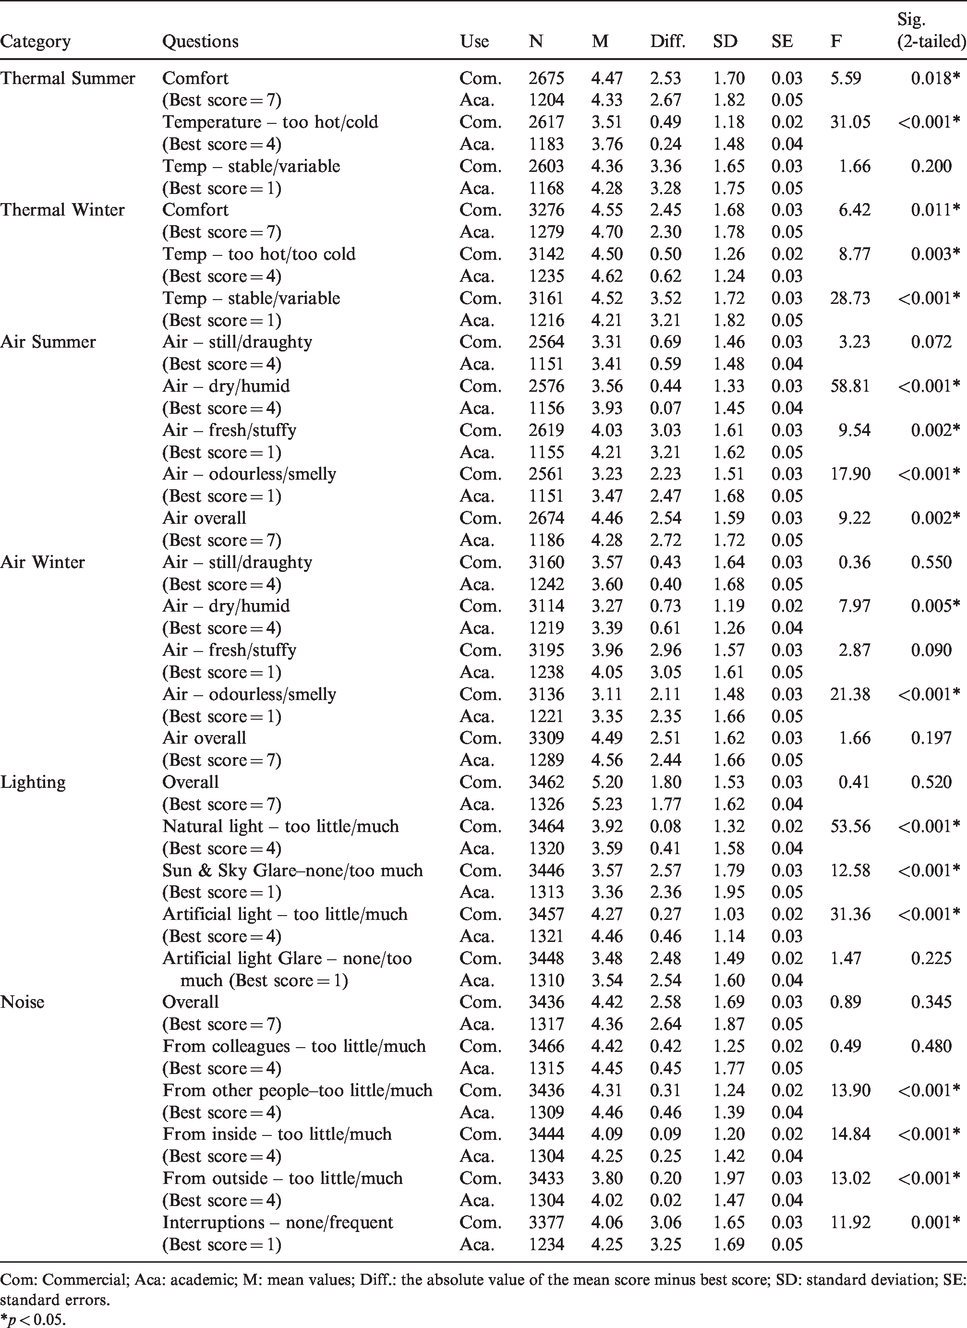
Com: Commercial; Aca: academic; M: mean values; Diff.: the absolute value of the mean score minus best score; SD: standard deviation; SE: standard errors.
*p < 0.05.
In summer, academic buildings obtained a better score in terms of temperature levels (Diff.com = 0.49; Diff.aca = 0.24), while other thermal parameters had a non-significant difference between commercial and academic buildings. In winter, all thermal comfort parameters were significantly different comparing commercial with academic buildings. In winter, academic buildings achieved a better result regarding comfort (Diff.com = 2.45; Diff.aca =2.30) and temperature stability (Diff.com = 3.52; Diff.aca = 3.21), while in terms of winter temperature levels, commercial buildings obtained a more satisfactory score (Diff.com = 0.50; Diff.aca = 0.62).
Regarding air in summer, significant differences between commercial and academic buildings were found in terms of air dryness (Diff.com = 0.44; Diff.aca = 0.07), freshness (Diff.com = 3.03; Diff.aca = 3.21), odour (Diff.com = 2.23; Diff.aca = 2.47) and air overall (Diff.com = 2.54; Diff.aca = 2.72), while scores regarding air in winter varied significantly in only air dryness (Diff.com = 0.73; Diff.aca = 0.61) and odours (Diff.com = 2.11; Diff.aca = 2.35). In both summer and winter, academic buildings obtained better scores than commercial buildings regarding air dryness, while commercial buildings performed much better than academics regarding air odours. Air freshness reached a better score in commercial buildings in summer only.
Although overall results regarding lighting had an insignificant difference (p = 0.52) between commercial and academic buildings, specific questions regarding natural (p < 0.001) and artificial (p < 0.001) lights obtained statistically significant differences comparing the two office types. Survey responses showed that commercial buildings achieved a better performance than academic buildings in terms of both natural lighting (Diff.com = 0.08; Diff.aca = 0.41) and artificial lighting (Diff.com = 0.27; Diff.aca = 0.46).
Overall noise and satisfaction in regard to noise from colleagues attained a very high p-value indicating an insignificant difference (p-value = 0.48) between commercial and academic buildings. Regarding noise from other people (Diff.com = 0.31; Diff.aca = 0.46), inside (Diff.com = 0.09; Diff.aca = 0.25) and interruptions (Diff.com = 3.06; Diff.aca = 3.25), commercial buildings achieve significantly better scores. In terms of noise from outside (Diff.com = 0.20; Diff.aca = 0.02), academic buildings showed a better performance.
To analyse the influence of environmental parameters on the productivity, overall comfort and health in the five office types, the one-way analysis of variance (ANOVA) was used to determine whether there are any statistically significant difference between the mean scores of the five offices types comparing environmental parameters. Tukey’s equal variances assumed for post hoc multiple comparisons were utilised in the one-way ANOVA tests. Tukey’s post hoc test identifies sample means that are significantly different from each other. The results of the one-way ANOVA tests comparing the environmental parameters across the five office types are presented in Table 6. The comparison analysis showed that environmental parameters were significantly different across the five office types for thirteen parameters including temperature in summer, air odours in summer, air freshness in summer and winter, and almost all lighting and noise parameters.
Mean comparison of environmental parameters within the five office type groups using one-way ANOVA tests.
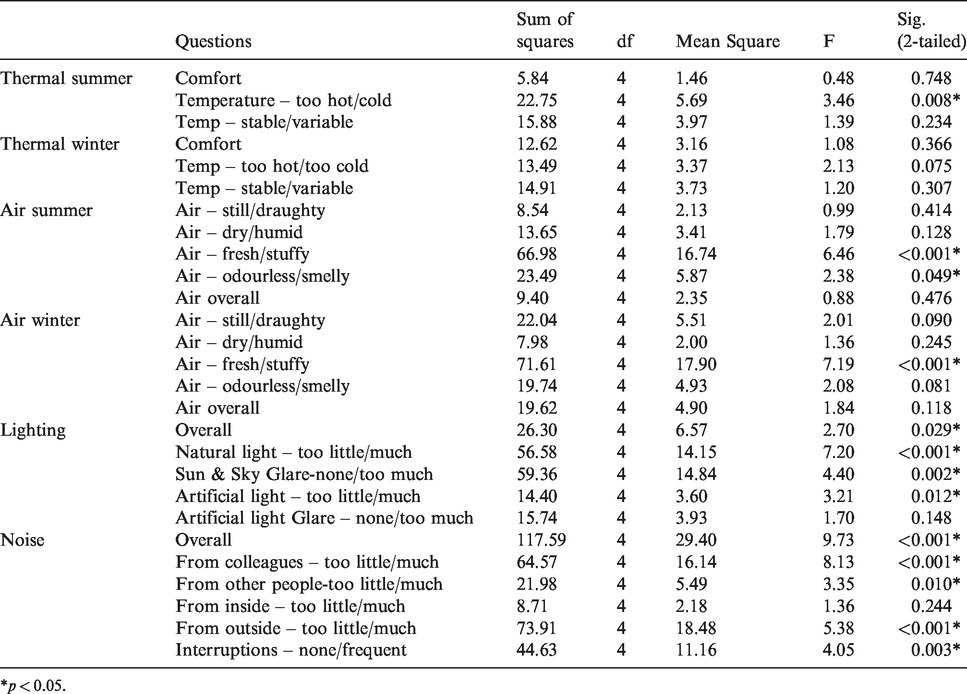
*p < 0.05.
Comparing operational parameters in commercial and academic buildings.
Com: Commercial; Aca: Academic; M: mean values; Diff.: the absolute value of the mean score minus best score; SD: standard deviation; SE: standard errors.
*p < 0.05.
As illustrated in Figure 1, the mean score of temperature in summer was better for 3–4, 5–8 and over 9 offices than those for solo and duo offices. Air odours and freshness in summer were scores the best in duo and over 9 offices. Air freshness was also scored the best in over 9 offices. In terms of natural lights solo offices scored better compared to other offices, while in terms of artificial lights 3–4 offices achieved a better score. All the noise parameters were scored the best in solo offices and the worst in over 9 offices. The abovementioned difference in environmental parameters across the five office types are due to the nature of the offices and the fact that occupants of solo offices can more easily exercise personal control of their spaces. Smaller work groups can also more easily negotiate thermostat settings and window blinds and opening protocols. In addition, there are less issues with noise and interruptions in solo offices as opposed to larger layouts, where occupants have less control over noise. This analysis showed that the environmental parameters are different across the five office types that might influence the productivity, overall comfort and health of occupants.
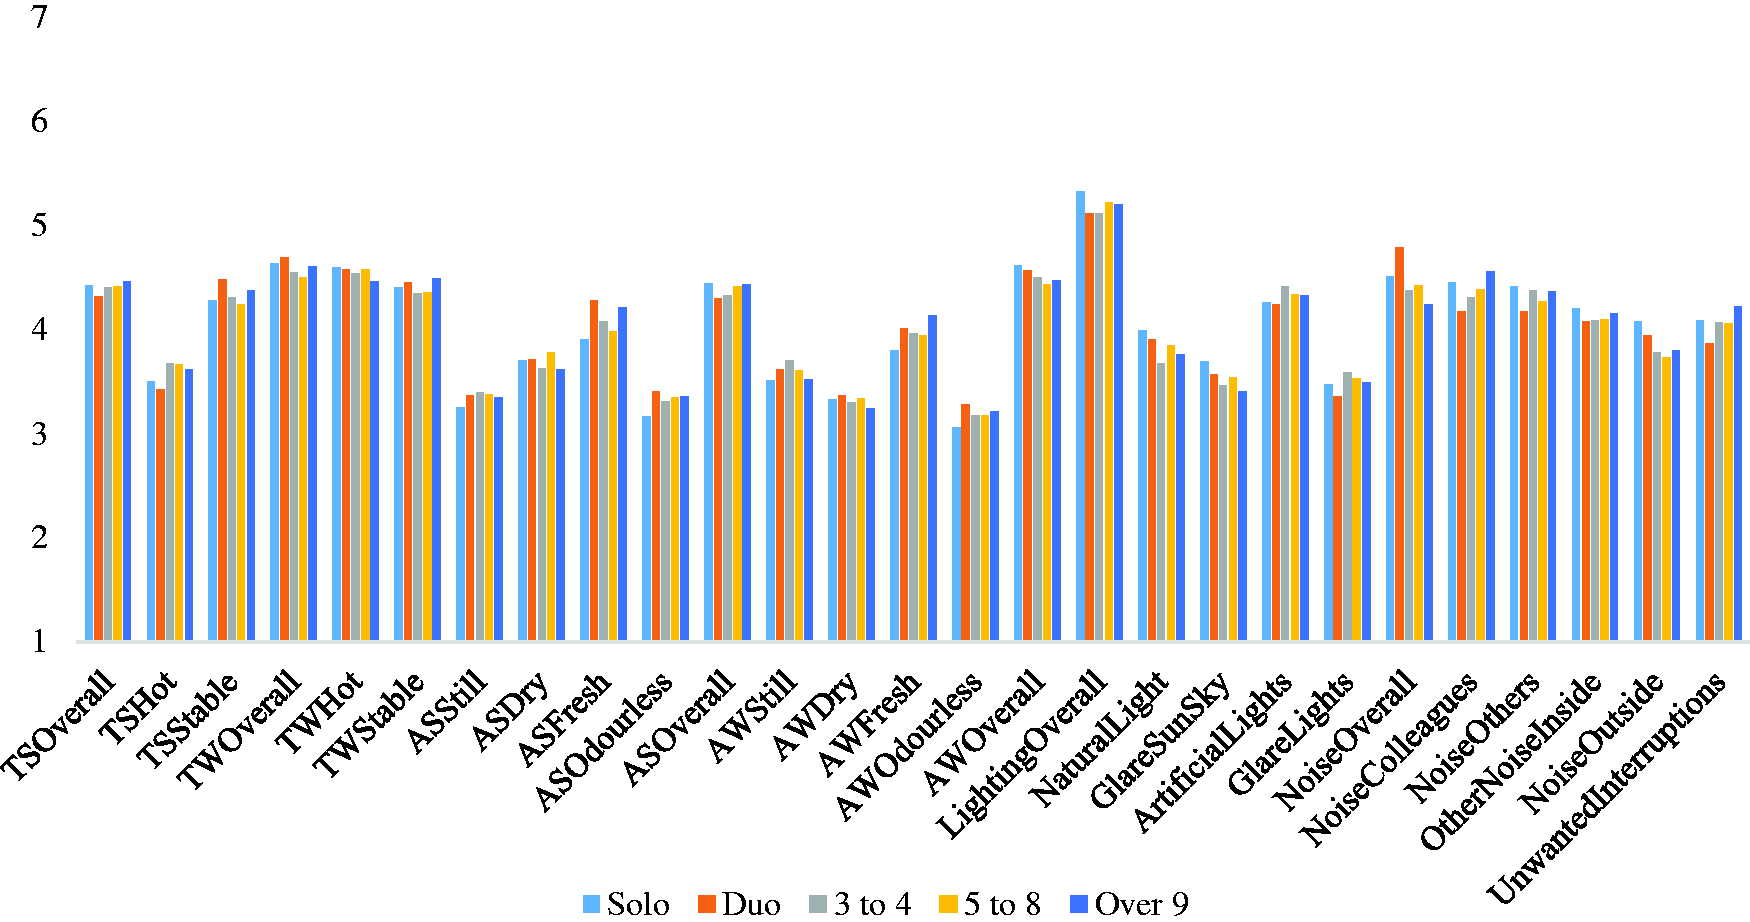
Mean comparison of environmental parameters across the five office types. TSOverall: Thermal comfort in summer; TSHot: temperature in summer; TSStable: temperature stability in summer; TWOverall: thermal comfort in winter; TWHot: temperature in winter; TWStable: temperature stability in winter; ASStill: air stillness in summer; ASDry: air dryness in summer; ASFresh: air freshness in summer; ASOdourless: air odours in summer; ASOverall: air overall in summer; AWStill: air stillness in winter; AWDry: air dryness in winter; AWFresh: air freshness in winter; AWOdourless: air odours in winter; AWOverall: air overall in winter.
Operational parameters
Occupants scored operational building parameters consisting of design (Diff.com = 1.88; Diff.aca = 2.33), needs (Diff.com = 1.86; Diff.aca = 2.14), image to visitors (Diff.com = 1.59; Diff.aca = 1.89), space in the building (Diff.com = 2.13; Diff.aca = 2.34), and cleaning (Diff.com = 1.93; Diff.aca = 2.23) better in commercial buildings than academic buildings (see Table 7). Space at desks (Diff.com = 2.71; Diff.aca = 2.52) and meeting room availability (Diff.com = 2.33; Diff.aca = 2.16) were the two parameters that secured a better score vote in academic workplaces compared with commercial buildings. Scores regarding furniture (p-value = 0.276), storage arrangements suitability (p-value = 0.061), and facilities meet work requirements (p-value = 0.114) had no significant differences comparing commercial and academic buildings.
To analyse the influence of operational parameters on the productivity, overall comfort and health in the five office types, the one-way ANOVA tests were used to determine whether there are any statistically significant differences between the mean scores of the five offices types comparing operational parameters. Tukey’s equal variances assumed for post hoc multiple comparisons were utilised in the one-way ANOVA tests. The results of the one-way ANOVA tests comparing the operational parameters across the five office types are presented in Table 8. The comparison analysis showed that operational parameters were significantly different across the five office types for five parameters including image to visitors, space at desk, furniture, meeting and facilities meet work requirements.
Mean comparison of operational parameters within the five office type groups using one-way ANOVA tests.
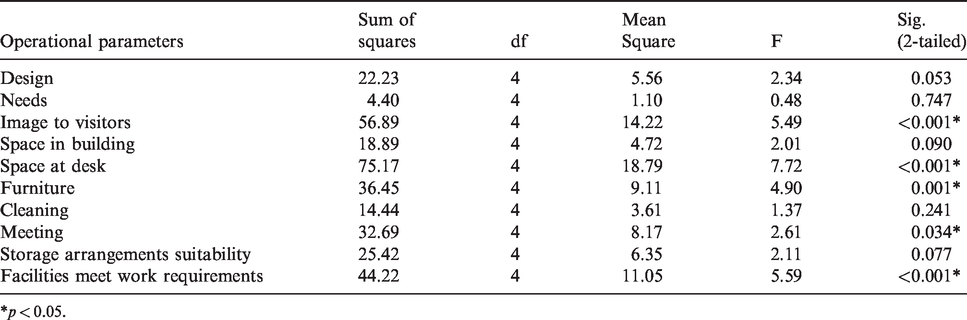
*p < 0.05.
As illustrated in Figure 2, image was scored the best in over 9 offices, in terms of other factors including space at desk, furniture, work requirements solo offices achieved the best scores. In terms of meeting rooms, solo and duo offices attained the best scores. The abovementioned difference in operational parameters across the five office types are due to the differences in expectations and occupants’ previous buildings particularly in regard with image. In terms of space at desks, furniture, meeting rooms and work requirements, occupants of solo offices can more easily customise their spaces according to their needs in comparison to shared offices. This analysis showed that the operational parameters are also different across the five office types along with environmental parameters that both influence the productivity, overall comfort and health of occupants.
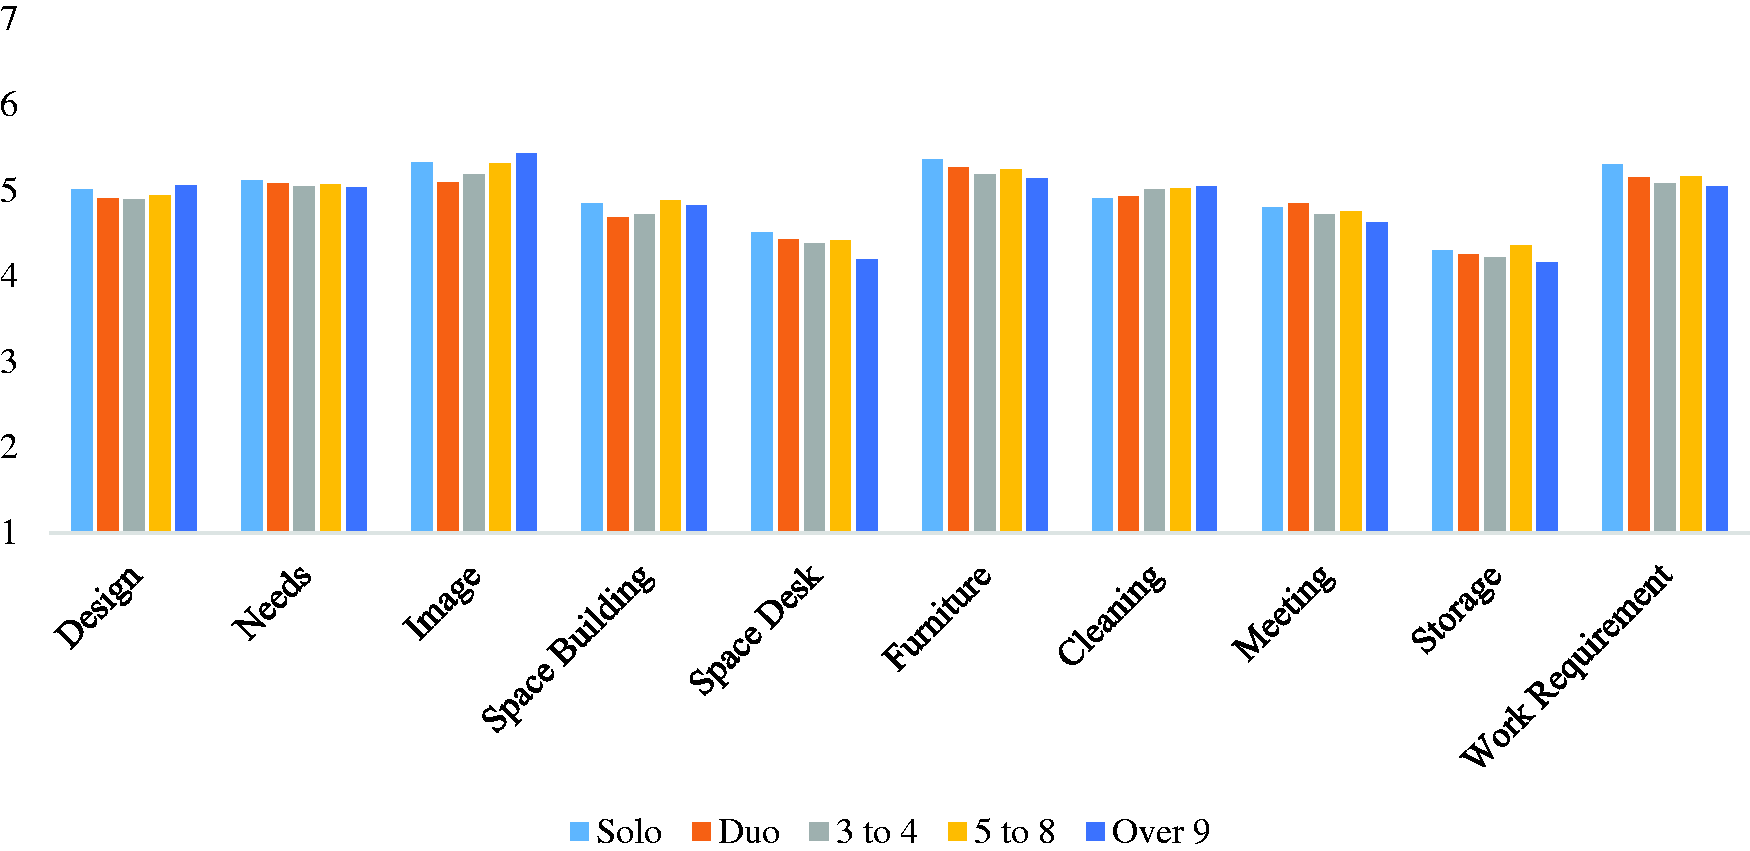
Mean comparison of operational parameters across the five office types.
Productivity, overall comfort and health parameters
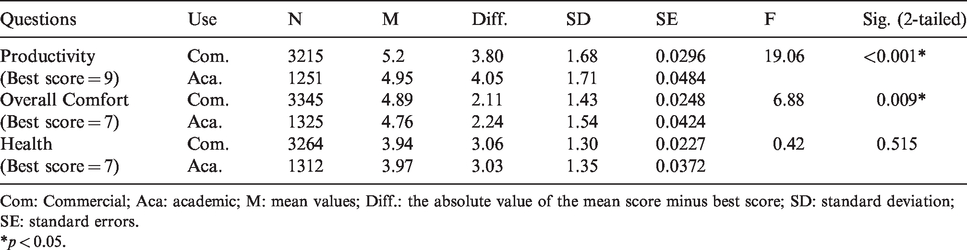
The descriptive and inferential statistics of perceived productivity, overall comfort and health, grouped based on building use, commercial and academic, are provided in Table 9. One-way ANOVA test showed that perceived productivity varies significantly across the two building types with a p-value less than 0.001. Regarding perceived productivity, commercial buildings with a Diff. value of 1.68 obtained a better score than academic buildings with a Diff. value of 1.71.
Comparing satisfaction parameters in commercial and academic buildings.
Com: Commercial; Aca: academic; M: mean values; Diff.: the absolute value of the mean score minus best score; SD: standard deviation; SE: standard errors.
*p < 0.05.
The analysis also showed a significant difference in relation to perceived overall comfort regarding building use, commercial and academic, with p-value of 0.009. Commercial buildings with a Diff. value of 2.11 achieved a better score regarding overall comfort than academic buildings with a Diff. value of 2.24.
However, one-way ANOVA test showed no significant differences regarding perceived health regarding building use with p-value of 0.515. Overall, commercial buildings showed a better performance in terms of productivity and overall comfort than academic buildings.
Productivity
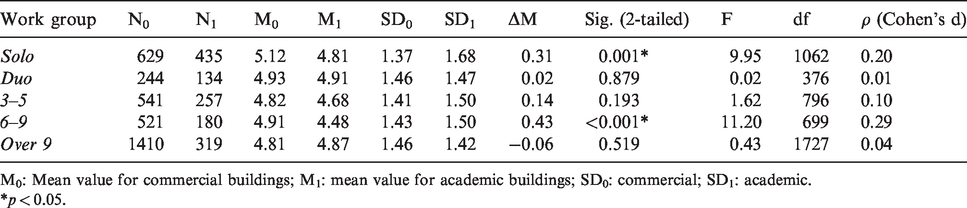
A summary of the Wilcoxon rank-sum test of pairwise comparisons of perceived productivity between building use (commercial and academic) and work group (solo, duo, 3–4, 5–9, over 9) is presented in Table 10. Productivity was higher in commercial buildings than in academic buildings in all five work groups as evidenced by the positive ΔM (differences in mean between commercial and academic) values. Although pairwise comparisons achieved positive values for ΔM in all work groups, the tests obtained statistical significance in only four of the five comparisons, and effect sizes were negligible for two office types and small for the other three. The effect sizes for solo, duo and 6–9 offices were small (0.20 <ρ < 0.50) with 0.24, 0.24 and 0.23, respectively. For 3–5 and over 9 offices, the effect sizes were negligible (ρ < 0.20) with 0.12 and 0.13, respectively. Comparing F values also showed that the difference in mean values had the most significant effect in solo offices (F = 13.2), followed by 6–9 office (F = 7.21).
Pairwise comparison of perceived productivity in commercial and academic buildings.
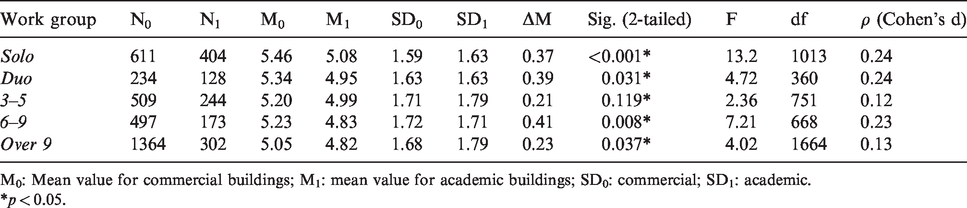
M0: Mean value for commercial buildings; M1: mean value for academic buildings; SD0: commercial; SD1: academic.
*p < 0.05.
To test relevant differences in perceived productivity between commercial and academic buildings across five different work groups, factorial ANOVA tests were conducted. As shown in Table 11, both building use (commercial and academic) and work groups (solo, duo, 3–4, 5–9, over 9) achieved statistical significances for productivity. This indicates that productivity was significantly different across work groups and also building use.
Factorial ANOVA with productivity as the dependent variable and building use and work groups as fixed factors.
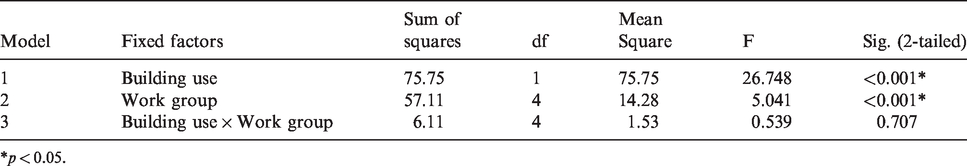
*p < 0.05.
However, building use and work group as independent variables in a single model (Model 3 in Table 11) did not achieve statistical significance, indicating that there are no interactions between building use and work groups. Interaction effects happen when there is some sort of relationship between the two independent variables, for example the value of one dependent variable depends on the effect of another dependent variable. Regarding productivity, no interactions between building use and work group were identified. This indicates that productivity levels have almost the same pattern and order in different work groups in both commercial and academic buildings. As presented in Figure 3, it seems that productivity decreased as the number of people in offices increased. Figure 3 illustrates an interaction plot presenting the fitted values of productivity on the y-axis while the x-axis shows the values for commercial and academic buildings. Meanwhile, the various lines represent values of the five work groups. Solo offices attained the highest productivity rates in both commercial and academic buildings, and over 9 and 6–9 offices attained the lowest productivity scores in commercial and academic buildings, respectively.
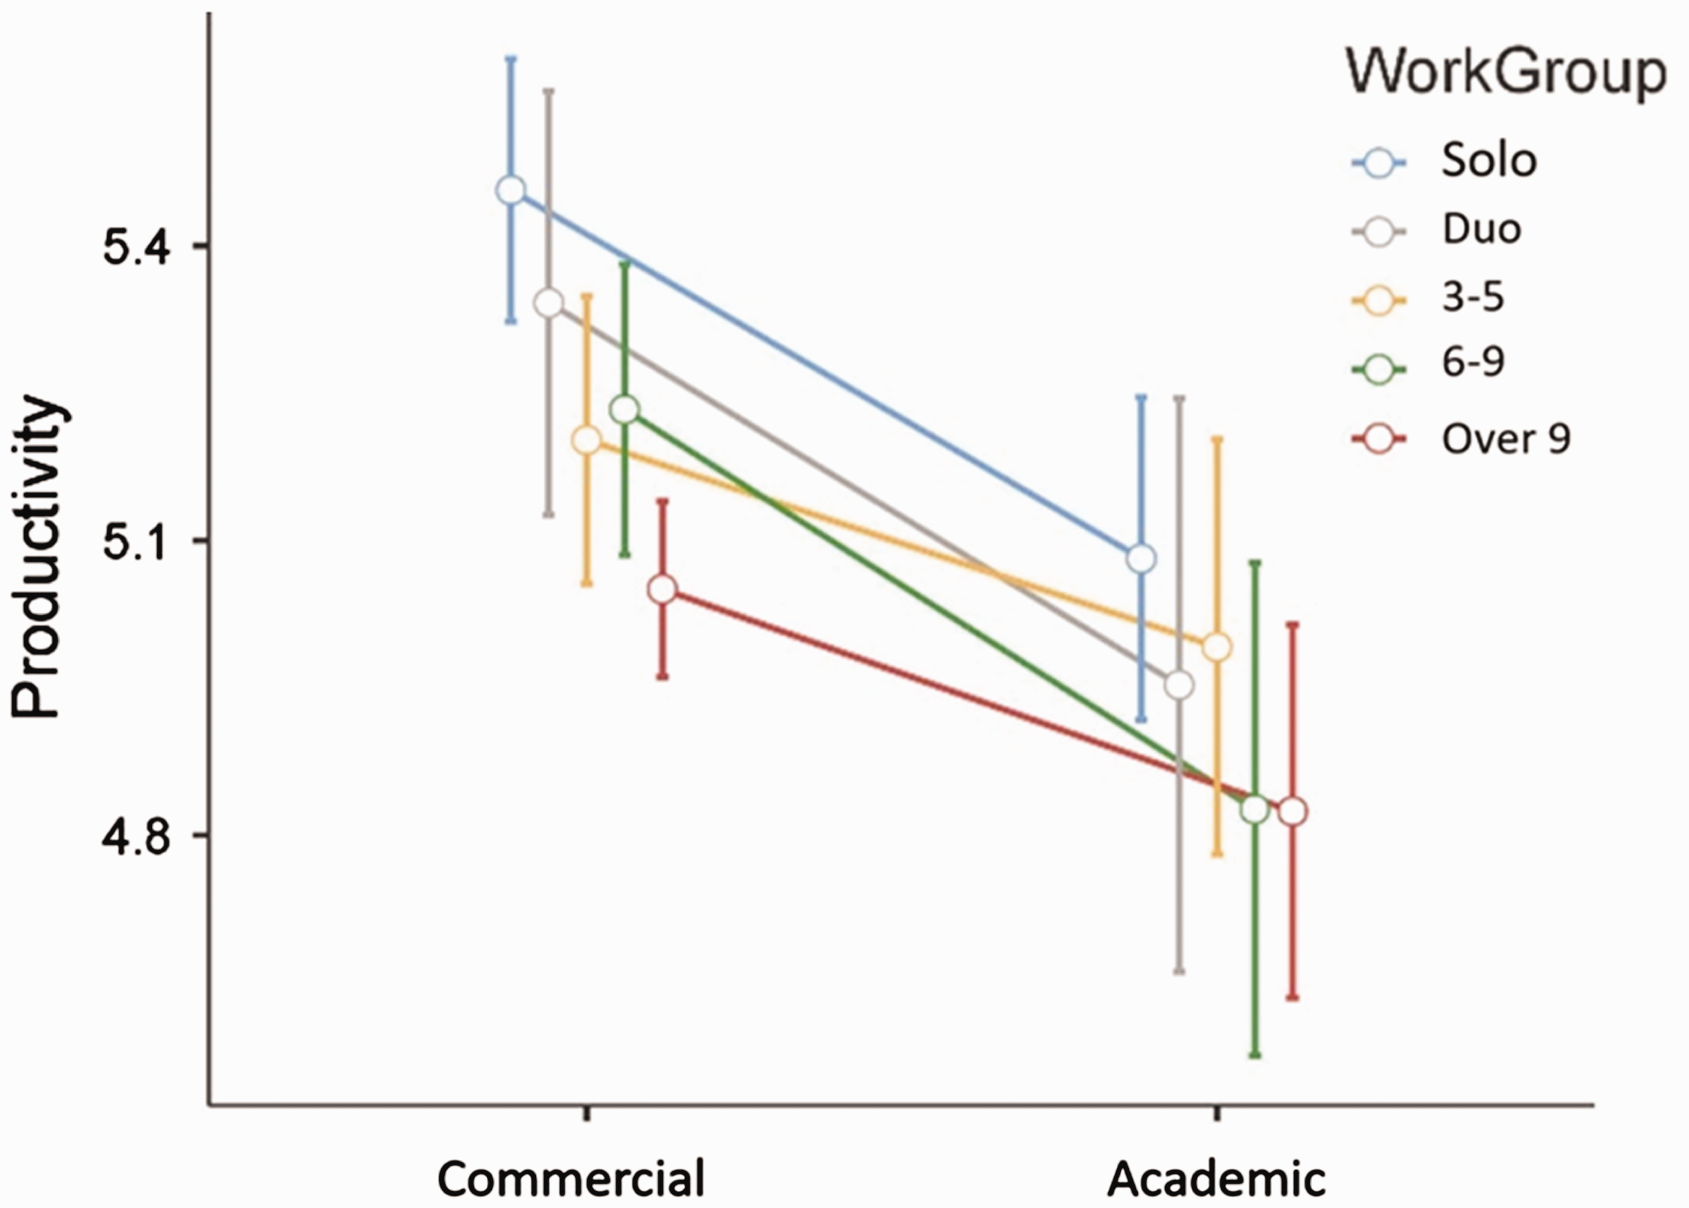
Estimated marginal means plots for factorial ANOVA for perceived productivity.
Although the lines in Figure 3 are almost parallel indicating no interactions between building use and work group in general, there are three crossing lines including 3–5 and 6–9, 3–5 and duo, and 6–9 and over 9. This indicates that the pattern of perceived productivity is different between commercial and academic buildings comparing the above three work group comparisons. In commercial buildings, productivity was higher in 6–9 offices than 3–5, while 3–5 academic offices obtained higher productivity scores than 6–9 offices. In commercial buildings, duo offices achieved higher productivity scores than 3–5, while in academic buildings occupants in 3–5 offices scored their productivity higher than those in duo offices. Similarly, 6–9 offices in commercial buildings also obtained higher scores than over 9 offices, while 6–9 academic offices obtained slightly lower scores than over 9 offices.
Overall comfort
Pairwise comparisons of perceived overall comfort between the two independent groups of commercial and academic buildings are presented in Table 12. The differences in mean (ΔM) were positive for all office types except over 9, indicating perceived overall comfort was also better in commercial buildings than in academic buildings for all work groups except for over 9. Nonetheless, the tests obtained statistical significance only for solo and 6–9 offices. The effect sizes were negligible for duo, 3–5 and over 9 offices with 0.01, 0.10 and 0.04, respectively. For solo and 6–9 offices, the effect sizes were small (0.20 <ρ < 0.40) with 0.20 and 0.29, respectively. This leads us to conclude that only in solo and 6–9 offices, commercial buildings achieved a significantly higher overall comfort scores than academic buildings. However, the F-value showed that the effect of difference in mean values was much higher in 6–9 offices (F = 11.20) than the rest of the work groups.
Pairwise comparison of perceived overall comfort in commercial and academic buildings.
M0: Mean value for commercial buildings; M1: mean value for academic buildings; SD0: commercial; SD1: academic.
*p < 0.05.
Factorial ANOVA tests were also used to compare the effect of building use (commercial and academic) and work group (solo, duo, 3–4, 5–9, over 9) on overall comfort. As shown in Table 13, all the models including Model 1 for building use, Model 2 for work group, and Model 3 for building use and work group exhibited statistically significant differences for overall comfort. This indicates that overall comfort was significantly different comparing building use and work group. Results also showed that there was an interaction between building use and work group as Model 3 in Table 13 also achieved statistical significance (p = 0.009).
Factorial ANOVA with overall comfort as the dependent variable and building use and work groups as fixed factors.
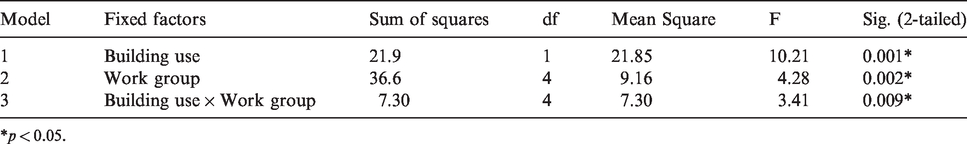
*p < 0.05.
The interaction between building use and work group were further explored by an interaction plot in Figure 4. As illustrated in Figure 4, there were four interactions between certain compared groups including, duo and solo, over 9 and solo, over 9 and 6–9, and 6–9 and 3–5. In commercial buildings, solo offices achieved better overall comfort scores than duo offices, while in academic buildings, occupant in duo offices showed better overall comfort values than those in solo offices. In commercial buildings, 6–9 offices achieved better overall comfort scores than over 9 offices, while in academic buildings overall comfort was perceived better in over 9 offices than 6–9 offices. Commercial solo offices also attained better overall comfort scores than commercial over 9 offices, while academic over 9 offices achieved better scores than academic solo offices. In commercial buildings, 6–9 offices obtained better overall comfort scores than over 9 offices, while in academic buildings over 9 offices scored much better than 6–9 offices in terms of overall comfort. Similarly, in commercial buildings, 6–9 offices performed better in terms of overall comfort in comparison with 3–5 offices, while academic 3–5 offices achieved higher overall comfort scores in comparison in 6–9 offices.
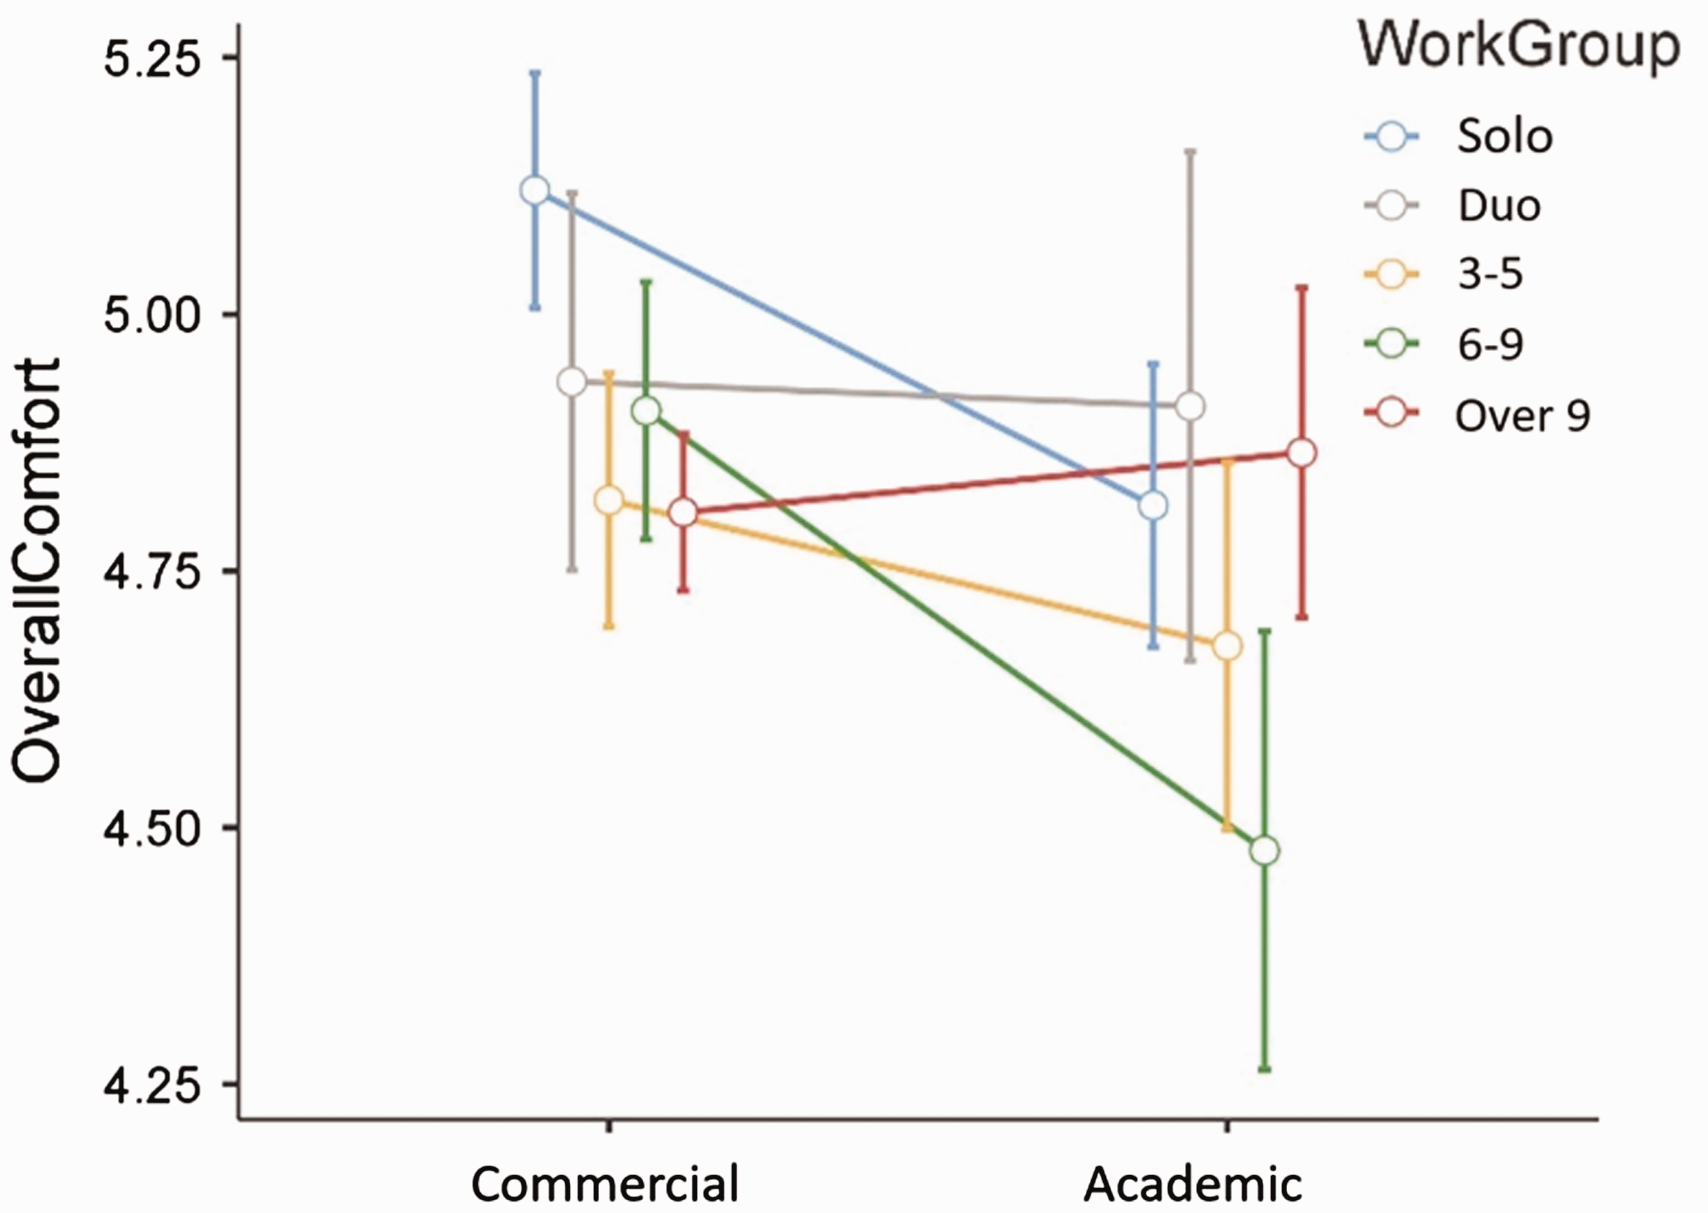
Estimated marginal means plots for factorial ANOVA for perceived overall comfort.
Health
Pairwise comparisons of health between commercial and academic buildings are shown in Table 14. The differences in mean (ΔM) were positive for all office types, suggesting that health was perceived better in commercial buildings than in academic buildings in all work group types. However, the tests attained statistical significance only in 6–9 office groups (ρ = 0.23), and effect sizes were negligible for all groups (ρ < 0.20). This indicates that only in 6–9 offices, perceived health was significantly better in commercial than academic buildings. The F-value of 7.47 for 6–9 offices also shows that the effect of difference in the perception of health between commercial and academic buildings was significant. In 6–9 offices, the perception of health was significantly better in commercial buildings than in academic buildings.
Pairwise comparison of perceived health in commercial and academic buildings.
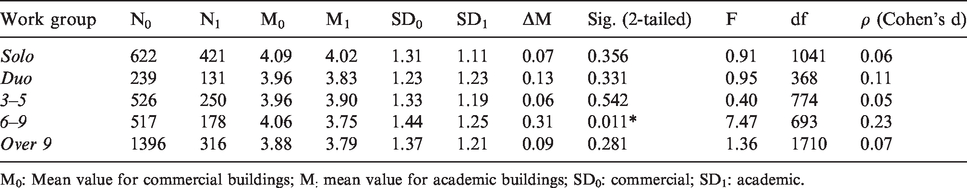
M0: Mean value for commercial buildings; M: mean value for academic buildings; SD0: commercial; SD1: academic.
Factorial ANOVA tests were conducted to predict health scores based on two independent variables of building use and work group, separately (Model 1 and 2) and combined (Model 3). As shown in Table 15, both building use (commercial and academic) and work groups (solo, duo, 3–4, 5–9, over 9) achieved statistical significance in predicting health scores as separate models in Model 1 and 2 with p-values of 0.006 and 0.004, respectively. However, Model 3 that has building use and work group as two independent variables did not attain statistical significance. This indicates that regarding health, there are no interactions between building use and work group.
Factorial ANOVA with health as the dependent variable and building use and work groups as fixed factors.
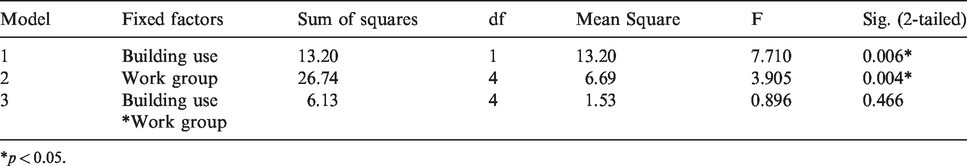
*p < 0.05.
Figure 5 further illustrates the interaction between building use and work group for the health parameter. By observing the slope of the lines in the interaction plot in Figure 5, offices with fewer occupants in a space, generally, attained better scores in health. However, there are some interactions and some cross lines between 6–9 offices and other work groups including duo, 3–5 and over 9. In commercial buildings, 6–9 offices scored better than duo offices, while in academic building duo offices scored better than 6–9 offices. Similarly, in commercial buildings 6–9 offices attained better health scores than 3–5 offices, whereas in academic buildings, 3–5 offices performed much better than 6–9 offices. In commercial buildings, 6–9 offices also provided a better performance in terms of health than over 9 offices, while over 9 academic offices performed better than 6–9 academic offices. This indicates that some abnormality and uneven distribution of scores were found when comparing health scores of 6–9 offices between commercial and academic buildings.
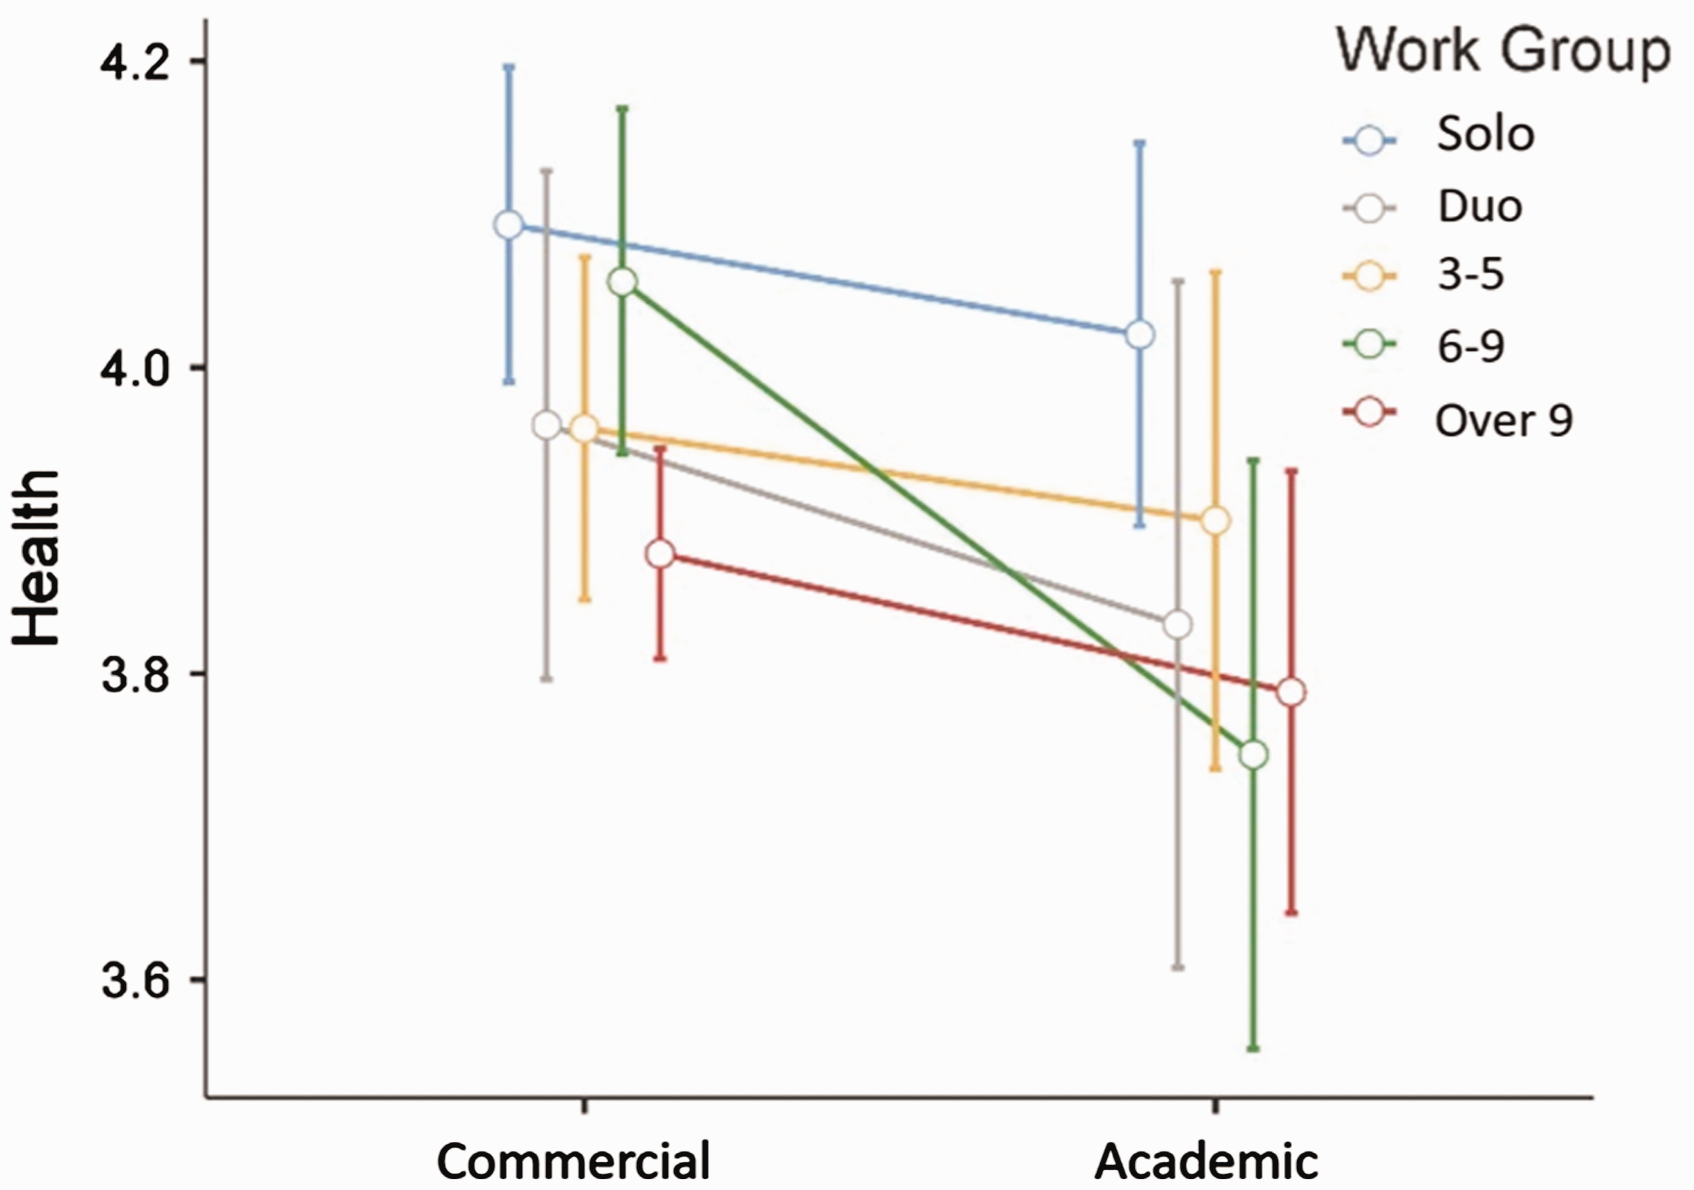
Estimated marginal means plots for factorial ANOVA for perceived health.
The effect of age and gender
We also investigated the effect of age and gender on perceived productivity, overall comfort and health as shown in Table 16. The comparison analysis of factorial ANOVA showed that the influence of gender in perceived productivity, overall comfort and health achieved non-significant results in our study with p-values being above 0.05 for all the variables. As shown in Table 16, only age had a statistically significant influence on perceived productivity.
The effect of age and gender on perceived productivity, overall comfort and health.
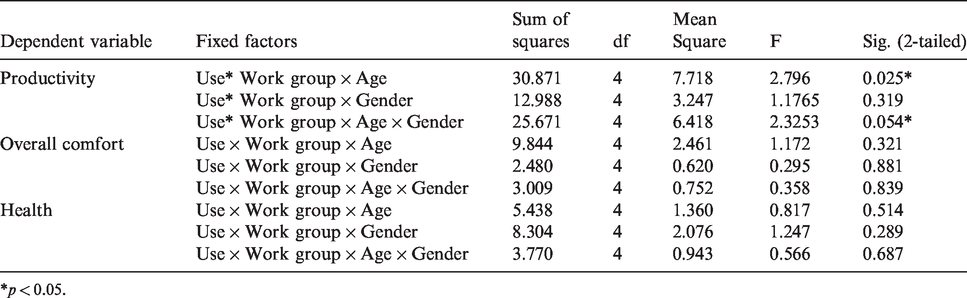
*p < 0.05.
As presented in Figure 6, the most dominant interaction was identified for under 30 years in solo offices. For under 30 years, solo offices obtained lower productivity scores in commercial buildings than academic buildings. The interaction line in under 30 years group for Duo offices obtained the highest slope in the fitted graph, which indicates that for under 30 years, productivity in duo offices was significantly different between commercial and academic buildings. This shows that for under 30 years duo, offices are more favourable in commercial buildings than in academic buildings. On the other hand, solo offices particularly for under 30 years achieved a relatively low score in commercial buildings compared to academics. This indicates that in commercial buildings, younger occupants prefer duo offices over solo offices. The results illustrate that younger employees in commercial buildings need to share their office with one another to learn and get trained while in academic buildings, younger employees would rather be the single occupier of the office than sharing with one another.
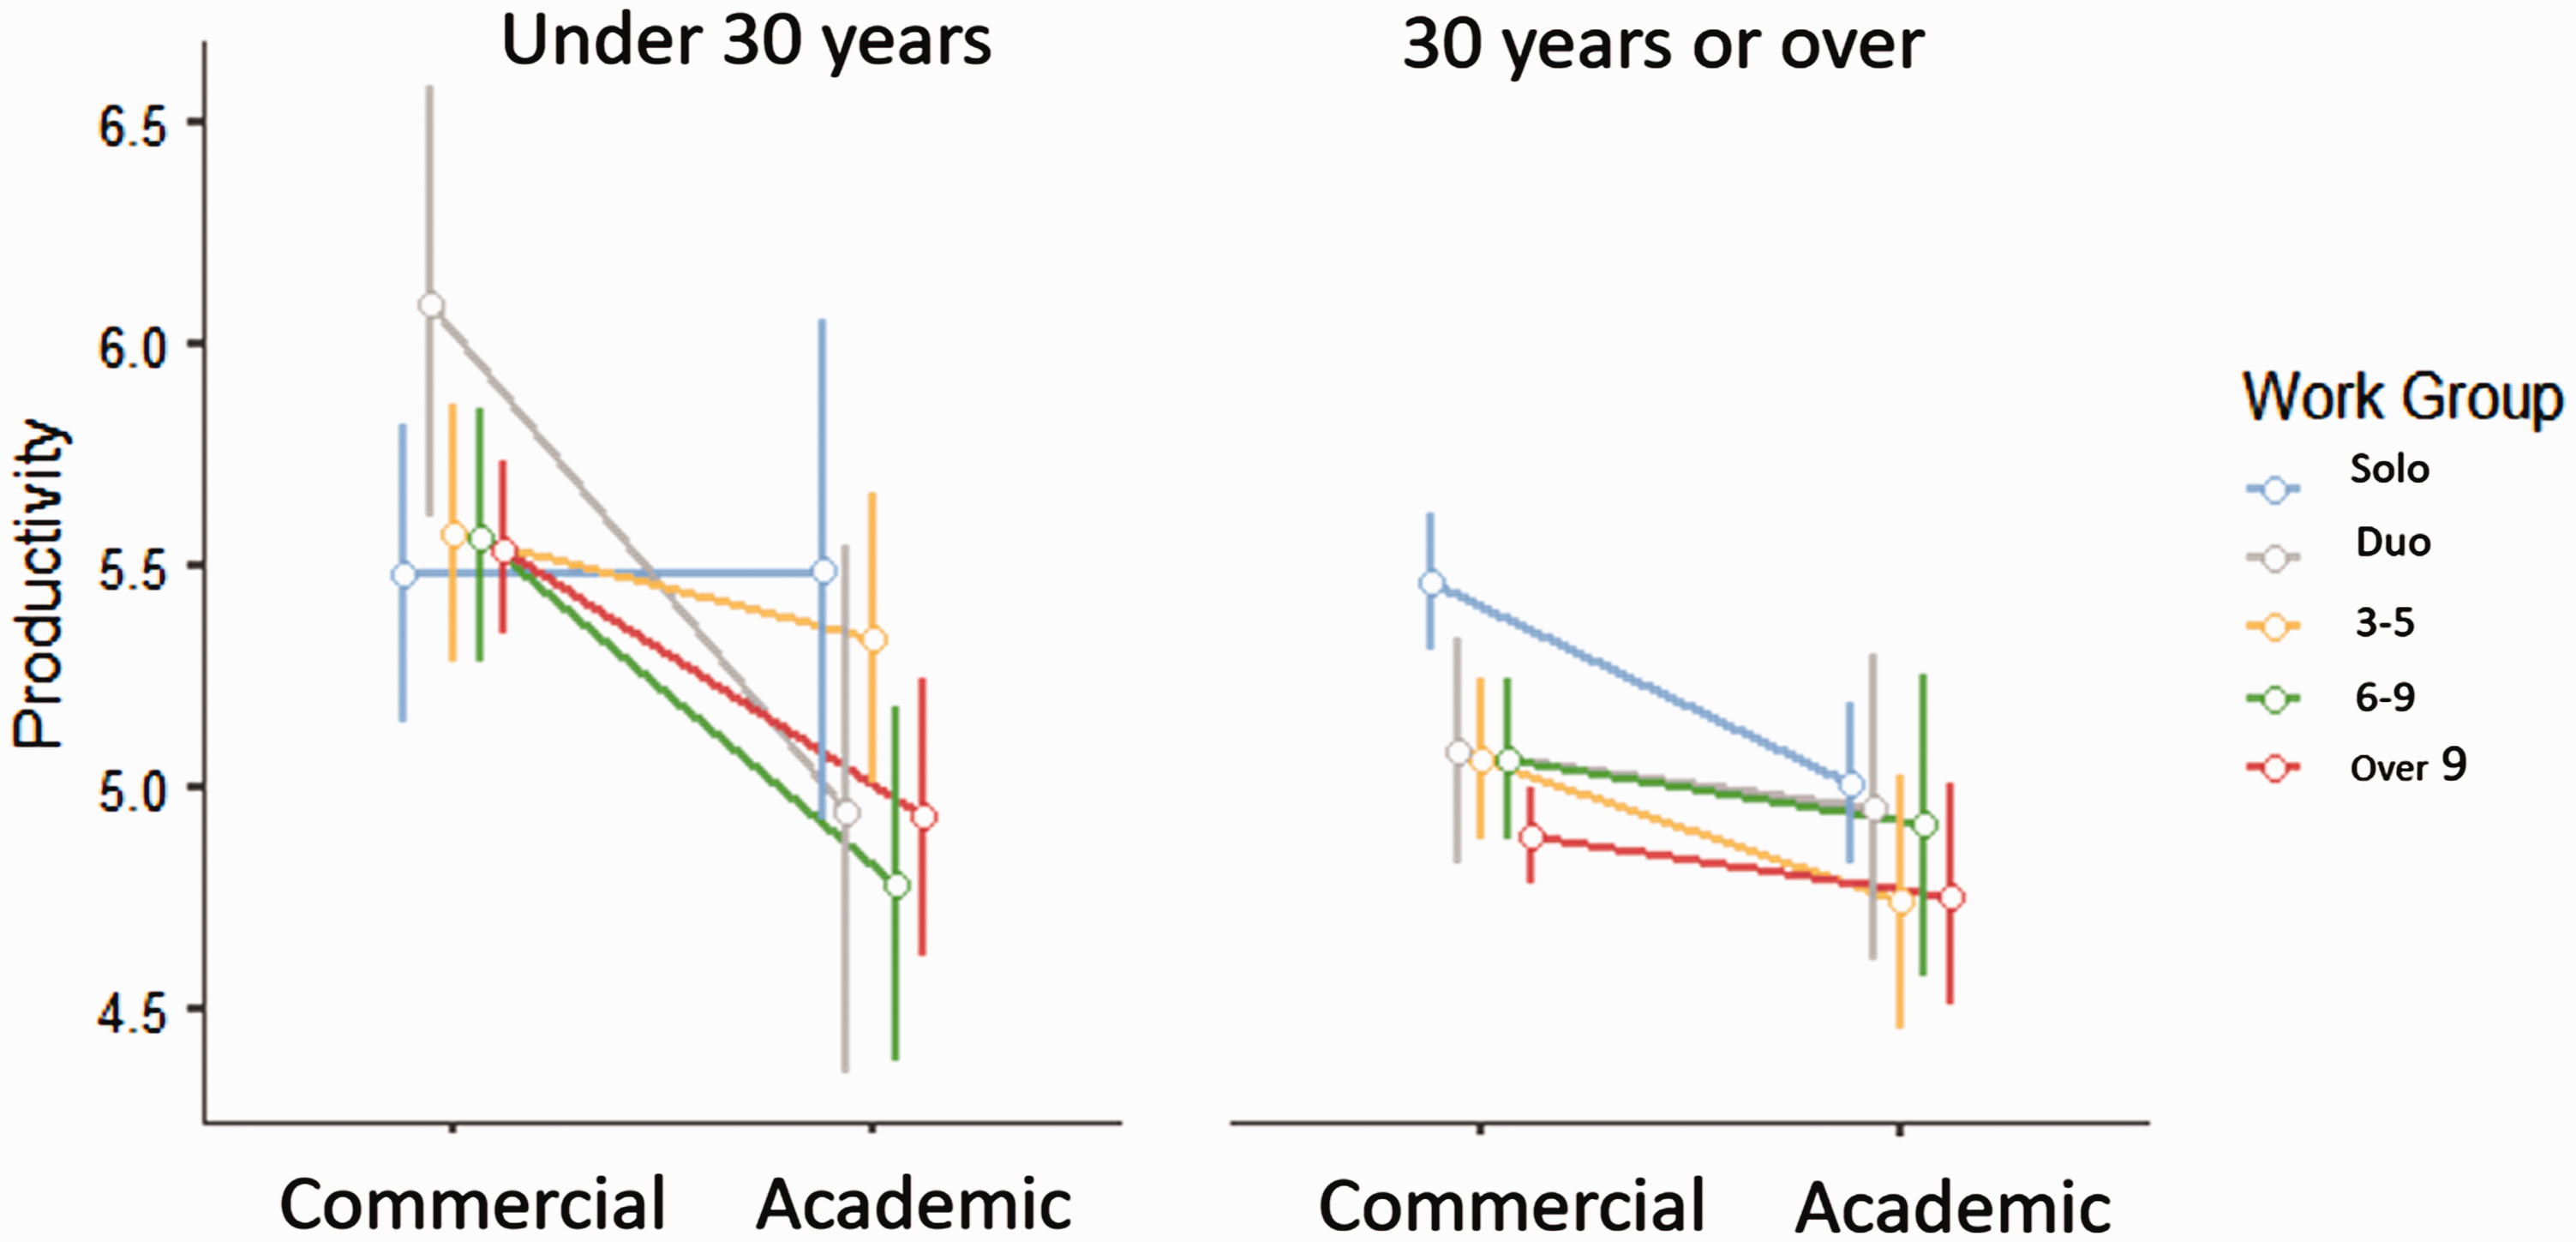
Estimated marginal means of productivity including building use, work group and age as marginal means.
For 30 years or over, less visible interactions were identified comparing commercial and academic buildings. Productivity decreased as the number of occupants in the office increased in both academic and commercial buildings. In academic buildings, under 30 years scored their productivity with the lowest rates in 6–9 offices, while 30 years or over scored their productivity with the lowest rate in 3–5 and over 9 offices.
The interaction plot in Figure 7 shows that the most dominant interaction occurred regarding female participants particularly in solo, duo and 3–5 offices. Female occupants’ productivity scores in commercial buildings were higher in duo offices than solo offices, while in academic buildings, female participants scored their productivity higher in solo offices than duo offices.
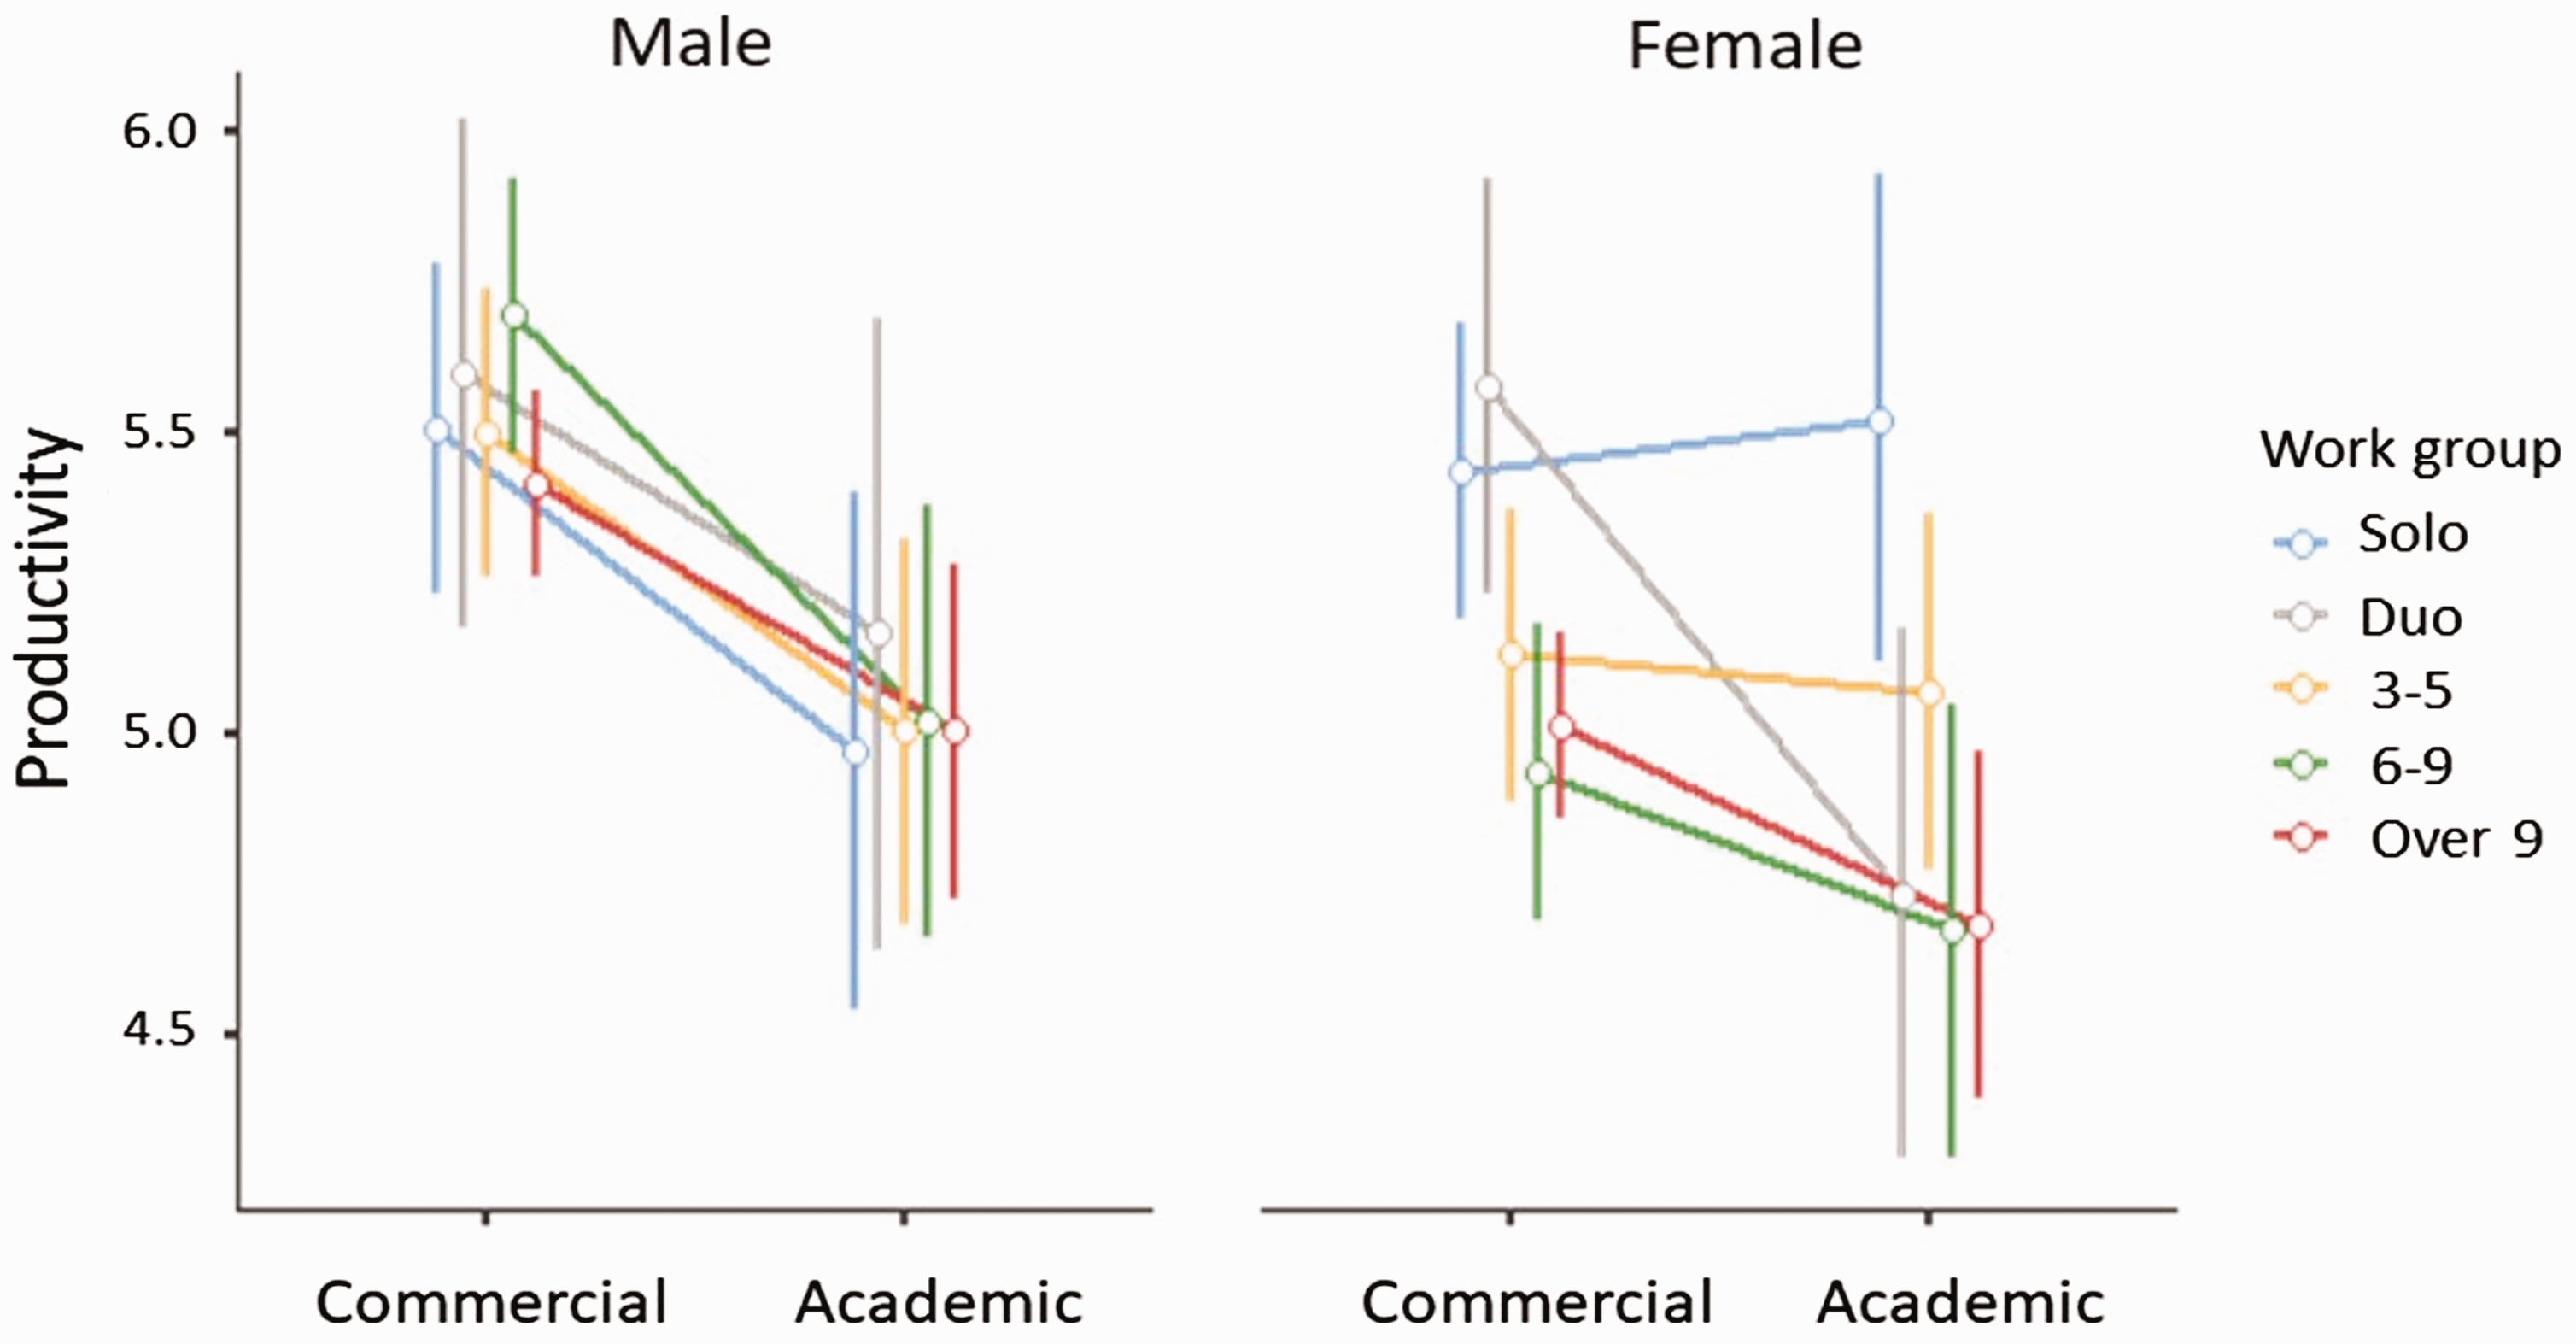
Estimated marginal means of productivity including building use, work group and gender as marginal means.
Similarly, female occupants’ productivity scores in commercial buildings were higher in duo offices than 3–5 offices, while in academic buildings, female participants scored their productivity higher in 3–5 offices than duo offices. In academia, female participants perceived that they were more productive in solo offices, while in commercial buildings, female occupants perceived that they were more productive in duo offices. Male participants perceived the least productivity in solo offices in both commercial and academic buildings.
Discussion
Occupants in solo offices may more easily exercise personal control of their spaces regarding environmental parameters such as light and noise, while smaller work groups can negotiate the operation of window or thermostat settings. In terms of operational parameters also, there seems to be more control for adjustments to furniture or space at desks in smaller work groups as opposed to larger work groups. These differences in environmental and operational parameters across the five office types may be the explanation for the differences in productivity, overall comfort and health. As the nature of the work differs between commercial and academic buildings, so does the expectations and occupant experiences across the two building use types.
In commercial buildings in terms of productivity and overall comfort, the highest scores were obtained for solo and duo offices, indicating that solo and duo offices were the most preferred work group types. However, in terms of perceived health, solo and 6–9 offices were the most favourable in commercial buildings. On the other hand, 3–5 and over 9 offices achieved the lowest scores in terms of productivity, overall comfort and perceived health, showing that 3–5 and over 9 offices were the least favourable work group types in commercial buildings.
In academic buildings in terms of productivity and perceived health, highest scores were obtained for solo and 3–5 offices, indicating that solo and 3–5 offices were the most preferred work group types. However, in terms of overall comfort, duo and over 9 offices were the most favourable in academic buildings. On the other hand, 6–9 and over 9 offices achieved the lowest scores in terms of productivity and perceived health, showing that 6–9 and over 9 offices were the least favourable work group types in academic buildings. However, 6–9 and 3–5 offices achieved the lowest scores in overall comfort in academic buildings.
The better scores regarding productivity in solo offices in both building use types was in line with a previous study by Brennan et al., 37 which showed a negative impact on job satisfaction when occupants moved from solo to open-plan offices in comparison with solo offices. In both building uses, productivity scores were decreased as the number of occupants increased in the offices. As evidenced in previous studies, an increased number of people in the offices may result in reduced control over visual and auditory quality of working environments, 17 consequently negatively influencing occupant productivity.
However, a clear distinction between work groups in commercial and academic buildings was also identified that may be explained by the nature of the work and relationships between colleagues in commercial and academic buildings. Considering all the parameters, productivity, overall comfort and perceived health, middle-sized open-plan offices (6–9) were the least favoured office types by academics, and large open-plan offices (over 9) were the most disliked work group among commercial office occupants. This may indicate that concentration levels and the ability to multi-task tends to be the lowest in middle-sized open-plan offices for academic, and the lowers in large open-plan offices for commercial office occupants.
Due to the nature of gender and age differences and co-worker relationships, occupants from different demographic groups showed different perceptions regarding productivity in various work groups. Older (30 years or over) participants in commercial buildings preferred small open-plan offices (3–5) to large open-plan offices, while older academic occupants scored their productivity better in large open-plan offices than small open-plan offices. This finding showed the differences in preference of work groups among older occupants in commercial and academic buildings, which might be due to the nature of the work and complexity of interpersonal conflicts that may occur in these office work groups in commercial and academic buildings. Older academic participants may experience less interpersonal conflicts in large open-plan offices than small open-plan offices, while in commercial buildings, workplace conflicts among older participants may increase in large open-plan office layouts in comparison to small open-plan offices. Previous research has shown that the provision of protected space necessary for sharing thoughts, feelings and values is particularly more absent in large open-plan offices and this may prevent occupants from developing friendships, resolving interpersonal conflicts, or offering interpersonal feedback. 38 Differences in productivity scores among older participants in commercial and academic buildings could be a result of different requirements and needs for older participants in commercial and academic buildings.
In commercial buildings, younger (under 30 years) participants also preferred duo offices to solo offices, while younger participants in academic buildings preferred solo offices to duo offices. In an office environment, socio-cultural factors influence the way newcomers create knowledge and identity in a new profession. 39 In our study in commercial buildings, younger participants that are probably newcomers preferred duo offices over solo offices that might be due to a decline in team member relations in solo offices and the importance of learning from colleagues for younger employees in commercial office environments. However, research has shown that the culture of finding identity in an academic environment may be different from commercial office environments. According to Gravett and Petersen, 40 newcomers in academia tend to find their own way of doing things, which explains the preference of solo offices over duo offices for younger participants in academic buildings.
Some differences influenced by gender were observed in productivity scores among various work groups in commercial and academic buildings. In commercial buildings, female participants were the most productive in duo offices, while male participants in commercial buildings were the most productive in middle-sized open-plan offices (6–9). In commercial buildings, female participants also showed the lowest productivity scores in middle-sized open-plan offices, whereas male participants scored the lowest productivity values in solo offices. Female academic participants were the most productive in solo offices, while male academics were the most productive in duo offices. Female participants in academic buildings also showed the lowest productivity scores in middle-sized open-plan offices, whereas male participants scored the lowest productivity values in solo offices.
The differences in productivity scores between female and male participants can be explained by the need for concentration for workplace duties and different tolerance of physical stress by various demographic groups as noted by Seddigh et al. 41 The differences in productivity scores between female and male participants in various work group sizes may be due to the interpersonal conflict handling styles in commercial and academic workplace environments. As previous studies have shown, the handling of workplace conflicts is not necessarily similar between genders. 42 On the other hand, conflict styles are indicators of behavioural patterns in interpersonal conflicts, 43 which are different in nature in commercial and academic environments. These differences in conflict styles in commercial and academic workplaces may explain why genders may have different perceptions towards work groups in commercial and academic buildings.
To summarise, the results of this exploratory study should only be viewed as a first step in the investigation of the long-term effect of work groups on perceived productivity, overall comfort and health. These results can thus only be viewed as indications of the possible effect of solo, duo, 3–5 (small open-plan), 6–9 (middle-sized open-plan) and over 9 (large open-plan) offices on occupant productivity, comfort and health. Further studies need to be performed based on experimental investigations to provide a more precise evaluation of the extent of influence of work groups in occupant productivity and comfort in workplace environments using objective as well as subjective evaluation methods. These results further suggest that the applicability of different work groups needs to be further investigated according to building use. Purposely designed spaces that support work-related tasks are necessary to provide a human-centred approach to the design of office environments. 44
Reflected from occupant perspectives, this study provided solid evidence that expectations and needs significantly differed among occupants with various work-related responsibilities and offices with different work group sizes. Making appropriate design decisions particularly in relation to work groups has a significant impact on the perceived and, consequently, actual productivity, overall comfort and health of occupants, which consequently increases the efficiency in the workplace. For business owners in commercial buildings as well as universities in academic buildings, the increase in workplace efficiency will significantly affect the return of investment because more work will be completed for the same hourly pay rate. This further highlights the significance of occupant perceptions and satisfaction in buildings for organisations. Learning from buildings in use is a key to improving the performance of buildings that results in creating a built environment that meets the needs of building occupants, building owners and finally the wider society and the environment. 45
Conclusion
This study focused on the effect of work group on occupant perceived productivity, overall comfort and health in commercial and academic buildings using post-occupancy evaluations. Results showed that occupants in commercial and academic buildings have significantly dissimilar perceptions of offices with different work groups. Results of this study can be summarised as follows:
Some environmental and operational parameters, such as noise and furniture, were significantly different across the five office types that may explain the differences in productivity, overall comfort and health in the five work groups. Comparing environmental, operational and satisfaction parameters, commercial buildings showed a better performance in our dataset by out-performing academic buildings in 27 out of 40 parameters. Perceived productivity was higher in commercial buildings than those in academic buildings in all work groups. Middle-sized open-plan offices were the least favoured work groups among academics. Large open-plan offices were the least favoured work groups among occupants in commercial buildings. Regarding productivity, scores decreased as the work group size increased in both commercial and academic buildings. In terms of overall comfort, no clear pattern was identified with increased work group size. In both commercial and academic buildings, solo offices achieved the highest productivity scores. Younger commercial office occupants preferred duo to solo offices, while older commercial occupants had the highest productivity scores in solo offices.
The results provided an indication of which specific work requirements in commercial offices and academia play a decisive part in explaining the differences in terms of concentration and collaboration. In fact, a combination of factors influences perceptions towards productivity, comfort and health in workplace environments influenced by various architectural and functional features. This study contributed to improving our understanding of the influence of workplace environmental qualities on office occupants’ satisfaction status. The study highlighted the importance of work group in creating a high-performance work environment regarding perceived productivity, overall comfort and health of occupants in commercial as well as academic buildings.
Footnotes
Acknowledgements
It is a pleasure to acknowledge Mr Adrian Leaman for permission to use the BUS Methodology questionnaire under licence. The surveys have been collected during 12 years of effort by Prof. George Baird and his collaborators using BUS Methodology surveys around the world. We must also thank all the building managers and occupants for their participation in the surveys.
Authors’ contribution
All authors contributed equally in the preparation of this manuscript.
Declaration of conflicting interests
The author(s) declared no potential conflicts of interest with respect to the research, authorship, and/or publication of this article.
Funding
The author(s) received no financial support for the research, authorship, and/or publication of this article.