
Abstract
Carbon dioxide is the largest component of the human footprint and one of the major components of all greenhouse gases. The expected increase in population will lead to growth in energy consumption and greenhouse gas emissions. The building industry has the highest potential for reducing greenhouse gas emissions. Therefore, buildings should become not only efficient consumers but also energy producers, not a simple task in dense cities. The paper describes the feasibility and limitations of near zero energy design in highly dense urban conditions. The study was carried out by examination and comparison of various density design, alternatives of an existing urban plot in the coastal climate zone of Israel. Increased dwelling units’ number leads to higher total energy use on the one hand and mutual shading of new high-rise residential buildings on the other. Preserving solar rights for PV systems installation become more complex. The relation between urban density and solar rights in urban design, energy consumption and energy generation within plot borders and their implications are presented and discussed in the paper.
Introduction
The ecological footprint is a measure for evaluating the amount of natural resources, required to meet the needs of the world’s population managing a certain lifestyle. In 2010, it took the Earth a year and a half to recover the annual consumption by people, a figure that continues to increase every year. The largest component of the human footprint, more than 50%, is carbon dioxide, considered one of the major components of all the greenhouse gases responsible for climate change. 1 The building industry has the highest potential for immediate action with economic benefit and long-term effects of a significant reduction in greenhouse gas emissions. This sector is responsible for about 30% of the total world carbon emissions and other greenhouse gases. Moreover, buildings are responsible for about 40% of the total electricity consumption. 2 To minimize the ecological footprint, many countries worldwide, including Israel have committed to reducing domestic greenhouse gas emissions by 40% until 2030 compared to 1990. To achieve this goal more objectives were set: a reduction of energy consumption by 20% and an increase in renewable energy sources to 20% of the total energy supply by 2020.3,4 Besides, all new buildings in Europe have to be built as nearly zero energy buildings, that is to have a very high-energy performance, and the energy required by these buildings will be from renewable sources. 5
One of the most affecting factors of the human impact on the environment is population growth. Today, Earth’s population is more than 7 billion people,
6
and for the first time in history, more than half lives in urban areas, with this ratio expected to rise to 68% by 2050. Since the establishment of the State of Israel, its population increases each year significantly. In 2007, when Israel’s population was about 7 million inhabitants, its ecological footprint was 15 times bigger than its bio-capacity.
7
Nowadays, with more than 8 million inhabitants, more than 90% of Israel’s population lives in urban areas.
8
The increasing population and current lifestyle will lead to the growth in households’ number and urban areas densification. As a result of the growing population, energy consumption and greenhouse gas emissions will grow, as well as mutual environmental influences between buildings in cities. According to the ‘Sustainability Plan for Israel 2030’
9
a recommended planning strategy is concentrated dispersion and revitalization of existing city centres. To minimize damage to open spaces, in the early 2000s, an urban renewal plan was developed by the Israeli Government. Within the framework of the plan, two main tracks for the promotion of municipal urbanization processes were proposed
10
Urban renewal (increased building rights without demolition) Urban redesign (demolition of existing buildings and construction of new buildings on the same plot)
The aim of both tracks is better land utilization within built-up areas, the creation of a new housing inventory in cities, and their improvement by upgrading existing buildings and infrastructure. In the context of the ‘Urban Renewal’ track, the committee promotes the intensification of built-up areas without demolition activities and maximal use of existing infrastructures. The ‘Urban Redesign’ route on the other side, requires fully re-planning of an existing area with significant plot densification and related infrastructure renewal.
In Israel, the electricity consumption by the domestic, public and commercial sectors accounts for about 60% of the total consumption, 11 and almost 50% of total greenhouse gases are emitted by buildings. 12 Until 2040, the electricity demand is expected to increase in all sectors by more than 70%. 13 Most of the emissions are the result of embodied and operational energy uses at all stages of the building ‘life cycle’. To reduce energy consumption and greenhouse gas emissions generated by the construction industry, buildings must become from energy consumers to energy producers (prosumers). Zero energy (or Net Zero) building/complex (similar to zero-emissions), could be a building, public or private, that its annual energy consumption is considerably reduced by energy-efficiency measures, and is supplied by renewable energy sources on the site. 14 During the measurement period (one year), most of zero energy buildings are connected to the urban grid and use its energy when on-site energy production is less than the building’s loads. The energy is returned to the grid when on-site energy production has excess. Alternatively, battery storage can be used to cope with the solar energy generation peaking during the day avoiding problems for management of the power grid. There are several definitions for zero energy building/complex. The main difference between them is the system borders – the location of renewable energy sources. According with different definitions, the energy production source can be found within the building footprint or inside the plot/site boundary; however, the building owner can also purchase ‘green’ energy off-site or import renewable energy sources (biomass, ethanol, etc.) for on-site energy production. Most of the existing examples that demonstrate zero energy buildings15,16 deal with relatively small buildings located in areas with a low urban density and then with a very high potential for solar collection in PV systems located in their envelope or surrounding open areas. Generally, studies of zero energy feasibility for high-rise buildings 17 relate to a single building and do not refer to challenges as mutual shading or variable buildings’ orientations. However, the integration of solar systems for energy generation from renewable sources in crowded cities where energy use is very intensive, is complex and presents new challenges to building and urban design.18,19 Mutual shadowing between buildings may be an obstacle to install photovoltaic arrays on the building envelope and open spaces around buildings compromising the feasibility of the ZEB equation.
Research goals, materials and methods
In this study, we examined urban renewal as an opportunity of ‘green’ cities upgrade by large-scale redevelopment, exploiting opportunities for improving energy efficiency on the one hand and for energy production by integrating photovoltaic systems on the other.
The main objectives are:
Determine the feasibility of zero (or near zero) energy/emissions neighbourhood design in terms of high density. Understand the relation between the required energy generation and the needed area of photovoltaic arrays in the building envelope.
For that purpose, we assessed and compared various density design alternatives of an existing urban plot in the coastal climate zone of Israel facing an approved ‘Urban Redesign’ densification program. According to it, plot density will increase by more than 200% compared to the existing condition. The densification plan and general design layout were already approved by the District Committee in 2015. We assumed that the energy supply options are renewable energy sources available within the building’s footprint or complex limits. The connection to the existing infrastructure grid is assumed as well. This study is focused on achieving zero energy goal with maximum potential on-site energy generation using PV panels. The design of the buildings and the apartments was done according with recommendations and guidelines to minimize their energy consumption.
The studied plot is located in Tel Aviv – Jaffa (32.5 N, 35E), one of the densest cities in Israel. According to Köppen climate classification, Israel has a hot-dry summer climate (Csa) that is characterized by dry summers and mild, wet winters. Tel Aviv is located in the coastal climate zone, affected by the direct proximity to the Mediterranean sea. During average climate conditions in Tel Aviv, Heating, Ventilating and Air-Conditioning (HVAC) usage is required about two-thirds of the year, while in the remaining time comfort conditions can be achieved without mechanical means. The relative humidity is high, so even if the summer temperatures are not extreme, there is heat stress during most of the summer days. In residential buildings in Israel, heating, cooling and ventilation are an integral part of annual indoor acclimatization, estimated at about 30% of total residential energy, 20 with variation for the different climate zones.
The city promotes a variety of urban renewal programs to control sprawl and tighten its borders. Residential buildings cover most of the plot area (Figure 1). All the existing residential buildings were built in the early 1950s when the construction speed was more important than quality.
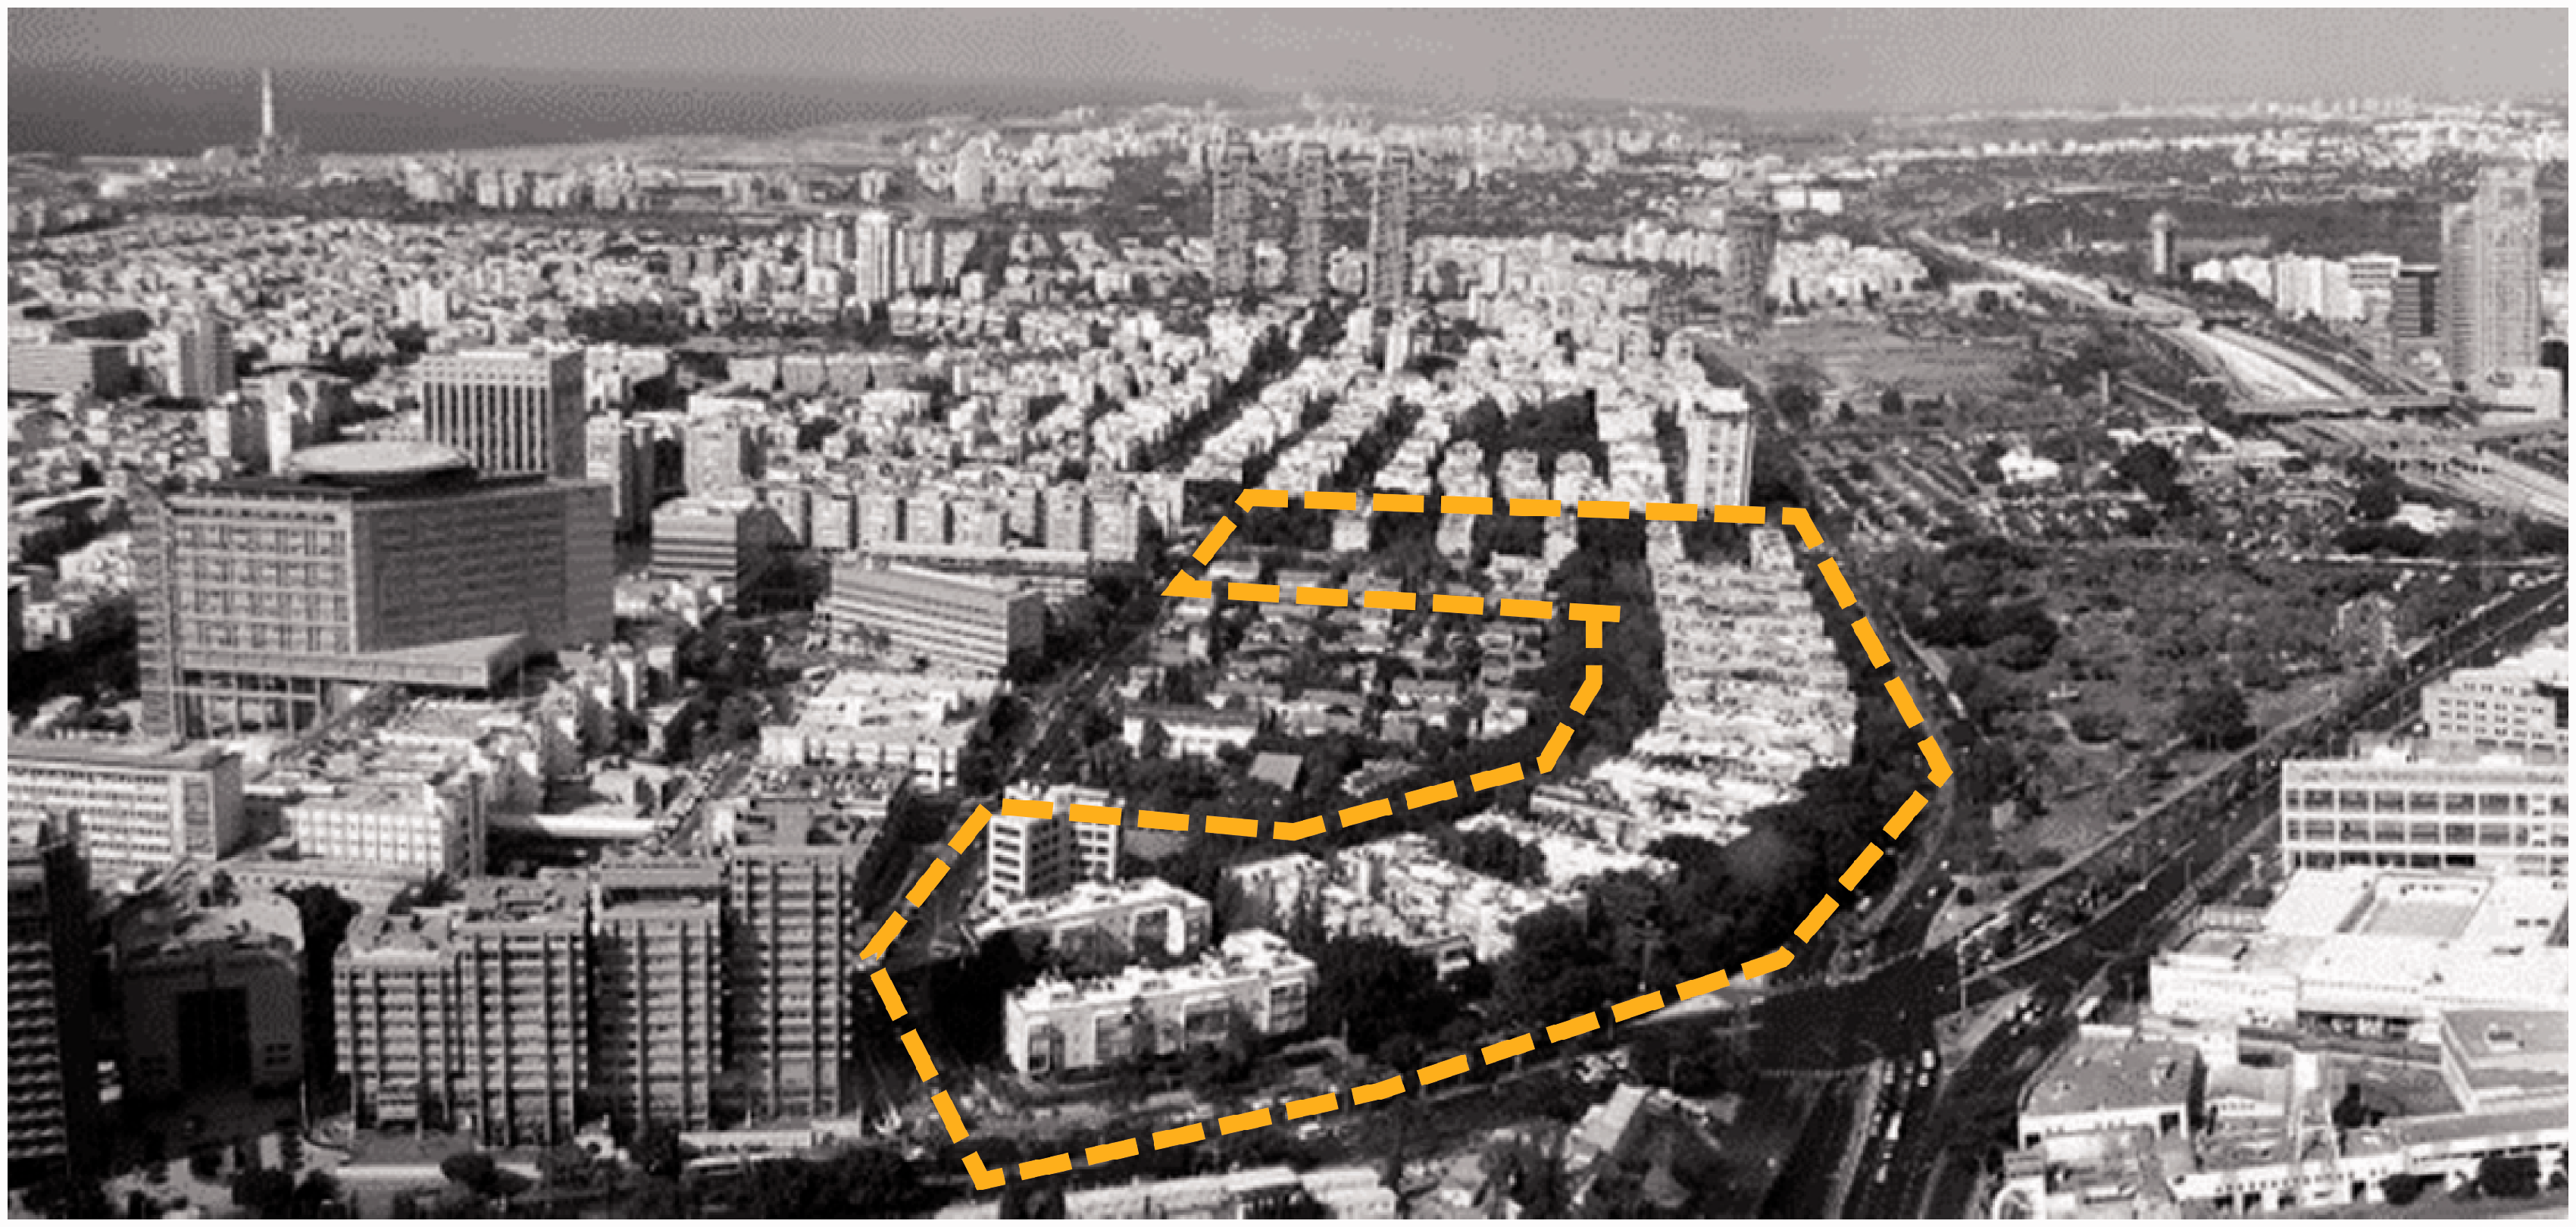
Aerial view of the existing plot condition.
Analysing design alternatives
The existing buildings in the plot are elongated with linear typology. They are located following the nearby road geometry; therefore, the same building typology appears with varied orientations (Figure 1). The plot contains 21 residential buildings; all of them are four floors constructions with 22 apartments in each building. All the apartments are similar but mirrored with an area of about 82 m2 each. Each building has three entrances in total, while staircases serve two adjacent apartments per typical floor (Figure 2).
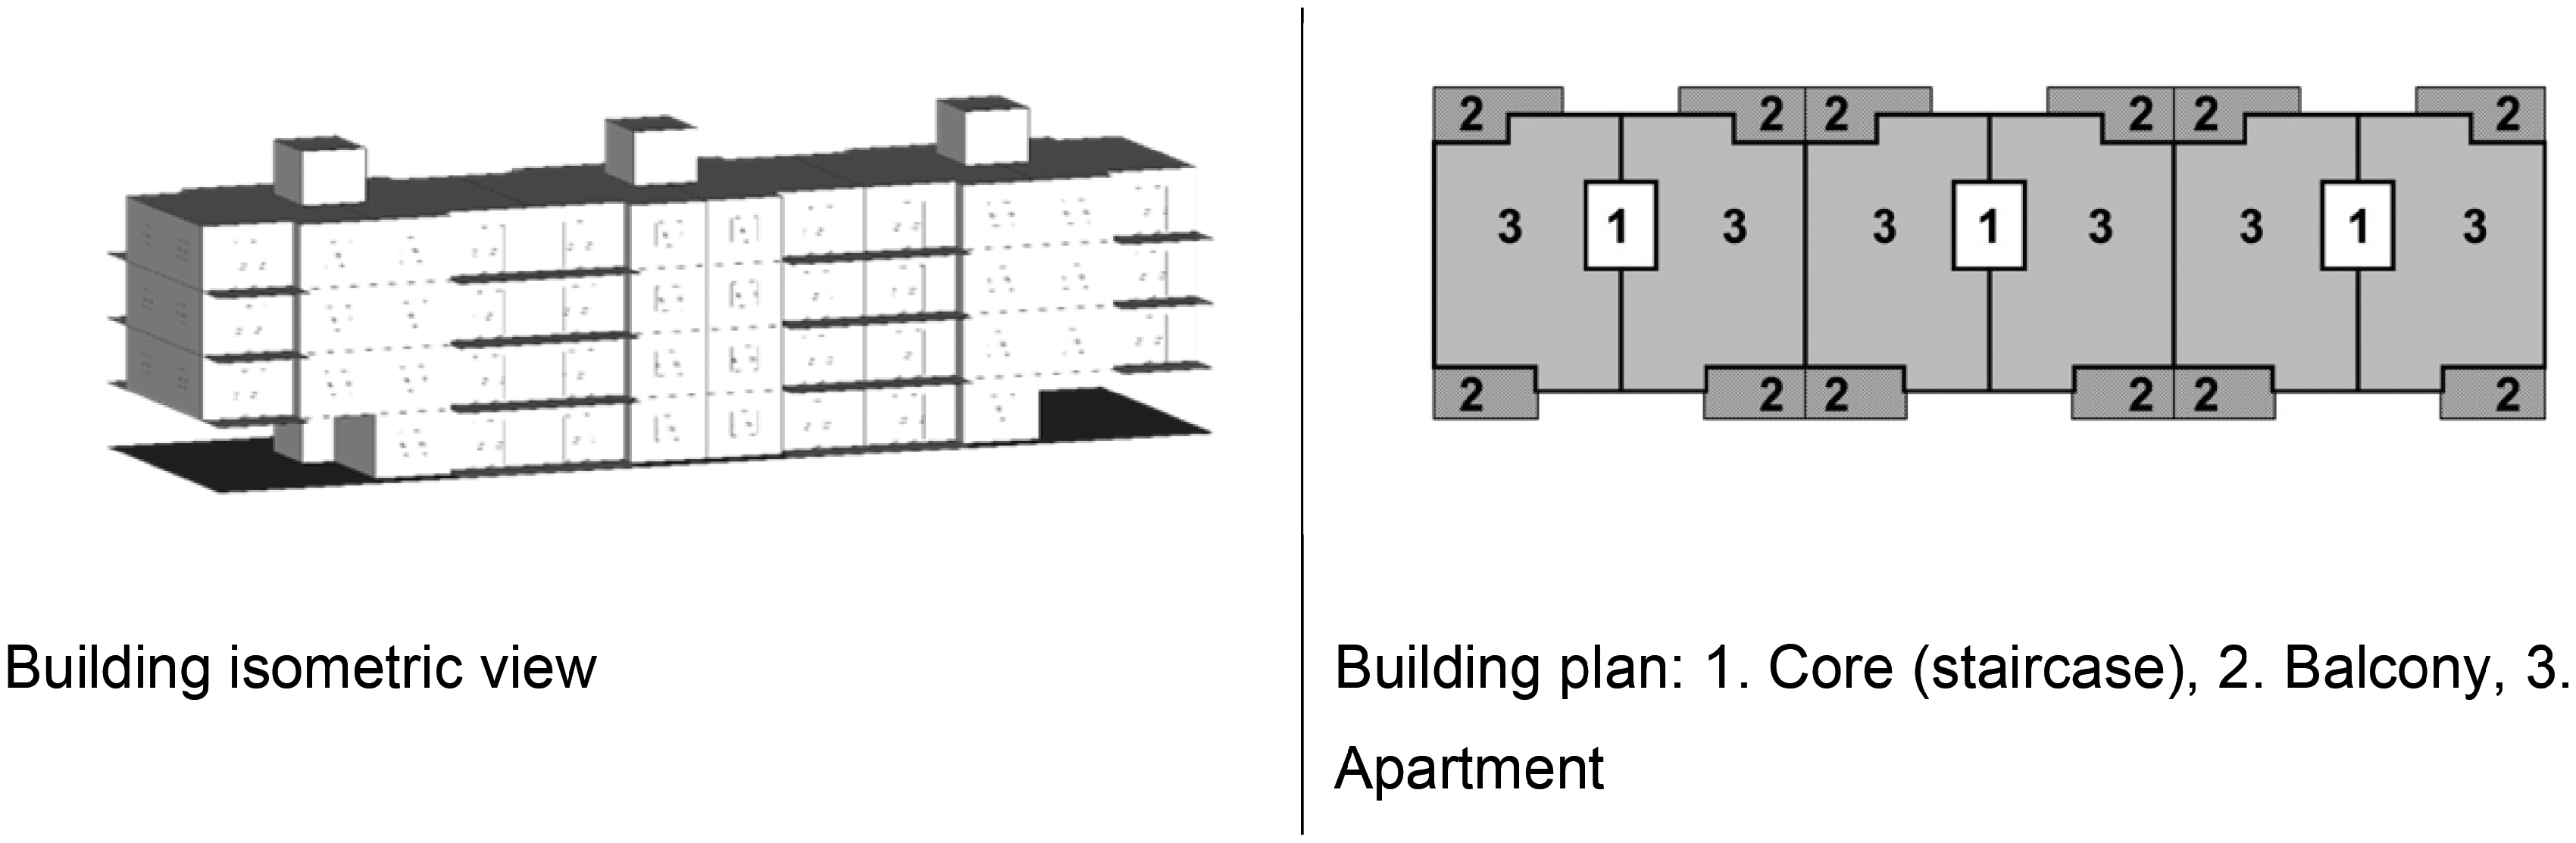
Typical existing building in the plot.
Along with the current plot condition, we analysed several additional geometric alternatives for densification (Figure 3):
0. Existing – current plot condition. 1. Existing + 2 floors – Urban renewal: two floors addition above the existing buildings. 2. Approved – plot urban redesign as approved by District Committee. 3. Proposed – Urban redesign of approved building’s volumes to maximize electricity production potential by minimizing mutual shading and maximizing usable roof area.
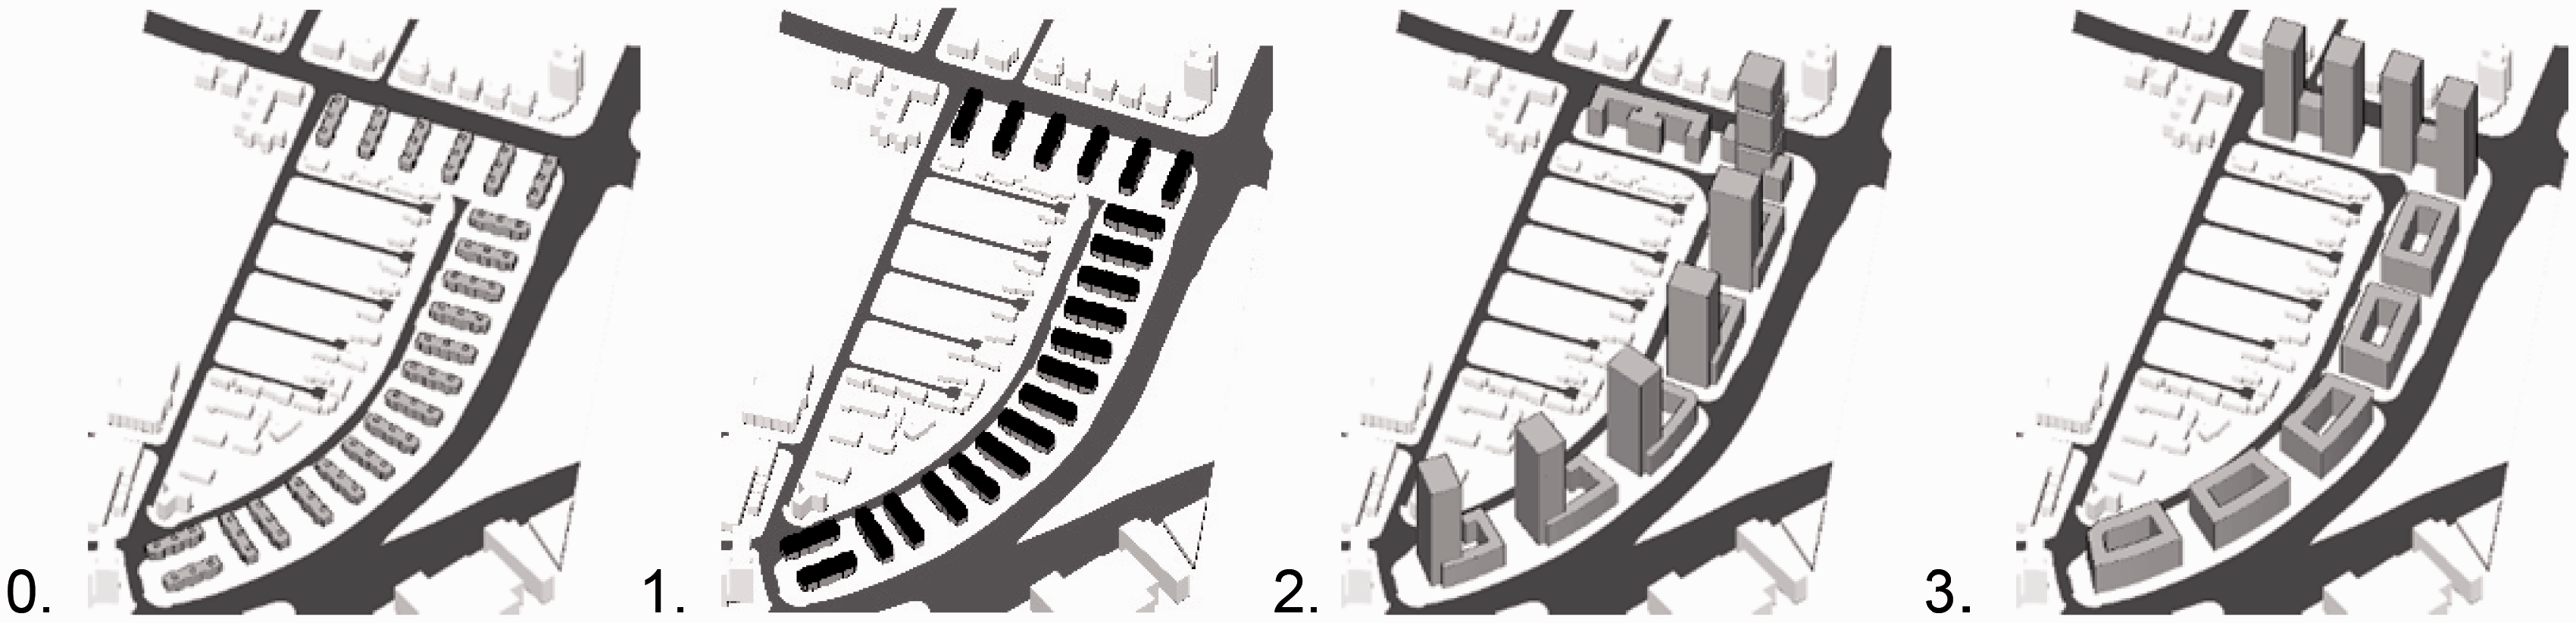
Isometric view of studied alternatives: 0 – existing, 1 – existing + 2 floors, 2 – approved, 3 – proposed.
The approved option presented in this paper (alternative 2) shows the proposal designed by Yashar Architects Ltd. This alternative contains three building block types as shown in Figure 4. The first one is an eight-storey elongated type building (Type 2_1), the second one is a 30-floor tower with eight floor base on the lower levels (Type 2_2). These two types appear one time within the case study area. The third block type (Type 2_3) is a six-floor building connected to the 25-floor tower and appears five times on the studied plot. According to the solar radiation simulation, in this case, the potential surfaces for PV panels’ installation are reduced due to mutual shading.
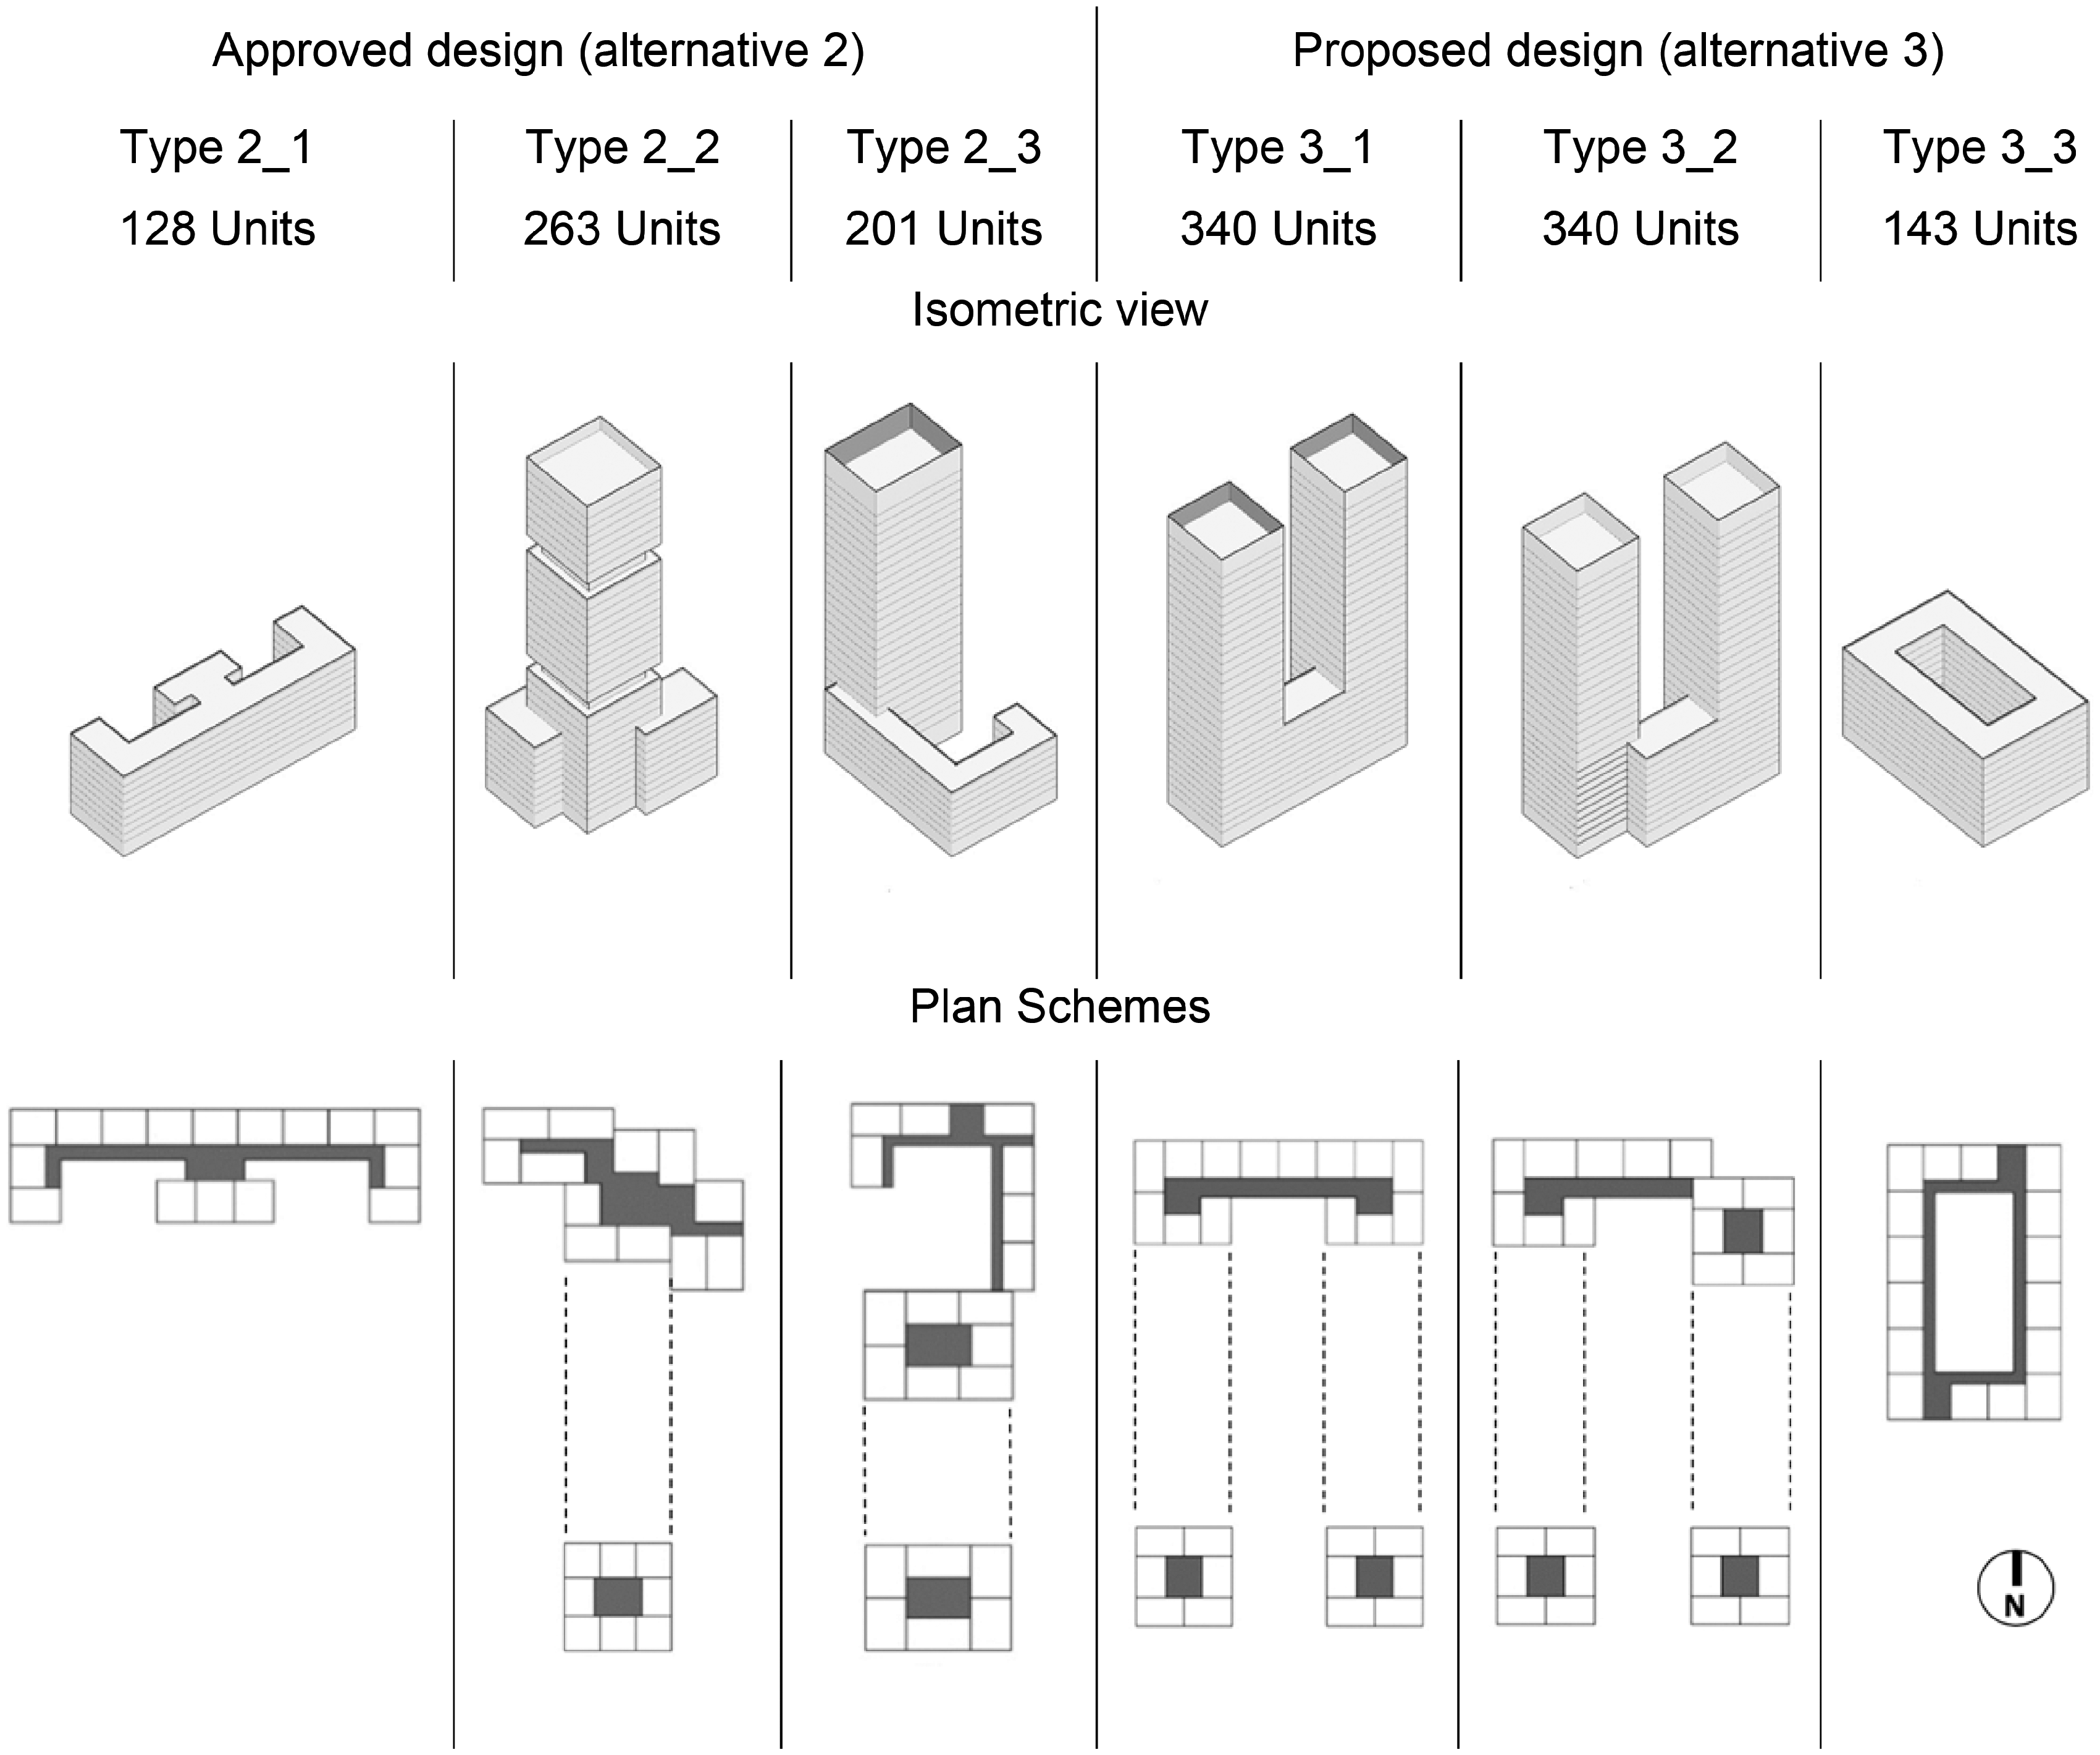
Isometric view and plan schemes of building types of approved and proposed urban redesign alternatives (2 and 3). White: residential units, gray: core/public corridor.
The proposed option (alternative 3) was designed to increase plot solar yield potential. It was done enabling maximum roof surfaces fully exposed to solar radiation increasing on-site electricity production. As the previous alternative, it contains three building block types. Two blocks of eight-floor buildings connected to two 20 floor towers above them (Types 3_1, 3_2). These blocks have minor geometry differences due to actual plot borders. They appear once at the northern plot to maximize towers south facade exposure to solar radiation and to prevent any shading on other buildings’ roofs within plot borders. Third, a closed city block type (Type 3_3), which appears five times. This block is a nine-floor courtyard building with flat roof fully exposed to solar radiation (Figure 4).
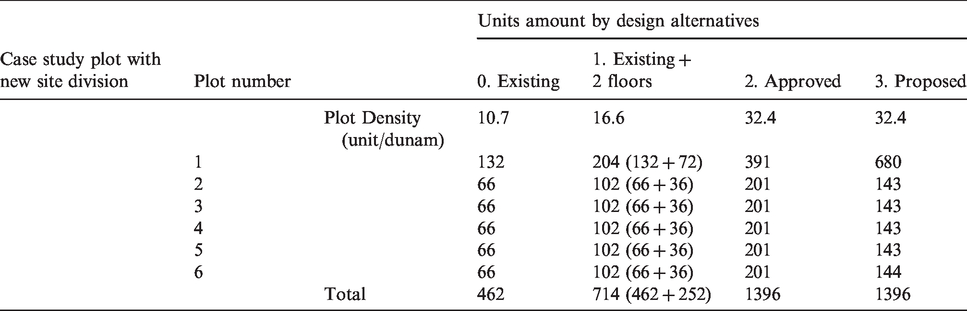
The current density is 10.7 units to 1 dunam (1000 m2). It does not match the minimal density requirements by the National Building Plan 35 21 in-force, which requires 12 units to 1 dunam. The newly approved plot Urban Redesign plan will increase plot density by about three times. Urban Renewal adding two floors to existing buildings (alternative 1) the density increases to 16.6 units/dunam. With both Urban Redesign densification alternatives, approved and proposed we achieved equal plot density, namely 32.4 housing units to 1 dunam as shown in Table 1.
Comparison of plot density by plot number and design alternatives.
Estimating energy consumption
The energy consumption analysis of the buildings in each design alternative was carried out by examining the different basic types of units that compose them.
22
Unit types are determined according to an analysis of existing buildings and according to the following criteria:
Number of external envelope elements – walls, roofs and floors; Unit’s main orientation; Window size and orientation; Mutual shading.
Existing typologies and their orientation were determined by examination of plans, sections, facades and other documents included in the related municipality files and GIS maps. Building’s typology principles of the proposed alternative were similar to those of the approved alternative buildings types.
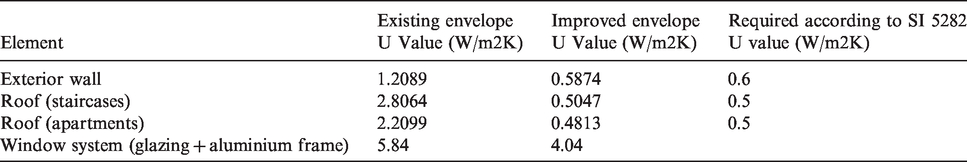
The construction materials of the existing buildings are reinforced concrete for floors, roofs and structural elements; concrete blocks with variable thickness for the external and internal walls; single clear glazing with aluminium frame for the windows. The colour of the building’s external walls is light ochre. At the time the buildings were designed and built, no insulation requirements existed, nor Green Building Standards or Energy Rating System. Thus, no extra insulation was applied to the buildings during construction, and no energy retrofit was conducted later. Also, in old housing complexes, outdated wasteful home appliances were commonly used. Therefore, two conditions of the existing alternative were checked: Existing (with outdated appliances and no envelope insulation), existing–improved (which more efficient appliances and envelope improved insulation according to Israeli Energy Rating of Buildings Standard (SI 5282) 23 ). Energy performance data for the existing condition was defined according to the current energy usage statistics. 24 For the existing condition, HVAC and artificial lighting represent about 42% of the total energy consumption of the household. 13 Unlike home appliances, HVAC and lighting energy consumption are affected by household area, climate and insulation conditions. Therefore, the statistic usage data were adapted to each unit condition according to its size, orientation and plan, and section location. HVAC and lighting energy consumption was calculated by energy simulations according to SI 5282 using the model Energy UI 25 which is based on the simulation engine Energy Plus. For the improved envelope conditions, a layer of up to 6.5 cm rigid polystyrene on exterior walls and slabs exposed to the outdoor was added. Besides, single glazing on windows was replaced by double clear glazing with aluminium frame. According to SI 5282, no additional thermal glazing improvement is needed due to relatively hot local climate conditions. Natural night ventilation was assumed in all alternatives during the hot season. At first, existing and existing-improved conditions were compared to gain a better understanding of the energy improvements effect. Further, improved envelope properties were applied to the additional alternatives; alternative 1: existing + 2 floors, alternative 2: approved and alternative 3: proposed (Table 2).
Existing-as built section compared to existing–improved section and required by SI 5282. 23
Following the methodology proposed by Capeluto and Shaviv, 22 we determined the overall energy consumption of each building according to its morphology, gathering together the consumption data of all of its unit types. The energy consumption results were used as a basis for all further comparative analysis of the various design alternatives. As approved in the original plan, in Approved and Proposed alternatives, the ground floor of all building types was considered as a non-residential public floor. Both alternatives aim to maximize their density conditions but do not necessarily consider neighbour building’s solar rights. Design within the solar envelope to consider solar rights of neighbours and adjacent open areas according to proper requirements, should be made carefully to ensure solar access and maximizing land use and project’s feasibility. 26 In the existing current alternative, due to actual building height and distance from each other, there is no mutual shading between them. In the case of adding two floors (approximately 6 m height) to the existing alternative, winter shading of the ground floor appears (Figure 5).
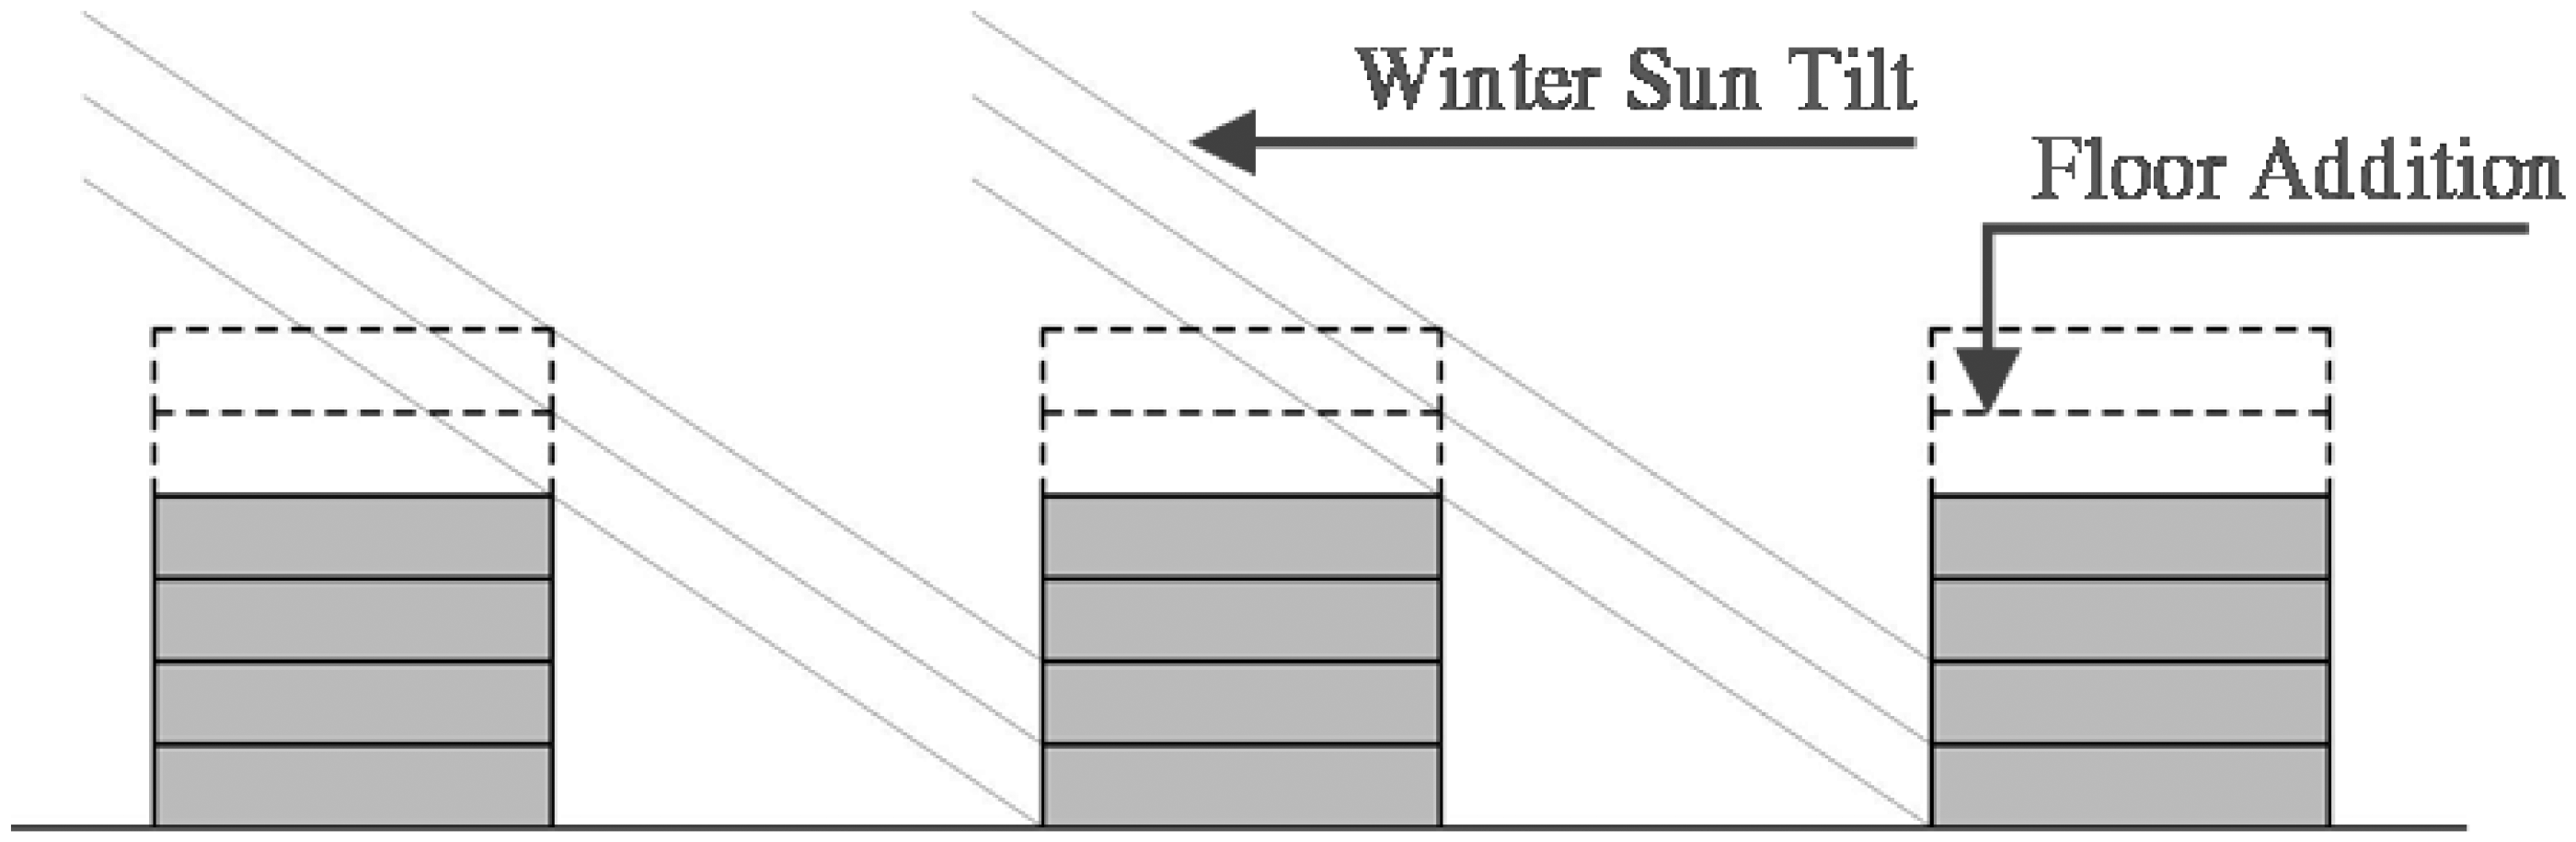
Schematic diagram of mutual winter shading for south-north oriented building.
Electricity consumption and energy production of Approved and Proposed alternatives will be affected by mutual shading due to building heights. Therefore, additional calculations of the buildings with an improved envelope with possible winter shading consideration due to mutual influences were performed with Energy UI. Energy UI considers 60% shading in windows as winter shading.
Assessing energy generation
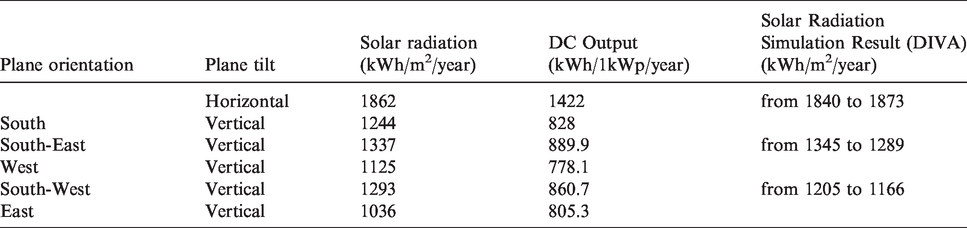
From a variety of available renewable energy options, such as wind turbines, biomass or concentrated photovoltaics arrays (CPV), in this work a building integrated photovoltaic (BIPV) system was chosen as for electricity on-site production. BIPV is a widely used renewable energy source in Israel, relatively accessible and easy for installation and maintenance in dense areas. This system is suitable for installation on buildings and does not require unique site conditions. To identify suitable surfaces for PV panels installation, solar radiation simulations were conducted with DIVA for RHINO 27 for all design alternatives. As a result, we determined the total annual solar radiation which reaches each building’s surface. For calibration and validation purposes, the outcome of the simulations for unshaded surfaces was compared to the solar radiation data from the Design Guide for PV Systems in Israel’s Cities. 28 The design tables presented in the guide are normalized to 1 kWp of PV and are suitable for monocrystalline, polycrystalline, thin-film or any other PV technology. The technology selection should be done considering different aspects as efficiency and available area, shading, cost, degradation rate, heat tolerance, waste, among others. Due to slight rotation towards North of the case study plot, only three orientations were relevant for PV implementation: horizontal, south-east and south-west. Good accuracy with measured radiation values that appear in the PV Guide was obtained (Table 3).
Several alternatives for the location of the PV system were considered according to the following criteria:
The location of PV arrays will be determined for maximizing electricity generation. PV arrays should be within the building footprint and integrated into the building design. PV arrays should be exposed to the sun at least 4 hours between 9:00 AM and 3:00 PM on 21st December as required by the Israeli Green Buildings Standard (SI 5281).
29
In addition to fully exposed areas, also partially shaded surfaces were considered for electricity production, provided a minimum threshold value of annual solar radiation was available. Lower values than 1000 kWh/m2/year, similar to the annual solar radiation available in East facades as shown in Table 3, were not considered as suitable for PV array installation.
For the case study alternatives, the most suitable way of roof-based PV array installation was found to be horizontal, parallel to the roof (0° tilt). Although the electricity production of this installation method is about 9% lower than the most efficient way (south orientation, 30° tilt), the advantage on the horizontal array is that it can be suited to any building orientation, can be smoothly integrated into building design and creates minimum shading on neighbouring buildings. Additional PV arrays can be placed on the facades oriented to south-west and south-east. Typically, tower’s roofs are small in relation to the total floor area and are occupied by thermo-solar panels and other technical equipment with little or no place left for PV arrays. Therefore, tower type buildings’ roofs weren’t considered as surfaces for potential energy production. In addition, the three lower floors of each building were not also considered for PV installation. Lower public floors (in alternatives 2 and 3) usually have a glazed facade with no opaque surfaces for PV installation, and partial or constant shading can be caused by urban infrastructures like street lights, traffic signs, trees and others.
Results and discussion
Energy consumption
In the existing alternative, seven unique basic unit types were identified. The big number of units types is due to the elongated geometry and partial ground floor. These geometry parameters create a variety of external walls configurations that cause perceptible electricity consumption differences between the units. In this alterative, the internal middle-located units have two external facades, while units at the edge of the buildings have three which allows for cross ventilation. Windows for alternatives 0 and 1 in the energy model were determined according to the current situation size and geometry. According to the simulation results, middle located units with minimal external walls number have lower energy consumption, while roof edge units have the highest (E and F in Figure 6).
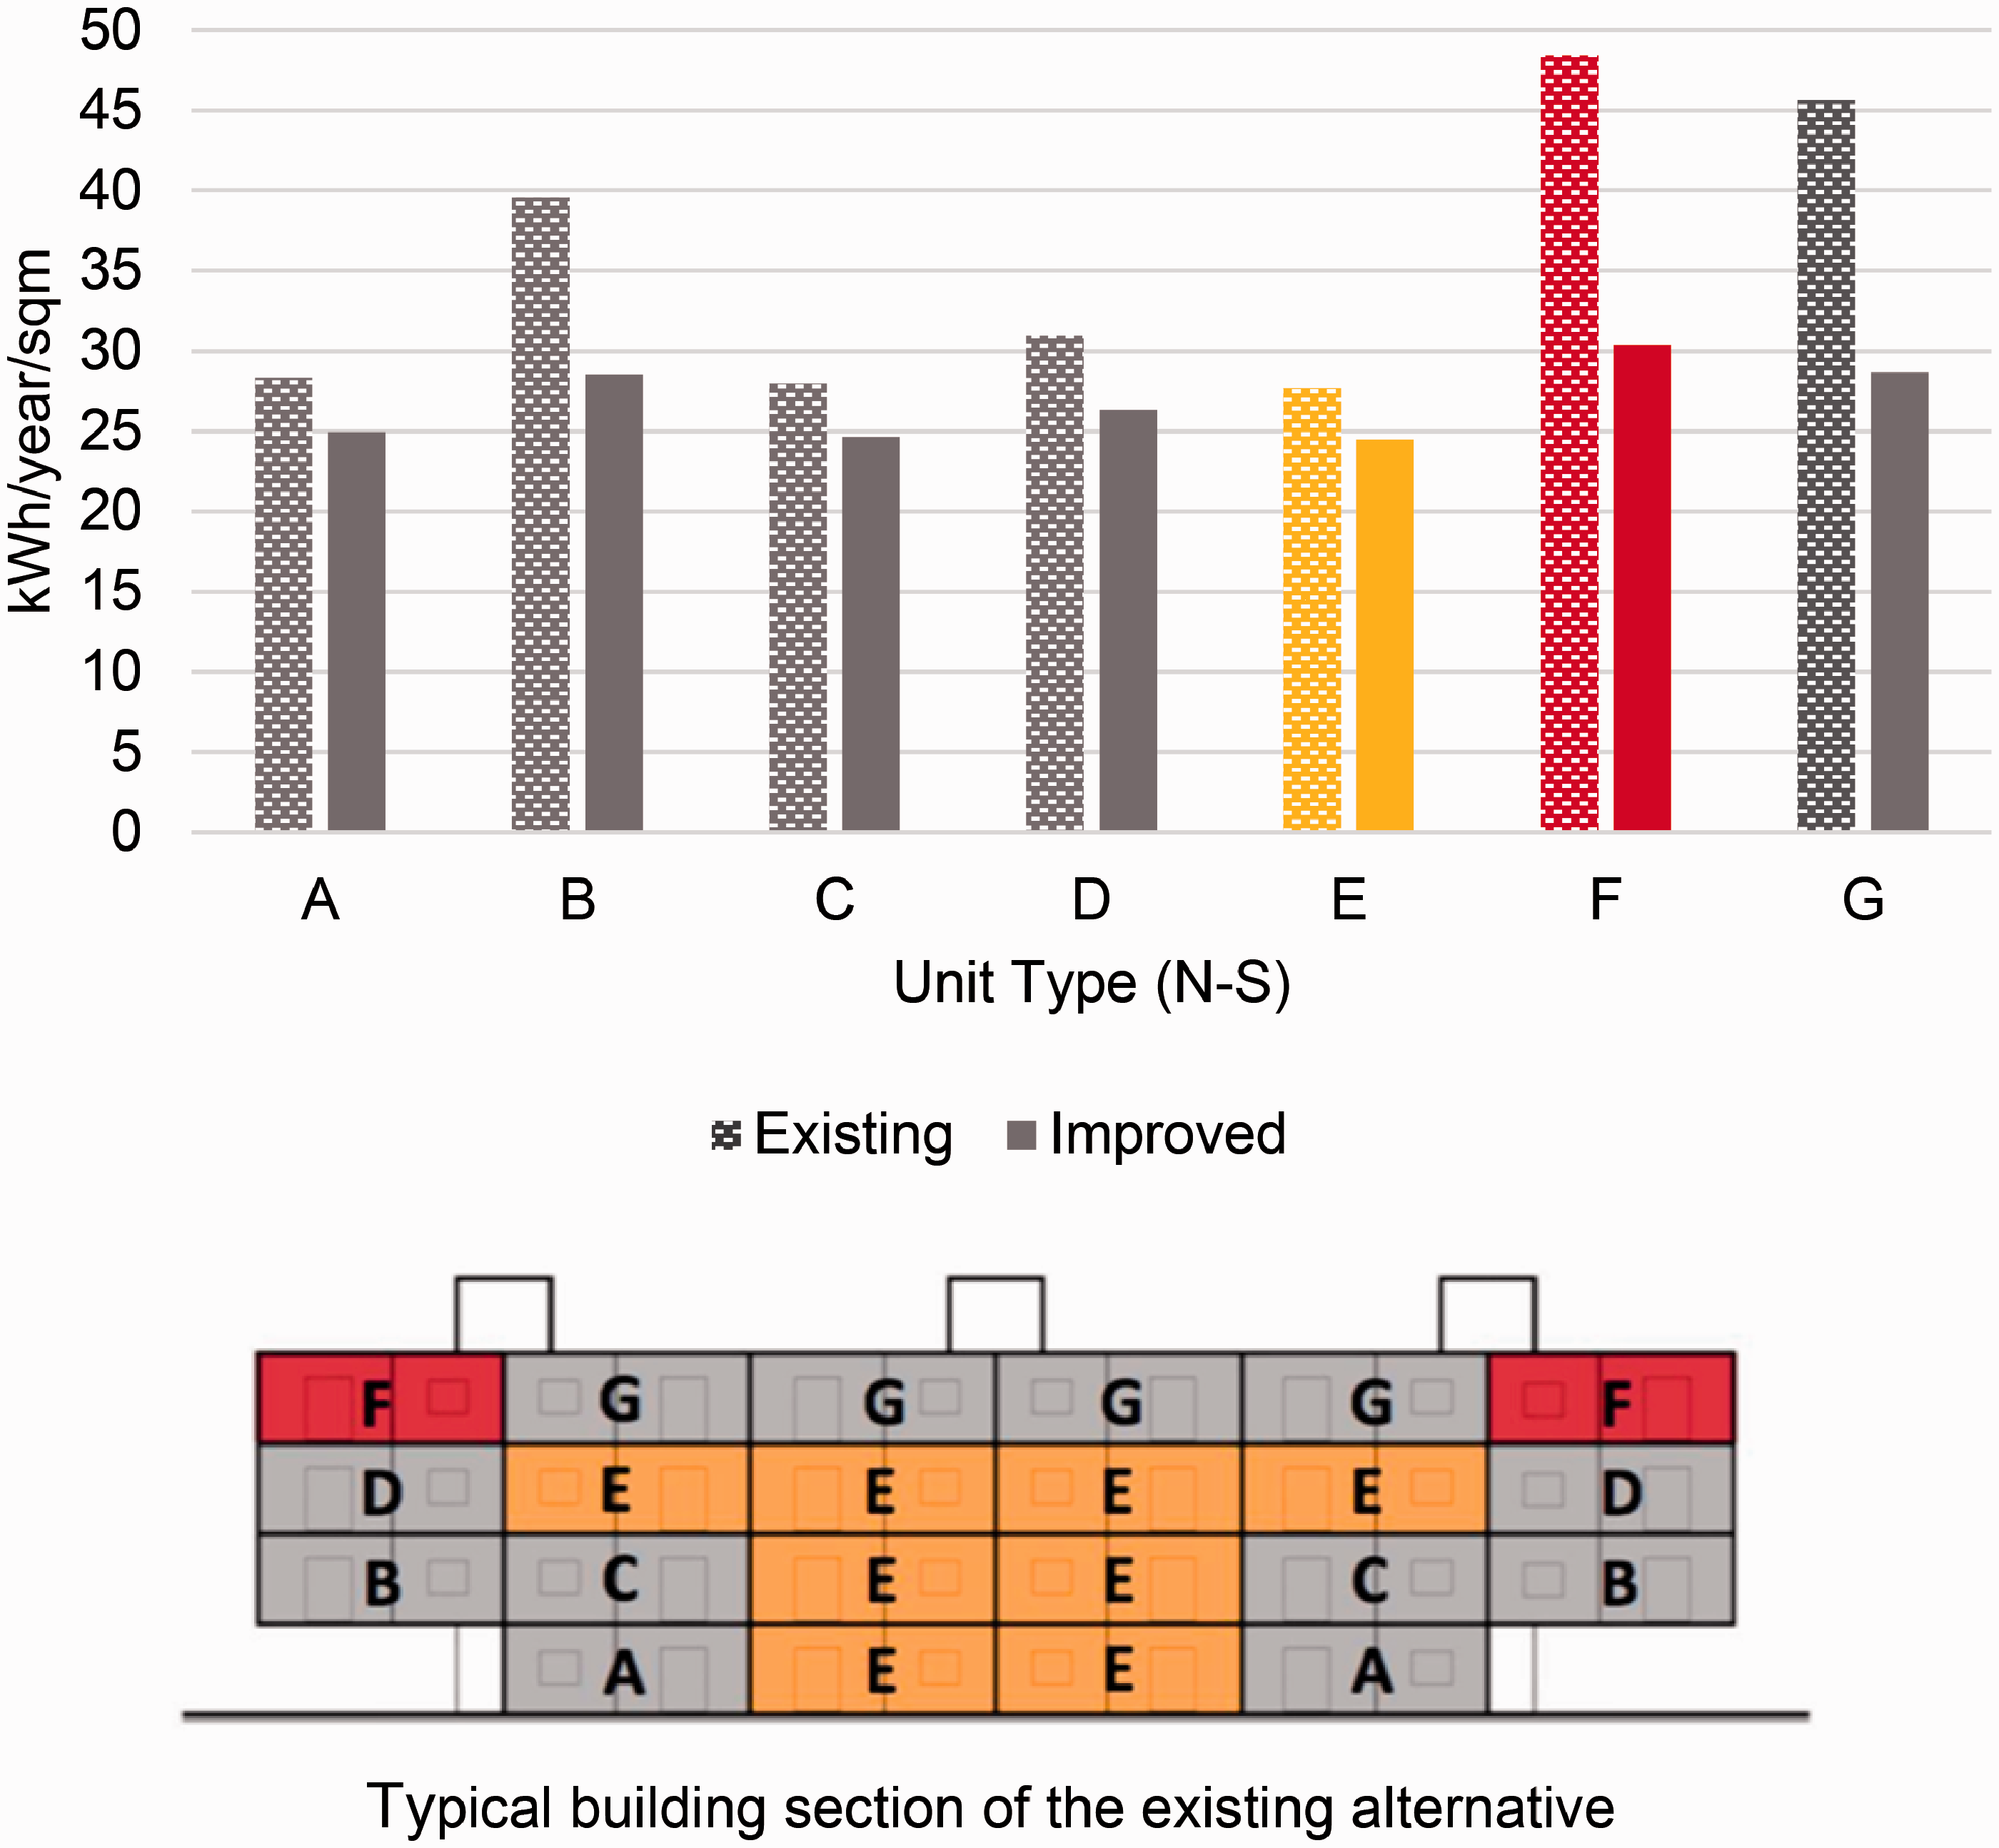
Comparison of the total energy consumption for heating, cooling and lighting (HVAC + lighting) (kWh/year/m2) of various residential units’ types of the existing and existing – improved design alternatives (0 and 1). Most efficient units marked in yellow, units with the highest consumption marked in red.
Typical building section of the existing alternative
In both proposed and approved alternatives, we identified two main types of basic units in every building block type. Type A apartment is a unit with facade orientation in one direction and a single external facade wall. Its depth does not exceed 10 m to provide basic daylight access to main dwelling areas in the apartment. The lack of cross-ventilation in these units is also controversial and can increase their energy consumption. With that being said this typology is often used in high-rise residential buildings in Israel. This topic deserves re-examination and in-depth discussion among designers and authorities, out of the scope of this paper. Type B apartments are corner units and with orientation in more than one direction, providing better cross-ventilation and daylight conditions. These two base types have various subtypes that slightly vary in area and orientation. The energy model was built as a tower type building to assess maximum number of unit types with minimum calculation time. Units’ windows for alternatives 2 and 3 were set according to SI 5282, namely 15% of the floor area. Although in the standard openings’ sizes varies according to facade orientation, the maximum allowed size was applied to each unit according to Israeli residential design habits. In these alternatives, south-oriented A and B units have better energy performance results than north oriented. West and east oriented type A units have higher energy consumption compared to north and south (Figure 7). Similar to the previous existing design alternatives (0 and 1), typical middle floor units’ energy performance is better compared to the upper floor (roof) units of the same building due to differences in the external envelope area.
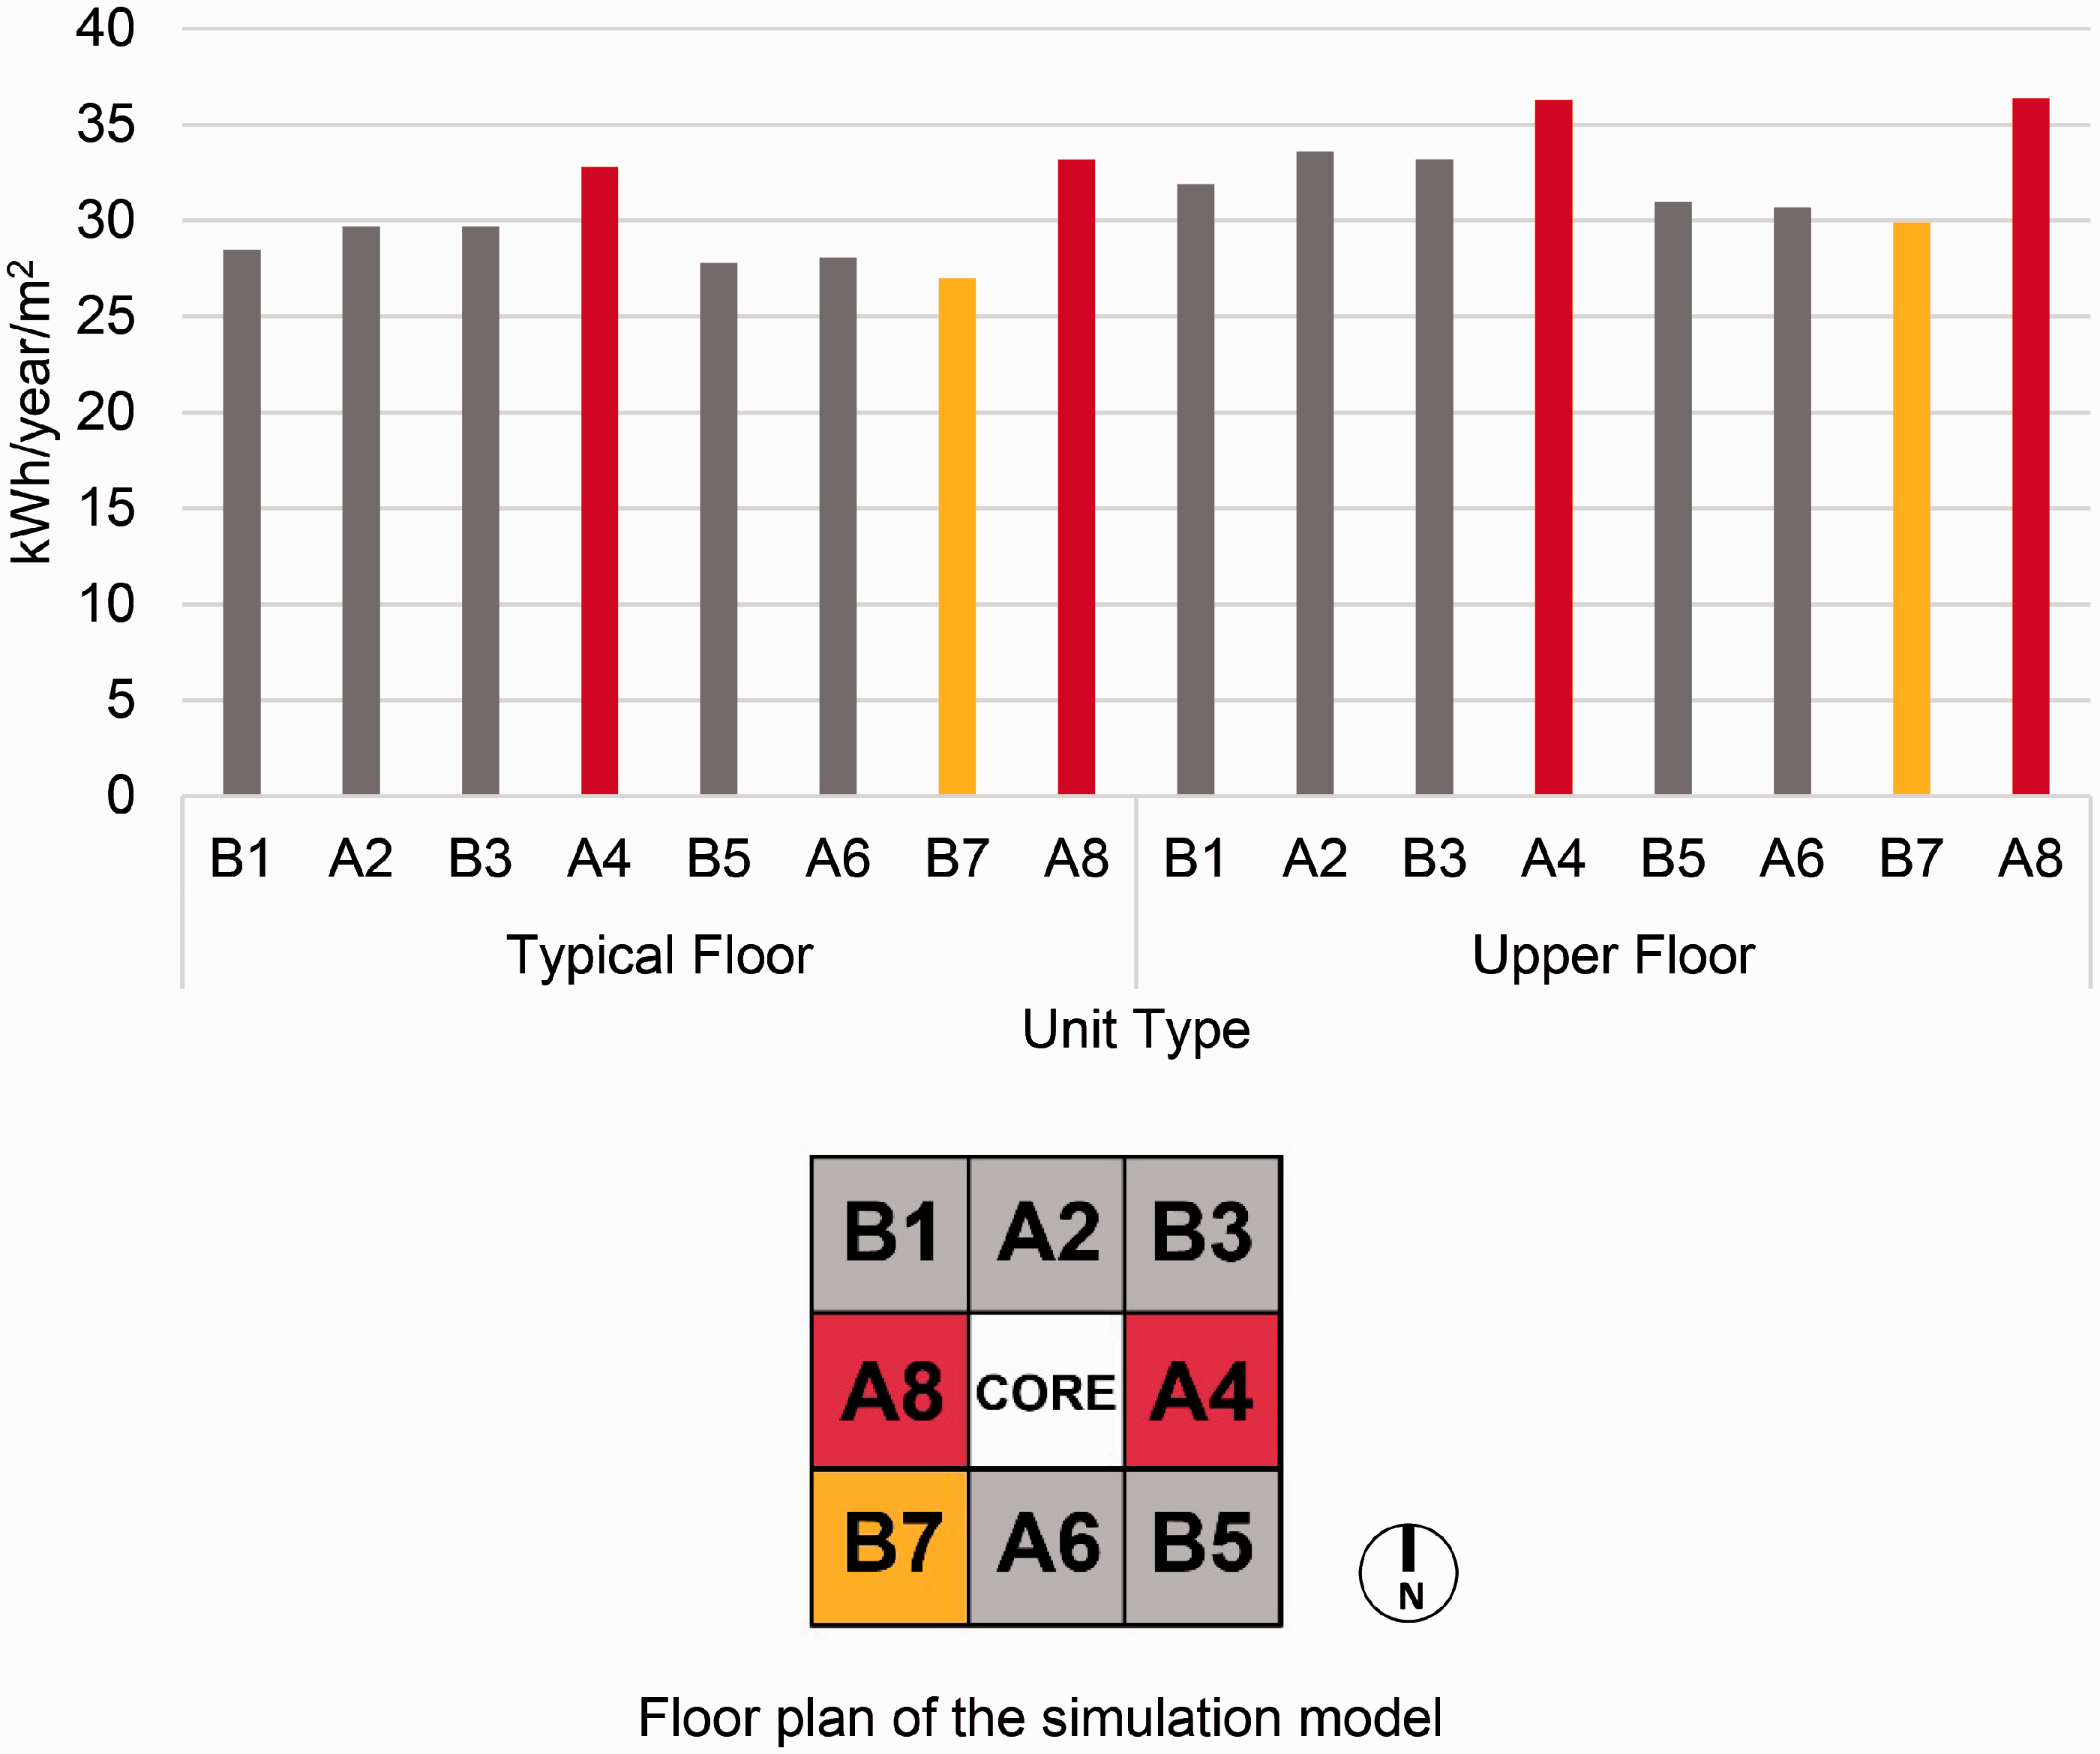
Comparison of energy consumption for heating, cooling, and lighting (kWh/year/m2) between various residential units’ types of approved and proposed design alternatives (2 and 3). Most efficient units marked in yellow, units with the highest consumption marked in red.
Figures 8 and 9 show the comparison of the average energy consumption for the whole building in the different design alternatives. As can be seen in Figure 7, there is a direct impact of units’ orientation on their energy performance. Improved envelope, compared to existing, shows about 25% upgrade in the energy performance of the units while preserving relatively the differences between orientations and units’ types. Efficient home appliances can decrease energy consumption significantly, in our calculations we assumed a conservative value of 5%.
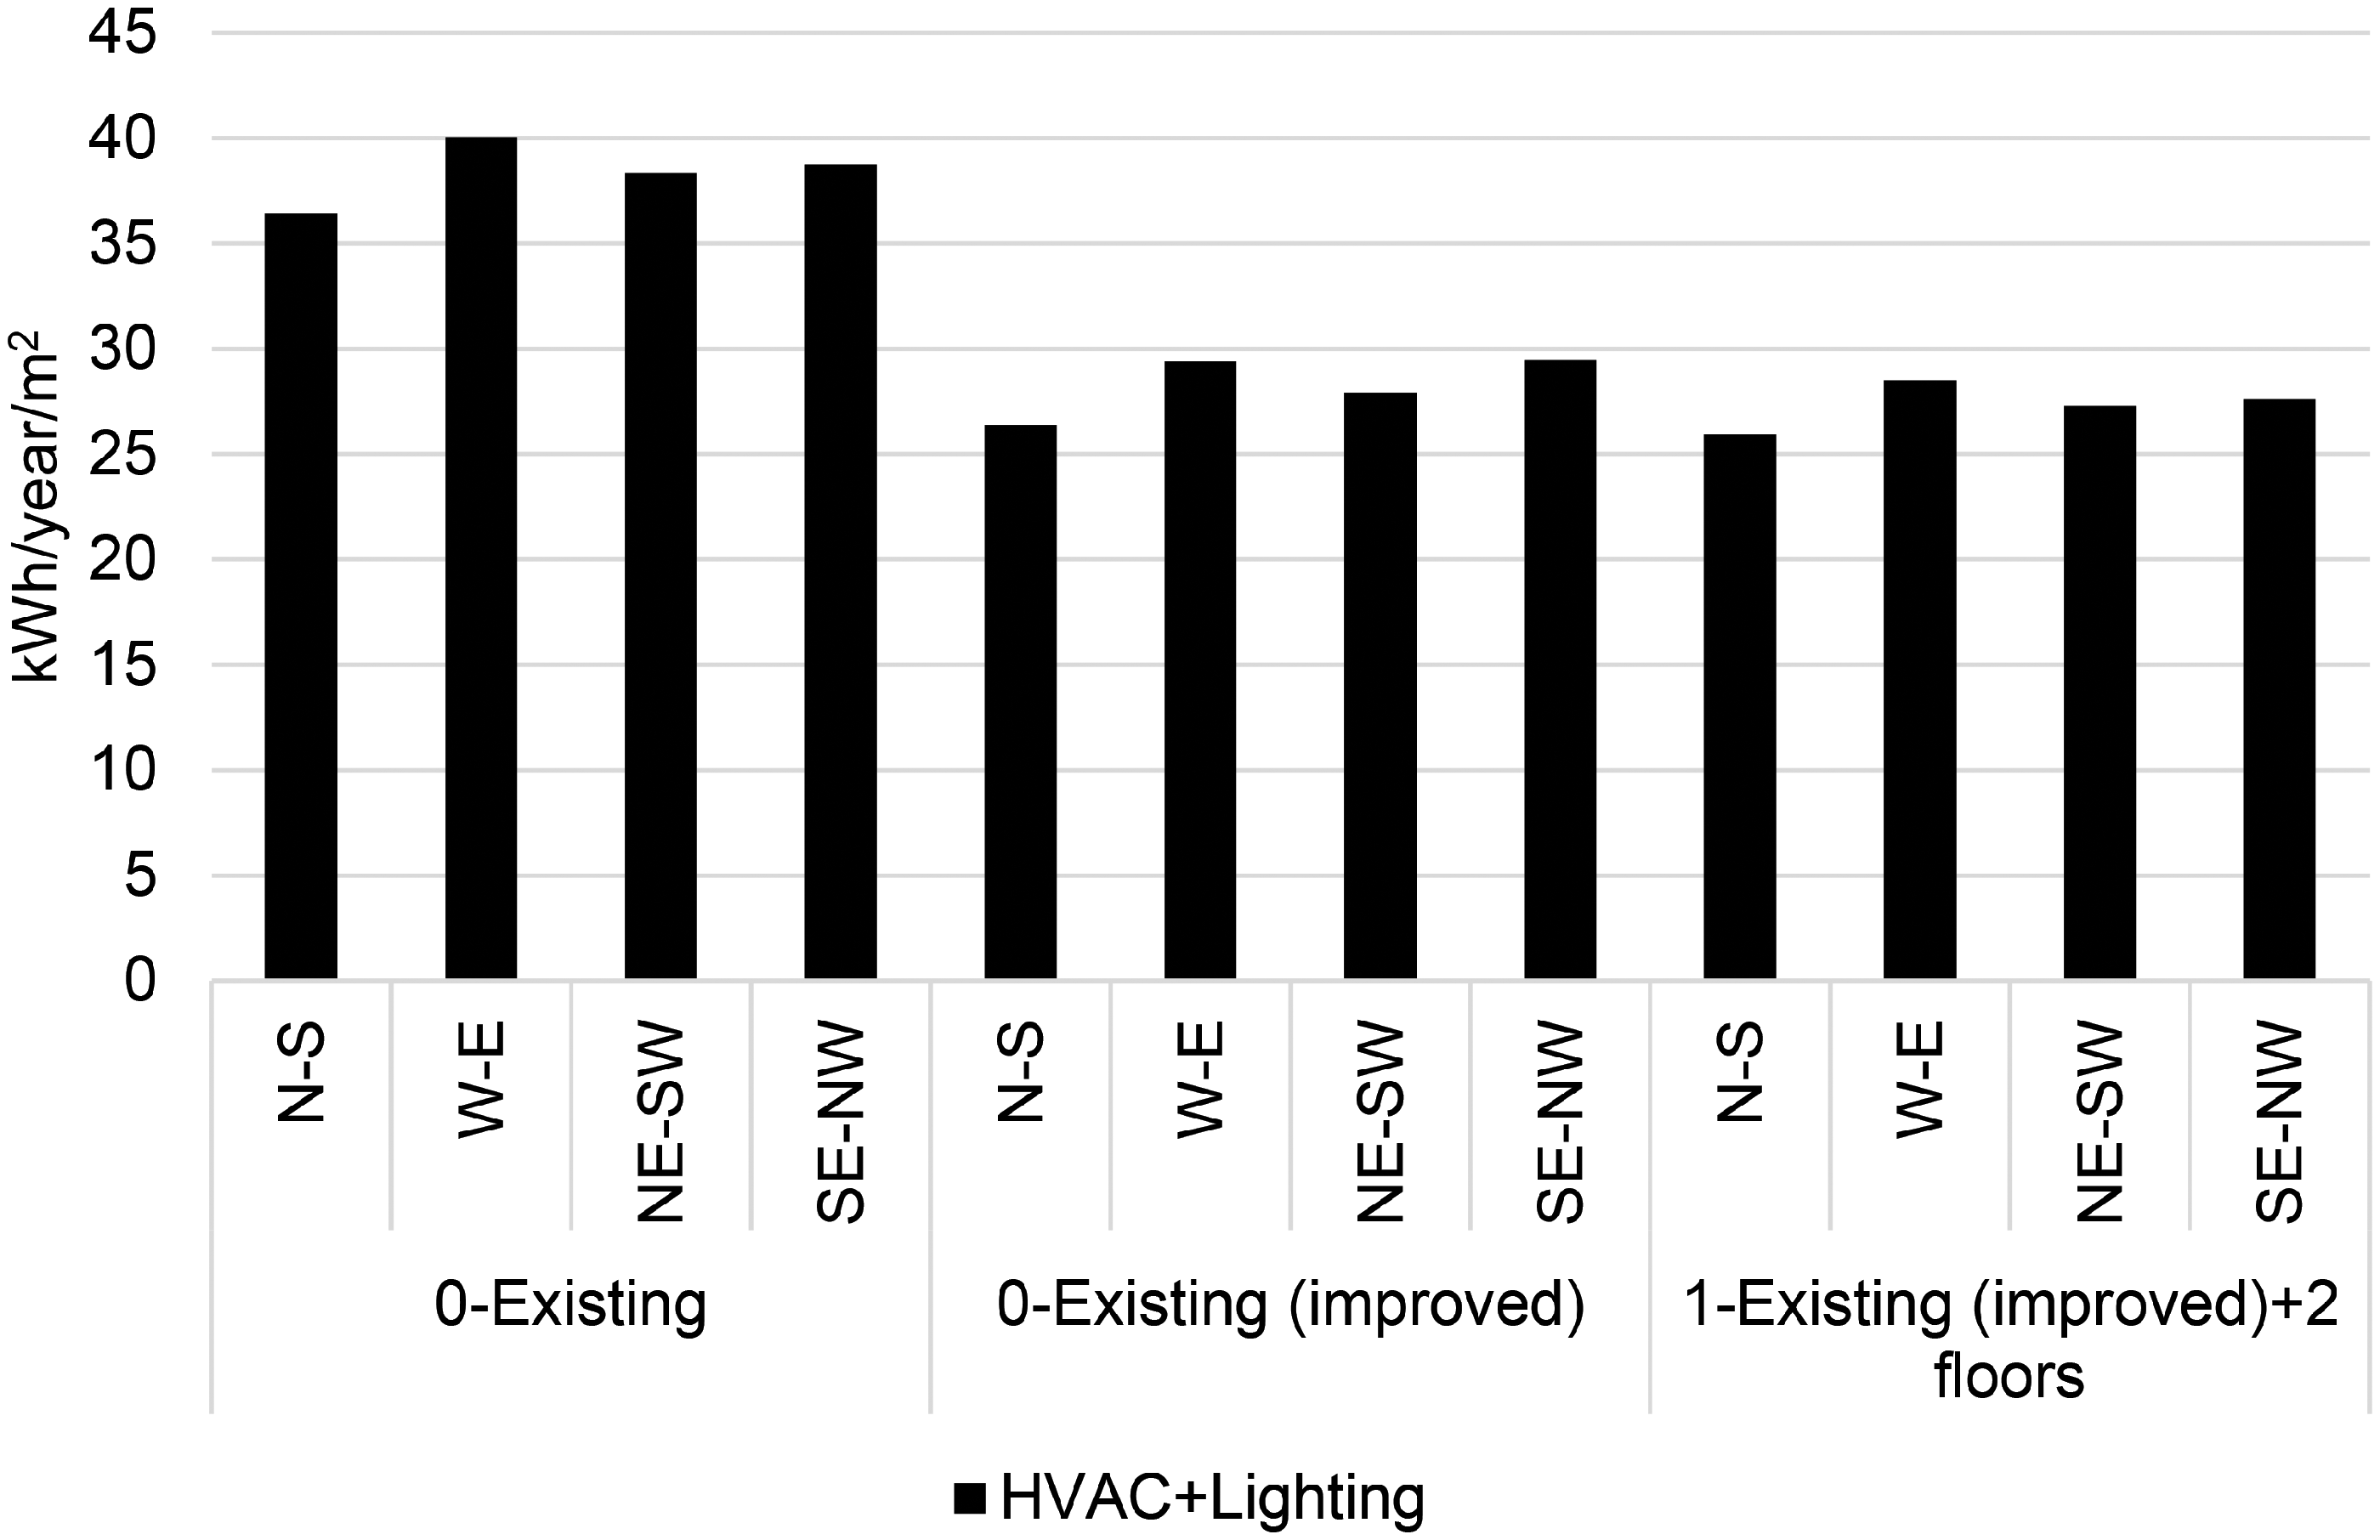
Average electricity consumption (HVAC+ Lighting) in urban renewal altrenatives for various orientations. Left: existing building (alternative 0), middle: existing building (improved) (alternative 0), right: Existing building + 2 floors (alternative 1).
Average electricity consumption (HVAC+ Lighting) in urban redesign alternatives. Left: approved (alternative 1), Right: proposed (alternative 2).
The addition of two floors to the existing improved building, slightly improves the overall average performance by adding more internal and efficient units (type D and E in Figure 6). We can conclude that elongated buildings with main orientation close to south–north with cross ventilation show better performance results than other orientations, while rotated east–west were the worst (Figure 8). In tower buildings, the influence of orientation disappears because there is a similar number of units in all directions. However, the relative performance of the building in terms of energy consumption for HVAC and lighting reflects the large number of middle typical floors that are energy efficient as seen in Figure 9.
Energy generation
Regarding the existing case study alternatives (0 and 1), the most worthwhile surface for energy production is the large roof due to lack of mutual shading between buildings, particularly after the two floor’s addition (Figure 10).
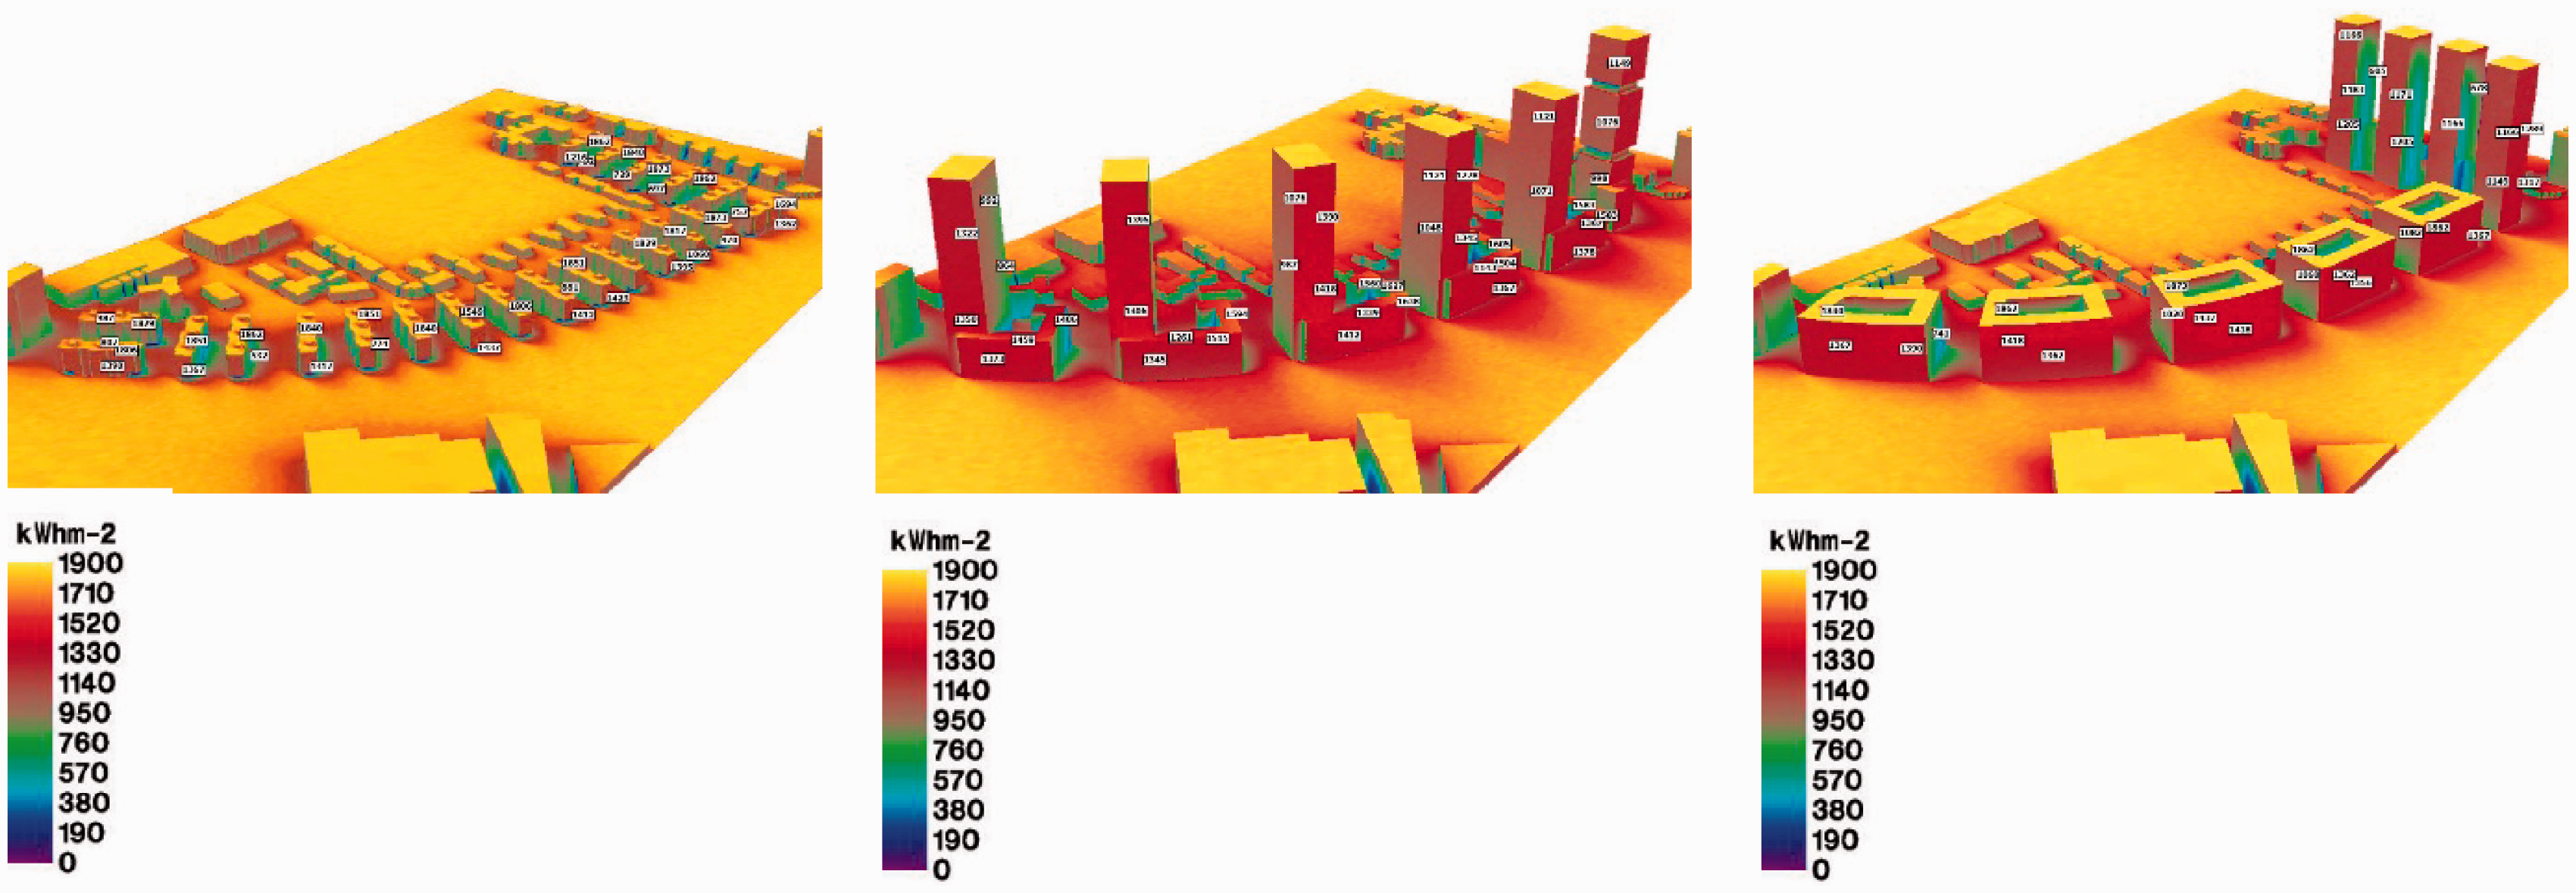
Solar radiation map of the various plot conditions: 0-existing, 2-approved, 3-proposed.
Existing situation – Figure 11 presents the energy consumption of the entire building including appliances in the existing situation for different orientations (alternative 0), improved (alternative 1), and with the addition of two floors (alternative 2). Moreover, the electricity generation capacity using PV on roof and facades is also shown assuming various panel’s efficiencies. Results show that without energy envelope improvements, the annual electricity demand for acclimatization systems and lighting can be covered by 12% efficiency PV system production covering the entire roof. After an energy-efficient envelope upgrade of the Existing alternative, the energy needed for acclimatization and lighting can be generated by 80% of the roof area, leaving enough free area for hot water panels which are mandatory in Israel. For this case study using low-efficiency PV panels, 50% energy generation compared to total consumption within building borders should be a realistic target. However, currently, more effective solar panels, from 16% to more than 20% are available in the market. Moreover, in 2014, a four-junction solar cell with 46% efficiency was announced. 30 Therefore, less area is required for more efficient PV array installation, which can bring us, in this case, closer to the goal of net-zero energy. Under the scenario of very efficient solar panels (20–30% efficiency), it is theoretically possible to achieve zero-energy goal for the existing plot situation with improved envelope. When plot density increases (addition of two floors), 20% efficiency panels could cover up to two-thirds of the total consumption. Zero energy for this condition will be possible to achieve with 30–40% efficient PV panels (Figure 10).
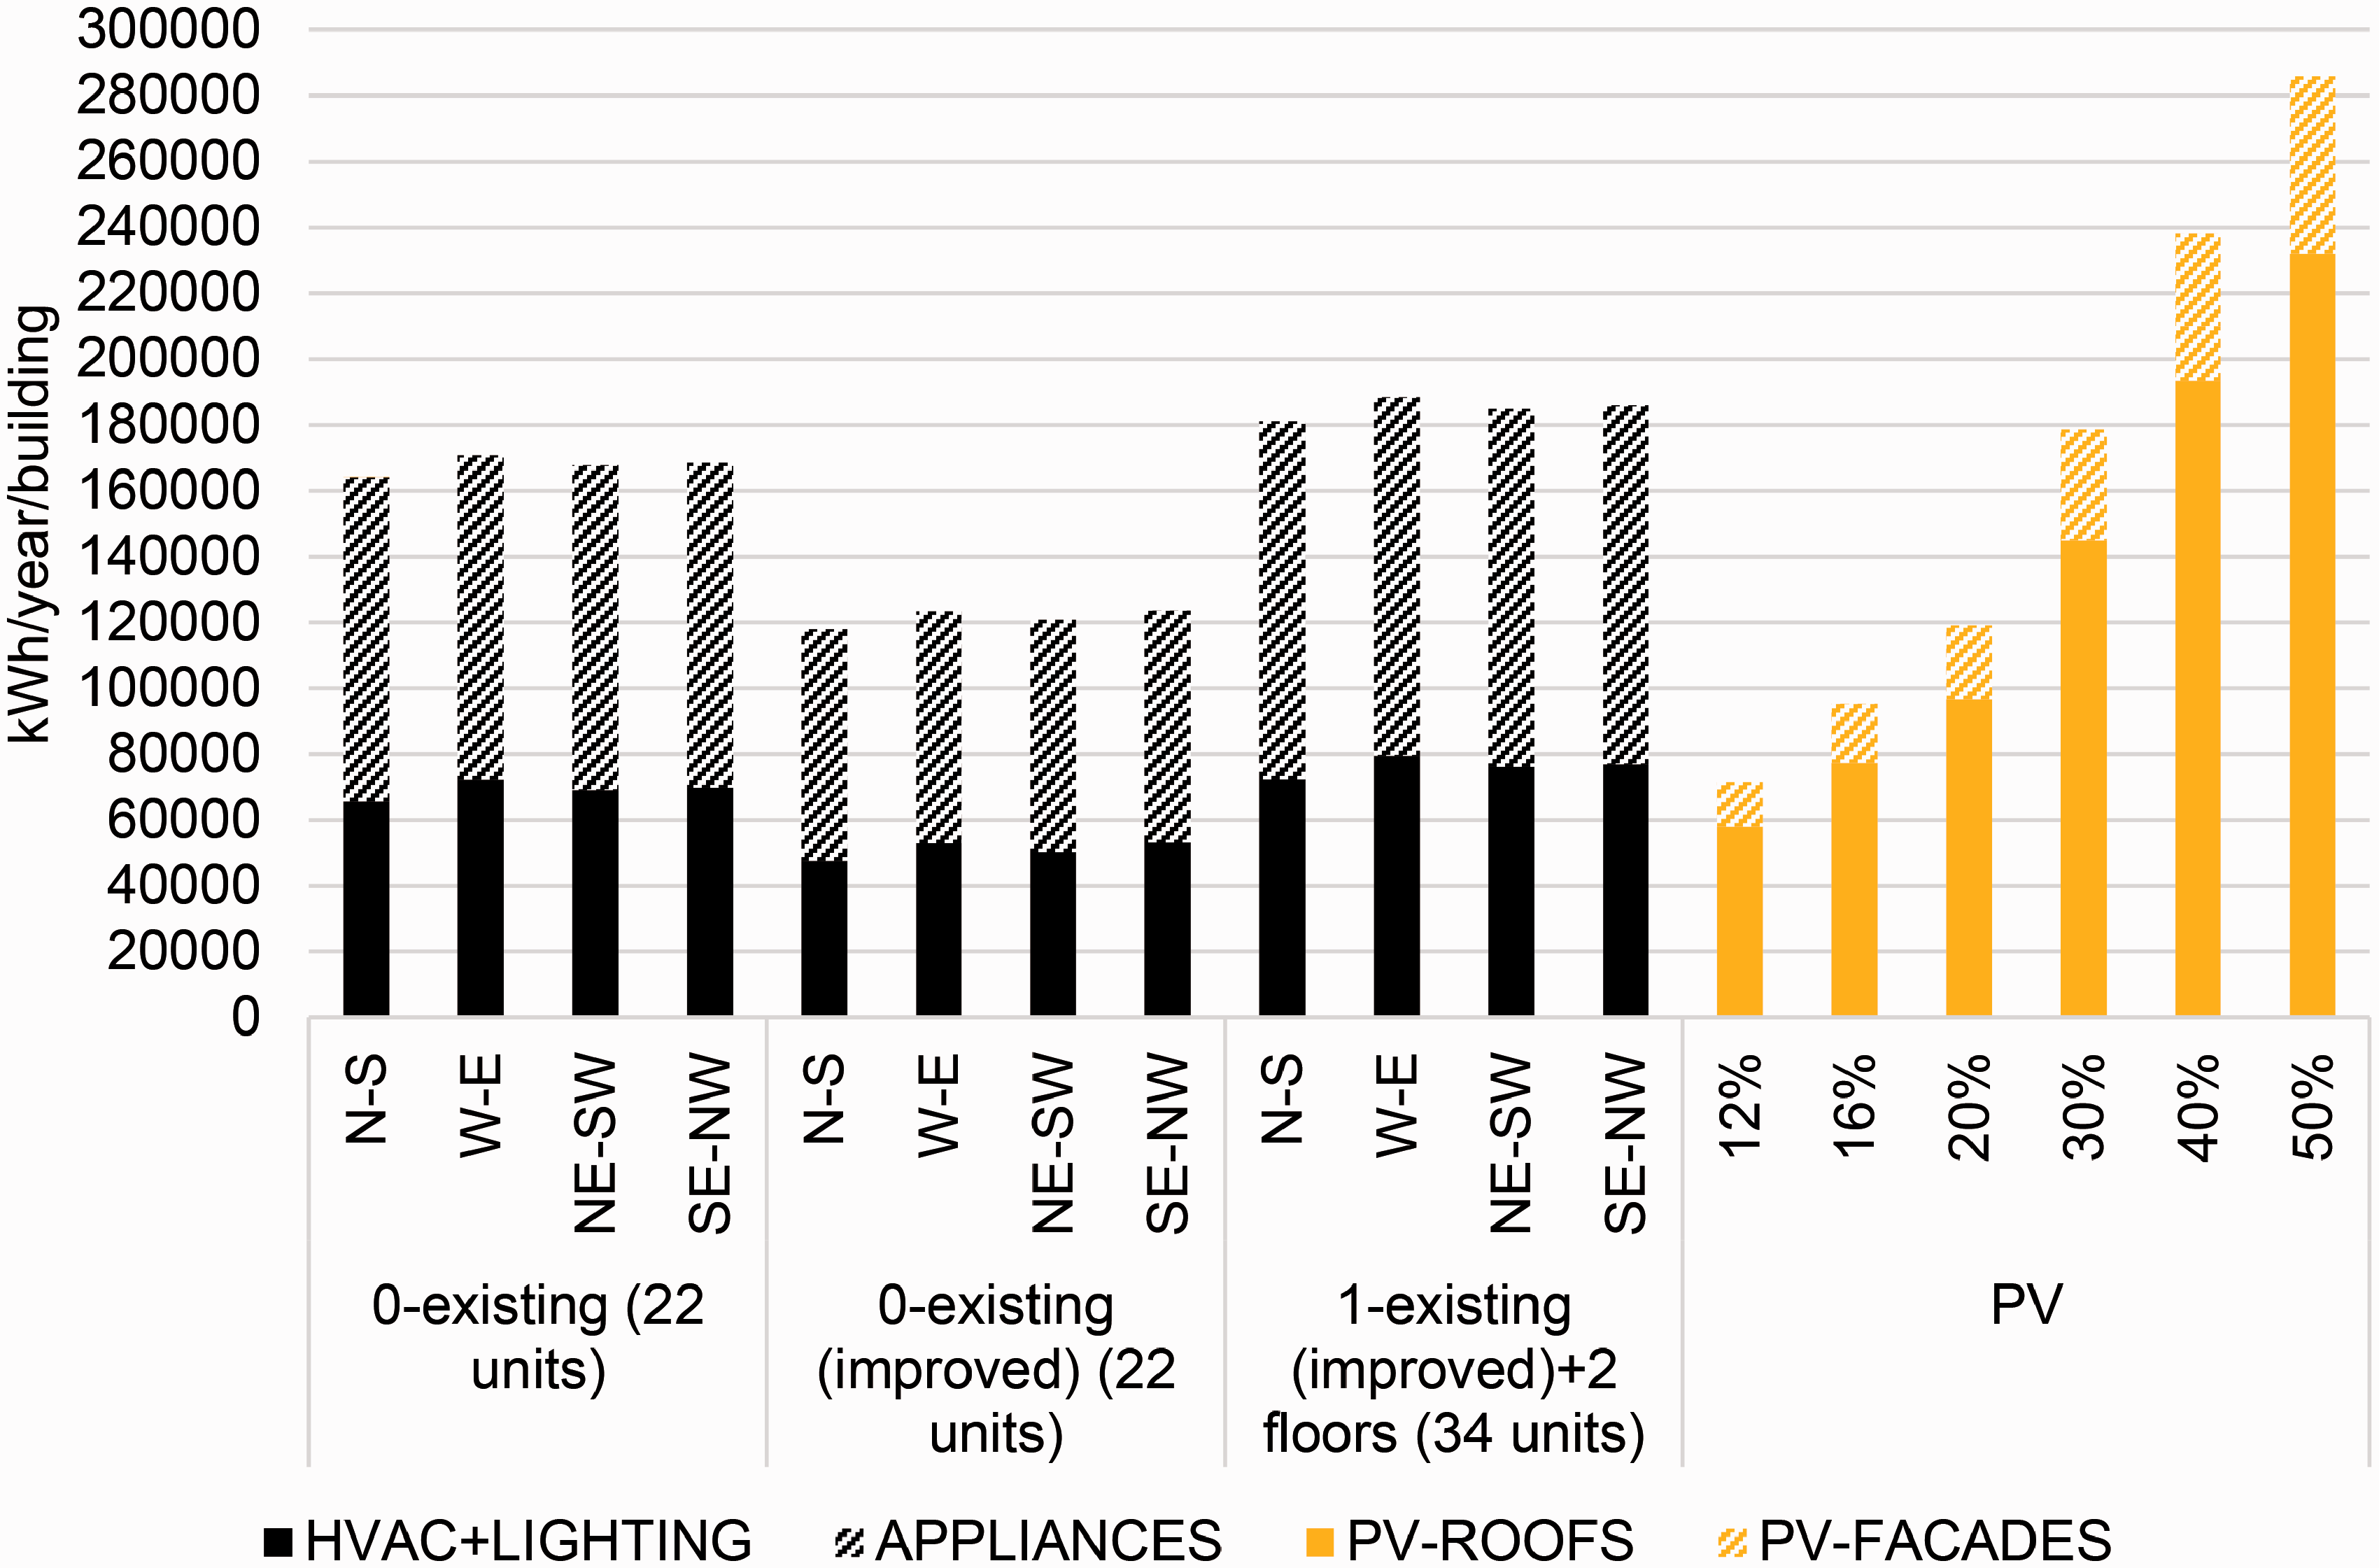
Comparison of energy consumption of a single building with various orientations in relation to electricity production by solar panels with varying efficiency (kWh/year/building).
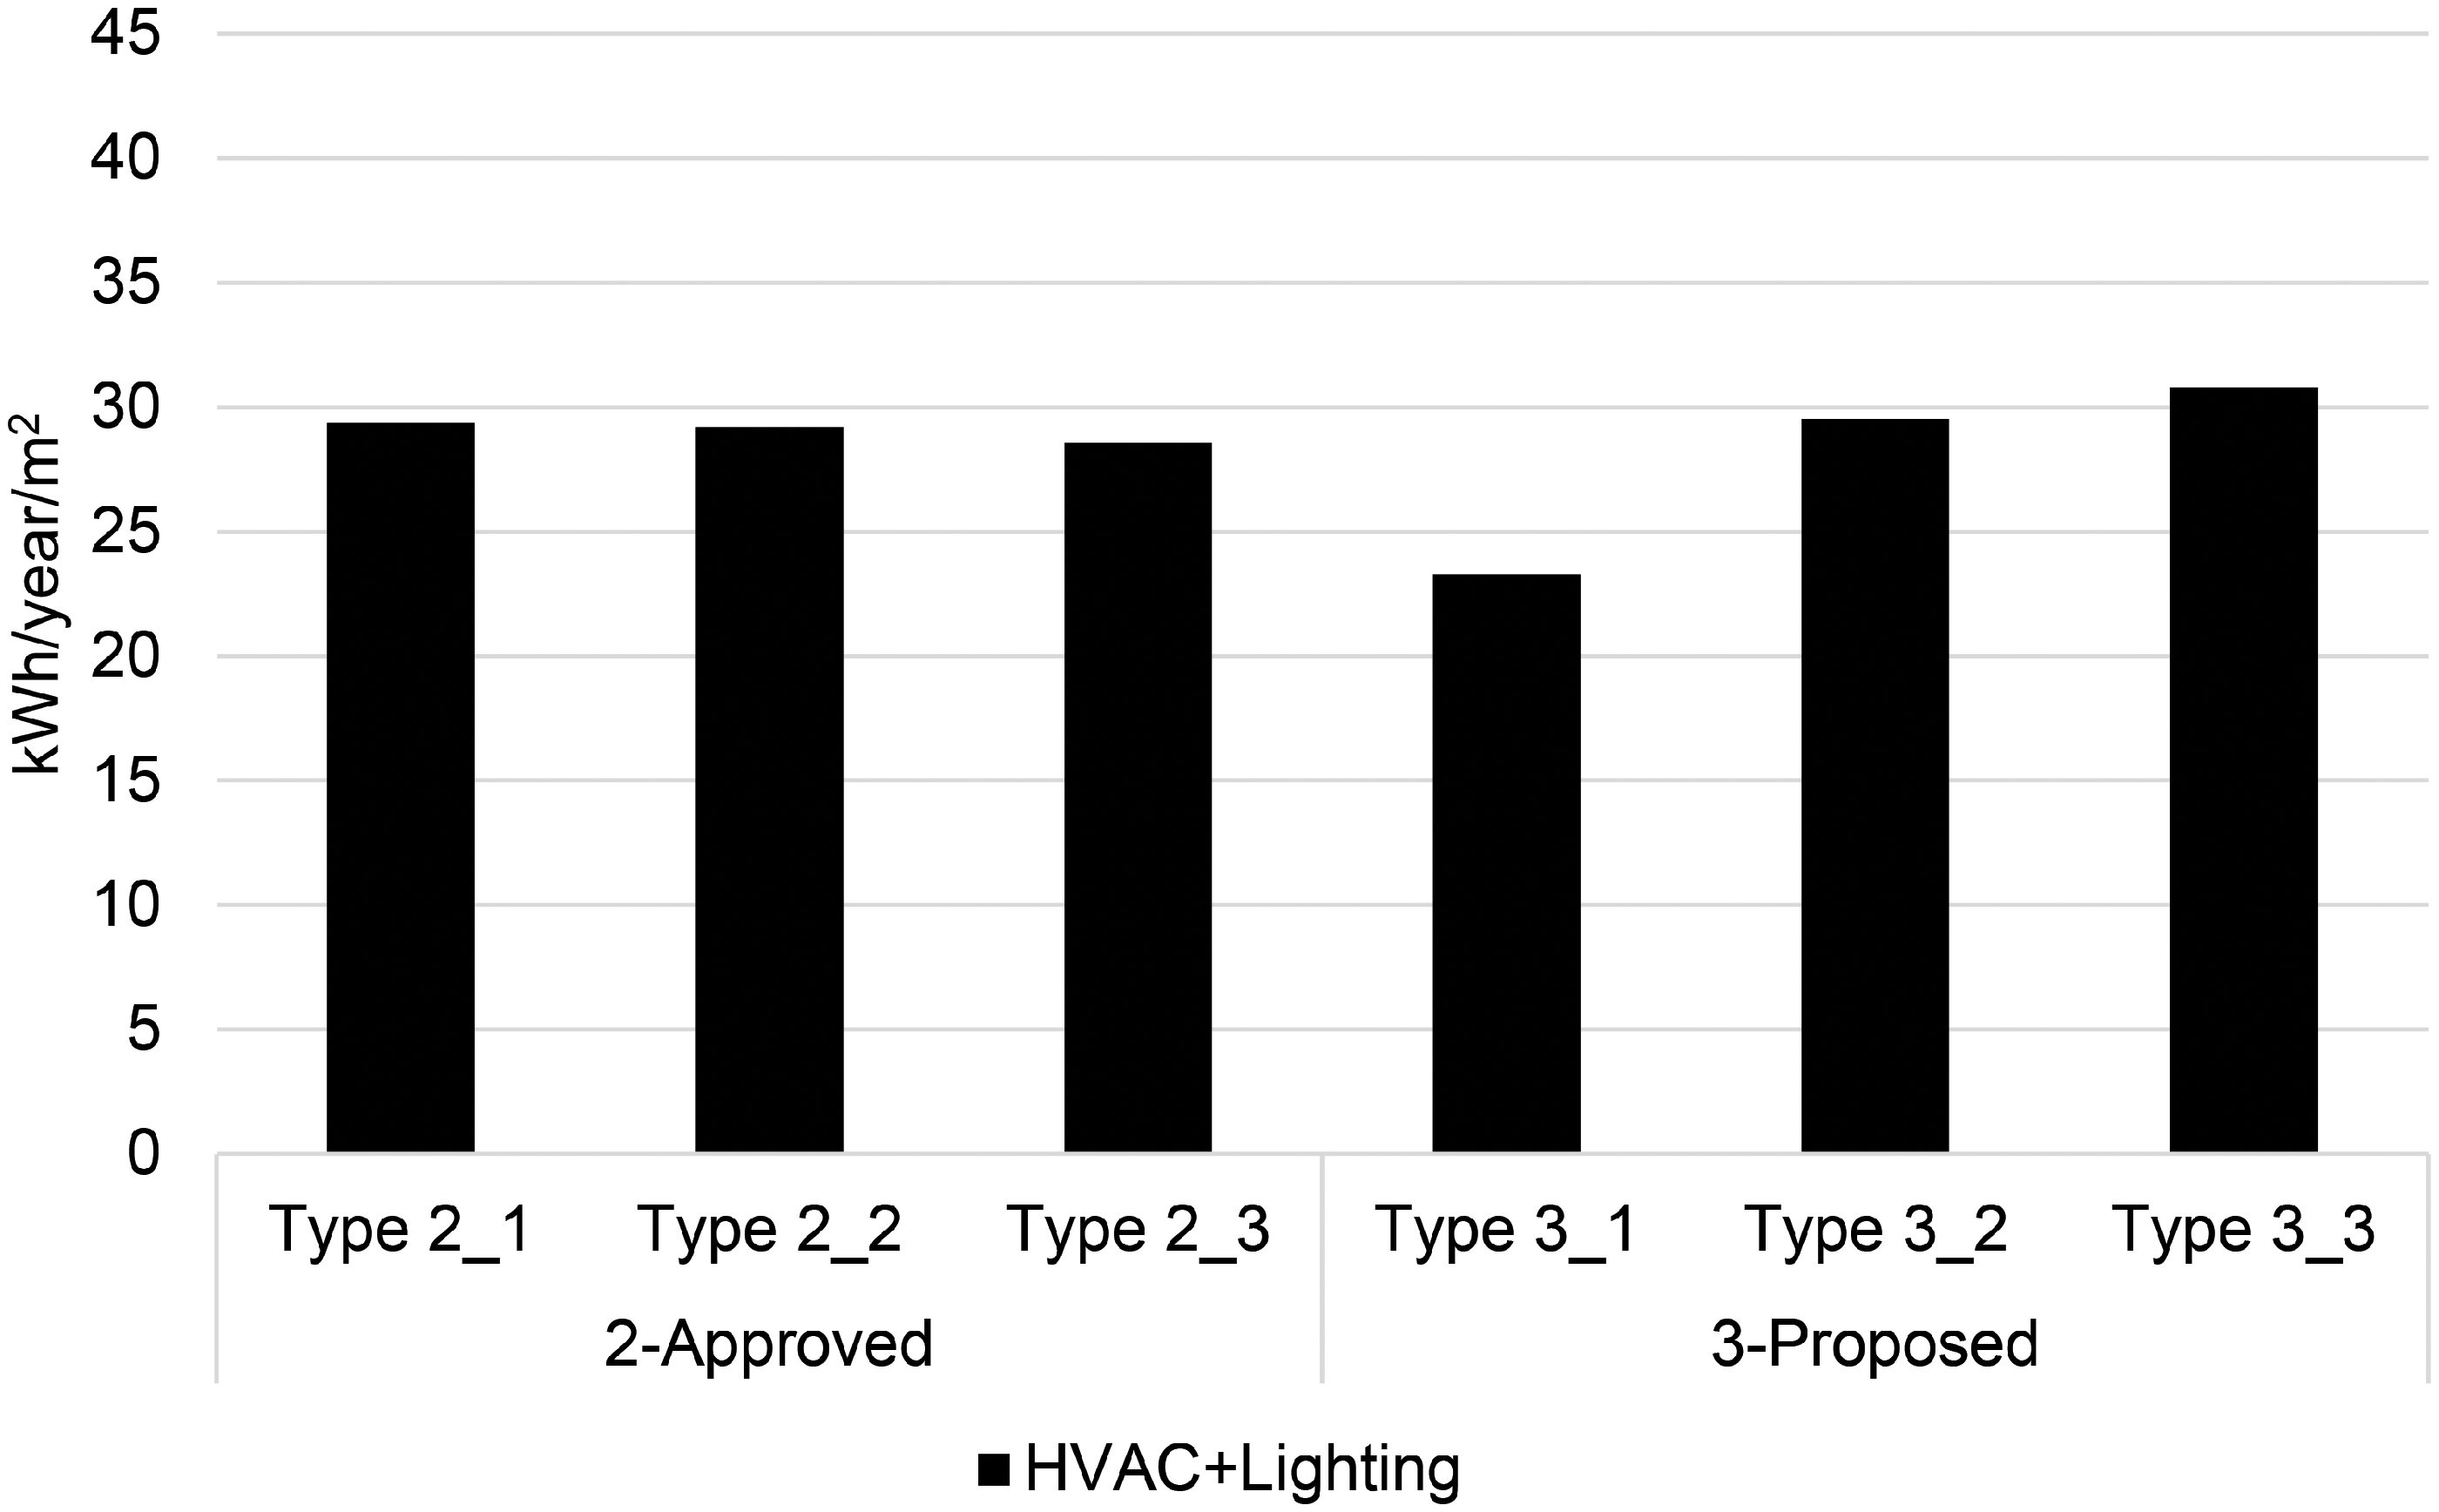
Approved alternative – Figure 12 shows the energy consumption of the buildings including appliances by types for the approved and proposed alternatives (alternatives 2 and 3), along with their electricity generation capacity using PV on roof and facades. Figure 13 presents the total energy consumption of the entire complex for alternatives 2 and 3, comparing it with the electricity generation capacity using PV in roof and facades assuming different panel’s efficiencies. About two-thirds of roof surfaces of the approved design (alternative 2) are fully exposed or partly shaded, while another third is shaded most of the year. Potential areas for BIPV received up to 1600 kWh/m2 annual radiation on average and are then found suitable for horizontally PV array installation. Additionally, the upper levels of south-oriented facades exceed 1000 kWh/m2/year and can be therefore considered for energy generation. However, west oriented facades were not considered due to low radiation resulting from the plot’s slight rotation to the north. Due to mutual shading and small roof area of the several towers, in this alternative electricity generation is mainly based on vertical arrays, while roof electricity generation is about 20% only of the total production (Figures 12 and 13).
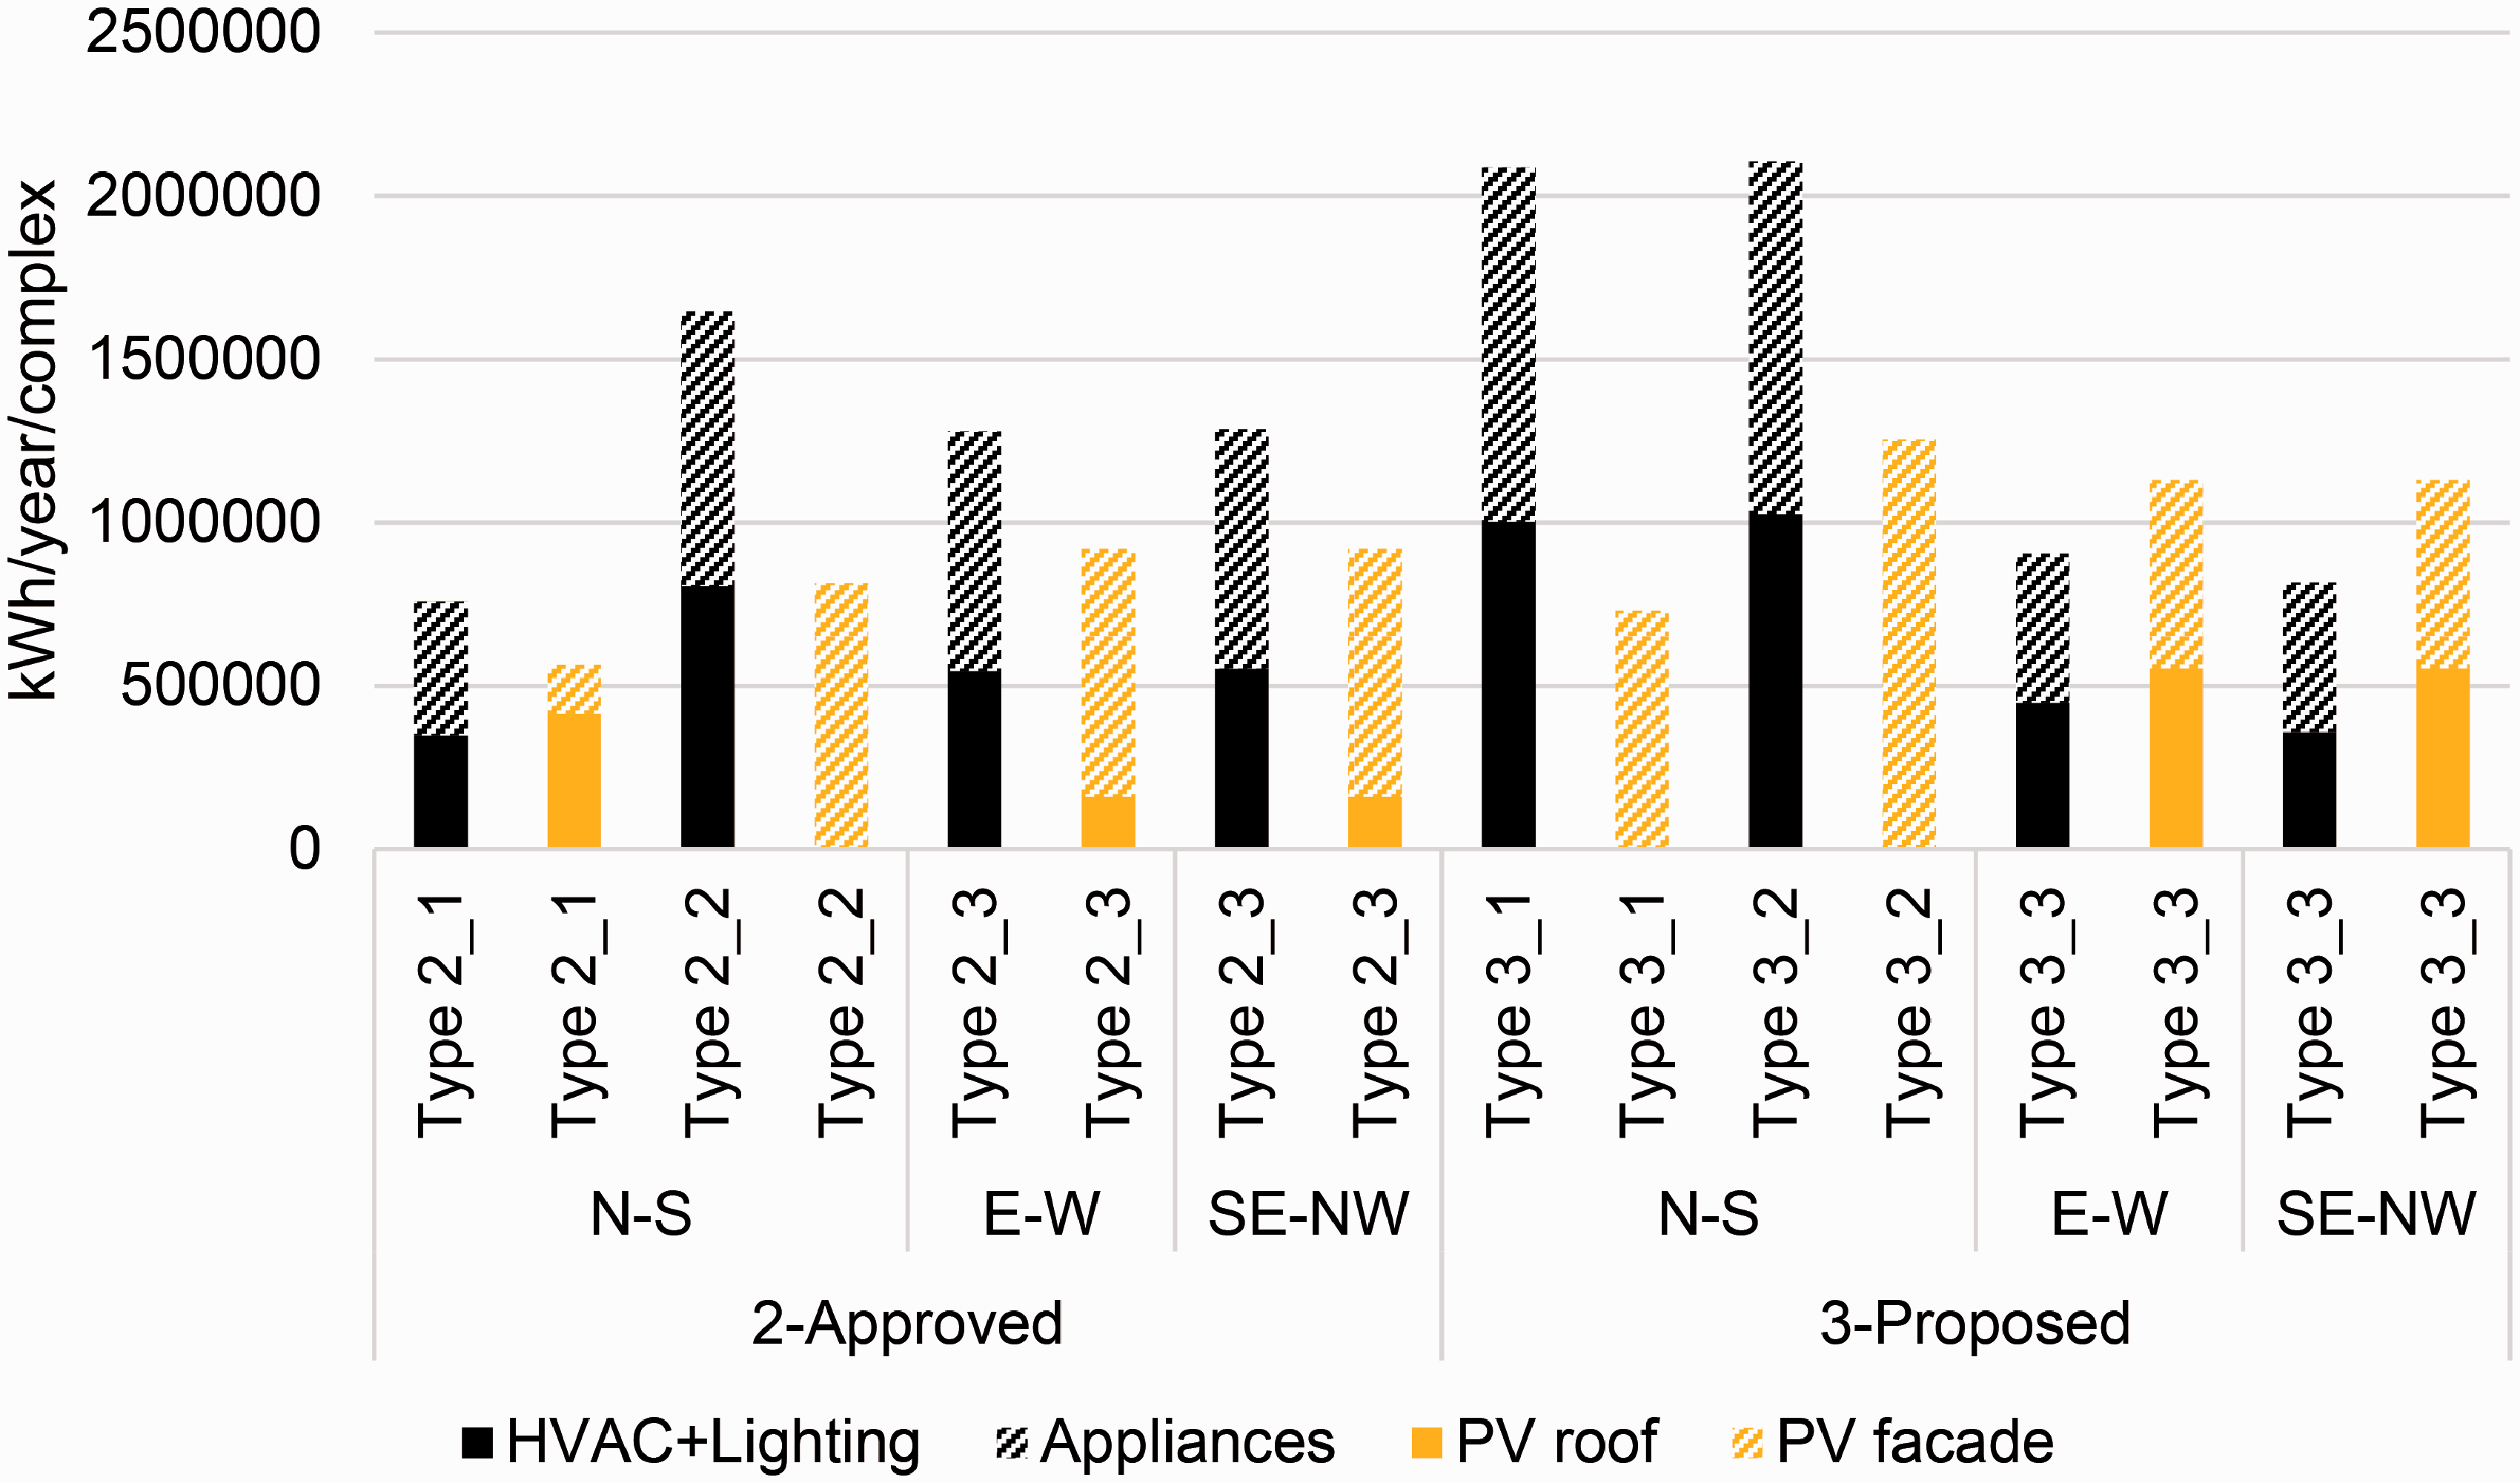
Energy consumption comparison of approved and proposed alternatives by building block type to energy production on roofs and facades within building borders (kWh/year/building).
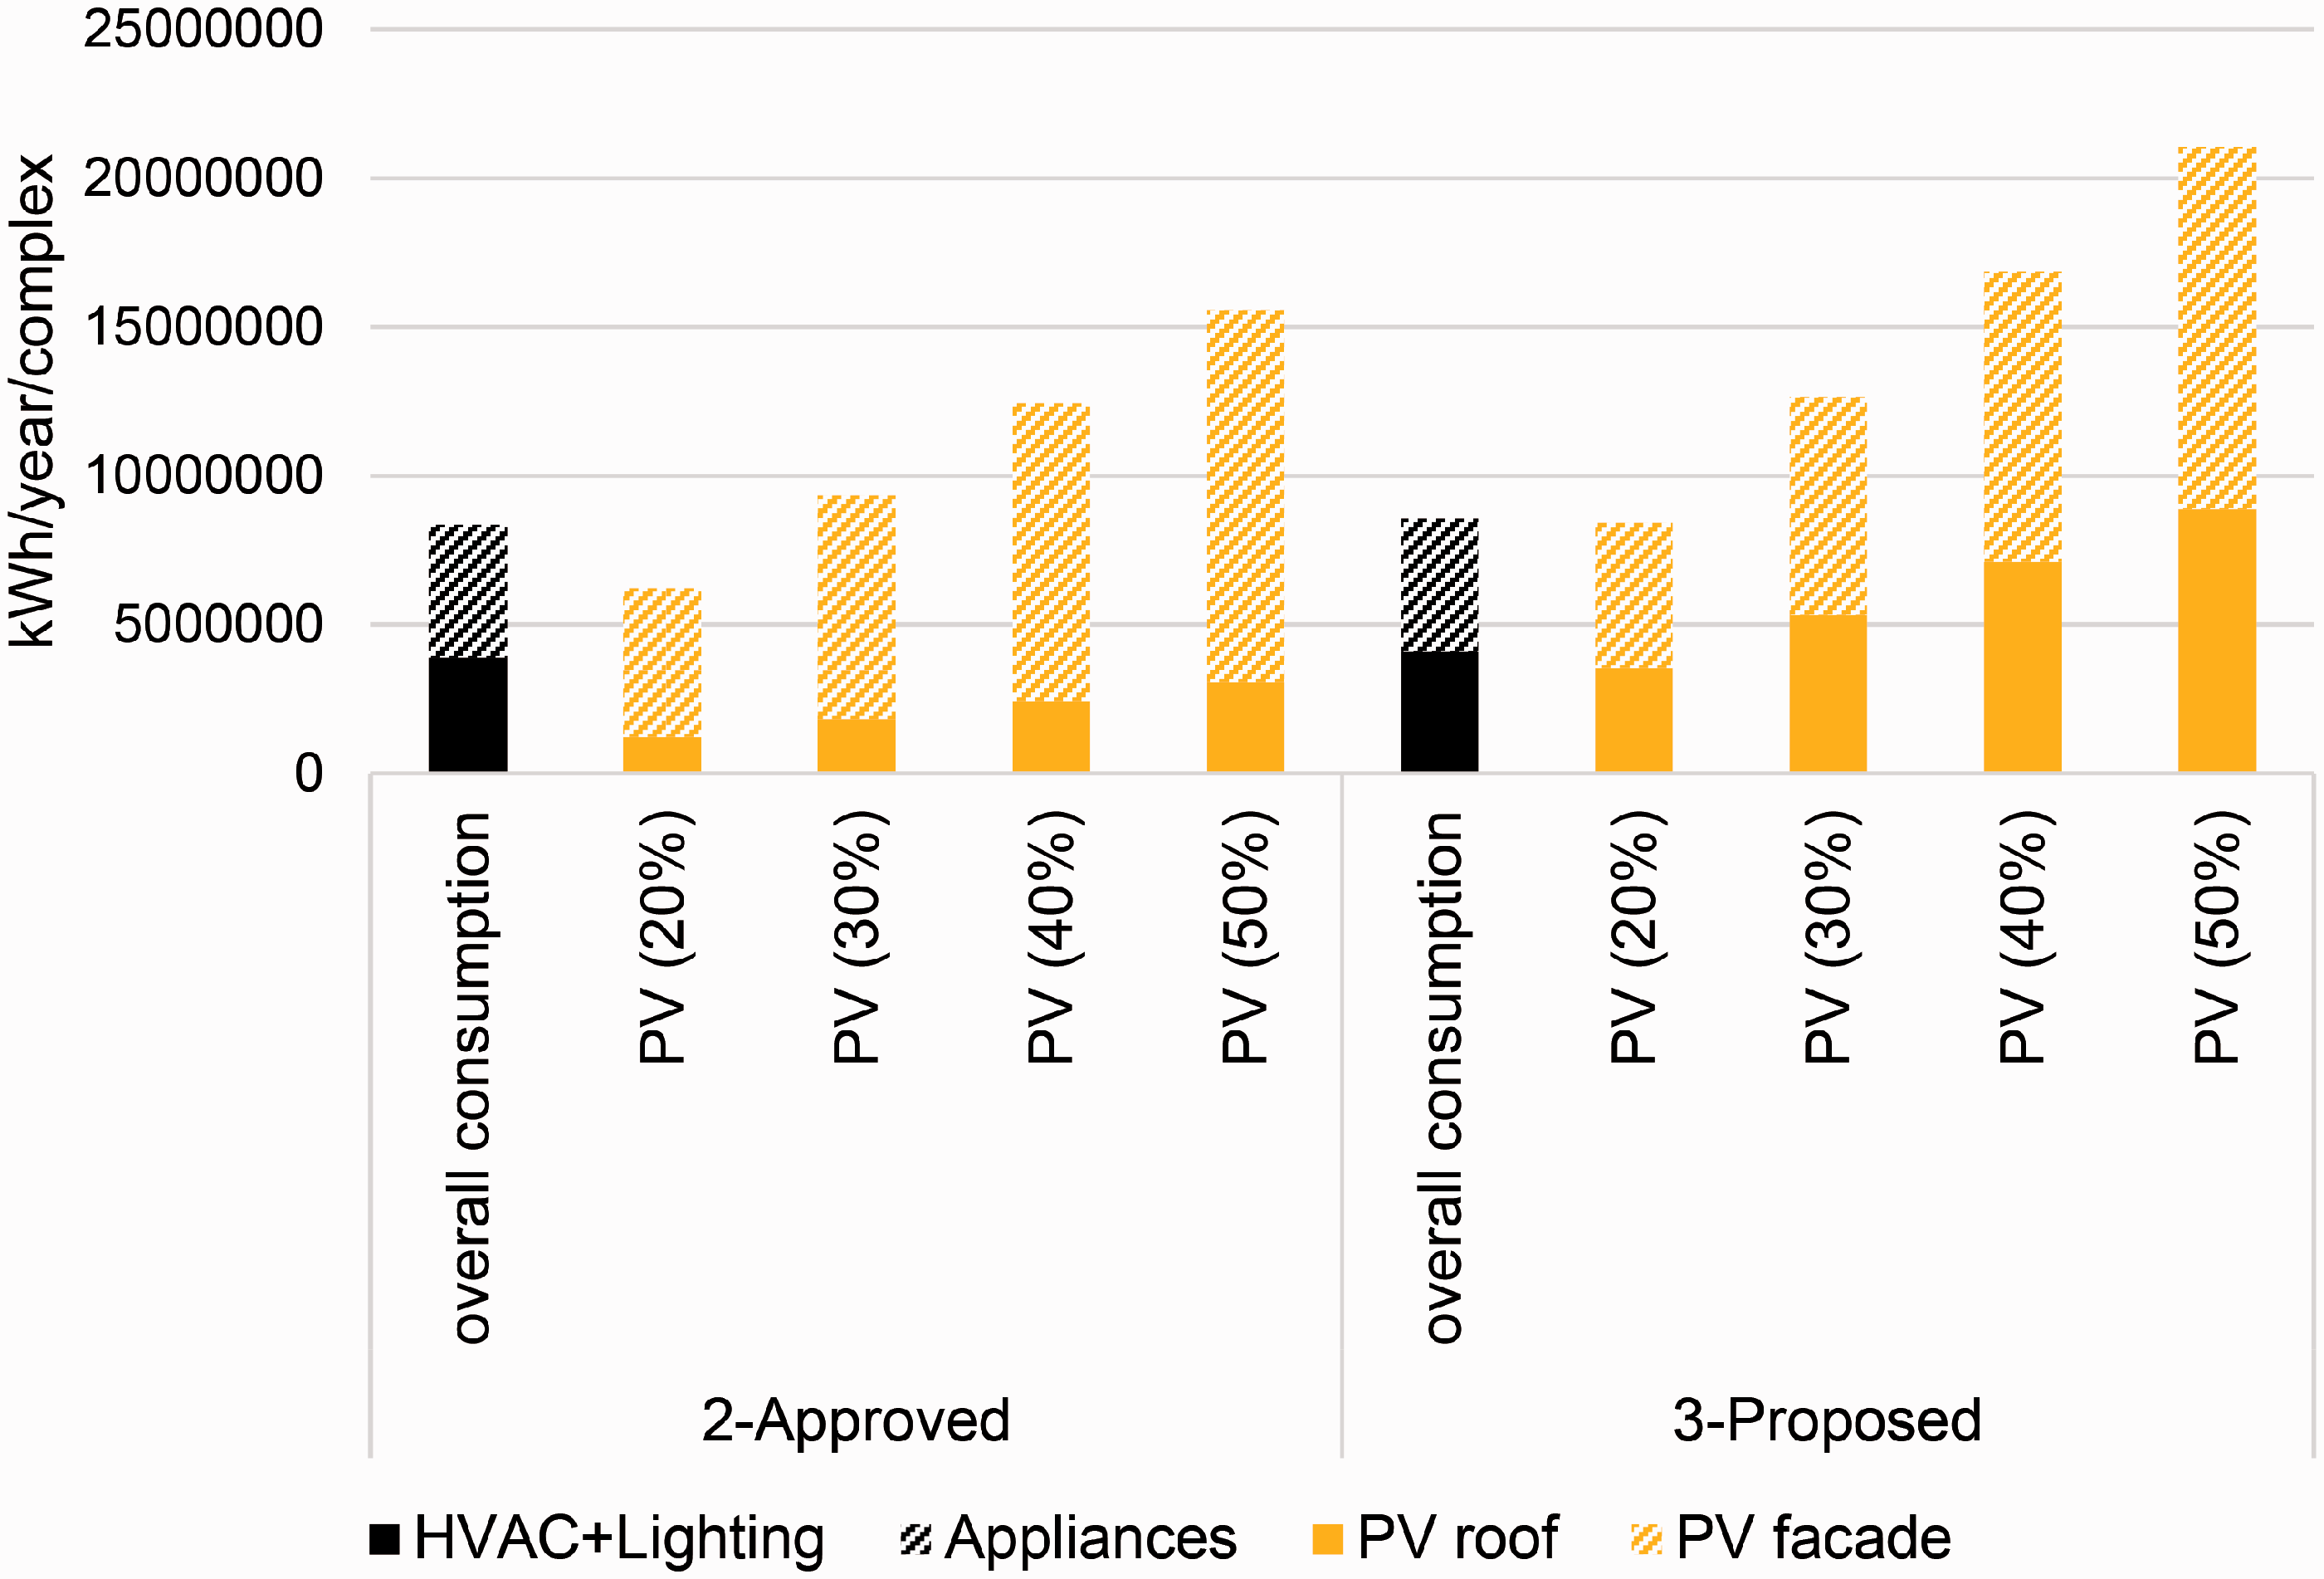
Case study approved and proposed design alternatives’ overall electricity consumption compared to possible energy production by PV roof and facade installation with various efficiencies.
Proposed alternative – On the other hand, the proposed alternative (alternative 3) is composed mainly of lower courtyard buildings (type 3_3), which offer larger, fully exposed roof areas for maximum electricity generation. In this case, PV roof array which is easy to install and maintain, assuming 20% efficiency can provide more than 85% of the total energy used for HVAC and lighting, depending less on complex vertical facade installation and maintenance. In this case, using facades as well, it is possible to achieve almost a zero-energy complex, a task that will be easier when more efficient panels become available (Figure 13).
According to the study, there is a clear relationship between urban density, energy consumption and available area for electricity production. However, architectural design plays an important role in this equation. As density grows, total energy consumption rises and less well-exposed envelope areas are available for PV systems implementation due to the increase in mutual shading caused by higher buildings. Therefore, good solar design at building and urban levels is necessary for achieving zero energy goal in dense urban areas and maintain comfort conditions in open urban spaces. There are density limitations for developing nearly zero energy urban complexes and ensure basic environmental qualities. However, there is a challenging opportunity to push the limit and achieve nearly zero-energy complexes if good architectural design is implemented, and more efficient systems developed. Thus, solar design principles are important as much as energy-efficient envelope design to approach the goal of near-zero energy buildings. Although the study does not discuss passive solar principles such as orientation, passive heating, shading, thermal mass, etc., if implemented those can dramatically lower energy consumption by buildings and decrease area needed for PV array installation. On the other side, windows needed for passive solar heating may compete for area available for installation. The study showed that even near zero-energy goal is difficult to achieve in high-density complexes using low-efficiency PV panels array implemented on the roofs. Existing buildings’ protrusions and balconies might limit PV array installation on the main facades.
As noted before, horizontal roof PV installations are easier to install and maintain and have less impact on building appearance, being suitable for any building orientation. If PV array on façades is implemented, further aesthetical, comfort and maintenance design issues should be considered: Facade surfaces covered by PV require highly exposed facades design. Adjacent buildings, facade openings, shading elements or balconies will decrease facade energy production potential; PV facade array implementation limits the cladding material variety. Besides, PV cladding may increase the expenses of the finishing material and its maintenance. Moreover, solar panels on facades can cause a glare disturbance on the street level of the urban areas that should be considered. Future developments in the PV field may provide more colours, shapes and textures for more diverse geometry and intelligence facade designs.
Conclusions
The study shows that zero energy or near zero energy goals in high-density conditions is difficult to accomplish if urban and building design relies mainly on facade installation as in the proposed option, thus building typologies that allow for large roof area should be encouraged. It is important to implement a solar oriented design on the urban level as much as on building scale to reduce energy consumption and maximize energy on-site production. In the future, with increased efficiency of PV panels and proper design at urban and building scales, zero energy should be an attainable goal for high-density developments.
This work concentrated on buildings operational energy consumption and active energy production using BIPV arrays only. Subjects related to buildings and PV panels embodied energy and lifecycle cost, as well as architectural and social implications of different building typologies, were not discussed but worth further examination when analyzing a real project.
Footnotes
Authors' contribution
All authors contributed equally in the preparation of this manuscript.
Acknowledgements
The authors would like to thank the Technion- Israel Institute of Technology, the Azrieli Foundation, and the Society of Building Science Educators (SBSE) for the support of this research.
Declaration of conflicting interests
The authors declare that there is no conflict of interest with respect to the research, authorship, and/or publication of this article.
Funding
The authors received no financial support for the research authorship, and/or publication of this article.