
Abstract
In tunnel fire, smoke is a great threat to successful emergency escapes, and its spreading patterns at high altitude tunnel may differ. Therefore, the impact of ambient pressure on the stability of smoke layers and maximum smoke temperature under ceiling in ventilated tunnels were investigated in this study. Results show that the temperature of smoke layer is negatively correlated with the longitudinal velocity and ambient pressure. Besides, the influence of longitudinal velocity at different ambient pressures on the shear velocity between the smoke and air layers was further studied. Using Richardson number (Ri) and Froude number (Fr), smoke flow can be classified into three patterns, namely stable and obvious smoke stratification (Ri>3.2 or Fr < 0.38), a stable smoke layer but with blurred interface (2.3 < Ri < 3.2 or 0.38 < Fr < 0.53) and a completely unstable smoke stratification (Ri < 2.3 or Fr > 0.53). Furthermore, a model has been developed to predict maximum smoke temperature under the tunnel ceiling, which agrees well with previous studies at standard atmospheric pressure. The results of the present work provide information for tunnel structure protection and safe evacuation in fire accidents at different ambient pressures.
Introduction
When a tunnel fire accident occurs, toxic smoke will spread along the long and narrow tunnel. It will not only block up vision but also make rescue efforts more difficult, putting survivors in the tunnel at a great risk. Therefore, studying the law of smoke movement in tunnel fires is critical as the foundation to control smoke in a timely manner and rescue trapped tunnel users.
A large number of studies have investigated smoke control in tunnel fires.1–15 Specifically, Xie et al. 4 analysed the impact from shaft cross section on natural ventilation in urban tunnels by a numerical study. As for smoke stratification, research found that smoke in a narrow and confined space exhibits a clear thermal stratification structure without forced airflow, and the interface between the upper smoke and lower air layers is clear. 5 Besides, the thickness of a smoke layer is a crucial parameter for studying the characteristics of stratification, which is also related to the condition of tenability. 6 Oka et al. 6 proposed a model to predict the ceiling jet thickness and the vertical temperature and velocity distributions in a tunnel with natural ventilation. Additionally, Nyman and Ingason 7 divided the longitudinal smoke layer in mines into three regions based on Froude number (Fr). In region 1 (Fr < 0.9), the upper smoke and lower air layers show obvious stratification. In region 2 (0.9 < Fr < 10), vortex appears between the two layers. In region 3 (Fr > 10), there is no obvious stratification.
Due to poor natural ventilation in narrow space, longitudinal ventilation is usually employed to assist smoke exhaustion during tunnel fires.16–30 Lemaire and Kenyon 17 analysed the impact of longitudinal velocity on smoke behaviours in tunnel fires. They studied smoke stability and spreading, as well as the critical wind velocity for smoke back-layering, with full-scale fire experiments. Additionally, longitudinal ventilation is one of the common measures of smoke control in tunnel fires by increasing the shear intensity between the upper smoke and lower air layers, further affecting smoke features. However, if the intensity of longitudinal ventilation is too large, the layering characteristics in smoke would be destroyed, resulting in chaotic smoke and difficulty in evacuation and rescue.16,19,23
Nowadays, most studies about smoke stability and its stratification features in tunnels have been carried out at standard atmospheric pressure (1 atm). On the other hand, as China is continuously developing its transportation network in its plateaus, many high-altitude tunnels have been built recently, e.g. ‘Mila Mountain Tunnel’ (4752 m), ‘Snow Mountain No. 1 Tunnel’ (4400 m) and ‘Queershan Tunnel’ (4378 m). Previous reports have proved that smoke stability and temperature distributions are significantly different in tunnels under a low air pressure. 31 However, no literature has reported on smoke ventilation and optimization control in such tunnels. Smoke behaviour and temperature distributions under the tunnel ceiling are different at low pressures. Besides, the entrainment features also change, which could definitely affect smoke layer stability in a tunnel fire. Based on current research, numerical simulations were conducted to investigate smoke stratification with various ventilation under different ambient pressure. Also, critical criteria related to Fr and Ri, as well as the maximum smoke temperatures were also investigated in this work.
Numerical simulations
Fire scenarios
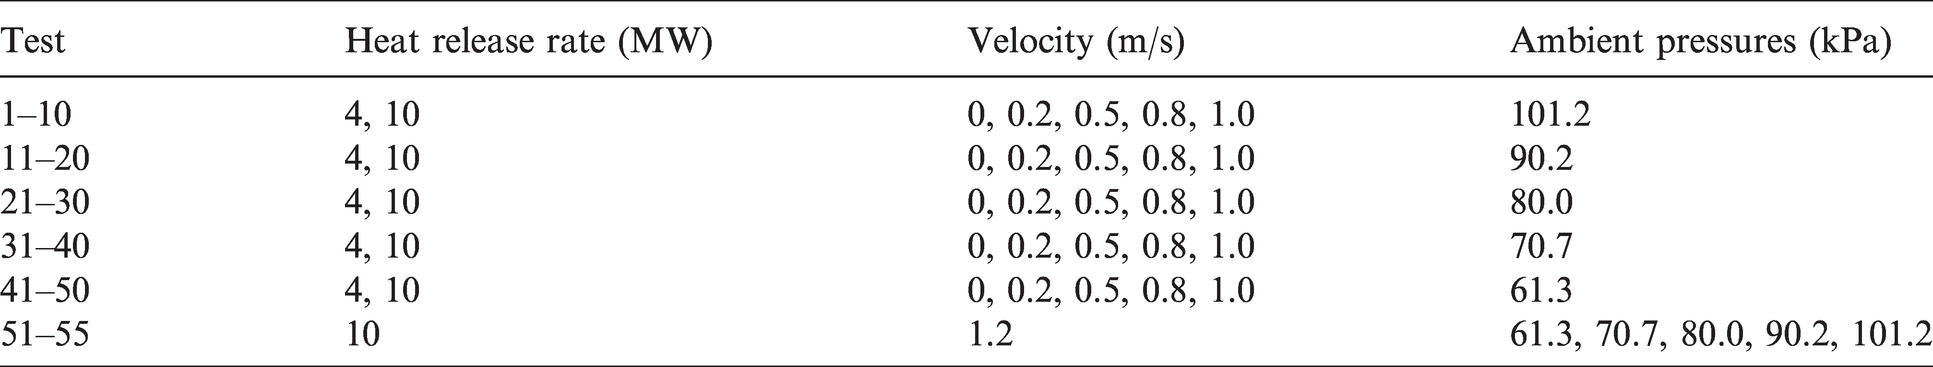
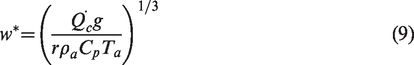
Compared to experiments, numerical simulations are advantageous for convenient variable modifications and their capability to investigate special environmental conditions. At present, Fire Dynamics Simulator (FDS) is widely employed to study smoke features in tunnel fires,32–35 and this work was conducted on FDS 6.1. Figure 1 shows the tunnel model (160 m [L] × 10 m [W] × 8 m [H]). Its sidewalls, ceiling and floors were set as ‘CONCRETE’, whose density and specific heat capacity are 2200 kg/m3 and 0.88 kJ/(kg•K), respectively. 36 The fire source was set as 2 m [L] × 2 m [W] × 0.25 m [H], and its centre coincided with the coordinates’ origin, which was placed at the centre of the tunnel floor. Additionally, the heat release rates (HRRs) were input as 4 or 10 MW, which represented car or truck fires in actual highway tunnels, respectively. 37 Ambient pressures of 61.3, 70.7, 80.0, 90.2 and 101.2 kPa were selected to simulate those at altitudes of 4000, 3000, 2000, 1000 and 0 m, respectively (Table 1). A ventilation velocity of 1.2 m/s was added along with an HRR of 10 MW to ensure v’ (dimensionless ventilation velocity of the smoke max-temperature model mentioned in Li et al. 11 ) was greater than 0.19, and the ambient temperature was fixed as 20 °C. In order to ensure that a quasi-steady state was reached for smoke movement at all working conditions, ‘t2 fire’ was employed as the combustion mode of the fire source. In addition, a series of measurement points for temperature and velocity were arranged with an interval of 0.3 m on the vertical line.
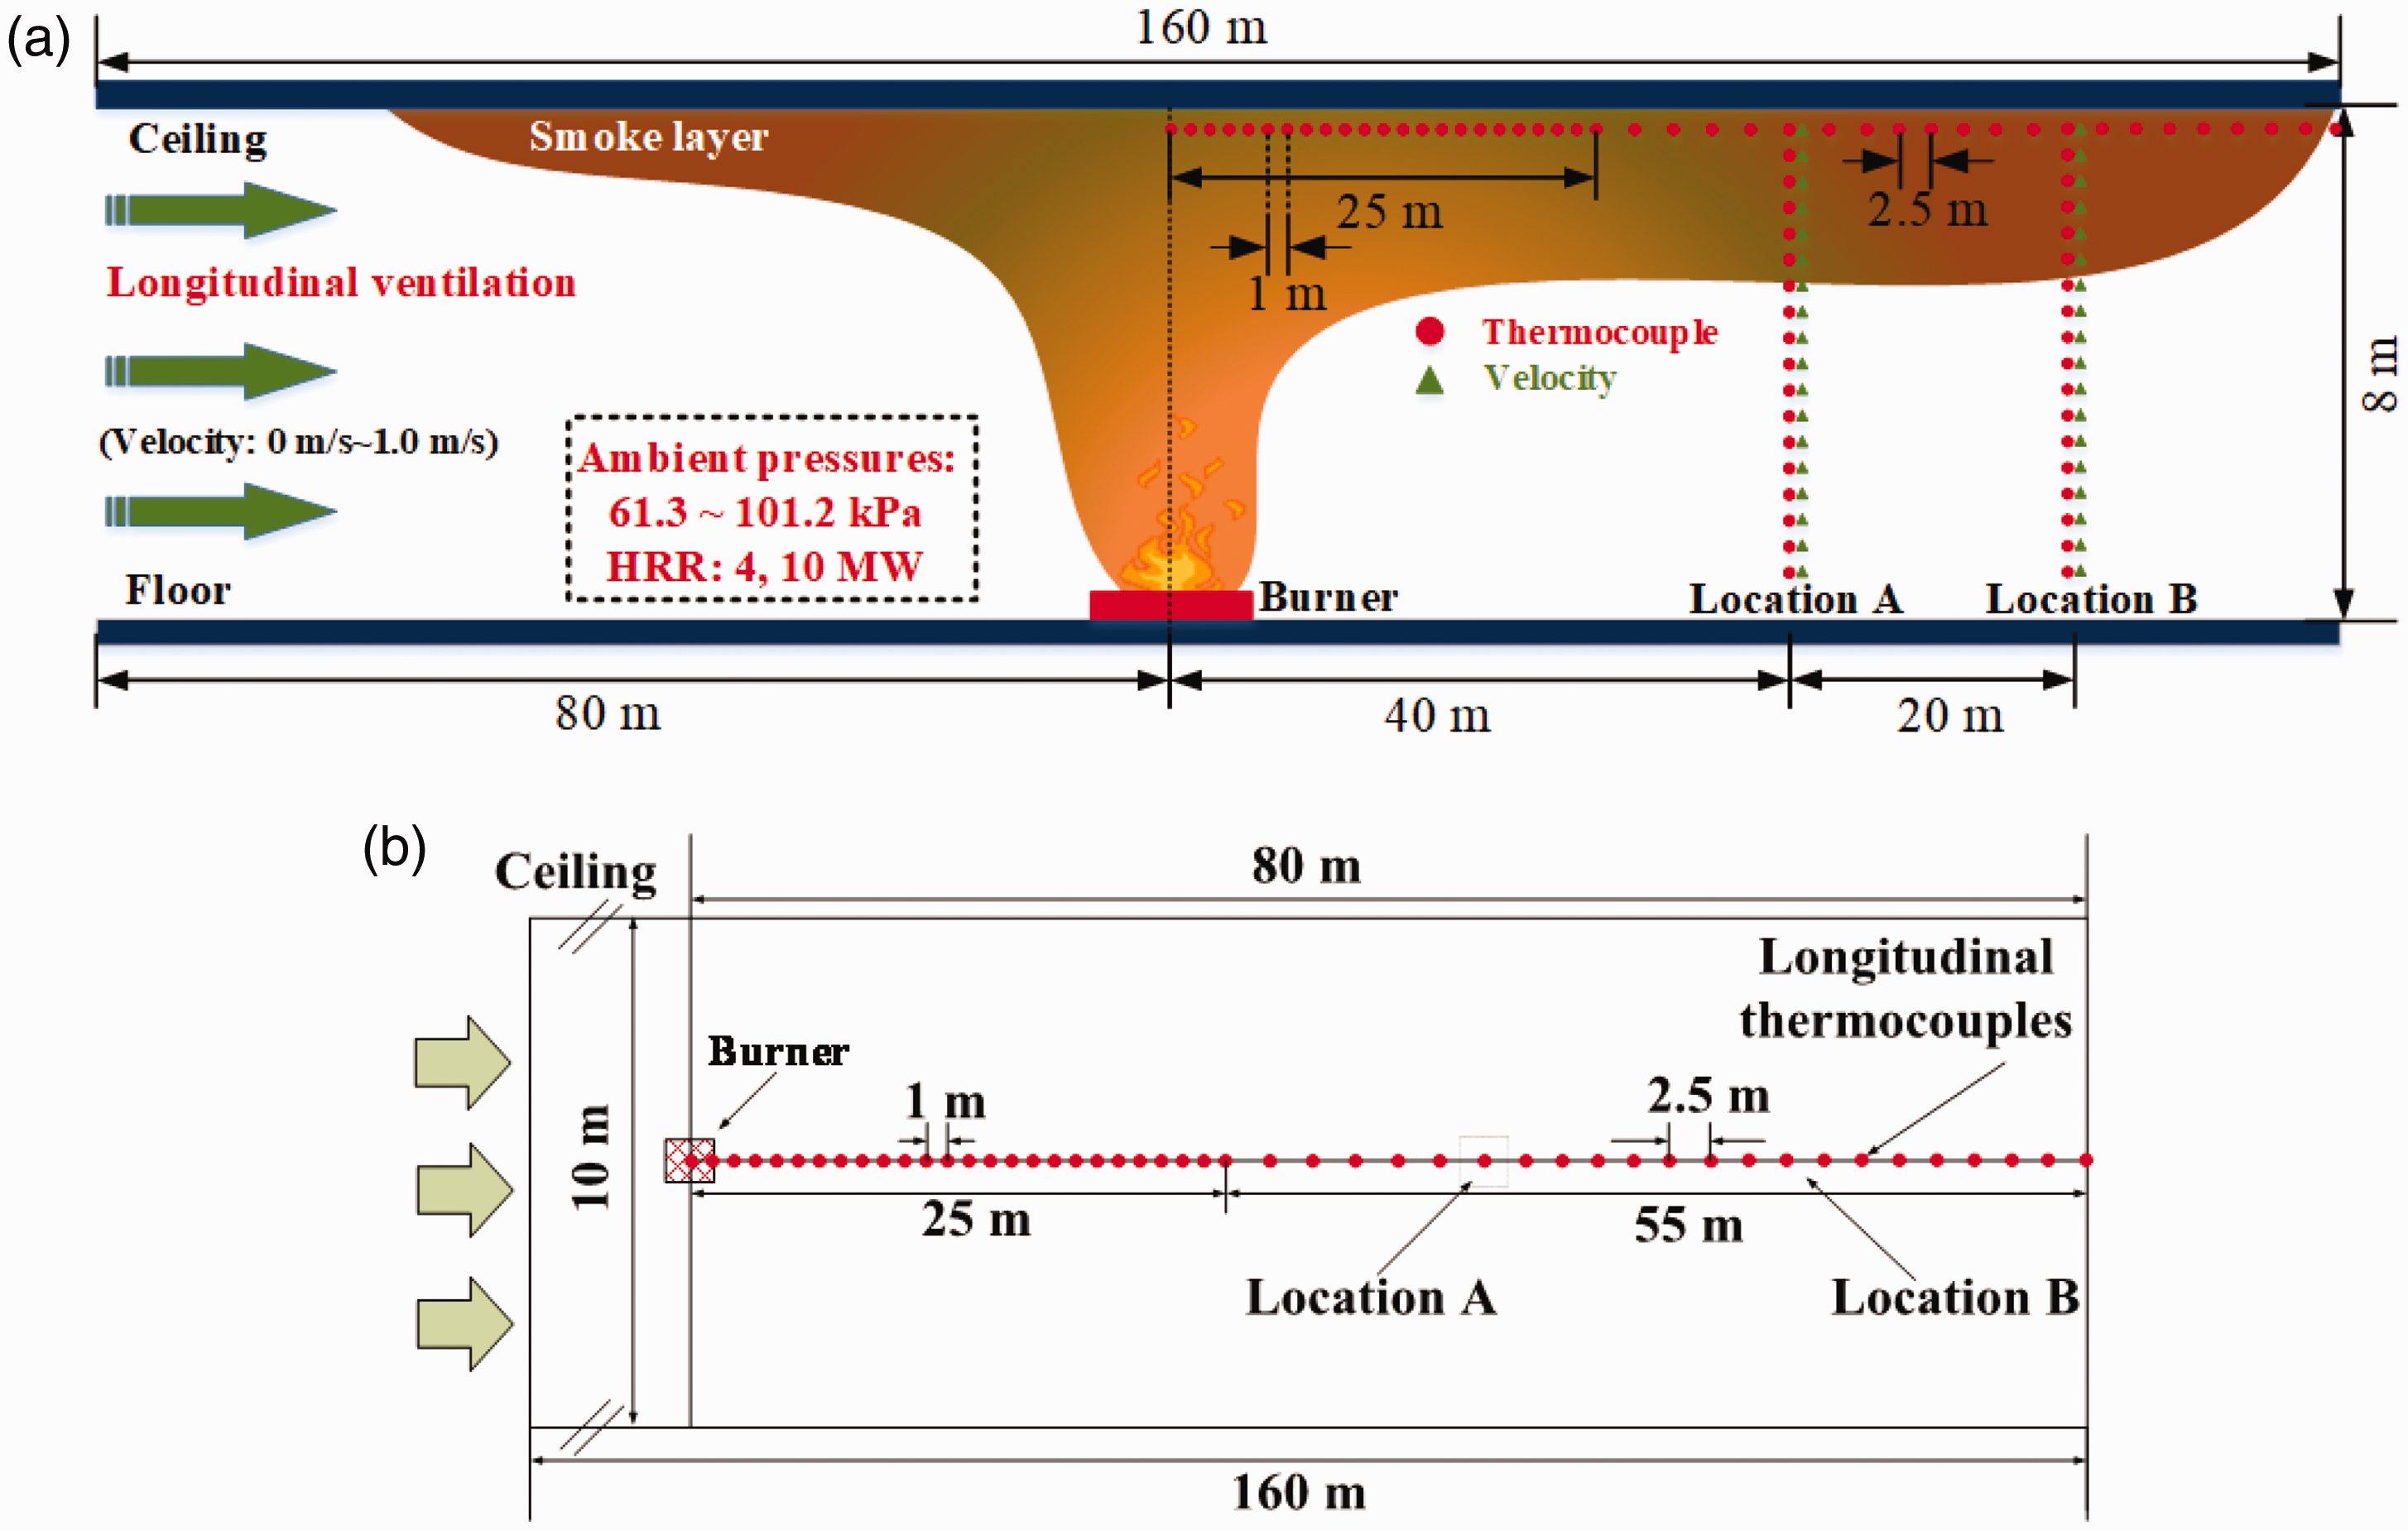
The schematic view of the FDS model tunnel. (a) Front view. (b) Top view.
Summary of simulation conditions.
Grid sensitivity analysis
The grid size would bring a significant impact on simulation accuracy. The D*/δx standard is usually employed to determine the mesh accuracy in a large eddy simulation, where δx is the mesh size and D* is the characteristic length.
38
Specifically, D* is defined by equation (1)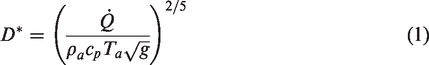
Previous research have recommended D*/δx to be located between 4 and 16. 38 As the grid size becomes larger, despite that the simulation time turns shorter, the results would become less accurate. Therefore, grid sensitivity analysis was performed to find a reasonable grid size. The optimal mesh size for a 4 MW tunnel fire was between 0.10 and 0.42 m, while the optimal grid size for 10 MW fires was between 0.15 and 0.6 m as calculated by equation (1) and D*/δx. Consequently, six mesh sizes (0.20, 0.23, 0.25, 0.27, 0.30 and 0.35 m) were selected to compare with each other in simulations. Figure 2(a) and (b) show the temperature and velocity distributions above the fire source in the direction perpendicular to the ceiling at HRR = 4 MW and ambient pressure = 101.2 kPa. When the mesh size was less than 0.30 m, both the temperature and velocity curves exhibited good convergence. Thus, the grid size of 0.25 m was determined as appropriate to save computational resources and improve accuracy. After a careful inspection, such grid size was deemed as applicable to all other conditions involved in this simulation. For the cross section of the tunnel simulation model, the width of 10 m and height of 8 m is similar to the full-size tunnel section. As for the tunnel length, the tunnel models of 160 m, 250 m and 300 m in length were built, and Figure 2(c) showed the vertical temperature distribution at location A with no wind and standard atmospheric pressure. Figure 2(c) shows that there is little difference in the temperature decay corresponding to the tunnel lengths of 160 m, which indicates that 160 m can well reflect the law of smoke movement.
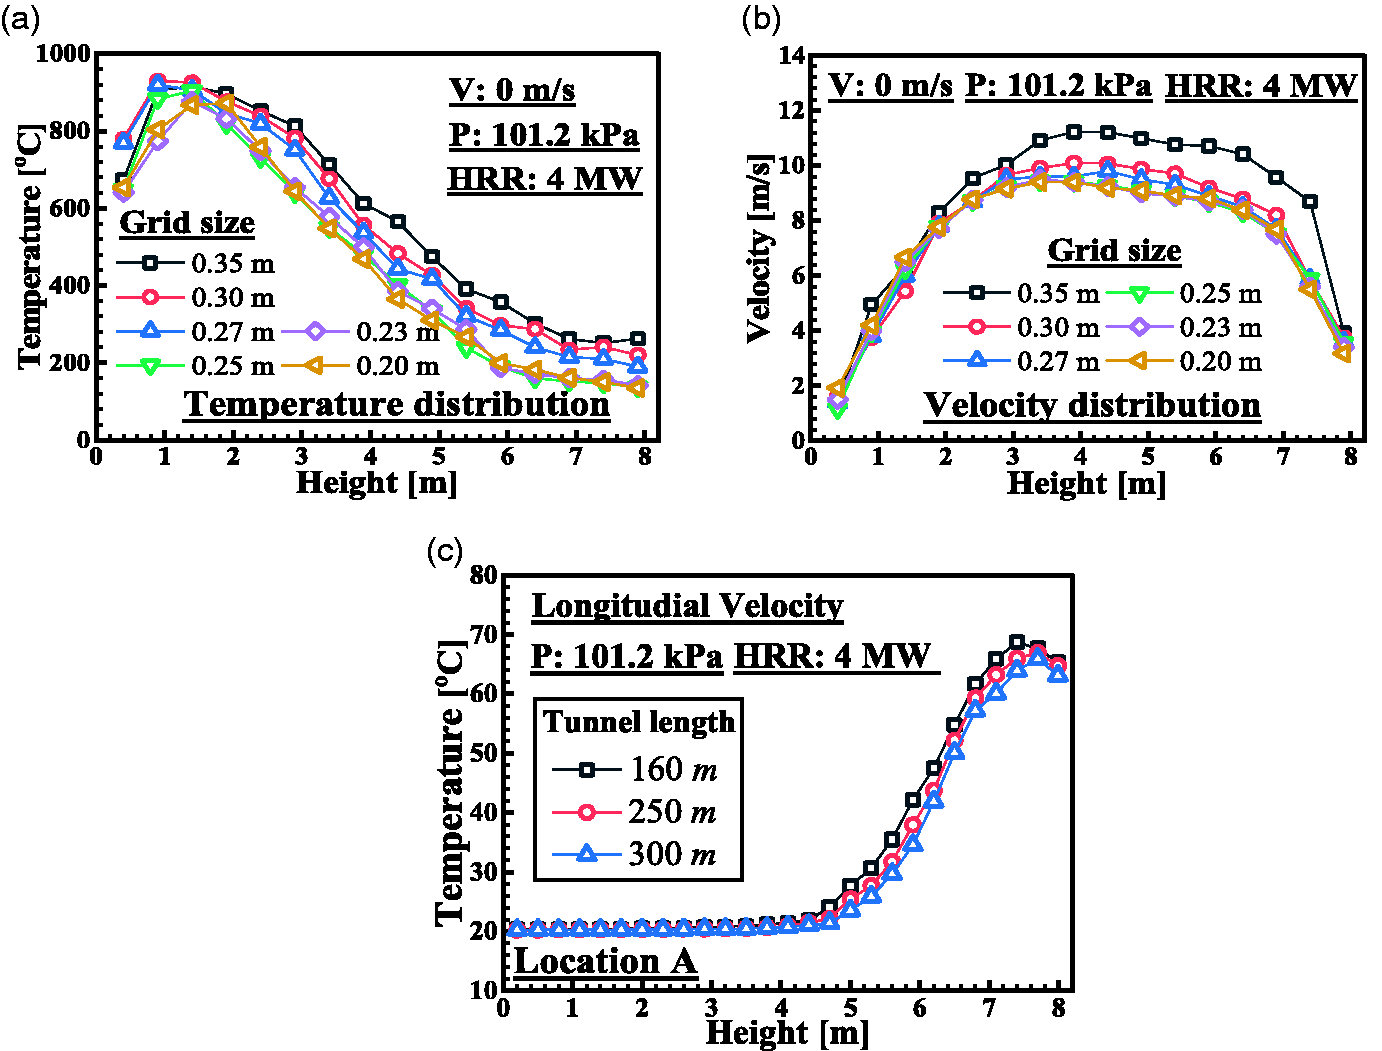
Mesh independence analysis and tunnel size selection. (a) Temperature distribution in the direction perpendicular to the ceiling above the fire source. (b) Velocity distribution in the direction perpendicular to the ceiling above the fire source. (c) Vertical temperature profiles with different tunnel length at Location A (HRR: 4 MW and ambient pressures: 101.2 kPa). HRR: heat release rate.
Results and discussion
Flow patterns and horizontal velocity of fire-induced flows
Typical smoke layer patterns in simulations can be classified into three types (Figure 3). The flow pattern in Figure 3(a), which corresponds to Test#1, is defined as Pattern 1, in which a clear boundary between the upper smoke and lower air layers was present. In Pattern 1, almost no mass exchange occurred between the two layers, and the combustion products moved along with the upper smoke, forming a stable smoke stratification in Test#1 at HRR = 4 MW, longitudinal velocity = 0 m/s and a standard atmospheric pressure. As the longitudinal velocity was increased to 0.5 m/s, the boundary became blurred and partial vortices occurred (Figure 3(b)). Some smoke particles penetrated into the air layer as a result of the vortex, leading to more mass exchange. Such pattern is described as Pattern 2. In Figure 3(c), the longitudinal velocity became 1 m/s in Test#5. Under such condition, smoke and air mixed extensively, and many smoke particles poured into the air, resulting in the smoke sinking to a lower height. Therefore, the smoke layer in Test#5 has completely lost its stability, which is classified as Pattern 3.
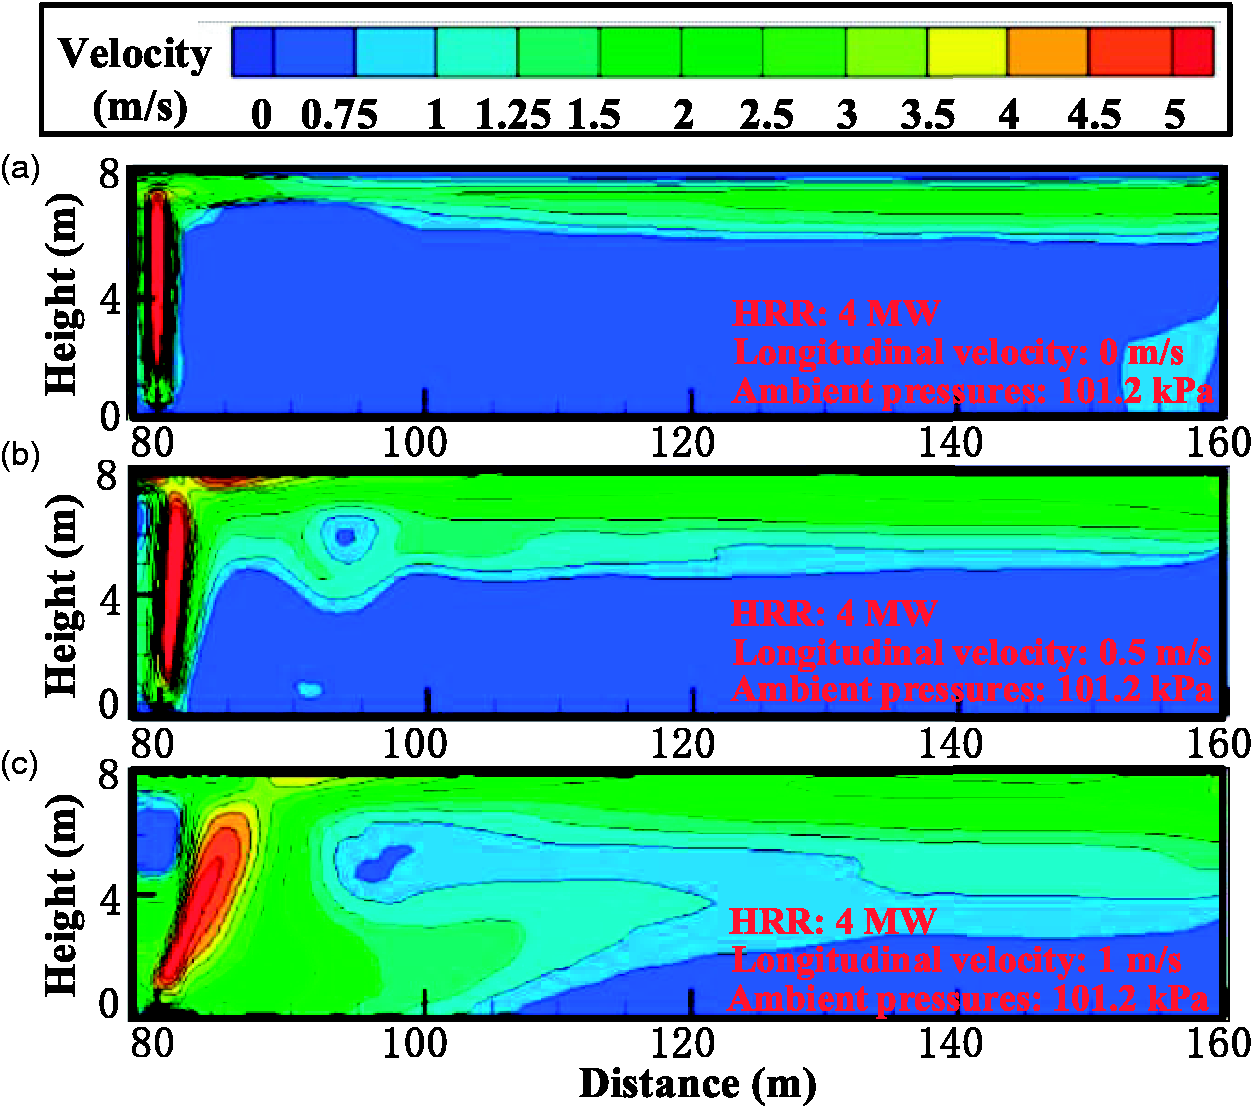
Typical smoke layer patterns according to flow field slices. HRR: heat release rate.
The three flow patterns were formed because the upper smoke and the lower air layers are different in their velocities. Calculation of smoke layer thickness by integral ratio method was employed. 39 The measurement point of flow velocity near the middle part of the smoke layer was usually selected to obtain the smoke layer velocity, and the measurement point of flow velocity near the middle air layer was selected to obtain air layer velocity. 23 Two additional measuring points of flow velocity were added respectively above and below the velocity measuring points of smoke and air layer in this simulation for higher accuracy, and the average value of the three measurement points of flow velocity was calculated to characterize the velocity of the upper smoke layer and the lower air layer, as shown in Figure 4. Longitudinal velocity could affect the characteristics of the smoke flow by altering the velocity difference between the two layers, resulting in a change in the shear strength and smoke flow patterns. Velocity differences between the smoke and air layers at Location A and B (refer to Figure 1) under different ambient pressures are shown in Figure 5. The velocity difference rose with elevated longitudinal velocities but was negatively correlated with pressure. Furthermore, the velocity difference grew due to a stronger driving force for one-dimensional smoke flow as a result of higher temperatures and thermal buoyancy at lower pressures.
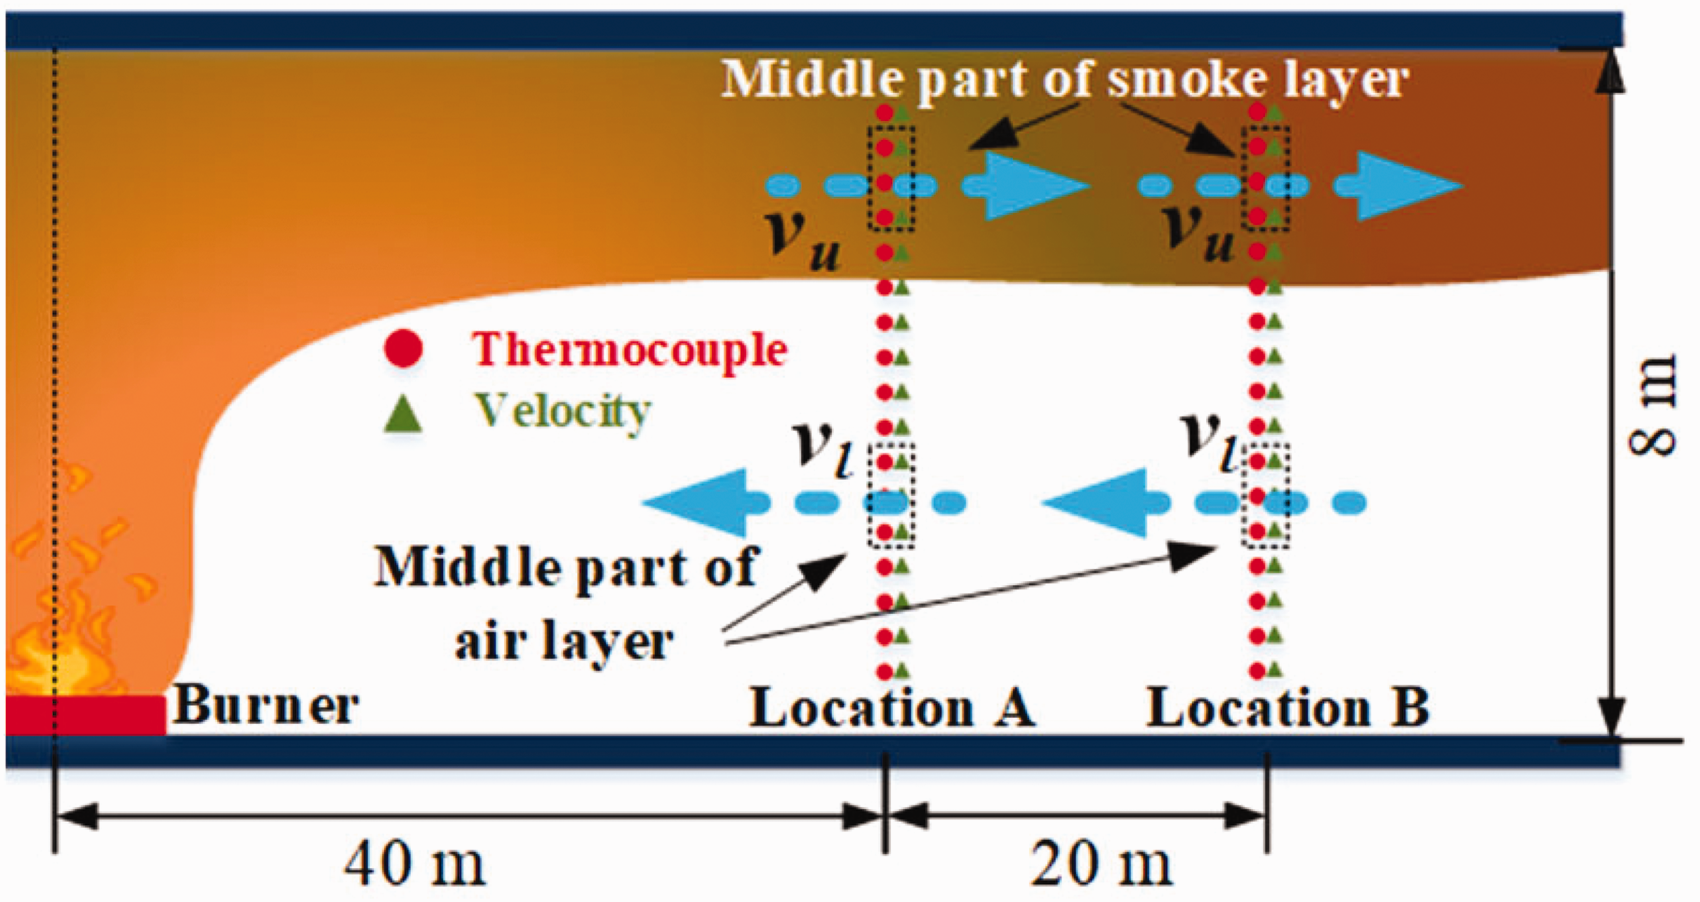
Selection of velocity measuring points of upper smoke and lower air layer.
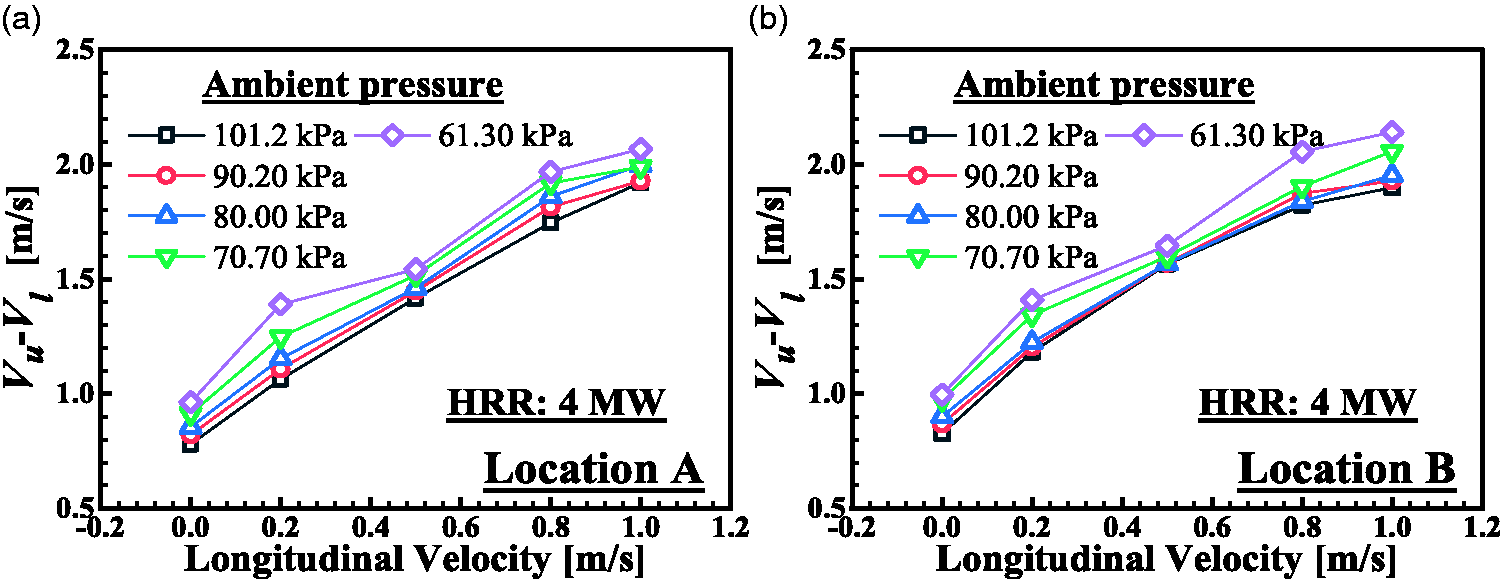
The difference in velocity between the smoke and air layers at Location A (a) and Location B (b) under various ambient pressures. HRR: heat release rate.
Vertical temperature distributions and smoke thicknesses at different ambient pressures
Figure 6 shows the variation of vertical temperatures at Location A with different HRR. The longitudinal velocity affect smoke movement in the tunnel. A faster longitudinal velocity can bring more heat from the fire source downstream at a given HRR, causing the faster rise rate of smoke temperature in the tunnel height below 6 m at Location A and B. While the phenomenon changed at a height of about 6 m, since a faster longitudinal velocity would exacerbate the spread of hot smoke at the ceiling of the tunnel, the smoke temperature would fall. In addition, the temperature near the floor (height < 5 m) rose slowly, while it ascended sharply at other heights. Specifically, the smoke temperature difference between 5 m and 7 m at vertical heights was the sharpest under various longitudinal velocities, approaching 50 °C. However, little variations in temperature were observed between 7 m and 8 m.
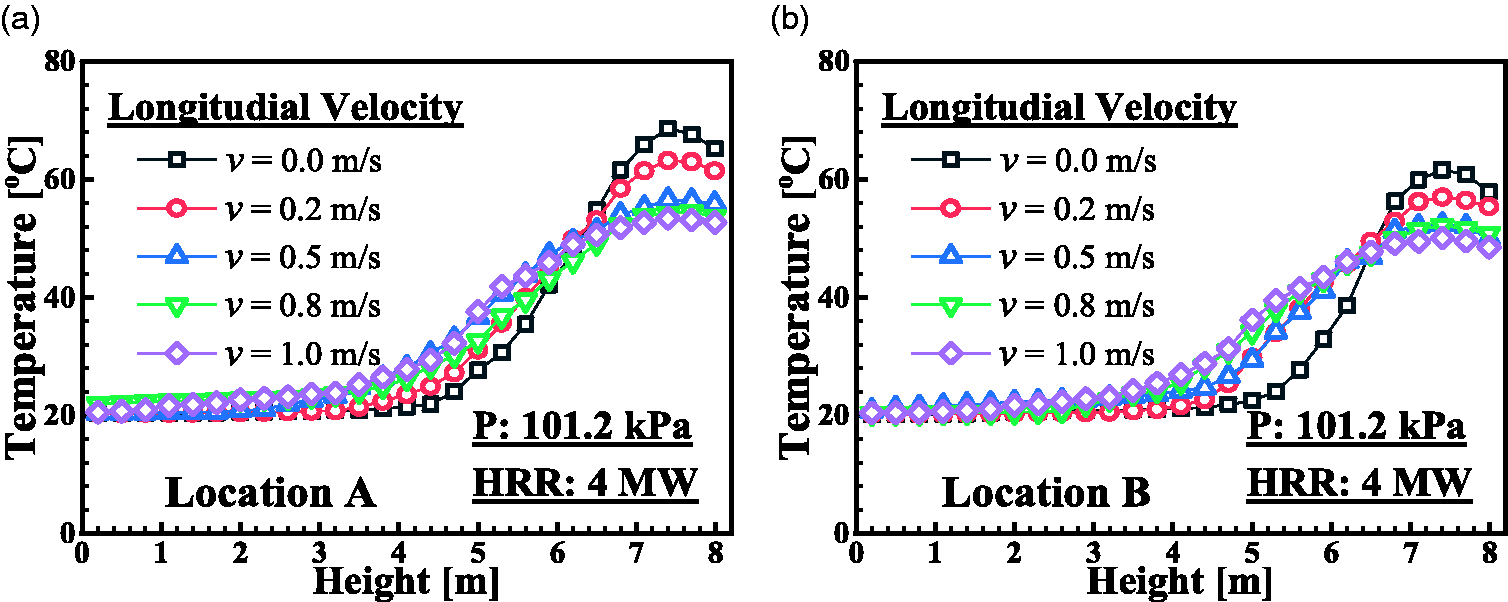
Vertical temperature profiles with different longitudinal velocities at Location A (a) and Location B (b) (HRR = 4 and ambient pressure = 101.2 kPa). HRR: heat release rate.
Figure 7 shows the temperature curves at Location A and B under various ambient pressures. In Figure 7, the overall temperature in the tunnel decreased with higher ambient pressures. When HRR = 4 MW and longitudinal velocity = 0 m/s, the vertical temperature peak at Location A was 84 °C at 61.3 kPa, and at 101.2 kPa the temperature was just 68 °C, exhibiting a difference close to 16 °C. Similar variation was observed at Location B, as well. Low air pressure could affect the combustion in two major aspects. On the one hand, on plateaus with low air pressure, more air is necessary to maintain the flame as it is thinner, leading to greater flame heights. On the other hand, according to the vertical temperature curve, air entrainment of the buoyant overflow plume is weaker under a reduced pressure, 31 owing to changes in the gas density at high altitudes. Different air densities would cause variations in the entrainment intensity, causing the combustion features of combustibles to change. Furthermore, as smoke spread along the longitudinal direction in the tunnel, heat conduction loss occurred along the way, which could explain that the temperature at Location A was slightly higher than that at Location B at the same height.
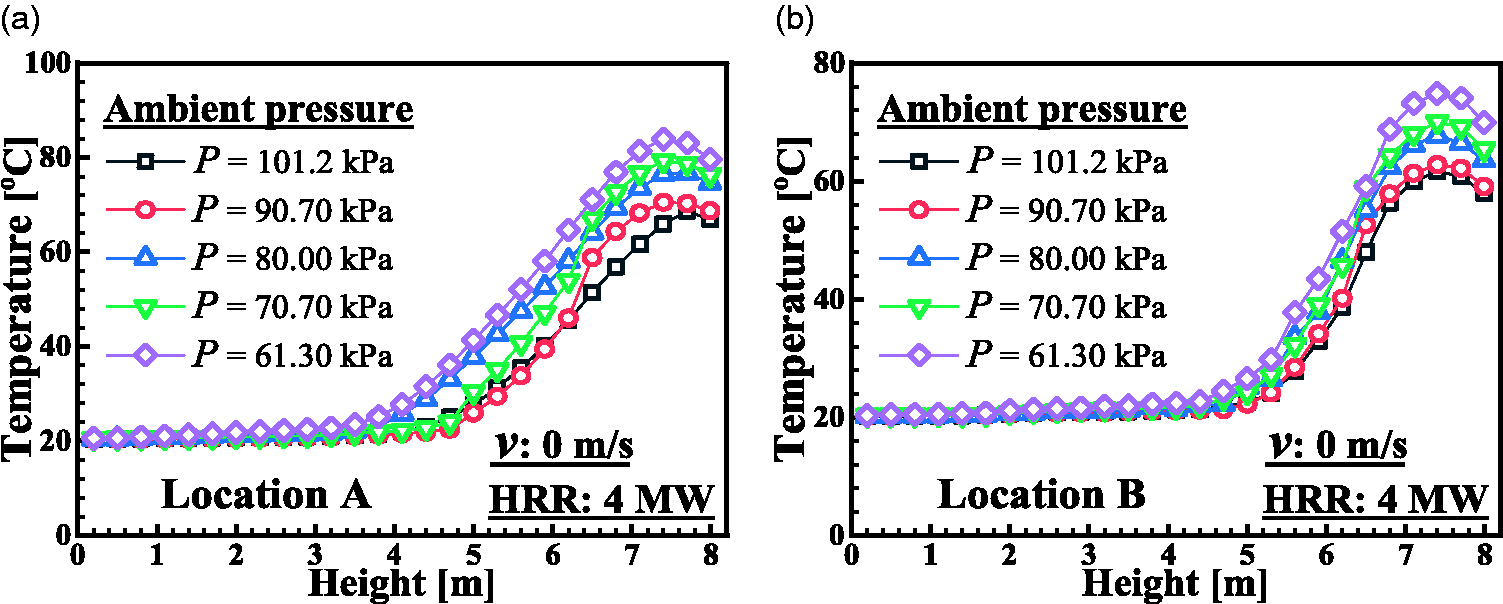
Vertical temperature profiles with different ambient pressures at Location A (a) and Location B (b) (HRR = 4 MW and longitudinal velocity = 0 m/s). HRR: heat release rate.
Based on the temperature collected at Location A, the smoke layer thickness was calculated by the integral ratio method, 39 so as to describe the temperature distribution as a function of temperatures and vertical heights. The specific calculation process was as follows.
Upper smoke integral ratio was calculated by equation (2)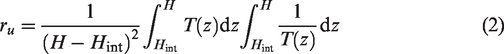
The temperature integral ratio at lower heights was defined by equation (3)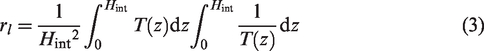
Then the total integral ratio was calculated by equation (4)
When HRR = 4 MW, longitudinal velocity = 0 m/s and ambient pressure = 101.2 kPa, the lower limit height for smoke was calculated as 6.16 m with a corresponding smoke layer thickness of 1.84 m (Figure 8). Since longitudinal velocity = 0 m/s, the smoke and air in the tunnel exhibited as Pattern 1, and smoke layer thicknesses at Location A and B were identical.
Calculation of smoke layer thickness by integral ratio method: (a) Location A and (b) Location B. HRR: heat release rate.
Smoke stratification with Froude number (Fr) and Richardson number (Ri)
The stability of smoke thermal stratification is predominantly dependent on the competition between thermal buoyancy and inertial forces. The former caused by the fire tends to promote a stable smoke stratification, while the latter caused by the forced ventilation tends to facilitate the mixture between the smoke and air layers and destroy the smoke layer. In previous literature, Fr has been suggested to characterize the ratio of the inertial force to the smoke layer buoyancy, which is expressed by equation (5)23
On the other hand, the overall Ri is defined as the ratio of buoyancy to the inertial force. It was proposed as a number to characterize smoke thermal stratification, as calculated by equation (6)
5
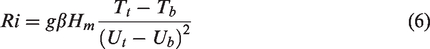
Figure 9 shows the two numbers calculated under all simulation conditions at Location A and Location B. At higher longitudinal velocities, Fr can be observed to increase with a decline in Ri. Besides, both numbers were smaller at Location B than Location A. Based on the flow pattern definitions, three regions with different Fr and Ri can be classified into their corresponding patterns:
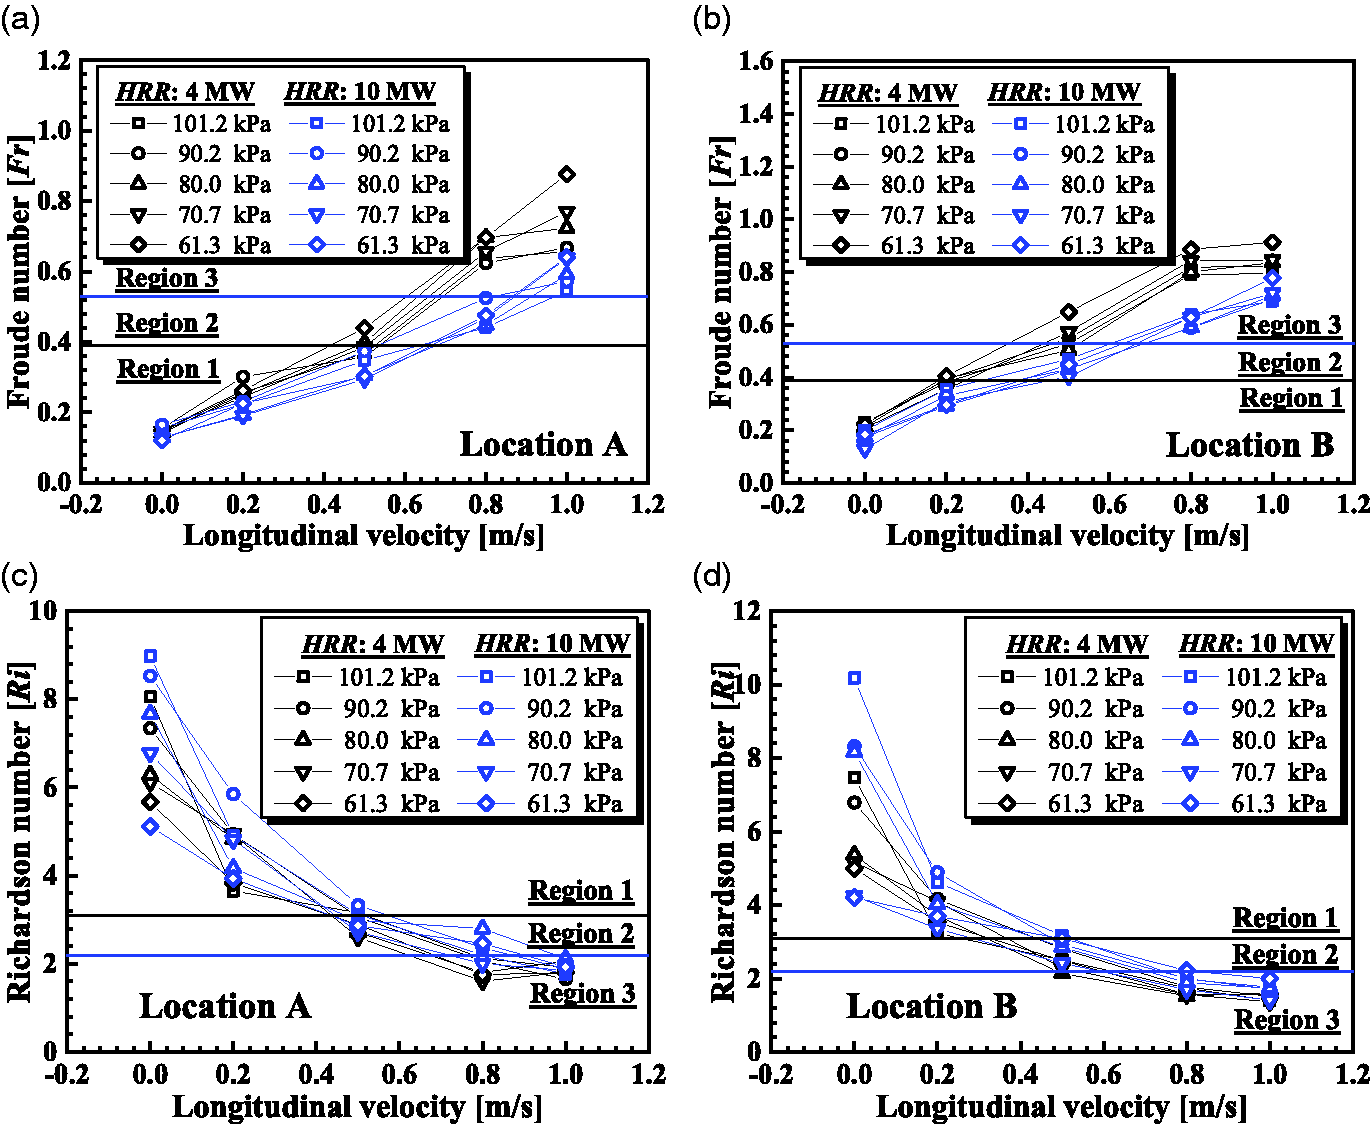
Variations of Fr and Ri in relation to longitudinal velocities at different ambient pressures and HRRs in Location A (a and c) and Location B (b and d), respectively. HRR: heat release rate.
Region 1(
Region 2 (
Region 3 (
Maximum smoke temperature under the ceiling in ventilated tunnels with different ambient pressures
Maximum smoke temperature under the ceiling is an important parameter to tell whether the monitoring and sprinkler systems can work normally. Also, it can be used in damage evaluations on tunnel structures. According to previous studies, 32 the maximum temperature occurs at 0.2 H under the tunnel ceiling, where H is the tunnel height. Therefore, in this work, the peak temperature of 1.6 m at different longitudinal positions was taken as the maximum smoke temperature beneath the tunnel ceiling.
Figure 10 showed the maximum smoke temperature below the ceiling, which was seen to be negatively correlated with ambient pressures and longitudinal velocities. When longitudinal velocity = 0 m/s, the maximum smoke temperature was 270 °C at 61.3 kPa, and at 101.2 kPa, it was 145 °C, showing a difference of 125 °C. Besides, greater longitudinal velocities would promote the formation of smoke-air mixture and strong air entrainment, leading to a decrease of smoke temperature beneath the tunnel ceiling. 11 Regardless of the varied longitudinal velocities, the ambient pressures are influential to the maximum smoke temperature under the tunnel ceiling. This is because lower air pressure means lower air density, and as a consequence, less fresh air is entrained into the smoke layer during smoke propagation under the same entrainment velocity. 40 Therefore, the air entrainment is weaker at lower pressure, resulting in higher smoke temperatures beneath ceiling.
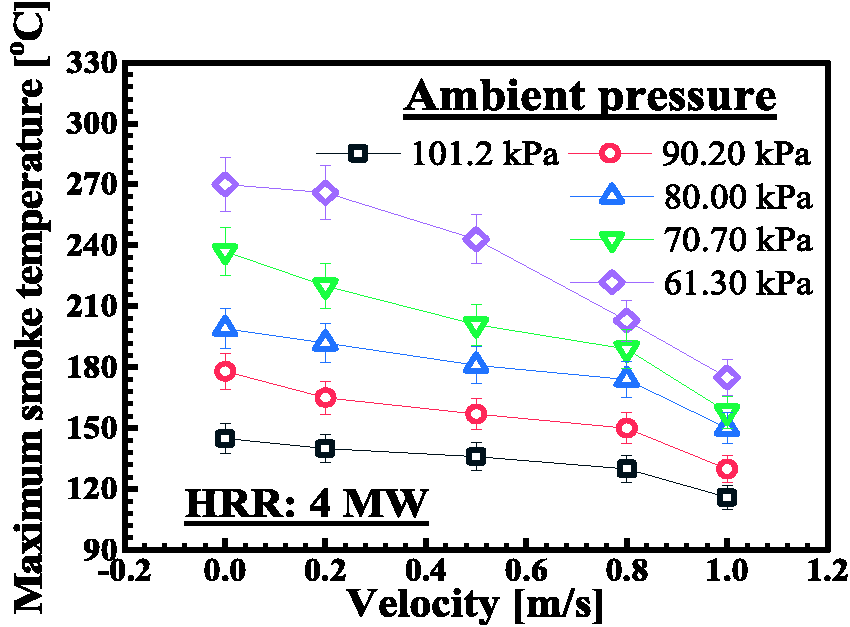
Maximum smoke temperature below the tunnel ceiling under various ambient pressures and longitudinal velocities (HRR = 4 MW). HRR: heat release rate.
In 2011, Li et al.
11
established a theoretical model to describe the maximum smoke temperature below the tunnel ceiling in a horseshoe-shaped tunnel A and a rectangular-shaped tunnel B. The results showed that the maximum smoke temperatures are linearly proportional to HRR when the dimensionless longitudinal velocity is higher than 0.19. Besides, the temperatures are proportional to two-third times of the HRR when the dimensionless longitudinal velocity is no greater than 0.19, and it remains constant despite changes in the longitudinal velocity. The theoretical model is described by equation (7)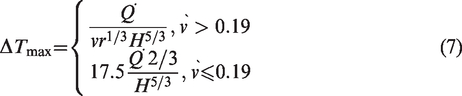

Previous research on maximum smoke temperature rise below the ceiling were predominantly conducted in ventilation tunnels under standard pressure, and their results are inappropriate for direct applications at different pressure. Therefore, studies about the law of maximum smoke temperature below the ceiling at various ambient pressures are necessary, and longitudinal smoke temperature distributions can be obtained by numerical simulations in the established tunnel model (Figure 11).
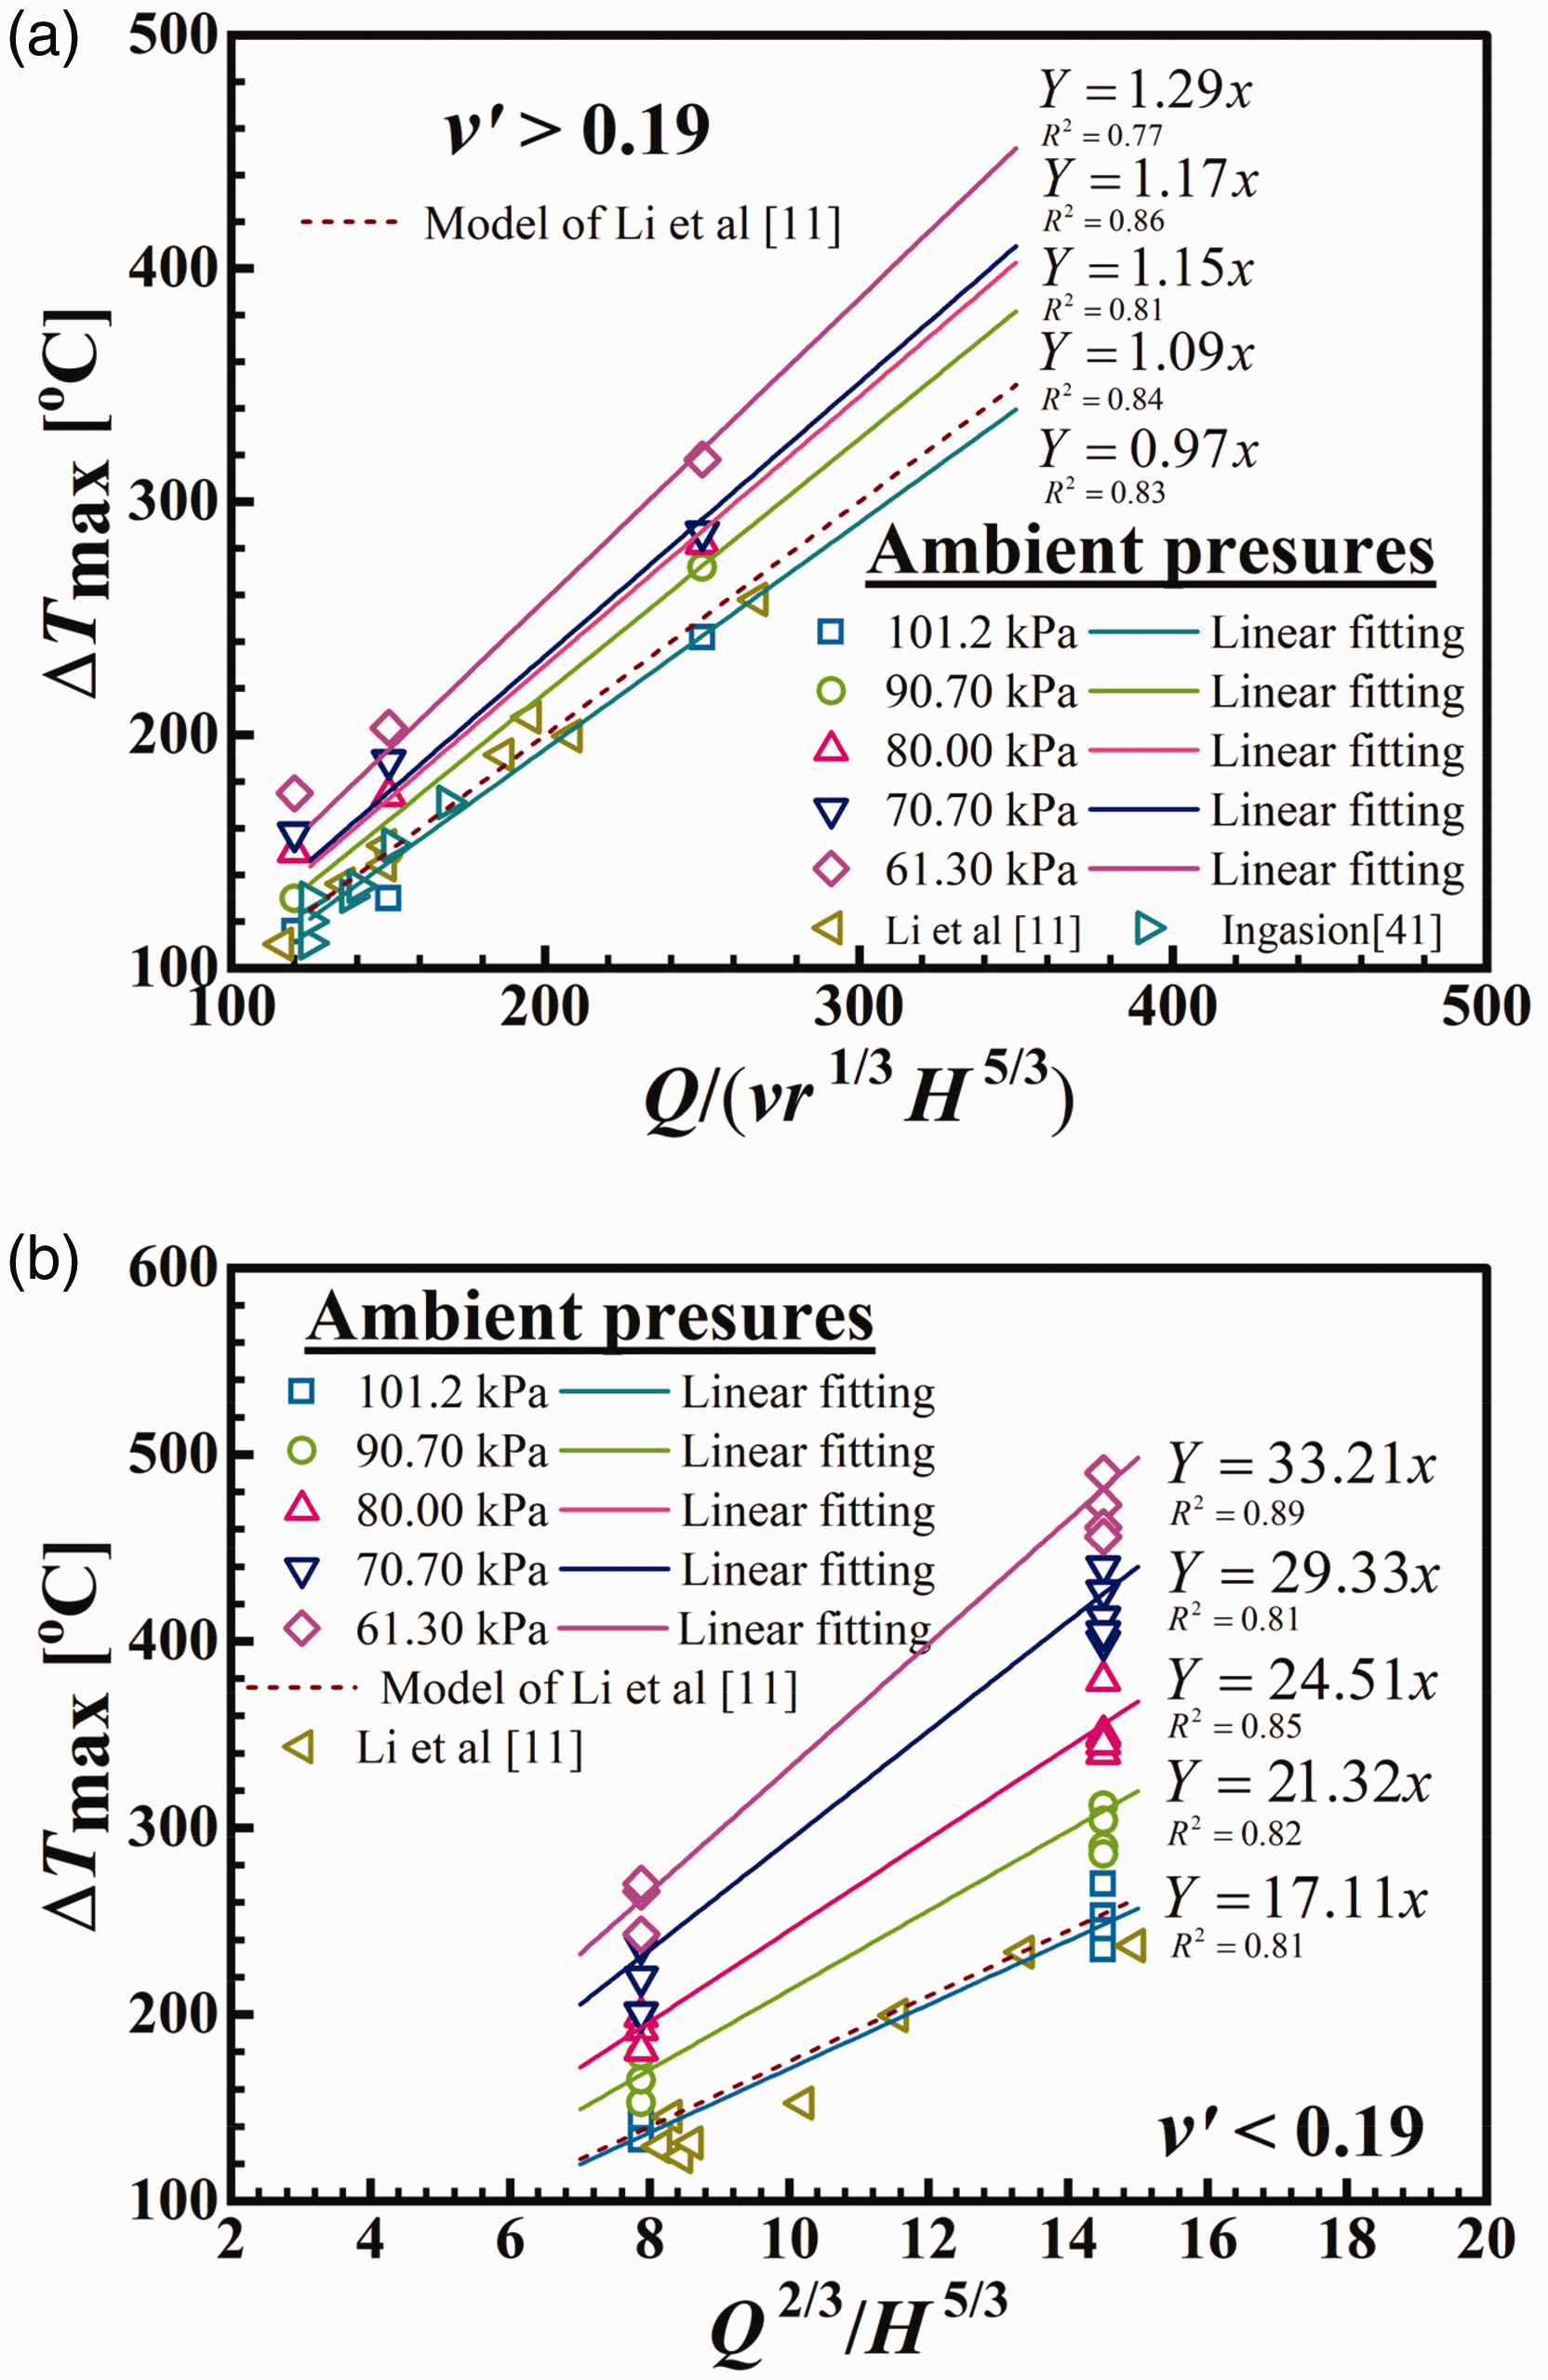
The maximum rise in smoke temperature under various ambient pressures and HRRs. HRRs: heat release rates.
Judging from Figure 11, predictions offered by the Li et al.’s model
11
are relatively close to measurement results at the atmospheric pressure, suggesting the model to be more accurate for predictions at the standard pressure. However, simulation results at other pressures, which continuously decreased along with a rising ambient pressure, varied far from the predictions given by the Li model.
11
Therefore, when establishing a theoretical prediction model for maximum smoke temperature rise below the ceiling in a ventilation tunnel at all pressures, environmental factors need to be considered. Assume that the ambient pressure coefficient is 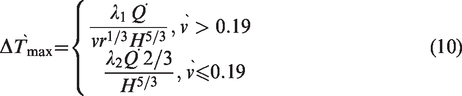
Similarly, 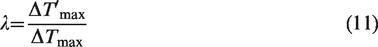
The relationship between
The relationship between
Equation (12) gives the correlation between 
Taking equation (12) into equation (10), and Li’s prediction model
11
can be modified by equation (13)
The maximum rise in smoke temperature at various ambient pressures calculated from equation (13) was compared with the numerical experiment results (Figure 13).
Comparison of the numerical simulations from equation (13) and experimental results of the maximum rise in smoke temperature beneath the tunnel ceiling.
Figure 13 shows that the predictions obtained from equation (13) fit well with the numerical simulation under various ambient pressures and previous experimental results at standard atmospheric pressure.41-43 Therefore, the prediction model proposed in this study is reliable.
Conclusions
A series of simulations were conducted in a high altitude tunnel to study the influence of various ambient pressures and longitudinal velocities on smoke stratification and maximum smoke temperature. Additionally, the velocity of smoke and air layers, as well as their vertical temperature distributions, were recorded. The smoke flow patterns were also captured. The major findings in this study include: The longitudinal ventilation and the ambient pressure could affect the smoke flow rate, causing the velocity difference between smoke and air layers and shear intensity to change. Furthermore, the temperature of the upper smoke layer is negatively correlated with the longitudinal velocity and ambient pressure. Three regions correlated with Fr and Ri are classified and found to exhibit a good correspondence with the three the flow patterns. When The maximum smoke temperature below the tunnel ceiling was found to be negatively correlated with the ambient pressure. Additionally, a correlation model was established to predict the maximum smoke temperature below the tunnel ceiling with various HRRs, longitudinal velocities and ambient pressures, and the established model was found to fit well with previous experimental results under a standard air pressure.
Supplemental Material
sj-pdf-1-ibe-10.1177_1420326X211013080 - Supplemental material for Impacts of ambient pressure on the stability of smoke layers and maximum smoke temperature under ceiling in ventilated tunnels
Supplemental material, sj-pdf-1-ibe-10.1177_1420326X211013080 for Impacts of ambient pressure on the stability of smoke layers and maximum smoke temperature under ceiling in ventilated tunnels by Tong Xu, Fei Tang, Xuhao Xu and Qing He in Indoor and Built Environment
Footnotes
Authors’ contribution
Tong Xu: Writing – Reviewing and Editing; Fei Tang: Conceptualization, Writing – Reviewing and Editing, Supervision; Xuhao Xu: Writing – Reviewing and Editing; Qing He: Writing – Reviewing and Editing.
Declaration of conflicting interests
The author(s) declared no potential conflicts of interest with respect to the research, authorship, and/or publication of this article.
Funding
The author(s) disclosed receipt of the following financial support for the research, authorship, and/or publication of this article: This work was supported by the National Nature Science Foundation of China (grant nos. 52076066 and 51776060) and SAFEA: High-End Foreign Experts Project (grant no. G20200012001).
References
Supplementary Material
Please find the following supplemental material available below.
For Open Access articles published under a Creative Commons License, all supplemental material carries the same license as the article it is associated with.
For non-Open Access articles published, all supplemental material carries a non-exclusive license, and permission requests for re-use of supplemental material or any part of supplemental material shall be sent directly to the copyright owner as specified in the copyright notice associated with the article.