
Abstract
In factories where high-risk chemical pollutants are treated, it is essential to anticipate response measures in the event of chemical pollutant leakage to minimize adverse health effects on workers. When high-risk liquid chemical pollutants are assumed to be leaked inside enclosed spaces, it becomes crucial to predict the non-uniform concentration distributions in enclosed spaces and evaluate the health impacts and risks of short-time exposure to prevent large-scale accidents. Therefore, we have developed an emergency ventilation system for controlling the inhaled contaminant dose of factory workers. In this study, assuming a worst-case scenario liquid chemical pollutant leak in an enclosed factory space, the advantages and performance of a hybrid ventilation system that combines displacement and push–pull type ventilation systems were numerically investigated. Installation of wall materials that facilitate photocatalytic oxidation (PCO) reactions for background passive concentration control was also discussed. Based on the demonstrative numerical analyses for a realistic factory space, push–pull type ventilation system was confirmed to effectively suppress chemical pollutant diffusion in enclosed spaces with a low ventilation rate. Wall materials with the PCO mechanism had a certain contribution to the control of peak concentration.
Keywords
Introduction
Indoor air pollution is known to be a potential risk factor for various diseases such as acute lower respiratory tract infection, chronic obstructive pulmonary disease, lung cancer, ischemic heart disease and stroke.1–4 Recently, air pollution has also been linked to heightened incidence of severe acute respiratory syndrome coronavirus (SARS-CoV and SARS-CoV-2).5–7 In modern societies, where people spend more than 90% of their time indoors, indoor pollutant concentration will have a significant impact on life quality and health of residents. With the constant industrialization throughout the world, the application of advanced design methods is highly desired for industrial buildings, distinguished from theoretical and practical design methods for civil buildings. 8 Moreover, a strict control of indoor chemical concentration is required, especially in the industrial built environment where chemical substances are handled. Particularly, it becomes crucial to take measures against accidental chemical leakage emergencies wherein a liquid pollutant was leaked in an enclosed space. This worst-case scenario poses a risk of high concentration exposure over a short period.9–11
Ventilation strategies, either active or passive, are straightforward measures to transport and dilute chemical pollutants from the indoor environment for air quality and pollutant concentration management.12–16 To date, a variety of active ventilation systems where fresh and clean air is directly introduced into the industrial built environment, have been applied for pollutant control; i.e. lateral ventilation, local exhaust ventilation, displacement ventilation, and so on.16–19
Particularly, displacement ventilation (DV), whose main control target is the working area in the lower part of the room, has often been applied to offices and similar settings, with a few examples applied in factory spaces.20–25 Under DV, air is delivered through the supply inlet allocated to the lower part of the room, forming temperature stratification wherein pollutants are transported from the lower to the upper section of the room due to buoyancy. Hence, pollutants generated near the floor are discharged from the exhaust outlet set along the ceiling surface.
Although DV efficiency has been confirmed, additional measures should be preliminarily discussed for emergency cases of accidental leakage. In the field of industrial ventilation, push–pull (P–P) ventilation systems are well known due to their high containment capture effect of emitted gas-phase pollutants. Huebenger and Hughes 26 reported that P–P ventilation has marked advantages in controlling contaminant emissions in the workplace, where 98% of the contaminant generated can be captured by the P–P system using the proper flow rates.
On the other hand, passive ventilation has also been adopted for pollutant concentration regulation in the indoor environment.27–30 For example, facilitating photocatalytic oxidation (PCO) reactions with titanium dioxide (TiO2)-bound indoor building materials has become a promising approach to decomposing gas-phase chemical pollutants. Recently, the development of visible-light-type TiO2-bound building materials, along with the precedence of photocatalytic building material technology for indoor environments, has also been explored.31,32 However, the PCO technology has rarely been applied to air quality control in factory spaces.
Against this information, we propose an emergency ventilation system (EVS) that integrates the merits of active (DV and P–P) and passive (PCO) ventilation strategies to purge contaminant concentration in the case of a large chemical leakage. This hybrid EVS connects DV, P–P and a PCO reaction of a gas-phase chemical pollutant with TiO2-bound indoor building material in the form of wall finishing. We report a feasible pollutant concentration reduction due to the EVS in terms of room-averaged and inhaled pollutant concentration for a specific worker. We also discuss the synergic effect with the EVS under different leakage scenarios of liquid-phase chemical pollutants. To date, there has been little to no research into the application of emergency ventilation systems assuming accidental leakage of pollutants, while passive/active ventilation systems operating all the time have been widely discussed to reduce long-term health risks in industrial buildings.33–36 In other words, this study becomes a highly leading and original research where the application possibility of a hybrid EVS in emergency situation is investigated in detail.
We have adopted a numerical method applying computational fluid dynamics (CFD) to investigate the performance and applicability of the proposed EVS to a factory space. CFD is considered a promising method for precisely predicting non-uniform air flow and contaminant distribution in indoor environments. This method has relatively low operating costs with fast calculation, and its quantitative and visual results are suitable for assessing complex flow fields and pollutant distribution.37–40 Furthermore, when designing a hybrid EVS, direct measurements may be constrained by ethical considerations, but CFD facilitates calculations for optimizing the proposed ventilation system without such constraints. To clarify and quantitatively estimate the inhalation exposure of a specific worker in an enclosed space, we adopted a computer simulated person (CSP) for indoor CFD analysis.3,41
The overarching objective of this study is the development of an integrated ventilation system that can efficiently control and noticeably reduce the inhalation exposure concentration of workers in an emergency event of large chemical leakage in an industrial environment. In particular, we have parametrically investigated the controllability of indoor and inhaled pollutant concentration when PCO-bound wall finishing is applied in addition to the hybrid DV/P–P ventilation system.
Methodology
Analysis model
An industrial workshop space consisting of two zones that handle chemical compounds was assumed in order to analyse inhalation exposure in case of liquid chemical compound leakage accidents. Figure 1 shows the layout of the workshop model. The workshop space is a rectangle of (31.0 × 9.0 × 4.0) m, and the interior space is divided into two spaces, room 1 (R1) and room 2 (R2) by a wall with a door. The door was open as a passageway. The shape of the workbench was determined to recreate the complex machinery inside a factory. Six rectangular workbenches were installed uniformly on R1, and one workbench with a complicated shape was installed at the centre of the room on R2. A CSP that precisely reproduces the shape of the human body was installed near the door of R1. The workshop model used in this analysis was the same as that reported in our previous study. 10
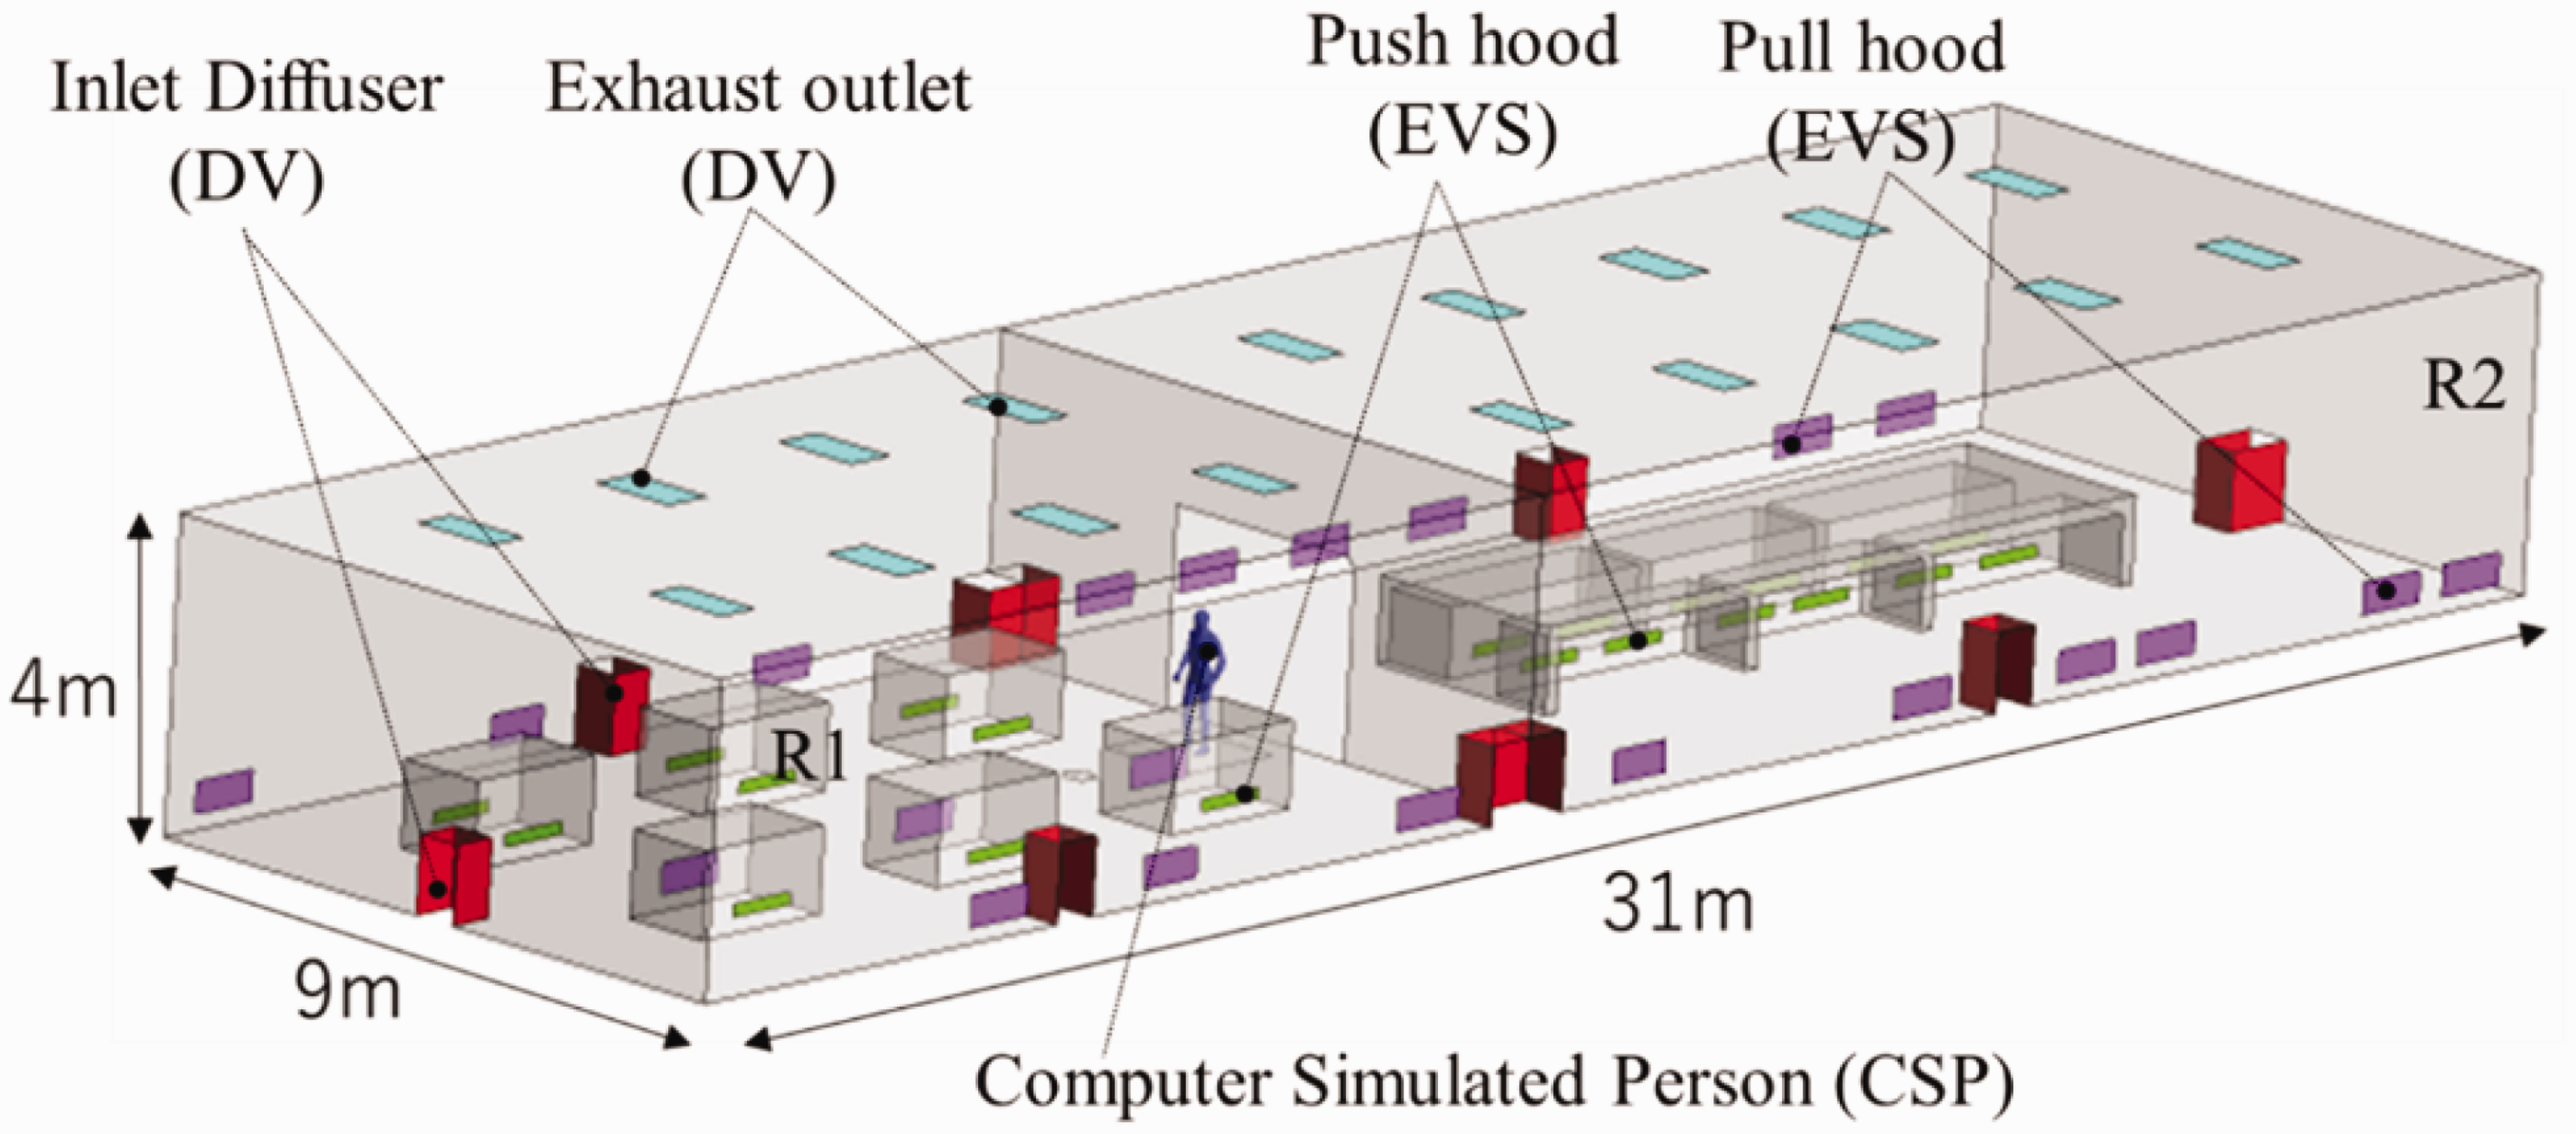
Layout of industrial workshop.
Three-layer prism grids were created on the surfaces of the CSP and workbench. Furthermore, adjustments were made to include one mesh or more in the area of wall coordinates y+ <1, and six-layer prisms were created on the floor, wall and ceiling surfaces. The room volume was discretized using a polyhedral mesh with a hexahedral core. Two locations of leak sources were set up to evaluate the performance of the EVS with respect to the location of the leak sources (Cases 1 and 2). In Case 1, leak source A was set on the floor surface 2 m in front of the CSP, assuming typical pollutant leakage in the working zone. The mesh division (x–z plane) of Case 1 is shown in Figure 2(1), and the location of the leak source is shown in Figure 2(3). In Case 2, a leak source B as shown in Figure 2(4) was set on the floor of R1, away from the CSP, assuming pollutant leakage in a blind spot of ventilation.

(a) Grid design of Case 1 (x–z plane). (b) Grid design around leak source A. (c) Position of leak source A (Case 1). (d) Position of leak source B (Case 2).
Computer simulated person
The CSP installed in the factory was modelled based on the body shape of an average adult male. An enlarged view of the CSP is presented in Figure 3. This CSP has 45,000 surface elements, a surface area of 1.716 m2, and a height of 1.736 m. In this study, the left and right nostrils were used as the boundary conditions for inhalation. The respiratory rate of the CSP was set constant at 0.45 m3/h (or 7.5 L/min) in accordance with the tidal volume of 0.0005 m3 (0.5 L), and a respiratory rate of 15 breaths per minute in the normal range when humans are in resting condition. 42 The skin surface temperature was kept constant at 34°C to maintain simplified temperature conditions. 43
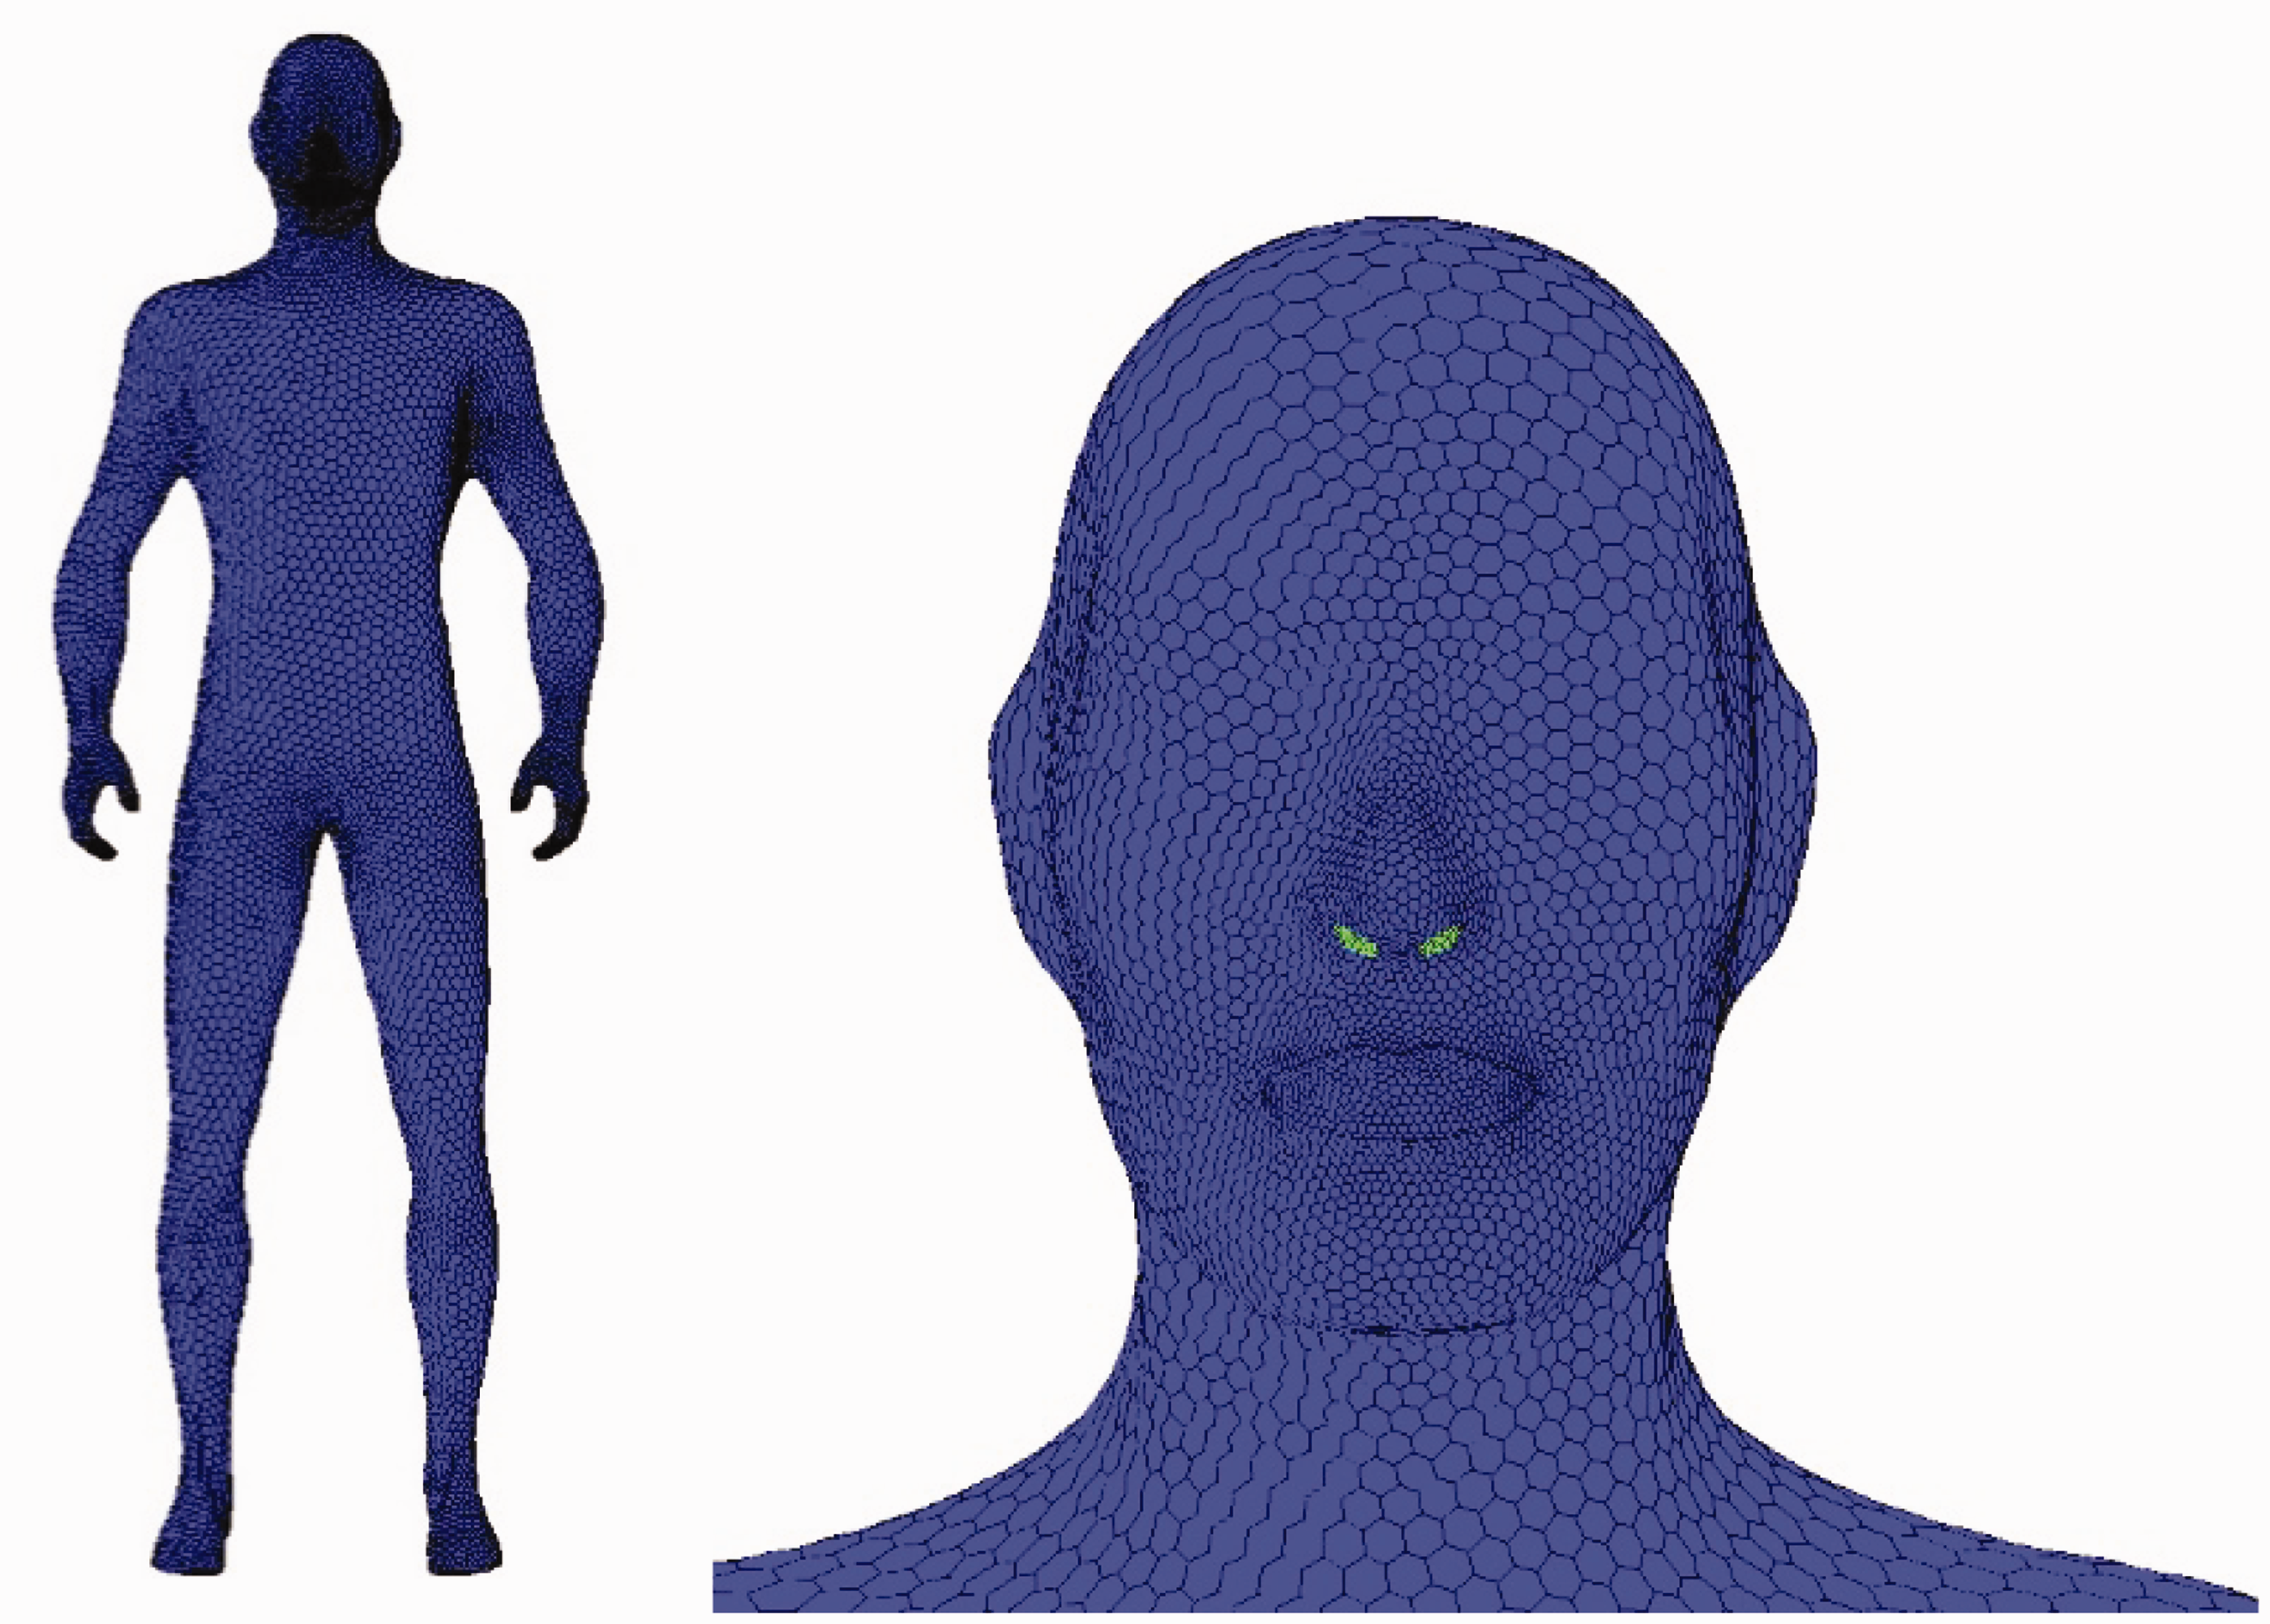
Computer simulated person for inhalation exposure analysis.
Gas-phase chemical compound emission from leakage source
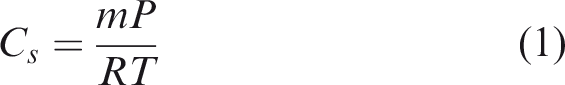
The target chemical substance used in this simulation was toluene. Liquid toluene was assumed to be leaked to the floor, and gas-phase toluene evaporated from the liquid level at the leak location. In terms of surface leakage, the inside of the liquid was excluded from the analysis and was set as a Dirichlet-type boundary condition. The saturated gas concentration based on the vapour-liquid equilibrium theory was derived from the ideal gas law as shown in equation (1)
44
Displacement ventilation system
To analyse the performance of the DV system, a total of 10 supply inlets (diffusers) were installed at positions in contact with the wall surface of the factory model. The dimensions of the diffuser are rectangular: (0.6 × 0.6 × 1.0) m. The location of the diffusers is shown in red in Figure 1. In addition, 18 exhaust ports with dimensions (1.2 × 0.6) m were added to the ceiling at regular intervals of 2 m. Location of the exhaust ports is shown in Figure 1 (light blue).
According to general industrial regulations, the ventilation rate was assumed to be 25 changes per hour (ACH), and the velocity inlet of the diffuser was set to 0.5 m/s. The boundary condition of the exhaust port was set as pressure outlet. The ventilation rate of the entire factory under the DV system was 8.11 m3/s. Table 1 lists the numerical and boundary conditions used for the DV system.
Numerical and boundary conditions.
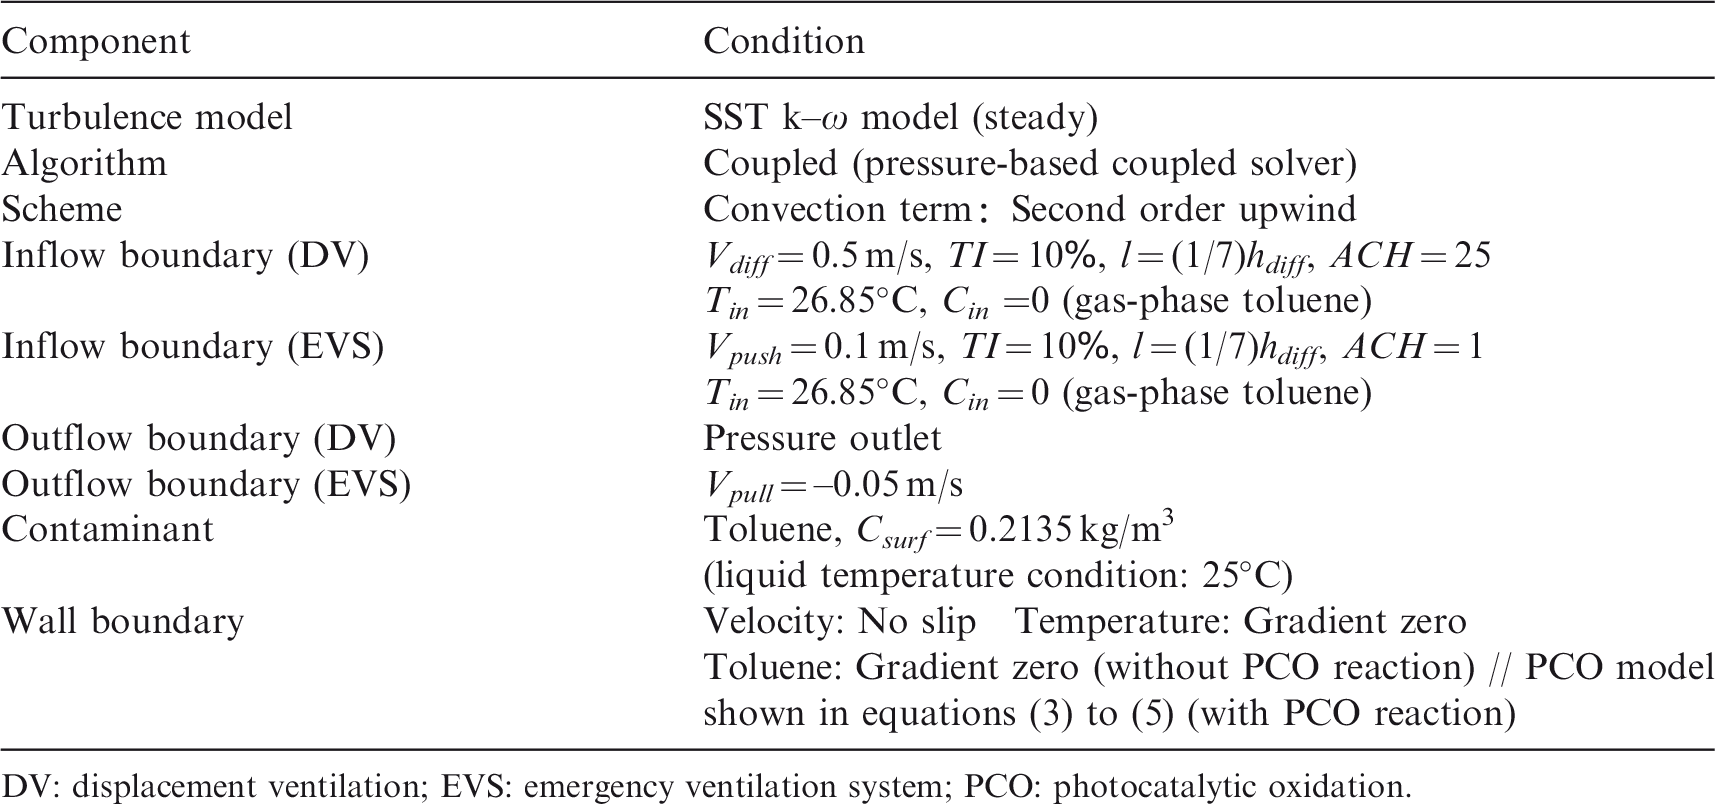
DV: displacement ventilation; EVS: emergency ventilation system; PCO: photocatalytic oxidation.
Hybrid emergency ventilation system
Push and pull (P–P) type ventilation systems were installed on the factory model to purge pollutants generated from the floor level. In this study, the combination of DV and P–P systems is designated as the hybrid EVS.
Each push opening (i.e. the supply inlet of the P–P system) was (1.0 × 0.2) m; in total, nine push openings were installed on the R1 workbench, and 12 push openings were installed on the R2 workbench. The size of the pull opening (i.e. the exhaust outlet of push–pull system) was (1.0 × 0.4) m, installed in a total of 18 locations on the wall of the factory and one on each of the three workbenches of R1. The P–P openings are shown in green and purple in Figure 1, respectively. The push hood and pull hood were installed facing each other to ensure the effectiveness of the system.
The velocity inlet of the supply push jet was set to 0.1 m/s (0.02 m3/s) assuming an air change per hour of 1 h−1. The pull hood was set at an outflow velocity of 0.05 m/s (0.02 m³/s). The total ventilation rate of the EVS system was 8.43 m3/s, which was only 4% higher than that of DV. Table 1 also lists the numerical and boundary conditions used for EVS analysis.
Modelling of wall materials with photocatalytic oxidation reaction
We numerically modelled the PCO degradation of toluene on TiO2-bound building material surfaces and integrated this numerical model into CFD simulation as a wall surface boundary condition.31,32
To evaluate the effect of concentration reduction when the photocatalyst building material is installed on the wall surfaces of the factory, the integrated effects of chemical pollutant concentration reduction with the EVS were numerically investigated.
The model used in this research is based on the Langmuir–Hinshelwood adsorption type, incorporated into the CFD model considering the competitive adsorption of water and toluene on building materials.
31
,
32
Equation (3) shows a model formula for reducing the concentration of toluene using a photocatalytic building material, where r is the toluene decomposition flux ((kg/m2).s). r is the sum of r1 in equation (4) and r2 in equation (5), each weighted by the titanium oxide coverage ζ (−)
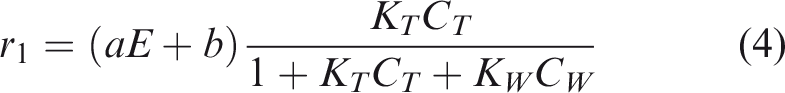
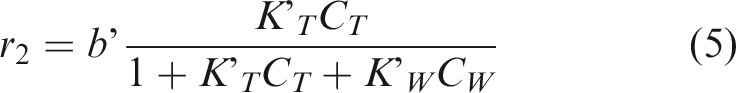
Here, KT is the equilibrium constant of toluene adsorption (m3/kg), KW is the equilibrium constant of water vapour adsorption (m3/kg), a is the constant of the reaction rate (kg/m2.s.lx) and b is the reaction rate constant ((kg/m2).s).
There are four variables in the PCO model: gas phase concentration of toluene CT (kg/m3), titanium oxide coverage ζ (−), wall illuminance E (lx) and gas phase concentration of water vapour CW (kg/m3). The titanium oxide coverage was set at 0.44 (−), a value that has been used in building material studies. Two types of illuminance conditions, 600 and 1000 lx, for average floor illuminance were assumed; non-uniform illuminance distributions on the wall surfaces were calculated using the ray tracing method.
The gas phase concentration of water vapour was set to 0 kg/m3 to confirm the maximum effect of the photocatalyst. Equation (3) was modelled as a surface reaction. This was applied to the first cell of the wall surface as a volume reaction, and equation (6) was derived to describe the reaction changes occurred. 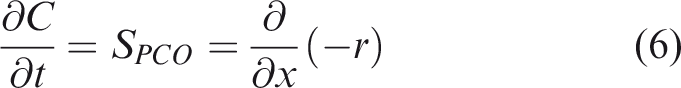
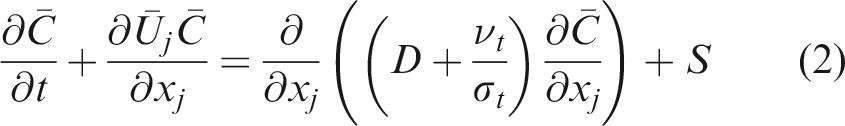
Photocatalytic building materials were assumed to be installed on the floor, walls and ceiling of the factory model (excluding leak sources, workbenches and inflow/exhaust ports). Then, using SPCO as the source term S of the scalar transport equation (equation (2)) of the first cell in contact with the surface of the building material, the photocatalytic phenomenon and physical adsorption phenomenon were reproduced.
Quality control of CFD calculation
In this study, we established our comprehensive simulation method in joining the elements whose individual accuracies/qualities were validated. The key model in our comprehensive indoor environmental analysis is the computer-simulated person. The precise reproduction of indoor environment–human interaction and microclimate around a human body in detail is highly important, especially the flow field characteristics which have a dominant influence on the contaminant transport and exposure risk. In this study, we carefully prepared our analytical grid design around the CSP based on the quality control guidelines reported in our previous studies,37–40 and analysis results were checked referring to benchmark test results of CSP. The SST k–ω turbulence model which is excellent for detachment prediction was used for detailed analysis in the viscous sublayer, allowing the concentration profile near the wall to be predicted accurately. 39
Boundary conditions for DV/EVS system were also carefully checked, and the simulation method of PCO reaction was applied in accordance with the methodologies adopted in the previous studies.31,32 For the evaporation of toluene from the leak source, we referred to previously reported experiments and numerical simulations in a small glass chamber to set the boundary conditions. 11 By validating the chemical emission model from a liquid surface, it was confirmed that the experimental results concerning chemical emission characteristics from a liquid surface can be reasonably reproduced by incorporating a chemical emission model based on the vapour-liquid equilibrium theory into the numerical analysis.
Results and discussion
Airflow distributions
The cases analysed in this study are listed in Table 2. A total of 12 cases were set by changing the position of the leakage source, illumination level and ventilation system design. Figure 4 shows the scalar velocity distributions in the workshops and around the CSP in Cases 1–1, 1–2, 2–1 and 2–2. For Cases 1–3, 1–4, 2–3 and 2–4, which contained a PCO reaction, the same flow field was used before and after the application of the photocatalyst building material.
Cases and analysis results of toluene concentration and decrease rate.
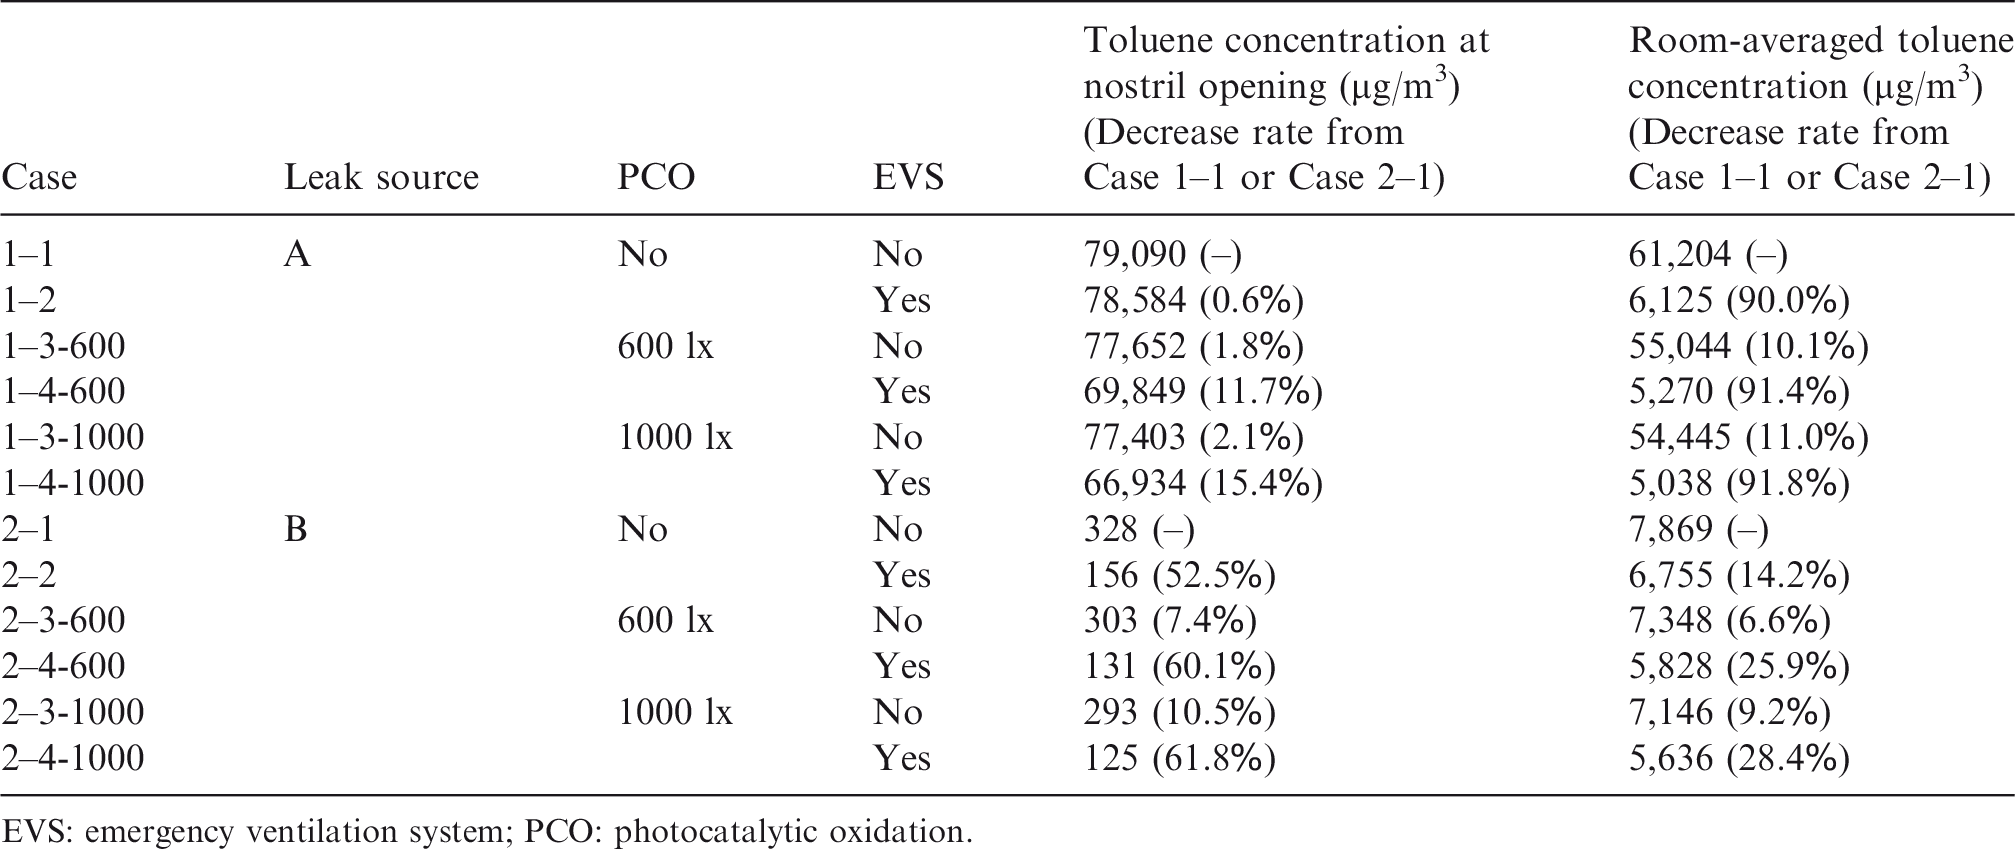
EVS: emergency ventilation system; PCO: photocatalytic oxidation.
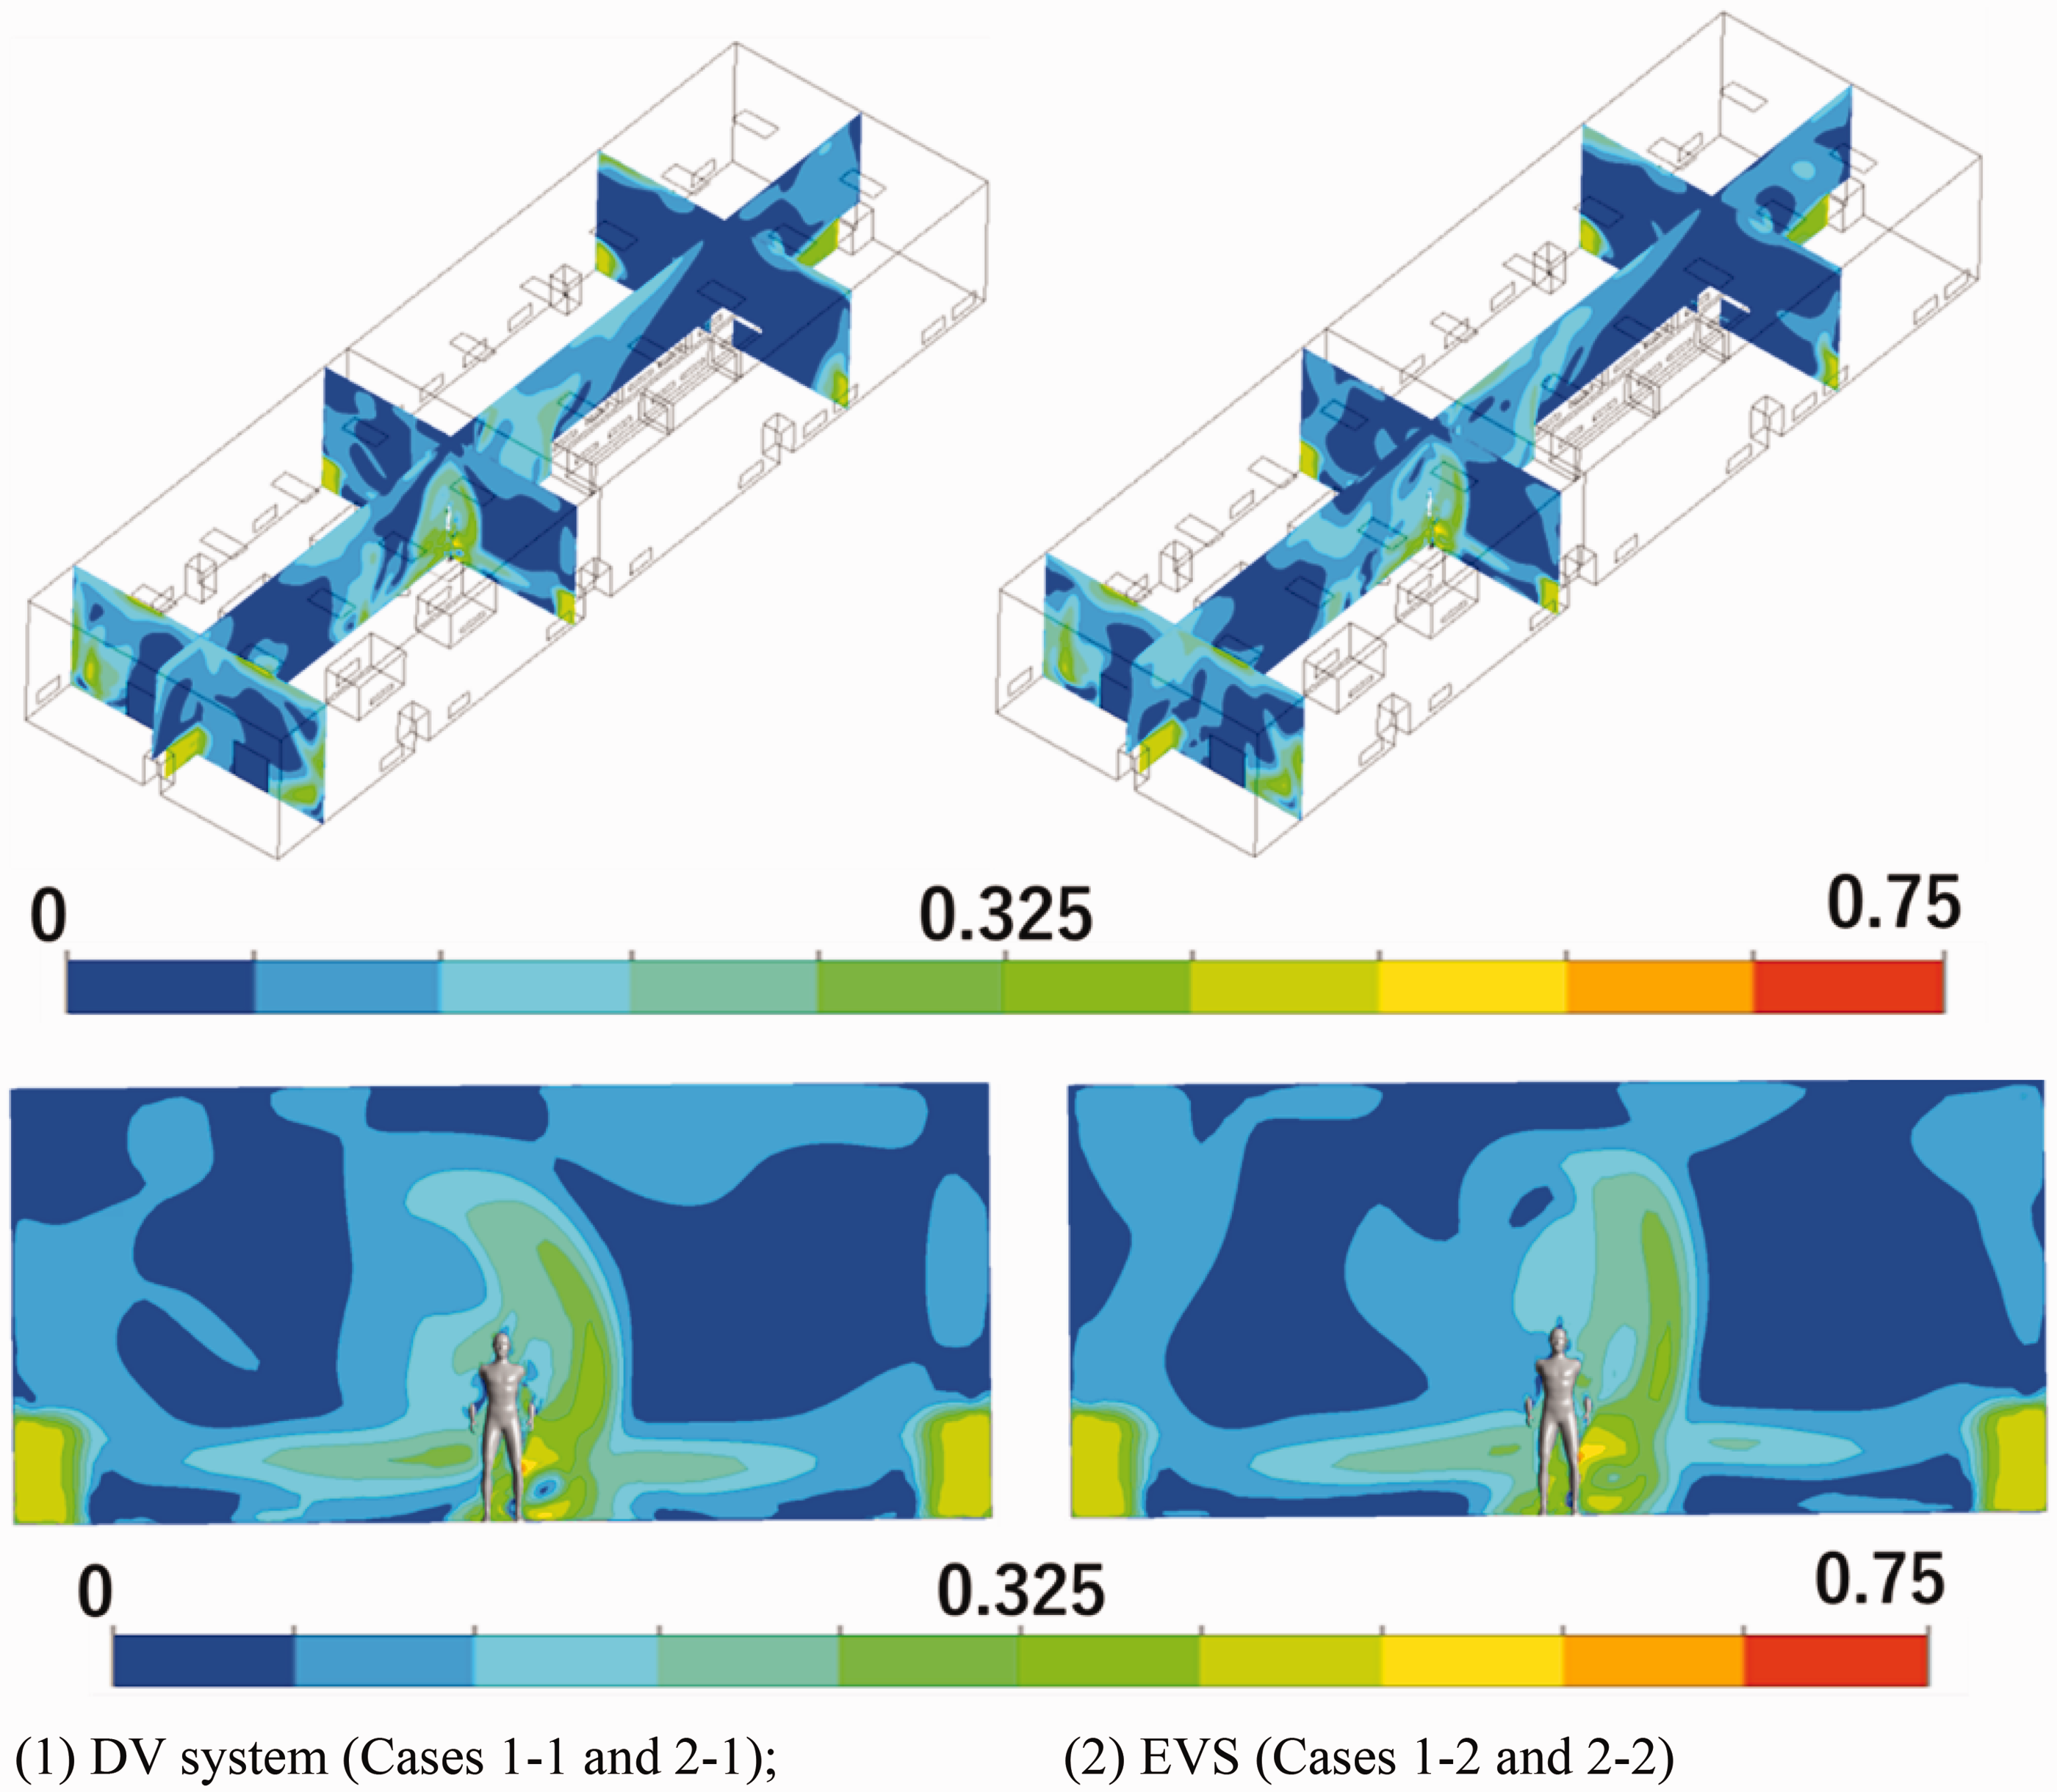
Scalar velocity distributions (m/s). (1) DV system (Cases 1-1 and 2-1) and (2) EVS (Cases 1-2 and 2-2).
In Cases 1–1 and 2–1, ventilated by the DV system, stagnant air flow can be observed in locations where the diffuser jet cannot directly reach. In Cases 1–2 and 2–2, to which the EVS is applied, more air movement can be seen near the floor. As for the air flow around the CSP, the jets of the wall diffuser collided, and a complex flow was formed at knee height.
Toluene concentration distribution
Figure 5 shows the three-dimensional concentration distribution of gas-phase toluene in the entire indoor space. In all cases, the toluene concentration of R2 was low, confirming the effectiveness of the ventilation system in containing contaminants. In Case 1–1, the distribution of high-concentration pollutants was confirmed over a wide area. However, in Case 1–2 to which the EVS was applied, the diffusion of pollutants was suppressed, and the concentration was also reduced. In Case 1, the EVS was effective in reducing indoor toluene concentration. For Case 2-1 and Case 2-2, the effectiveness of the EVS was not remarkable, although the concentration tended to decrease.
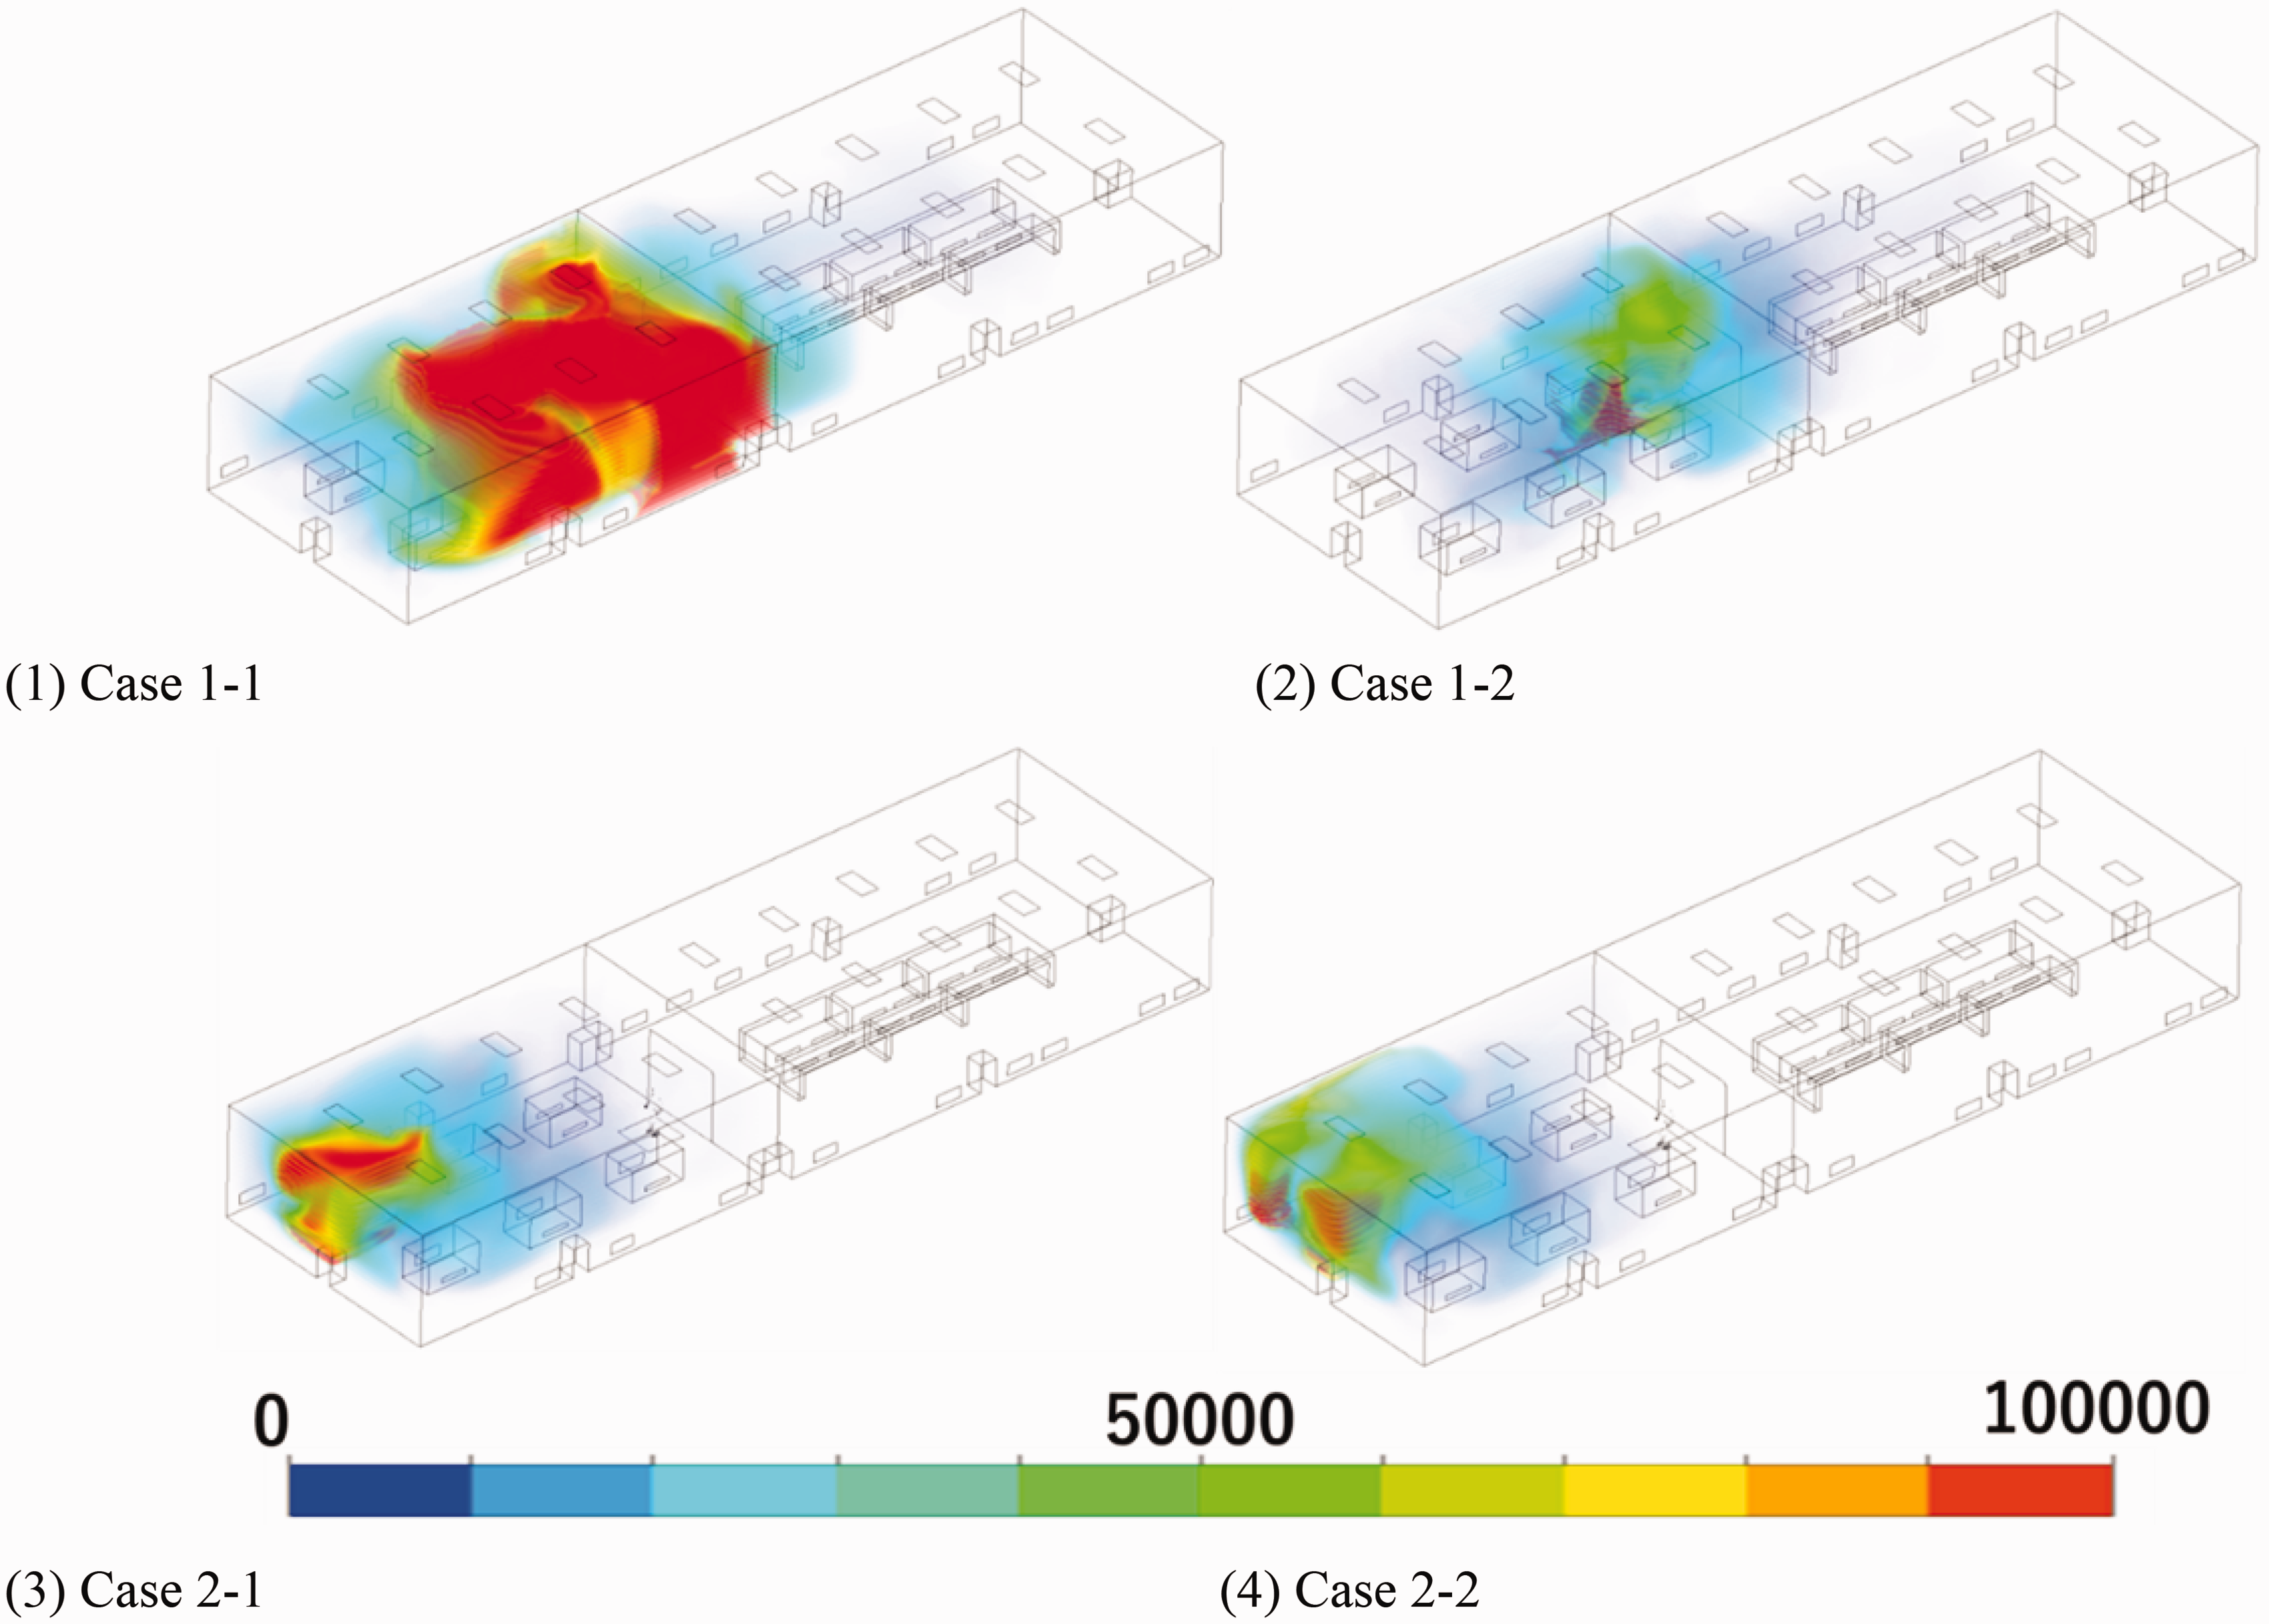
Toluene concentration distributions (µg/m3). (1) Case 1–1, (2) Case 1–2, (3) Case 2–1 and (4) Case 2–2.
Figure 6 shows the concentration distribution of toluene in the cross-section of the CSP installation position. The concentration fields were compared between cases before and after PCO adaptation, and the concentration distribution of toluene around the human body and the effect of reducing the concentration of PCO were clarified. Regarding Case 1, a decrease in the toluene concentration can be confirmed in Case 1–2, ventilated with the EVS, compared to Case 1–1. However, for Case 2, the decrease in the concentration of toluene in Case 2-2 was minimal, and the effect of the EVS was low.
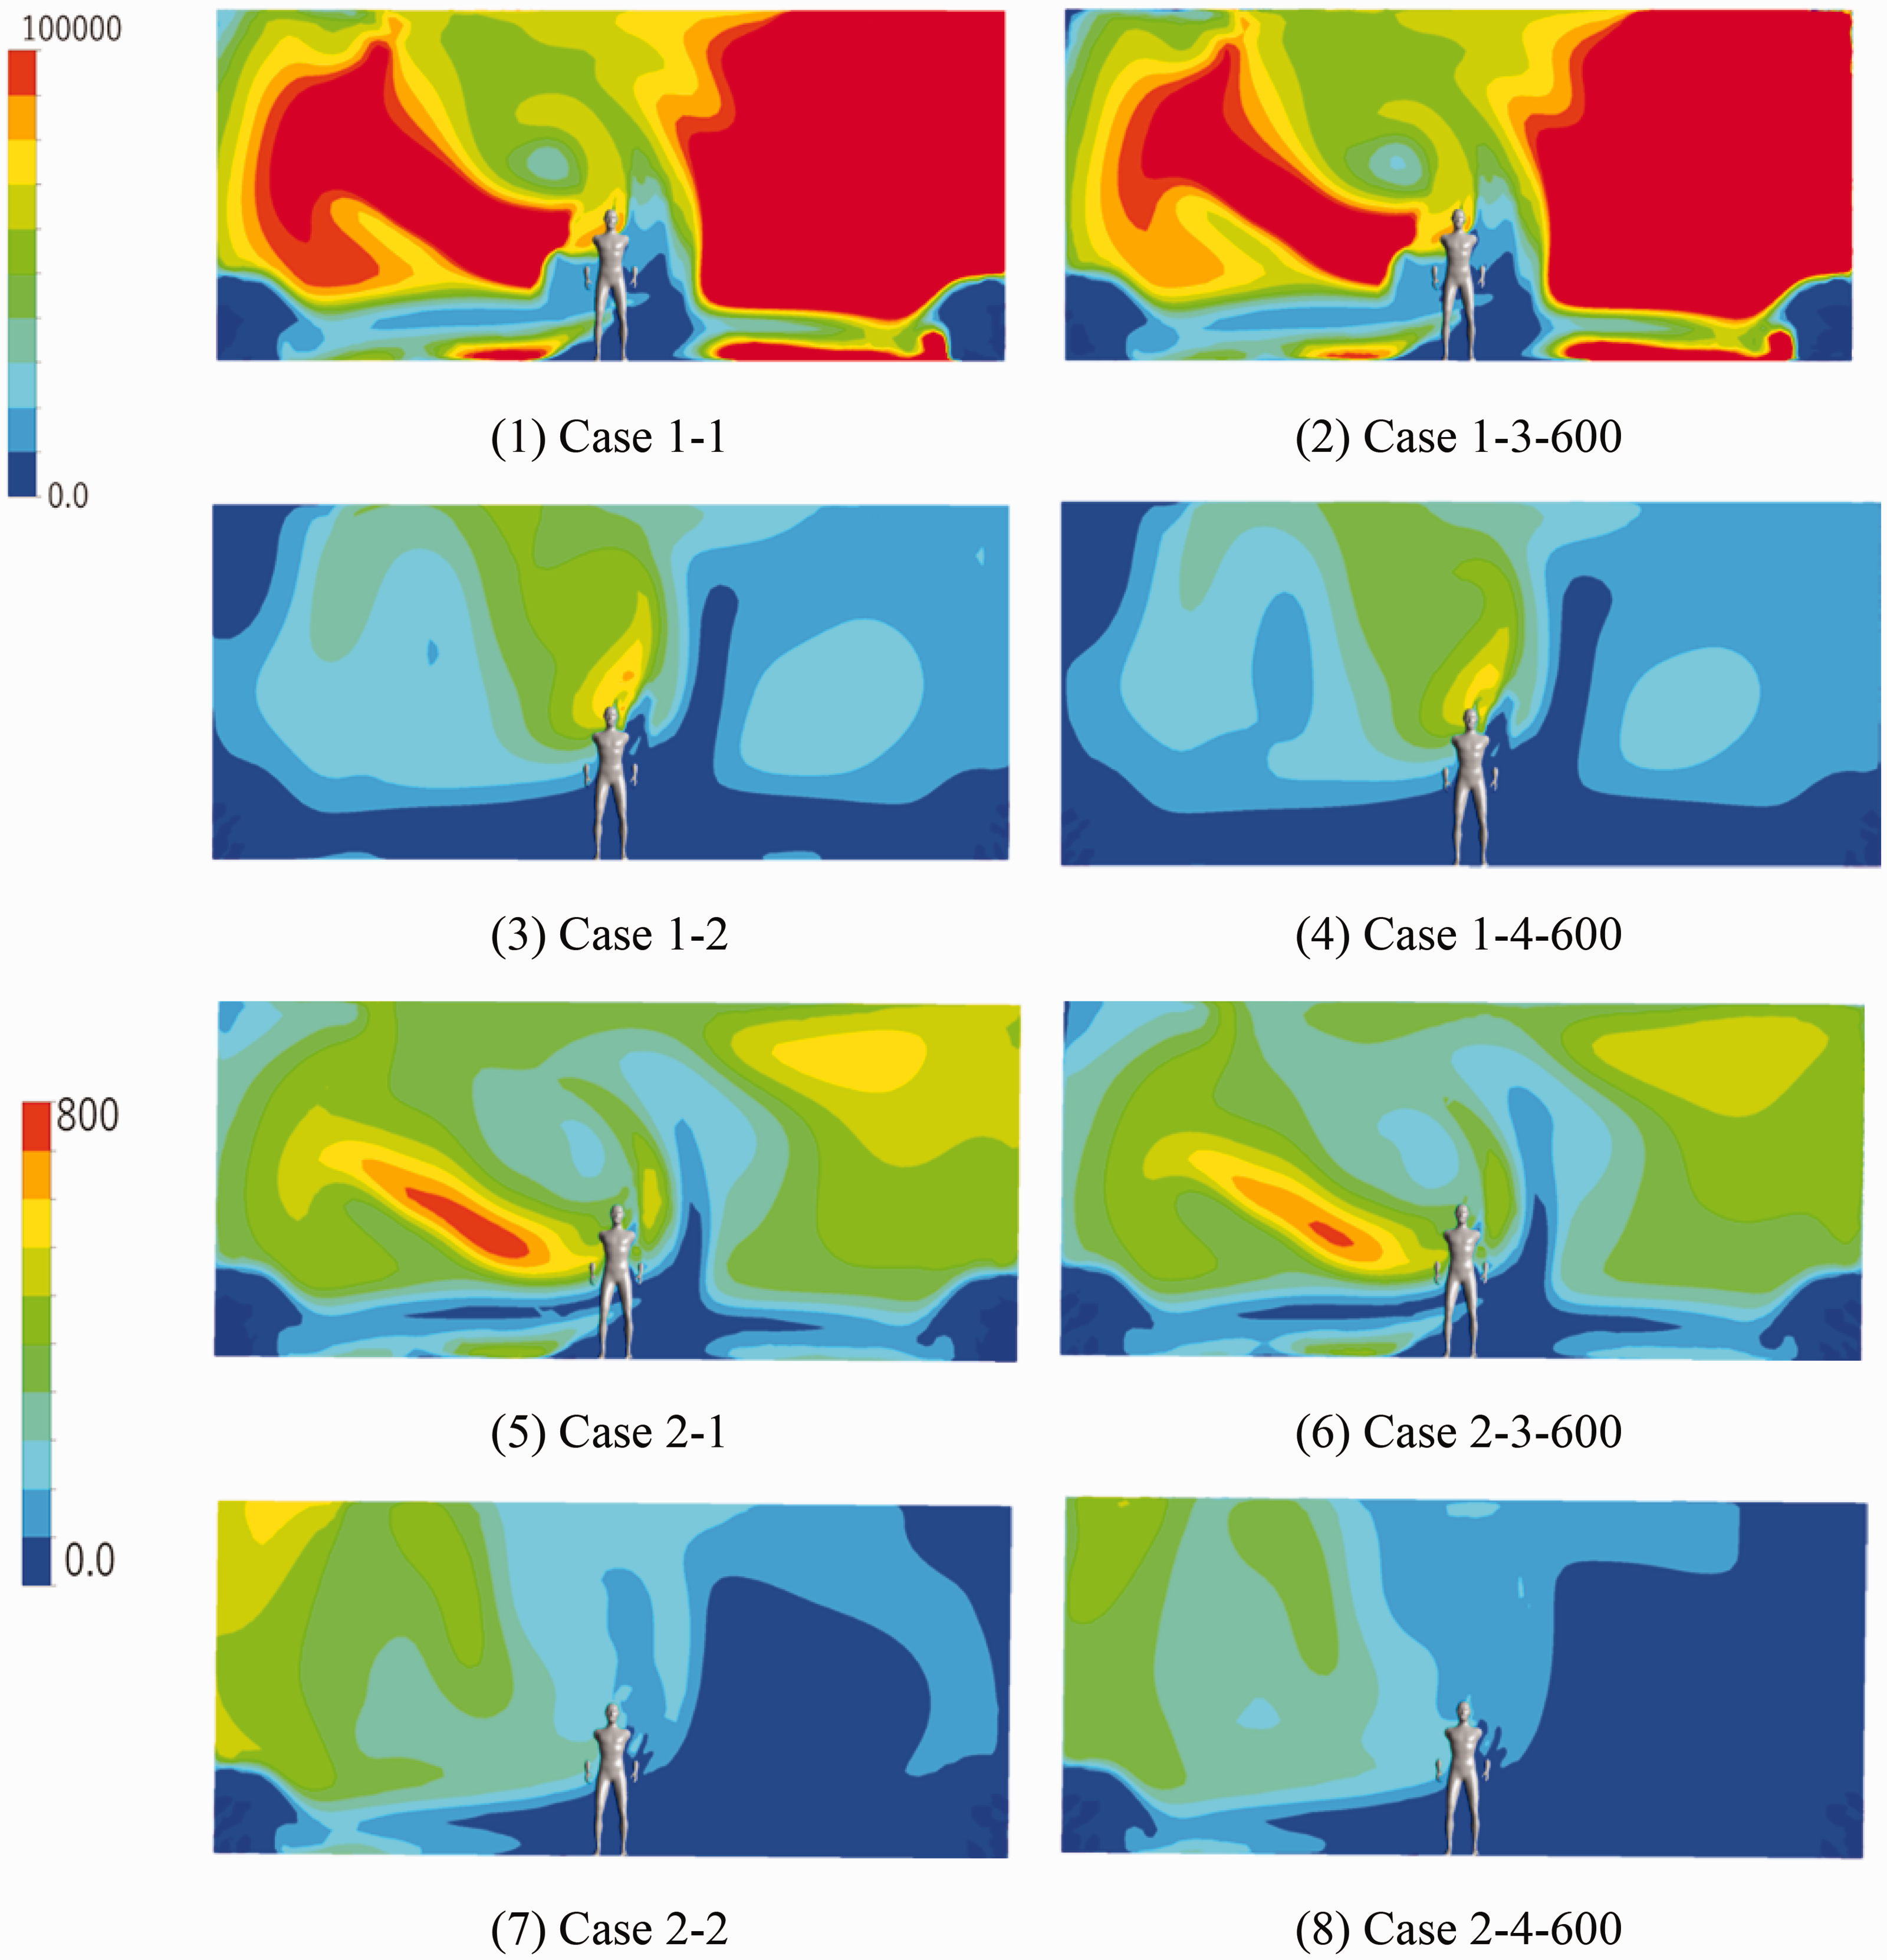
Concentration distribution in the cross section of CSP installation position (µg/m3). (1) Case 1–1, (2) Case 1–3-600, (3) Case 1–2, (4) Case 1–4-600, (5) Case 2–1, (6) Case 2–3-600, (7) Case 2–2 and (8) Case 2–4-600.
In addition, by applying the EVS in Case 1, the shape of the concentration field of toluene was changed, and a high concentration distribution was formed near the nostrils of the CSP. This result shows that there is a risk of inhaling high concentration of toluene depending on the position of the CSP, even if the indoor average concentration is lowered by the EVS.
In the case where the photocatalyst building material was applied, the same flow field was used as in the case before the application of the photocatalyst building material; thus, no change in the shape of the concentration field was observed. However, in all cases where photocatalytic building materials were applied, the toluene concentration in the entire space was slightly reduced.
CSP nostril toluene concentration
Table 2 shows the analysis results of the inhaled toluene concentration via nostril openings of the CSP and the concentration reduction rate in each case compared with the base case (Case 1–1 or Case 2–1).
When the EVS was applied to Case 1 and the leak source was assumed to be in the vicinity of the CSP, the reduction rate of the inhaled toluene concentration was 0.6%, and the effect of the EVS was low (Case 1–2). In contrast, when the EVS was applied to Case 2 and the leak source was distant from the CSP, the reduction rate of the inhaled toluene concentration was 52.5%, demonstrating the effectiveness of the EVS (Case 2–2). This change likely occurred due to the change in flow field following the application of the EVS, allowing for a high toluene concentration distribution around the nostrils of the CSP in Case 1–2.
Regarding the effect of photocatalytic building materials, the inhalation concentration of toluene was decreased by 2.1% in Case 1–3-1000, in which the photocatalyst was applied to Case 1–1. In Case 1–4-1000, in which the photocatalyst was applied to Case 1–2, there was an additional concentration reduction effect of +14.7%, and the reduction rate combined with the EVS was 15.37%.
Regarding the effect of the photocatalyst in Case 2, the toluene concentration was decreased by 10.5% in Case 2–3-1000 ventilated with DV. In Case 2–4-1000 ventilated by the EVS, the toluene concentration was decreased by 61.8% (+ 9.3% to the decrease rate of Case 2–2), confirming the effectiveness of the photocatalytic building material.
Because the concentration field is non-uniform in the room, the inhalation concentration of toluene largely depends on the installation position of the CSP. Therefore, strengthening the ventilation system does not have a notable effect on the concentration reduction.
However, PCO was found to be effective on the entire space without changing the shape of the concentration field while stably reducing the inhalation concentration. Especially in Cases 1–4, where the effect of concentration reduction by the EVS was low, the photocatalytic building material reduced the inhalation concentration more than the ventilation system.
Volume average concentration of indoor toluene
Table 2 also shows the analysis results of the volume average concentration of toluene and the reduction rate compared with the base cases (Cases 1–1 and 2–1). When the EVS was applied to Case 1 and the leak source was at the foot of the CSP, the reduction rate of the volume average concentration was 90.0%, demonstrating the effectiveness of the EVS (Case 1–2).
When the EVS was applied to Case 2 and the leak source was located away from the CSP, the reduction rate of the volume average concentration of toluene was 14.2%. In Case 2, the effect of the EVS was much lower than that in Case 1 (Case 2–2).
Regarding the effect of photocatalytic building materials, the volume average concentration of toluene was decreased by 11.0% in Case 1–3-1000, wherein the photocatalyst was applied to Case 1–1. In Case 1–4-1000, in which the photocatalyst was applied to Case 1–2, there was an additional effect of reducing the concentration of toluene by 1.8%, and the reduction rate combined with the EVS was 91.8%. Regarding the effect of the photocatalyst in Case 2, the toluene concentration was decreased by 9.2% in Case 2–3-1000 that was ventilated with DV. In Case 2–4-1000 that was ventilated with the EVS, the toluene concentration was decreased by 28.4% (Case 2–2 decrease rate + 14.2%), confirming the effectiveness of the photocatalytic building material. In particular, in the results of Case 2–4-1000, the effect of reducing the toluene concentration by PCO exceeded the effect of the EVS (Case 2–2).
Regarding the decrease in volume average concentration by the EVS, the effect of the decrease in Case 1 was significantly greater than that in Case 2. This can be explained by the effectiveness of the ventilation depending on the location of the P–P openings with respect to the location of the leak source. In Case 1, the leak source is directly between the P–P openings and is efficiently discharged. Therefore, the adapted EVS achieved a large concentration reduction effect. In Case 2, the leak source was only affected by the DV diffuser and was not directly on the push jet path; hence, even if the EVS was applied, the effect was small and the concentration reduction was low.
Regarding the illuminance dependence of PCO, when comparing the 600 lx case with the 1000 lx case, the decomposition amount increased in all 1000 lx cases. At 1000 lx, the concentration reduction rate was increased by 1.0% in Case 1–3, 0.4% in Case 1–4, 2.6% in Case 2–3 and 2.4% in Case 2–4, compared with the case of 600 lx.
PCO decomposition flux distribution of toluene on the wall
Figure 7 shows the decomposition flux distribution of the pollutant amount decomposed by PCO with the wall surfaces to which a photocatalyst is applied ((kg/m2).s). The flux distribution of the pollutant decomposition amount of PCO had the same tendency as the indoor 3D concentration distribution shown in Figure 5. In all cases, the amount of decomposition at R2 was low.
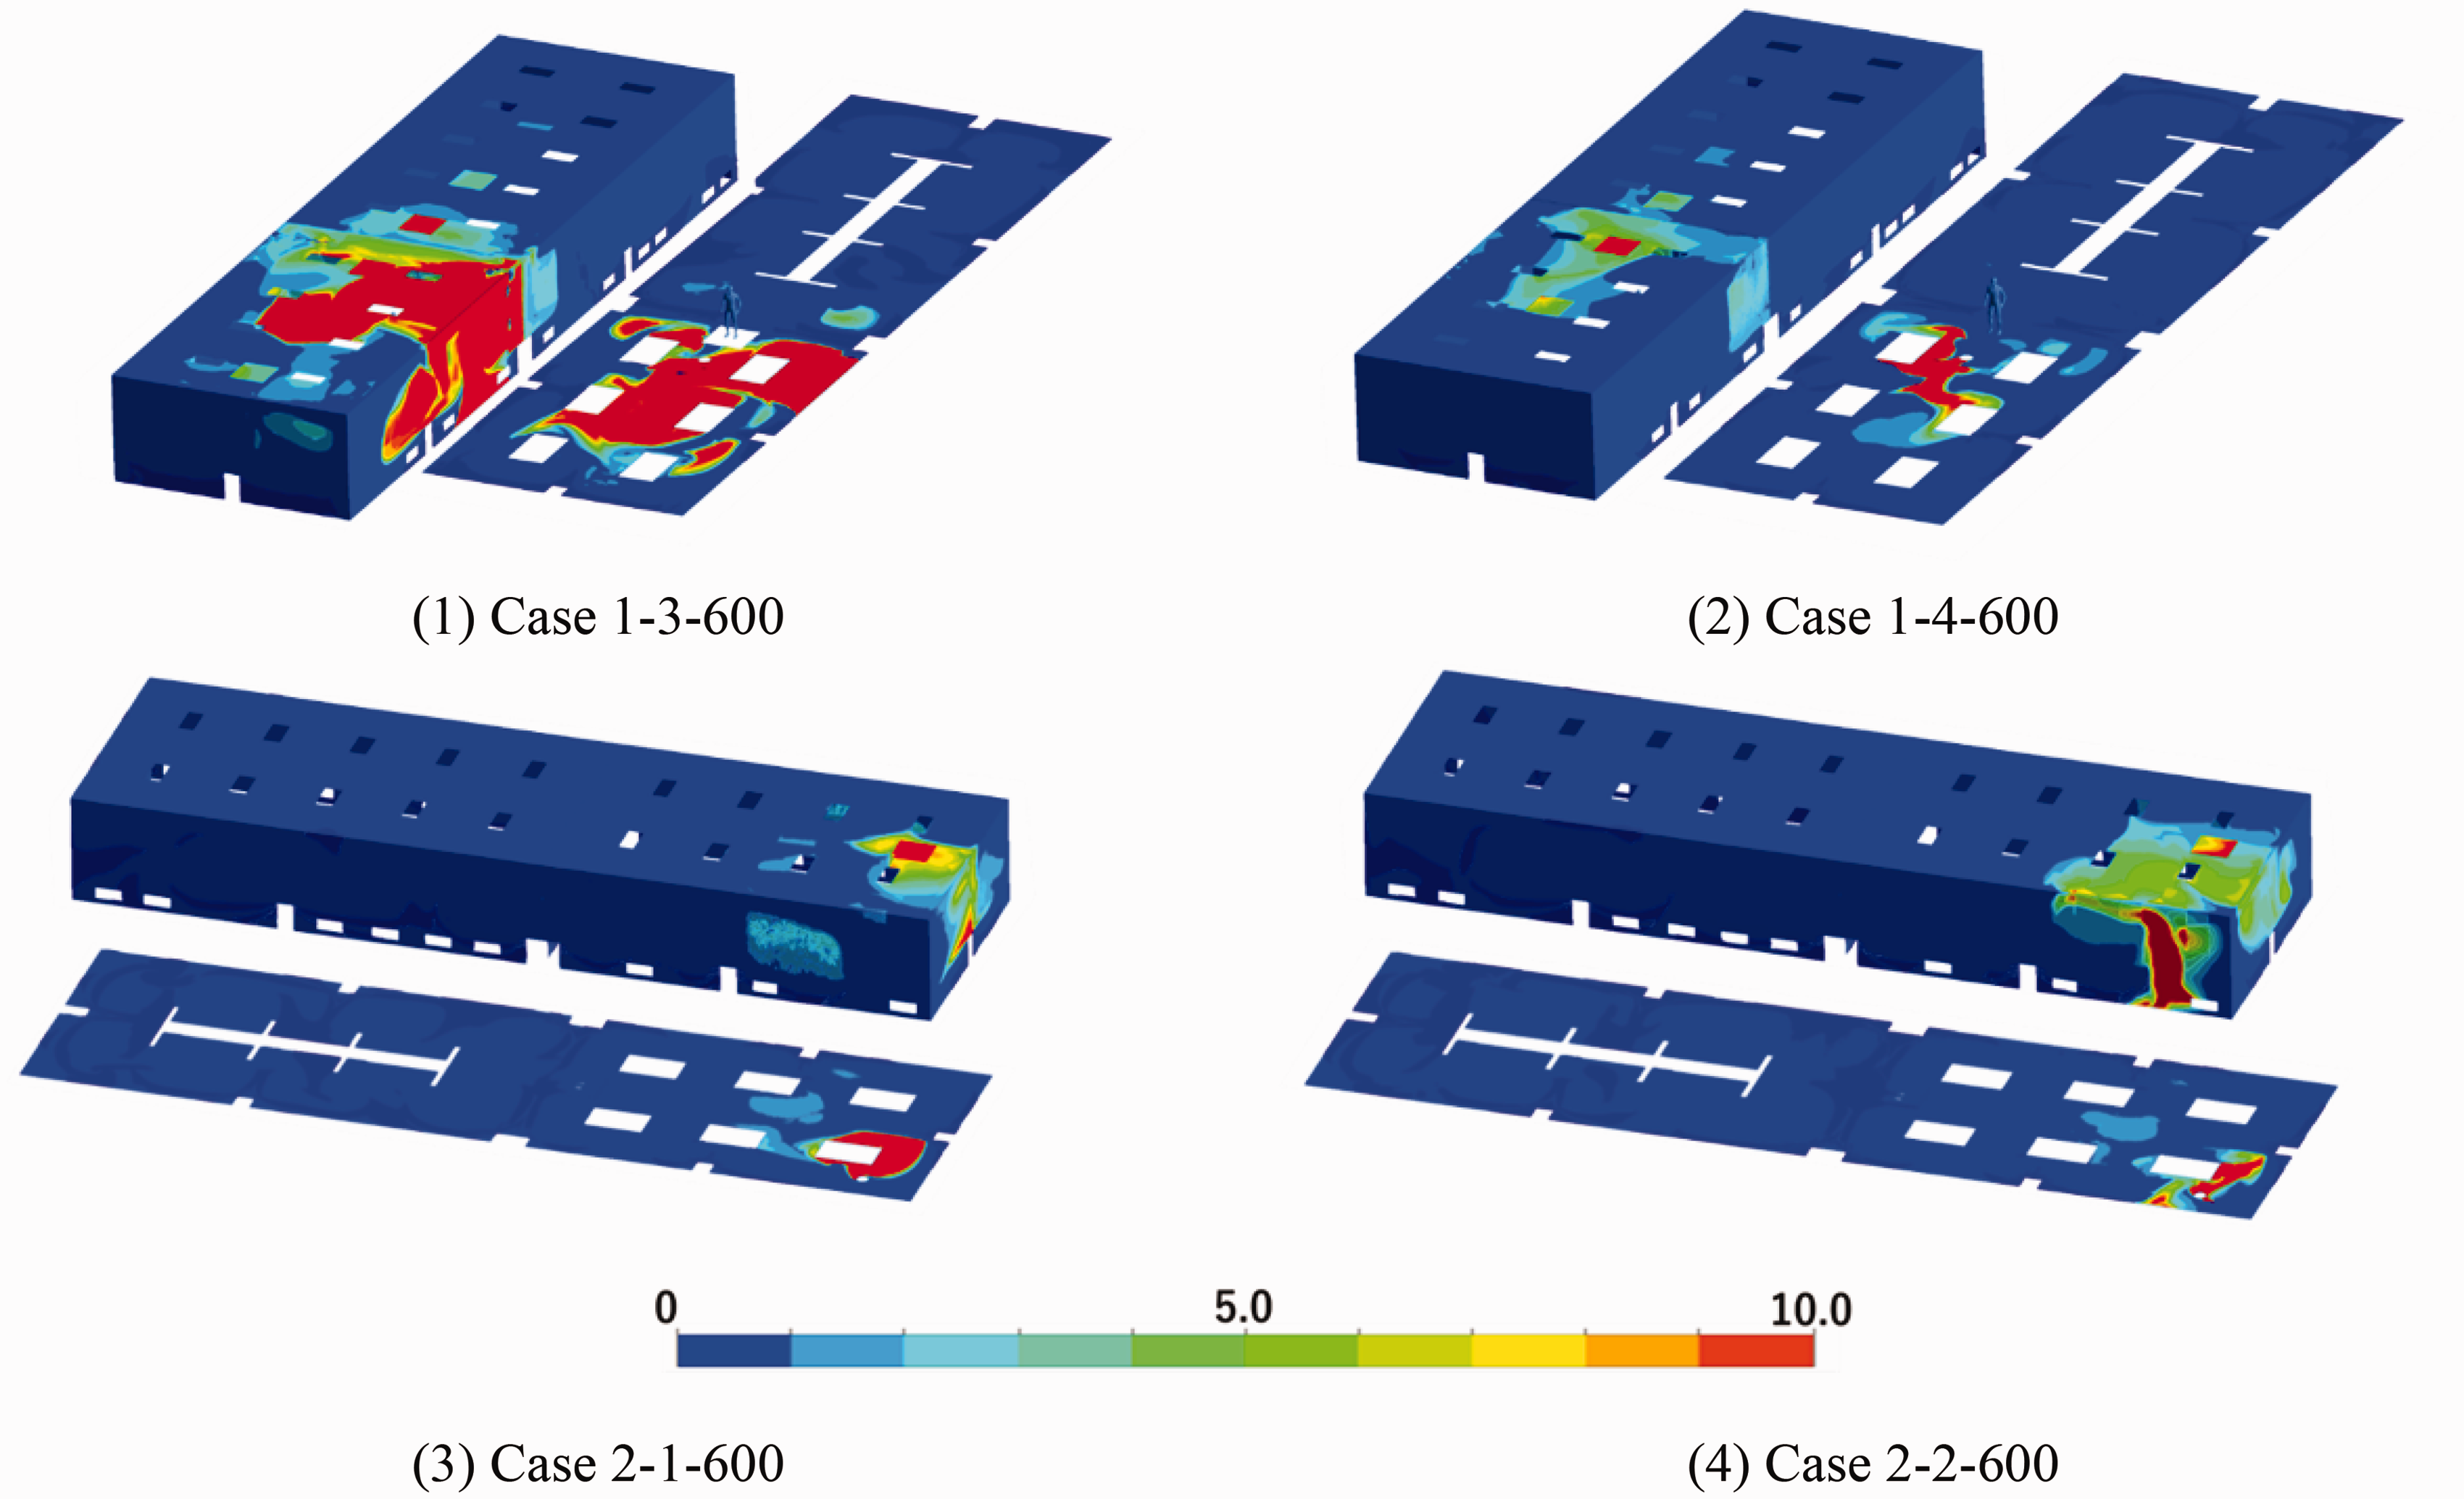
Decomposition flux distribution of pollutant by PCO under 600 lx condition (kg/m2.s). (1) Case 1–3-600, (2) Case 1–4-600, (3) Case 2–1-600 and (4) Case 2–2-600.
In addition, a high flux distribution of toluene is formed around the leak source. In particular, a high flux distribution of toluene was observed in all cases around the leak source and on the ceiling near the leak location.
For Case 1, where the diffusion of pollutants was suppressed by the EVS, the amount of flux on the wall surface was significantly reduced in Case 1–4-600 compared to Case 1–3-600. However, this effect was not significant in Case 2. By applying the EVS, the flux on the wall increased slightly.
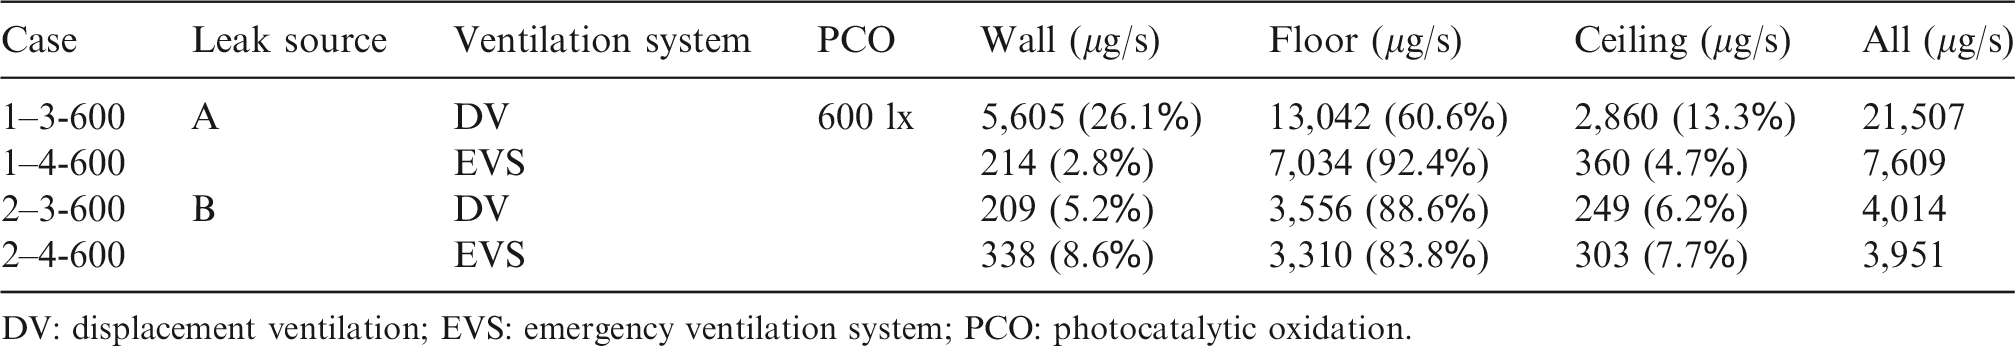
Table 3 shows the decomposition amount of PCO and composition ratio of the decomposition amount for each surface.
Decomposition amount per surface (μg/s) and composition ratio of decomposition amount (%).
DV: displacement ventilation; EVS: emergency ventilation system; PCO: photocatalytic oxidation.
When the volume average toluene concentration in the room was high, a large amount of toluene was decomposed by PCO according to equation (3), and the concentration dependence was confirmed. Here, the indoor average concentration of toluene in Case 1–3 is approximately 10 times that of Case 1–4, but the decomposition amount of toluene in Case 1–3 is 21,507 µg/s, which is approximately three times the decomposition amount of Case 1–4. PCO decomposition was increased logarithmically as the toluene concentration was increased. Therefore, in Case 1–3, decomposition was suppressed. The results also confirmed that the amount of decomposition changed depending on the adaptation to the EVS. The composition ratio of the decomposition amount on the floor surface was 60.6% in Case 1–3. Conversely, in Case 1–4, the composition ratio of the floor surface was 92.4%, and the amount of decomposition of the wall and ceiling was greatly reduced.
In Case 1, the leak source was directly ventilated by the EVS push jet, which suppressed diffusion. As a result, the amount of decomposition on walls and ceiling decreased, and the composition ratio of the floor surface was relatively high. In Case 2, where the concentration distribution did not change significantly by the EVS, there was almost no change in the decomposition amount and composition ratio after applying the EVS.
These results show that the amount of toluene decomposed by the photocatalytic building material not only depends on variables such as the concentration of toluene in the room but also on the diffusion of pollutants by the ventilation system. Greater effects can be obtained if the ventilation system does not suppress pollutant diffusion.
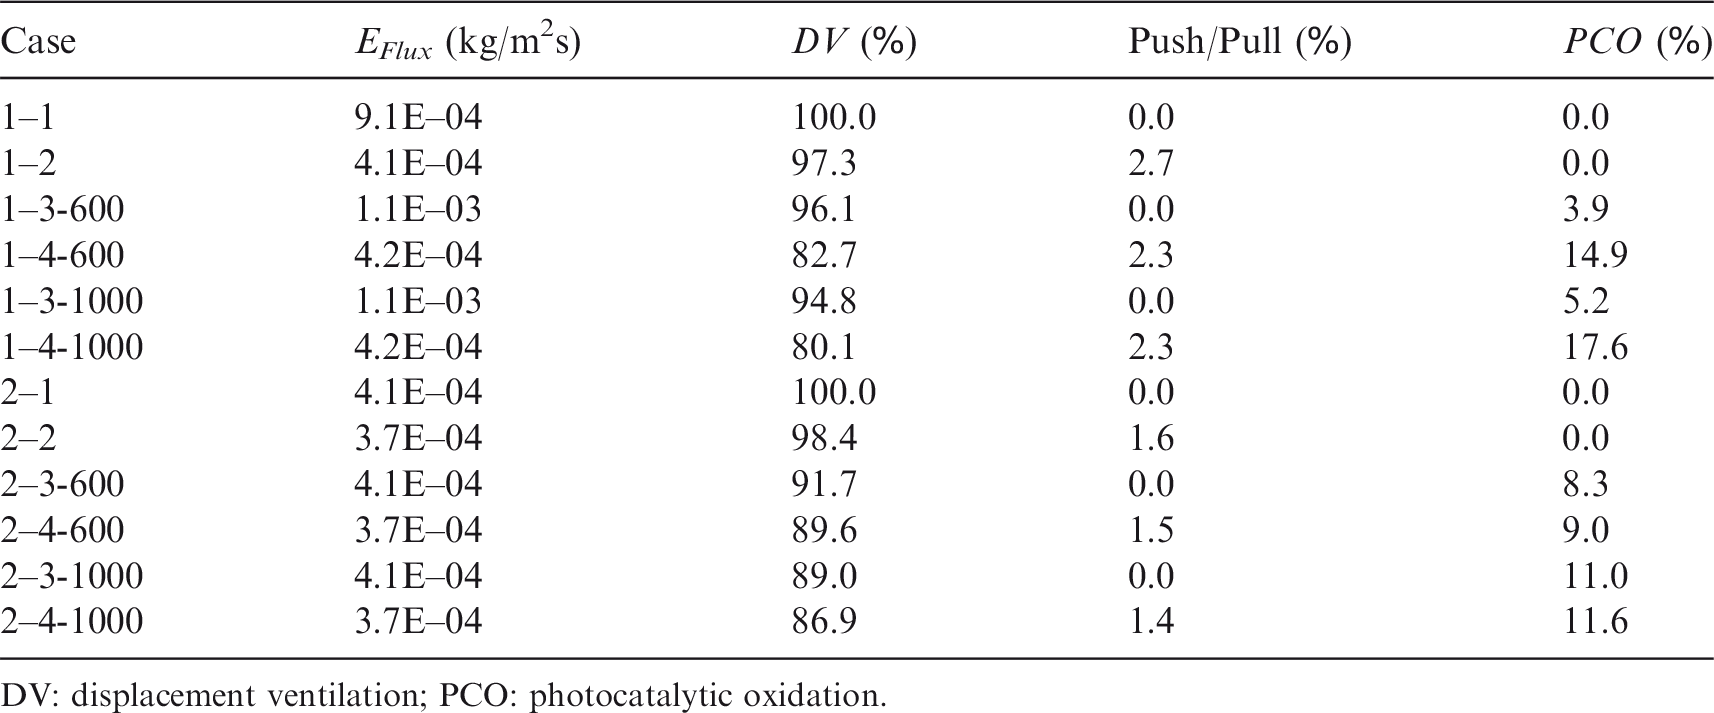
Table 4 shows the composition ratio of the amount of toluene that was reduced by each system and the toluene-generating flux at the leak source (kg/m2.s). The composition ratio was calculated based on the amount of toluene generated in each case, and the effectiveness of each air quality control system in each case is shown.
Composition ratio of the toluene amount that was reduced by each system (%).
DV: displacement ventilation; PCO: photocatalytic oxidation.
In all cases, the DV system emitted high amounts of toluene, with push–pull emissions of up to 2.7%. In addition, the PCO tended to have a higher composition ratio when the amount of toluene-generated flux was small, and a greater effect than that of the push–pull mechanism was obtained for the entire room.
Since the series of analyses conducted in this study are applied only in an emergency situation, we have prioritized the evaluation of contaminant reduction performance of each method, although the representative workshop model used, being of relatively large scale, may bring a higher energy consumption. The relationship between various scales of target domain, contaminant reduction performance and energy consumption can be clarified by conducting a parametric investigation, which becomes a potential crucial part of our future research.
Conclusion
In this study, we investigated the performance of an EVS that combines a DV system and a push–pull type local exhaust with the aim of reducing the inhalation exposure of workers in the workshop. We also proposed further improvement of the EVS in which photocatalytic building materials are applied to the walls of the factory workspace. The performance of the concentration reduction in the EVS was verified by comparing the CFD analysis results.
The findings obtained in this research are summarized below. When the EVS was applied, the ventilation rate was increased by 4% when the push jet was set to 0.1. The contaminant purging effect of the EVS varied greatly depending on the location of the pollutant leak source. If the leak source was on the push–pull hood path and the leak source was directly exposed to the push jet, the average concentration throughout the room was reduced by 90% using the EVS. However, when the leak source was in the corner of the room and was not directly subjected to the jet from the push hood, the effect of concentration reduction was low, and the average indoor concentration was reduced by 14%. Using photocatalytic building materials on walls, floors and ceilings, the effect of concentration reduction was strengthened regardless of the ventilation method and location of the leak source. The pollutant concentration reduction rate due to PCO reaction was confirmed to be relatively small compared to the effect of ventilation using DV and/or the EVS. The amount of pollutant decomposition in PCO was a function of the concentration of the pollutant and was evaluated on the wall surface near the pollution source. Toluene inhalation in the CSP’s nostrils was decreased in all cases where the EVS was applied. However, there was a risk of forming a high-concentration region around the human body and in the breathing zone due to the changes in the flow field caused by the push jet. Owing to the non-uniform concentration field in the factory space, the inhalation concentration largely depends on the location of the CSP and the pollutant leak source. The room-averaged concentration in the factory space was confirmed to be insufficient to evaluate the inhalation exposure concentration; thus, it is necessary to predict the inhaled pollutant concentration using a CSP coupled with a CFD technique.
Footnotes
Authors’ contribution
All authors contributed equally in the preparation of this manuscript.
Declaration of conflicting interests
The author(s) declared no potential conflicts of interest with respect to the research, authorship, and/or publication of this article.
Funding
This study was partially supported by JSPS (Japan Society for the Promotion of Science) Fund for the Promotion of Joint International Research (KAKENHI), Category (A) of Scientific Research (Grant Number JP 18H03807).