
Abstract
This paper presents results of a longitudinal field study which aims to investigate adaptive comfort behaviours (i.e. turning on air-conditioner, turning on fans and opening windows or doors) in residential buildings. Field measurements were conducted in 43 homes in Tianjin, northern China, from Spring through early Winter in 2016. Occupants' ‘right-here-right-now' thermal perception and adaptive comfort behaviours were collected through online questionnaires delivered to their smartphones. Results indicated that clothing insulation adjustment was the requisite adaptive behaviour to attain thermal comfort. Clothing insulation was more climate-responsive in Tianjin's autumn than in summer. Statistical models were developed to predict the likelihood of various thermally adaptive behaviours with regard to outdoor air temperatures. An outdoor air temperature of 25.2°C was associated with maximum use of windows/doors for comfort ventilation and minimum use of air conditioning (AC). When outdoor air temperature exceeded 32.5°C, 50% of occupants turned on AC for cooling.
Introduction
Occupants’ behaviour in buildings, for example adjusting thermostat for comfort, switching lights and opening/closing windows, have significant impact on energy use in buildings. 1 A study conducted in Japan found that over 80% of total air change rate was caused by occupants’ behaviour such as opening windows/doors and turning on air conditioning (AC). 2 An investigation conducted in Beijing revealed that air-conditioning energy use between households differs greatly even though the outdoor climates and building envelopes are the same. 3 This difference was caused by the different operating modes of the air conditioner.
While occupants’ behaviour is deemed as an important factor for building energy consumption, little is known about the precise thermal triggers for strategic thermal behaviour, especially in residential contexts. In the privacy of their own home, occupants have a wider palette of adaptive opportunities to attain and maintain thermal comfort.4,5 For example they can adjust the thermal insulation of their clothing across a wider range compared to other building typologies such as commercial offices. Meanwhile, occupants’ activities in the various rooms of their home tend to be much more diverse in terms of metabolic rate. 6 Moreover the patterns of usage of different thermally adaptive behaviours with varying energy intensities, ‘thermal lifestyles’, show large inter-individual, household socio-economic and cross-cultural differences.
Building simulation software is commonly used in building energy studies and ratings exercises. In these simulation software, occupancy and behavioural schedules are prescribed with little empirical evidence supporting their settings, despite the significant impact on energy results. Many researchers argue that standardized occupant’s behaviours adopted in contemporary simulation software is too simplistic to represent occupants’ behaviours in real-world settings.7,8 Numerous reports of an ‘energy performance gap’ between the predicted (simulated) and the actual (post-occupancy) energy consumption of buildings have appeared in the research literature in recent years,9,10 and the crude, overly simplistic presumptions about occupants’ behaviour in energy simulation have been singled out as a major culprit. Therefore, a good understanding of occupants’ behaviour is necessary to model and qualify its effect on the use of building technologies.
To get more accurate forecasts of energy consumption from building simulation software, Nicol et al. 11 suggested a probabilistic method to predict the likelihood of adaptive behaviours as a function of temperature variations. Many other studies have also investigated occupants’ behaviours in relation to temperature variations using the stochastic approach.12–14 Occupant behaviours and perceptions of thermal comfort are indeed complex matters, being largely influenced by contextual factors. Occupants’ behaviour models derived from office settings are very likely to be generic and generalizable across to residential contexts, due to all the contextual factors mentioned above. Only a small fraction of research activities into modelling of occupants’ behaviour have been directed at residential settings.8,15–18 In a Danish study 8 with naturally ventilated homes, the window opening behaviour was strongly related to the outdoor air temperature (p <0.0001). However, the utilization of windows in summer was lower in mixed-mode buildings. 15 The mixed-mode building is a naturally ventilated building with supplemental cooling capability to temper indoor environmental conditions when external weather overwhelms the passive capabilities of the building to provide for the occupants’ adaptive comfort. This indicated that conflicting adaptive actions need to be explicitly considered in different building operation modes. A Japanese study in naturally ventilated homes (also called free-running buildings) found that the frequency of opening windows cumulatively increased with air temperature rise, 16 while the behavioural pattern of window operation followed a ‘bell curve’ shape in Sydney mixed-mode residential buildings. 17 Evidence indicates that adaptive behaviour patterns obtained in free-running residential buildings cannot be applied directly to mixed-mode buildings.
In northeastern China, such as Tianjin, monsoon winds dominate the climate, which leads to considerable temperature differences between winter and summer. In cold and dry winter, people rely on district heating system to keep thermal comfort, while in hot and moist summer the demand is attributable to air conditioners. Air-conditioners have become one of the faster growing end-uses of electricity in Chinese homes. In Tianjin, per 100 urban households possessed 146.6 units of air-conditioners in 2018. 19 Chinese residential buildings are characterized as mixed-mode buildings.
To investigate adaptive comfort behaviours in Chinese homes, a longitudinal field study was conducted in 43 homes in Tianjin, China. To enable cross-cultural comparison, we have adopted the research methods used in a recent study by Kim et al. 17 in Sydney, Australia.
Methods
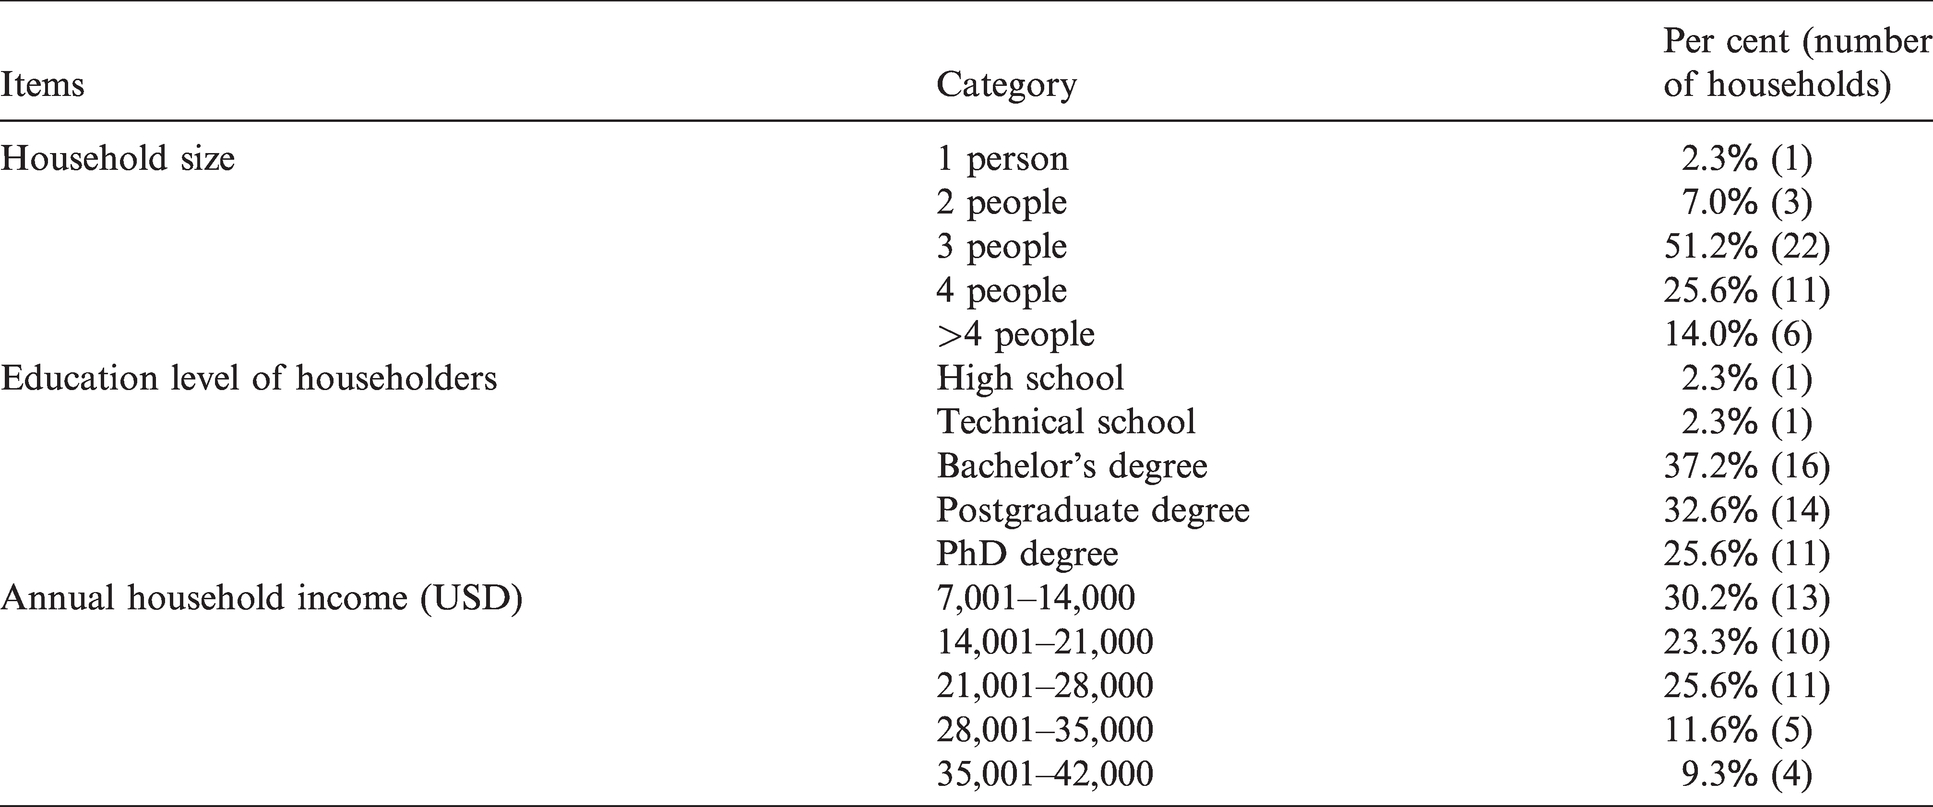
Forty-three households where at least one split AC system had been installed in multi-storey apartment buildings in the Tianjin urban area (a coastal city 120 km southeast of Beijing) were recruited to this study. Multi-storey apartments are typical dwellings in Tianjin urban, which are resided by 98% of Tianjin population. 20 These 43 apartments were built with insulation on outer walls, while no external window shield. Among these householders, 30% of respondents were male and 70% female. Majority of respondents (81%) aged 30–39 years old. Other demographic information such as the household size, the level of education and the gross income are summarized in Table 1.
Summary of the households’ information.
Air temperature and humidity measurements were made in the sample apartments for 6 months from 14 May to 20 November in 2016. During the first site-visit, a small iButton (17 mm diam. × 6 mm thick) temperature logger was installed at the supply air vent of each air conditioner. A second iButton was placed in the middle of the room (typically under furniture in bedroom and living room) to record the indoor air temperature of the occupied zone. The measurement interval was set at 15 min for the duration of this longitudinal study. The iButton has a measurement range of –20°C to +85°C and the accuracy is ±0.5°C. Due to limitations in data storage capacity of the iButtons, researchers visited each of the 43 households to download data every 3 months to avoid new data overwriting old.
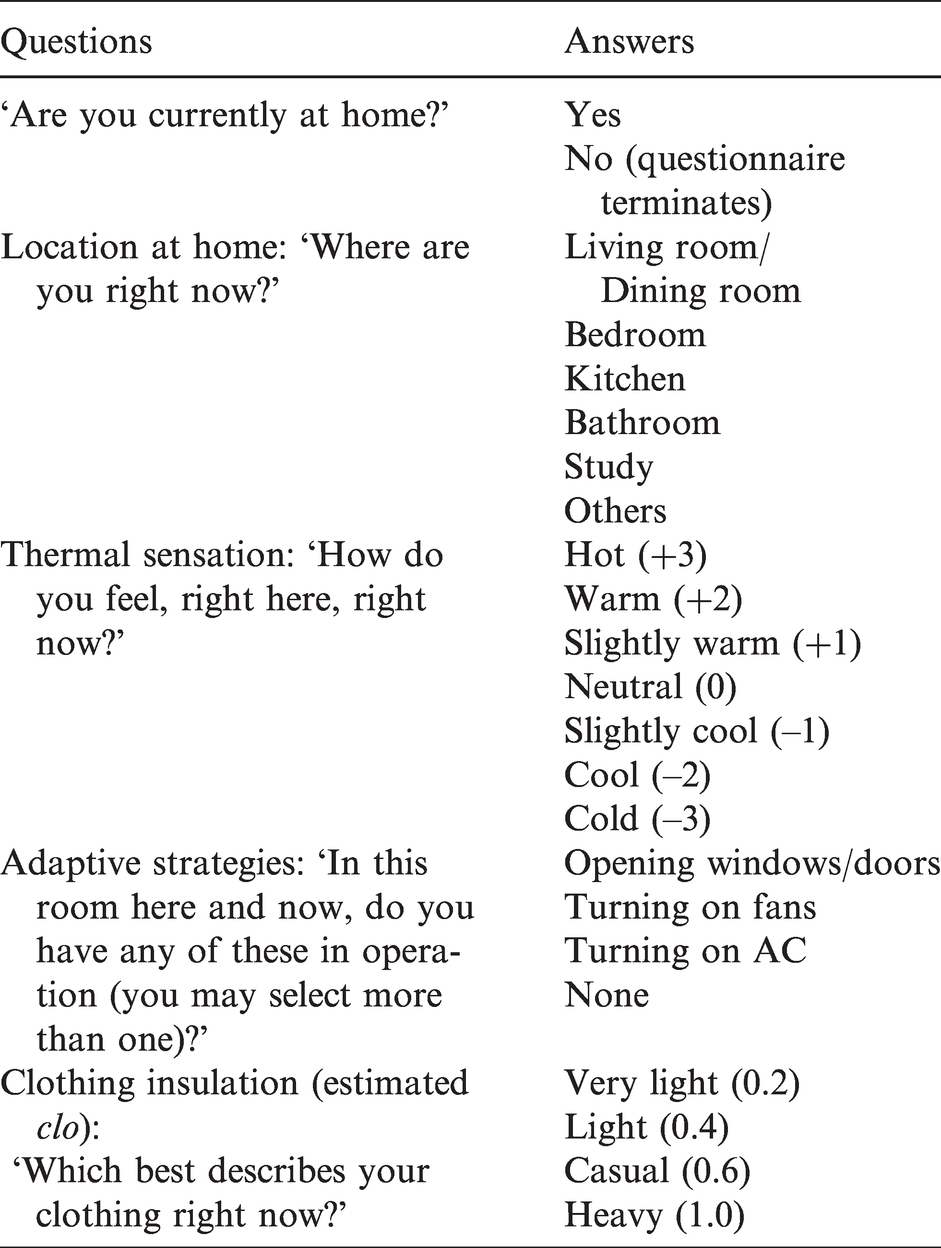
During the monitoring period, online comfort and behavioural questionnaires were quasi-randomly sent out to householders’ smartphones with a frequency of 2–3 times per week. The ‘right here right now’ wording of the items on the questionnaire is summarized in Table 2. Questionnaires were completed only if householders declared in the first question that they were in their home at the time. If the householders were not at home at the time the questionnaire appeared on their smartphone, they were invited to complete it when they arrived home. Apart from the online questionnaires, a background questionnaire was completed by householders on the first home visit with the objective of collecting demographic and basic household descriptive information.
Summary of the smartphone questionnaire.
A total of 1697 online comfort questionnaires were returned. Responses were manually matched with the coincident indoor air temperatures (recorded by iButtons) and outdoor air temperatures, the latter acquired from the China Meteorological Administration’s nearest weather stations. Occupants in homes were assumed to be sedentary and therefore the effects of humidity on the comfort zone are negligible.
This study was approved by the Human Research Ethics Committee at Sydney University.
Results and discussion
Brager and de Dear 21 classified thermal behavioural adjustments into three categories: (1) personal adjustment, (2) technological or environmental adjustment and (3) cultural adjustment. This paper focused on the first two of these.
Meteorological analysis
Figure 1 shows the outdoor daily average air temperature during the study period acquired from the weather station in Tianjin. Average daily outdoor air temperature was 21.8°C, while the highest and lowest outdoor air temperatures were 32.0°C and 0.6°C, respectively. Outdoor air temperature remained at a high and stable level in summer (mean 27.8°C, standard deviation 1.8°C, from June to early September). On the other hand, the outdoor air temperature tended to fluctuate more in autumn (mean 18.5°C, stand deviation 6.1°C, from early September to October) than in summer.
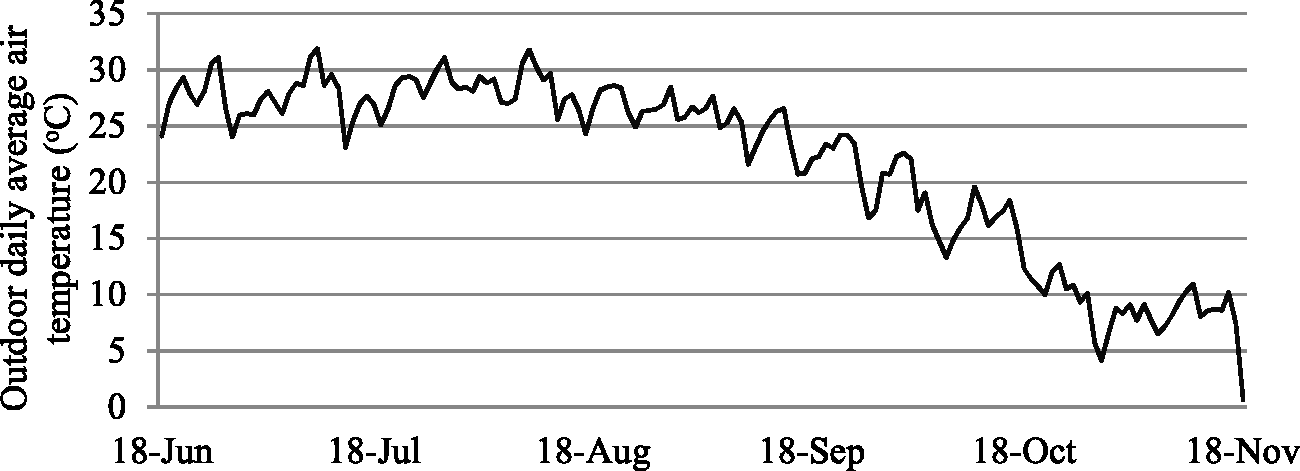
Outdoor daily average air temperature from June to November 2016 in Tianjin.
Clothing behaviours
Figure 2 shows Tianjin residents’ mean clothing insulation estimates (clo units) in relation to the indoor air temperature recorded at the time of the smartphone questionnaire being completed. Indoor air temperatures were binned at 1°C intervals. Occupants’ indoor clothing insulation changed from a maximum of about 1.0 clo (equivalent to suits dressed in offices in winter) to a minimum of about 0.3 clo (lighter than dresses in a commercial public building e.g. office) when indoor air temperature ranged from 15°C to 33°C.
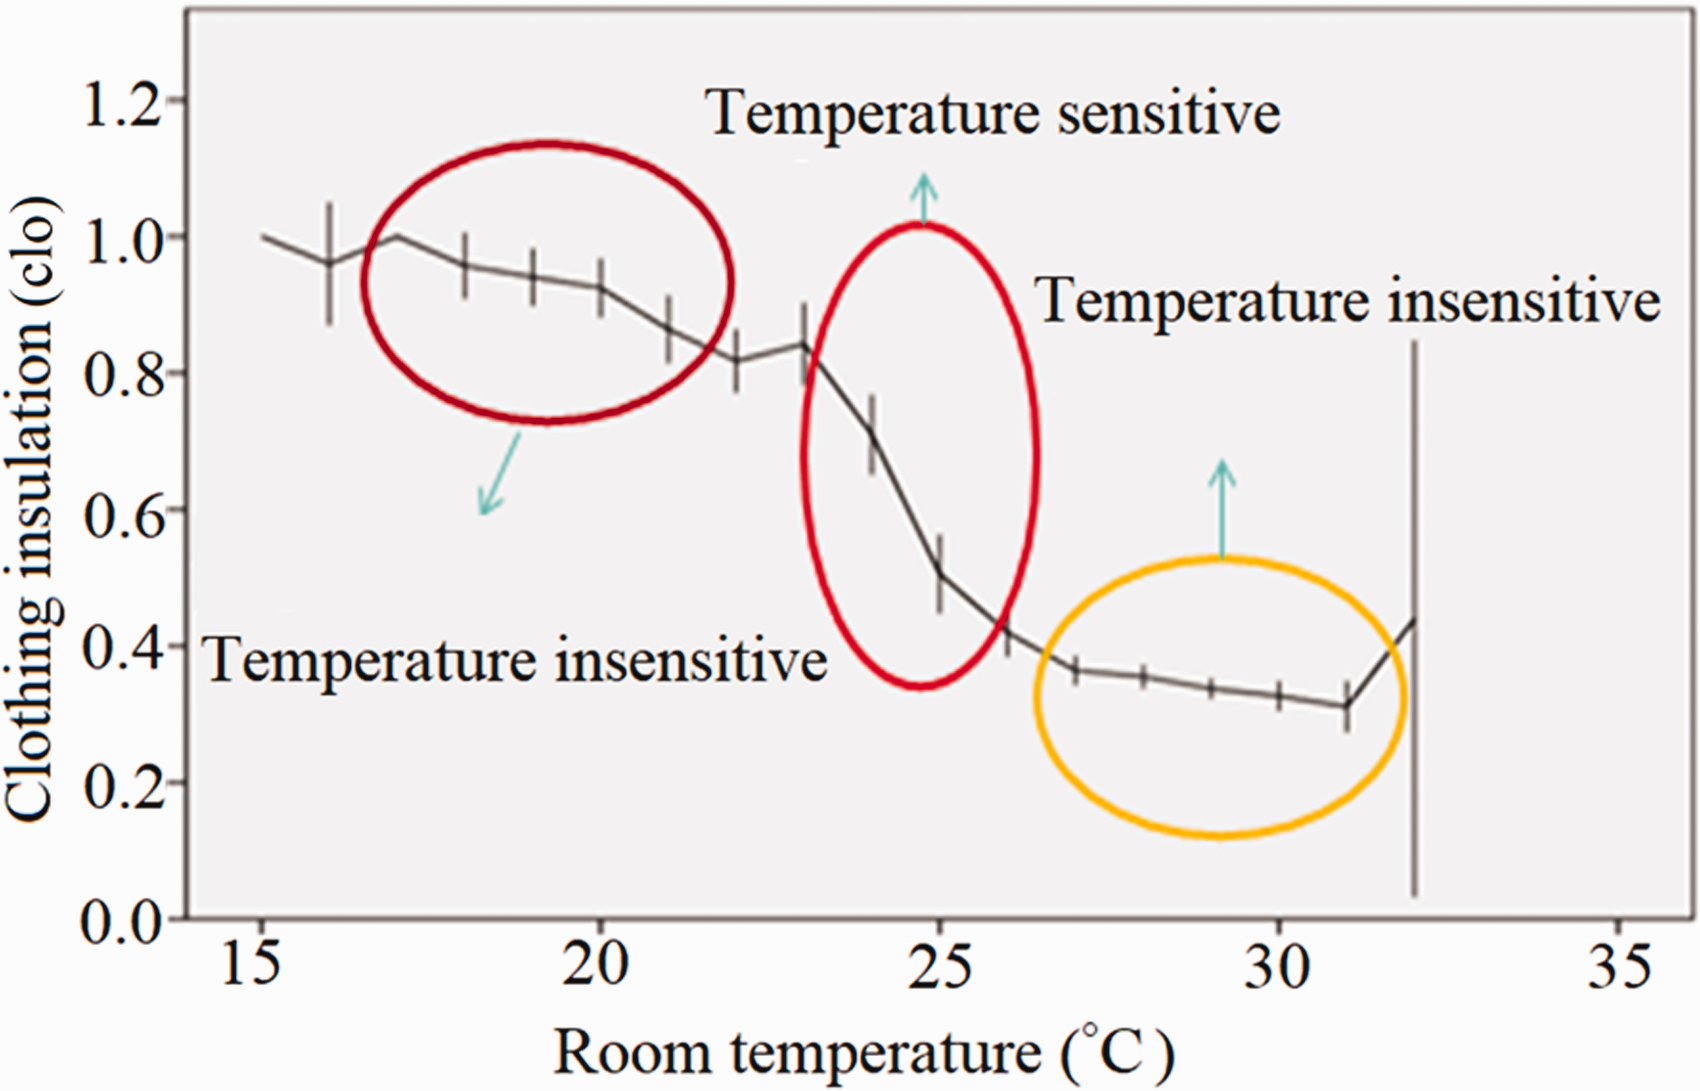
Clothing insulation and coincident room air temperature (error bars represent 95% confidence intervals).
When room temperature fell between 22°C and 26°C, the level of clothing insulation respondents chose to wear showed heightened temperature sensitivity. The mean clothing insulation estimate decreased by about 0.1 clo for every 1°C increment. In contrast, householders’ clothing insulation showed relatively minor sensitivity to room temperatures lower than 22°C or higher than 26°C, suggesting a reliance on clothing thermal adaptation when at temperatures within the comfort zone, and by implication, resorting to adaptive opportunities other than clothing when conditions fell outside the comfort zone.
Mean clothing insulation within each of the seven thermal sensation vote bins are shown in Figure 3. As thermal sensation vote changed from cold (–3) to hot (+3), occupants’ mean clothing insulation decreased from about 0.9 clo to 0.3 clo.
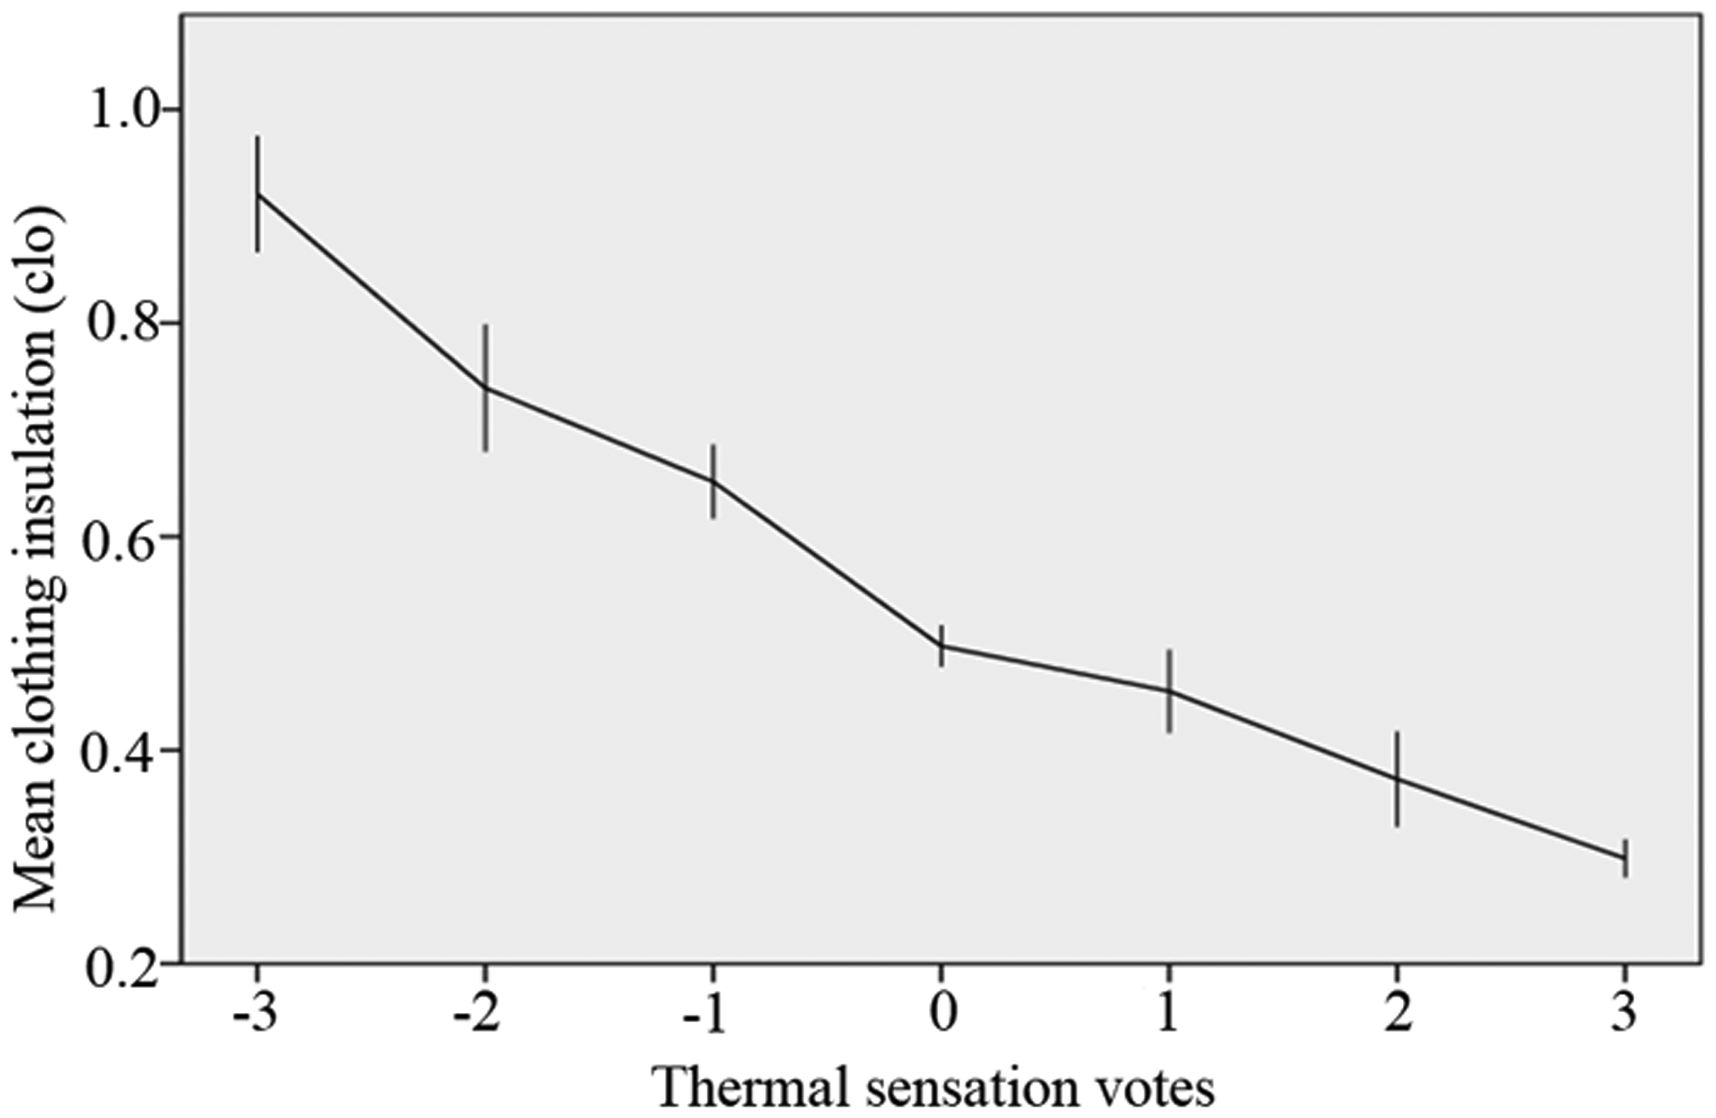
Clothing insulation in relation to thermal sensation votes (error bars represent 95% confidence intervals).
Occupants’ clothing behaviours (worn insulation) in relation to thermal sensation votes was analysed separately for the seasons covered in this longitudinal survey. As can be seen in Figure 4, the mean clothing insulation was relatively stable (about 0.3 clo) in summer. In contrast, occupants changed their clothing more frequently (from 0.9 clo to 0.4 clo) in autumn. Occupants’ clothing insulation during climatically stable summer months was approaching or already at the socially acceptable minimum, while the more synoptically dynamic autumn months in Tianjin prompted more frequent adjustments in the indoor thermal insulation. This interpretation emphasizes the external climate driver for the indoor clothing behaviour. 22
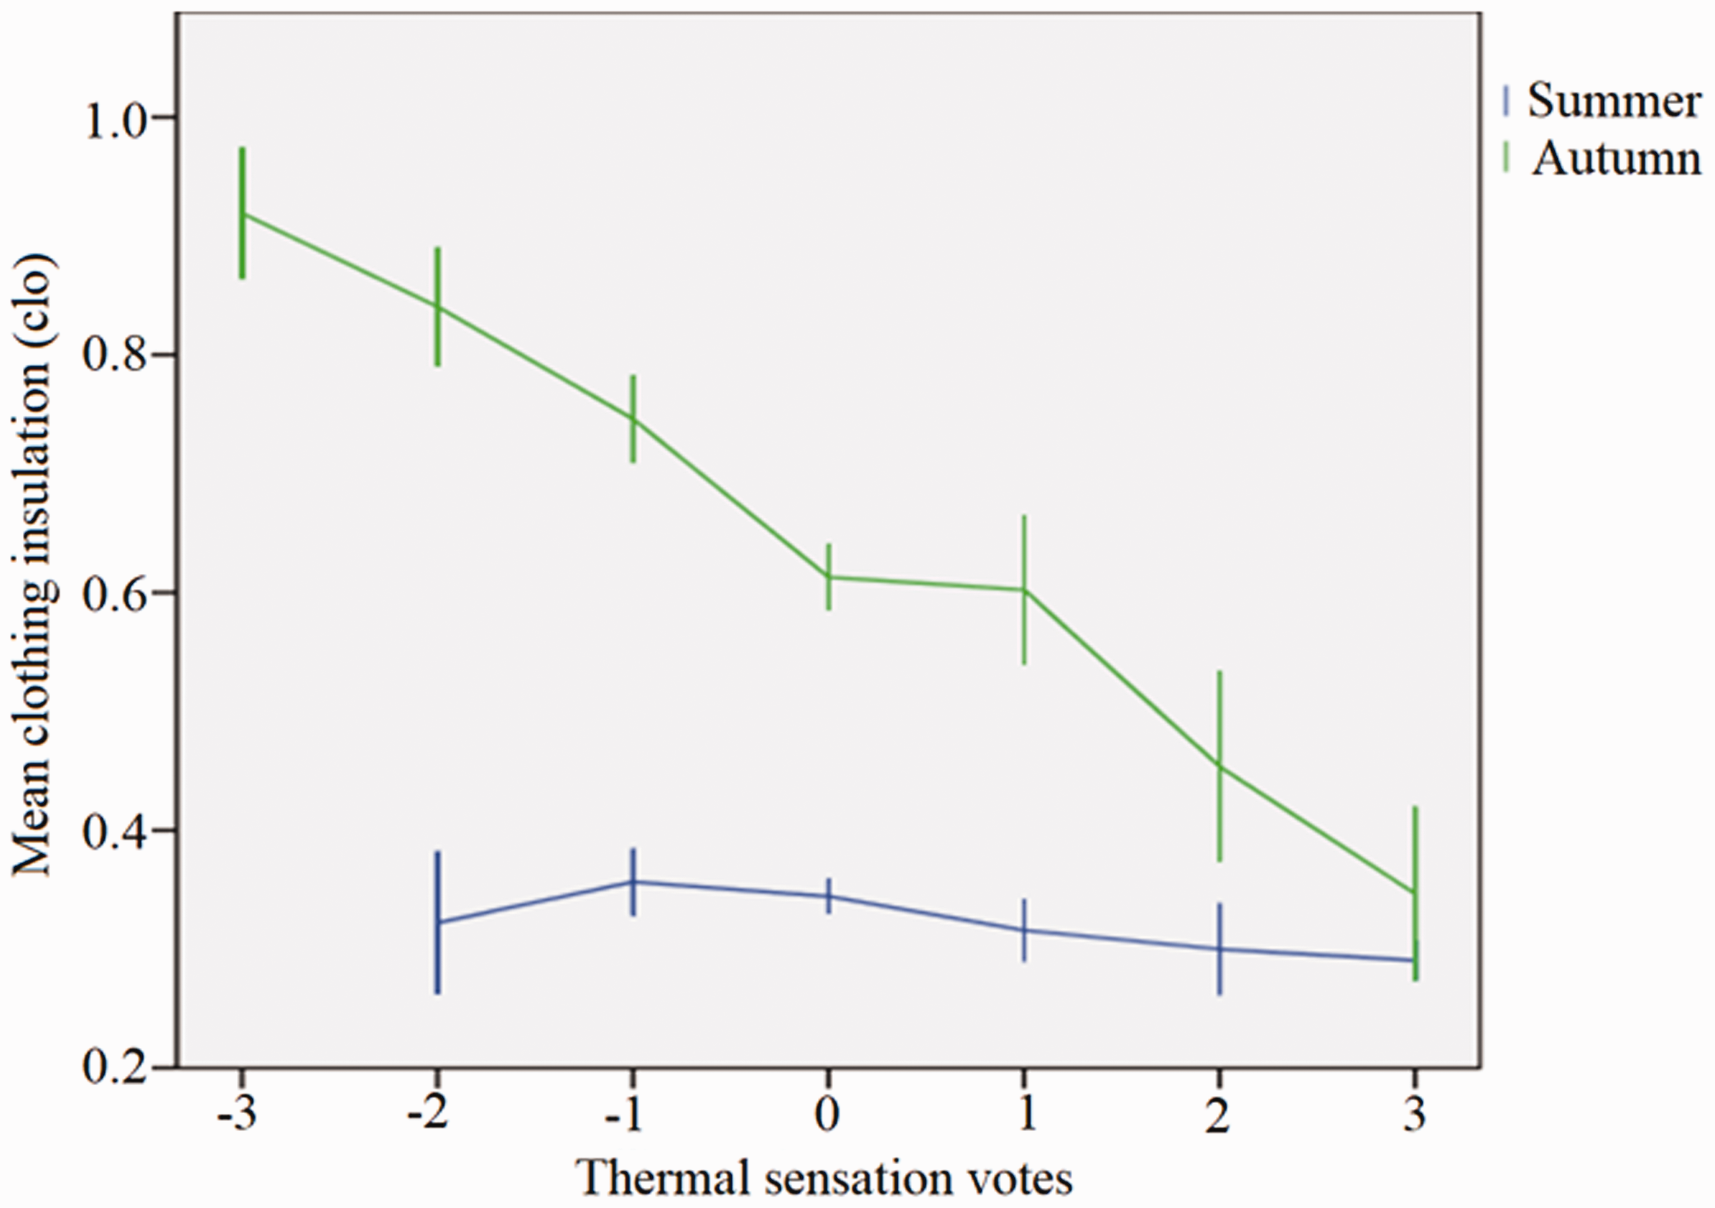
Clothing insulation in relation to thermal sensation votes in summer and autumn (error bars represent 95% confidence intervals).
Environmental intervention adjustments
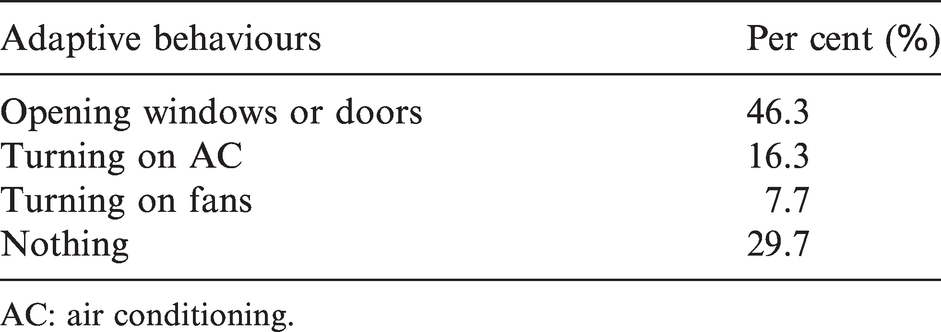
All the investigated households had no mechanical ventilation system. Occupants relied on opening windows or doors for ventilation. Occupants relied on pedestal fans as a type of control over their thermal environment. Our online ‘right here right now’ comfort questionnaire addressed adaptive behaviours such as turning AC cooling on, fans on and opening windows or doors. The percentages of these adaptive comfort behaviours being registered on the online questionnaire are shown in Table 3. Opening windows or doors was the most frequent adaptive strategy (46.3%) that Tianjin householders adopted.
Percentage of adaptive behaviours in use (N = 1697).
AC: air conditioning.
To further investigate the functional relationship between each adaptive behaviour (opening windows or doors, turning on AC, and turning on fans) and the concurrent environmental variables, the method of probit analysis was used. Probit analysis assumes that the likelihood of an event (dependent variable) happening increases as the intensity of the stimulus (independent variable) increases. In our study, the stimulus hypothesized as the driver for adaptive behaviours was concurrent outdoor air temperature. There is still no general agreement as to which is more appropriate for predicting the adaptive behaviours when choosing outdoor or indoor air temperature. 17 Considering the fact that indoor air temperature is also influenced by the outdoor air temperature, we chose outdoor air temperature as the independent variable.
Previous studies also suggested that occupants’ adaptive behaviours were governed by a stochastic rather than deterministic cause-and-effect relationship. In other words, there is not a precise temperature where everyone opens windows, but as the temperature increases, the probability that occupants open windows or doors also increases.
23
Therefore, the probability of an adaptive comfort behaviour being deployed in an occupied residence can be defined as a function of outdoor air temperature. In our study logistic regression models were performed with ‘AC cooling on’ and ‘fans on’ as the dependent variables, and the outdoor air temperature as the independent variable. The probability of an adaptive comfort behaviour can be defined as a function of outdoor temperature (shown as equation (1)). The pattern of opening windows and/or doors follows a ‘bell curve’ shape. We used a logistic function based on a second-order polynomial regression to create a fit curve on opening window and/or doors responses (shown as equation (2))
17
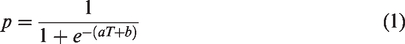
The proportion of adaptive behaviours was calculated on the basis of online questionnaire responses, with an interval of 1°C for outdoor air temperature. Parameters of a, b and c were obtained through regression process. Results of the above logistic regression model analyses for AC and fan behaviours are summarized in Table 4 (results for opening windows or doors will be presented in subsequent sections). All models returned statistically significant regression coefficients (a, b) and constants (c) (p < 0.001). Each of the regression models given in Figures 5 to 8 are discussed separately in the following sections.
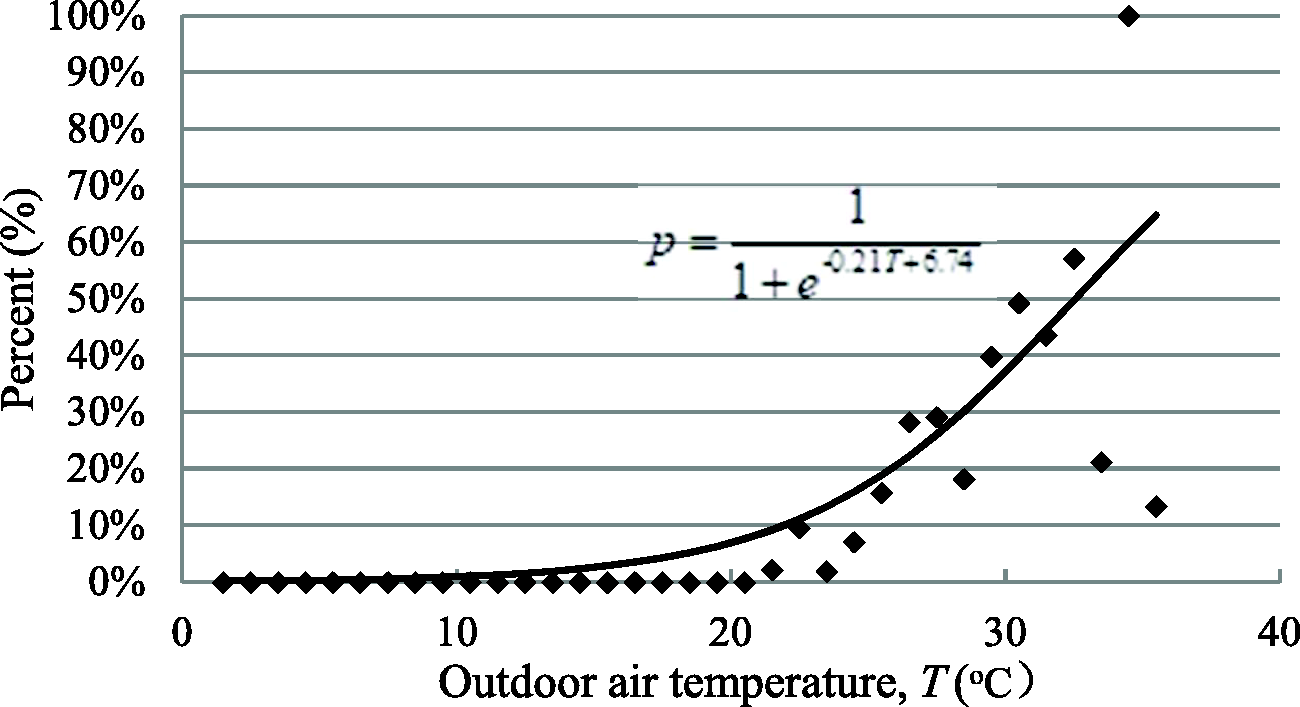
Results of logistic regression models for AC and fan behaviours.
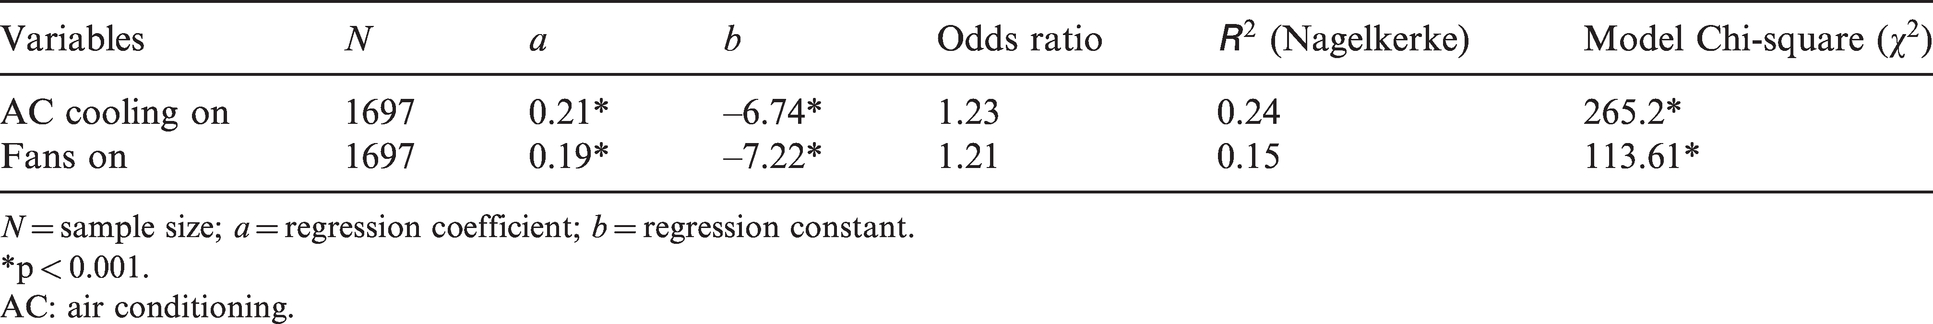
N = sample size; a = regression coefficient; b = regression constant.
*p < 0.001.
AC: air conditioning.
AC cooling on
Online questionnaire responses were binned into 1°C intervals along the outdoor air temperature axis. The actual proportion of the sample with AC cooling ‘on’ was presented as data points (the logistic regression equation is based on unbinned data) in Figure 5. The fitted regression model for AC cooling ‘on’ can be seen in equation (3)
Percentage of AC cooling on in relation to outdoor air temperature.
As expected, the proportion of householders turning on AC for cooling purposes increases as outdoor air temperature increases. When the percentage of respondents turning on AC is 50%, the corresponding outdoor air temperature, T50, is 32.5°C. A previous study conducted in mixed-mode office buildings in Pakistan 11 found that T50 was 28°C–29°C. This means that occupants in Tianjin residential contexts had a greater heat tolerance than occupants of offices in Pakistan during summer.
Fans on
The equation of the regression model for fan usage is demonstrated in equation (4)
As shown in Figure 6, the likelihood of turning fans on also increases as outdoor air temperature increases, but percentages of fans in use across the full range of outdoor air temperature is consistently lower than 35%, suggesting that occupants in Tianjin rely on fans to a lesser extent than they do on AC during summer.
Percentage of turning fans on in relation to outdoor air temperature.
Opening windows or doors
The equation of the regression model for opening windows/doors is demonstrated in equation (5)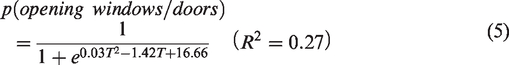
As can be seen from Figure 7, window opening behaviour was not common at outdoor air temperatures lower than 13°C. However, once outdoor temperatures crept above that threshold the percentage of occupants opening their windows increased quickly, peaking at 25.2°C, with nearly 77% of householders opening windows or doors. The occupants’ tendency of opening windows or doors decreased as outdoor air temperature exceeded 25.2°C. These Tianjin mixed-mode residential building results differ from those observed in naturally ventilated buildings. Previous studies 13 found that the proportion of windows being open continuously increased as outdoor air temperature rose without decreasing, forming a logistic ‘S’ function.
Percentage of opening windows or doors in relation to outdoor air temperature.
Patterns of adaptive behaviours in Tianjin residential contexts
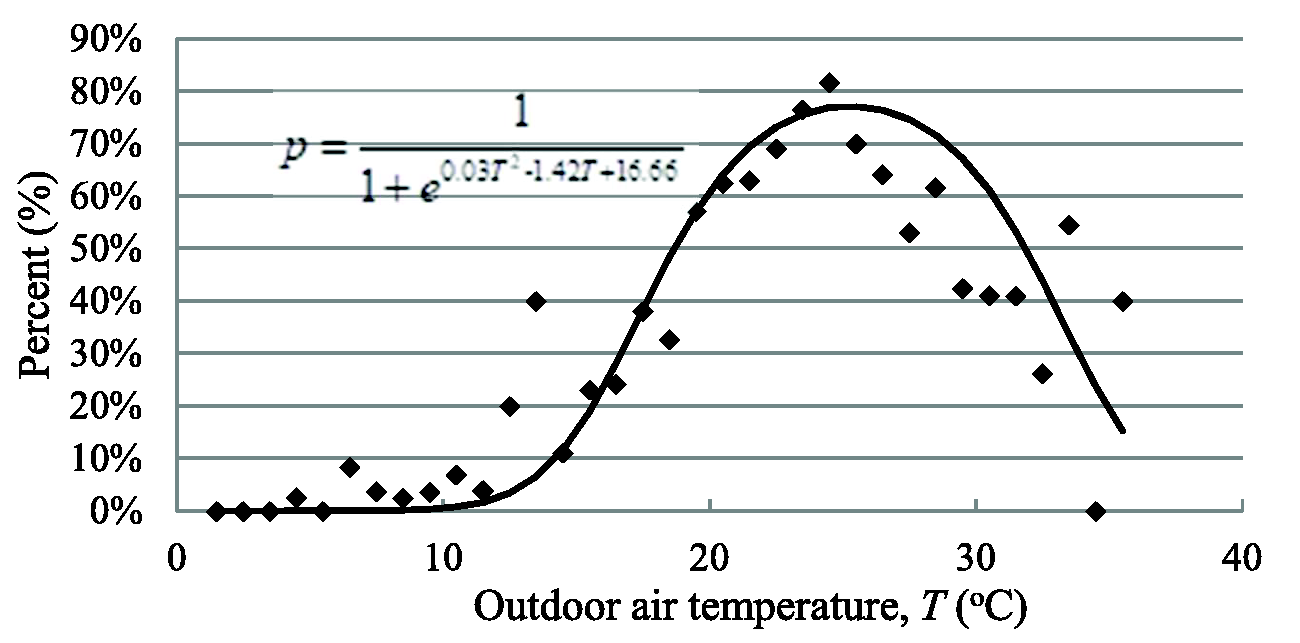
Figure 8 presents regression models of the dependence of three adaptive comfort behaviours on outdoor temperature – AC cooling, fans and windows/doors. Viewed together, these models convey thermal relativities of Tianjin residential comfort behaviours.
Percentage of three kinds of adaptive behaviours in relation to outdoor air temperature.
For this sample of Tianjin residents, an outdoor air temperature of 25.2°C maximized the usage of windows/doors for comfort ventilation instead of AC. Considering the fact that most contemporary dynamic building energy simulation softwares (e.g. EnergyPlus, DesT) adopt fixed, simplistic schedules to reflect occupant behaviours, these logistic regression results derived from field observations provide another degree of realism to residential building simulations in the Tianjin setting. The findings from this field study can be programmed into current simulation software to provide more accurate and representative forecasts of building energy consumption patterns.
Comparison of adaptive behaviours between daytime and night-time
Timestamps on data collected in this survey permit comparison of occupants’ adaptive comfort behaviours between daytime and night-time. The data were divided into two groups, daytime from 06:01 h through 18:00 h, and nighttime from 18:01 h through 06:00 h. Regression models were obtained using the same analytical methods described above. Results of these regression models are summarized in Table 5.
Results of logistic regression models in different times of the day.
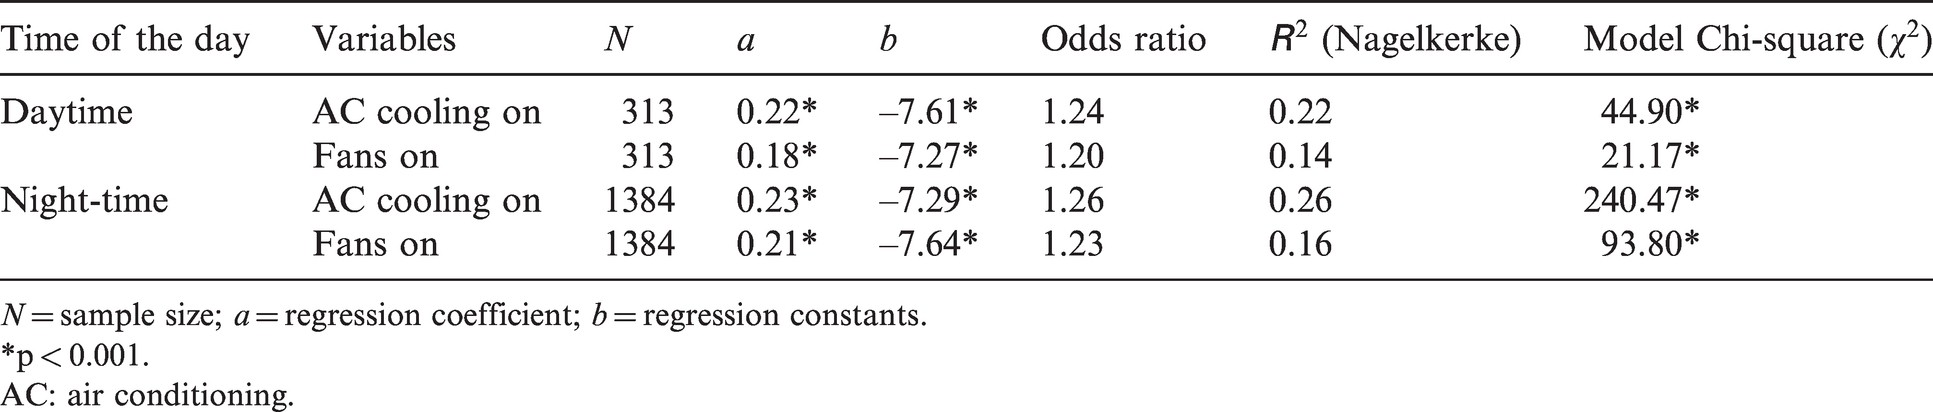
N = sample size; a = regression coefficient; b = regression constants.
*p < 0.001.
AC: air conditioning.
Figures 9 to 11 illustrate percentages of the three adaptive behaviours in relation to outdoor air temperature. Separate daytime and nighttime regression equations for turning AC cooling on, fans on and opening windows/doors are presented in related figures as well.
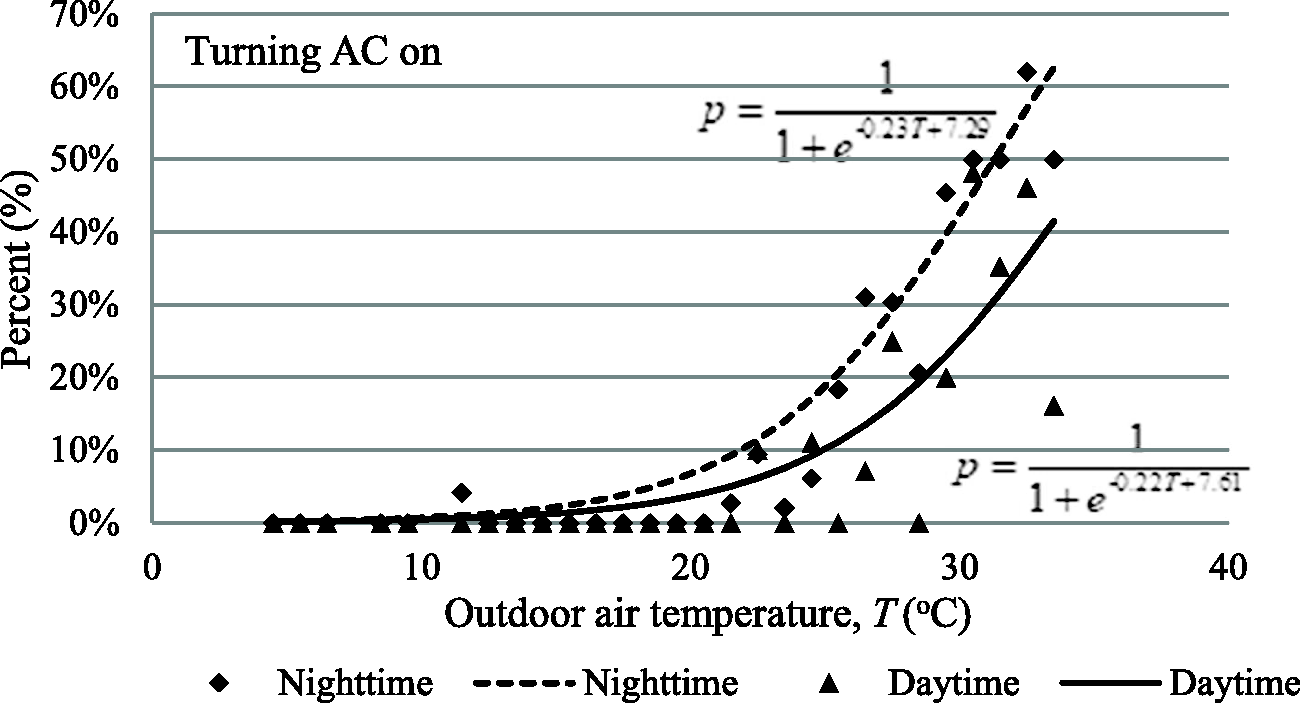
Likelihood of AC cooling being in use (%) in relation to outdoor air temperature during daytime and night-time.
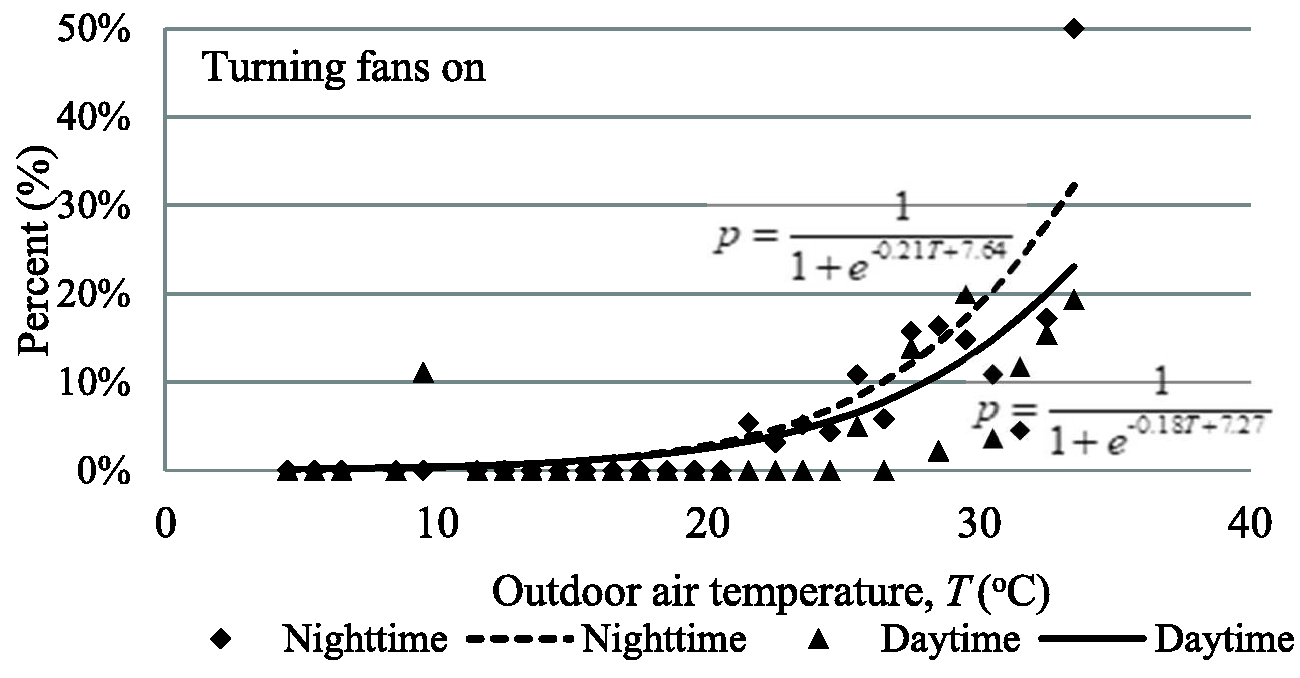
Likelihood of fans being in use (%) in relation to outdoor air temperature during daytime and night-time.
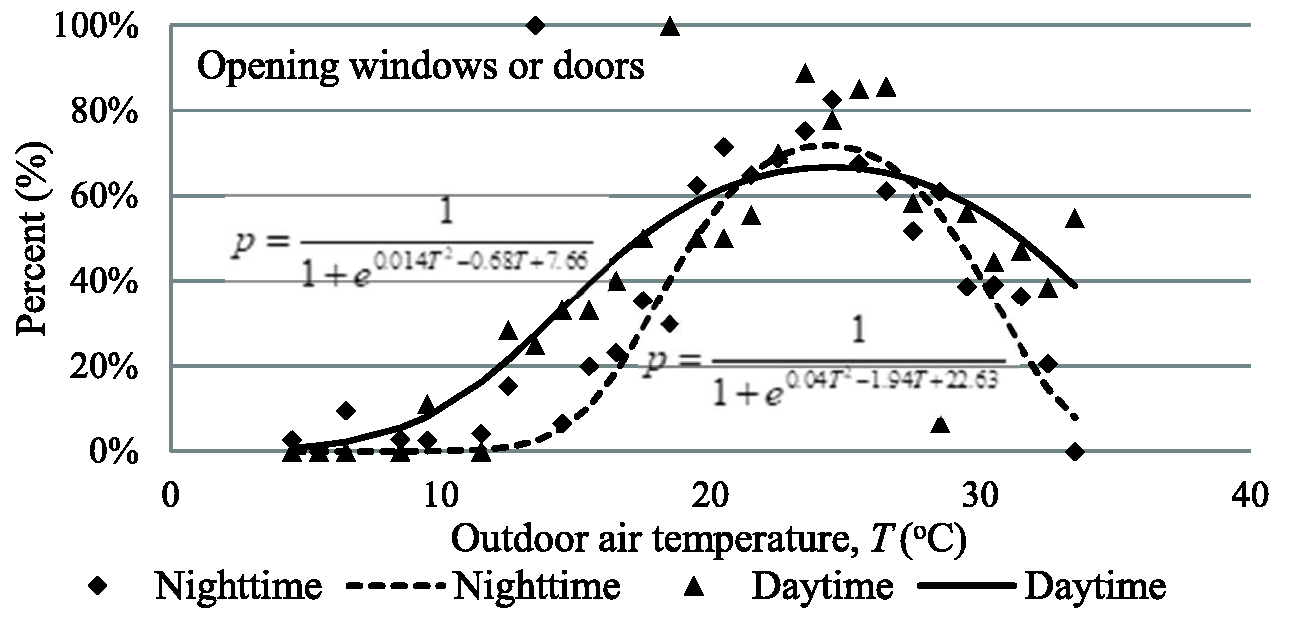
Likelihood of windows/doors being used for cooling (%) in relation to outdoor air temperature during daytime and night-time.
From Figures 9 to 11, occupants tended to turn AC and fans on more frequently in nighttime than in daytime. When the outdoor air temperature was between 22°C and 26°C, this sample of Tianjin residents opened their windows or doors more frequently at night than in daytime. However, when the outdoor air temperature was higher than 26°C or lower than 22°C, they chose to open their windows less frequently at night than during daytime.
Comparison of adaptive thermal behaviours between Tianjin, China and Sydney, Australia
As described above, the present research adopted the same method as the one carried out in Sydney, Australia,
17
which enables some cross-cultural comparisons. (We assumed that climatic differences are negligible between the two cities as they are both located in temperate climate zone.) The typical dwelling investigated in Tianjin was a multi-storey apartment, while it was one- or two-storey house in Sydney. Females represented 65%–70% respondents in Tianjin and Sydney. Fewer Sydney families had family size of >4 people, compared to participated family in Tianjin (Sydney 8.6% vs. Tianjin 14.0%). Occupants’ thermal behaviour can be complicated and influenced by many factors (e.g. household income, energy saving awareness, cultural difference). Therefore, to list out all the variables potentially influencing householders’ adaptive comfort behaviours is very difficult. The idea was to replicate the methods in a different cultural, socioeconomic, housing typology and climatic context. The comparisons between contexts represent a key contribution of this study. The major comparisons between the two cities are made as following: Both studies indicated that occupants had a wider range of clothing adjustments in their home compared to offices. Clothing adjustment behaviour in response to the room temperature was more pronounced in the transition season (autumn) than in summer or winter, both in Tianjin and Sydney studies. Opening windows or doors was the most frequently exercised comfort behaviour both in Tianjin and Sydney studies. The behavioural pattern of window operation observed in both studies followed a ‘bell curve’ shape, which peaked at 25°C–26°C of outdoor air temperature. The outdoor air temperatures for 50% of occupants turning on AC for cooling are respectively 32.5°C in Tianjin and 35°C in Sydney. This indicated that householders in Sydney were more tolerant of hot external environment than those in Tianjin. The mechanism behind this still remains unknown and to be discovered further.
Limitations of the study
Occupants’ AC usage decisions do not only depend on outdoor air temperatures but also on other trigger events (e. g. arriving or departing home). One of limitations of this study’s methods is that occupants’ occupancy patterns and movements inside their homes were not recorded. The only moments throughout the 6-month monitoring period that we could be certain the homes were occupied coincided with a response on the online questionnaire. Another limitation is the sample of 43 families is insufficient to support definitive generalizations to the greater Tianjin regional population. A larger sample encompassing multiple climatic zones and stratified by household income would derive a more robust occupants’ behavioural model.
Conclusions
This paper presents results from a 6-month field study about adaptive comfort behaviours in 43 residential buildings in Tianjin. The main conclusions are as follows: When the outdoor air temperature was between 22°C and 26°C, occupants tended to change their clothing insulation more actively to get better thermal sensation. People changed their clothing more frequently in autumn compared to summer. Opening windows or doors was the most common adaptive strategies Tianjin occupants adopted to reach thermal comfort. Regression models enabling prediction of the likelihood of adaptive strategies in use as a function of outdoor air temperatures were derived, which can be utilized in building simulation software. When the outdoor air temperature reached 25°C, 77% people started to close window. When the outdoor air temperature was above 33°C, 50% people turned on AC units for cooling. This sample of Tianjin residents tended to turn on air-conditioning and fans more often in night-time than in daytime.
Footnotes
Acknowledgement
We thank all the 43 homes for participating in this study. We appreciate Mr Shugang Luo and Professor Zhe Tian for their contribution in data collection.
Authors' contribution
Conceptualization and methodology: Richard de Dear, Jungsoo Kim and Thomas Parkinson; Data analysis: Jing Hou, Yangrui Song, Jungsoo Kim and Thomas Parkinson; Investigation: Jing Hou, Yangrui Song and Yuexia Sun; Writing original draft preparation: Jing Hou, Yangrui Song and Yuexia Sun; Editing: Yuexia Sun, Jing Hou, Jungsoo Kim, Thomas Parkinson and Richard de Dear; Supervision: Yuexia Sun and Richard de Dear. All authors have read and agreed to the published version of the manuscript.
Declaration of conflicting interests
The author(s) declared no potential conflicts of interest with respect to the research, authorship, and/or publication of this article.
Funding
The author(s) disclosed receipt of the following financial support for the research, authorship, and/or publication of this article: This study was supported financially by the National Key Project of the Ministry of Science and Technology, China (Grant No. 2017YFC0702700), the National Natural Science Foundation of China (Grant No. 21207097) and Key Research and Development Program of Tianjin Science and Technology Commission (Grant No. 19YFZCSN01170), as well as the Australian Research Council Discovery Projects (Grant No. DP11010559).