
Abstract
Cities comprise many residential districts, facing environment and energy problems. Therefore, the retrofit of these existing residential districts is the main part of city renewal. Some retrofit strategies may affect the thermal microclimate environment and lead to changes in the energy demand of buildings. Few studies had evaluated these retrofit effects, which has brought the motivation for this study, to determine the microclimate changes surrounding buildings due to residential district retrofits and the corresponding impact on the cooling load of buildings. The most general retrofit strategies were selected, including greening rate, ground pavement materials, wall materials and roof materials. They were applied to a prediction model for the selected residential district in the simulation tool. The mean reduction of air temperature around the building has been used to evaluate the impact of retrofit strategies on the microclimate in the district. The results showed that greening had the greatest impact on the mean air temperature around buildings, followed by the pavement material, the roof and the wall material. Ground greening, wall material and roof material decreased the total cooling load, while pavement material increased it.
Introduction
As an essential component of cities, the number of urban residential districts is enormous. However, most existing residential facilities are very old already and need retrofitting, 1 include building envelopes, energy systems and outdoor landscape environment. 2 Some retrofit strategies may affect the thermal microclimate environment of residential districts. In addition to local solar radiation, wind, humidity and other natural factors, a microclimate is related to many artificial factors including building layout, orientation, floor area ratio, vegetation, water, underlying surfaces and anthropogenic heat.3,4 For a residential district, it is difficult to change building layout, orientation and floor area ratio. Therefore, a retrofit strategy should focus on outdoor environment and building envelope, especially external surfaces. The common retrofit strategies that impact the microclimate include vegetation strategies and the use of high-reflectivity materials.
The beneficial effect of the vegetation on cities’ microclimate and the thermal comfort, either as a part of the urban landscape or implemented on the buildings’ facades has been widely discussed in many existing studies.5–9 Based on their findings, the key element of the greenery’s positive contribution towards the improvement of outdoor thermal environment is the evapotranspiration from the plant foliage. Through the latter process, which combines the transpiration of the water extracted by the roots from the soil, ending to the leaves’ stomata and the evaporation of the water from plants’ surface, the latent heat release on the surrounding environment can be significantly increased, leading to the ambient air temperature cooling. 5 In parallel, the shading of the adjacent ground and buildings’ surfaces by the trees’ foliage would result in a lower amount of solar energy absorbed and stored by urban surfaces and consequently, to lower convective heat fluxes.
High-reflectivity materials have been widely investigated as a solution towards the improvement of outdoor thermal environment; the respective materials can be applied either on ground surfaces, or on building envelope surfaces. Due to their thermophysical properties, they absorb smaller amount of solar radiation, resulting in lower heat storage and smaller surface temperature.10,11 As a result, the long-wave radiation flux emitted towards the surrounding environment is reduced, leading to lower ambient temperatures.
A substantial number of existing studies have applied the ENVI-met microclimate model to evaluate the impact of different mitigation strategies towards the improvement of the urban thermal environment and its implicit effects. 12 Vegetation is mostly applied on the ground and on roofs due to its obvious cooling effect. Some studies13–16 have been related to different vegetation strategies on the ground, focussing on the cooling effect of the pedestrian level, mainly by changing greening rate, plant species, heights and leaf area density. Some studies15,17,18 have applied roof vegetation strategies, mainly by changing coverage rate, height and leaf area density, to explore the temperature reduction at pedestrian level. Some studies19–21 have applied vegetation strategies to both ground and roof, and the temperature reduction became larger when both ground and roof vegetation strategies were applied together. The high-reflective materials can be applied to both the ground and the surface of the building envelope. Some studies22–24 have applied high-reflective materials to pavement, wall and roof, to explore their cooling effect on pedestrian level. The vegetation strategy and the use of high-reflective materials have a great potential on improving the microclimate of residential districts, although the results of some similar strategies have a little difference due to the variation in geographical locations, climatic conditions, building layouts and floor area ratios.
A change in the thermal environment around a building may also cause changes in the building energy demand and then have an impact on the energy system retrofit. Li et al. 25 simulated temperature distribution around buildings at different times of a day and predicted the impact of the outdoor thermal environment on the building energy consumption. Yang et al. 26 proposed a simulation method of the influence of outdoor microclimate on buildings’ air-conditioning energy consumption, and they studied the influence of different block space forms and different surface types on buildings’ cooling load. Pan et al.27,28 found that applying vertical greenery systems on building envelopes could reduce steady-state heat conduction by 18.7–39.8% and the use of vertical greenery systems in the built environment could bring remarkable passive cooling benefits to both outdoor and indoor environments. Peng et al.29,30 evaluated the summer cooling effects of facade greening at the block scale and estimated the energy savings of 11–31 kWh/m2 of green facades. The microclimate around a building can affect buildings’ indoor environment and thus could affect the air-conditioning demand.
Many studies focused on the thermal environment at the pedestrian level with the vegetation strategy and high-reflective material strategy applied separately or in combination. However, few studies evaluated the variation in the thermal environment around buildings, and the impact of the microclimate on the building load that mainly comes from the impact of thermal environment around buildings, especially air temperature. Therefore, the motivation of this study was to determine the variation of the microclimate surrounding buildings due to residential district retrofits. The strategies that are common in retrofit projects and mainly focused on pre-selected effects on microclimate. These include vegetation strategies and the use of high-reflective materials on the ground, wall and roof. ENVI-met has been used to simulate the microclimate in one residential district in Shanghai, and the mean air temperature around one building was taken as the evaluation index. The impact of both single-retrofit strategies and dual-retrofit strategies has been analysed.
Methodology
The investigation on urban microclimate has been traditionally performed by observational means. 31 The significant advances in computational resources of last decades, however, have considerably enhanced the application of numerical simulation approaches involving computational fluid dynamics and thermal energy balance models. 32 The basis of the creation of numerical micro-scale models relies on the complex interactions between urban fabric (i.e. buildings and ground surfaces) and local weather parameters. In principle, solar radiation, including direct, diffuse and reflected radiation along with airflow patterns, and heat transfer from the urban surfaces to the air are considered by such models. 33 In this context, one widely employed dynamic simulation tool for microclimate analysis 34 is the ENVI-met model.
Framework
The research process consisted of three steps. First, a field measurement was conducted to evaluate the accuracy of the ENVI-met model for simulation. Second, the weather data and the boundary conditions were selected as the input conditions of the model. Last, the common retrofit strategies were combined with a typical model of the existing residential district to simulate the air temperature around the building through a multi-scenario. Figure 1 displays the input and the output processes of the model. The research framework.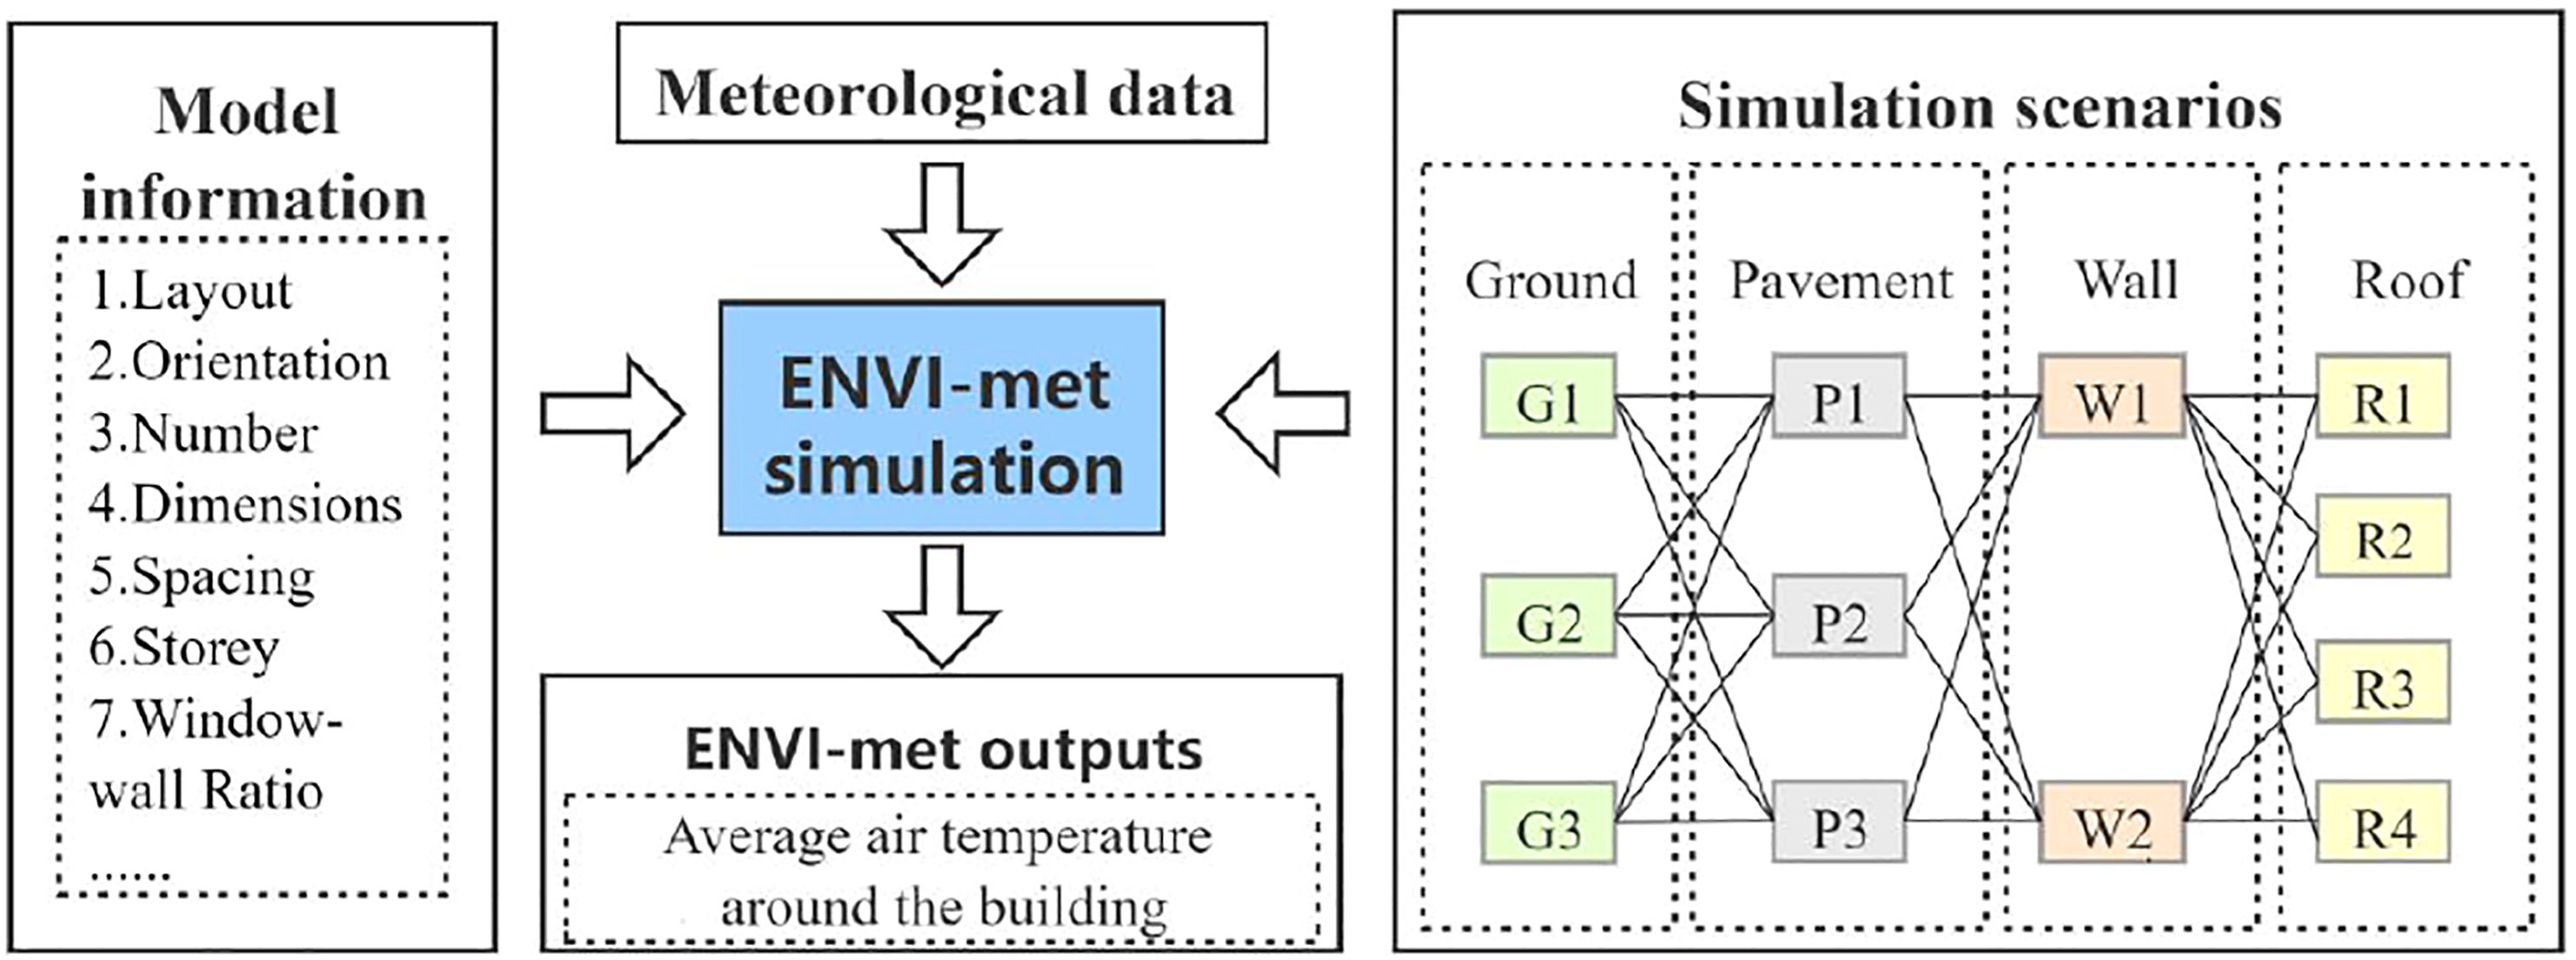
Evaluation of the ENVI-met model
Introduction of ENVI-met
ENVI-met is a three-dimensional grid-based microclimate modelling tool, which is widely used for studying the microclimate effect of urban forms, surface materials and vegetation in urban environments. 12 The tool is based on fundamental laws of fluid mechanics, thermodynamics and atmospheric physics. It can model complex building-soil-vegetation-atmosphere interactions at fine temporal resolutions (up to 10s) and fine spatial resolutions (0.5–10.0 m). A detailed description of this tool with all equations can be found in Bruse and Fleer 35 and Huttner and Bruse. 36 The tool is available at http://www.envi-met. 37 In the tool, the air temperature around the building is the average air temperature in all grids close to the building.
Measured information
Field measurements were obtained around a building located at the Xuhui campus of Shanghai Jiaotong University, about 800 m away from the Xuhui district meteorological station, Shanghai, China. The field measurements were conducted on 13 August from 9:00 am to 5:00 pm, 2017. Both measuring locations and the plan of the ENVI-met model are shown in Figure 2. The measuring locations were selected according to different environments, the environment of location 1 has more buildings, location 2 has more vegetation and location 3 has a moderate area covering of buildings and vegetation. The measuring locations and the plan of the ENVI-met model.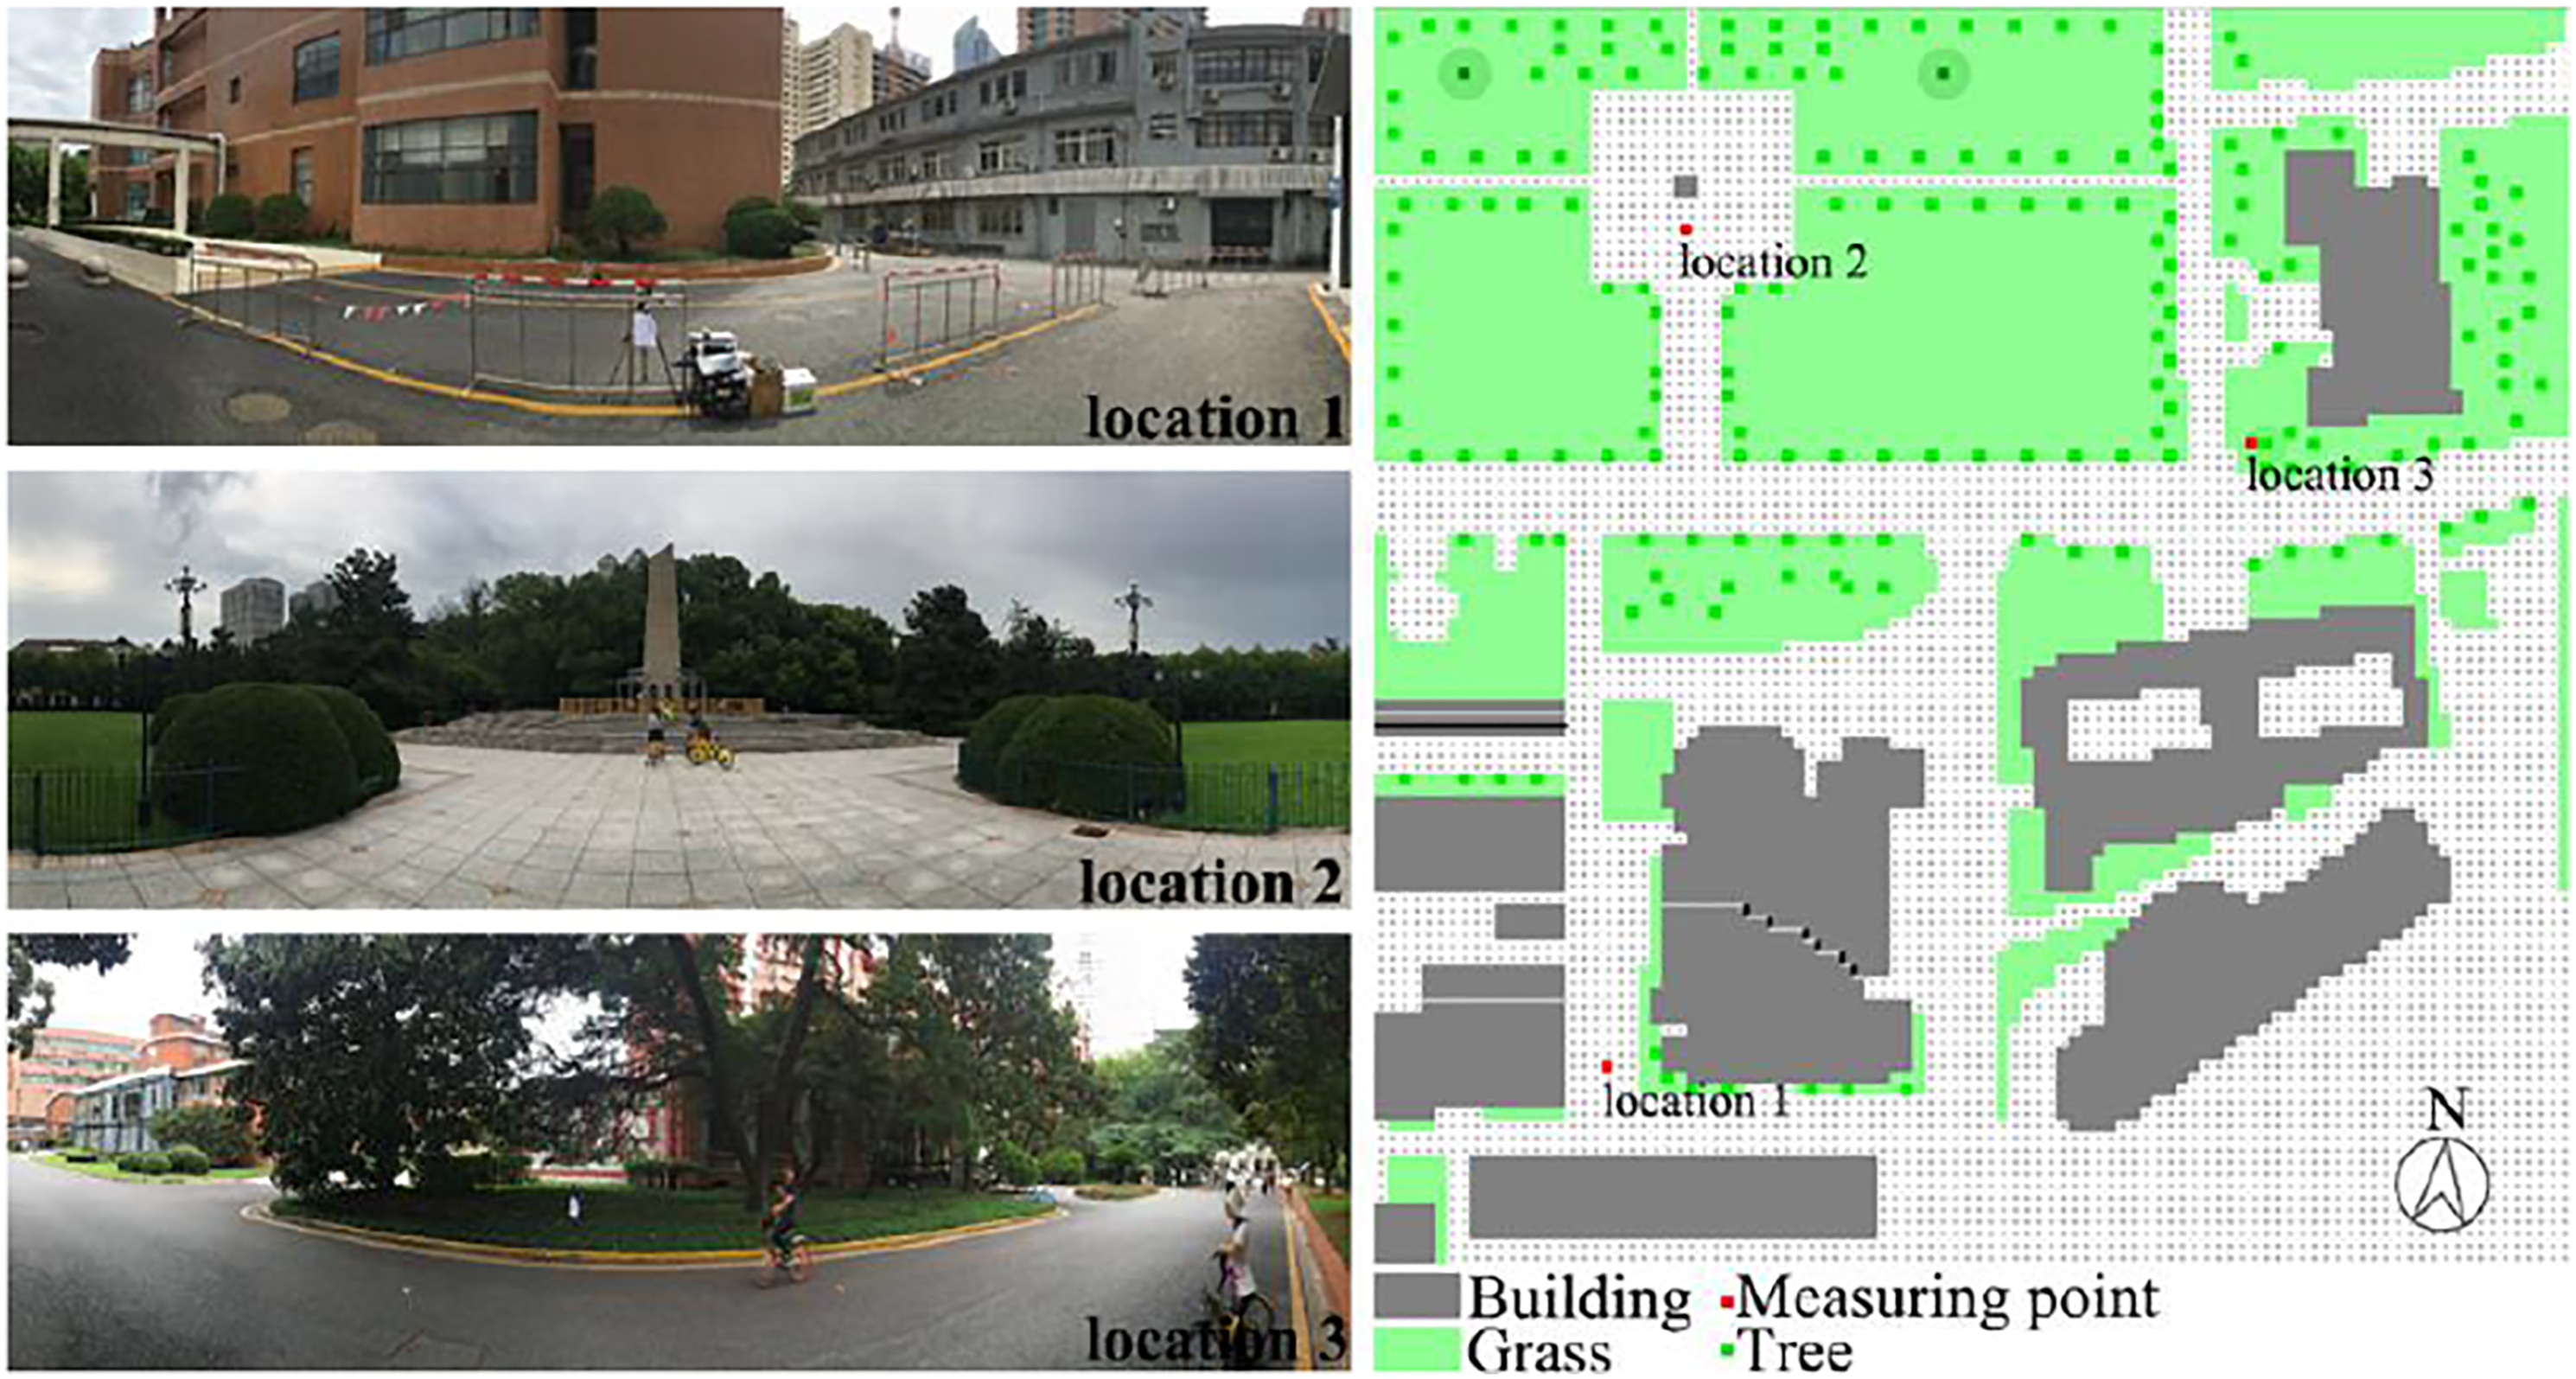
Location 1 was situated at the middle of the asphalt road, with an 80-metre-high building on the east side and two 10-metre-high buildings on the west and south sides. There are some grass and shrubs on the side of the road. Location 2 was on the marble floor tiles, surrounded by a large area of vegetation. Location 3 was situated on the side of the asphalt road, with grass below and covered by a pine tree crown. The instrument used was a temperature-humidity recorder (T&D72U) that automatically records the data and records results at every 10 min. The measuring range supported by the instrument was −40–110°C for the temperature and 10–95% for the relative humidity. The accuracy of the recorder is ±0.5°C for the temperature and ±5% for the relative humidity. The temperature and the relative humidity at the height of 1.4 m (pedestrian level) were collected and compared with data from the weather station and the ENVI-met simulation.
Evaluation of the model performance
To evaluate the reliability of ENVI-met simulation results, the weather station data was used for the ENVI-met model validation, and the modelled air temperature at the pedestrian level was compared with measured data and meteorological station data for the same time. The root mean square error (RMSE) between the simulated and the measured results and that between the weather station data and the measured results were calculated to evaluate the accuracy of the simulation, which were listed in Figure 3. Comparison of measured results, simulated results and hourly data from Xujiahui Weather Station: (a) air temperature at location 1; (b) air temperature at location 2; (c) air temperature at location 3; (d) relative humidity at location 1; (e) relative humidity at location 2 and (d) relative humidity at location 3.
Figure 3 shows the temperature and relative humidity measured and by simulation and compared with those recorded by Xujiahui Weather Station. The simulated and measured values matched well for air temperature, with the maximum differences of 0.22°C, 0.45°C and 0.53°C at three monitoring locations. The RMSE between the measured and the simulated results (RMSEM-S) was all smaller than the measured results and the weather station data (RMSEM-W), especially at locations 1 and 3, where RMSEM-S was less than half of RMSEM-W. There were specific differences between the simulated and the measured value for the relative humidity, with the maximum differences of 4.2%, 3.1% and 2.4%, respectively, at three monitoring locations, which were smaller than the differences between the measured value and the weather station. RMSEM-S of relative humidity was also smaller than RMSEM-W, and at locations 1 and 3, RMSEM-S was less than half of RMSEM-W. In fact, due to the uncertainty of relative humidity and the error of the measuring instrument, the actual difference between the measured results and the simulated results may be smaller. The observed differences may be due to many complex factors not considered in the simulation process, in addition to instrumental errors. For both the temperature and the relative humidity, when the measured value was close to the weather station data, there was just a slight difference between the two RMSEs. All the same, the simulated results were in good agreement with the measured results. Considering the above results, the simulation of ENVI-met is thought to be reasonable, which also illustrates the importance of using microclimate data as boundary conditions for the building energy consumption simulation.
Model information and key input parameters
Model information
Existing residential districts often display diverse geometric features, including building layouts, orientations and so on. In the exploration of the relationship between retrofit strategies and mean air temperature variation around a building, the use of representative residential models is crucial. The model information used in this study was based on the public list for the survey of existing residential districts to be renovated in Beijing, Shanghai and Guangzhou. 150 existing residential districts were randomly selected from the list. They were all built before 2000, a substantial portion before 1990. The building layout and orientation were determined according to the largest proportion of these residential districts. Reference values of the building length and width, floor height, building distance and wall-window ratio were adopted from local urban and building design regulations and guidelines.
Twelve buildings with a north–south layout representing a typical residential district model were created, with each building length and width corresponding to 48 m and 12 m, respectively, and the height of the building was 18 m. Building distances were 20 m for the north–south and 12 m for the east–west. The window–wall ratio of the south direction was 1/3, and the ratio of all other directions was 1/6, as shown in Figure 4(a). (a) The 3D view of the target neighbourhood model; (b) the site plan of the ENVI-met model.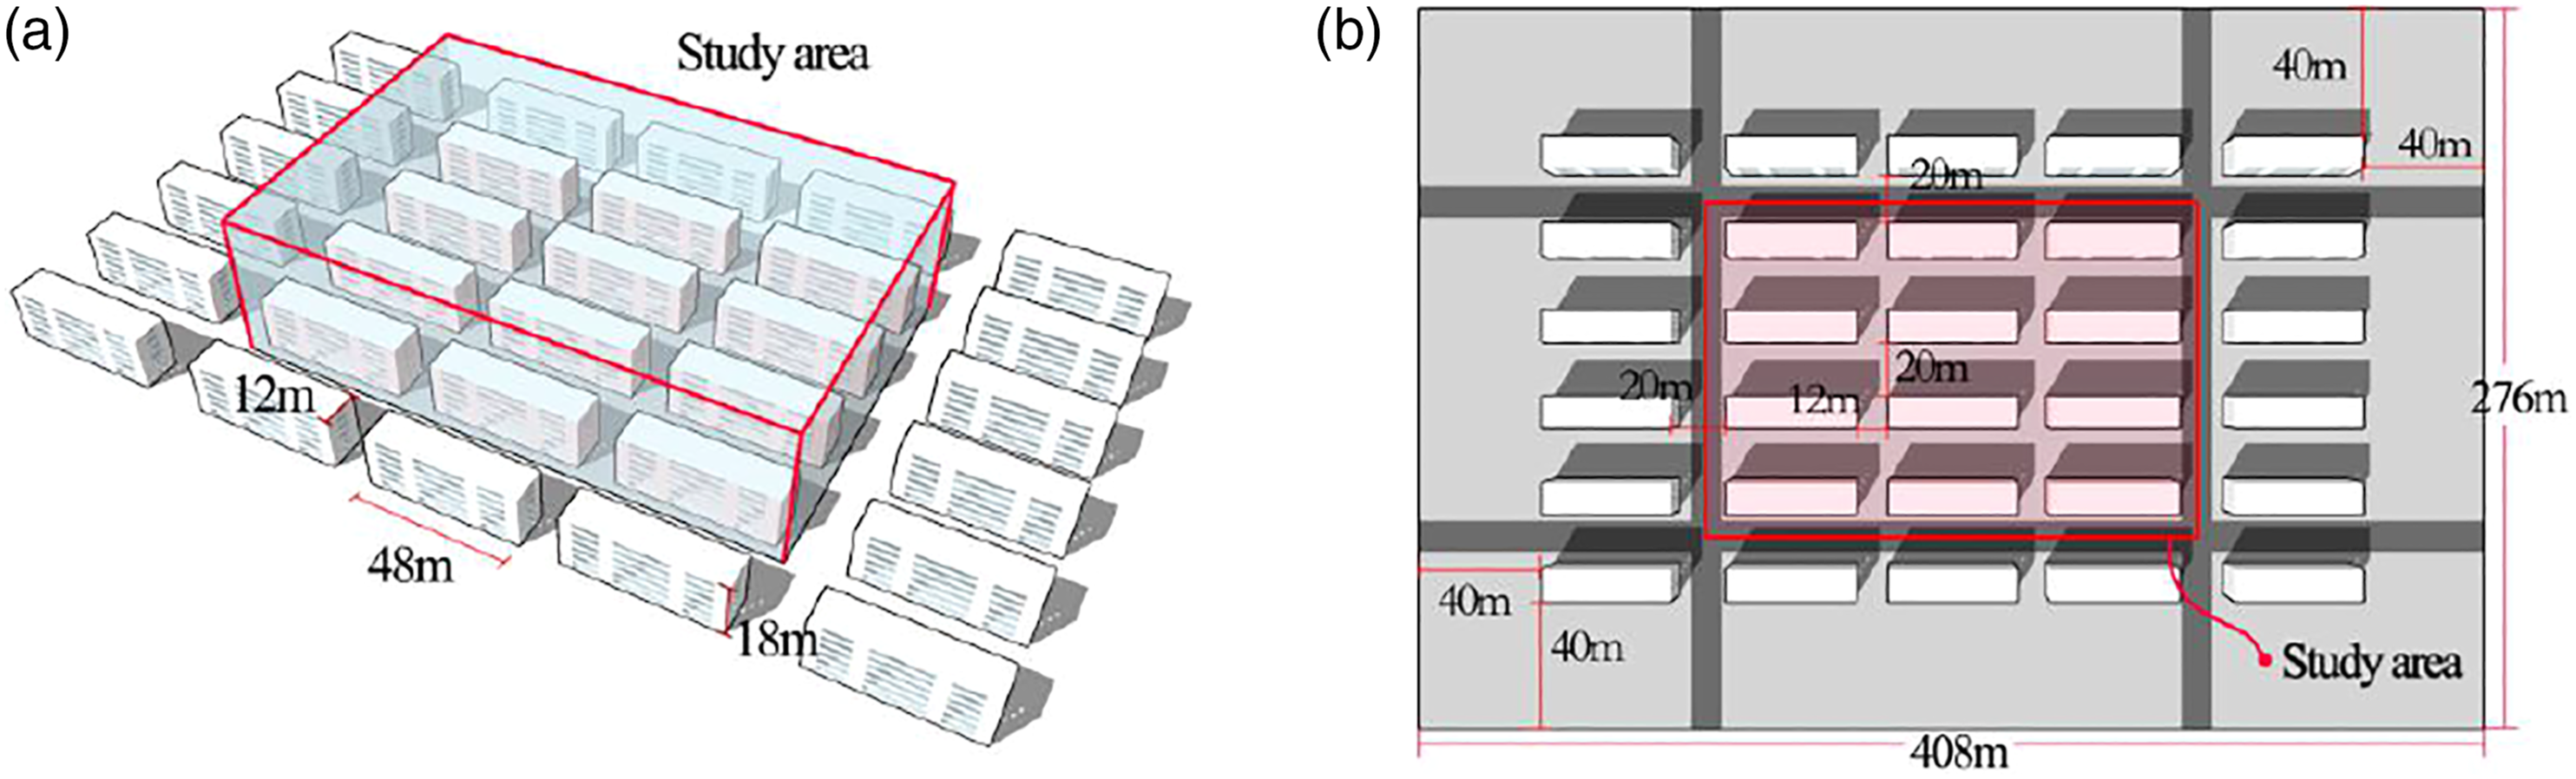
To improve the simulation accuracy, the surrounding of the study area was taken into consideration. However, expanding the calculation area would lead to a high computing load. To find the balance between simulation accuracy and computing load, one circle of buildings and two circles of buildings, the boundary distances of which were 20 m and 40 m and 60 m, respectively, were built around the study area to evaluate the surrounding environment effect. The results for one circle of buildings and two circle buildings were similar, and there was a great difference between 20 m and 40 m, but no significant difference between 40 m and 60 m. This showed that the boundary distance did affect the simulation results. However, when the boundary was 40 m or more, the difference was no longer obvious. The findings illustrated that the one circle of buildings should be built around the study area, and the boundary distance should be 40 m, as shown in Figure 4(b).
Data input
Main input parameters for ENVI-met modelling.
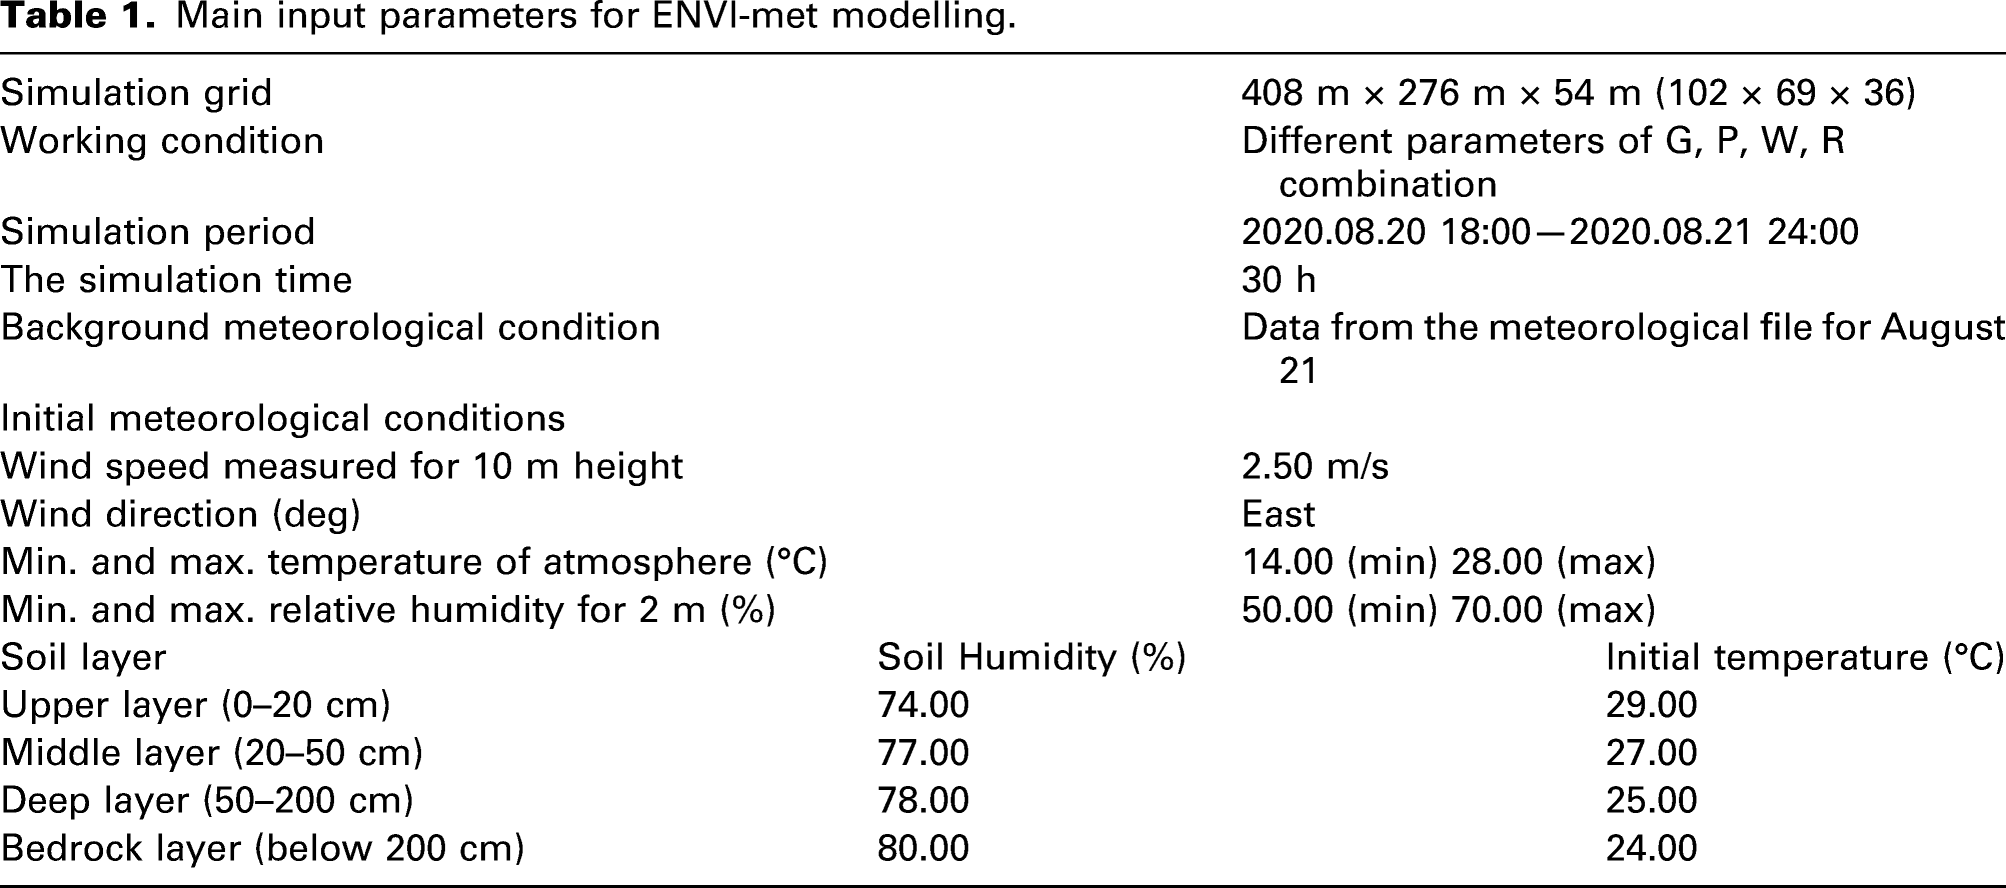
The China Standard Meteorological Data (CSWD) with the longest observation time and the latest data source was downloaded and used in the study. Figure 5 shows the weather conditions on the simulated day. Meteorological boundary conditions of the ENVI-met simulation.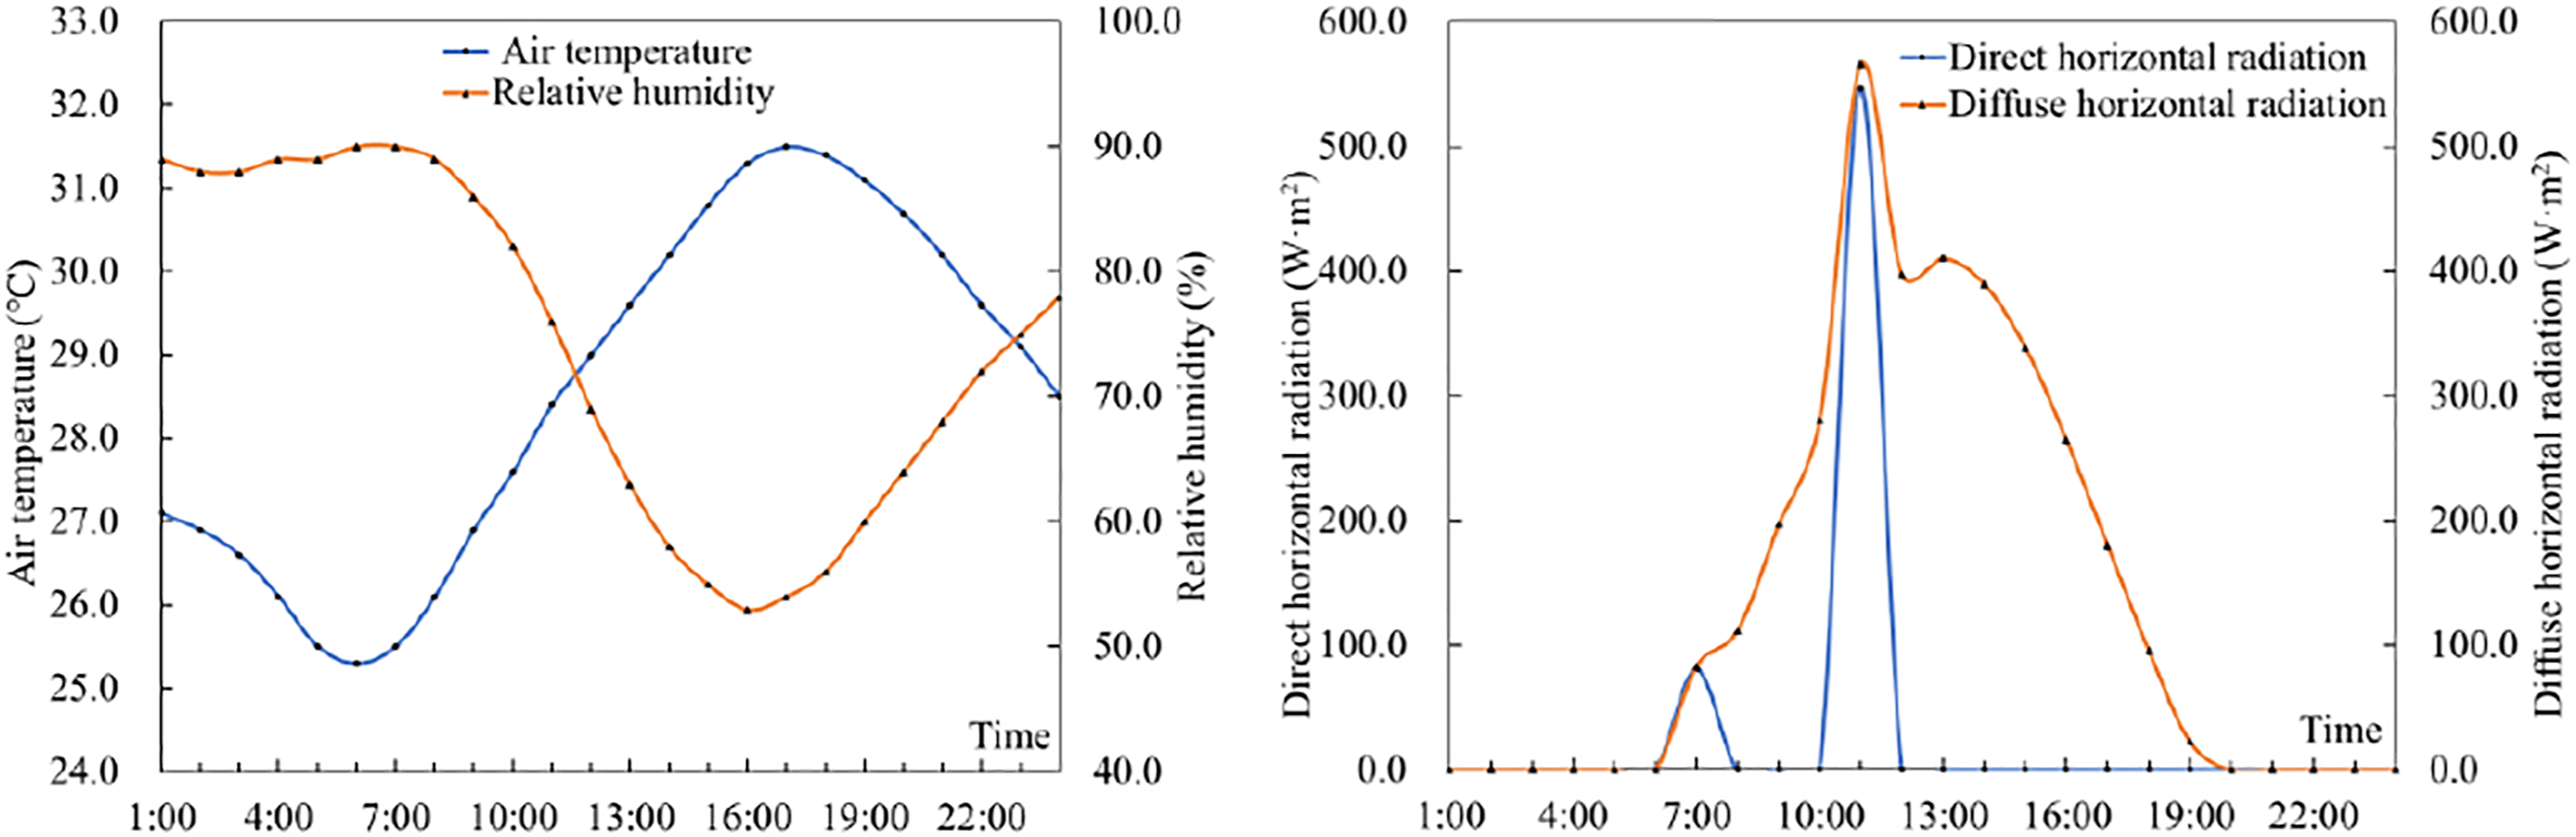
Case studies
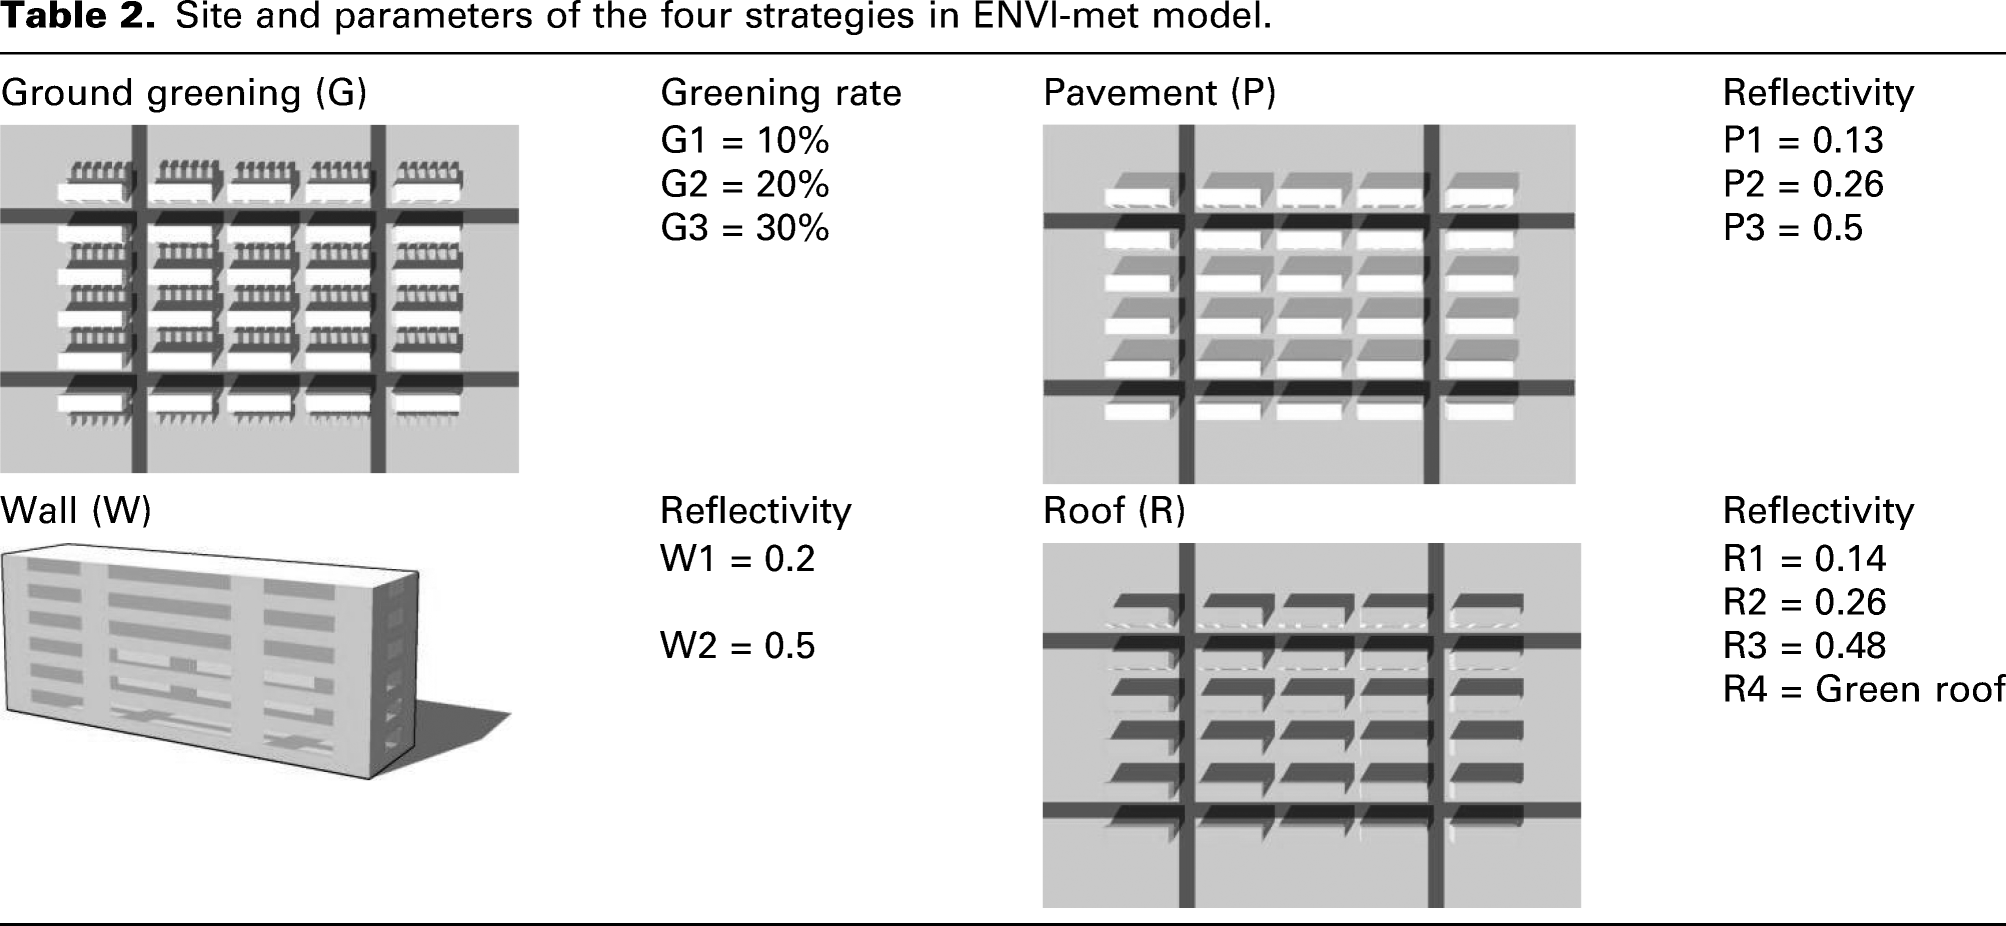
The residential district microclimate was related to many factors, including the building layout, vegetation, water body, underlying surface and artificial heat. Previous studies showed that vegetation strategies and high-reflectivity material strategies could effectively improve the regional thermal environment. They were applied much in the existing residential district. Therefore, vegetation strategies and high-reflectivity material strategies were selected in this study. There were many kinds of vegetation strategies, including changing the vegetation species, heights, leaf area densities and greening rates. In this study, the vegetation strategies referred to changing the greening rate. For the high-reflectivity material strategies, only the reflectivity was changed and the other properties were consistent.
Site and parameters of the four strategies in ENVI-met model.
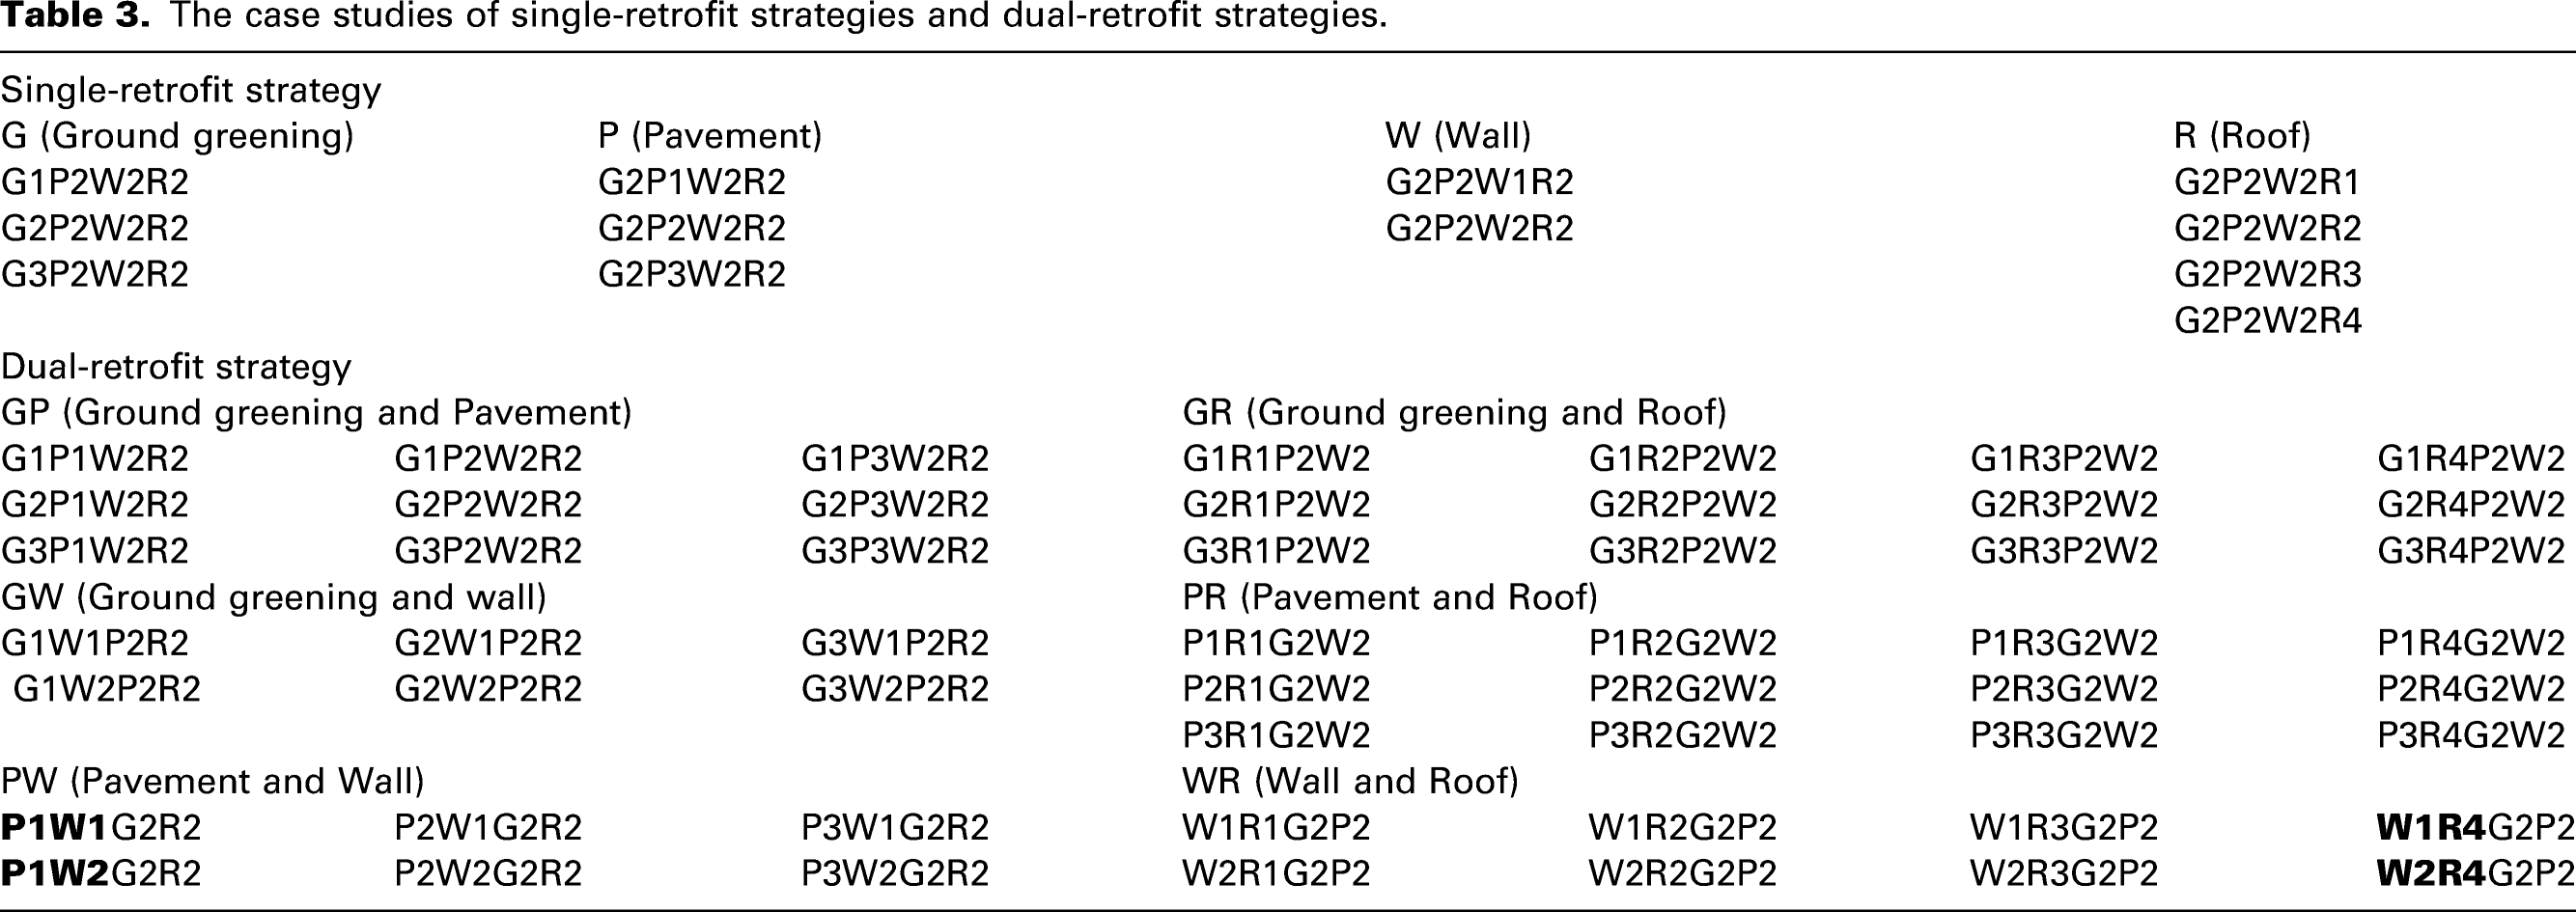
The case studies of single-retrofit strategies and dual-retrofit strategies.
Results and discussion
The impact of single-retrofit strategy
All cases with the highest simulated temperature under each single-retrofit strategy were picked out as the worst-case for comparison. The variation in the temperature effect caused by the changing parameters in each single-retrofit strategy was studied.
Hourly influence of single-retrofit strategy
Figure 6 shows the hourly mean air temperature reduction (ΔTma) around the building for different strategies compared with the worst-case. For example, in the calculation result for ground greening, the Ta for case G1 was the highest. Therefore, case G1 was treated as the worst-case. The mean air temperature (Tma) differences between G2 and G1, G3 and G1 in 24 h are shown in Figure 6(a). The ΔTma caused by the increasing greening rate was especially noticeable after 13:00, and compared with G1, the cooling effect of G3 with the lowest Tma was more than 0.3°C for the whole afternoon. The maximum ΔTma occurred between 16:00 and 19:00. When the greening rate was increased from G1 to G3, the Tma was reduced by more than 0.4°C. When the greening rate was increased, the Tma was reduced throughout the day. Additionally, the ΔTma between G3 and G1 was almost twice as large as that between G2 and G1. This also meant that the ΔTma around the building had a linear positive correlation with the increase of the greening rate within a certain range. The effect of the greening on the air temperature fluctuated constantly due to the transpiration of plants. The transpiration was influenced by many factors, including the light, temperature, relative humidity, wind speed, CO2 concentration in the environment and the biological characteristics of plants themselves. Since the simulation of plants by ENVI-met has already been validated in previous studies,12,34 such validation is not repeated here. The mean air temperature reduction (ΔTma) around the building for each strategy, compared to the highest temperature scenario. (a) Greening, (b) Pavement, (c) Wall and (d) Roof.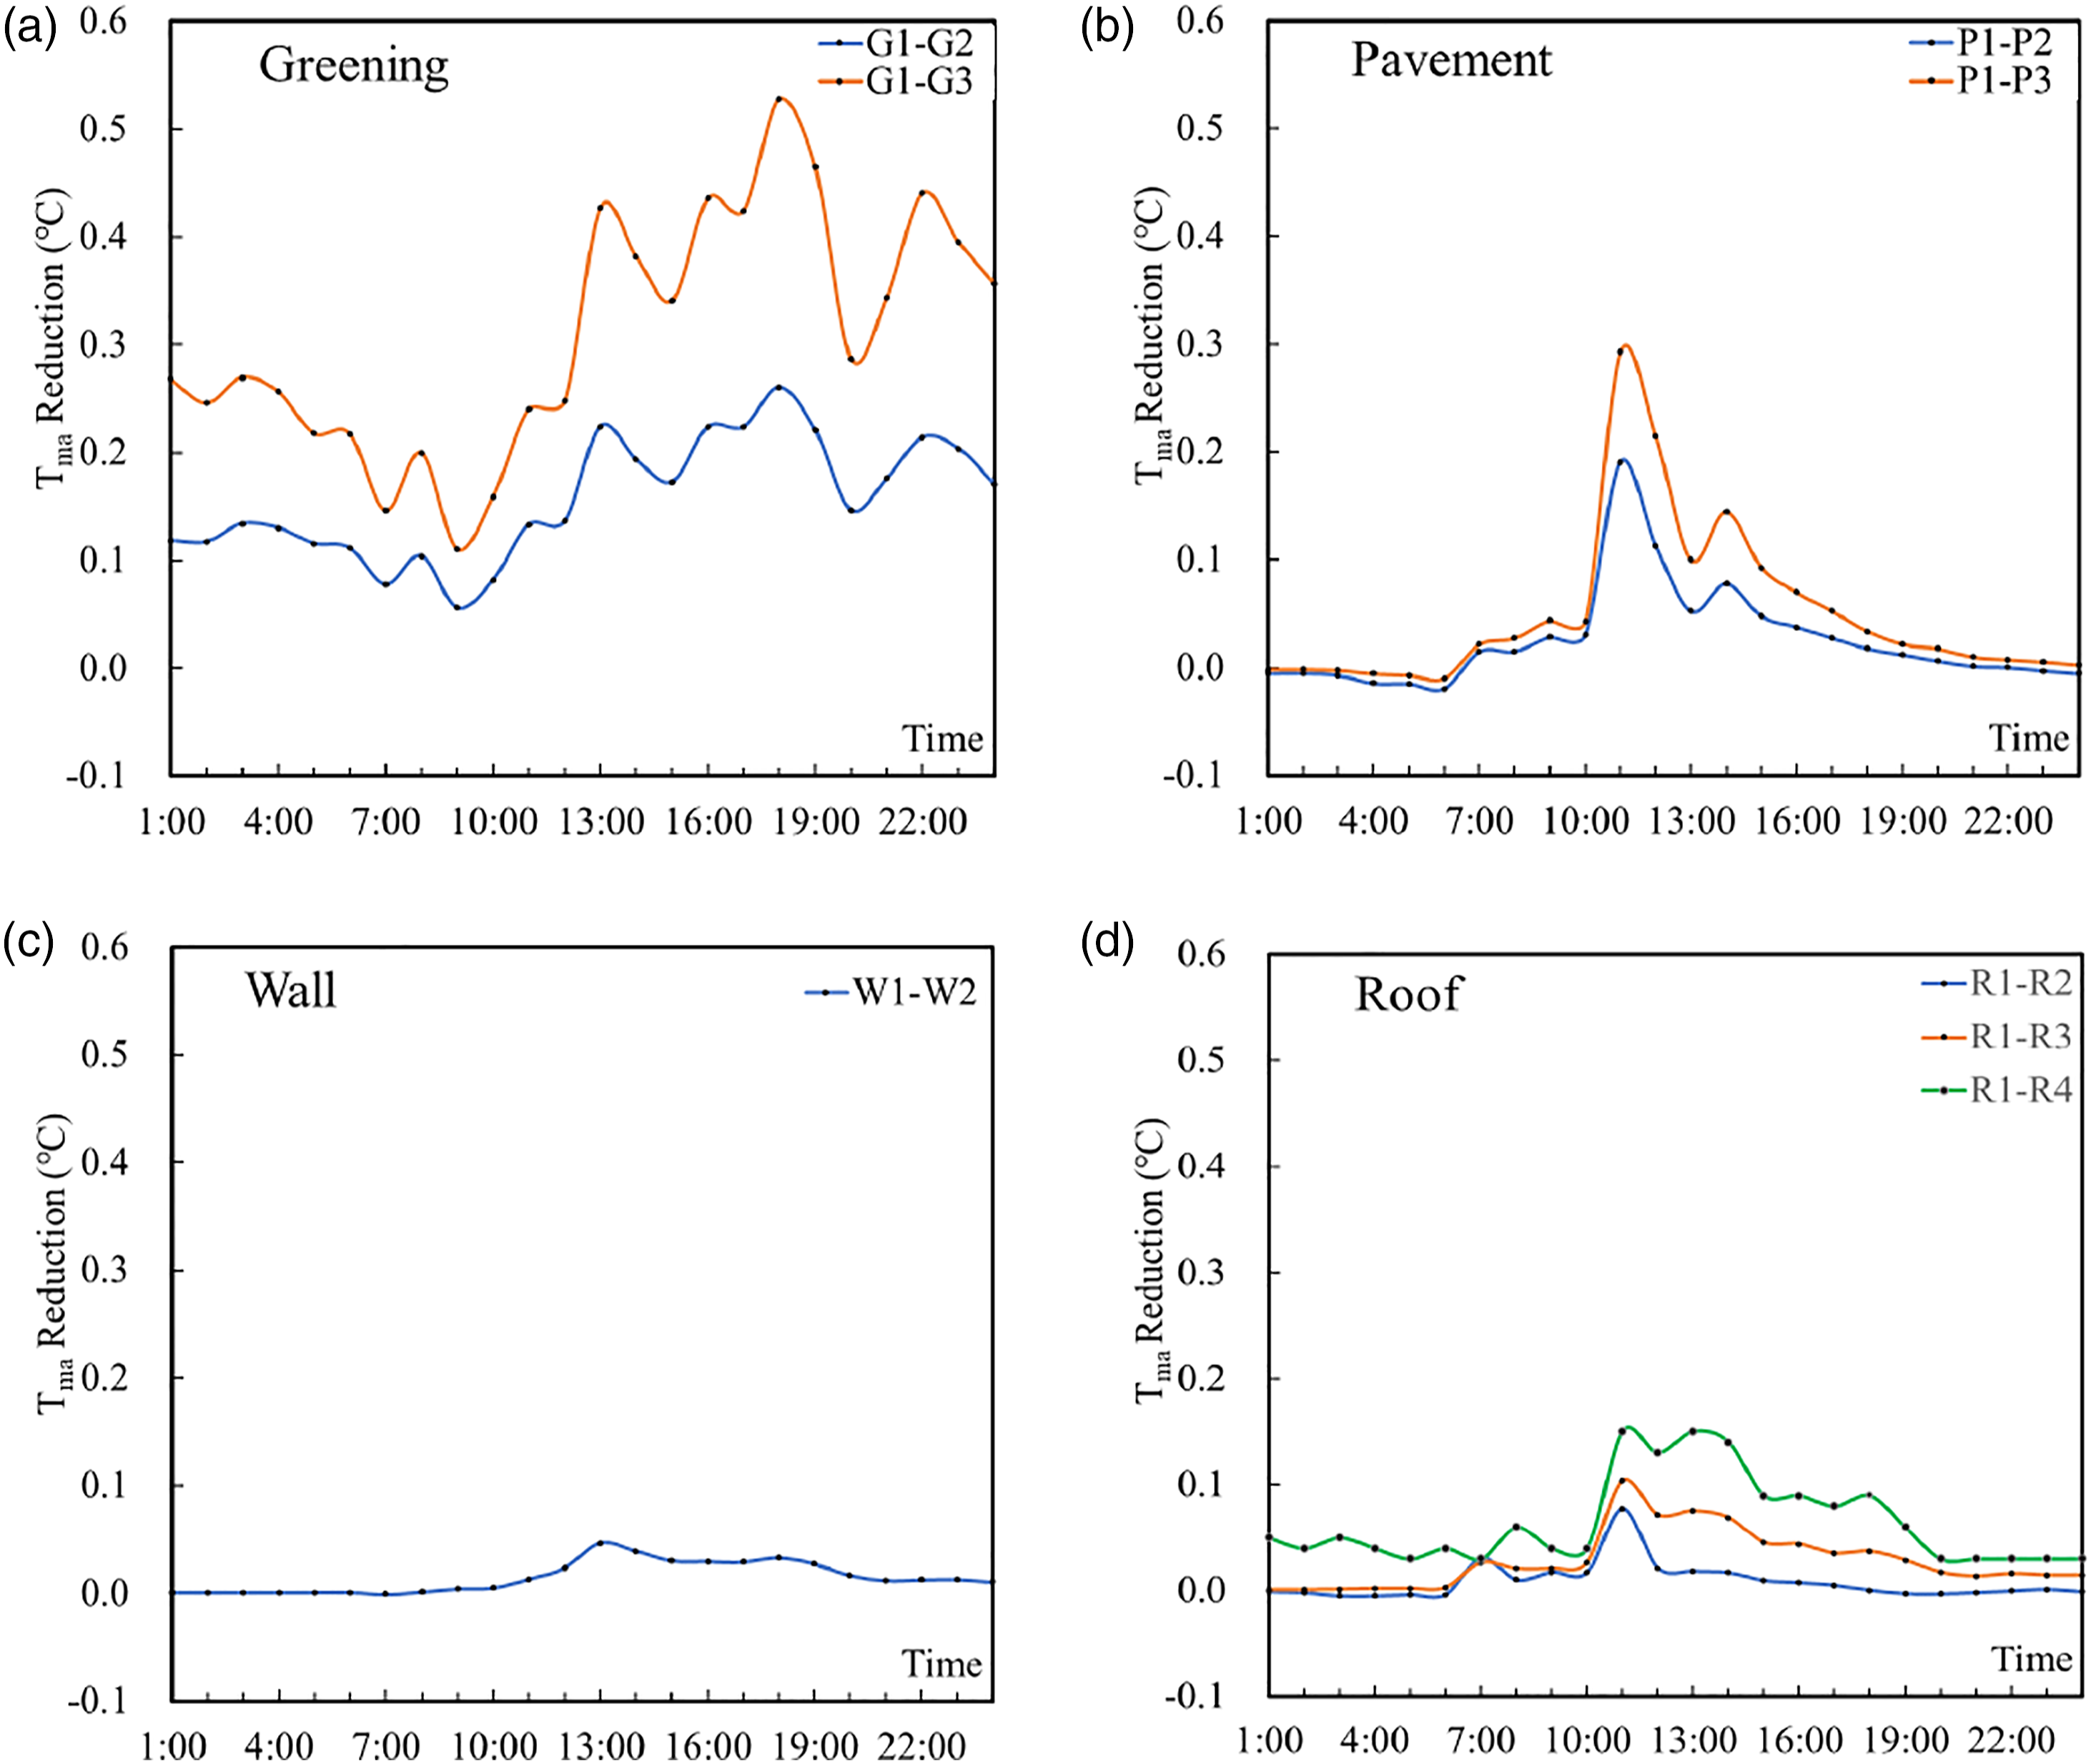
For different pavement cases, case P1 was selected for comparison with case P2 and case P3. The result is shown in Figure 6(b). The ΔTma was significantly enhanced during the period of 11:00–15:00 and the peak of ΔTma occurred at 11:00, corresponding to the peak of the solar radiation. At that time, the maximum variation range of Tma could reach 0.3°C between case P3 and P1. This was highly consistent with the variation trend of the solar radiation for the simulated day, and the higher-reflectivity materials had a higher effect on air temperature. Obviously, the stronger the solar radiation was, the larger the influence of the reflectivity on the air temperature was.
As shown in Figure 6(c), case W1 was selected for comparison with case W2. The figure shows that improving the reflectivity of the wall materials could slightly change the Tma around the building, and the maximum impact was not over 0.05°C and it occurred during periods of high solar radiation. This was due to the high building density of the existing residential district. The radiation reflection affected the underlying surface around the building and the adjacent buildings, although the reflectivity of the building surface was increased. The energy was still absorbed by other objects in the district so that the Tma around the building did not observably decline.
As shown in Figure 6(d), case R1 was selected for comparison with cases R2, R3 and R4. The figure shows that improving the reflectivity of the roof could also reduce the Tma around the building. The effect was most pronounced at 11:00, which was also the time of the strongest solar radiation. Similar to changing the material reflectivity of the pavement, the change in the air temperature was significantly positively correlated with solar radiation when the reflectivity of the roof materials was increased. For the R4 with roof greening, the effect on the air temperature was more evident in the afternoon and weaker in the morning. This was because the simulated afternoon temperature was higher and the solar radiation was stronger, and the transpiration of plants increased with the rise in the temperature and the solar radiation.
Maximum average air temperature reduction
For the four single strategies, the largest ΔTma values occurred between G3 and G1, P3 and P1, W2 and W1, and R4 and R1, respectively. As shown in Figure 7, the ΔTma throughout the day was compared with the high-temperature period from 14:00 to 21:00 (background temperature above 30°C). The ground greening had the most obvious effect on the air temperature, followed by the roof, pavement and wall. For the ground greening, the Tma around the building declined by 0.31°C throughout the day and it was reduced by 0.40°C during the high-temperature period. The mean cooling effect of each strategy was always higher during the high-temperature period than during the entire day, which had a positive effect on the extremely high-temperature days in summer. The maximum Tma reduction differences of the four single strategies, for both 24 h and hot hours.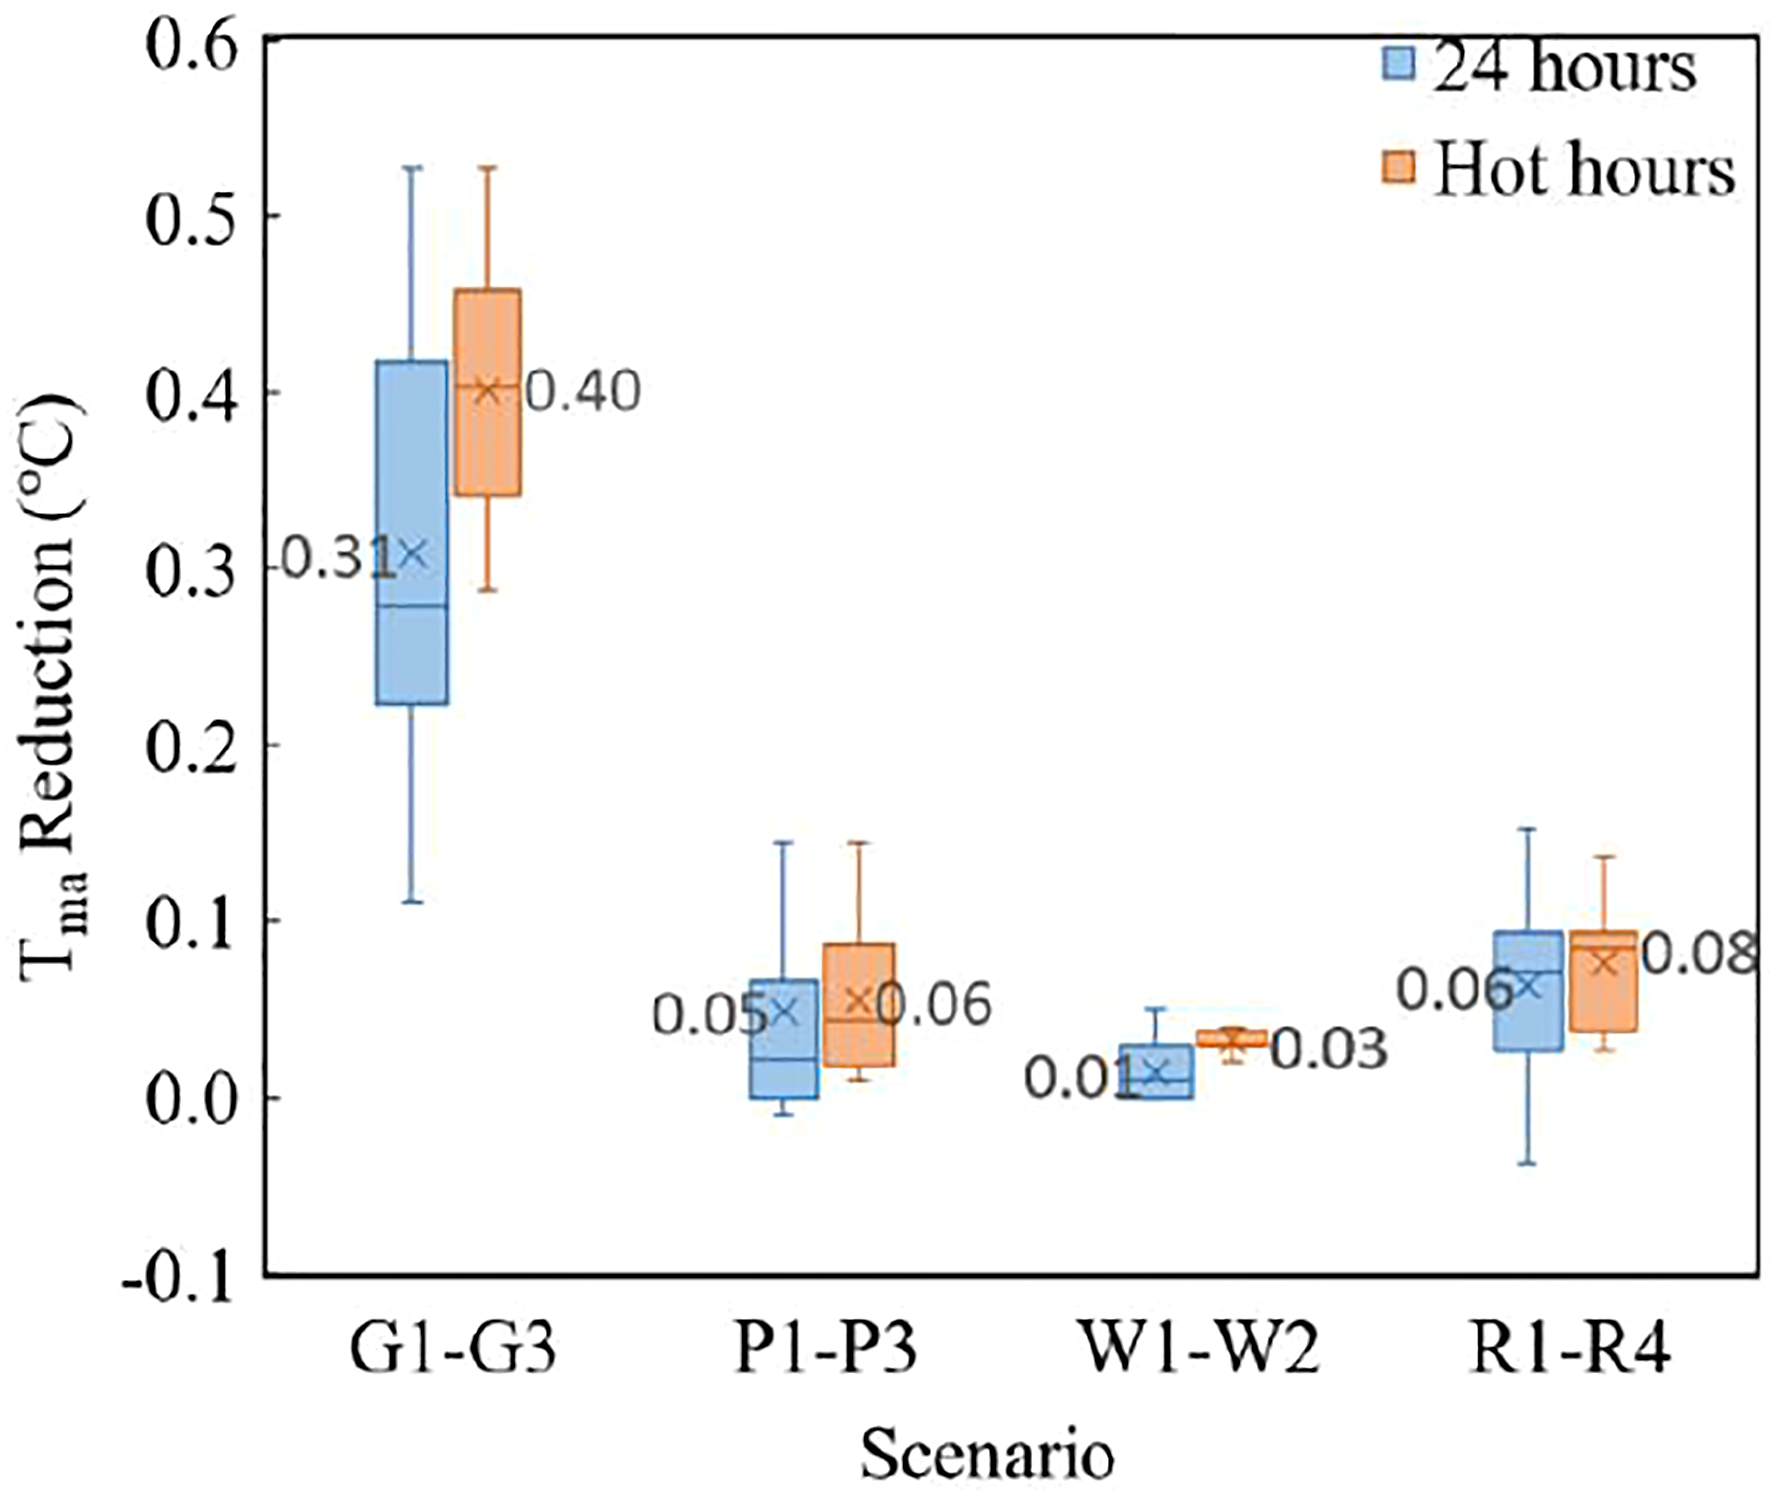
The ΔTma produced by the change of the roof material reflectivity was three times that of the ΔTma for the case of the wall with a similar change, although the roof occupied a small area of the building surface. This was because the roof reflected most of the radiation directly back to the sky, but the wall reflected more radiation back to the residential district.
The impact of dual-retrofit strategy combination
The previous section described the effect of common single-retrofit strategies on the air temperature around the building. However, these strategies often involved multiple retrofit strategies at the same time in the existing residential district. Therefore, the influence of these two retrofit strategies on the air temperature around the building was analysed. First, the air temperature during the whole day and during the high-temperature period with the dual-retrofit strategy combination were calculated. Second, the maximum temperature reduction caused by changing parameters in the dual-retrofit strategy combination was compared. Finally, the individual effects of the two strategies were added together and compared with the effect on the air temperature when these strategies were applied at the same time to explore whether the effect of these two strategies on reducing the air temperature around the building were reinforced or weakened.
Average air temperature of dual-retrofit strategy
The combination of four single strategies generated six dual-retrofit strategies in total. Figure 8 shows the mean air temperature around the building for different dual-retrofit strategy scenarios. When we focused on the mean value of the whole day and during the high-temperature period, the scenarios with the lowest Tma were the combination of scenarios with the most significant influence on the single-retrofit strategy temperature. The scenarios with the lowest Tma in different combinations were G3P3, G3W2, G3R4, P3W2, P3R4 and W2R4. The average air temperature around the building for the six dual-strategies.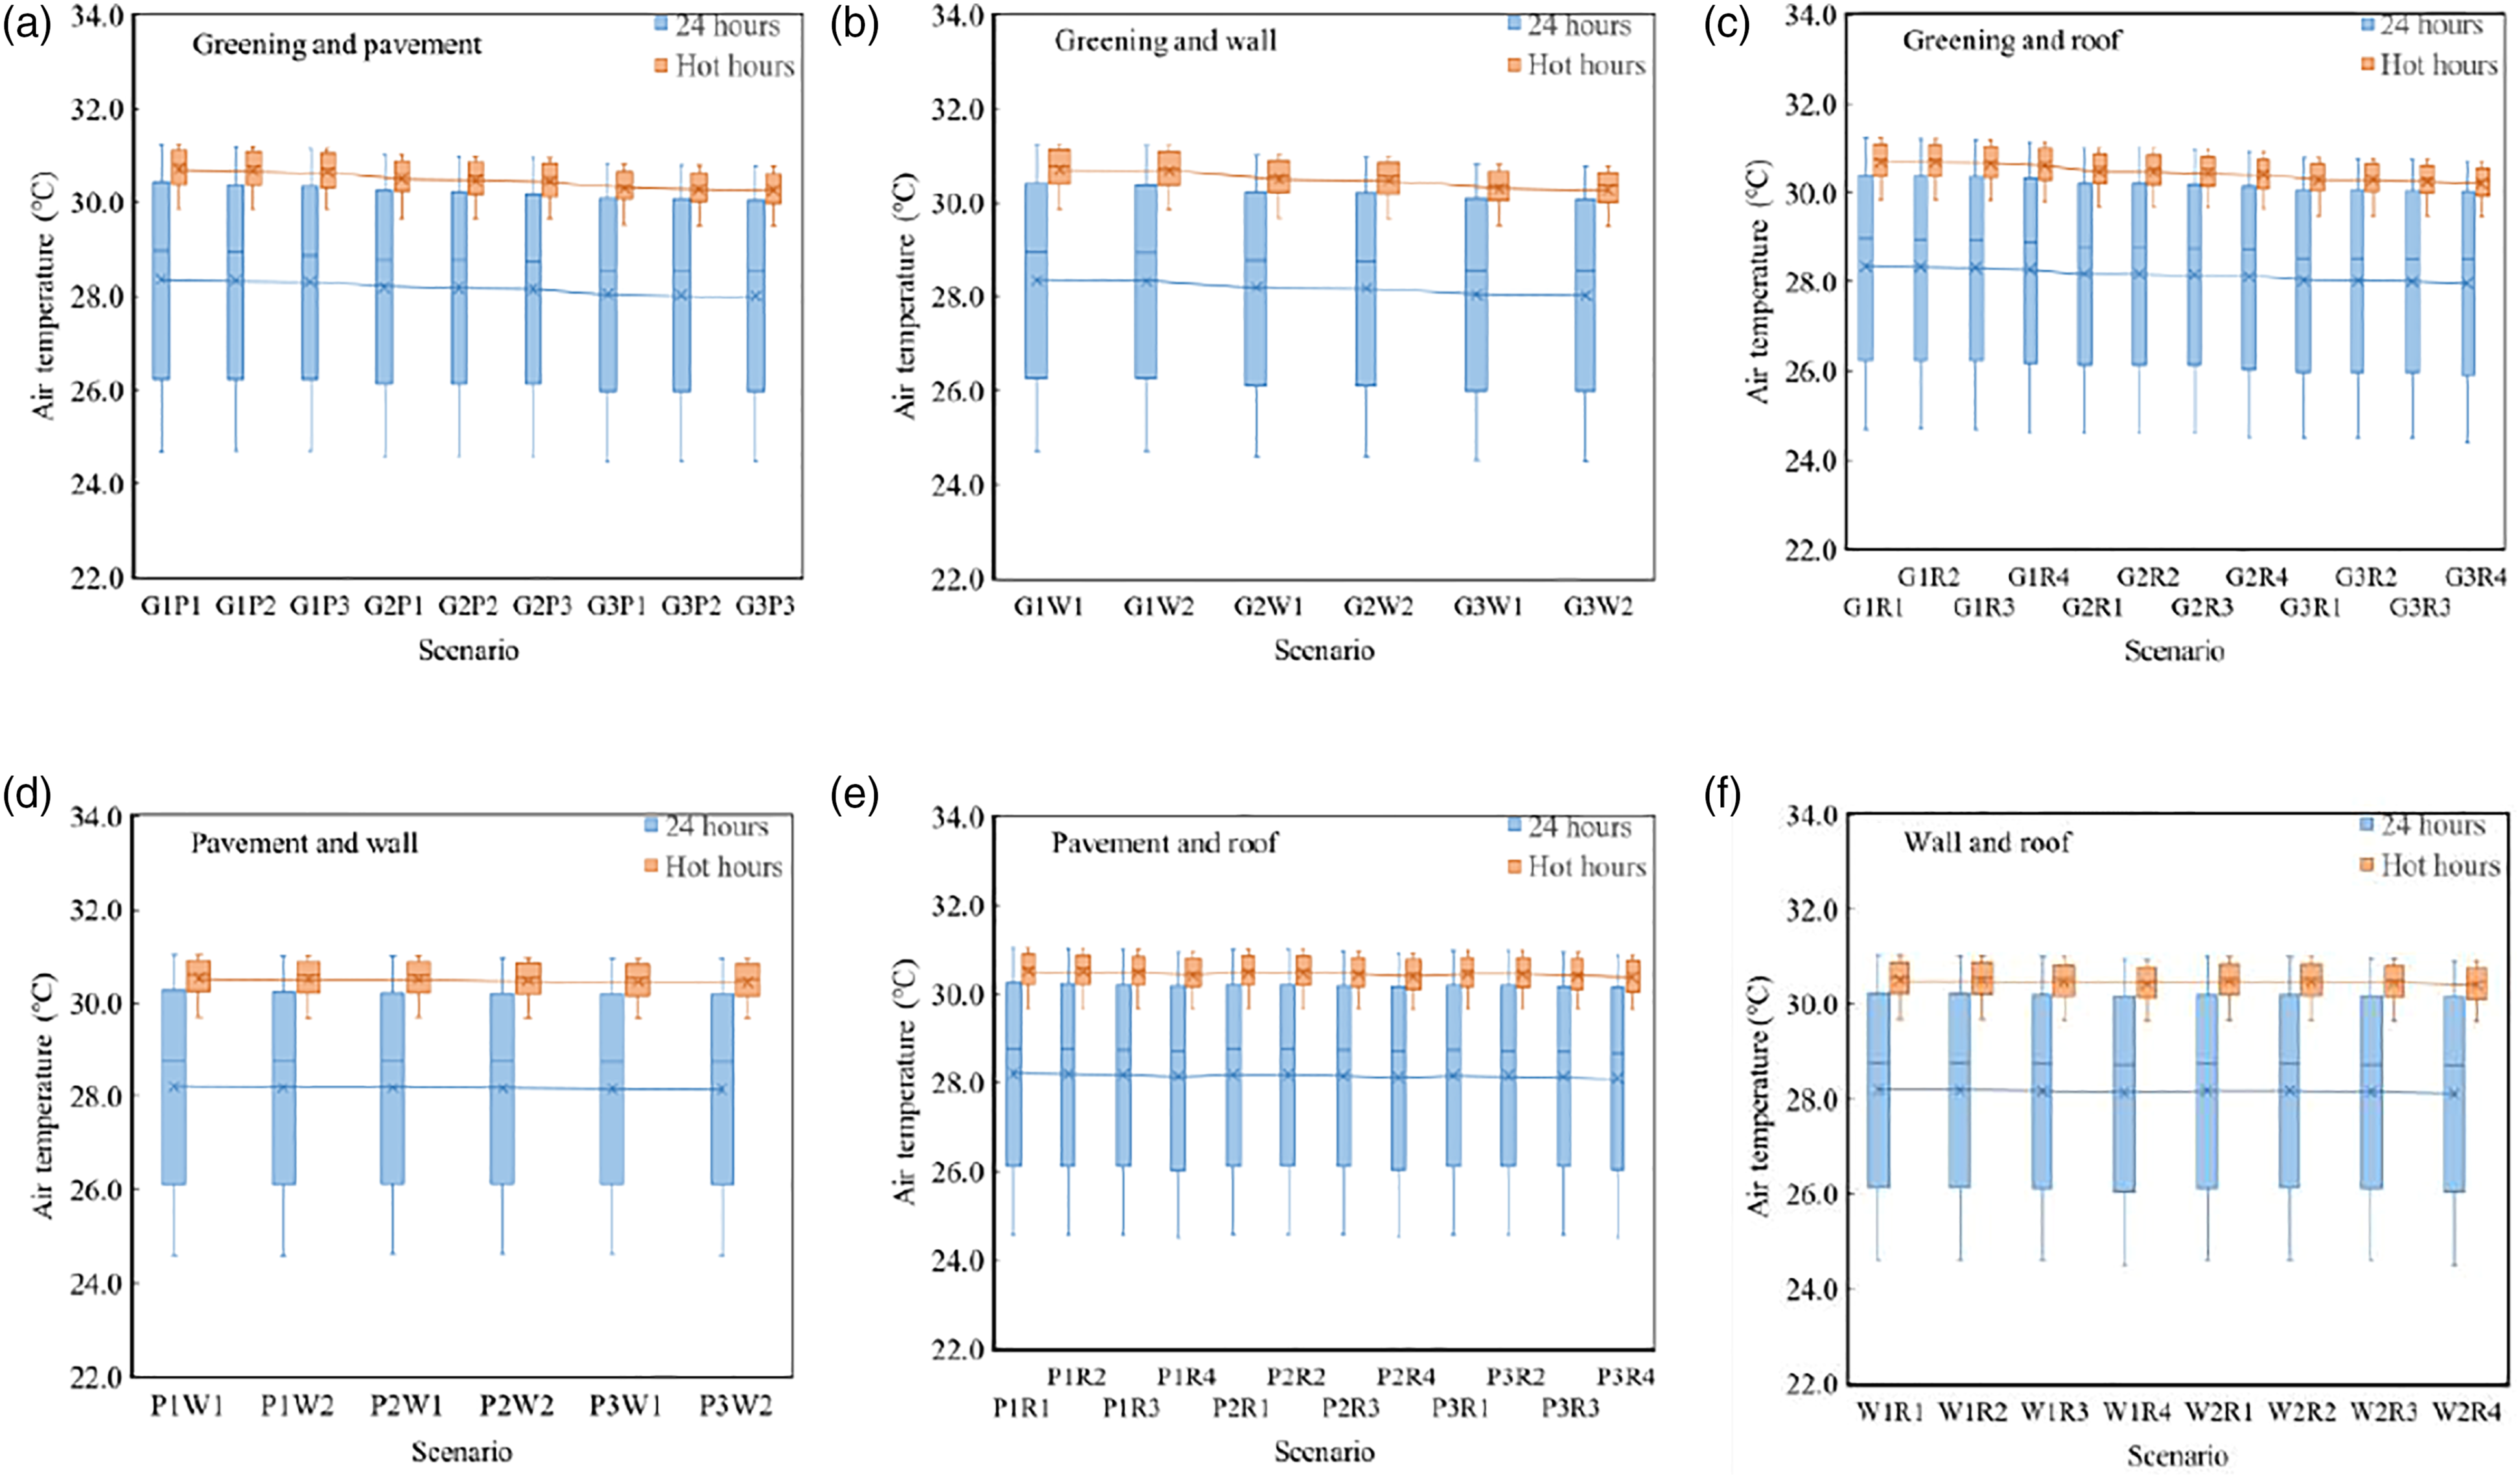
Maximum average air temperature reduction
Figure 9 shows the maximum ΔTma under the six dual-retrofit strategies. The Tma for the whole day and the high-temperature period were focused on. The most evident ΔTma was the combination of G and R. By comparing G3R4 and G1R1, the ΔTma around the building could achieve 0.38°C for the entire day and 0.48°C during high-temperature periods. The smallest ΔTma was the combination of P and W. By comparing P3W2 and P1W1, the ΔTma around the building could only achieve 0.06°C throughout the day and 0.08°C during the high-temperature periods. Strategies with greening had a more noticeable impact on the air temperature. Three combination strategies with ground greening could produce a ΔTma of more than 0.3°C for the entire day and nearly 0.5°C during the high-temperature periods. Similar to the single-retrofit strategy, the ΔTma during the high-temperature period was always higher than that for the entire day for the dual-retrofit strategy. The maximum Tma reduction differences produced by six dual-retrofit strategies, during both 24 h and hot hours.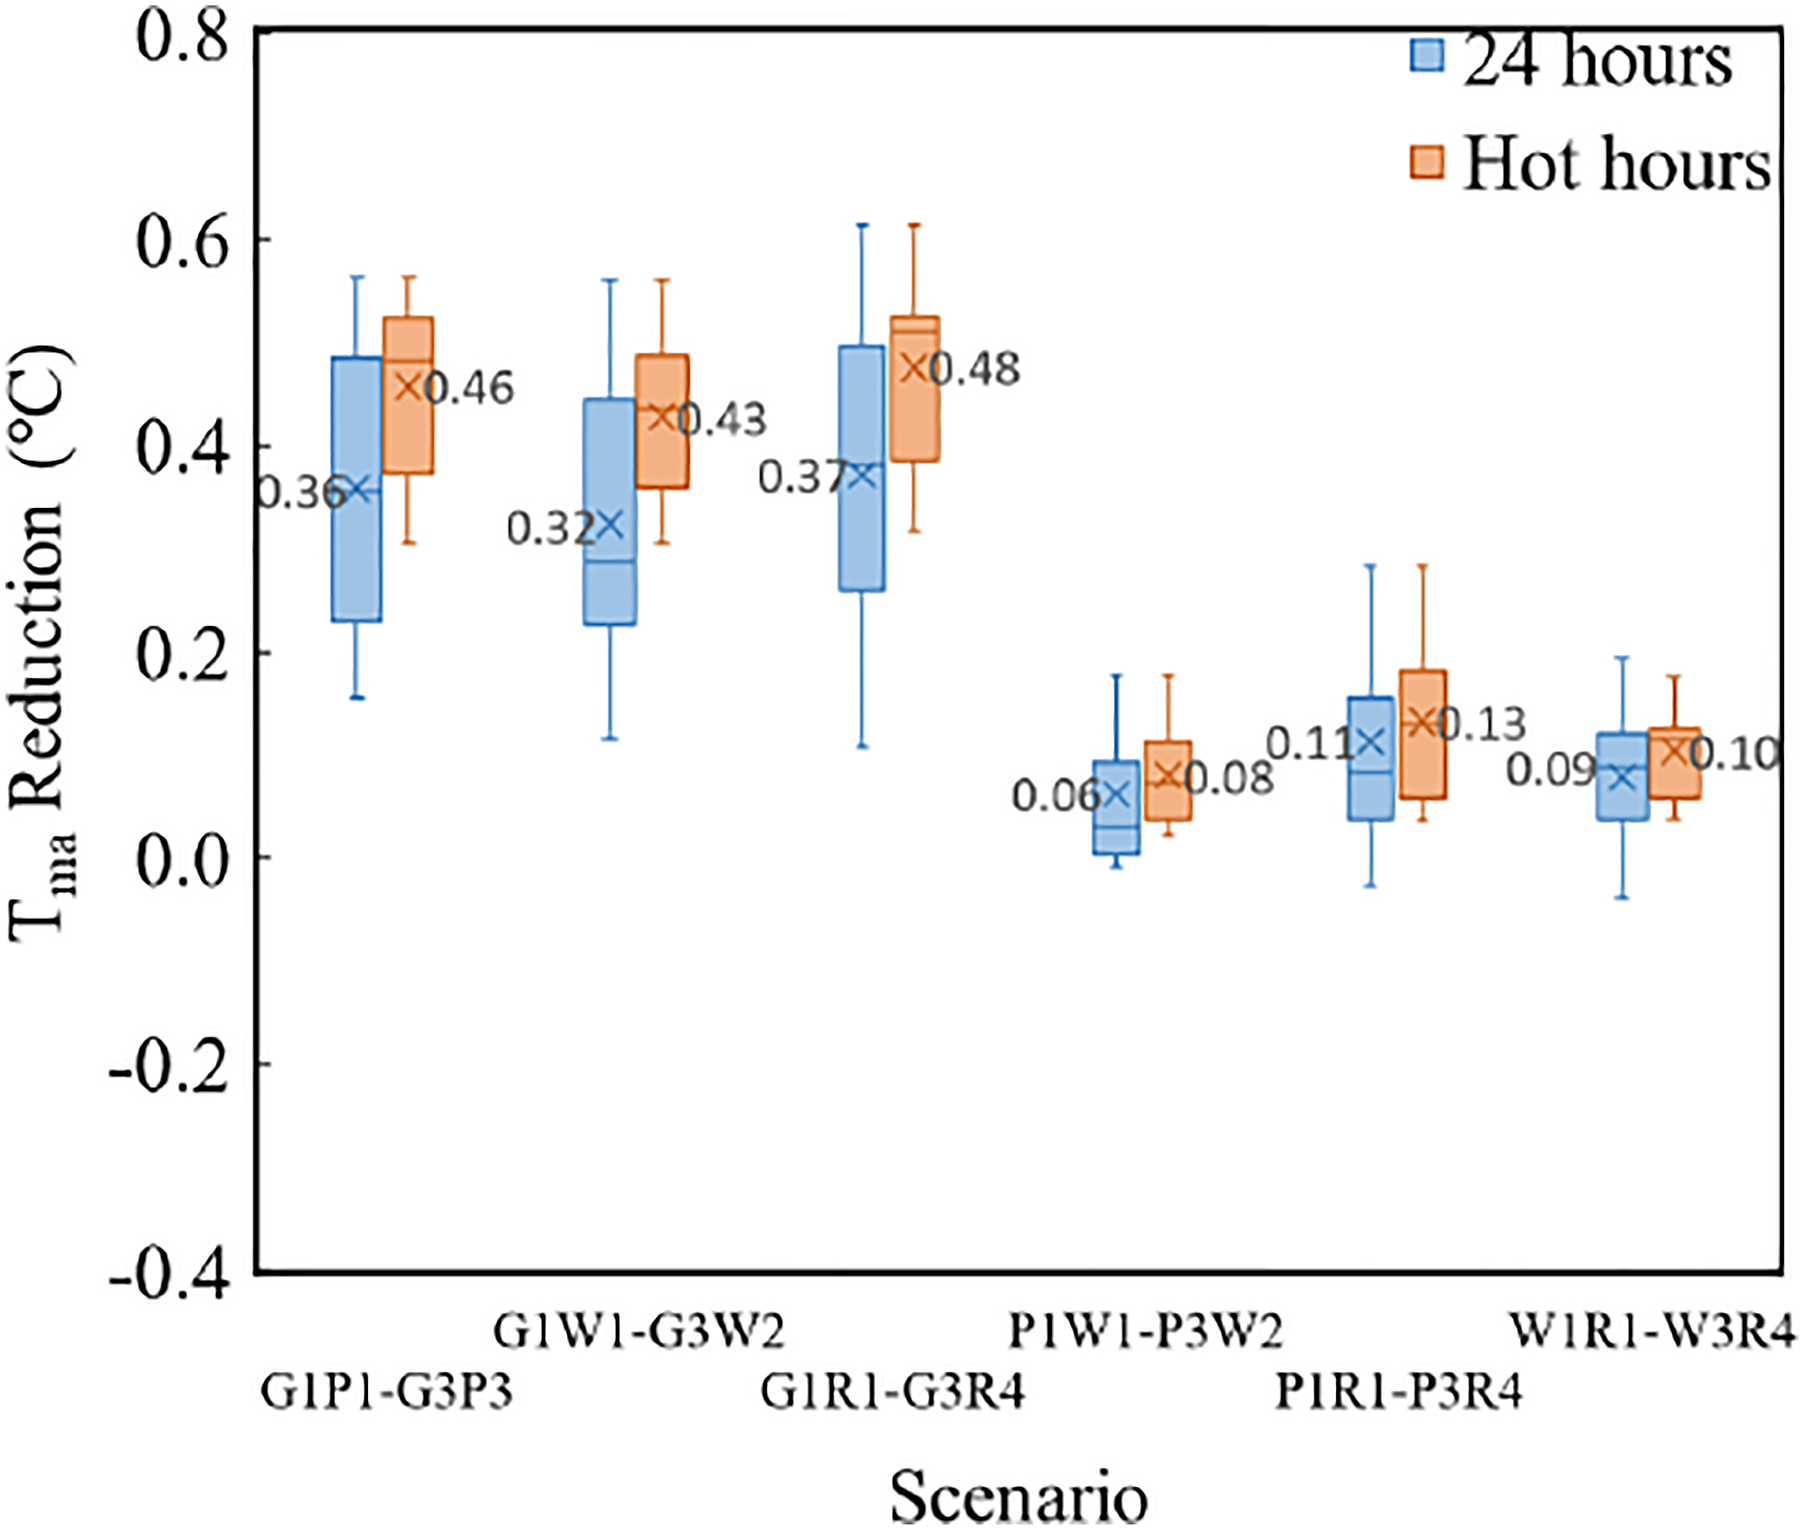
For the ΔTma of the entire day, the pavement and roof strategies had similar maximum influences on the temperature in the single-retrofit strategy. However, when the wall was combined with the pavement and the roof, the ΔTma was different. This meant that when two strategies were combined, the influence of one strategy on the temperature changed with another.
Coupling effect of dual-retrofit strategy
This section describes how the sum of the temperature reduction caused by the change of one strategy’s parameters was compared with the temperature reduction caused by the change of the two strategies’ parameters at the same time, in order to explore the cooling effect of the two strategies adopted at the same time and adopted alone.
Influence of changing strategy’s parameters individually and together on temperature reduction.
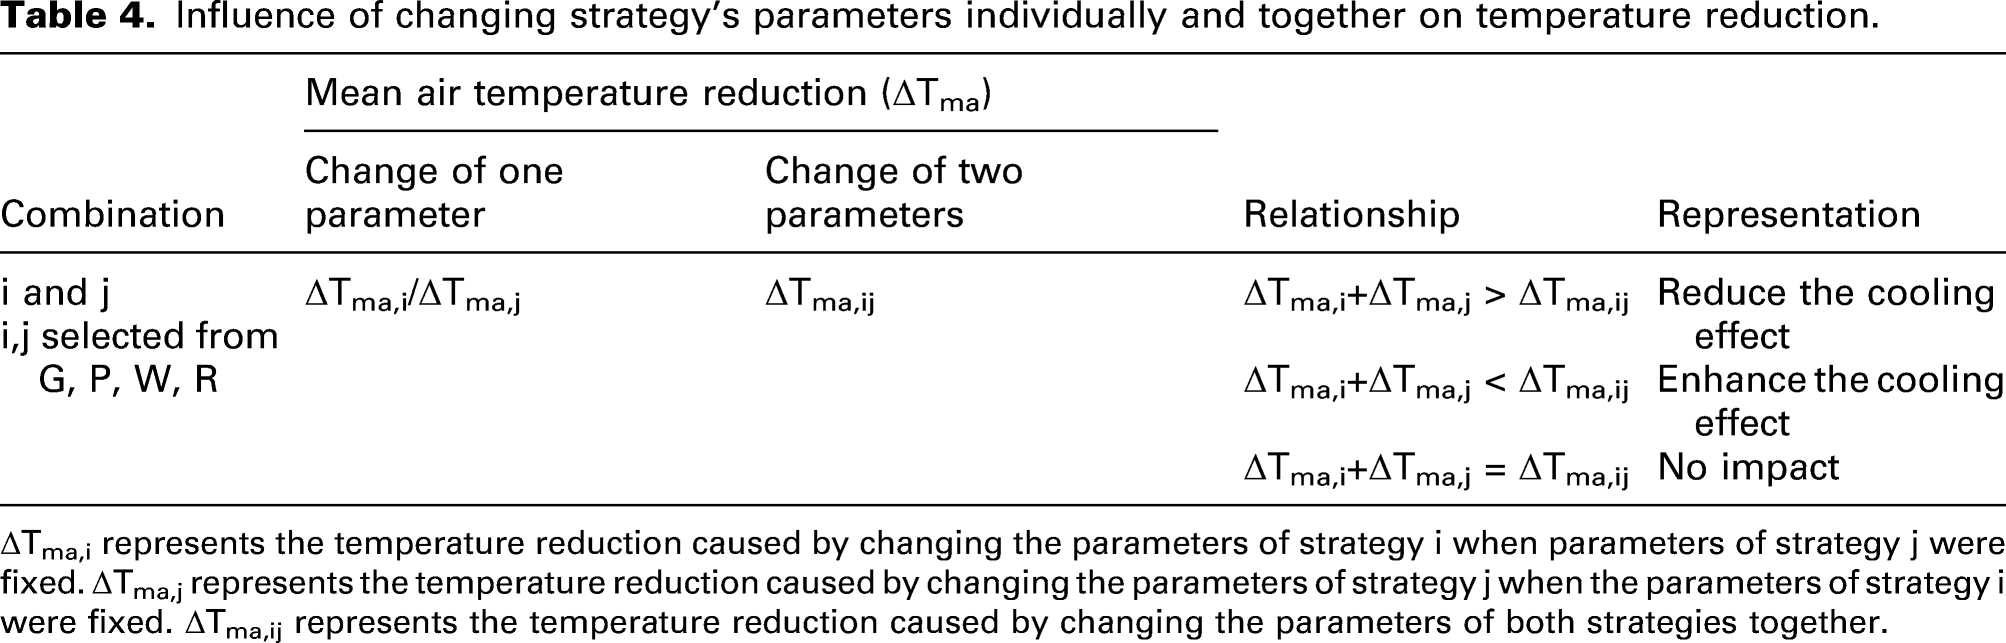
ΔTma,i represents the temperature reduction caused by changing the parameters of strategy i when parameters of strategy j were fixed. ΔTma,j represents the temperature reduction caused by changing the parameters of strategy j when the parameters of strategy i were fixed. ΔTma,ij represents the temperature reduction caused by changing the parameters of both strategies together.
Ground greening and pavement
Figure 10(a) shows the ΔTma for the dual-retrofit strategy of ground greening and the pavement. G1P1–G3P1 represents the ΔTma produced by the ground greening strategy for the same pavement condition. G1P1–G1P3 represents the ΔTma produced by the pavement strategy for the same ground greening condition. The ‘numerical sums’ of G1P1–G3P1 and G1P1–G1P3 were compared with G1P1–G3P3, which represented the ΔTma brought by the combination of the ground greening strategy and the pavement strategy. The sum of G1P1–G3P1 and G1P1–G1P3 was higher than G1P1–G3P3. This meant that increasing the greening rate of the ground and the reflectivity of the pavement materials at the same time could not produce a better effect than the sum of the effects of increasing them, and it was reduced to about 5% of the sum. (a) The Tma reduction caused by the parameters’ change of GP; (b) the Tma reduction generated by G for P1/P3 and by P for G1/G3.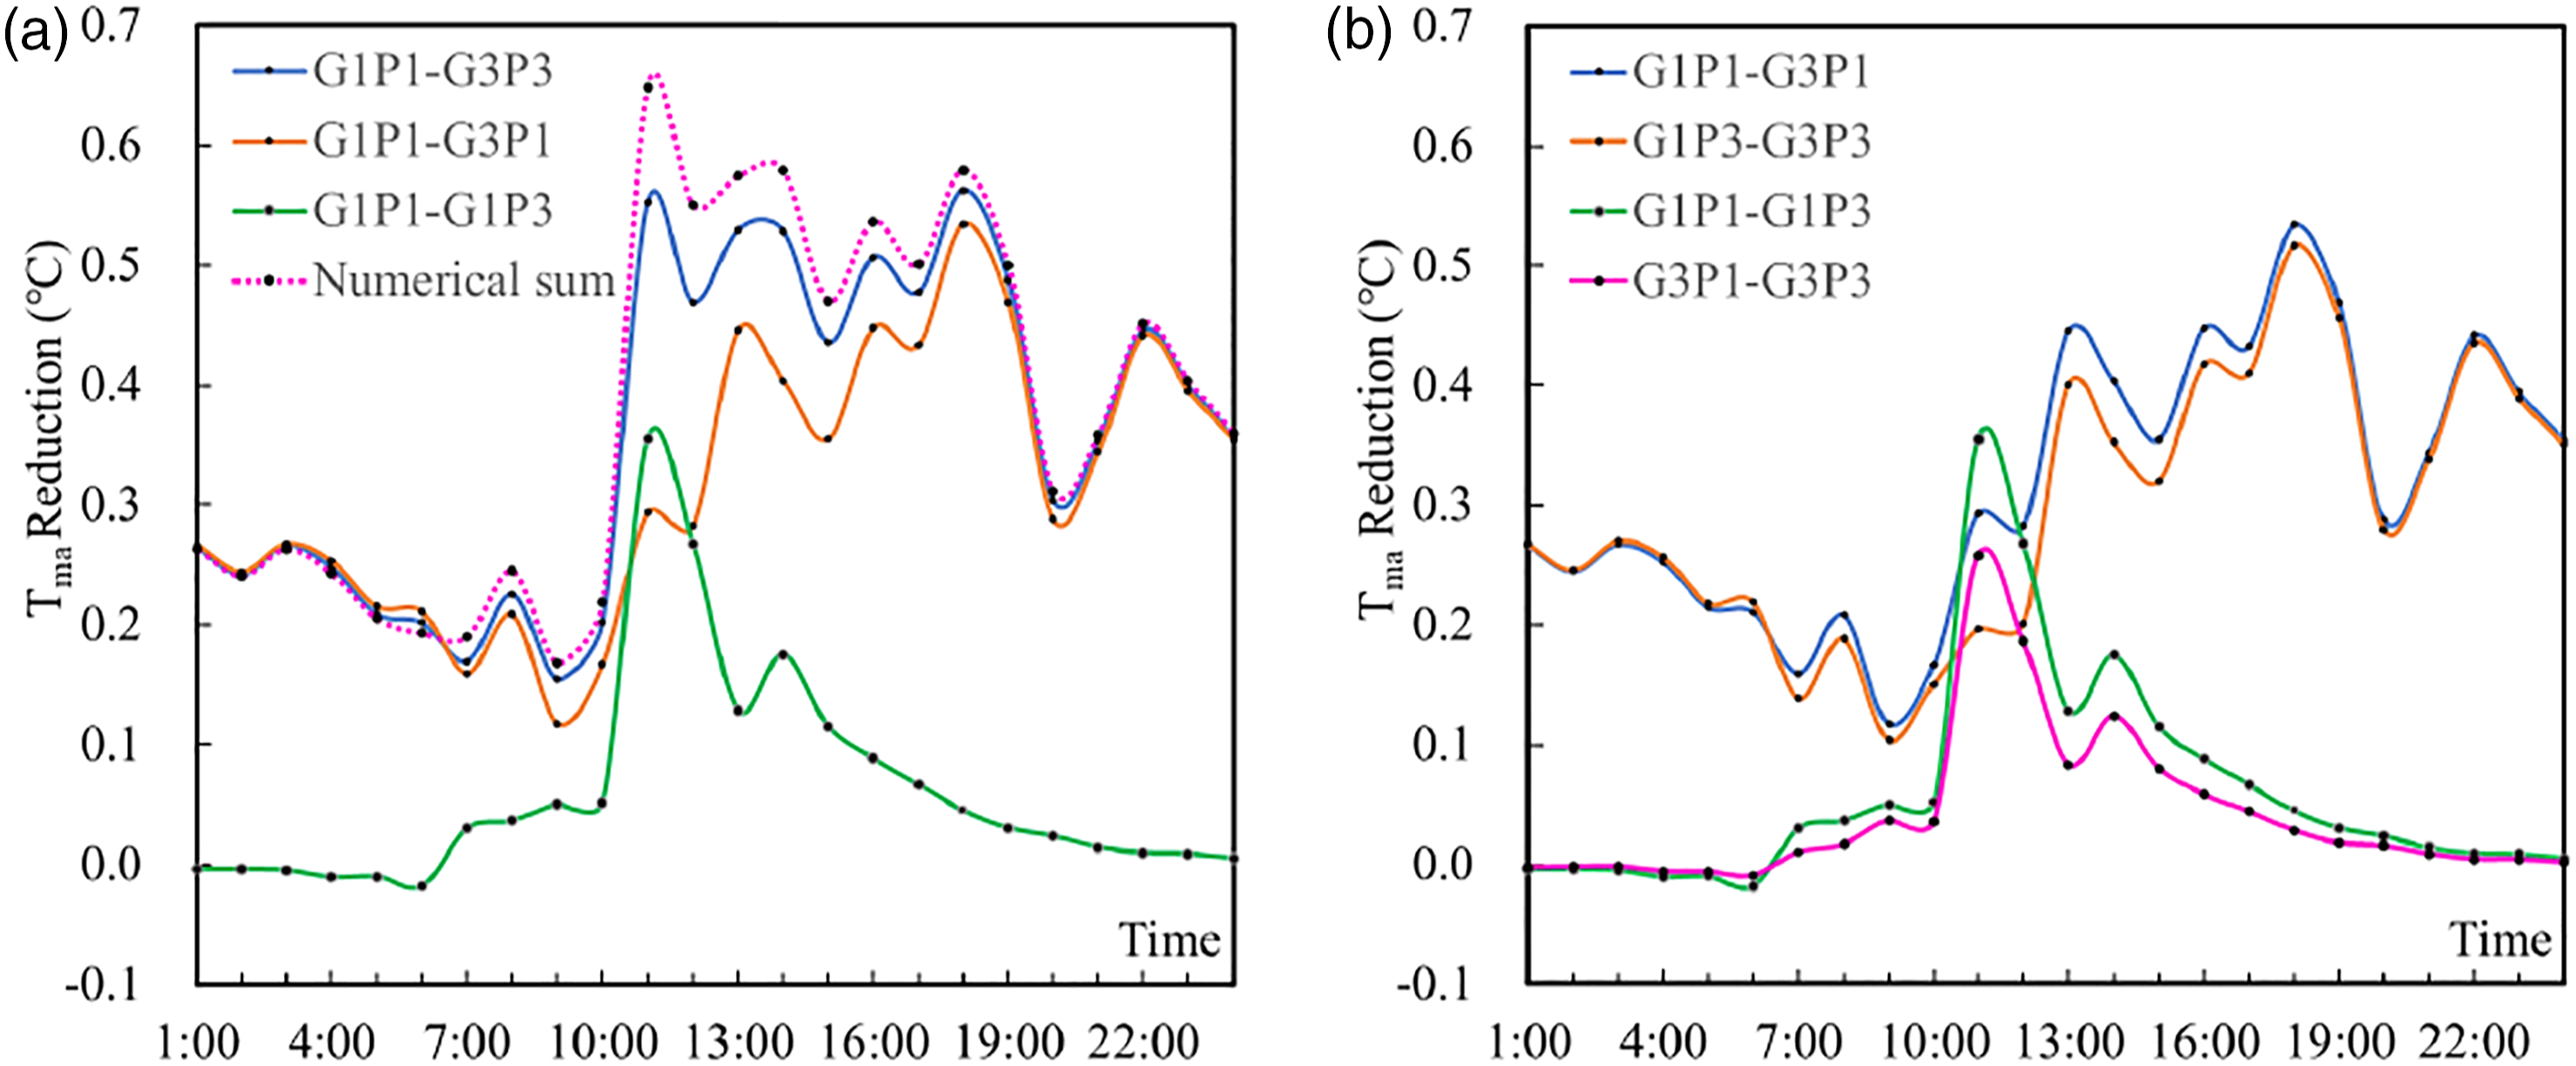
As shown in Figure 10(b), differences in the impact of the increased ground greening on the Tma were compared when pavements were different in G1P1–G3P1 and G1P3–G3P3. Differences in the increasing pavement material reflectivity for Tma when using different ground greening rates were compared for G1P1–G1P3 and G3P1–G3P3. When the reflectivity of the pavement materials was higher, the increase in the ground greening rate on the Tma around the building became weaker. The ΔTma caused by the greening decreased by about 6% from P1 to P3, which was mainly due to the increase in the reflectivity of the pavement materials. This produced a decline in the temperature around the plant, weakening the transpiration of plants, eventually leading to the weakening of the temperature impact. As shown in Figure 10(b), when the cooling effect of P1–P3 was greater throughout the day, the impact of greening on the air temperature was smaller. When the ground greening rate was higher, the influence of increasing the reflectivity of pavement materials on the air temperature also became weaker. From G1 to G3, the ΔTma, which was caused by the reflectivity of pavement materials, was decreased by about 32%. This was because the pavement area was reduced and the shade of trees also reduced the solar radiation obtained by the ground when the greening rate was increased, which ultimately led to the weakening of the effect of the change in the reflectivity of the pavement materials. From both Figure 10(a) or Figure 10(b), the interference with the temperature was more obvious at noon and afternoon when the radiation was intense, and the temperature was high. In summary, when the combination of ground greening and the pavement was adopted, their influence on the temperature was weakened.
Ground greening and wall
For the combination of ground greening and wall conditions, Figure 11(a) shows that the ΔTma of G1W1–G3W2 was close to the ‘numerical sum’ of G1W1–G3W1 and G1W1–G1W2. This showed that there was little difference between the increase in ground greening and the increase in the wall materials’ reflectivity at the same time and separately. (a) The Tma reduction caused by the parameters’ change of GW; (b) the Tma reduction generated by G for W1/W2 and by W for G1/G3.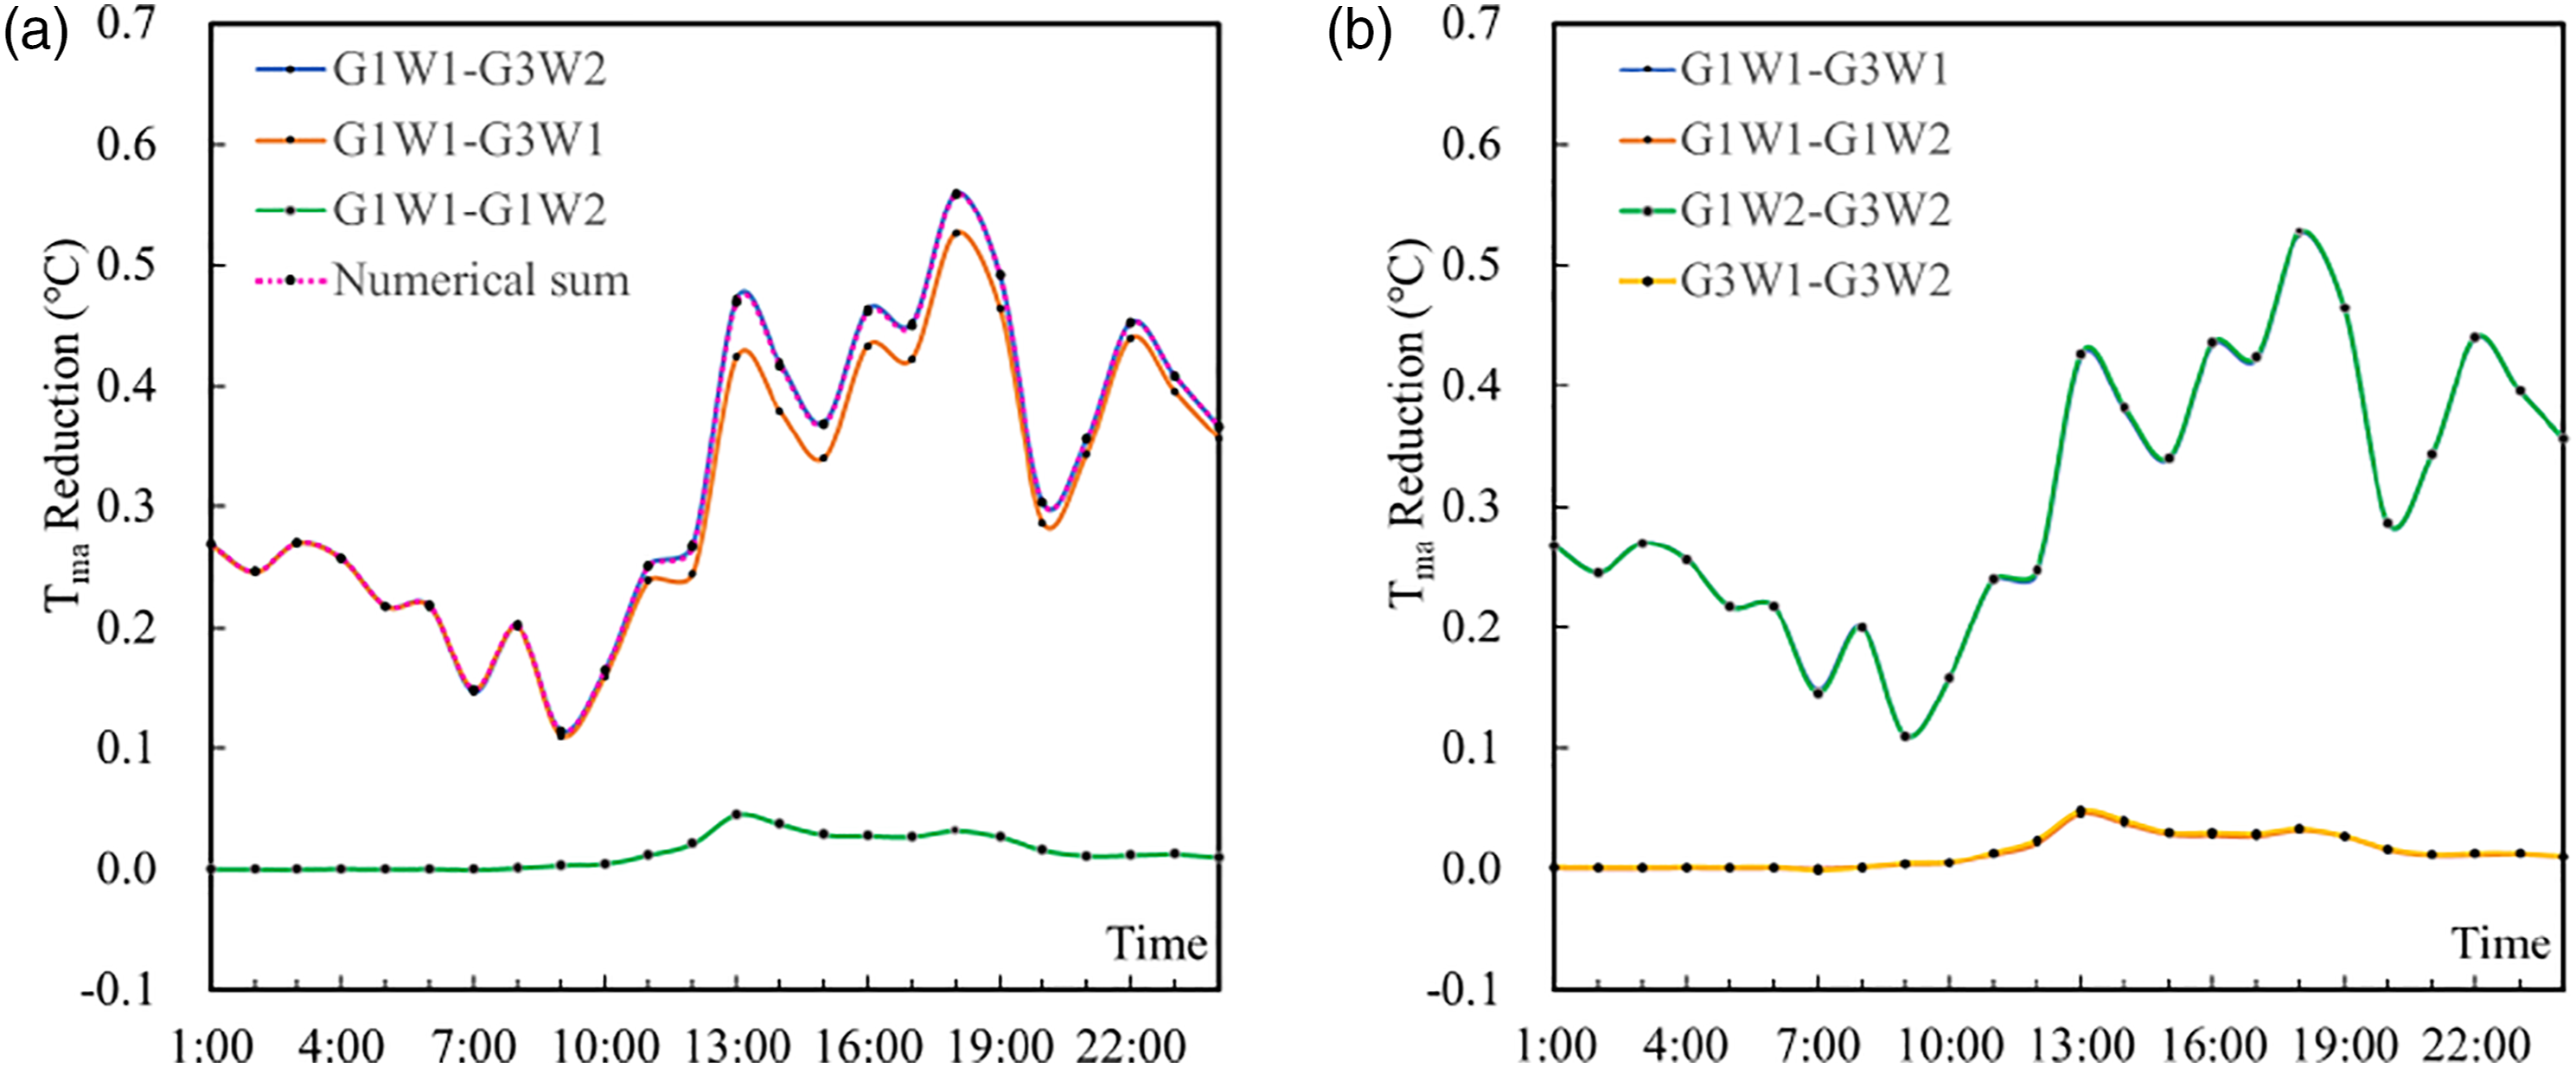
As shown in Figure 11(b), the results had almost no difference, whether the ground greening rate was changed for the same wall case or the reflectivity of the wall material was changed for the same ground greening case.
Ground greening and roof
For the combination of ground greening and roof conditions, Figure 12(a) shows that the ΔTma of G1R1–G3R4 was consistent with the ‘numerical sum’ of G1R1–G3R1 and G1R1–G1R4. This meant that the impact on the air temperature was generally consistent when the ground greening rate and roof greening were combined or adopted separately. (a) The Tma reduction caused by the parameters’ change of GR; (b) the Tma reduction generated by G for R1/R4 and by R for G1/G3.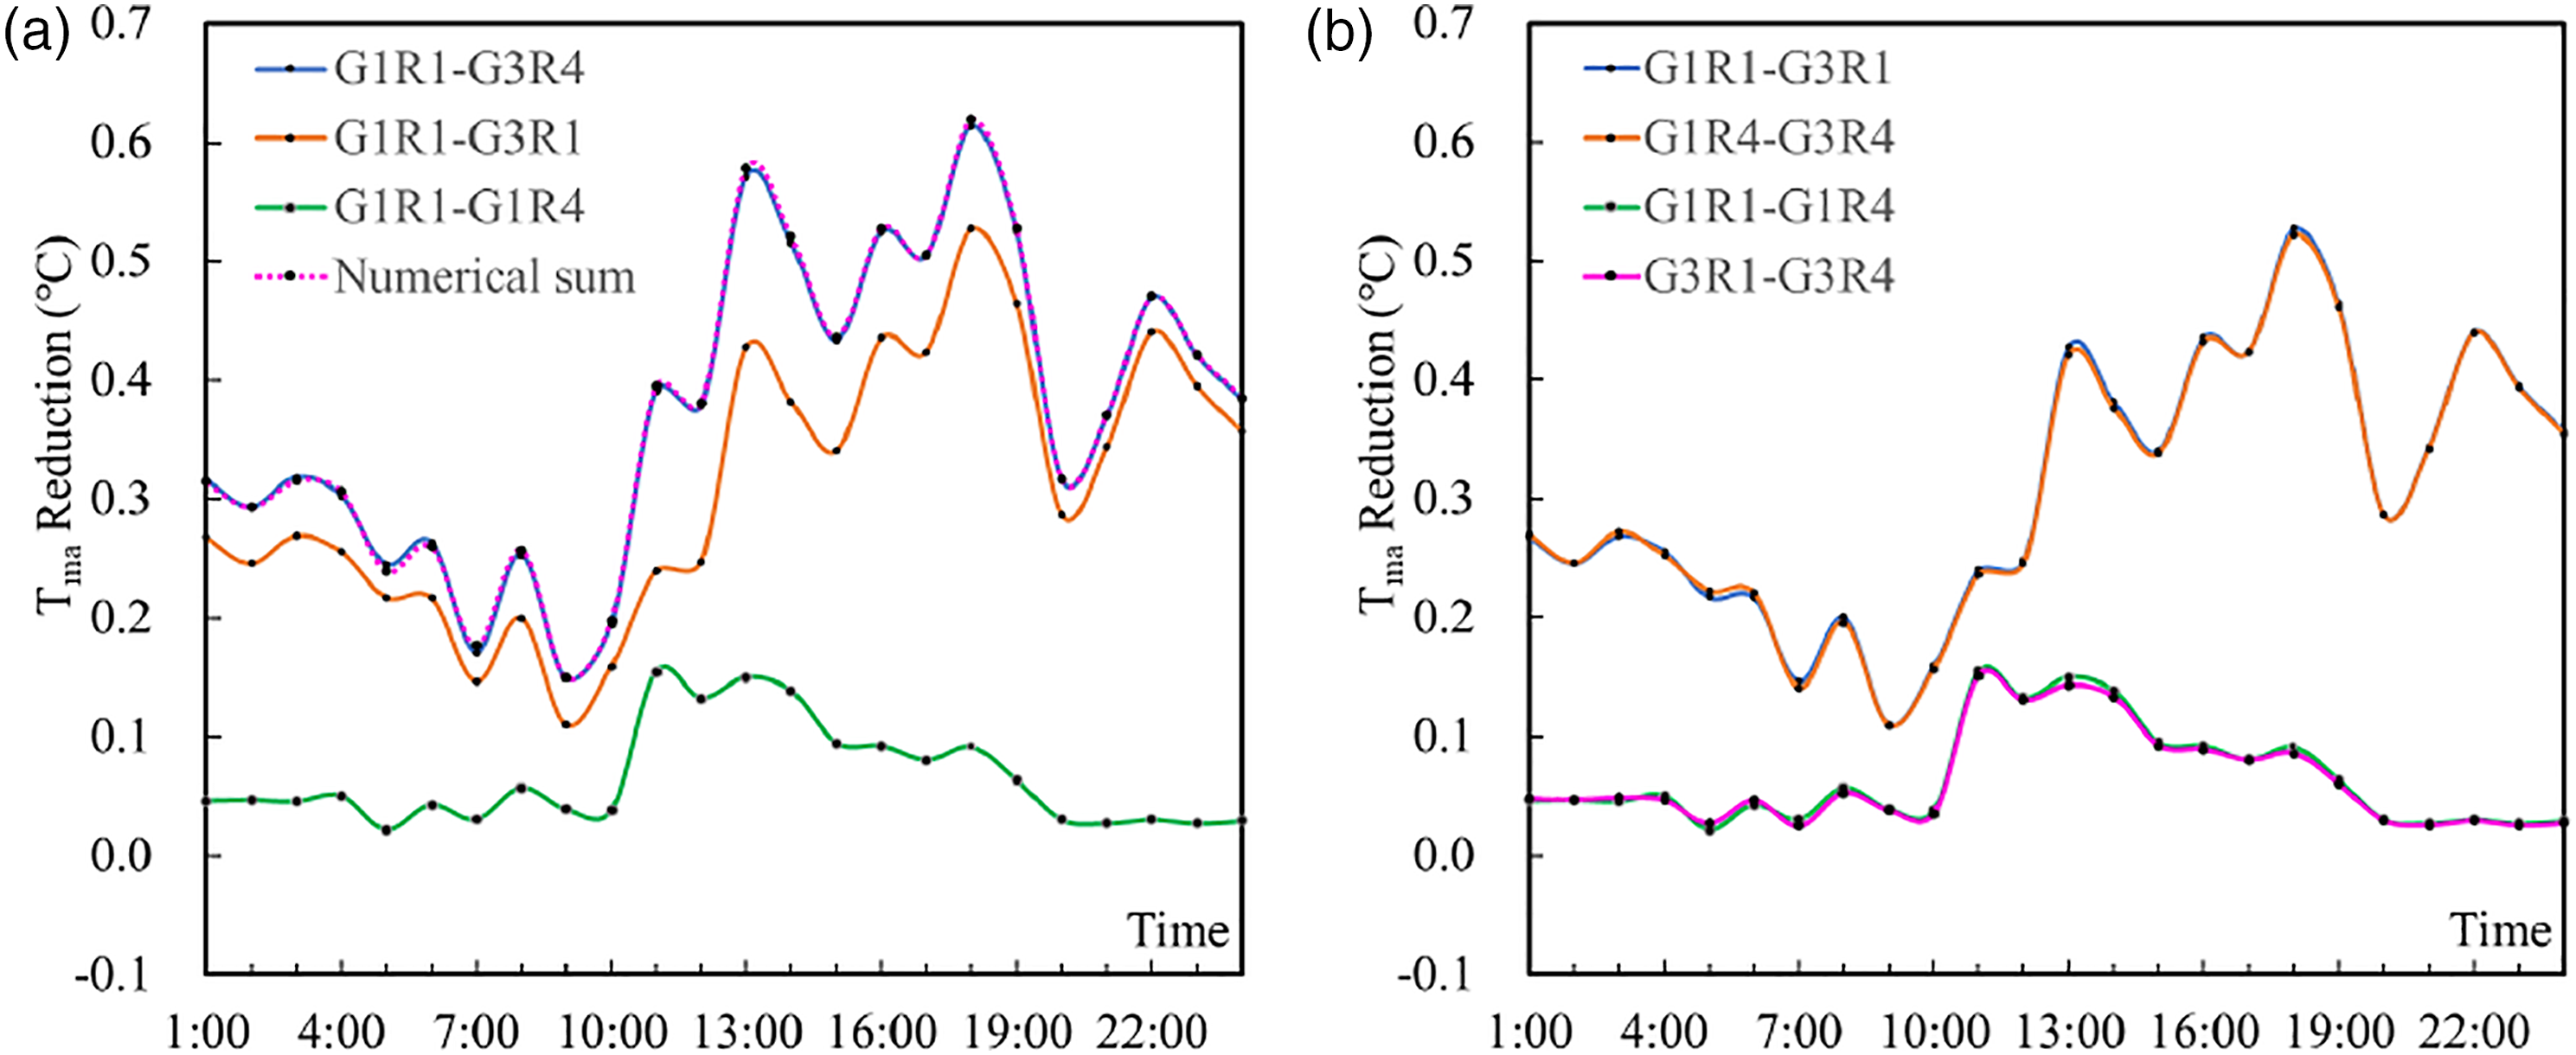
As shown in Figure 12(b), the ground greening and roof conditions had little influence on the ΔTma when they adopted different parameters. The main reason for this was that areas where the two strategies have apparent effects were far apart. When the ground greening rate was added, the temperature change near the roof was less than 0.1°C. Of course, this was also dependent on the height of the building and the trees.
Pavement and wall
For the combination of pavement and wall conditions, Figure 13(a) shows that the ΔTma of P1W1-P3W2 was higher than the “numerical sum” of P1W1-P3W1 and P1W1-P1W2. This meant that, when the reflectivity of the pavement and wall materials were improved, the impact on the temperature was stronger than the sum of the increasing reflectivity of the pavement and wall materials individually. (a) The Tma reduction caused by the parameters’ change of PW; (b) the Tma reduction generated by P for W1/W2 and by W for P1/P3.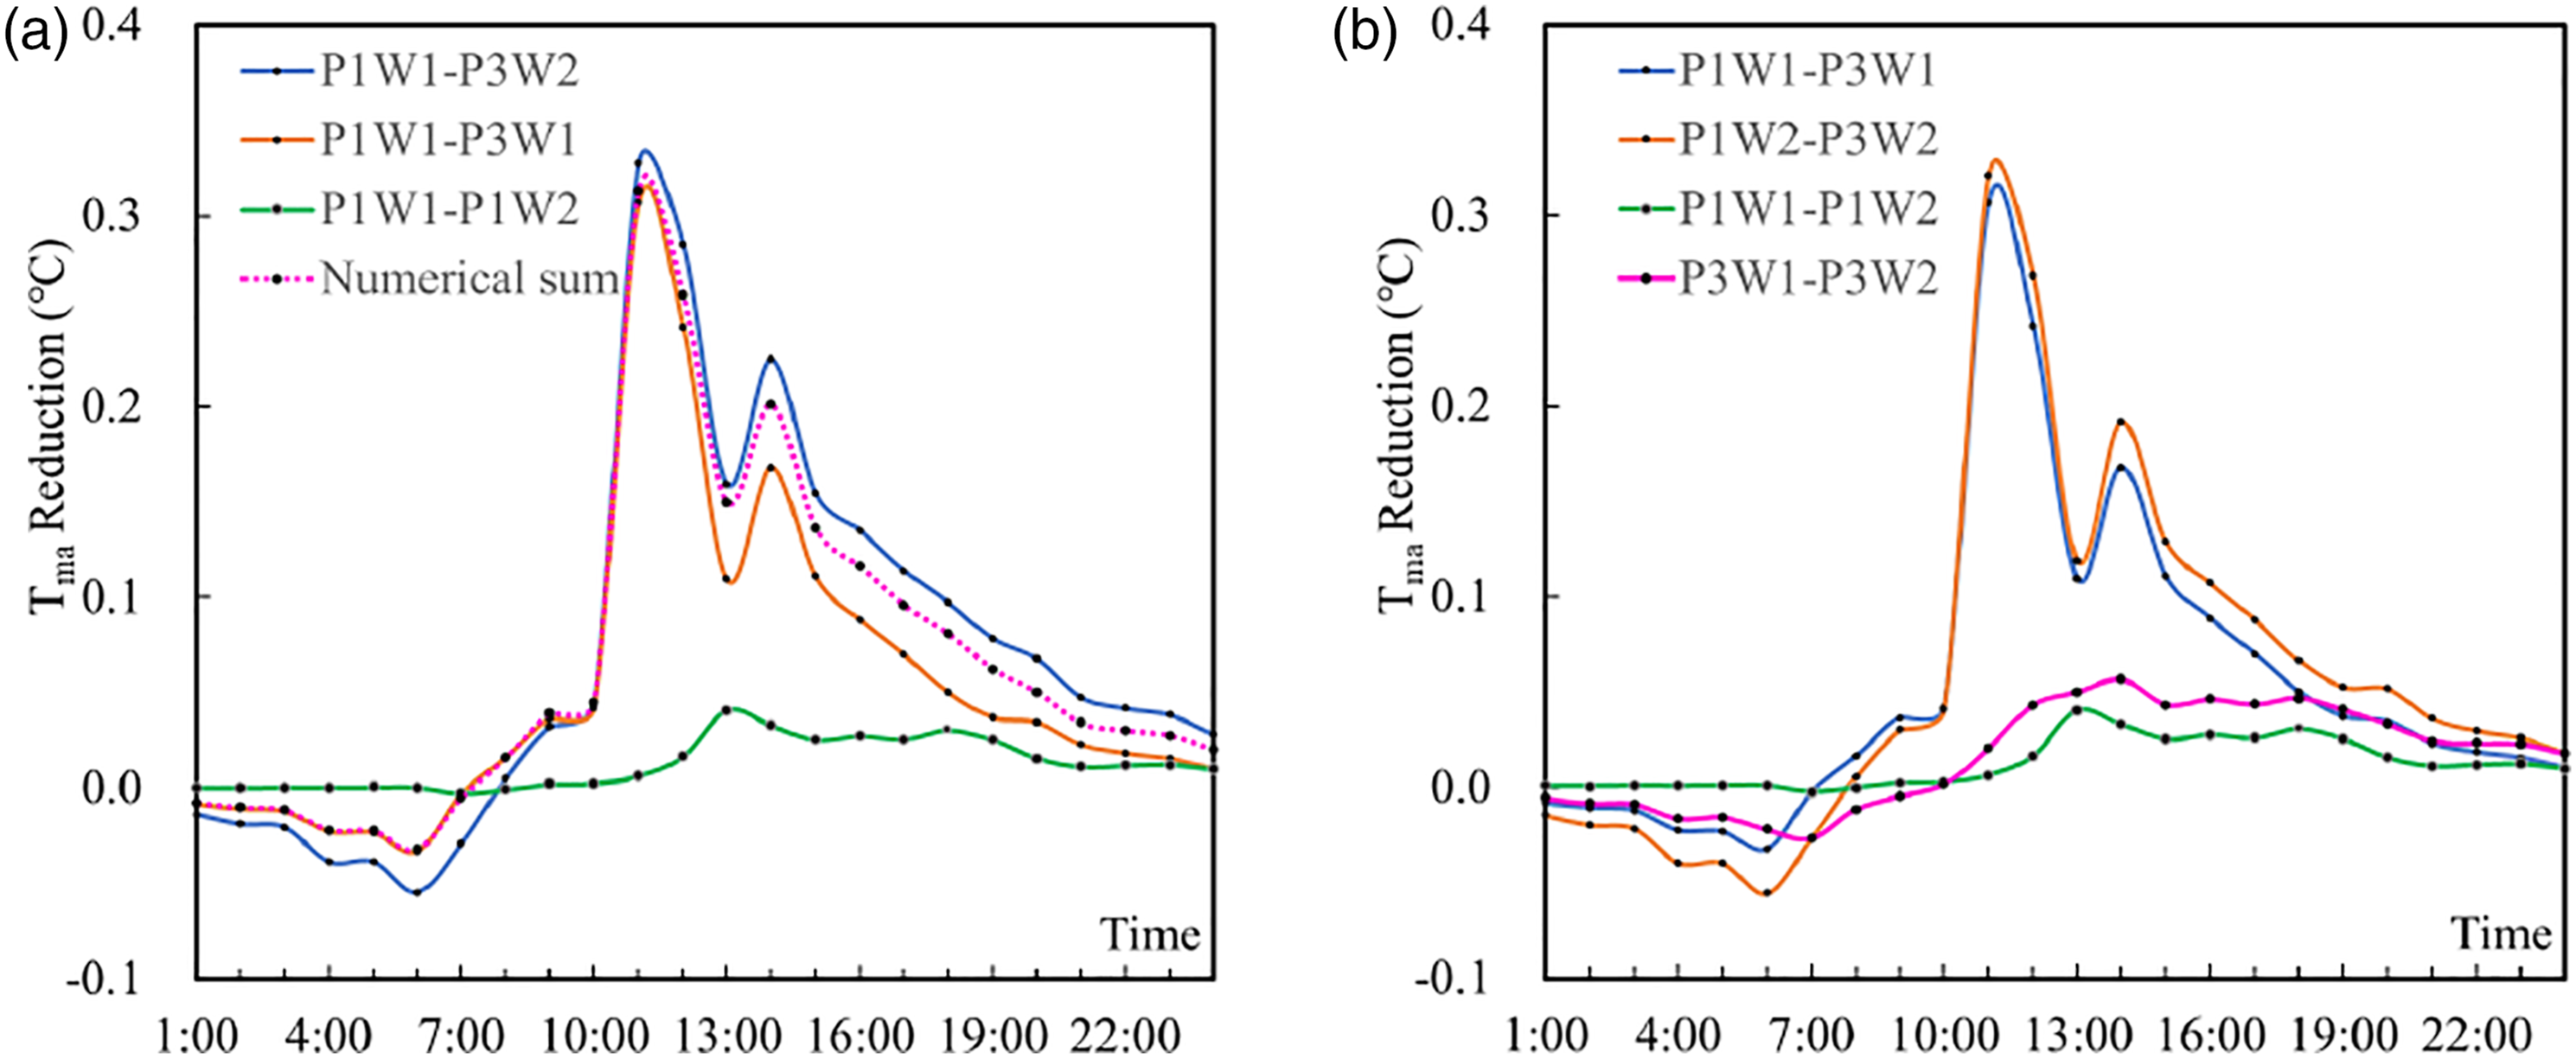
As shown in Figure 13(b), for cases W1 and W2, the reflectivity of pavement materials was increased, and the pavement strategy for W2 had a greater impact on the temperature. For P1 and P3, the reflectivity of wall materials was increased, and the wall strategy for the case of P3 had a greater impact on the temperature. Obviously, when the pavement and wall strategies were used together, their effect on the temperature was enhanced. Therefore, when the reflectivity was big, their changes in the effect on the temperature were greater.
Pavement and roof
For the combination of pavement and roof conditions, Figure 14(a) shows that the ΔTma of P1R1-P3R4 was consistent with the ‘numerical sum’ of P1R1–P3R1 and P1R1–P1R4. This meant that the pavement materials’ reflectivity and roof strategies were combined or adopted separately, and their impact on the mean temperature was basically consistent. (a) The Tma reduction caused by the parameters’ change of PR; (b) the Tma reduction generated by P for R1/R4 and by R for P1/P3.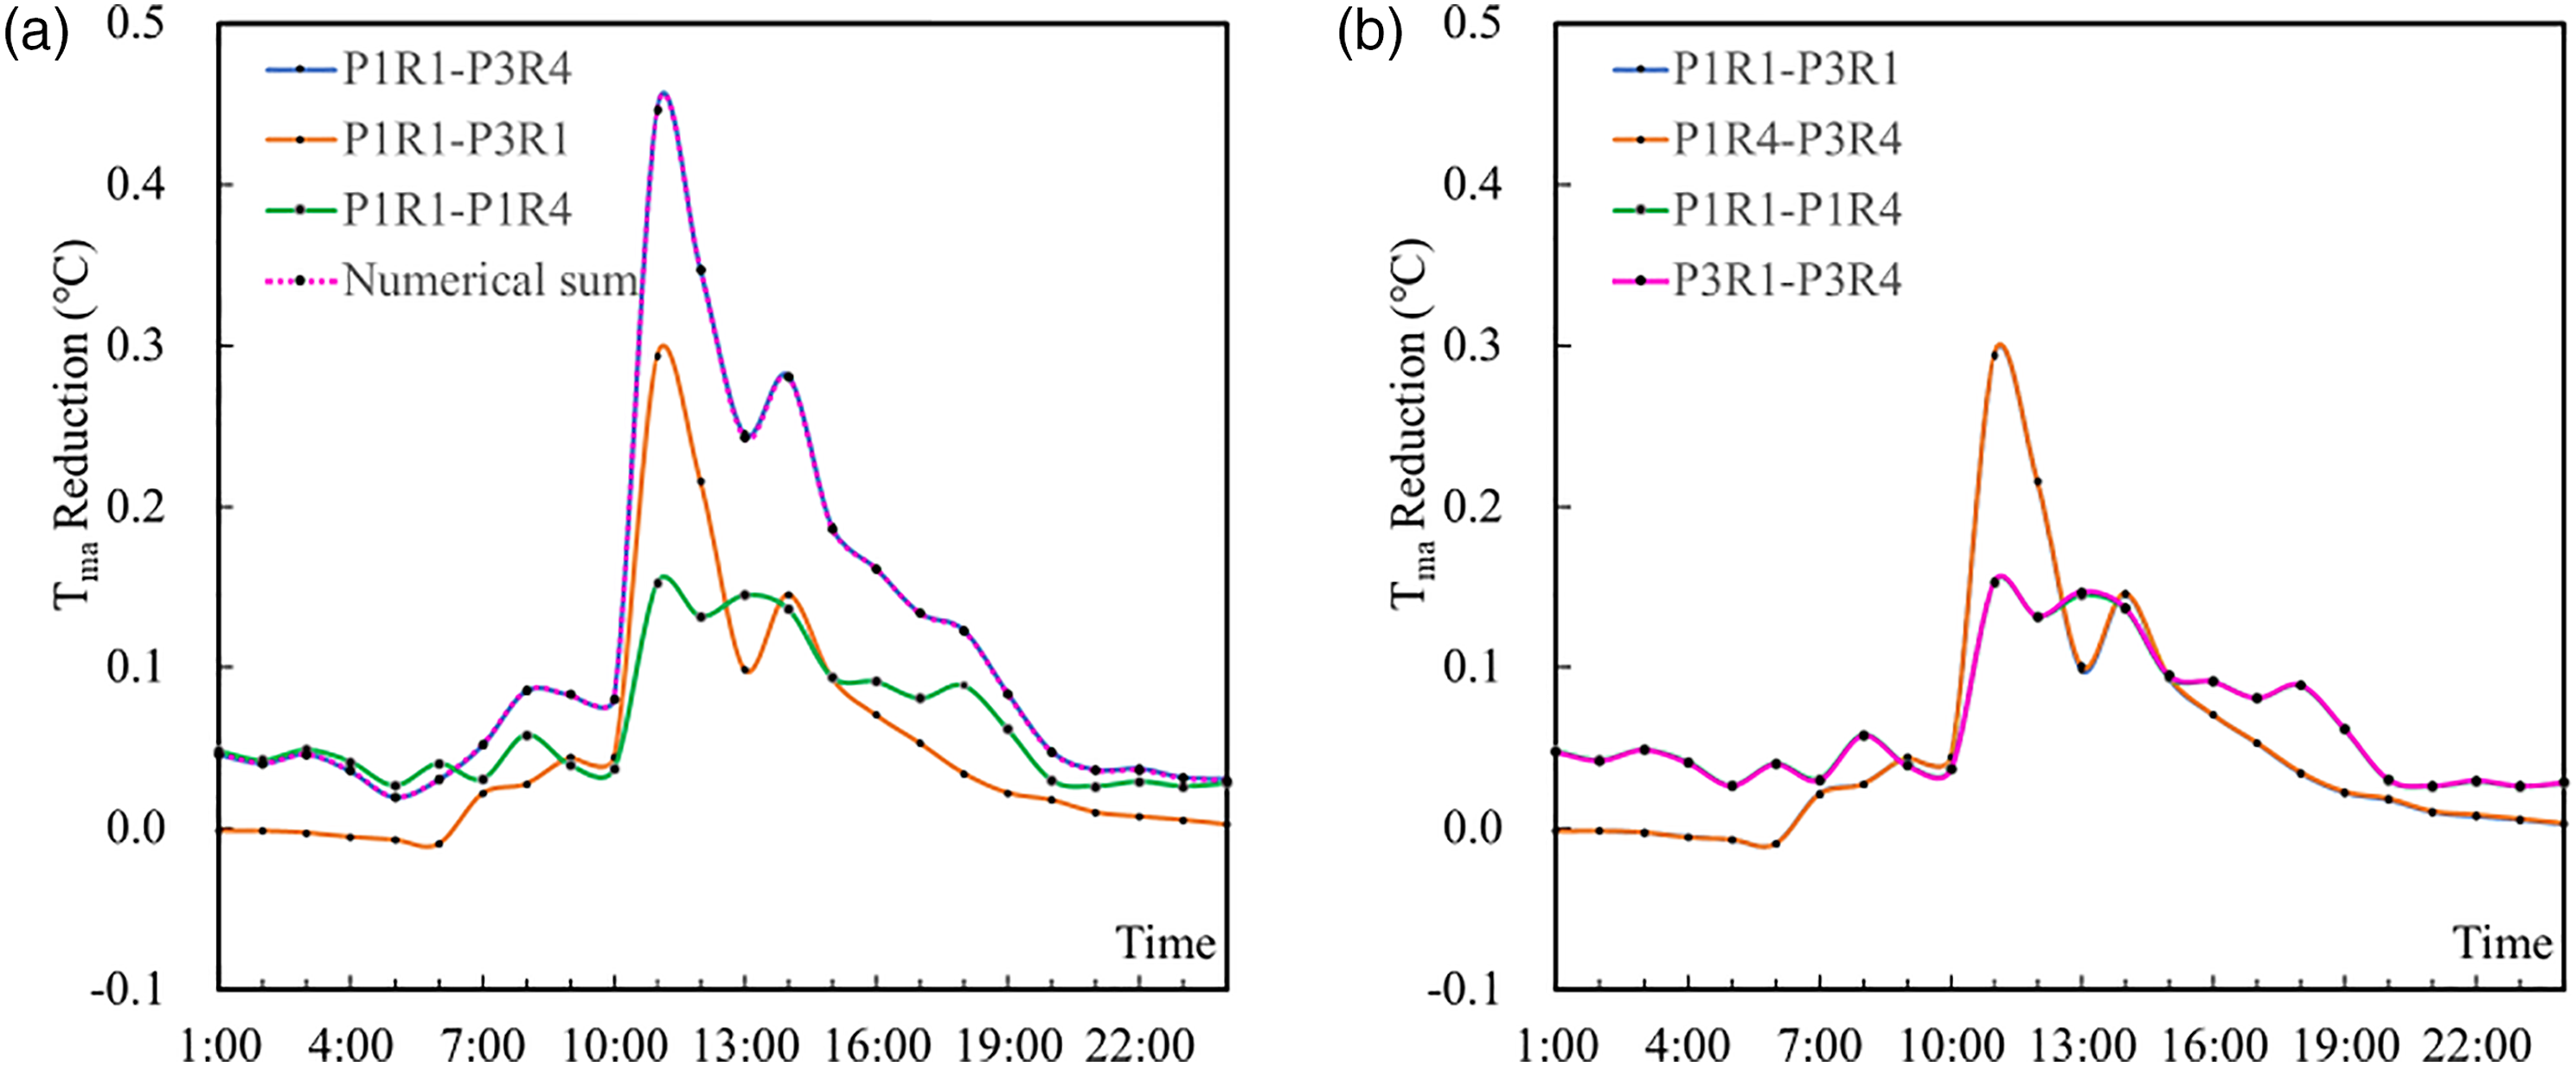
As shown in Figure 14(b), the pavement strategy and the roof strategy had little influence on the change in the ΔTma when they adopted different parameters. The reason that this was consistent with the influence of the ground greening and roof strategies was that the areas where the two strategies had apparent effects were far apart.
Wall and roof
For the combined conditions of the wall and the roof, as Figure 15(a) shows, the ΔTma of W1R1–W2R4 was lower than the ‘numerical sum’ of W1R1–W2R1and W1R1–W1R4 overall. This meant that when the wall materials’ reflectivity and roof strategies were combined, their effect on the temperature reduction were decreased throughout the day. (a) The Tma reduction caused by the parameters’ change of WR; (b) the Tma reduction generated by W for R1/R4 and by R for W1/W2.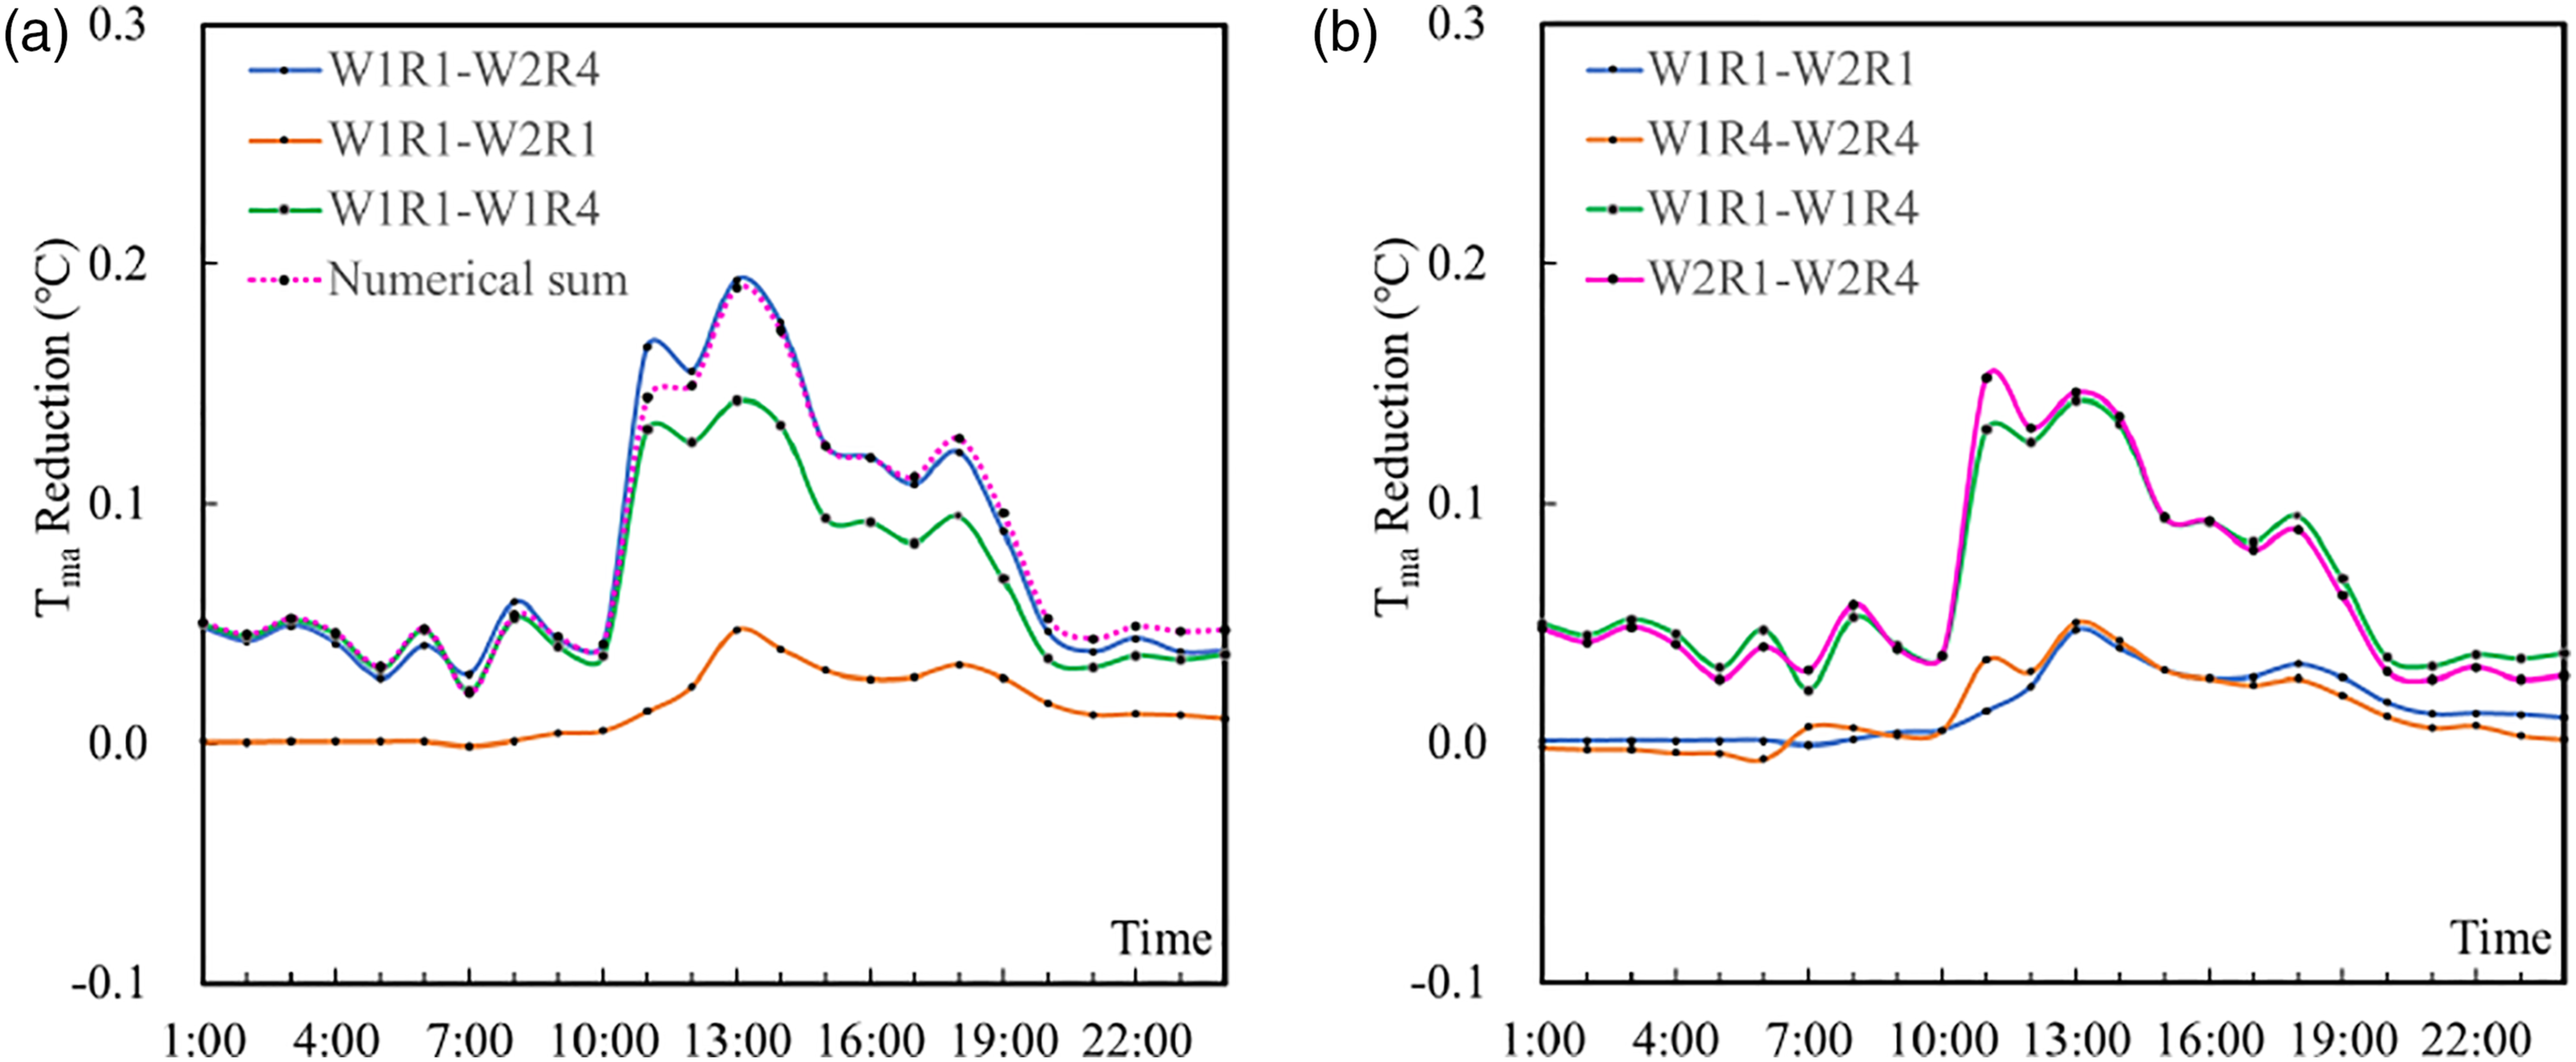
As shown in Figure 15(b), in the high-temperature period, the effect of adopting roof greening on the ΔTma for W2 was greater than that for W1, and the effect of increasing the reflectivity of the wall on the ΔTma for R4 was greater than that for R1. This indicated that their influence on ΔTma was enhanced in the high-temperature period when the wall reflectivity was increased and the roof greening was adopted.
In order to explore the temperature reduction for the condition of only changing the reflectivity of the wall and roof materials, the roof greening condition R4 was excluded. The change in temperature reduction caused by changing the reflectivity of two materials was compared. Figure 16 shows the effect of increasing the reflectivity of the roof material under different wall conditions and increasing the reflectivity of the wall material under different roof conditions on ΔTma. Increasing the reflectivity of the wall and the roof did not weaken their influence on the ΔTma and even produced a weak positive influence. The Tma reduction between W1 and W2 for R1/R3 and the Tma reduction between R1 and R3 for W1/W2.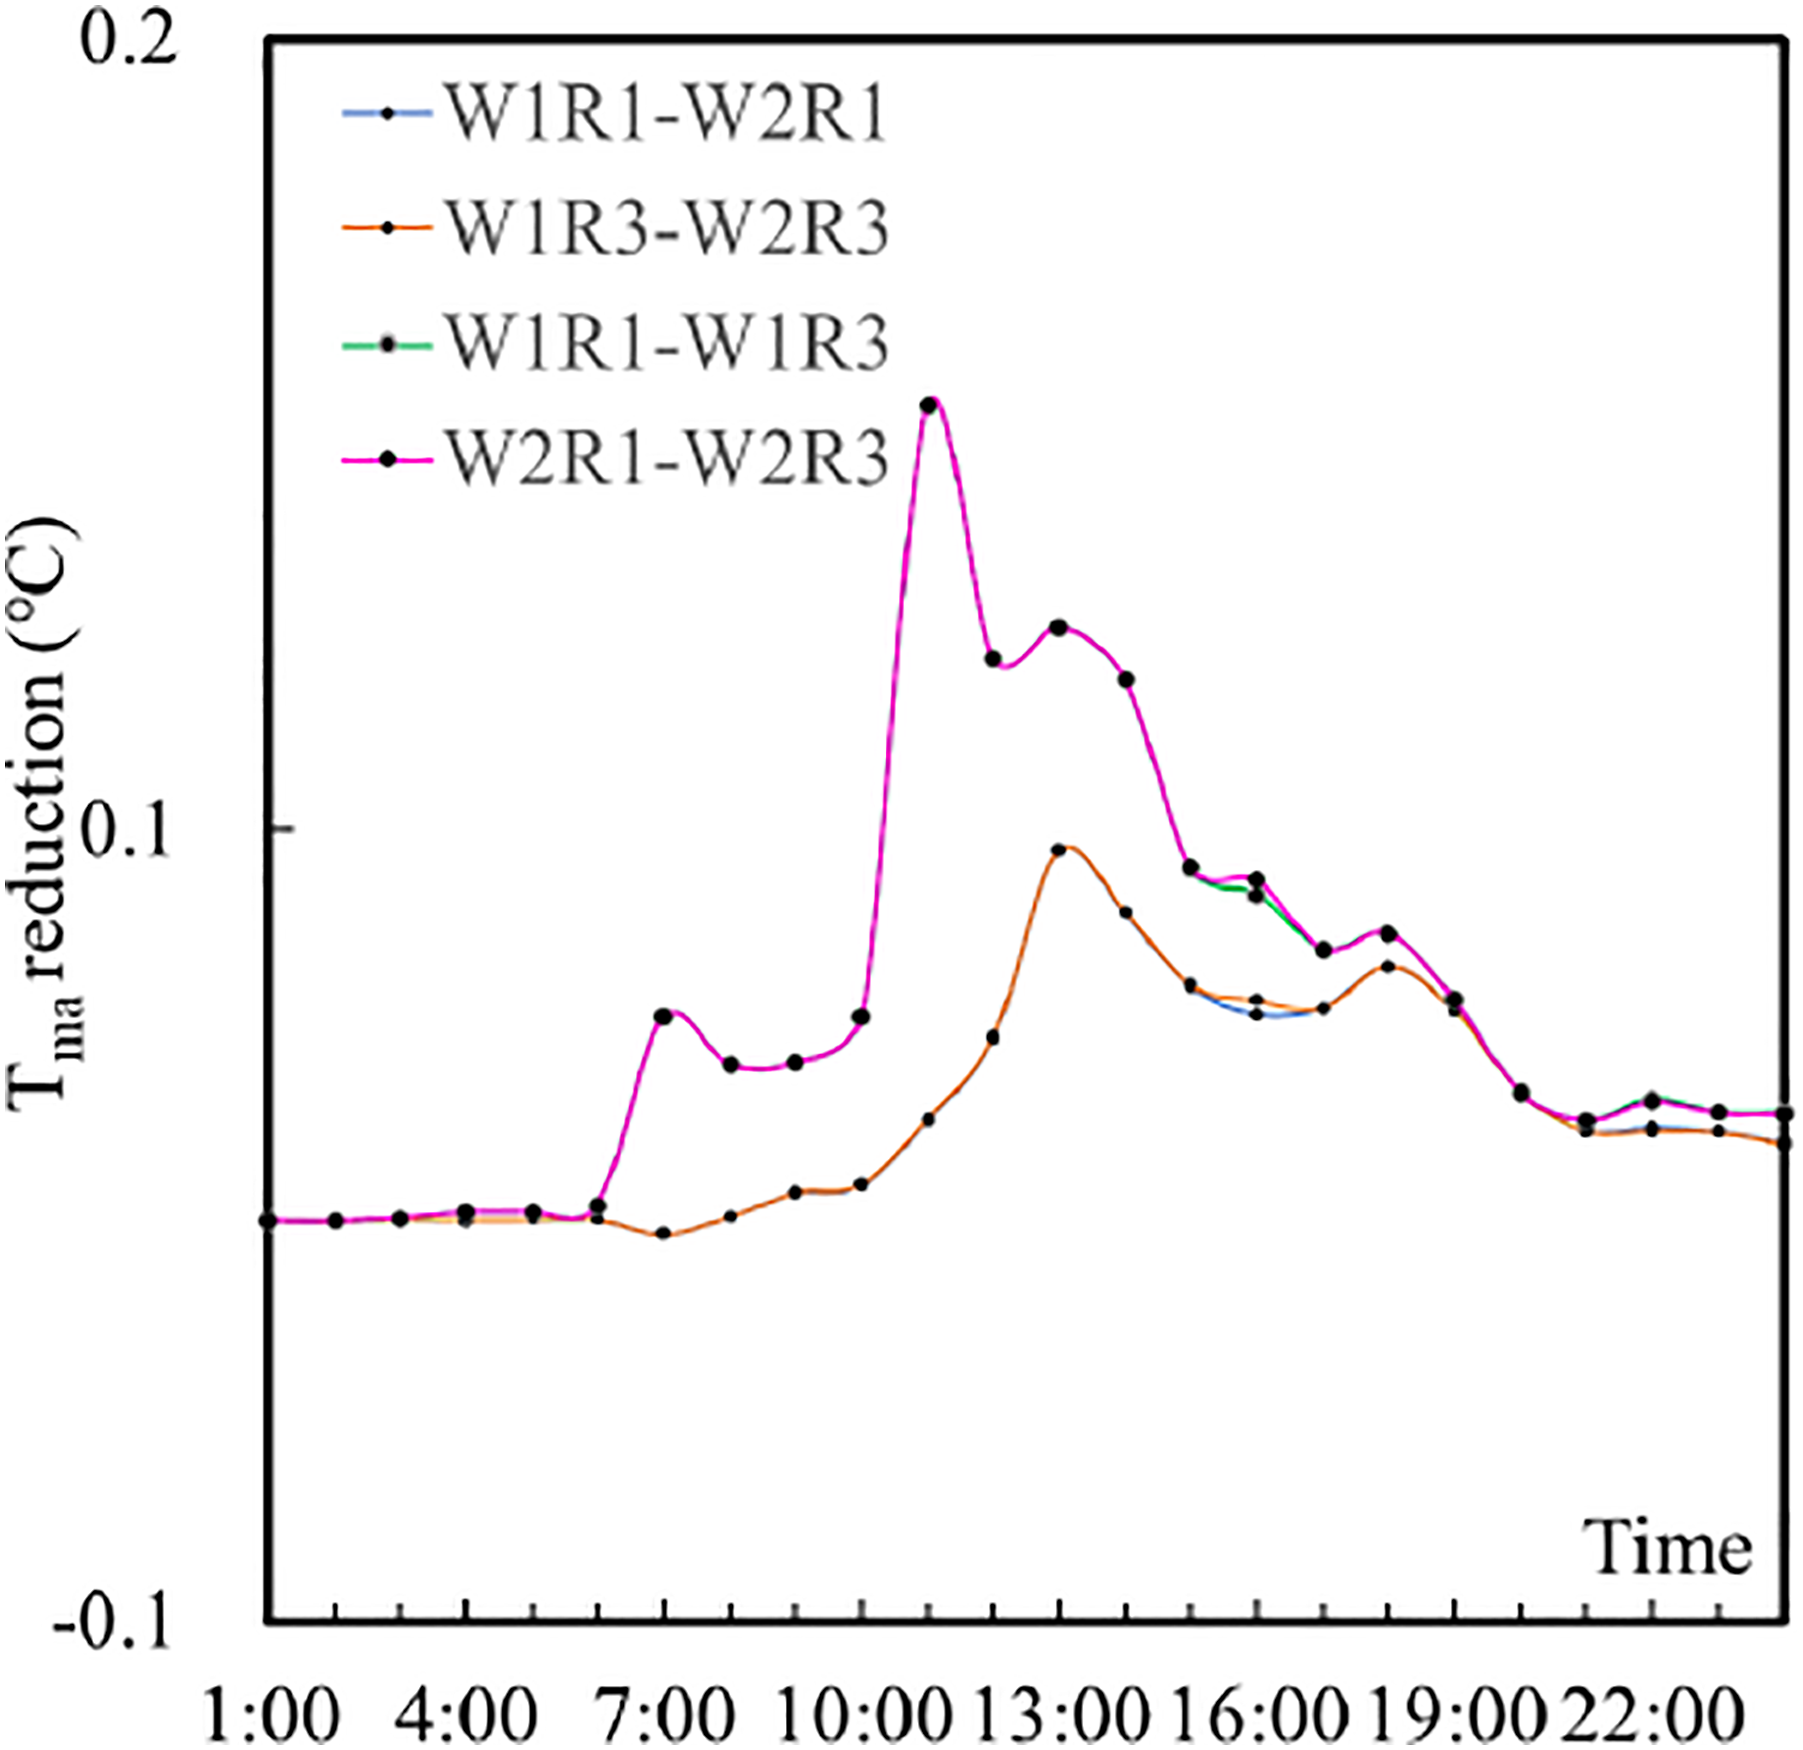
The dual-retrofit strategy combination
Figure 17 summarises the variation in the temperature reduction of one strategy under different working conditions. The horizontal axis represents the improvement of the base condition, and the vertical axis represents the difference in ΔTma between the best and worst conditions for every single-retrofit strategy. The intersection of the horizontal and vertical axes represents the change of ΔTma caused by improving strategy parameters of the vertical axis when the parameter of the horizontal axis strategy was changed. For example, the intersection points of the horizontal axis G1–G3 and the vertical axis P1–P3 represent the change of ΔTma caused by improving the pavement strategy parameters when the ground greening rate was increased. Figure 17 shows the results when the two strategies were combined. The colour blue represents the enhancement of the cooling effect (ΔTma,i+ΔTma,j < ΔTma,ij), and the colour red represents the weakening of the cooling effect (ΔTma,i+ΔTma,j > ΔTma,ij). The difference in the change of the Tma caused by one strategy parameter, when the other strategies were in different scenarios.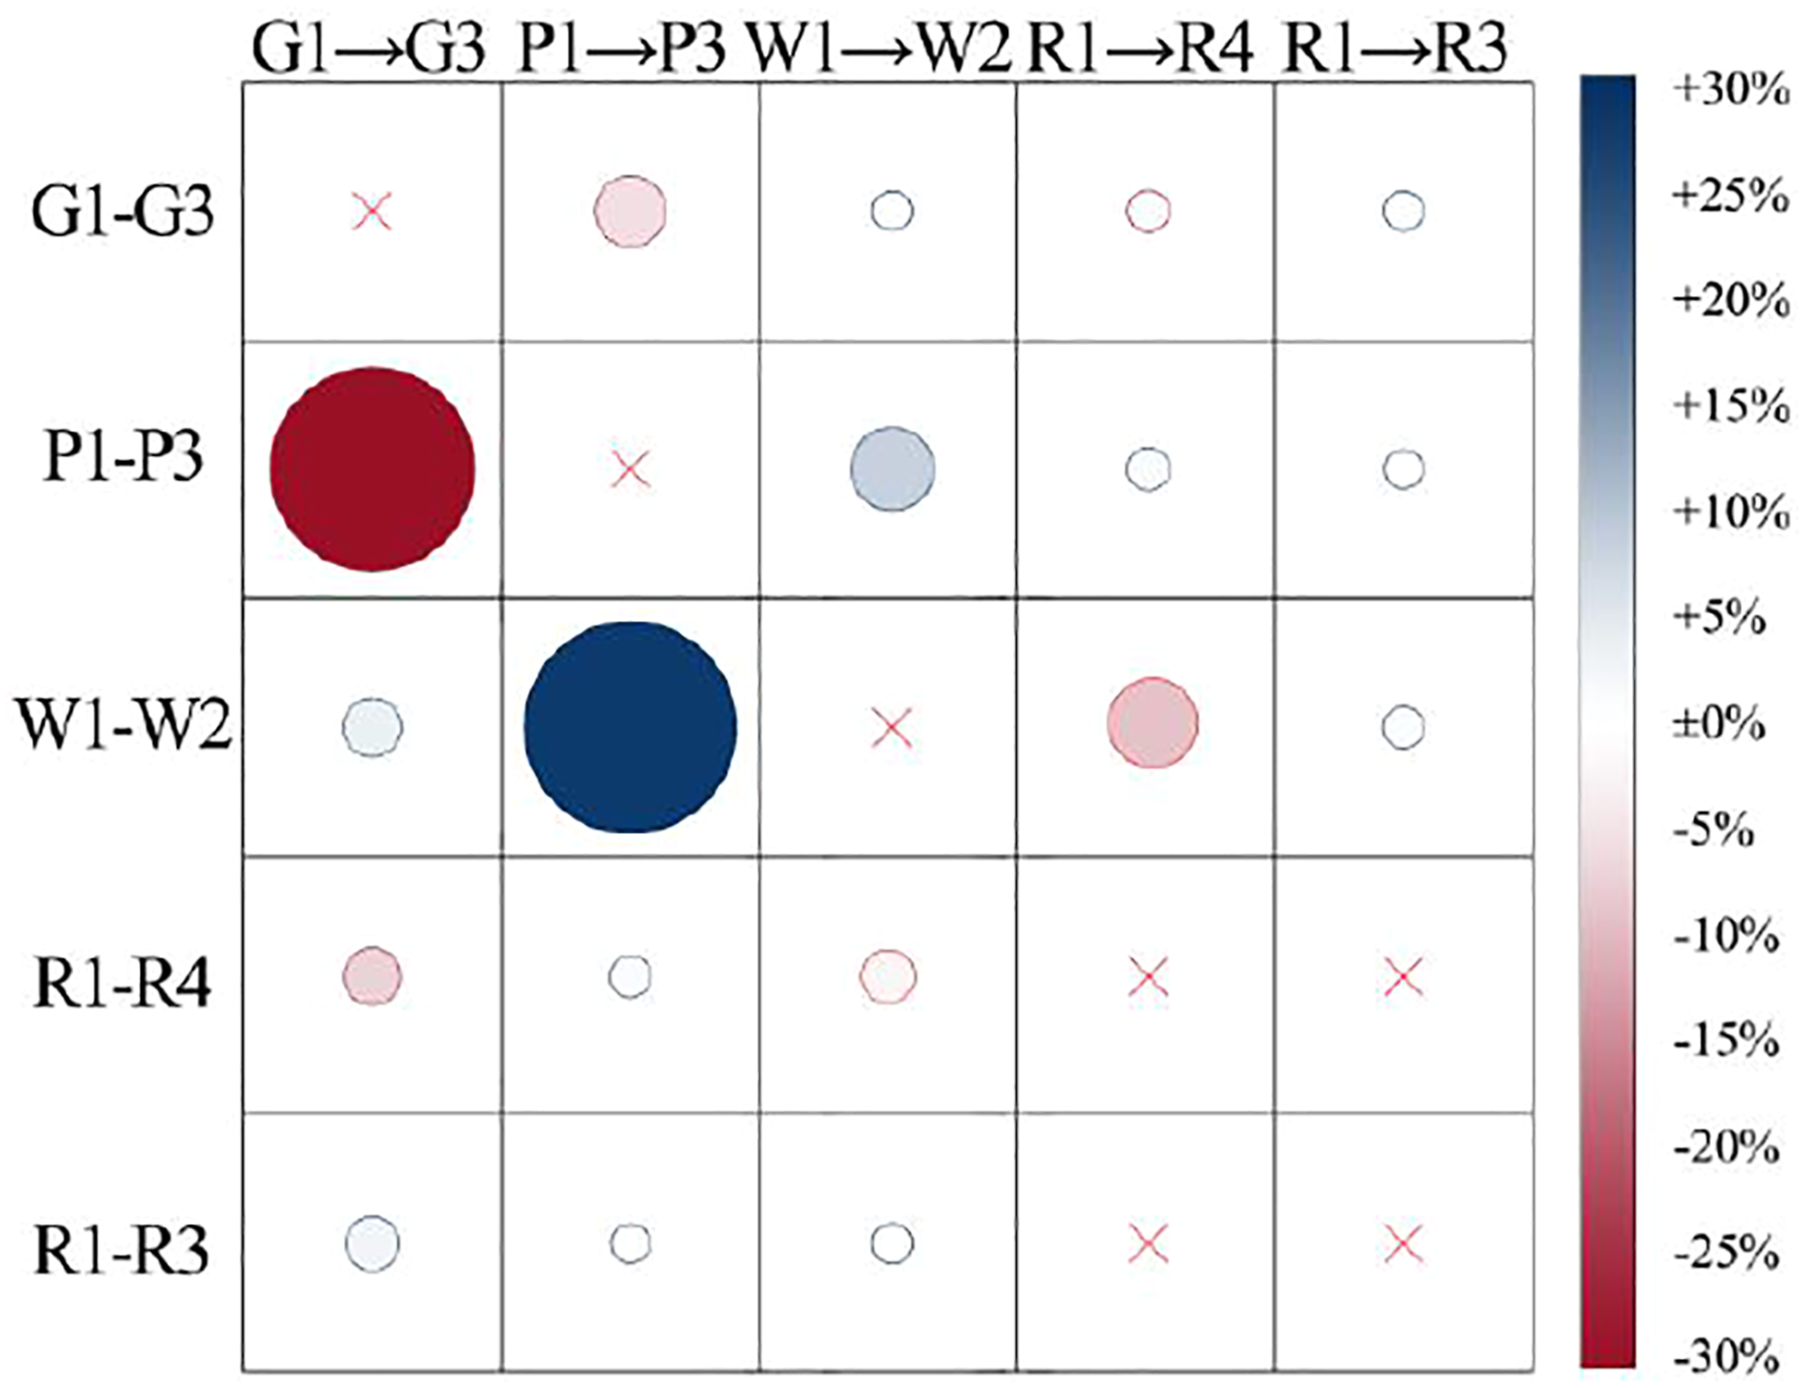
In the dual-retrofit strategy, some combination strategies weakened their influence on the temperature reduction, such as ground greening and the pavement, and the wall and the roof. Some combinations had little influence on the temperature reduction and could almost be ignored, such as ground greening and the wall, ground greening and the roof, and the pavement and the roof. Some combinations enhanced their influence on the temperature reduction, such as the pavement and the wall. Although the combination of the pavement and the wall slightly enhanced the impact on the temperature reduction, the reduction was relatively large in proportion because the wall had a small impact on the temperature reduction itself.
The combination with the roof strategy had little effect on the ΔTma of the other strategy. The reason for this was considered to be the roof height, which was far away from other strategies, and was difficult to affect the temperature reduction of other strategies. When the ground greening was combined with other strategies of changing the reflectivity of materials, the effect of ΔTma on others was mostly reduced. This was because the shade of plants reduced the solar radiation obtained by other materials. Therefore, the effect of improving the reflectivity of the material on ΔTma was not as good as that before the combination with vegetation strategy. When the reflectivity strategies were combined, they increased the solar radiation they obtained from each other, so their impact on temperature was enhanced. Of course, when the reflectivity was larger, their influence might have weakened.
We also observed that greening had a strong impact on the temperature reduction that other strategies could produce. In contrast, other strategies had a weak impact on the temperature reduction that greening strategies could produce. This was because the microclimate change caused by greening was larger, so the temperature reduction was relatively weak from a proportional point of view.
Effect of different strategies on cooling load
In order to study the impact of these strategies on building load, the microclimate simulation results were coupled with the load calculation. The residential district model was established in the load simulation software, and the model geometric information of load calculation was completely consistent with the microclimate model. DesignBuilder is a comprehensive user graphical interface simulation software developed for building energy consumption dynamic simulation program EnergyPlus. The average meteorological parameters around the building from ENVI-met simulation results were used to generate a new weather file, and the reflectivity settings corresponding to each strategy were adjusted in DesignBuilder to simulate the heat load of buildings. The building at the centre of the study area was taken as the target object to calculate the heat load, as shown in Figure 18. Details of the DesignBuilder can be found at https://www.designbuilder.co.uk/. Table 5 shows the difference in the percentage of the all-day cooling load under different strategies compared to the worst-case (G1, P1, W1 and R1). Target building for load calculation. The difference in percentage of cooling load under different strategies compared to the worst-case.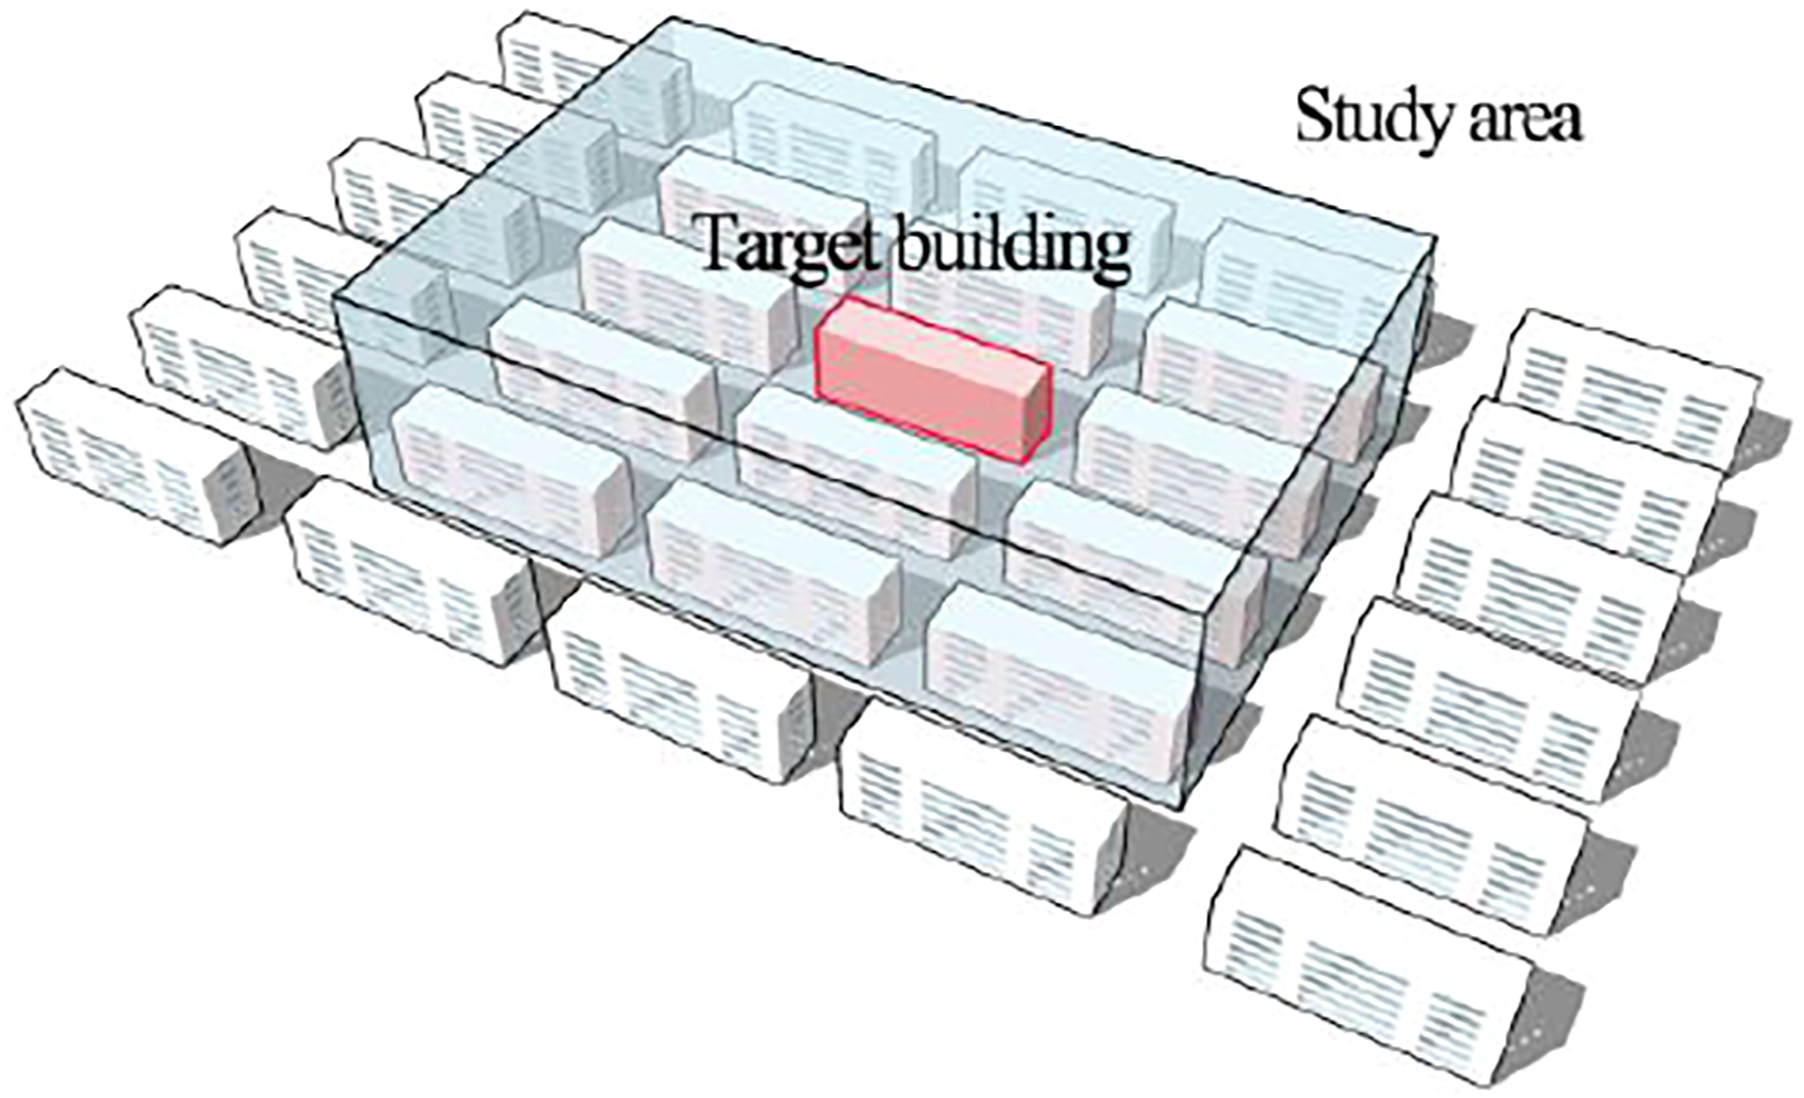
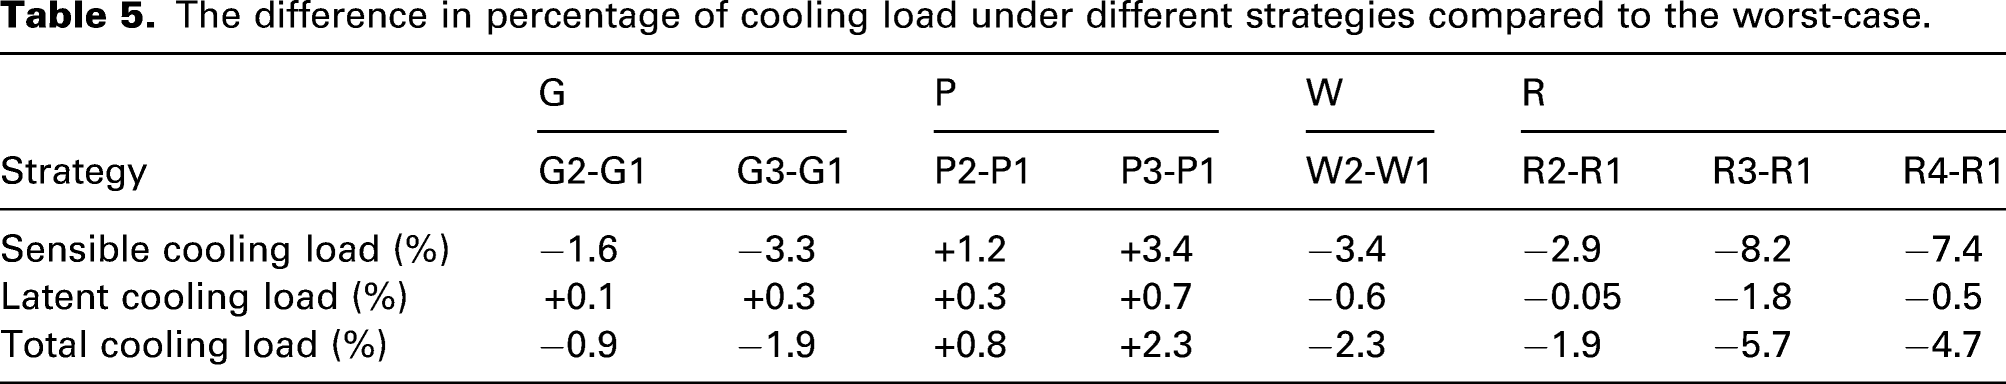
This section compared the effect of different strategies on the cooling load of the building, including sensible cooling load, latent cooling load and total cooling load. The ground greening and pavement mainly affected the building load through the microclimate around the building. Although the ground greening had the most significant effect on air temperature, it reduced the least sensible cooling load, for the ground greening to affect the sensible cooling load through infiltration and made little difference to the solar gain of the building. When the reflectivity of pavement materials was increased, the cooling load was increased too. This was due to the pavement materials with a high-reflectivity reflect more solar radiation onto the wall, resulting in the increase of the wall temperature, which increased the cooling load. The wall strategy and roof strategy affect the cooling load of buildings through both the microclimate change and the heat transfer of the building envelope. For example, improving the wall reflectivity can reduce the outer wall temperature and thus reduce the air temperature around buildings. While improving the wall reflectivity will also reduce the solar radiation absorption and lead to a lower cooling load. In most cases, the latter is more significant.
So, the two different effects should be quantified, respectively. Related work has been carried on and will be published soon, providing a more detailed analysis. While for this study, we focused on the impact of retrofit strategies on microclimate change, particularly the air temperature change around buildings as well as the relationship between these retrofit strategies. This is also the basis for the next step to quantify the proportion of the influence of the microclimate side and the building side.
The ground greening, wall and roof would reduce the sensible cooling load of buildings in three cities, while the pavement would increase the sensible cooling load. Wall and roof would cut down the latent cooling load of the buildings, while the ground greening and the pavement would increase the latent cooling load. The plant transpiration would significantly increase the relative humidity and therefore would increase the relative humidity of the indoor air through infiltration, finally increasing latent cooling load. The effect of all strategies on the latent cooling load was weaker than that on the sensible cooling load.
The effect of the roof on the reduction of the total cooling load was the most obvious, followed by wall and ground greening. In roof strategies, increasing the roof reflectivity to 0.48 (R3) would reduce the total cooling load than the green roof (R4). Considering this, applying a green roof blindly without analysis of specific projects was inadvisable.
Conclusion
Some of the retrofit strategies could affect the thermal microclimate environment of residential districts and could lead to changes in the building energy demand. Numerous studies focused on the microclimate changes of pedestrian level, however, few studies focused on the microclimate change around buildings. The influence of microclimate on building load mainly comes from the influence of the thermal environment around buildings on the building load, especially the air temperature. This study focused on the microclimate change caused by residential retrofit strategies and was carried out with a numerical simulation. The ENVI-met model was used and verified by the actual measurement. Since the microclimate around the building might have affected the building air-conditioning load, which was the final aim of the whole study, we took the air temperature reduction around the building as the evaluation index. Additionally, changes in the air temperature caused by the existing residential retrofit strategy in subtropical cities in summer were explored to determine the influence of different strategy parameters on the temperature reduction. At the same time, combining the results with energy consumption simulation, the influence of these common retrofit strategies on the cooling load was discussed. This study can provide a reference for the renovation design of the building surface and the outdoor environment in existing residential districts.
For single strategies, the ground greening had the most obvious effect on the air temperature, followed by the roof, the pavement and the wall. In the dual-retrofit strategy, some combination strategies weakened their influence on the temperature reduction, such as ground greening and pavement, and the wall and roof. Some strategies had little influence and could almost be ignored, such as the ground greening and the wall, ground greening and the roof, and the pavement and the roof. Some combinations enhanced their influence on the temperature reduction, such as the pavement and the wall. For the influence of these strategies on the cooling load, the ground greening, wall and roof would reduce the total cooling load of the building, while the pavement would increase the cooling load. The influence of the roof on the reduction of the total cooling load was the most obvious, followed by wall and ground greening. In this study, only the temperature change around the building was evaluated because it had a greater influence on the building air-conditioning load. In future work, other factors that affect the building air-conditioning load caused by these retrofit strategies should also be considered.
Footnotes
Acknowledgements
The authors gratefully acknowledge the coordinated support from the Key R&D Plan of China (Subject No.2018YFC0704800). Thanks so much for the great support and assistance of Shanghai Jiaotong University in the field measurement.
Authors contribution
Ruixu Li: Data curation and Writing-Original draft preparation. Weirong Zhang: Conceptualisation, Formal analysis, Funding acquisition, Methodology, Project administration, Supervision and Reviewing-Editing. Luo Qiu: Investigation, Formal analysis, Data curation and Visualisation. Huibo Zhang: Supervision and Reviewing
Declaration of conflicting interests
The author(s) declared no potential conflicts of interest with respect to the research, authorship and/or publication of this article.
Funding
The author(s) disclosed receipt of the following financial support for the research, authorship and/or publication of this article: This study was supported by Ministry of Science and Technology of the People’s Republic of China, 2018YFC0704800.