
Abstract
Fume hoods are an indispensable instrument for experimental operations dealing with hazardous chemicals, wherein safety operations are strictly adherent to regulations. Within this context, few cases exist wherein the ventilation efficiency and pollutant capture efficiency inside fume hoods are precisely analyzed and quantitatively visualized. In this study, the pollutant capture efficiencies of a fume hood were analyzed by computational fluid dynamics as functions of exhaust airflow rate and according to the posture of workers in front of the fume hood. The indices for ventilation efficiencies, that is, age of air (SVE3), net escape velocity (NEV), and local purging flow rate (L-PFR), were adopted to quantitatively evaluate the pollutant concentration distributions formed inside the fume hood. NEV analysis revealed that the presence of a worker at the front of the fume hood did not significantly affect the pollutant capture efficiency at the opening surface of the fume hood. Changing the exhaust airflow rate resulted in changes in the size of the circulation flow formed in the upper part of the chamber. The circulation flow was found to have a dominant effect on the distribution of SVE3 and on the formation of the pollutant concentration distribution in the chamber.
Keywords
Introduction
Fume hoods are widely found in university laboratories and industrial workshops where hazardous chemical substances are often manipulated. In this context, the installation of a local exhaust ventilation system is mandatory to maintain worker safety. Fume hoods installed in laboratory space are often designed to only exert an exhaust function, wherein the air in the laboratory space is supplied to the fume hood via the work-opening surface. The basic performance of a fume hood is specified by the average air velocity at the work-opening surface. According to the ANSI/AIHA Z9.5-2003 guideline, 1 an opening surface velocity of the laboratory chemical hoods in the range of 0.41–0.51 m/s would provide adequate contaminant capture and sealing efficiency for a majority of chemical hoods.
In Japan, the implementation of routine inspections is prescribed in Industrial Safety and Health Law, 2 which states that the air velocity at the opening surface must be maintained at 0.5 m/s or more when gaseous chemical substances are used. The air velocity at the opening surface is generally measured assuming ideal indoor environmental conditions in a laboratory space with no workers and no other equipment. The air supply of fume hoods with controlled exhaust airflow is laboratory-side air. Therefore, the protection performance of the fume hood as a local exhaust system is affected by the environmental conditions of the laboratory in which it is installed. In particular, conditions under which a worker stands in front of the fume hood and inserts their arm into the fume hood and conditions under which obstacles such as experimental equipment are placed inside the fume hood may have a significant effect on its protection performance. However, there is currently a lack of quantitative information regarding these effects on the users of fume hoods.
Several previous studies have evaluated the performance of fume hoods in laboratories. Ahn et al. 3 conducted a review of 43 studies on fume hoods from 1966 to 2016 to investigate factors that affect the performance of fume hoods. They reported that although many studies have investigated opening wind velocity, there is a lack of understanding of opening surface velocity with which to evaluate the performance of the pollutant capture efficiency of fume hoods. Therefore, there is a need to conduct a comprehensive evaluation by studying the actions of the human body in front of fume hoods. Smith and Crooks 4 determined and evaluated the factors affecting the performance of 356 laboratory fume hoods. These tests consisted of three tests, including measuring air velocity, observing airflow patterns, and using tracer gas contaminant tests. According to their results, 51% of total fume hoods passed the air velocity test, while only 29% of fume hoods passed all three tests. They also found that the average opening surface velocity alone could not be used as a reliable indicator of the pollutant capture efficiency of fume hoods. Teseng et al. 5 conducted an experiment on the behaviour of SF6 gas generated inside a fume hood by opening and closing the sash and human movement around the fume hood. They reported that both opening and closing the sash and human movement caused the formation of large turbulent eddies due to the turbulence of the airflow on the opening surface of the fume hood, and that this turbulence was likely to contribute to the leakage of contaminants. In this study, an upright mannequin was placed in front of the fume hood and the human heat generation, which is likely to affect the flow around the fume hood, was not considered. Liu et al. 6 evaluated the transport of gaseous pollutants in a laboratory with a fume hood by CFD (computational fluid dynamics) analysis by varying the ventilation frequency, the location of air supply and exhaust vents, and the location of contaminant generation in the laboratory. In addition, the contaminant around the breathing zone of the upright worker in front of the fume hood was evaluated. They reported that changes in the flow field due to changes in the shape of the worker might affect the concentration in the breathing zone. Liu et al. 7 also reported CFD analysis to evaluate the containment performance of the fume hood by simulating an upright worker in front of the fume hood, with the human body surface temperature was set at 31°C and the opening surface air velocity was varied from 0.3 to 0.9 m/s. As a result, they found that the performance of the opening surface was affected by the thermal plume caused by the human heat generation when the opening surface air velocity was less than 0.4 m/s. In addition, this thermal plume formed a stagnant zone between the chin and chest of the human body, indicating a risk of stagnant leaking contaminants in this zone.
Although several research reports on the performance evaluation of fume hoods have been fruitful, a discussion on the formation mechanism of pollutant concentration distributions inside fume hoods is still lacking.
In this study, we quantitatively evaluated the detailed mechanism of pollutant concentration distribution formation inside fume hoods by applying various ventilation efficiency indices. Here, a digital twin model that represents a typical fume hood applied in a university laboratory and its surrounding indoor environment was precisely reproduced, and a comprehensive computer simulated person (CSP) was integrated into a digital twin model to reproduce realistic working conditions in front of a fume hood. Numerical simulations were conducted to evaluate the effects of various exhaust airflow rates and the change in the posture of the worker or operator on the pollutant capture performance of the fume hood. We reproduced the operator’s posture with an arm inserted into the fume hood. No previous studies have evaluated the performance of fume hood considering the working posture. The capture performance of the fume hood was comprehensively evaluated by three ventilation indices of scale for ventilation efficiency 3 (SVE3 for evaluating the age of air by the steady-state scalar calculation), net escape velocity (NEV), and local purging flow rate (L-PFR). The results of this numerical analysis can provide basic data for optimizing the exhaust air flow rate of fume hoods and will be expected to contribute to the optimized design of fume hoods with high energy-saving performance, taking into account the running cost (energy cost associated with exhaust fan operation) and pollutant capture efficiency of the fume hood in future.
Theory
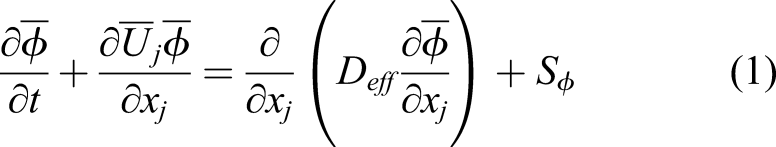
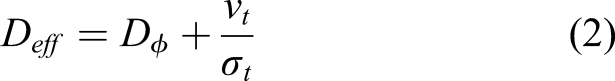
To evaluate the capture efficiency of the fume hood, the contaminant concentration distributions in and around the fume hood were analyzed by solving the scalar transport equation, as shown in equation (1), after the steady flow field analysis by computational fluid dynamics (CFD). Here, the scalar transport equation with ensemble averaging operations is presented, assuming that the flow field was analyzed by the Reynolds-averaged Navier–Stokes (RANS) model.
Here,
The ventilation efficiency index was used to quantify the degree of heterogeneity of an air mixture in an indoor environment. Various studies for developing the ventilation efficiency index have been conducted for several decades.8–12 Among them, we adopted three indices for ventilation efficiencies, namely, SVE3, NEV and L-PFR, to analyze pollutant concentration formation.
Age of air
One of the most representative ventilation efficiency indices for quantitatively understanding the heterogeneity of contaminant concentration distribution formed in a closed space is the age of air concept. The age of air concept was originally proposed by Sandberg
13
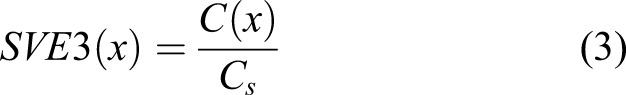
to quantitatively evaluate the dilution effect of contaminants generated inside the fume hood by the airflow from the opening surface. In this analysis, the scale for ventilation efficiency 3 (SVE3) was adopted as the calculation method of the age of air concept.
14
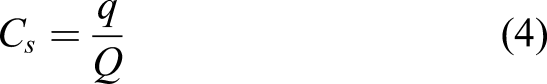
The concept SVE3 is defined in equation (3) as proposed by Kato et al.
14
and can be used to directly calculate the distribution of the age of air under steady-state numerical analysis.
Here,
Net escape velocity
One of the authors of this study developed a ventilation efficiency index for analyzing the structure of the formation of a pollutant concentration field at a local point in an indoor environment and defined it as the net escape velocity (NEV).15–19 The NEV concept can be used to quantitatively evaluate the essential velocity scale that directly determines the pollutant concentration of a point in an enclosed space. To quantitatively discuss the velocity scale that determines the average concentration of contaminants in the control volume (CV), which is the minimum scale in a CFD analysis, we used the NEV as defined in equation (5).
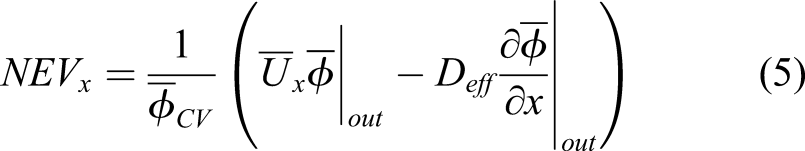
Here, NEV represents the vector quantity in each direction of the NEV defined by the difference between the outflow and inflow fluxes on the target CV. The NEV represents the real contaminant transport velocity, which considers the contaminant transport velocity associated with turbulent diffusion. In this study, the NEV distribution on the fume hood opening surface was calculated.
Local purging flow Rate
The purging flow rate was first introduced by Zvirin and Shinnar
20
in their study on pollutant dispersion in oceans and was later applied by Sandberg
8
to evaluate the ventilation characteristics of building spaces. L-PFR, as shown equation (6), is an index ventilation efficiency in the indoor local area that defines the real airflow rate to determine the average concentration in the local area.
Here,
Numerical methods
Analysis model
Figure 1(a) shows the analytical model used to reproduce realistic university laboratory conditions. An exhaust ventilation fan and an air conditioning system were installed in the laboratory space, and an upright worker/operator was placed 0.1 m apart from the edge and in front of the fume hood. In our preliminary study, we confirmed that the operation of an exhaust ventilation fan and air conditioning system did not significantly affect the opening surface velocity distribution and capture performance of the fume hood.
21
As a result, a space including only a worker and a fume hood was precisely reproduced and analyzed in this study. Figure 1(b) shows the analytical model that reproduced only the environment around the fume hood. A numerical model of the fume hood model is shown in Figure 1(c), with a size of 1.26 m × 0.75 m × 2.05 m and a baffle plate that formed three spaces in the fume hood. The exhaust outlet size was φ0.263 m, and the height of the fume hood opening was set to 0.42 m for normal use. The internal space of the fume hood was reproduced with sufficient accuracy for engineering numerical fluid dynamics analysis. Outline of analytical model.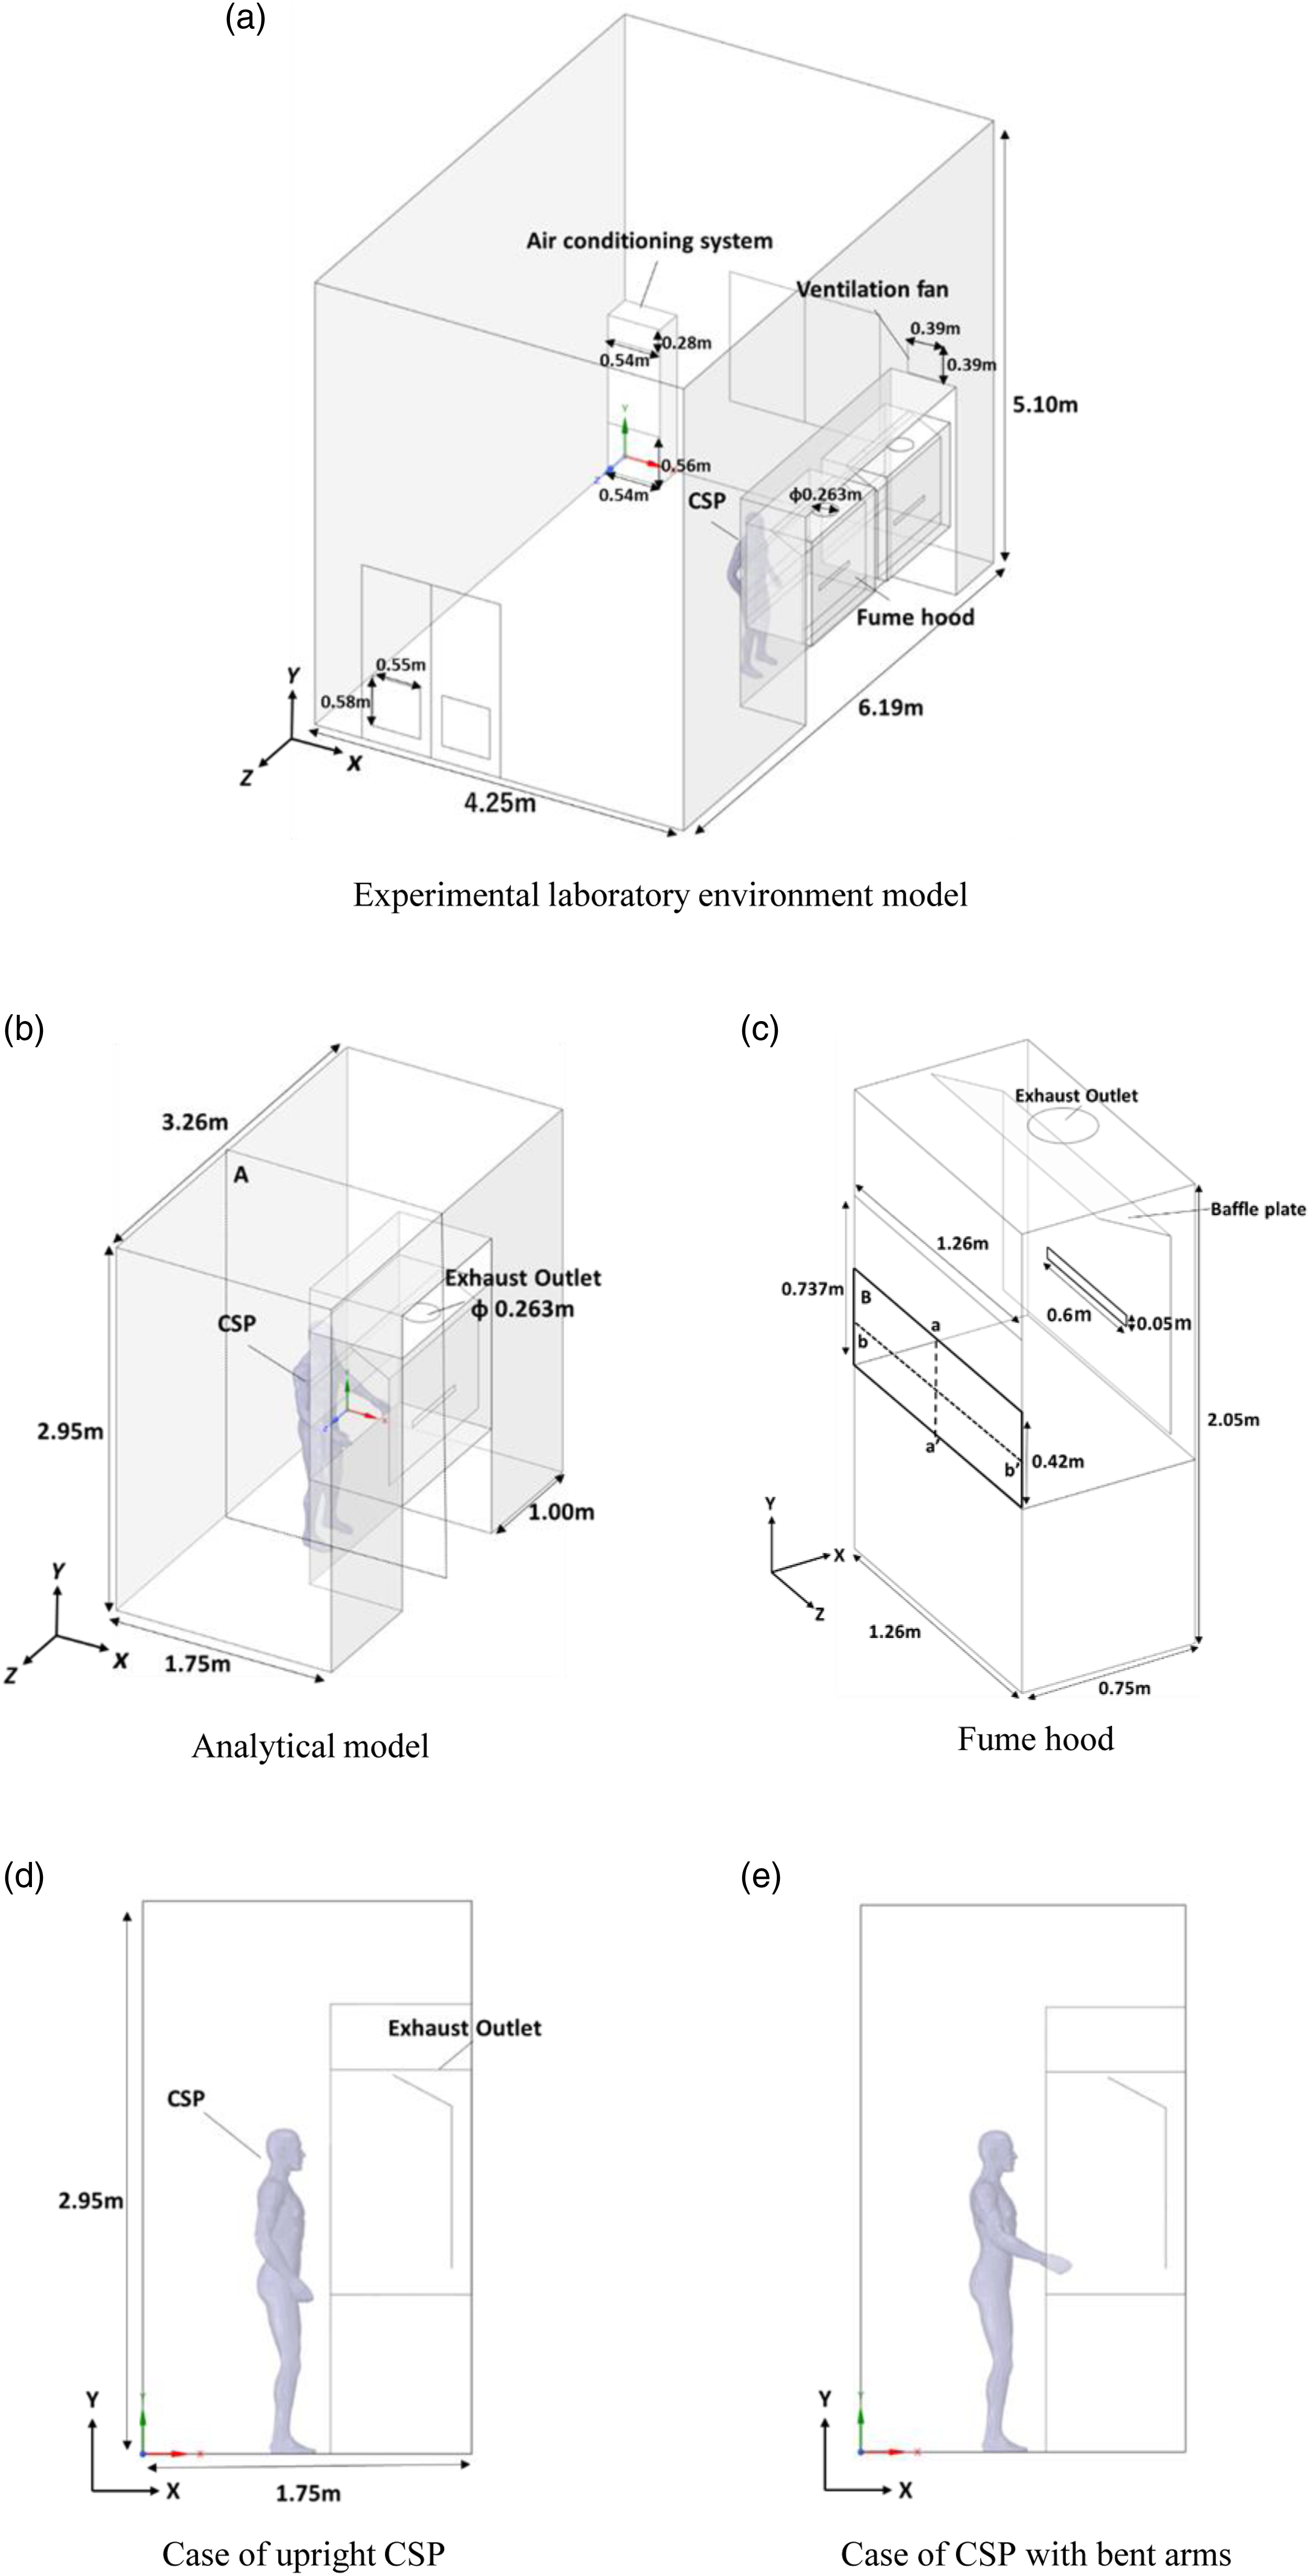
As shown in Figure 1(d) and Figure 1(e), an upright computer simulated person (CSP) with a metabolic heat generation was adopted into the analytical domain in front of a fume hood. Here, to investigate the impact of the use condition on the performance of the fume hood, we assumed the analyzed worker was in two postures, namely, in a normal standing posture and in another posture with his arms inserted into the inner space of the fume hood.
Computer simulated person
Figure 2 shows an outline of the CSP. We developed a CSP that reproduces the detailed geometry of the shape of the human body surface, metabolic heat generation, skin surface temperature control by a thermo-regulation model and respiration inside the airway.22–24 In this study, the CSP was assumed to be the worker to analyze the protection performance of the fume hood when used by a worker. We reproduced the upright CSP (Figure 2(a)) and CSP with bent arms to represent differences in the working posture (Figure 2(b)). Outline of CSP.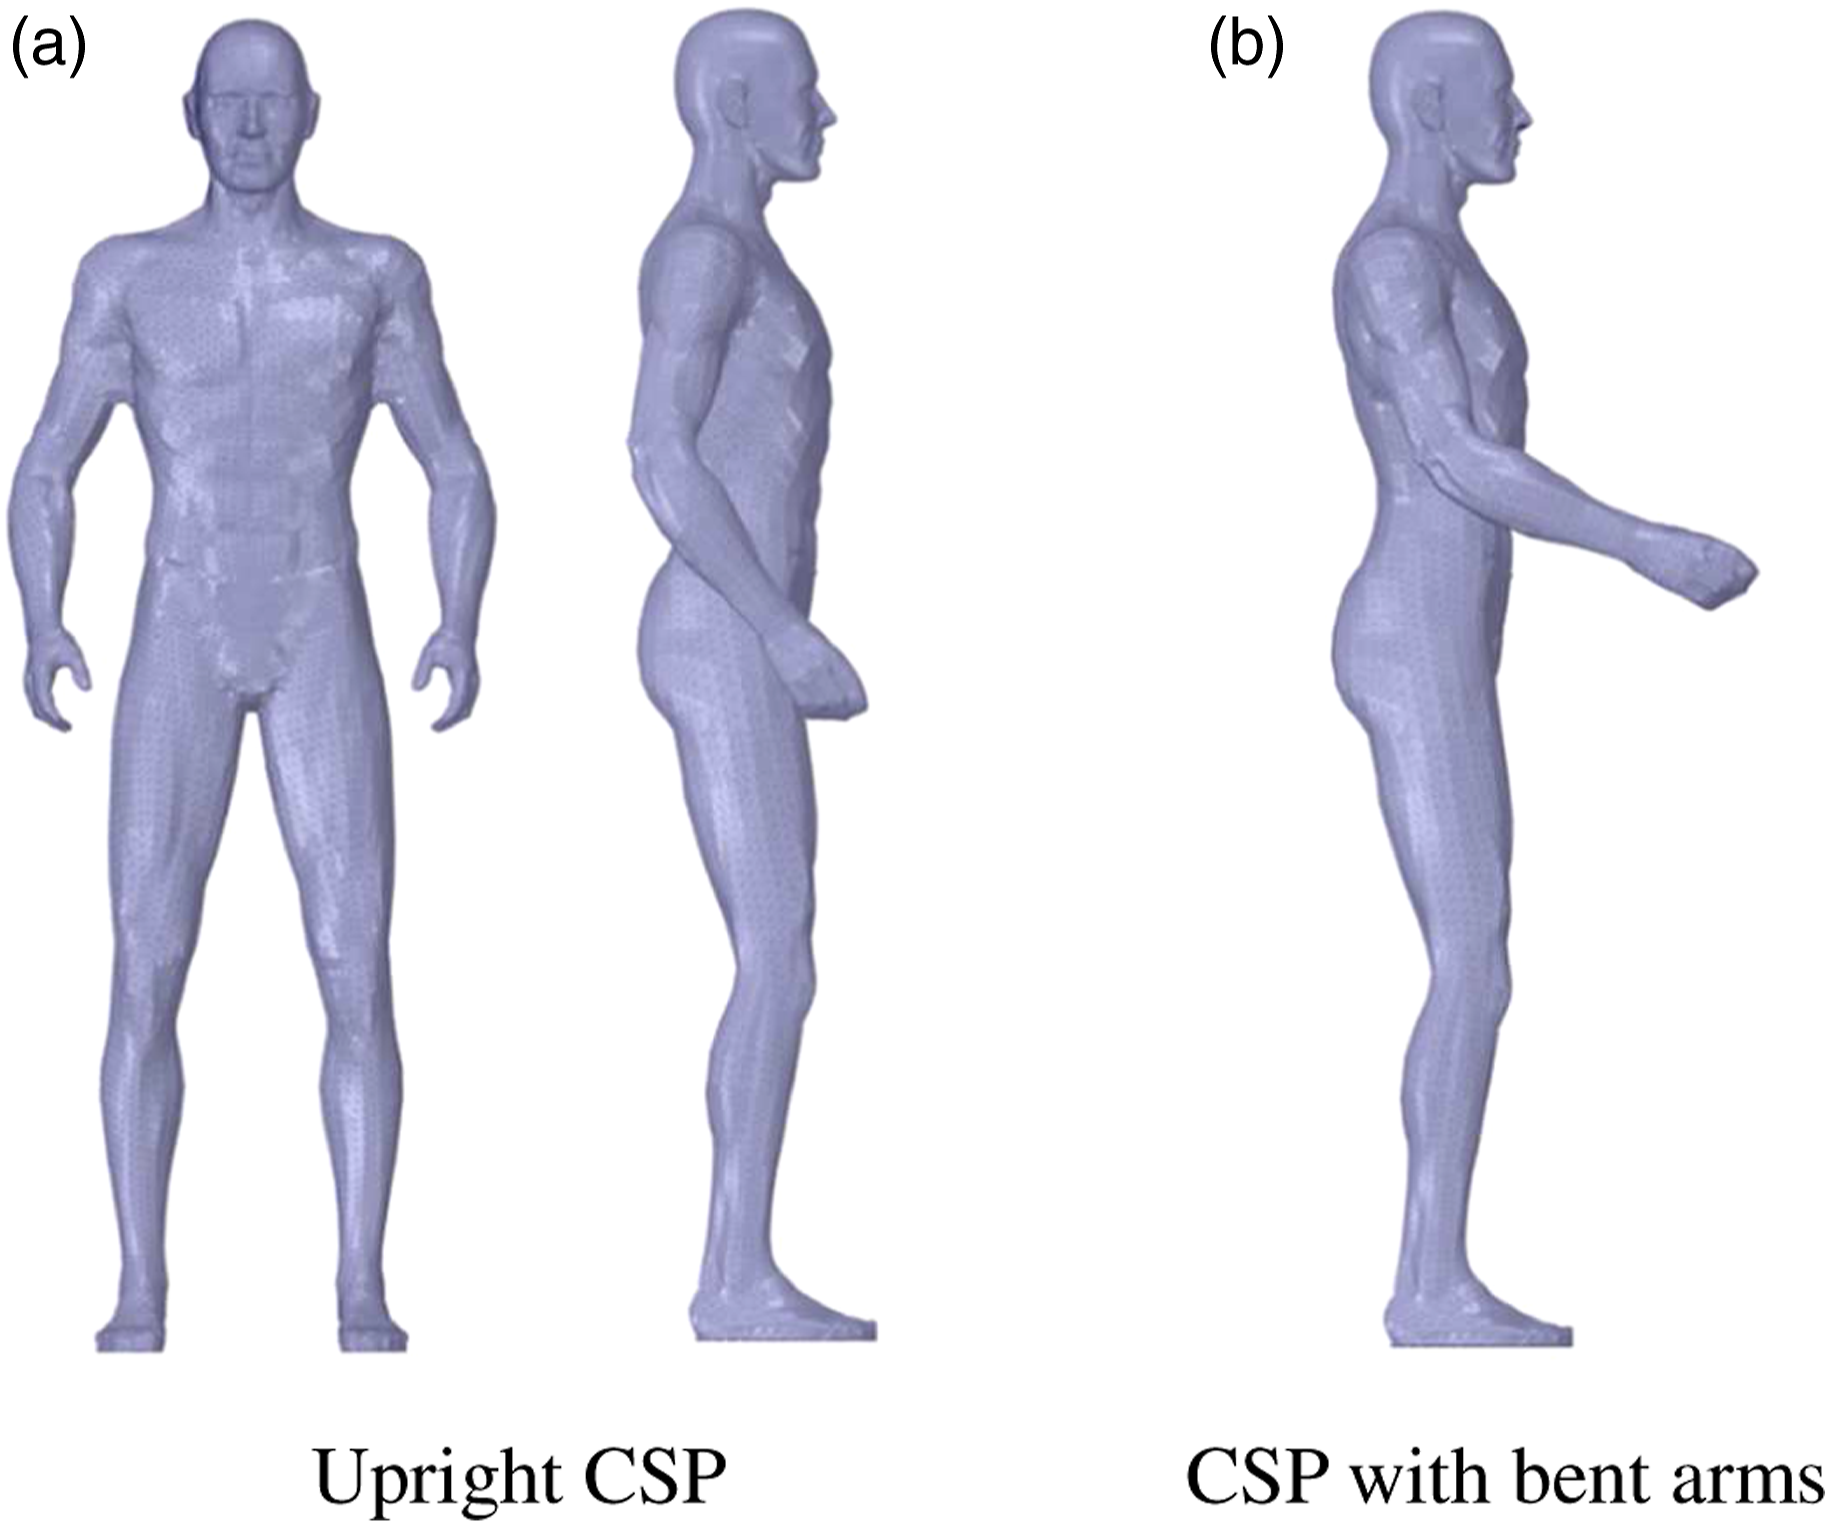
Outline of the numerical analysis
Outline of cases.
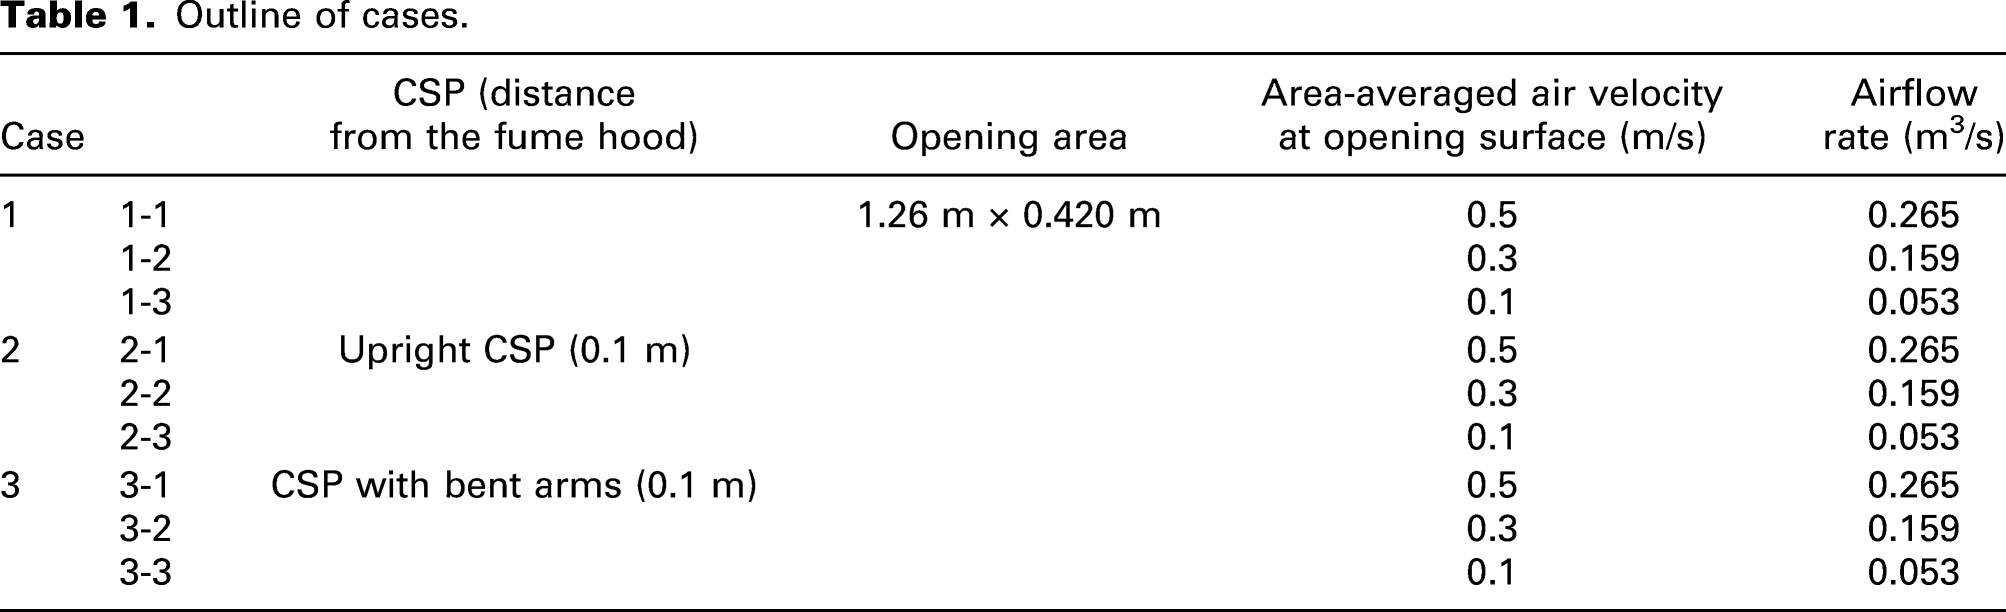

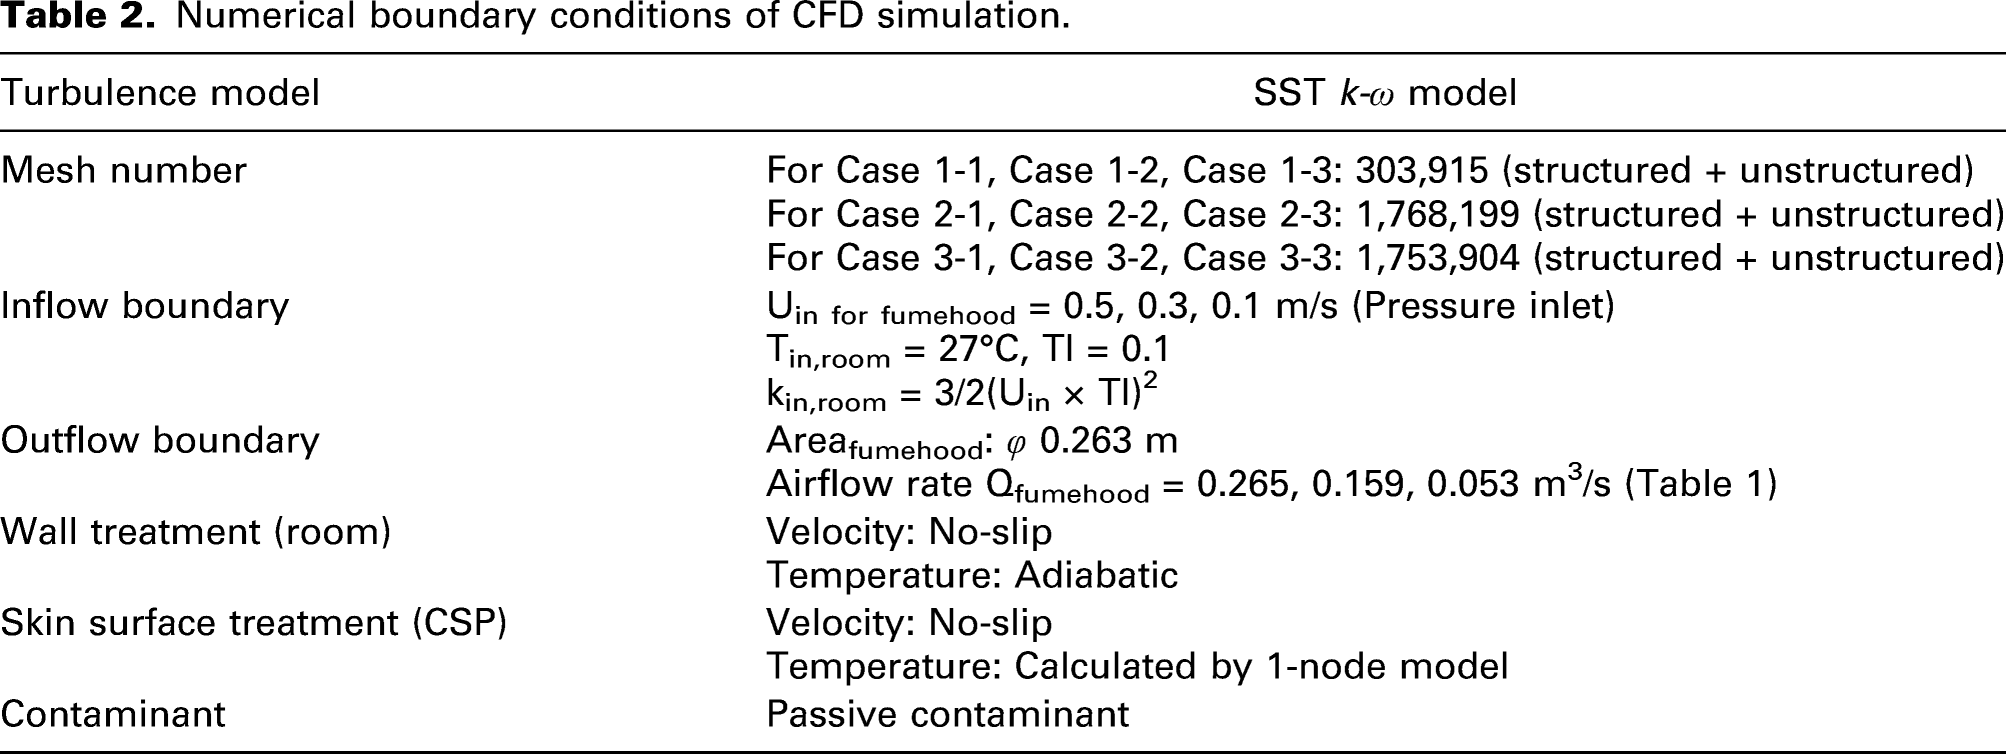
Numerical boundary conditions of CFD simulation.
Here,
The analysis of SVE3 was conducted to discuss the contaminant capture efficiency and leakage from the fume hood. A hypothetical contaminant with the same physical properties as air was assumed as the contaminant, and a passive scalar was generated uniformly inside the fume hood. In addition, to reproduce a more realistic usage, the contaminant was generated at the workbench in a fume hood. The analysis of L-PFR was carried out under the condition that passive contaminants were uniformly generated inside the fume hood and its working space. The NEV analysis was conducted under the condition that passive contaminants were generated individually in each control volume of the opening surface of the fume hood (boundary surface between the laboratory space and fume hood).
Quality control for CFD
The computational models were discretized and meshed using ICEM-CFD (ANSYS Inc.) with polyhedral mesh elements through the finite volume method (FVM). 25 For the human body surface and the inner wall surface of the fume hood, a refined mesh of approximately 0.01 mm prism layer was used as the first layer at the wall surface to resolve the flow profile inside the viscous sublayer. The complicated geometries of the human body and inner structure of the fume hood were carefully constructed to accurately reproduce realistic targets and enable accurate fluid analysis. The non-dimensional wall distance, wall unit, y+ ranged from less than 1, depending on the morphometric features and flow field of each analysis condition. A grid independence test was carefully performed. To balance the computational cost and accuracy, 1.7 million hybrid meshes were used for cases with CSP. The maximum skewness was less than 0.9, and the minimum orthogonal quality was higher than 0.02 in all models. The maximum skewness and minimum orthogonal quality values were controlled to meet the standards of the CFD benchmark results and guidelines.29–33
In order to validate the prediction accuracy of CFD analysis, we measured the air velocity distribution at the opening of the fume hood and compared the measurements with CFD analysis results. (Supplementary Material)
Results
Flow field around the fume hood
Figure 3 shows the results of velocity distribution around the fume hood at cross section A (Z = 1.63 m) (Figure 1(b)). Figure 4 shows the streamline in the lower part of the fume hood (Z-X cross section, Y = 0.9 m). Velocity distribution around the fume hood (Z = 1.63 m, X-Y cross section). Streamline around the fume hood (Y = 0.90 m, Z-X cross section).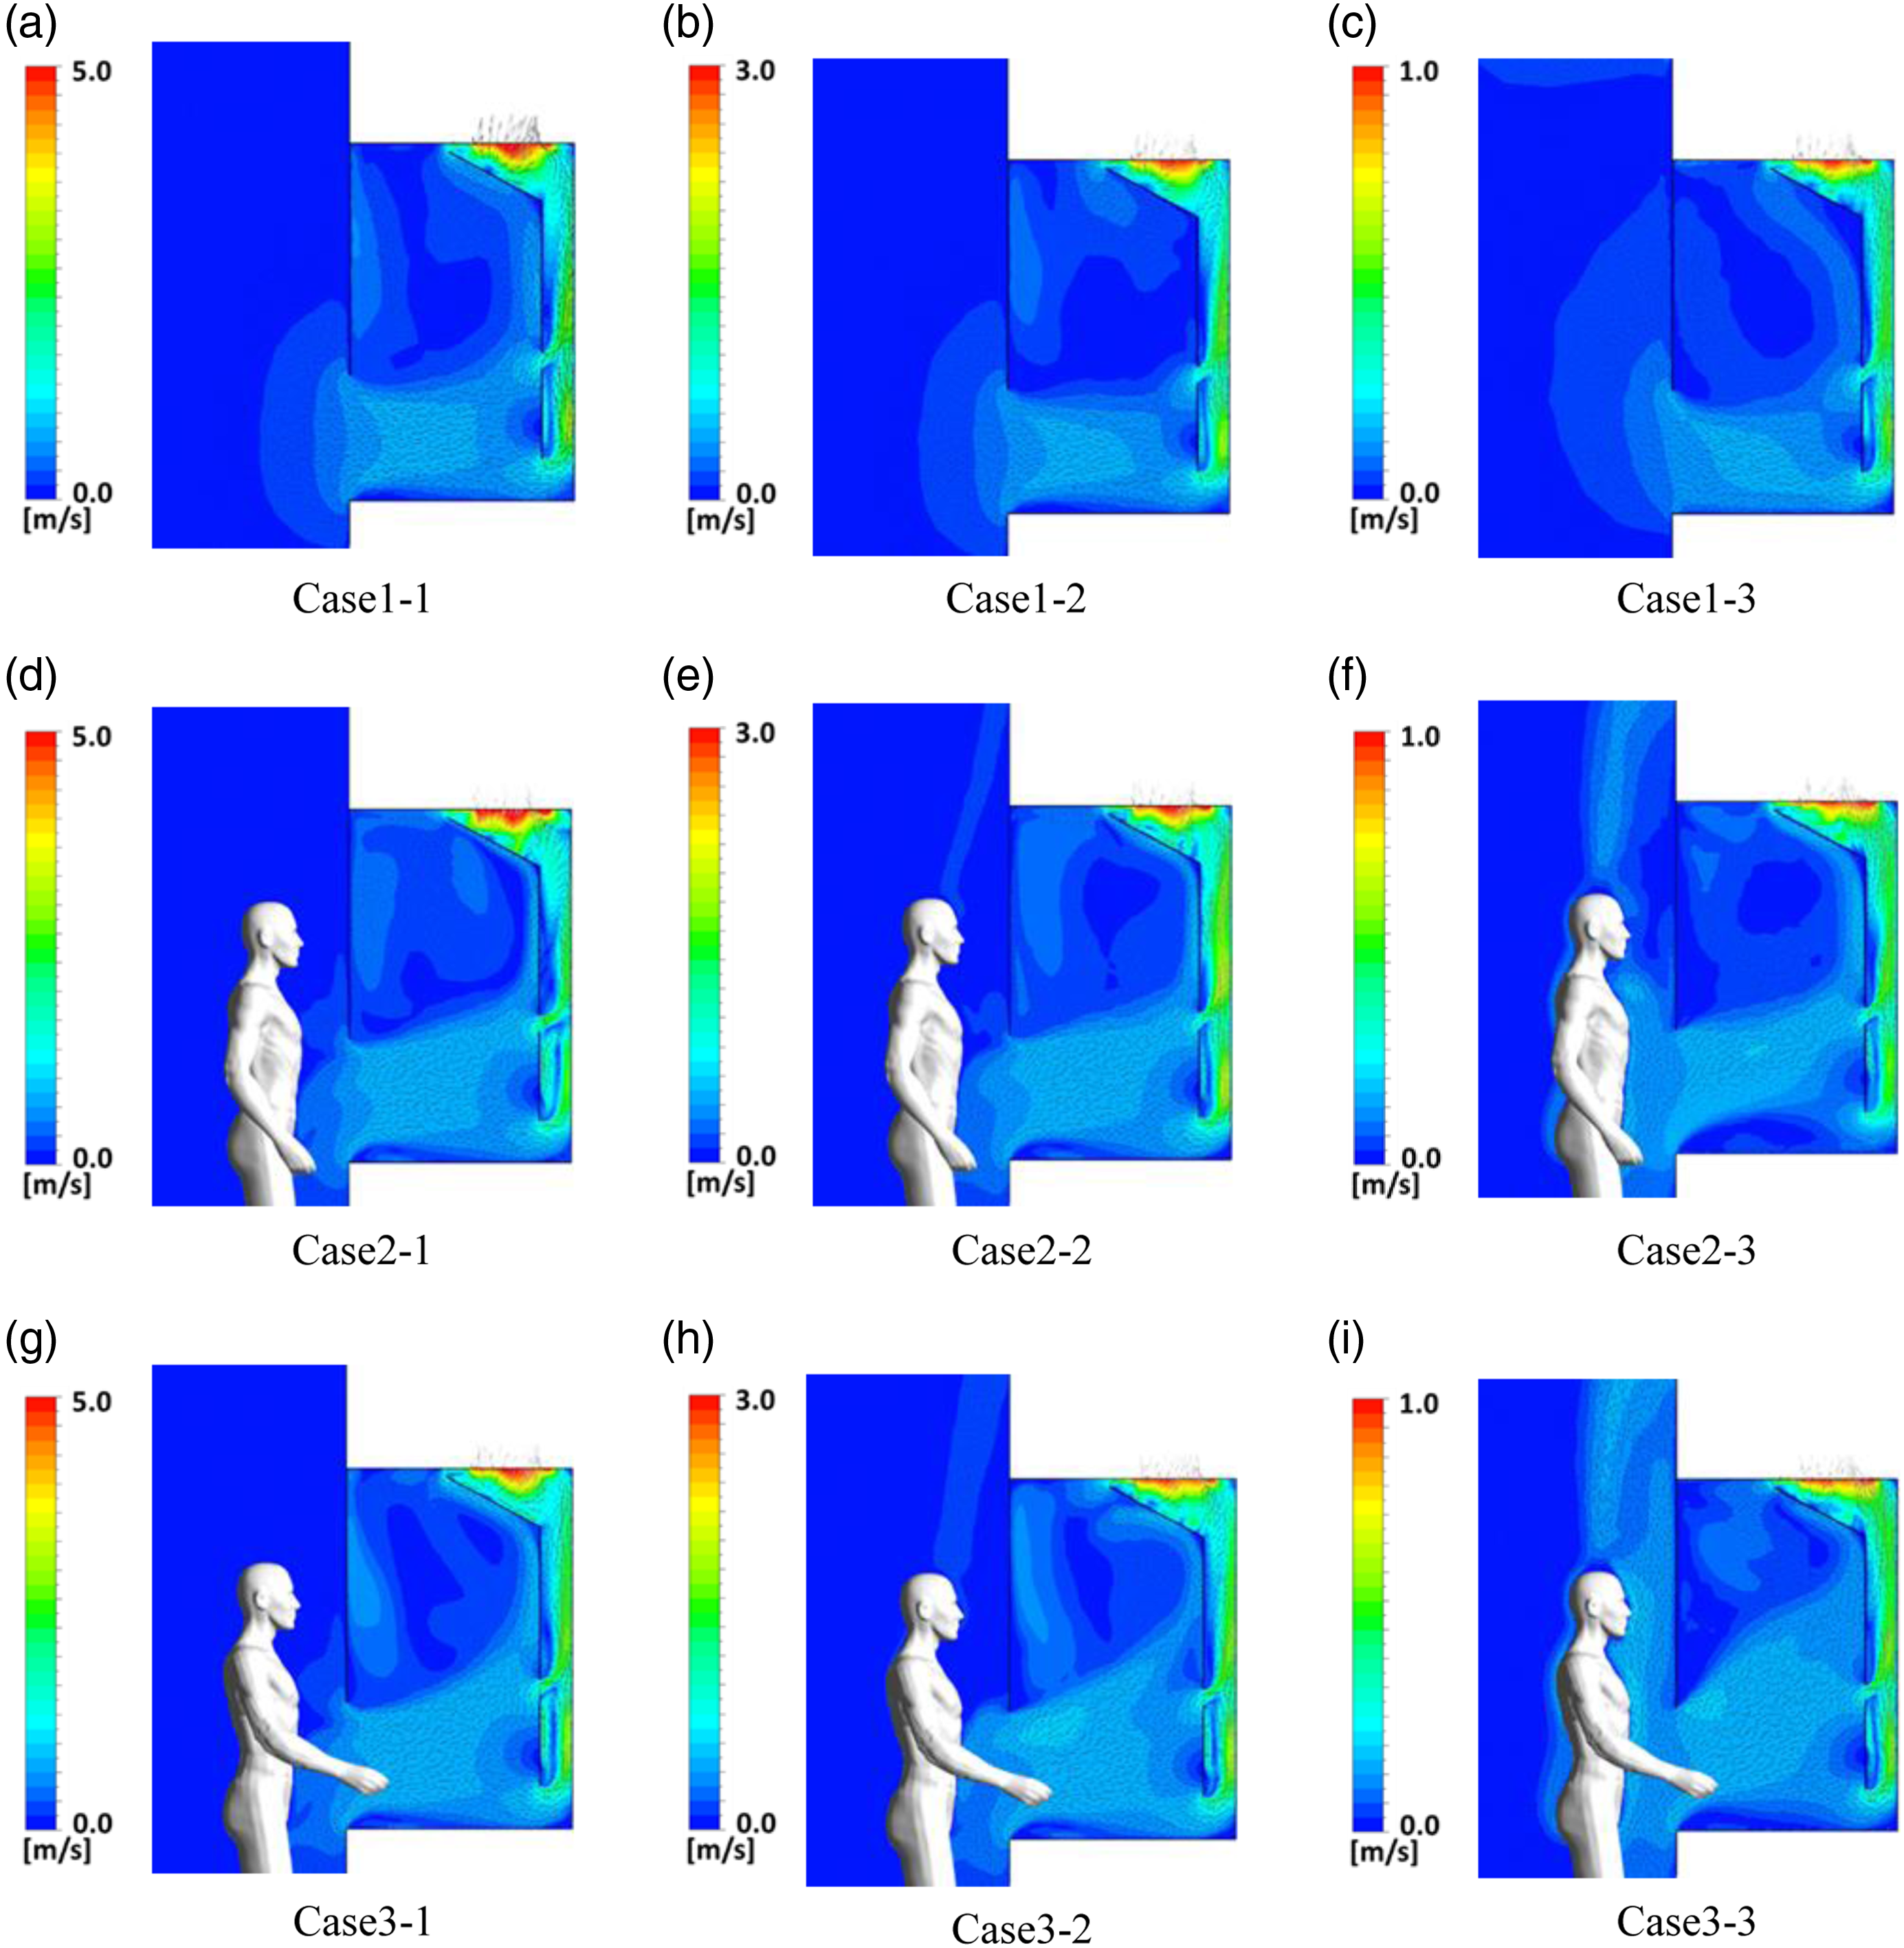

In Case 1 with no CSP in front of the fume hood, the air in the laboratory space flowed into the fume hood from the opening surface and entered the exhaust duct through the gap between the baffle plates. In addition, a large circulating flow was formed in the upper space inside the fume hood. In contrast, turbulent airflow was observed in the space between the CSP and the fume hood in Case 2 and Case 3.
When the exhaust airflow rate of the fume hood was reduced, the upward flow around the CSP due to metabolic heat generation became clear. In Case 2-2 and Case 3-2, where the opening surface wind speed was set to 0.3 m/s, the effect of the upward flow around the CSP was small. However, in Case 2-3 and Case 3-3, where the opening surface wind speed was set to 0.1 m/s, the upward flow around the CSP disturbed the inflow air into the fume hood. In particular, in Case 3-3, where the exhaust airflow rate was low and the CSP’s arm was inserted into the fume hood, the circulation flow in the upper part of the fume hood was disturbed.
The maximum velocity at the opening surface of the fume hood in the laboratory is approximately 0.5 m/s which is still in the low Reynolds number flow. As shown in Figure 4, no significant detachment was observed owing to the airflow from the laboratory side into the fume hood colliding with the CSP. In Case 2-3 and Case 3-3, turbulence was observed at the workbench. The upward flow around the CSP affected the direction of inflow air into the fume hood and formed a stagnant zone in the lower part of the fume hood. These zones would be a negative factor in terms of fume hood performance because they may form a high contaminant concentration zone near the workbench.
Velocity distribution at the opening surface of fume hood
Figure 5 shows the results of velocity distribution at the opening surface of the fume hood at cross section B (Figure 1(c)), where U
a
is the averaged scalar velocity at the opening surface and Velocity distribution at opening surface of the fume hood (m/s).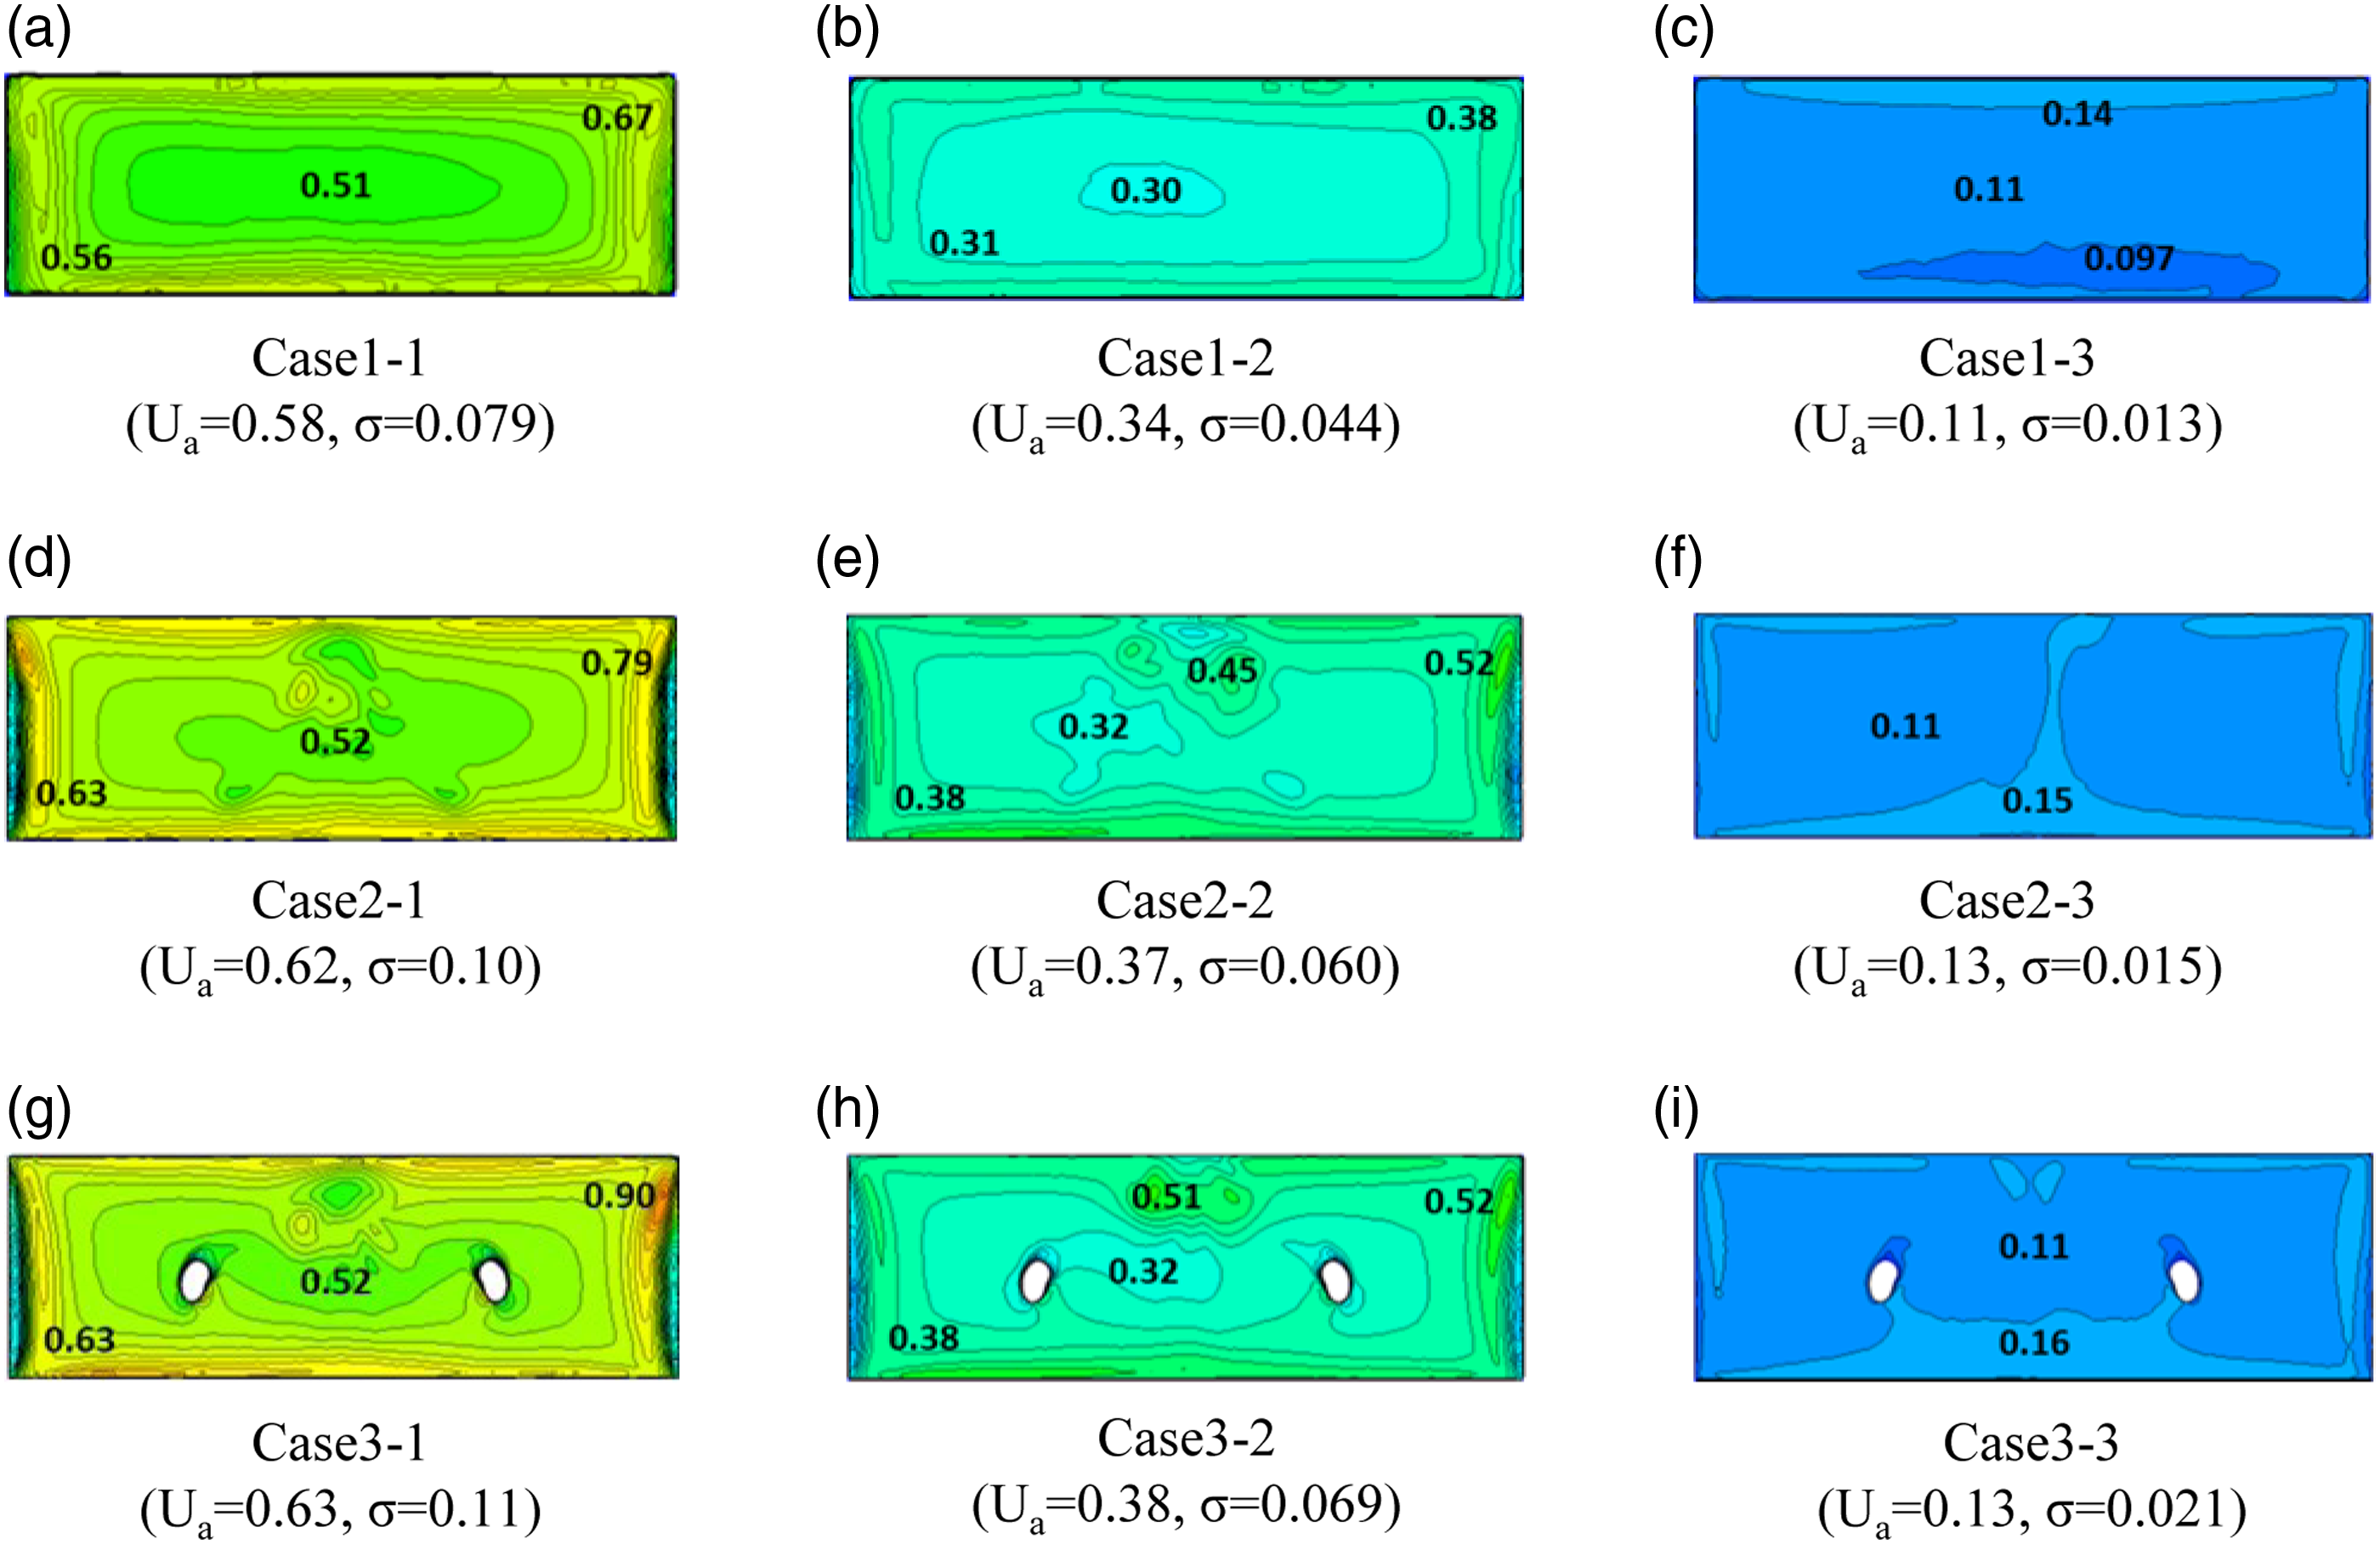
Under the same conditions of surface velocity, U
a
and
Concentration distribution inside the fume hood
Figure 6 shows the results of the SVE3 distribution inside the fume hood at cross section A (Z = 1.63 m) (Figure 1(b)) when the contaminant was uniformly generated inside the fume hood. The Ca values represent the volume-average contaminant concentration [-] in the fume hood. The contaminant concentration for all cases was standardized using the perfect mixing concentration estimated from the exhaust concentration in Case 1. Non-dimensional concentration distribution inside the fume hood (Z = 1.63 m, X-Y cross section). Case of uniform generation inside the fume hood.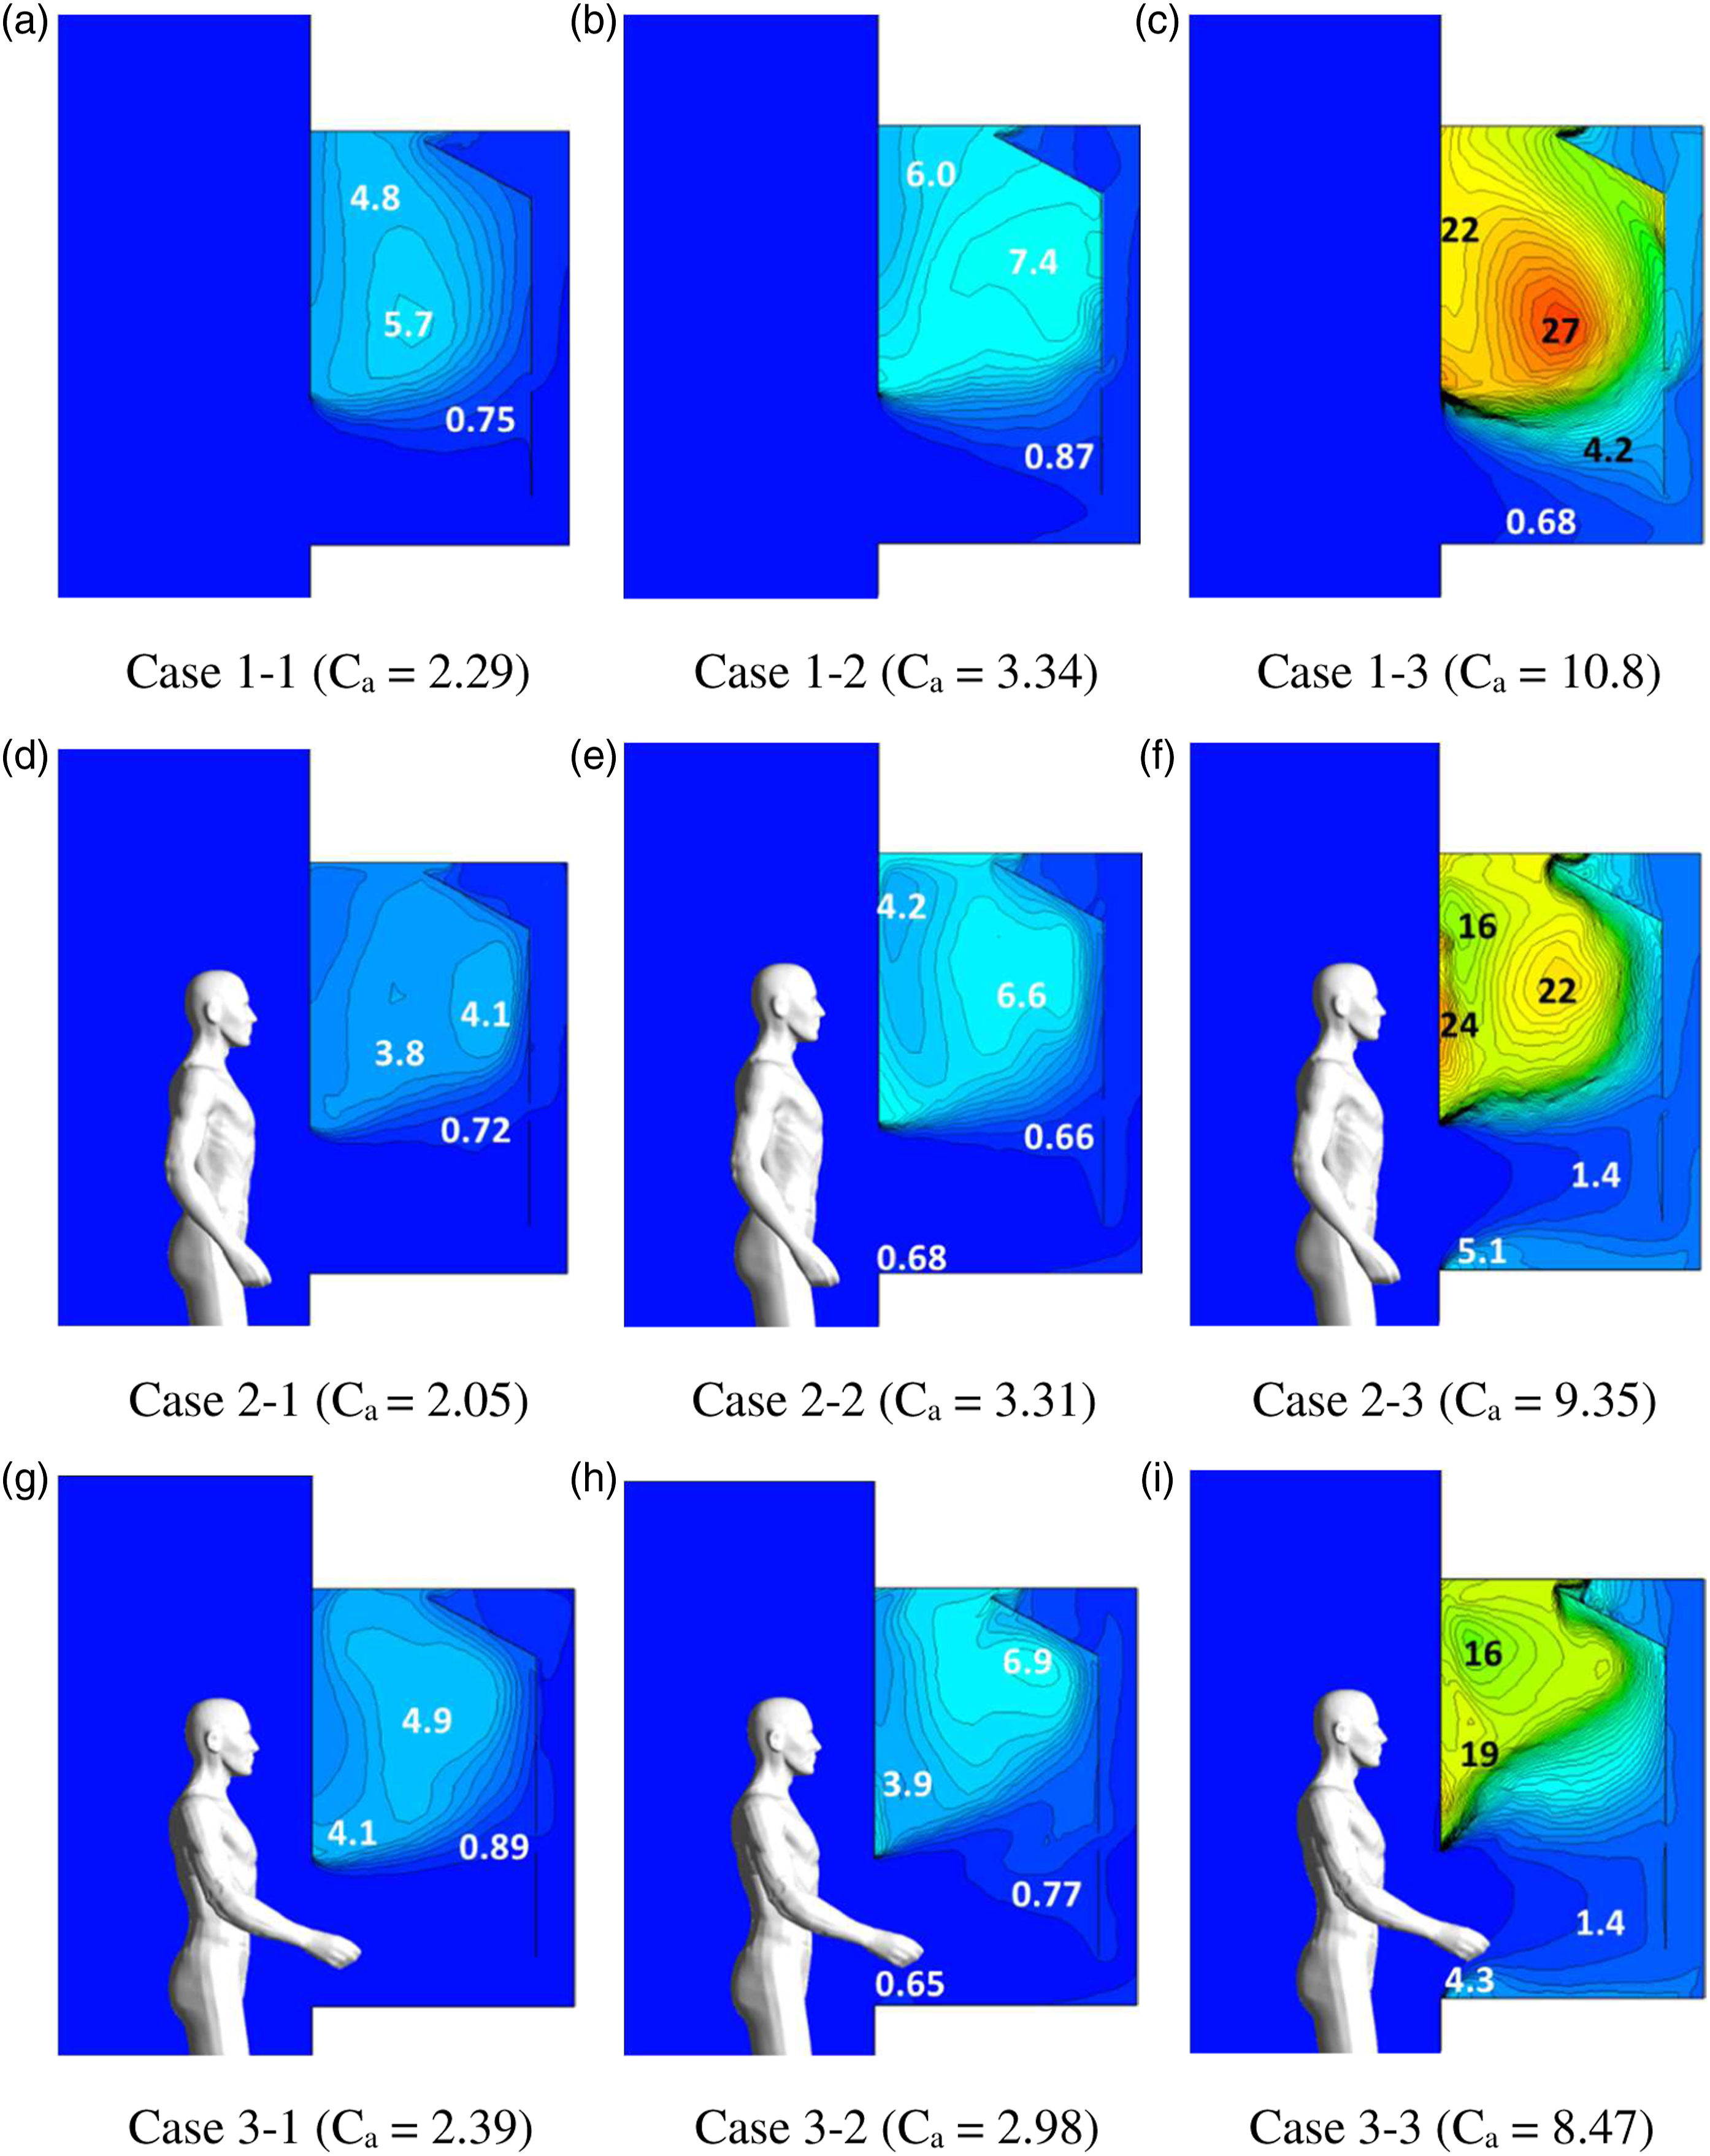
In all cases, the Ca values were found to increase as the exhaust airflow rate of the fume hood was decreased. In Case 1-1, Case 2-1 and Case 3-1, where the surface wind speed was set to 0.5 m/s, the contaminants were contained by the circulating flow in the upper part of the fume hood, regardless of the presence or absence of CSP. In addition, in all cases, the capture performance by the circulating flow was found to decrease with a decrease in the exhaust airflow rate. As a result, the contaminant concentration distribution spread widely inside the fume hood. In particular, in Case 2-3 and Case 3-3, where the surface wind speed was set to 0.1 m/s and CSP was located in front of the fume hood, contaminants in the lower part of the fume hood were not exhausted because of the stagnant zone generated in the lower part and high concentration zone was formed. As a result, the Ca values of Case 3-3 were lower than those of Case 2-3. In other words, the effect of the CSP’s arm reduced the capture performance of the fume hood, and the contaminant distribution inside the fume hood became closer to a uniform distribution. This spread of the contaminant is a negative factor in terms of worker exposure.
Figure 7 shows the results of concentration distribution inside the fume hood at cross section A (Z = 1.63 m) (Figure 1(b)) when contaminants were uniformly generated on the workbench in the fume hood. The concentration of the contaminant in the fume hood for all cases was standardized using the perfect mixing concentration estimated from the exhaust concentration in Case 1. In all cases, the contaminant generated on the workbench was exhausted into the exhaust duct by the airflow from the opening surface. In Case 2 and Case 3, where CSP was located in front of the fume hood, the contaminants stagnated near the opening surface of the workbench regardless of the working posture. Even under conditions of low exhaust airflow with CSP, the contaminants did not diffuse inside the fume hood, and no containment by circulating flow in the upper part was observed. Concentration distribution inside the fume hood (Z = 1.63 m, X-Y cross section). Case of uniform surface generation on the workbench in fume hood.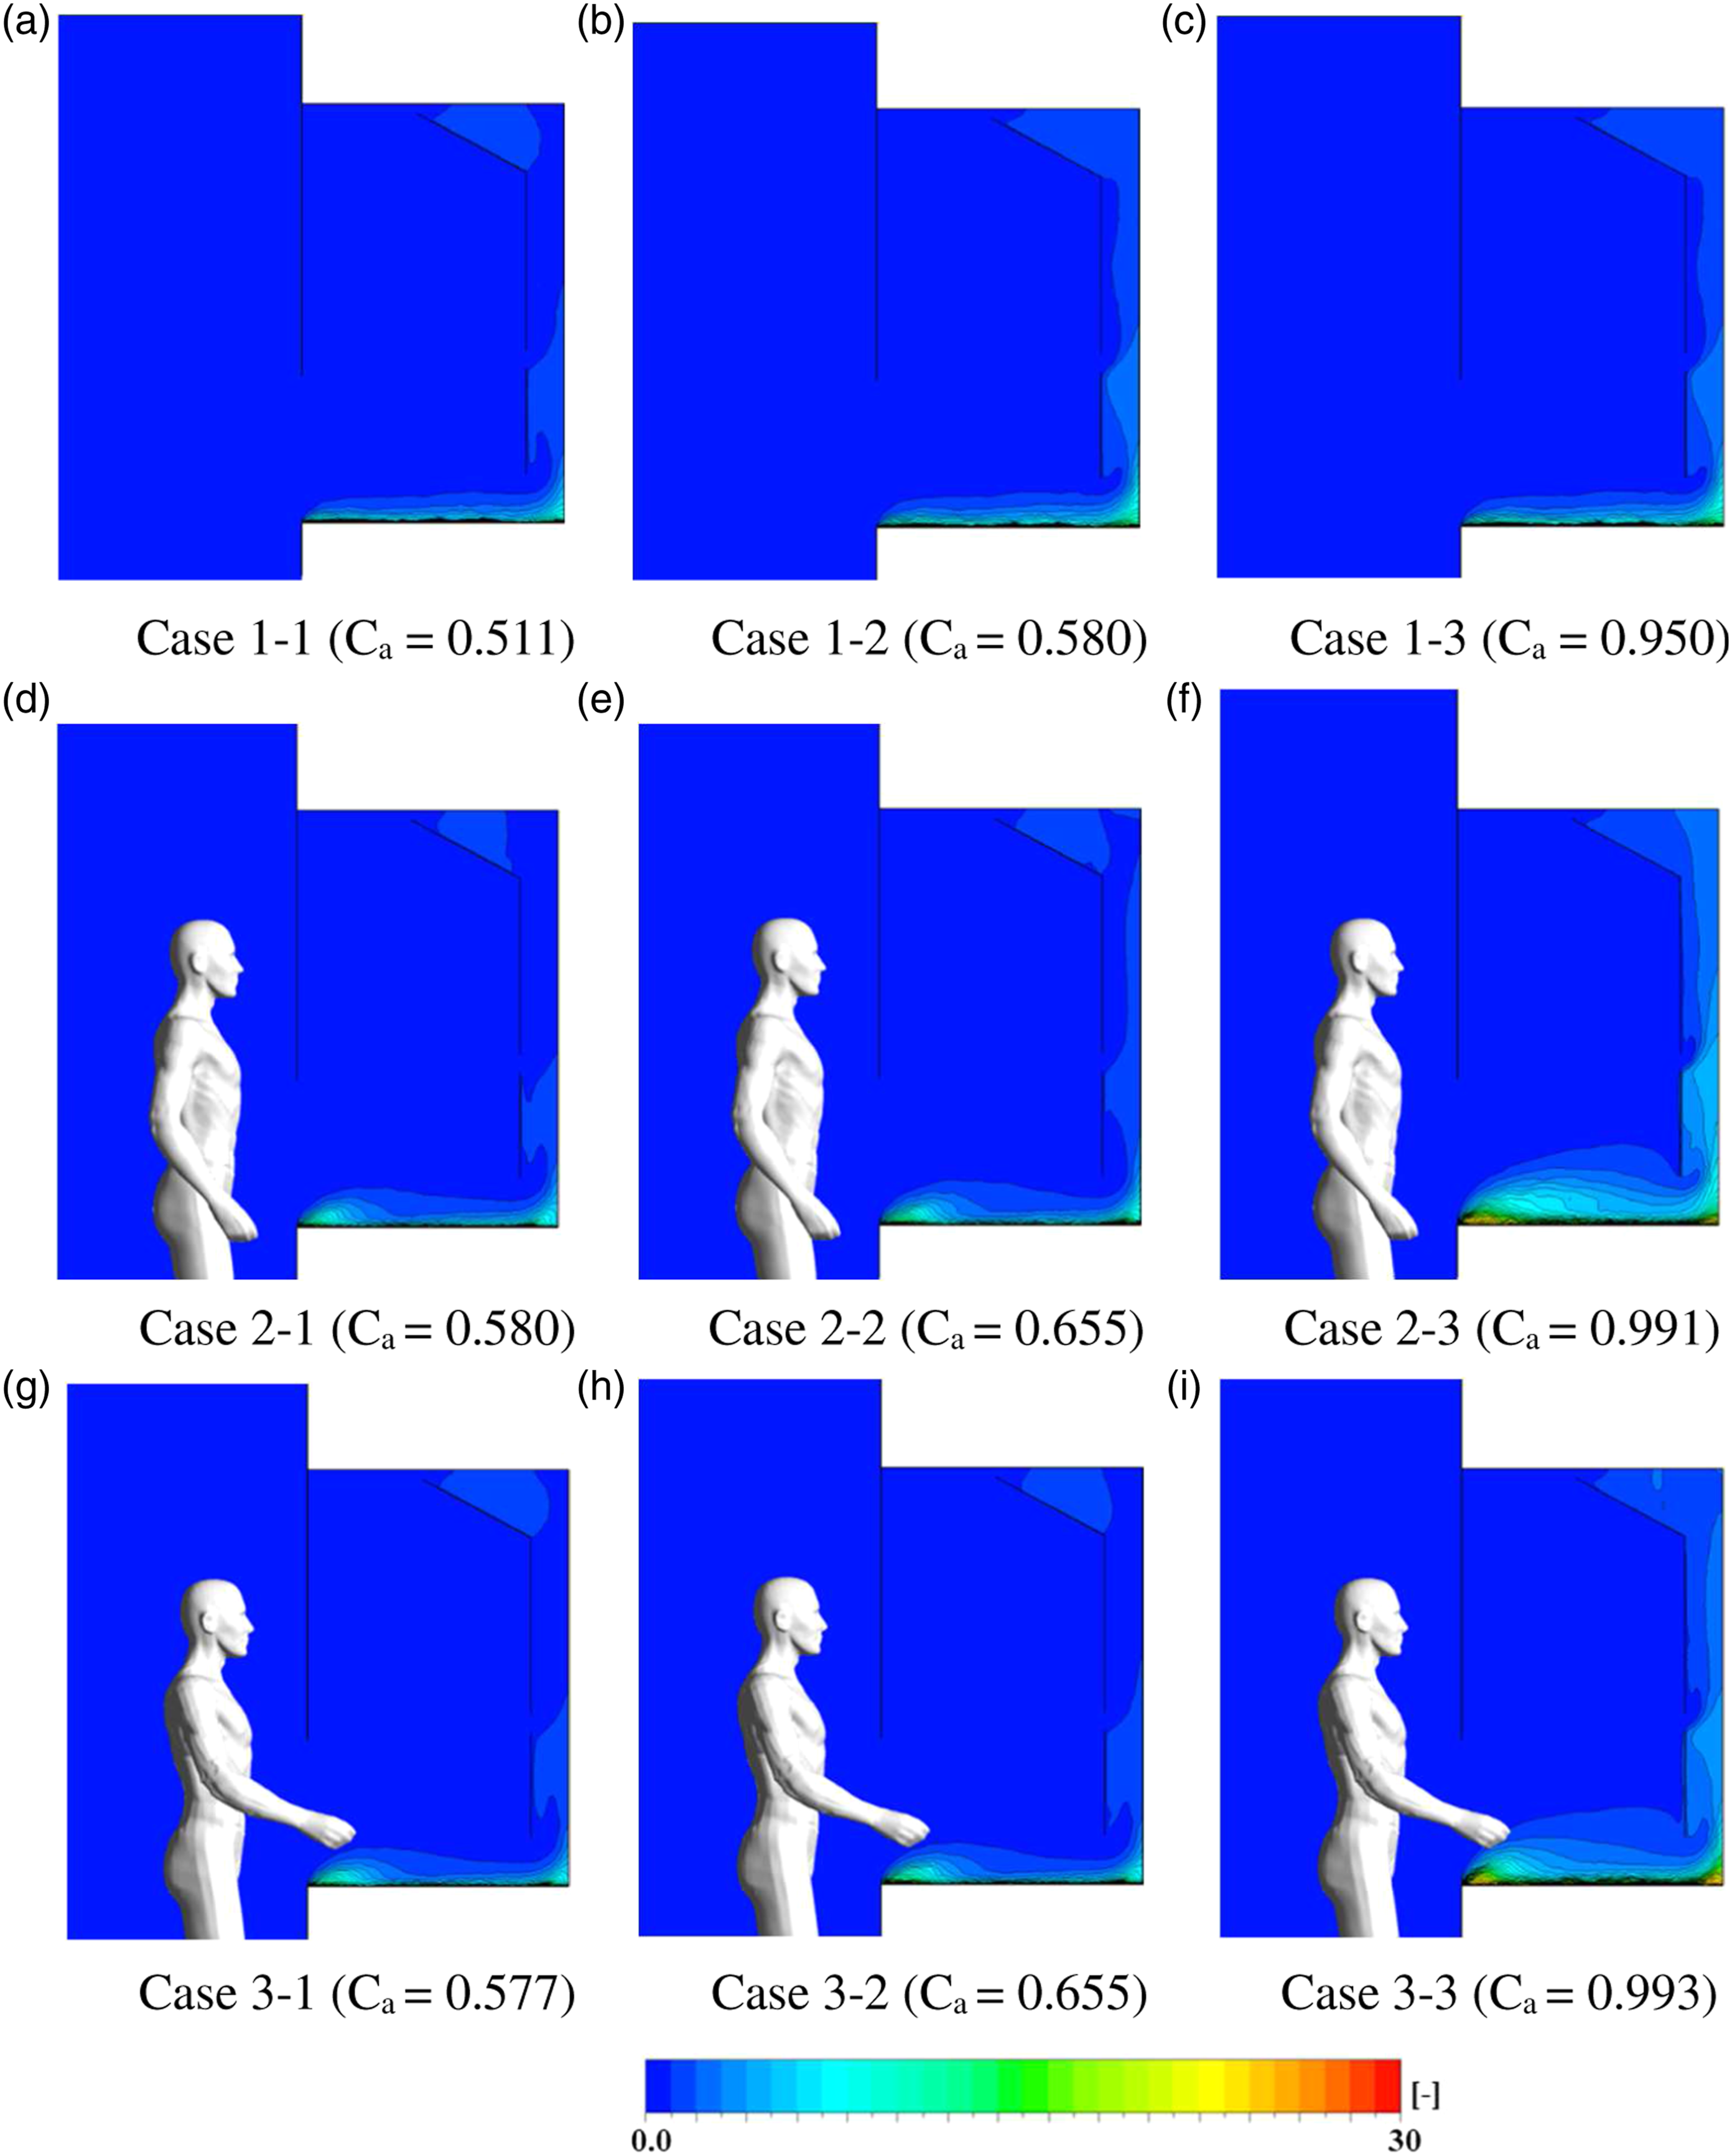
Net escape velocity
Figures 8 and 9 show the results of the vectors of the NEV and advection velocity in Y = 0.9–1.23 m on the line aa’ and in Z = 1.03–2.23 m on the line bb’ (Figure 1(c)), respectively. Magnitudes of each vector in Figures 8 and 9 were standardized using the wind speed at each opening surface. Figure 10 shows the results of the NEV values normalized by the advection velocity of each control volume on lines aa’ and bb’. As mentioned previously, the NEV, as defined in equation (5), represents the actual contaminant transport velocity at a point that considers advection and diffusion velocity. Therefore, we can consider the effect of turbulent diffusion by determining the normalized NEV (NEV/U
a
), which determines the NEV normalized by the average scalar opening surface velocity U
a
. That is, a higher value of NEV/U
a
was significantly affected by the turbulence diffusion compared to the advection velocity, and the value of 1 for NEV/U
a
indicates a state without the effect of turbulence diffusion. In addition, if the value of NEV/U
a
was less than 1.0, the turbulence diffusion occurred in the opposite direction from the point of the target surface. NEV vectors and advection vectors on the line aa’ (X-Y cross section) U: wind speed at opening surface. NEV vectors and advection vectors on the line bb’ (Z-X cross section). Normalized NEV (NEV/Ua) [-] on the line aa’ and bb’.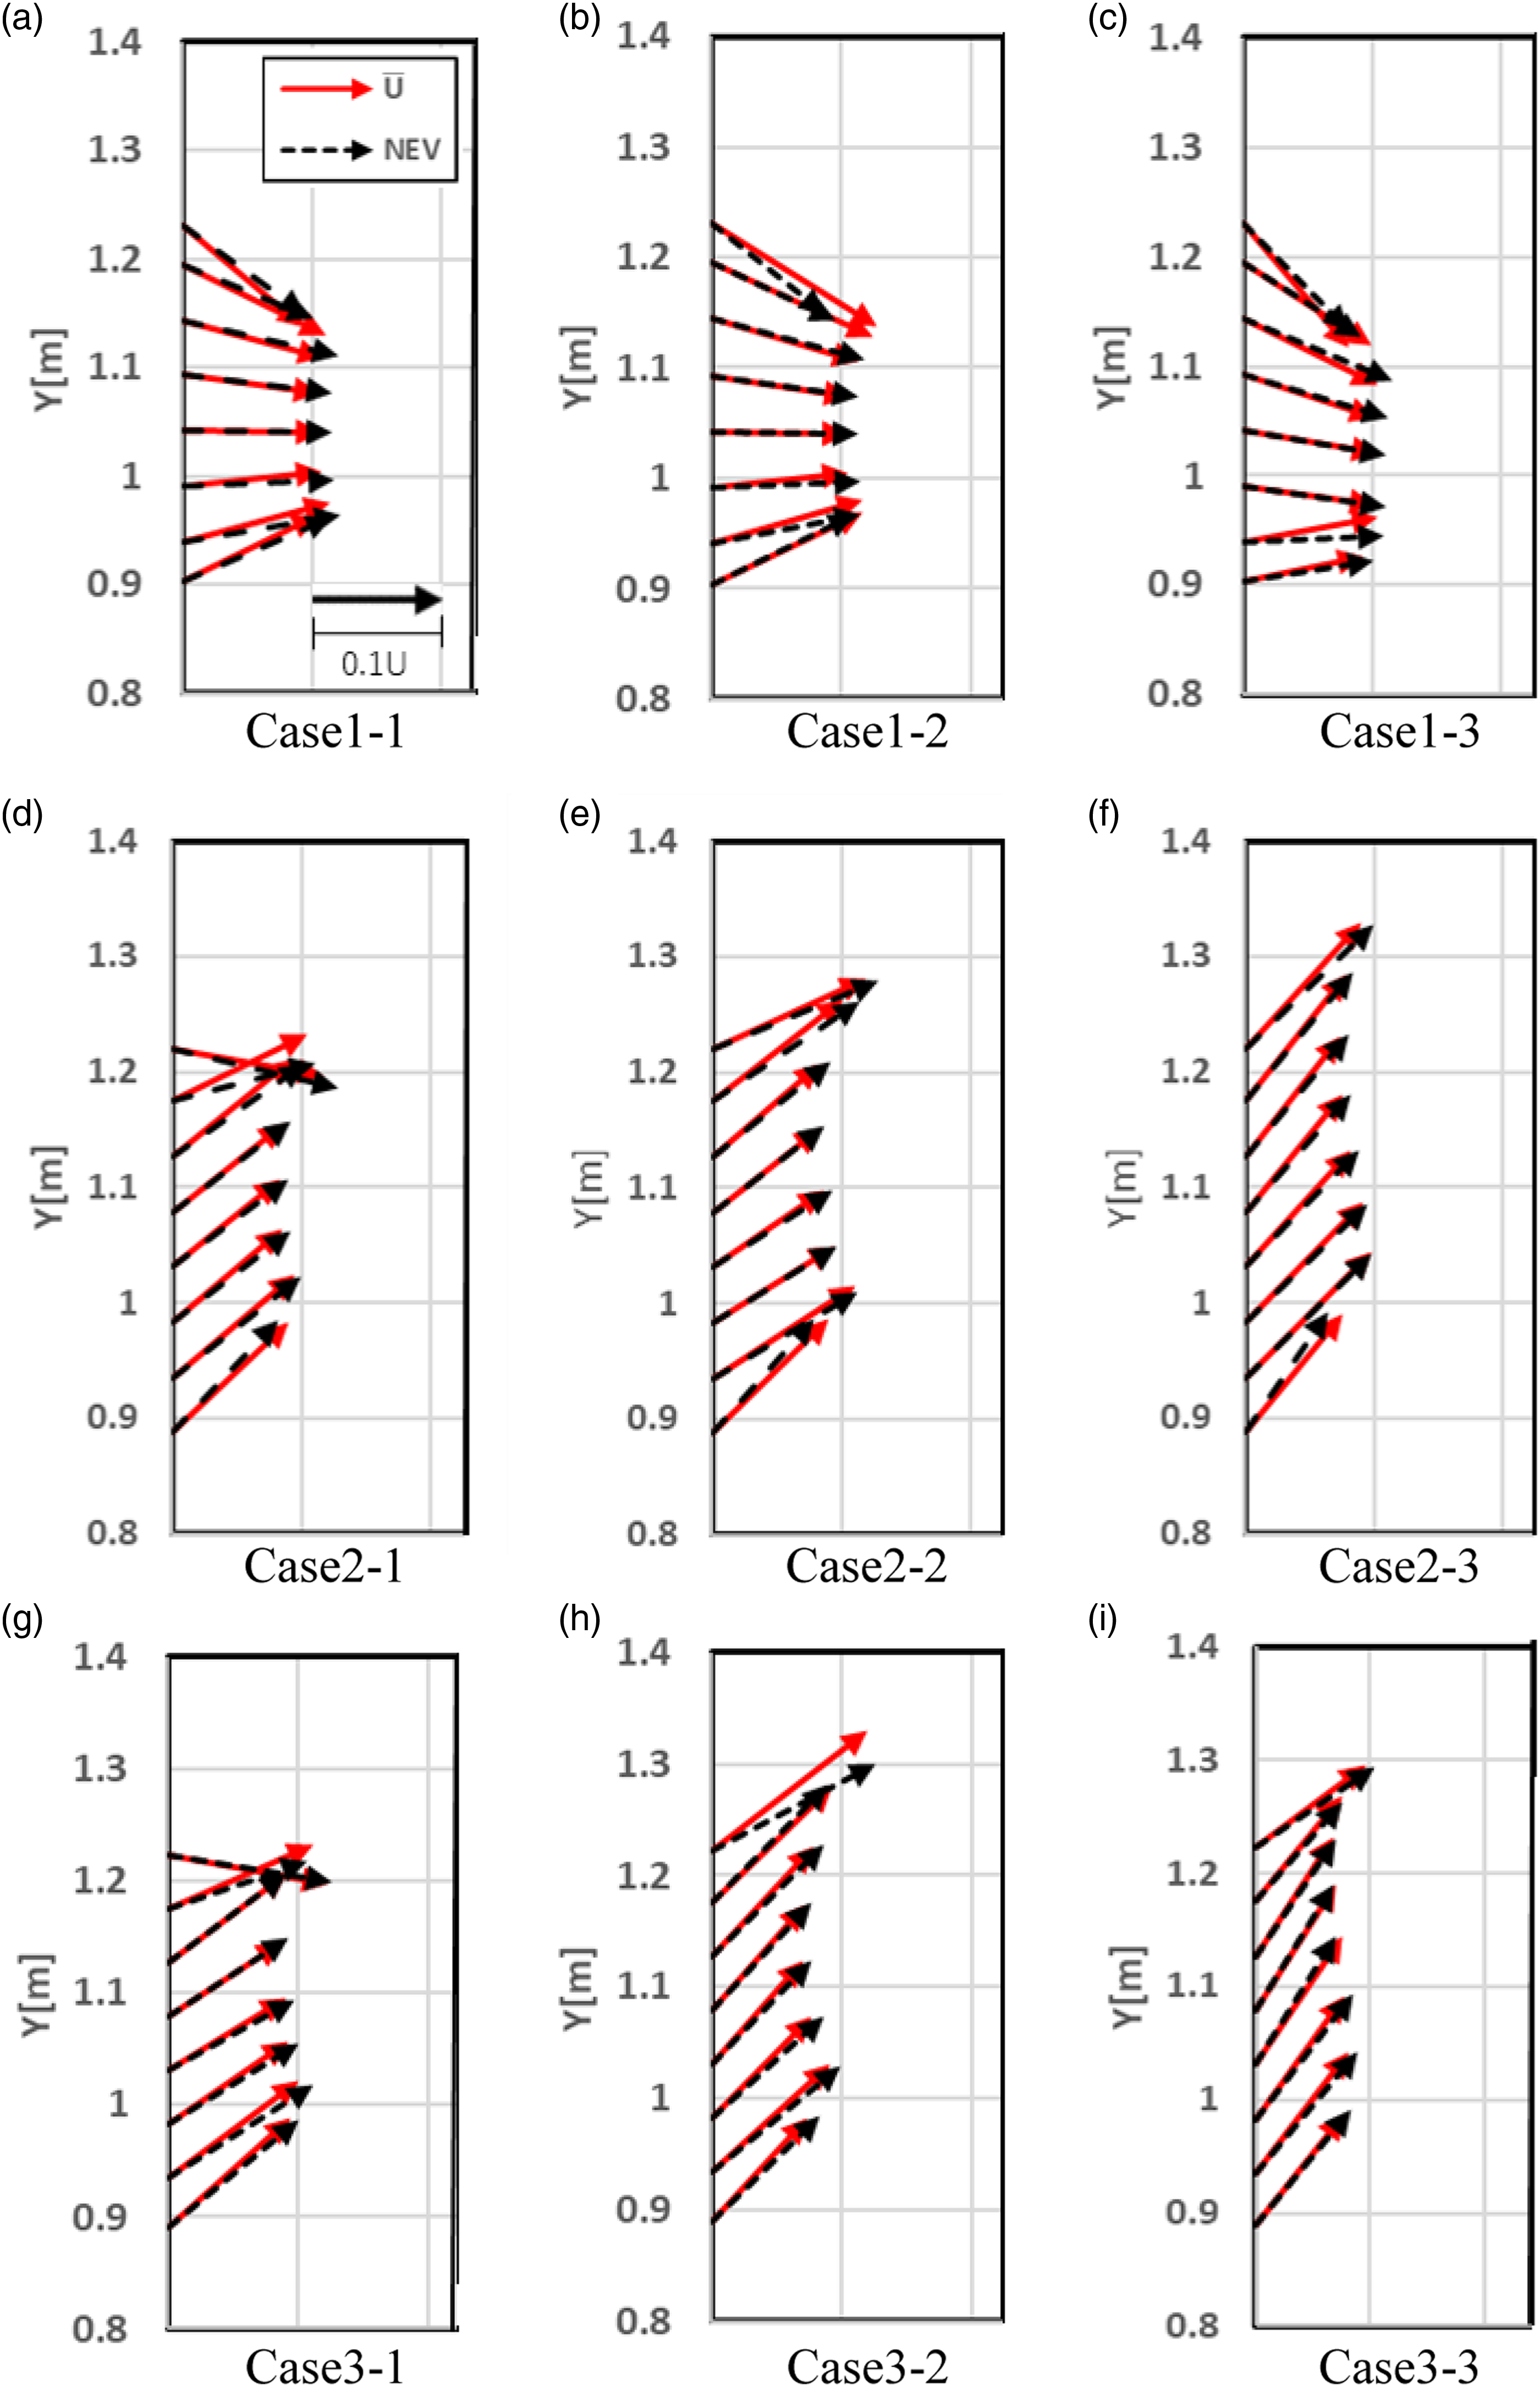
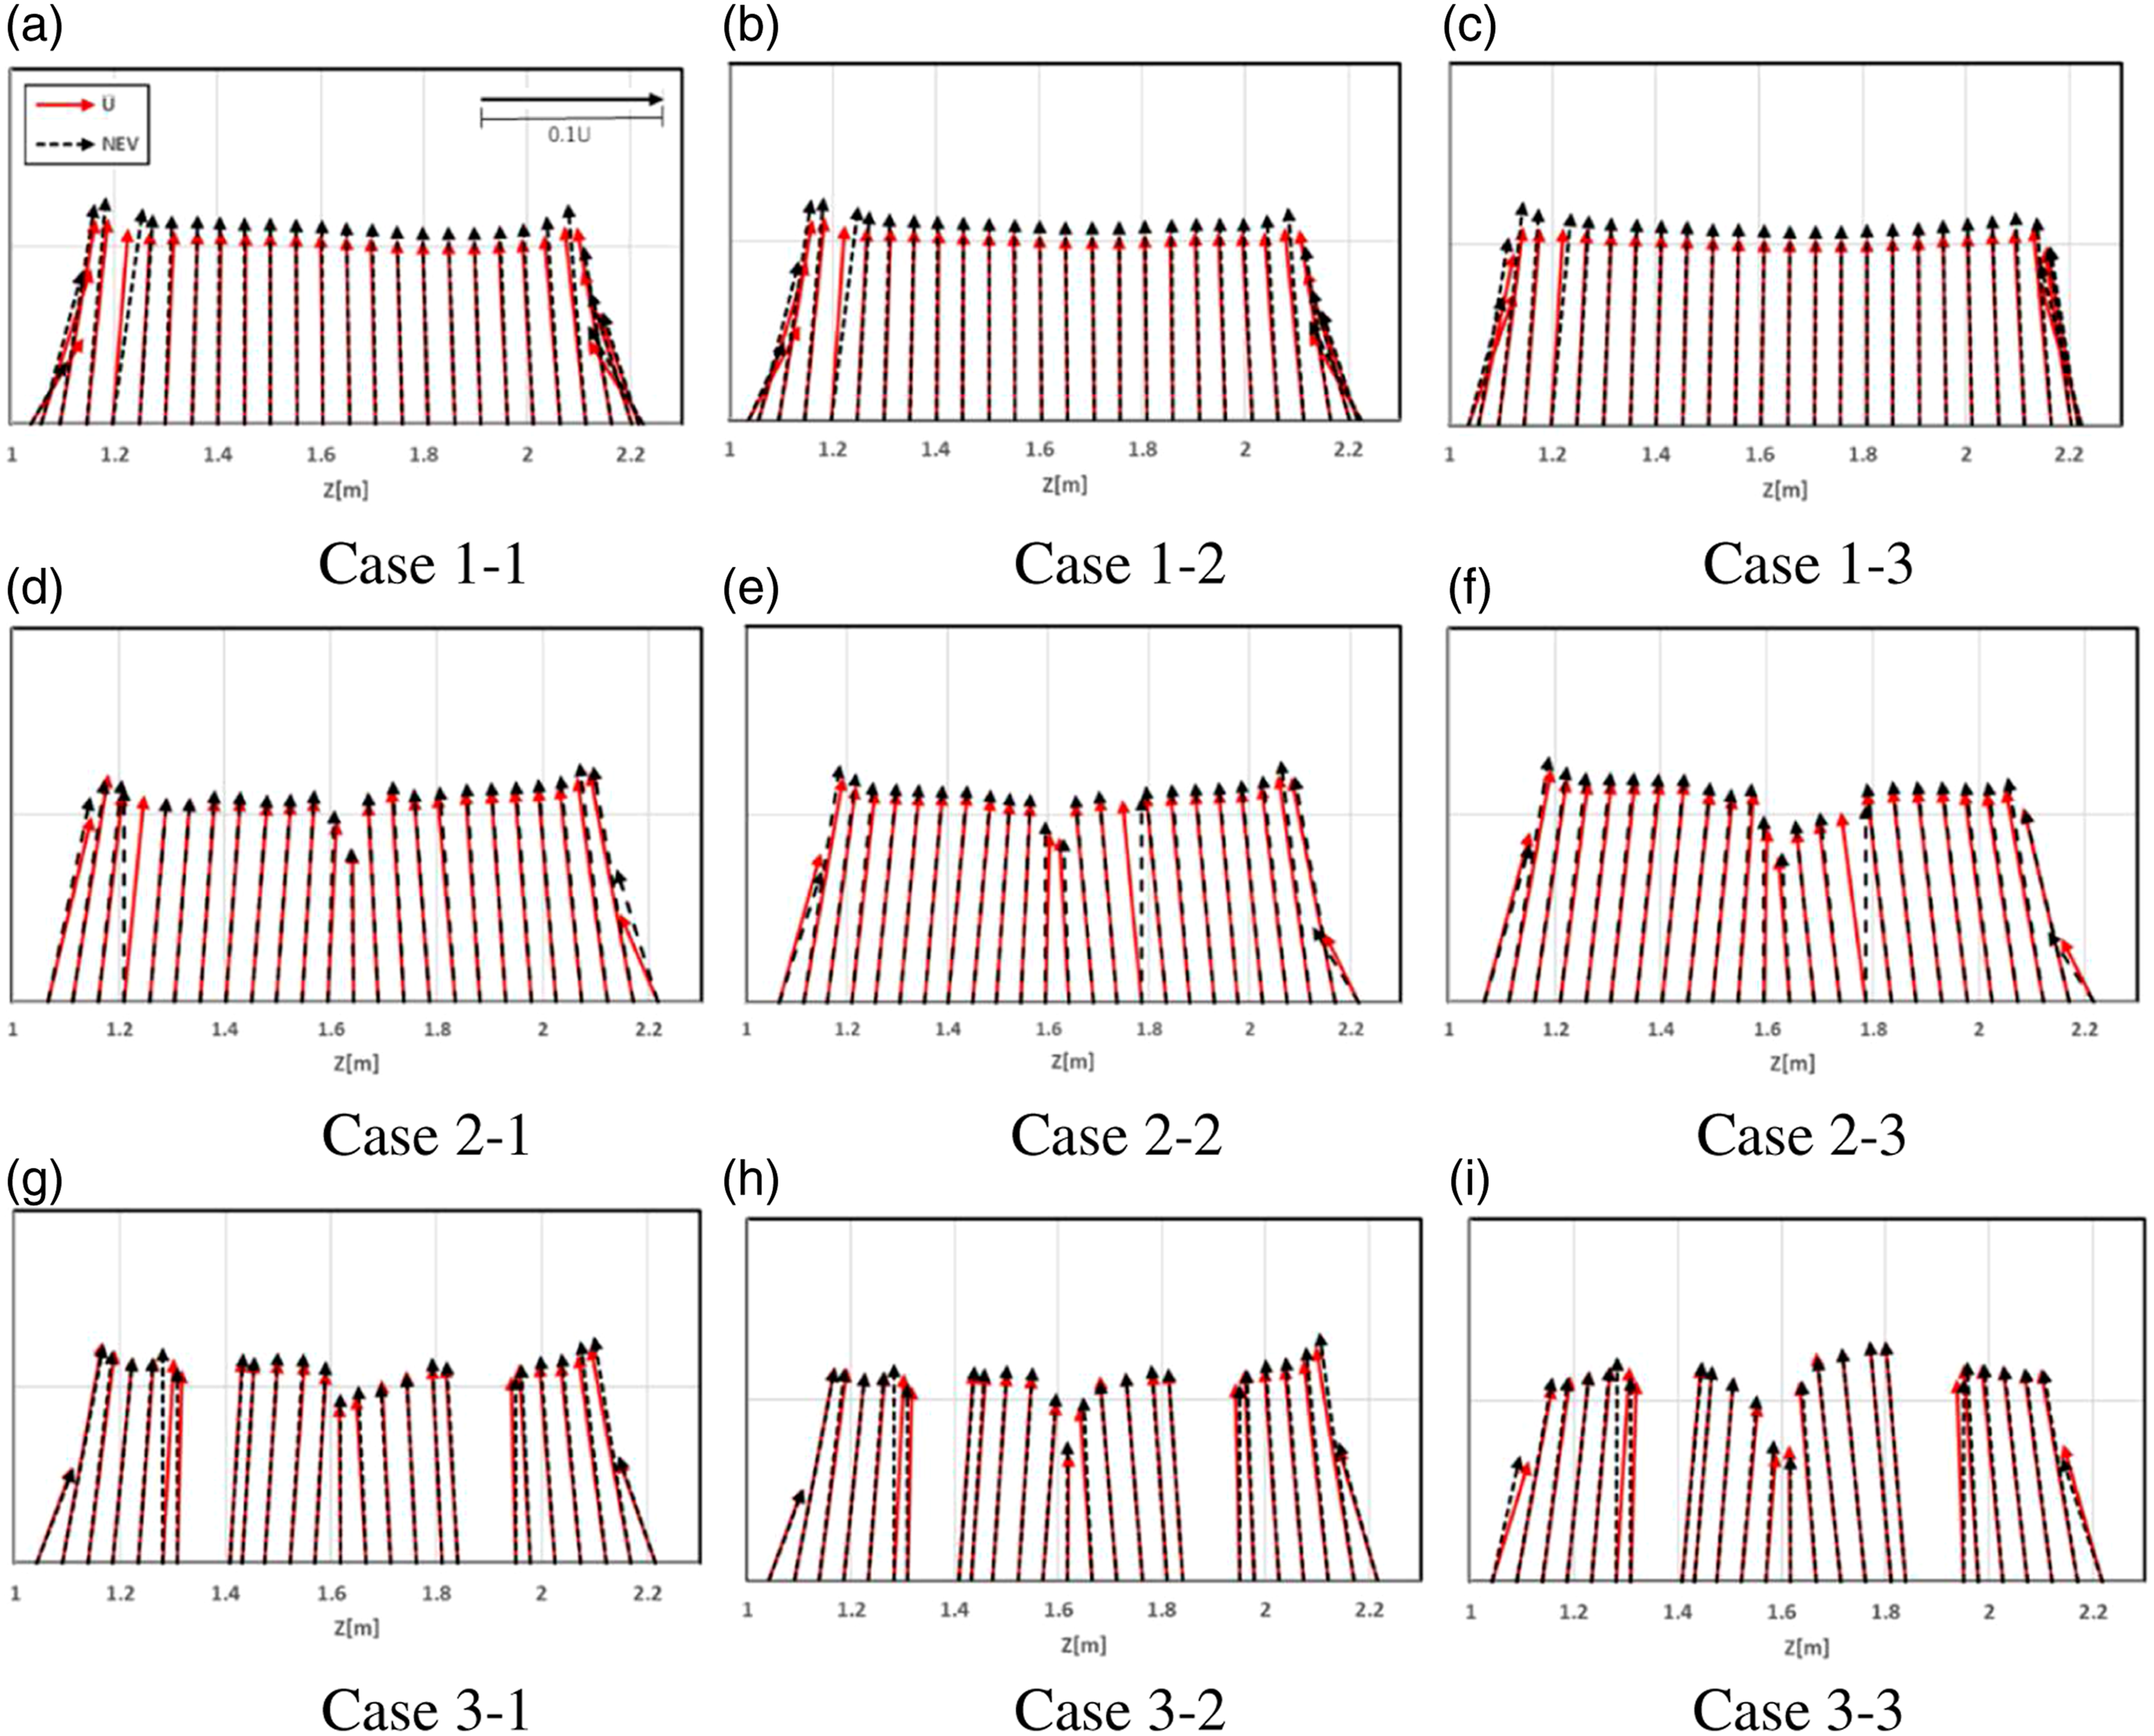
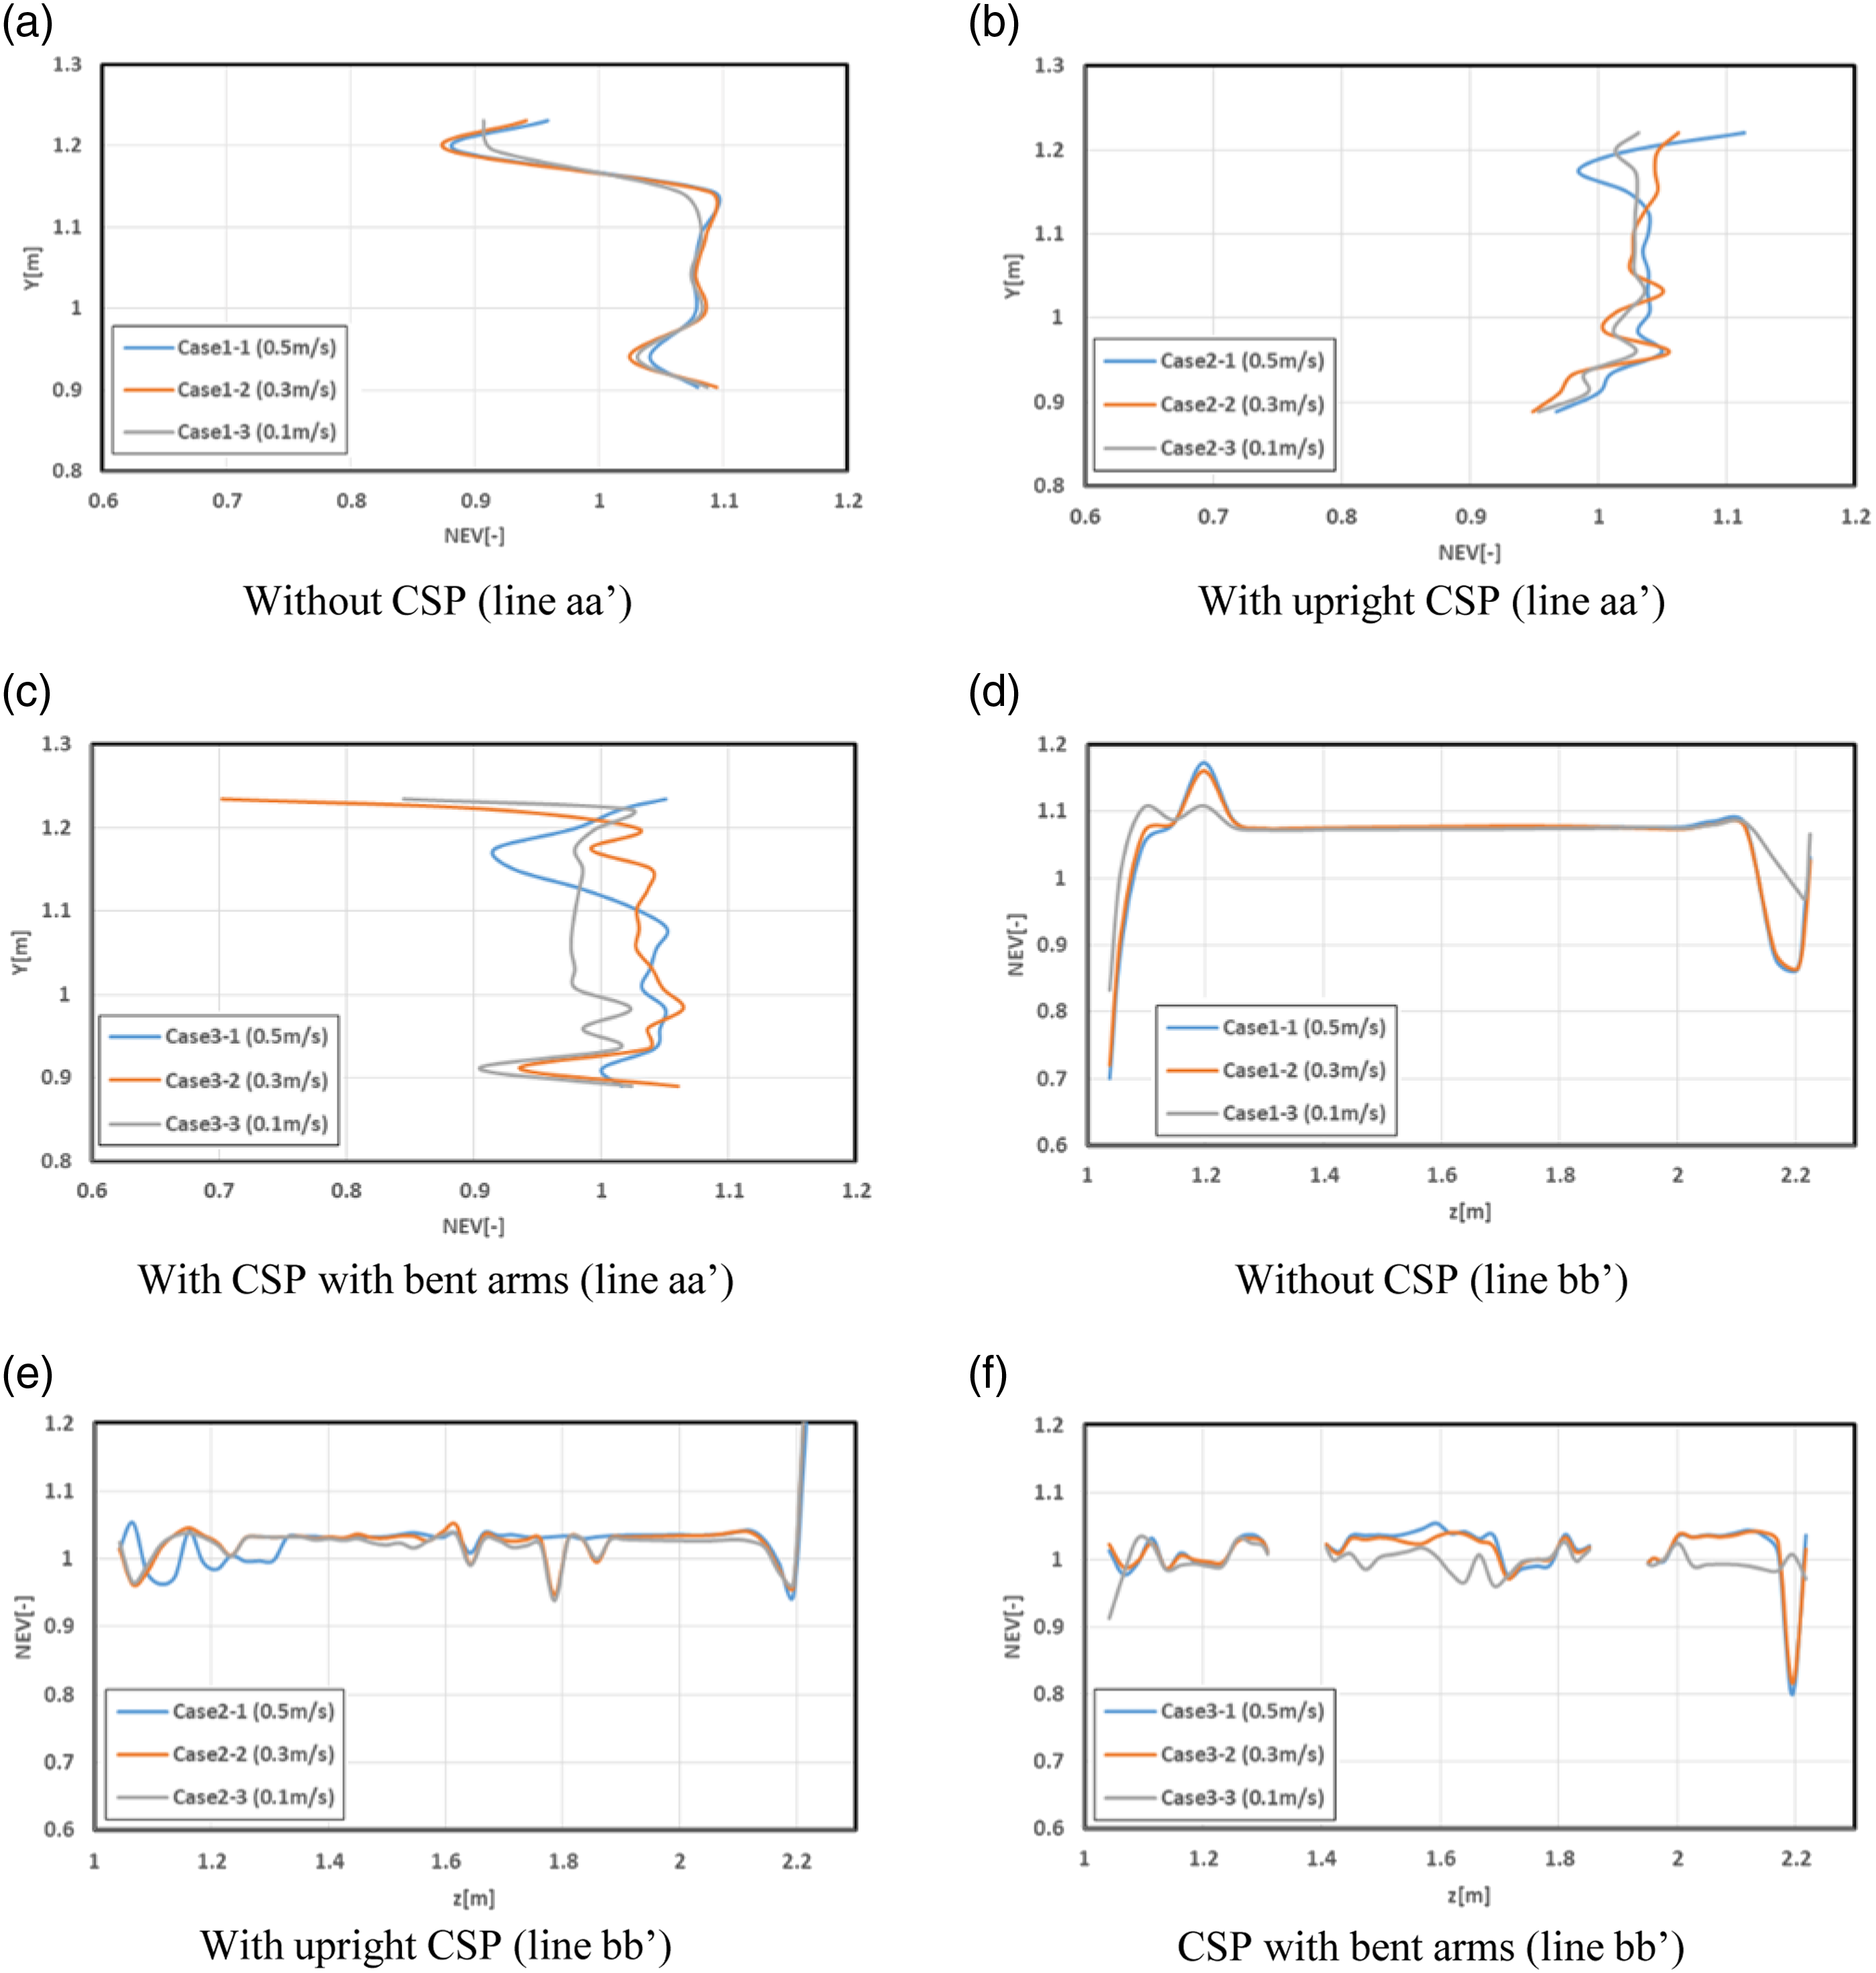
As shown in Figures 8 and 9, directions of NEV vectors and advection vectors were similar because the airflow from the laboratory to the inside of the fume hood occurred in one direction in all cases. However, with regards to the magnitude, values of NEV were found to be larger than the advection velocity in Case 1 with no CSP in front of the fume hood, while the difference between values of the NEV and the advection velocity was small in Case 2 and Case 3 in the presence of CSP.
In contrast, there was no significant difference with the exhaust airflow rate in the normalized NEV at the opening surface in Case 1, even for Case 2, with CSP, as shown in Figures 10(a),(b),(d),(e). In contrast, the difference in the exhaust airflow rate was clearly observed in Case 3, as shown in Figures 10(c),(f). In Case 3-1 and Case 3-2, where the surface wind speed was set to 0.5 m/s and 0.3 m/s, more than 75% of the NEV exceeded 1.0 on the line aa’, while in Case 3-3, where the surface wind speed was set to 0.1 m/s, more than 75% of the NEV were below 1.0 on the line aa’. In other words, the presence of the CSP’s arm on the opening surface of the fume hood increased the turbulent diffusion effect of contaminants in the direction opposite to the advection under the low exhaust airflow rate condition.
Local purging flow rate
Figure 11(a) shows the results of the L-PFR normalized by the fume hood exhaust airflow rate. In this analysis, passive scalars were assumed to be generated uniformly in the chamber space of the fume hood. When the surface wind speed was set to 0.5 m/s, the values of the normalized L-PFR of Case 1-1, Case 2-1 and Case 3-1 were 0.44, 0.49 and 0.42, respectively. In addition, when the surface wind speed was set to 0.1 m/s, the values of the normalized L-PFR of Case 1-3, Case 2-3 and Case 3-3 were 0.46, 0.54 and 0.59, respectively. Normalized L-PFR (L-PFR/Q
out
) [-] at opening surface of the fume hood.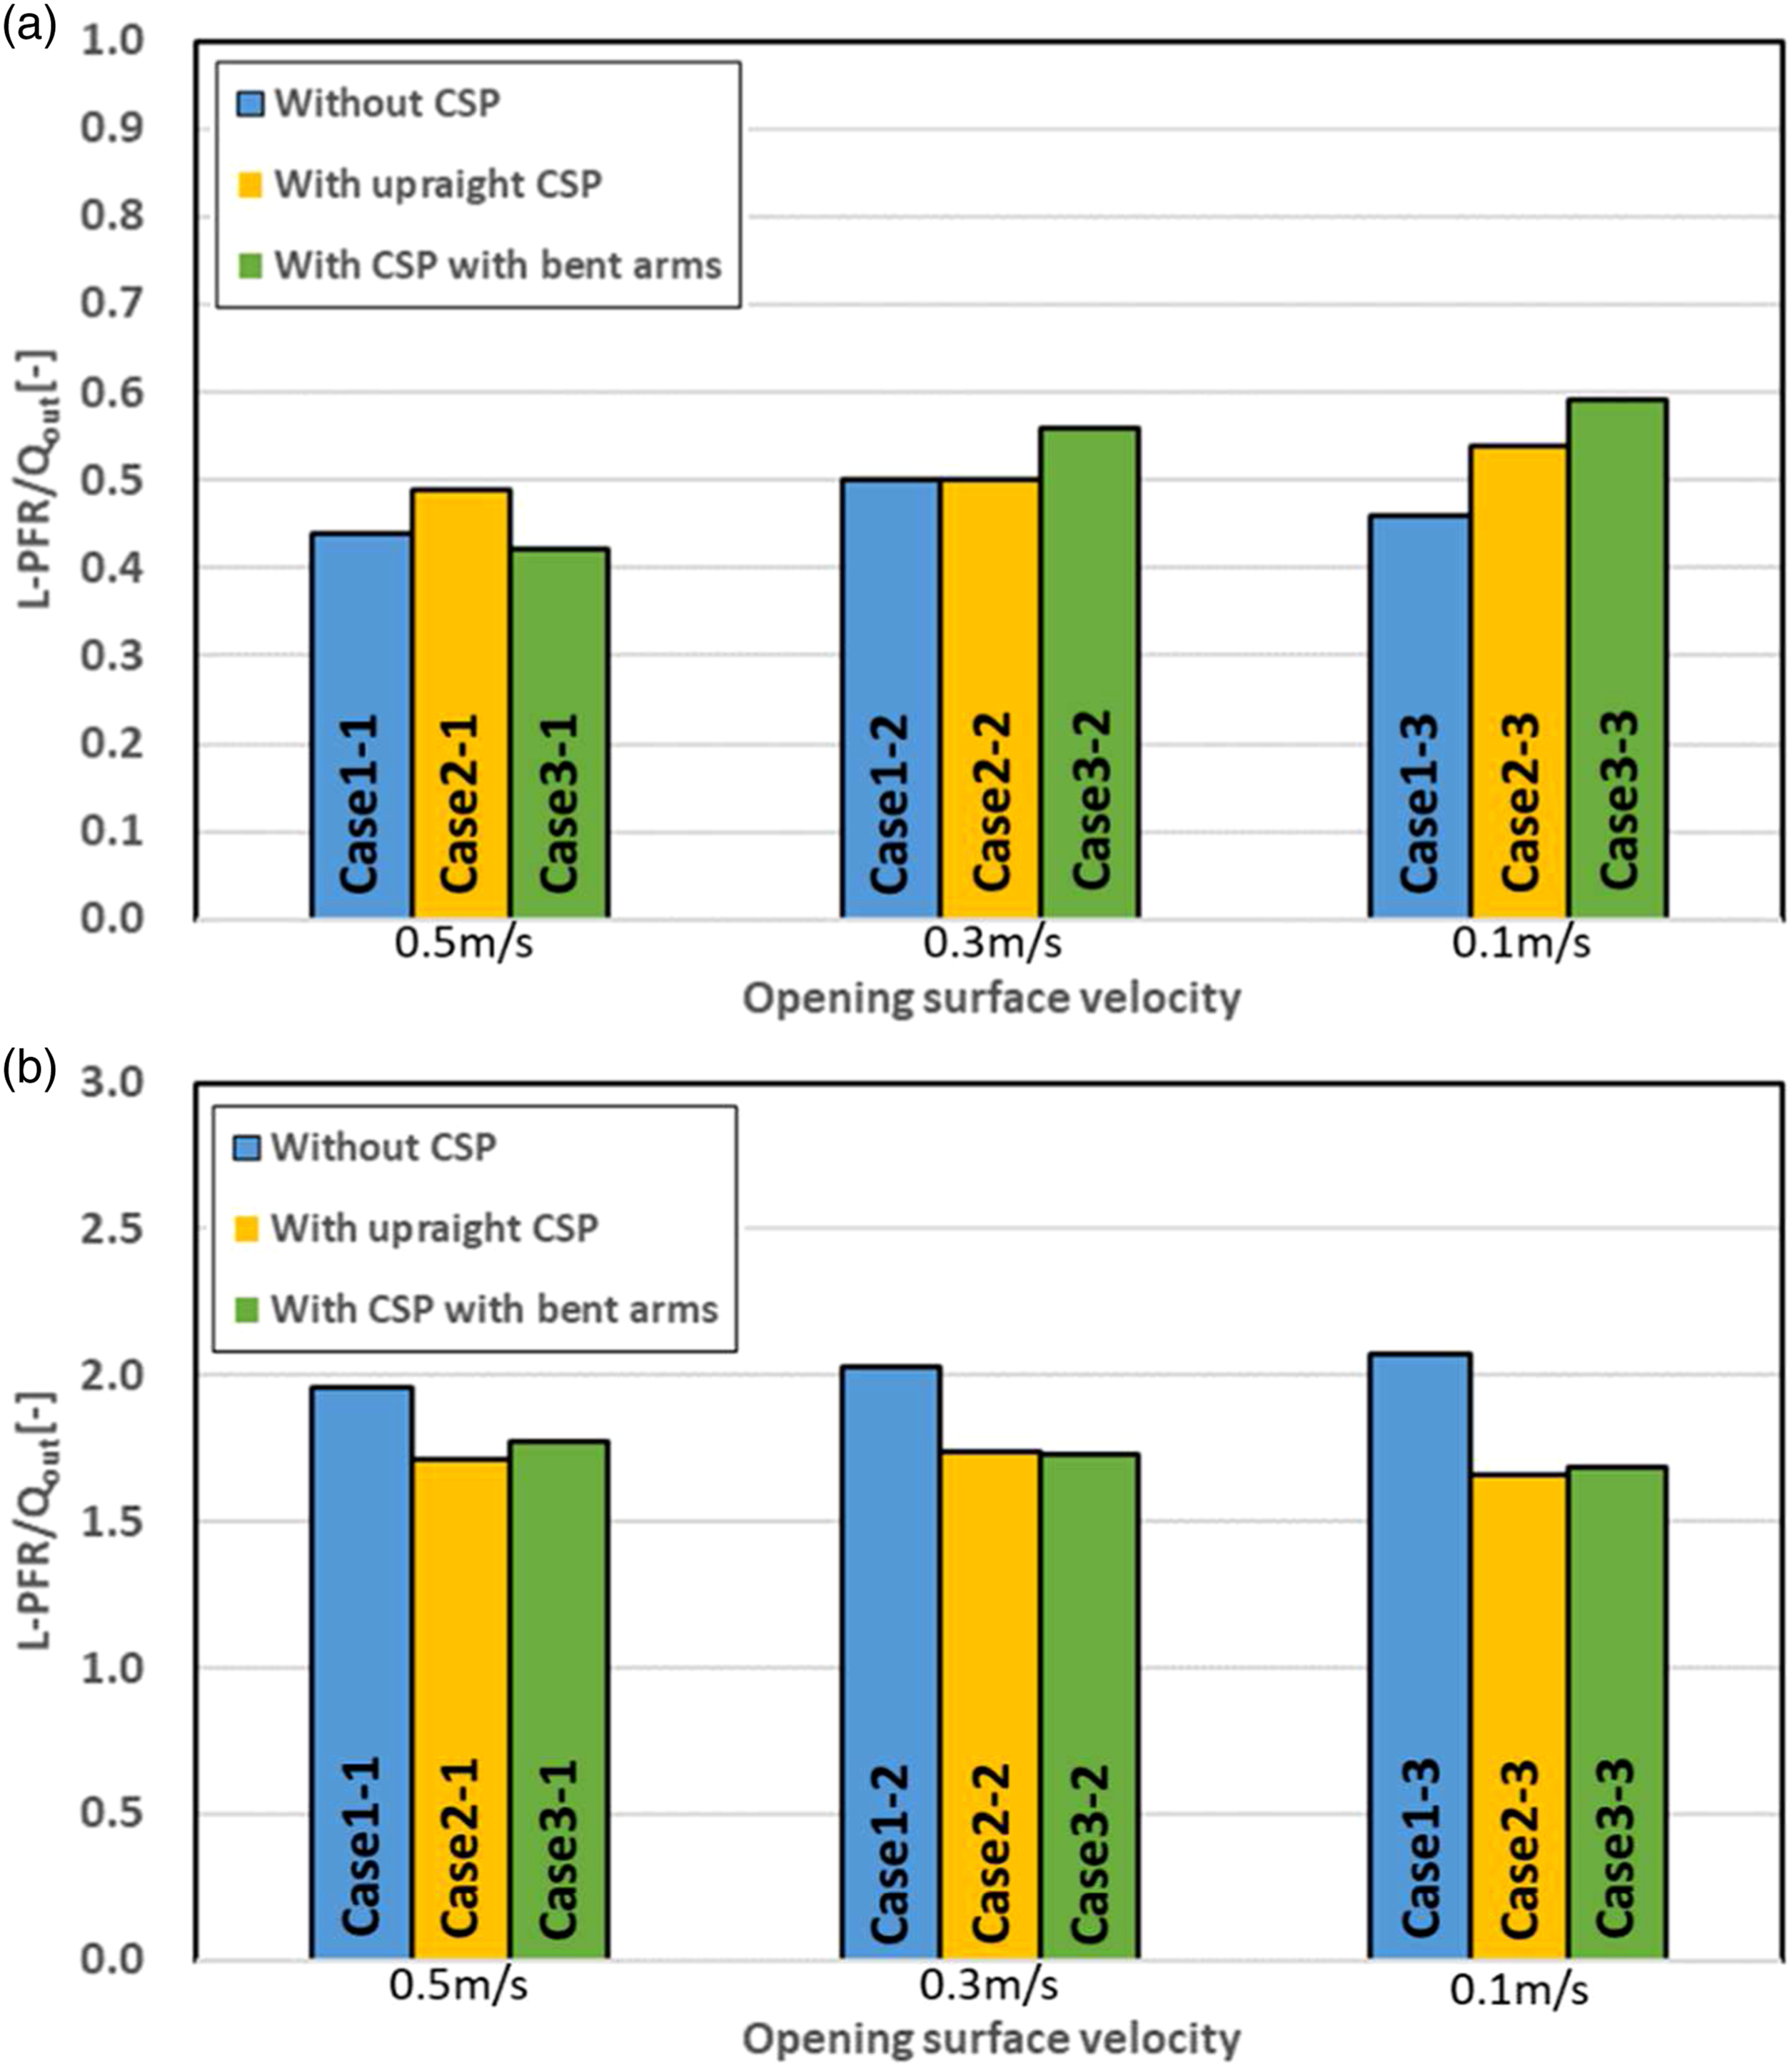
These results imply that very strong non-uniform pollutant concentration distributions are formed in the chamber compared to the perfect mixing condition, and only about half of the exhaust airflow rate (Q out ) contributes to efficient pollutant discharge from the chamber. This is due to the circulating flow formed in the upper part of the chamber and pollutants trapped inside the circulating flow forming a high concentration area. On the contrary, the concentration is very low near the opening surface at the lower part of the chamber. Although the ventilation efficiency expressed by L-PFR of the entire chamber space in the fume hood is about half that of the perfect mixing assumption, there is a very clear ventilation efficiency distribution in the chamber.
When the exhaust airflow rate was low and the CSP was located in front of the fume hood, the contaminant in the fume hood spread widely, and the lower part of the fume hood represented a high concentration area. As the contaminant spread to the lower part, the contaminant was diluted with fresh air from the opening surface. Therefore, the normalized L-PFR of Case 3-3, where the contaminant spread uniformly inside the fume hood, was the largest.
Figure 11(b) also shows the results of L-PFR calculated using pollutants concentration distribution analyses results for the case where contaminants were uniformly generated on the workbench surface in the fume hood. In all cases, L-PFR was larger than 1.0. L-PFR was larger in the case without CSP than in the case with CSP. The CSP had a negative effect on contaminant dilution near the workbench in the fume hood. There was no significant difference in L-PFR due to changes in CSP posture.
Discussion
Capture efficiency performance inside the fume hood
In all cases studied, contaminants uniformly generated inside the fume hood did not leak into the laboratory side, which confirmed the high capture performance of the fume hood. With regards to the capture efficiency performance inside the fume hood, under conditions of Case 1-1, Case 2-1 and Case 3-1, where the surface wind speed was set to 0.5 m/s, we found that the presence of the CSP in front of the hood and its arms inside of the hood did not affect the flow field inside the fume hood, and the circulating flow formed in the upper part of the fume hood clearly captured the contaminant. Therefore, inside the fume hood, the upper part of the fume hood was a high concentration area, while the lower part was maintained as a low concentration area by uniform piston flow from the opening surface. This uniform piston flow into the fume hood did not disturb, regardless of the CSP or working posture.
In contrast, the capture performance inside the fume hood in Case 2-3 and Case 3-3, where the surface wind speed was set to 0.1 m/s and CSP was located in front of the fume hood, was significantly different from other cases. The arms of the CSP and CSP itself were found to affect the flow field inside the fume hood, where the circulating flow was disturbed. In addition, as shown in Figure 4, the airflow turbulence in the lower part of the fume hood was also observed in the Z-X cross section. In particular, in Case 3-3, where the arms of the CSP were placed inside the fume hood, the capture performance was decreased due to the turbulence of the circulation flow in the upper part, and contaminants were spread to the lower part of the fume hood. These contaminants were contained in the stagnation zone in the lower part, forming a high concentration area in the lower part of the fume hood. The value of L-PFR (calculated by scalar uniform generation in the chamber) in Case 3-3 was 0.59, which was the highest in all cases. This indicates that contaminants that stagnated in the lower part were transported to the exhaust duct by piston flow from the opening surface.
According to the NEV analysis results, transport directions of contaminants at the opening area were found to be almost the same in the advection direction, that is, even when the exhaust airflow rate was decreased and CSP was present. However, in Case 3-3, the normalized NEV value normalized by the advection wind speed in front of the CSP was less than 1.0 and was identified at many points in lines aa’ and bb’. These results indicate that contaminant transport by turbulent diffusion at the opening surface was relatively large under conditions of low exhaust airflow rate and the presence of obstacles, such as the CSP’s arms at the opening surface. The NEV, which represents a superposition of the contaminant transport velocity associated with advection and turbulent diffusion, can be used to evaluate the contaminant transport mechanism in detail. We could not confirm whether the contaminant generated inside the fume hood leaked out of the laboratory from the results of the SVE3 analysis. However, NEV analysis revealed that the contaminant transport mechanism was changed depending on the exhaust airflow rate and obstacles, such as the CSP’s arm. Thus, the use of the NEV in combination with other indices for ventilation efficiencies, such as SVE3 and L-PFR, is required to investigate contaminant leakage across hypothetical boundaries of the control target surface of local ventilation hoods.
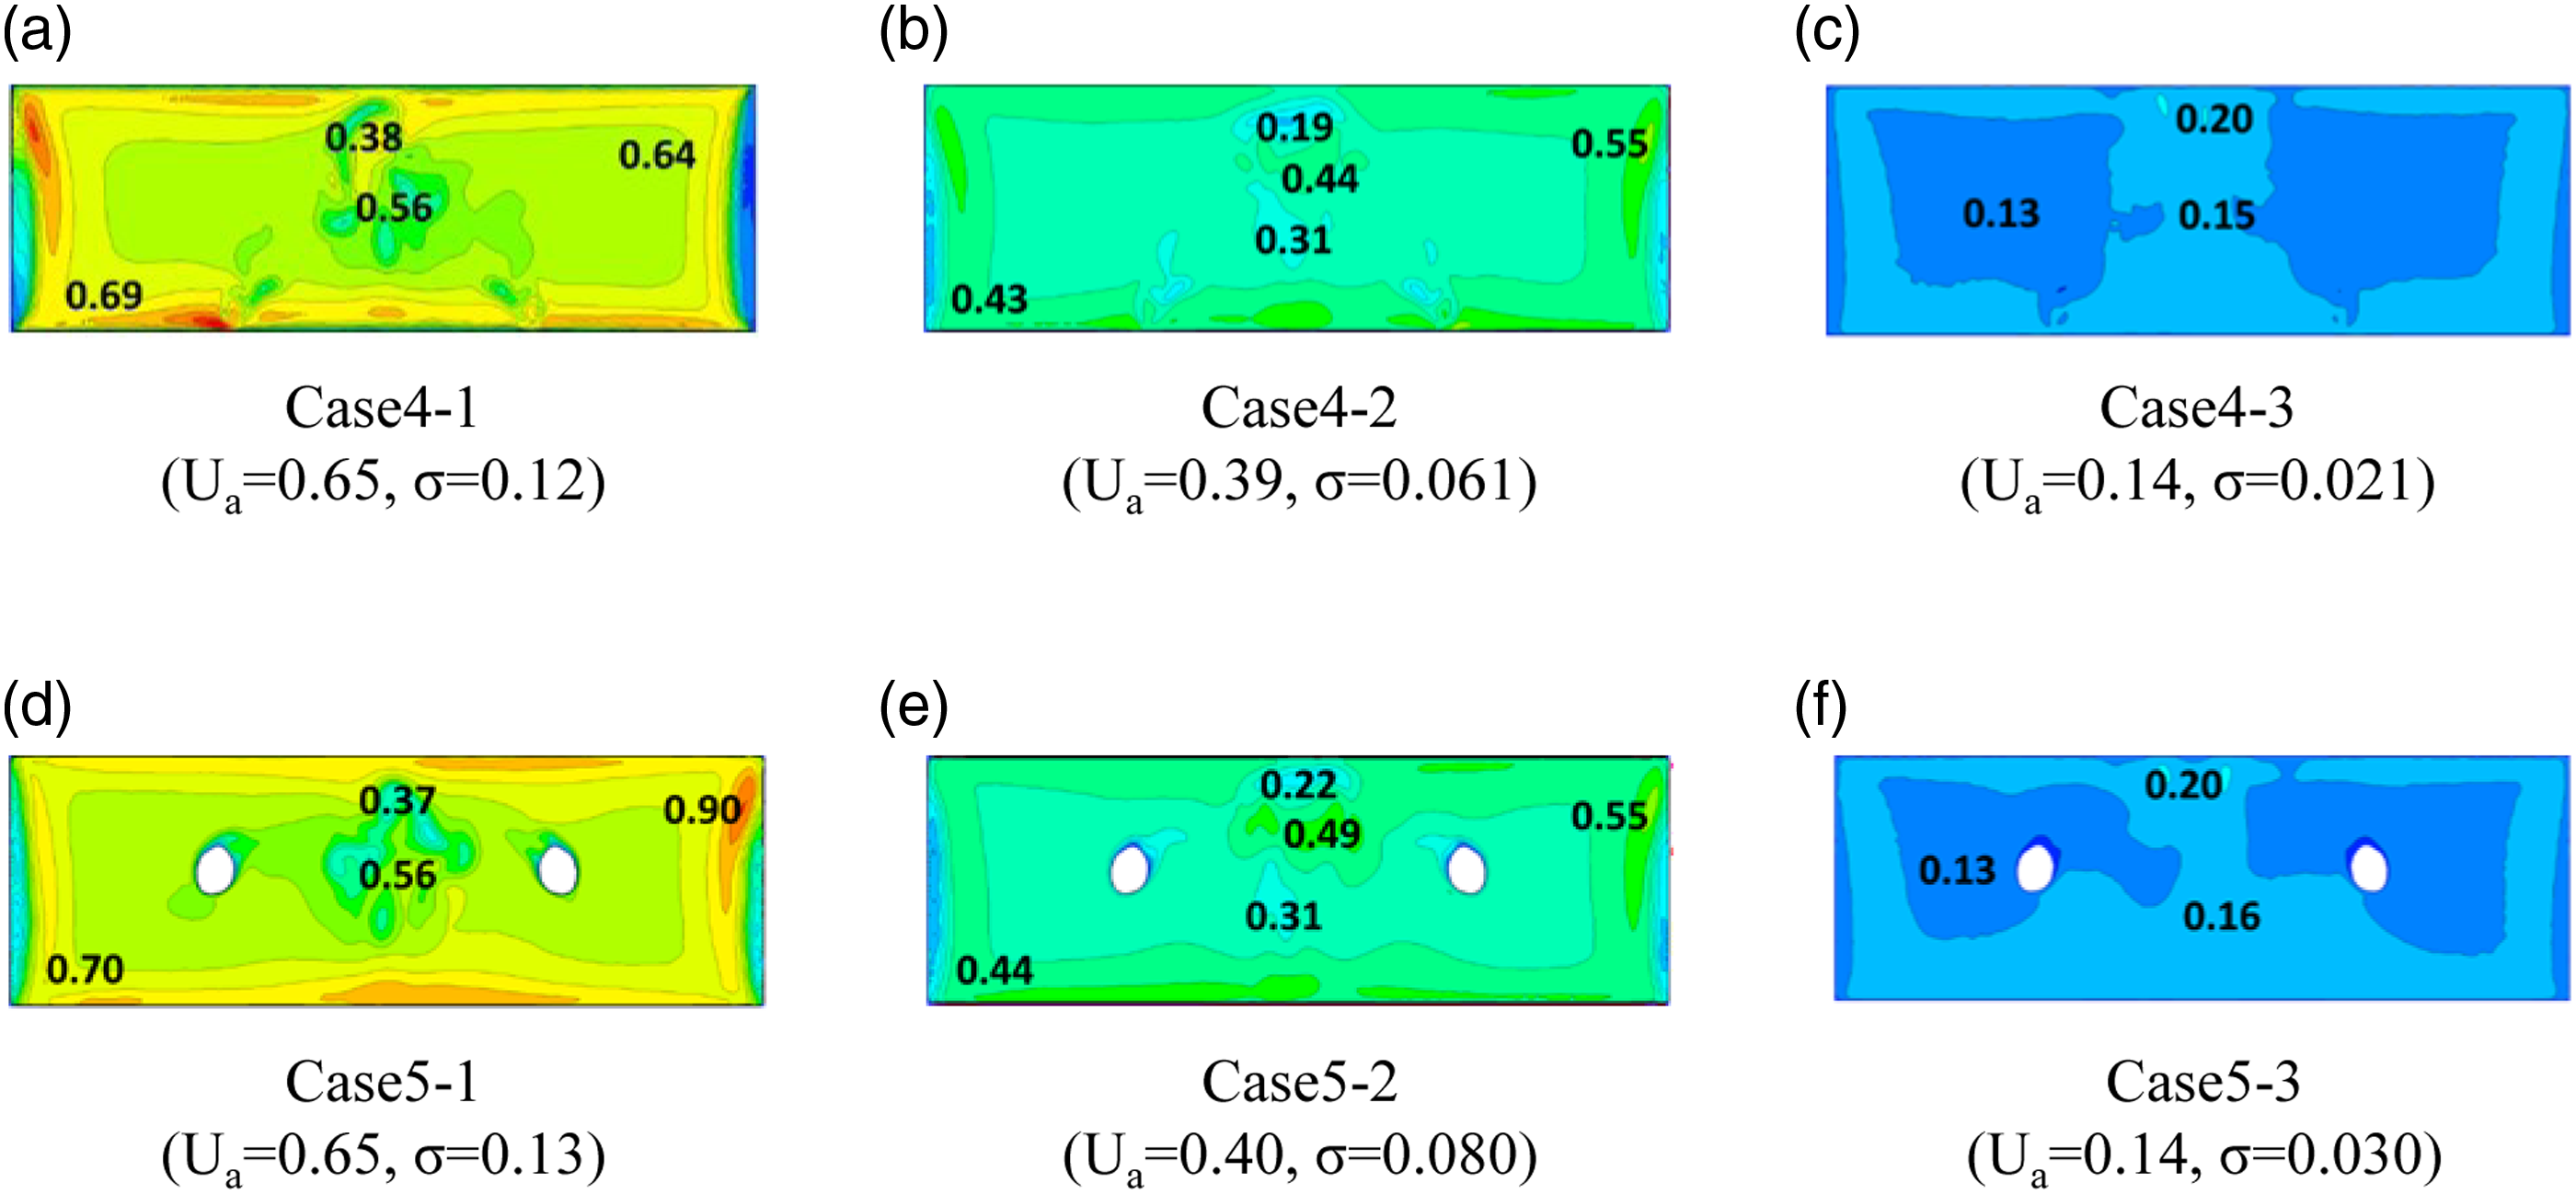
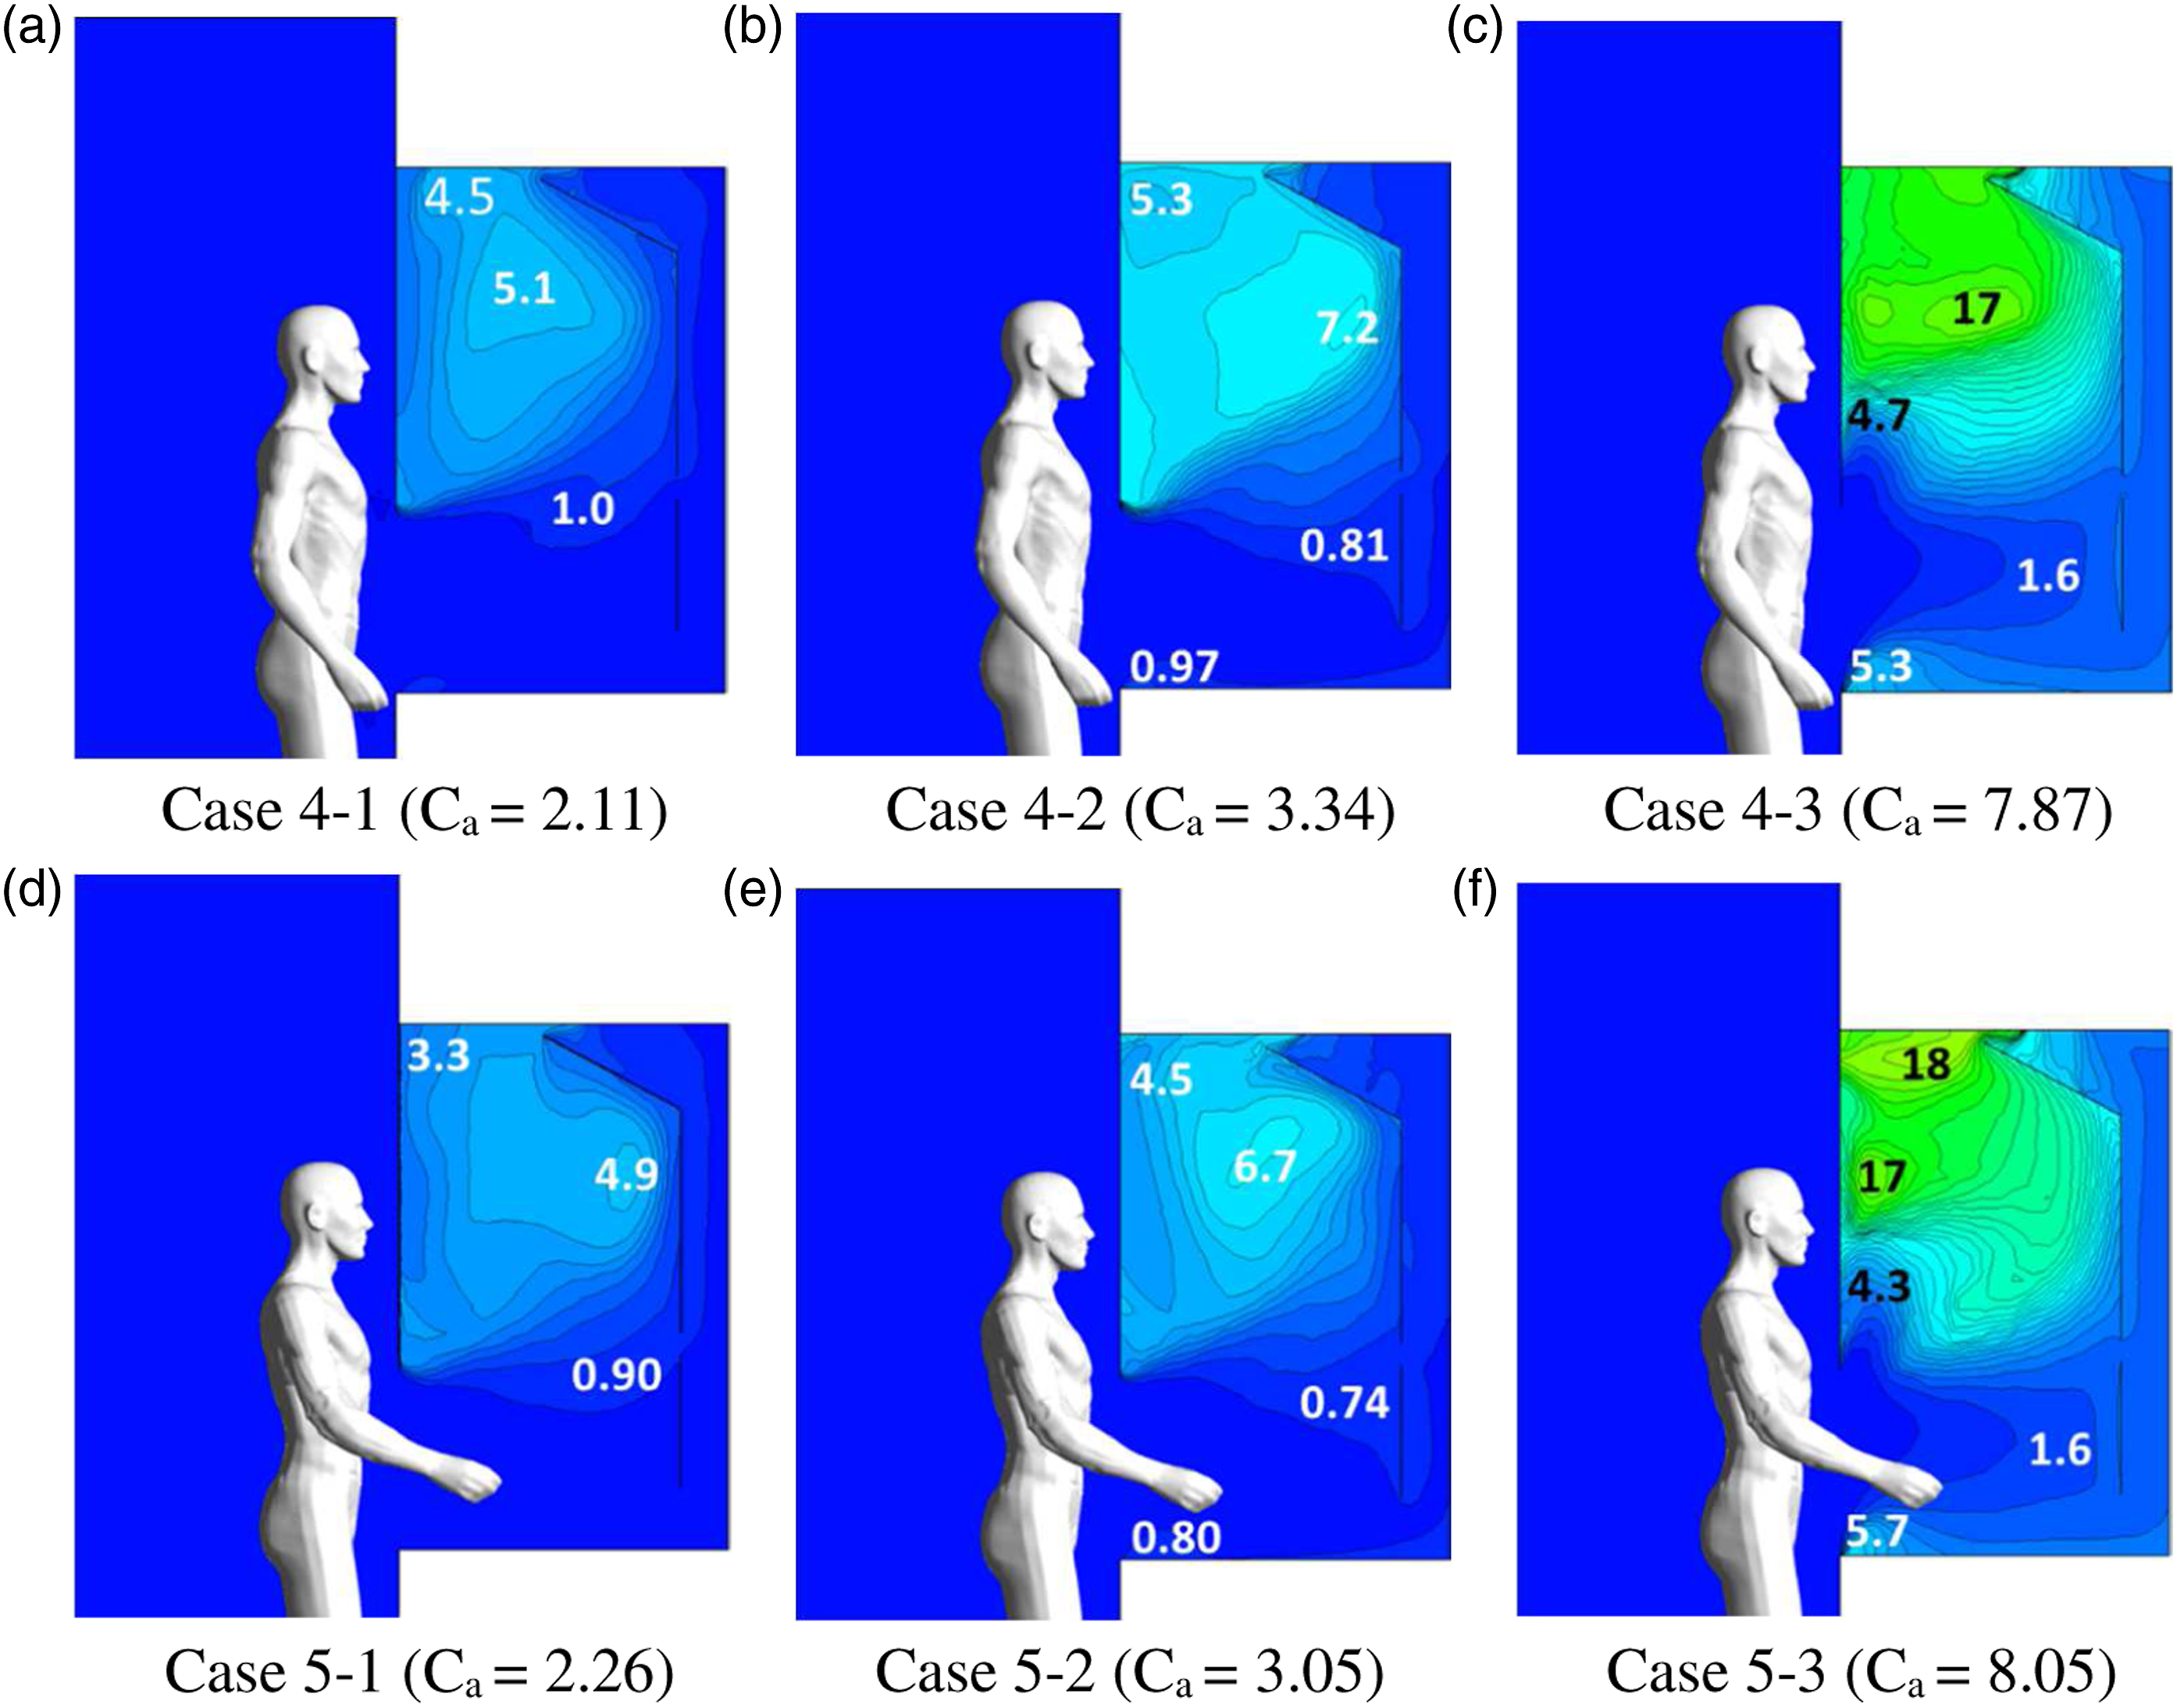
Impact of the distance between fume hood and CSP on the pollutant capture performance
Outline of additional analysis cases.
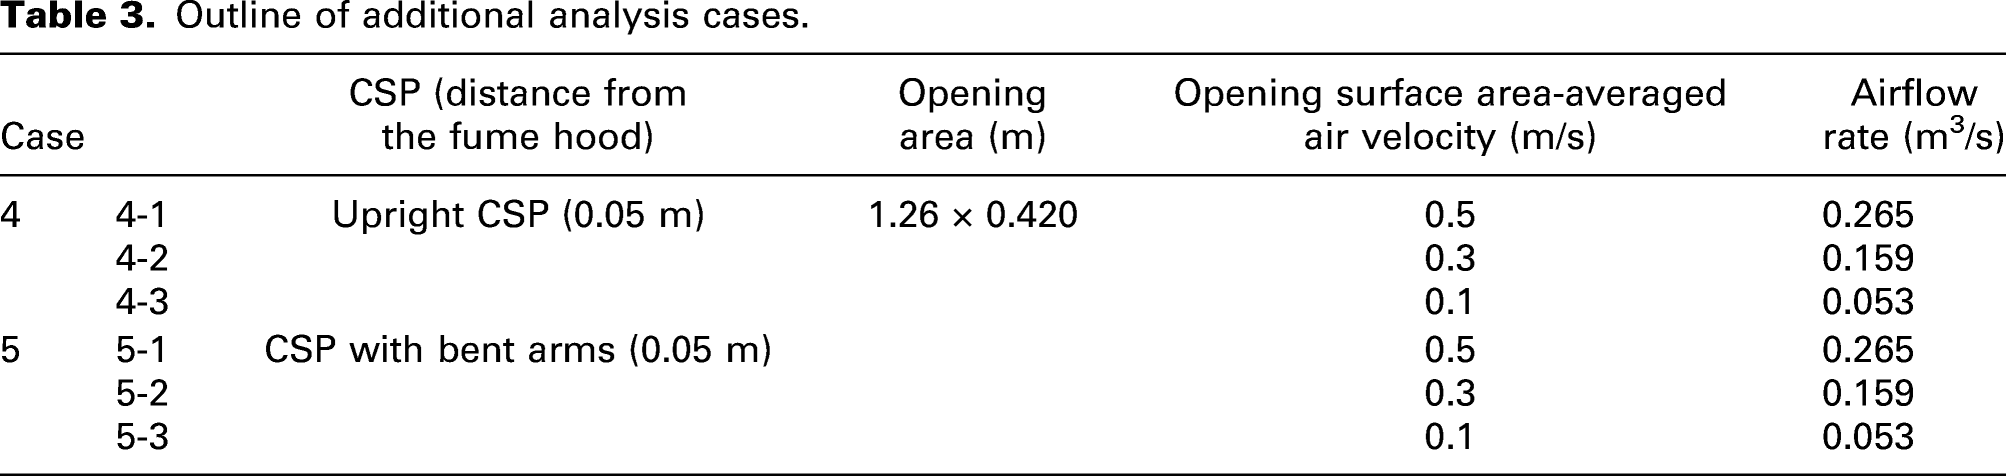
Figure 12 shows the results of velocity distribution around the fume hood at cross section A (Z = 1.63 m) (Figure 1(b)). The circulating flow was also formed in the upper part of the fume hood, even when the CSP was placed nearby in all cases. However, in Case 4-3 and Case 5-3, the circulating flow was more turbulent compared to Case 2-3 and Case 3-3, respectively. Figure 13 shows the results of velocity distribution at the opening surface of the fume hood at cross section B (Figure 1(c)). When the CSP was placed nearby, the Velocity distribution around the fume hood (Z = 1.63 m, X-Y cross section). Velocity distribution at opening surface of the fume hood (m/s). Concentration distribution inside the fume hood (Z = 1.63 m, X-Y cross section).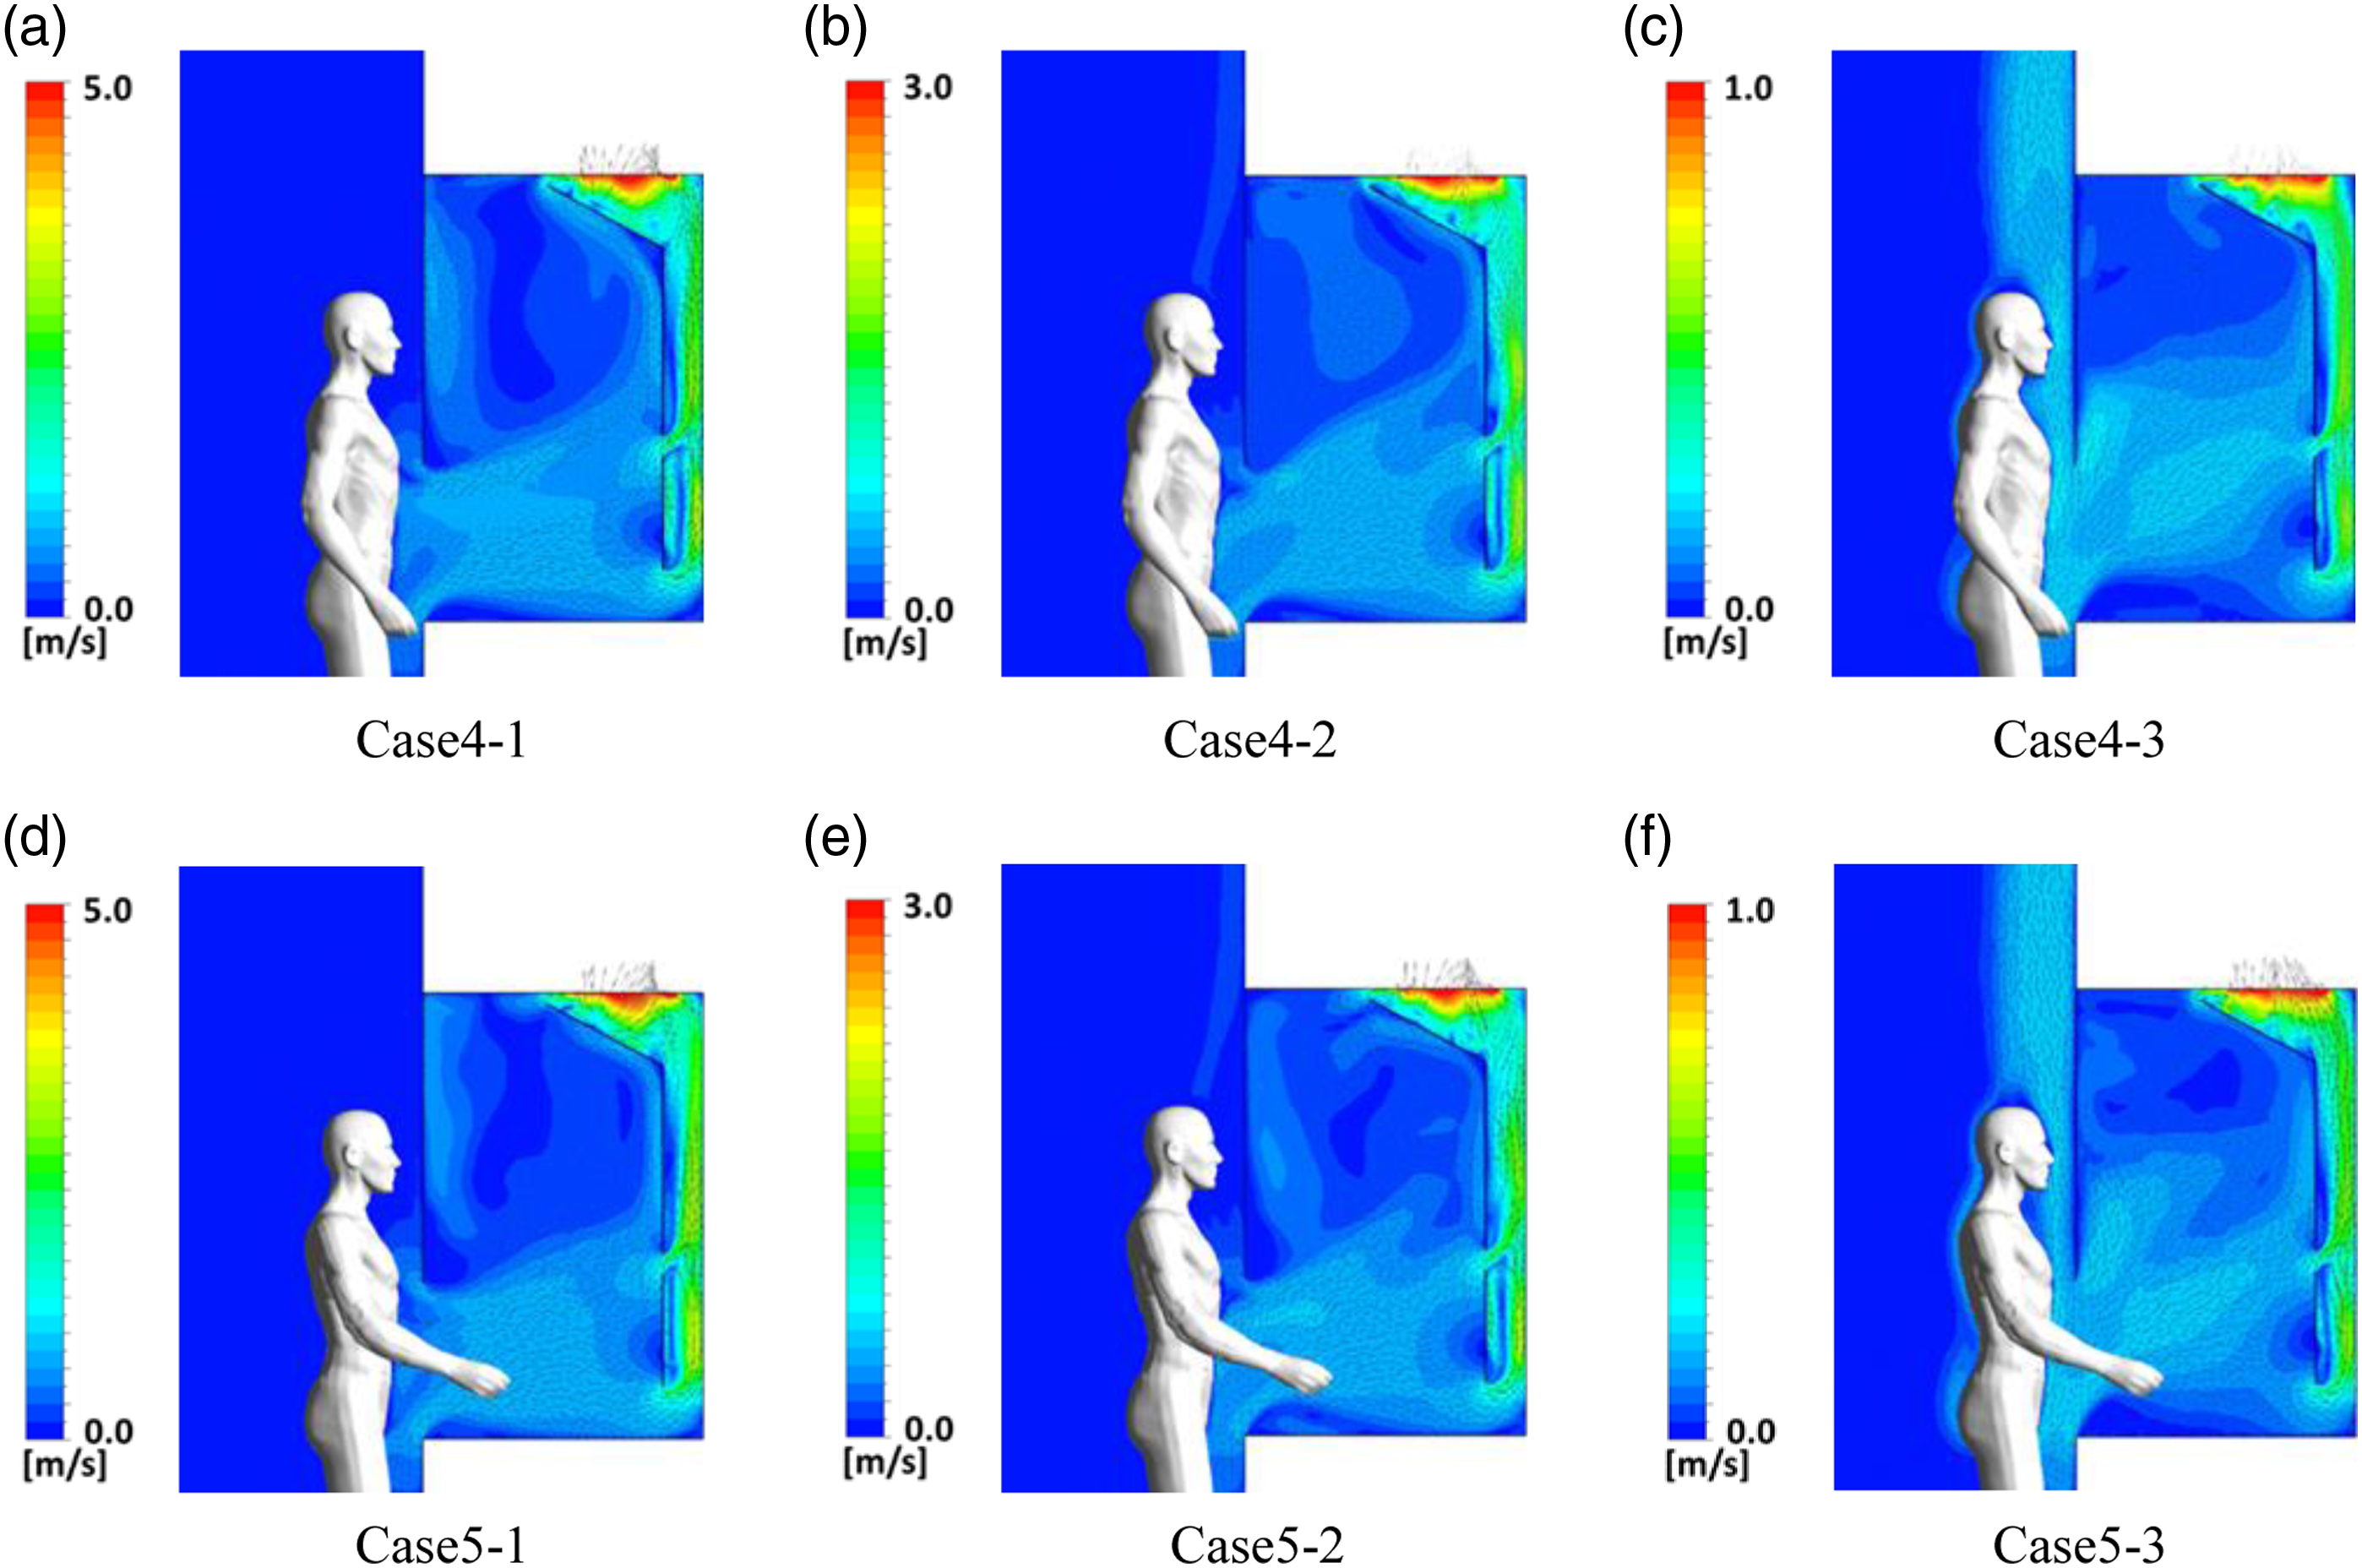
Limitation of this study
In this analysis, the inside of the fume food was reproduced as empty space and hypothetical scalar generation was also assumed. In order to reproduce more realistic numerical boundary conditions, obstacles such as laboratory equipment should be installed inside fume hood, and conditions in which heat is generated inside the fume hood should be discussed. Cases in which workers are seated and/or moving in front of the fume hood will be also important and essential for optimized design of exhaust airflow rate via fume hood.
Conclusion
In this study, CFD analysis was conducted on a model with the CSP in front of the fume hood, and the protection performance of the fume hood was numerically investigated using the ventilation efficiency index. No leakage of contaminants was observed from the fume hood under all analytical conditions, indicating the high protection performance of the fume hood. According to the overall evaluation of the ventilation efficiency index, the protection performance of the fume hood was maintained by two types of containment functions: by the circulating flow in the upper part of the inner fume hood and ventilation by a piston-like flow from the opening surface to the opening of the baffle plate in the lower part of the fume hood. On the other hand, when the exhaust airflow rate was reduced, the pollutant capture performance by the circulating flow was gradually reduced. The risk of pollutants staying and relative high concentration at the working space in the lower part of the fume hood was confirmed due to the stagnant flow created in the area between the CSP arm and the working table of the fume hood. In addition, according to the NEV analysis, in the case where the CSP’s arms were inserted into the fume hood under the low airflow condition, the contaminant transport by turbulent diffusion at the opening surface was relatively large. These results indicate that the contaminant transport mechanism at the opening surface was negative in terms of capture performance when the exhaust airflow rate was decreased, even if no risk of leakage was found on other indices of ventilation efficiency.
Supplemental Material
sj-pdf-1-ibe-10.1177_1420326X211066538 – Supplemental Material for Pollutant capture efficiencies in and around the opening surface of a fume hood under realistic conditions
Supplemental Material, sj-pdf-1-ibe-10.1177_1420326X211066538 for pollutant capture efficiencies in and around the opening surface of a fume hood under realistic conditions by Ryota Muta, Juyeon Chung, Cong Li, Sung-Jun Yoo, and Kazuhide Ito in Indoor and Built Environment
Footnotes
Author contributions
All authors contributed equally in the preparation of this manuscript. Ryota Muta processed the data and wrote this article. Juyeon Chung, Li Cong, and Sung-Jun Yoo designed and performed the analysis. Kazuhide Ito is supervision and revised this article.
Declaration of conflicting interests
The author(s) declared no potential conflicts of interest with respect to the research, authorship, and/or publication of this article.
Funding
The author(s) disclosed receipt of the following financial support for the research, authorship, and/or publication of this article: This study was partially supported by Japan Science and Technology (JST), CREST Japan (Grant Number JP 20356547), and the Japan Society for the Promotion of Science (JSPS) Grants-in-Aid for Scientific Research (KAKENHI) (Grant numbers JP 20KK0099 and JP 18H03807). The part of computation was carried out using the computer resource offered under the category of Intensively Promoted Projects by Research Institute for Information Technology, Kyushu University.
Supplemental material
Supplemental material for this article is available online.
References
Supplementary Material
Please find the following supplemental material available below.
For Open Access articles published under a Creative Commons License, all supplemental material carries the same license as the article it is associated with.
For non-Open Access articles published, all supplemental material carries a non-exclusive license, and permission requests for re-use of supplemental material or any part of supplemental material shall be sent directly to the copyright owner as specified in the copyright notice associated with the article.