Abstract
Climate change is known as a serious threat to the human species, and its significance should be considered in building design. This study aims to investigate the relationship between energy consumption and CO2 emission in Iran during the years 2018–2019 using artificial neural networks (ANNs) and regression methods. The input data were gathered and optimized by the particle swarm optimization (PSO) algorithm. Lighting, equipment load rate, wall U-value, roof U-value and people density were deliberated as effective parameters. Afterwards, the ANN was created, trained and tested by the radial basis function (RBF) algorithm; also, the data were evaluated based on statistical analysis in SPSS software. The results demonstrated R2 = 0.99 and the 45-degree line for the predicted value. Energy consumption and CO2 were reduced to 35% and 73.21%, respectively. Furthermore, CO2 emissions and energy consumption had an inverse relationship with infiltration rates (−0.201) and (−0.098). Furthermore, CO2 emission and energy consumption had a linear relation in Iran with the equation of y = 1.63x + 0.52. Moreover, based on ANOVA test, R2 linear was 0.985 and R = 0.993, illustrating significant accuracy. Architects and designers could enjoy these findings as guidelines for renovation and designing purposes so as to alleviate the negative environmental impacts of construction.
Introduction
Considering sustainable development, energy efficiency is recognized as an effective attitude worldwide. 1 Global warming and climate change are identified as undeniable threats to the human species and they result from excessive energy use and significant greenhouse gas emission such as carbon dioxide (CO2). 2 Amongst the worldwide greenhouse gas emissions, CO2 has an unbelievable emission share of 90%, N2O 1%, CH4 9% and other gases 14%. 3 The energy-concentrated buildings are the principal energy consumption sector, as well as CO2 emissions. 4 Research findings have shown that the average emission of CO2 was increased by 3% between the years 2000 and 2020 on a yearly basis. 5 Nowadays, the building sector is recognized as the main source of consuming energy and producing CO2 emissions due to fast-paced population growth. 6 Considering world climate change, the building sector is highlighted as a source of reducing energy consumption and CO2 emission. 7 Buildings consume approximately 30% of the world’s whole energy and virtually 50% of global greenhouse gas (GHG) emissions. 8 According to the Intergovernmental Panel on Climate Change (IPCC), one-third of greenhouse gas emissions are released by buildings. 9 Researchers have proven that buildings’ energy consumption and the resulting emissions in developing countries will double or triple up until the year 2050. 10 Therefore, it is imperative for developing countries to seriously consider assessing and controlling greenhouse emissions and energy consumption to avoid future disasters. 11
Research demonstrated that energy consumption by buildings has a significant effect on climate change.12,13 In this respect, energy preservation approaches have had a positive role in reducing air pollution and climate change. 14 Findings point to the connection between energy consumption and CO2 emission.15,16 However, energy consumption and CO2 relation are influenced by several factors such as sectors, geographical region and countries. 15 Given that CO2 emission has been increasing exponentially in a gradual manner, the impacts of energy consumption have gained significance. 17 Moreover, the indoor environment quality (IEQ) of buildings is recognized as an effective parameter for CO2 emission, which needs to be considered. 18
Recently, several computing methods such as artificial neural network (ANN) and fuzzy systems have been employed to solve engineering and architectural problems.19–21 Considering its ability to train the modelling and estimate the energy consumption of buildings, ANN is known as a potential application. 22 Therefore, the ANN is used for predicting energy consumption and CO2 emission widely. 23 Artificial neural network approach exhibits higher reliability and feasibility than other outdated regression methods. 24 Furthermore, it provides facilities to combine numerous parameters in the decision-making studies 25 and can be used for analyzing the built environment and climate parameters. 26 In order to predict energy consumption and sensitive analysis, ANN was investigated and it exhibited great accuracy. 12 Bu, Shao and Wang 27 predicted energy consumption using the radial basis function (RBF) kernel function of the Support Vector Regression (SVR). Weather parameters and operating parameters of the hotel air-conditioning system were the variables of this study. The result demonstrated high regression and good accuracy. In another study, ANN was applied to residential buildings to predict energy consumption. Numbers of exterior walls, housing direction, housing area and numbers of occupants were identified as effective parameters. Similar to previous studies, ANN model revealed high accuracy. 28 Therefore, the ANN was used to estimate the relationship between energy consumption and CO2 emission in this research.
Literature
In order to calculate energy consumption, a parametric model was conducted in Egypt using Grasshopper software. People density, lighting load, equipment load, heating, cooling, infiltration and fresh air were the input data. Then, the ANN evaluation was assessed and results showed that ANN predicted energy consumption accurately with MAPE <20% and R2 >95%. 8 Likewise, the research centre was assessed based on the energy consumption and optimization by Grasshopper and ANN. Wall U-value, equipment load rate, infiltration rate, lighting intensity, number of occupants and roof U-value were the considered parameters. Results revealed that the best ANN model had R2 = 0.9971 and energy consumption was reduced by about 35% in the proposed scenario. 12
Based on climate change, a dynamic model was industrialized to evaluate energy consumption and CO2 emission trends in Iran. The impact of energy consumption on the environment was analyzed based on energy policy factors. Results indicate that CO2 emission has been increasing by 5% yearly, and 985 million tonnes of CO2 will be produced up until 2025. CO2 emission will be reduced by 12.14% using the suggested policy scenarios. 2 Based on conducted research, linear regression was recognized as having a better performance by assessing energy consumption and CO2 emission cases. The multilayer perceptron had great accuracy by suggesting Error Correction Model (ECM) value closer to 0 and R2 coefficient beyond 99%. 29 In another research, the relationship among office buildings’ height, CO2 emission and cost of core wall was evaluated. As the thinness ratio was increased, CO2 emissions would be increased practically, which had a linear relation with the height. 30 Moreover, by optimizing energy consumption and CO2 emission, passive energy measurement was prioritized. The results revealed that ‘increasing the building’s thermal mass’, ‘using sunspaces’ and ‘refining the building’s air tightness’ were the most appropriate passive processes in thermal, lighting and acoustic groups, correspondingly. 31 Furthermore, in another research, the relationship between CO2 emission and embodied energy during building construction was evaluated. The results pointed to the linear correlation between CO2 density and intensity of floor area and materials. 32 Furthermore, 71 sample apartments were investigated by estimating energy use and CO2 emission. Results indicated that electrical applicants, space heating, DHW, lighting, cooking, space cooling and air movement were effective parameters in CO2 emission. 33
Pervious research.
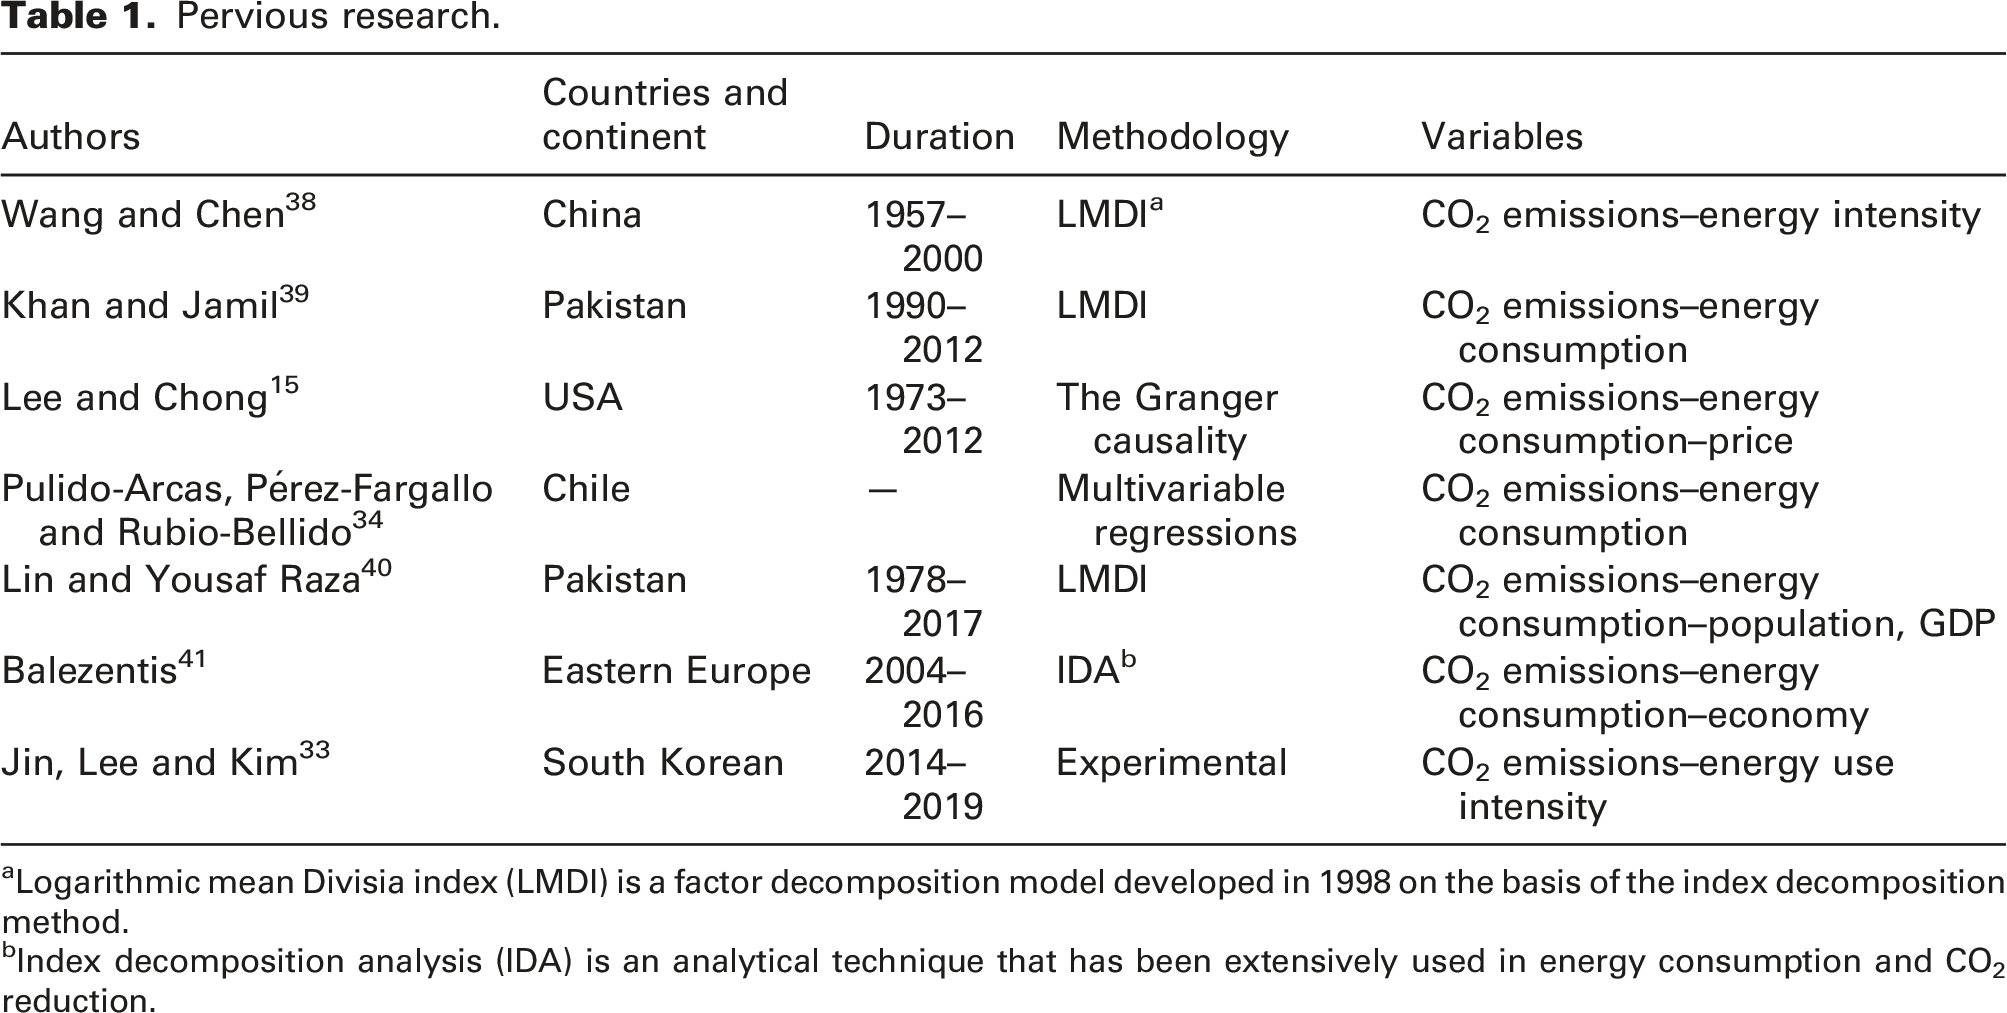
aLogarithmic mean Divisia index (LMDI) is a factor decomposition model developed in 1998 on the basis of the index decomposition method.
bIndex decomposition analysis (IDA) is an analytical technique that has been extensively used in energy consumption and CO2 reduction.
In this research, the aim was to investigate the relationship between CO2 emission and energy consumption in a research centre in Iran by implementing particle swarm optimization (PSO) algorithm, ANN and statistical analysis. The hypothesis of the research is that the CO2 emission in existing buildings has a linear relation to energy consumption and can be reduced by building parameters. The questions of the research are: What is the relationship between energy consumption and CO2 emission in Iran? How can building parameters affect CO2 emission? Considering the importance of the subject and the existing gap amongst research, this research was conducted for the first time in Iran during the year 2018–2019. Also, as its novelty, this study focused on multiple methods. Other novelties and objectives of this research are listed below: • Finding the correlation between energy consumption and CO2 emission in Iran by ANN; • Discovering the impacts of effective parameters on energy consumption and CO2 emission; • Generating the design strategy guideline by implementing the tree decision tree; and • Comparing building-related effective parameters in energy consumption and CO2 emission.
Methods
Case study modelling
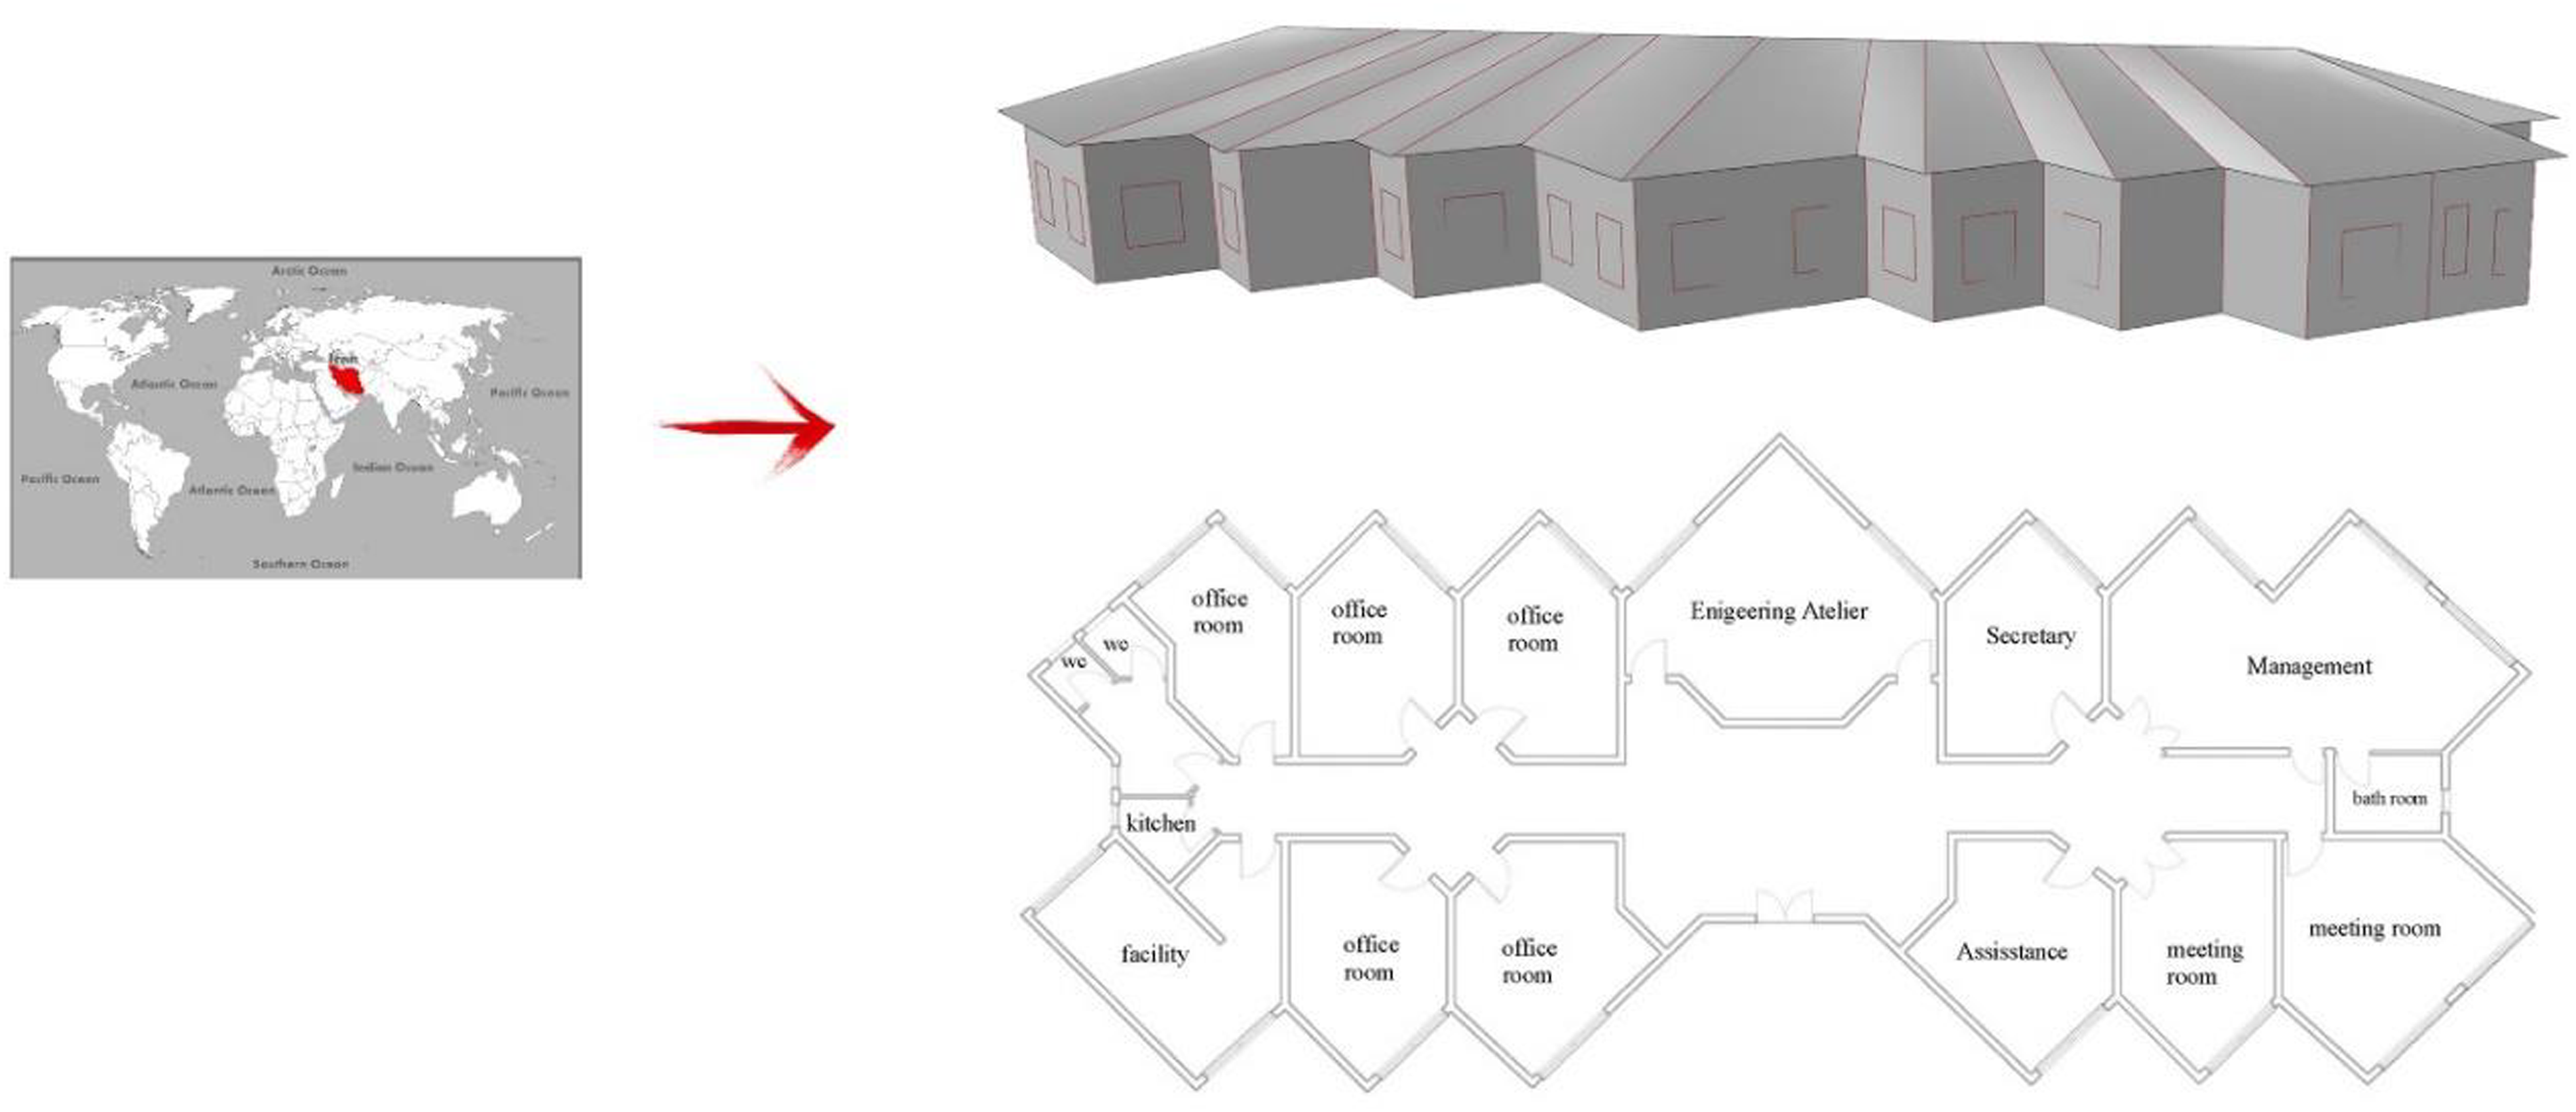
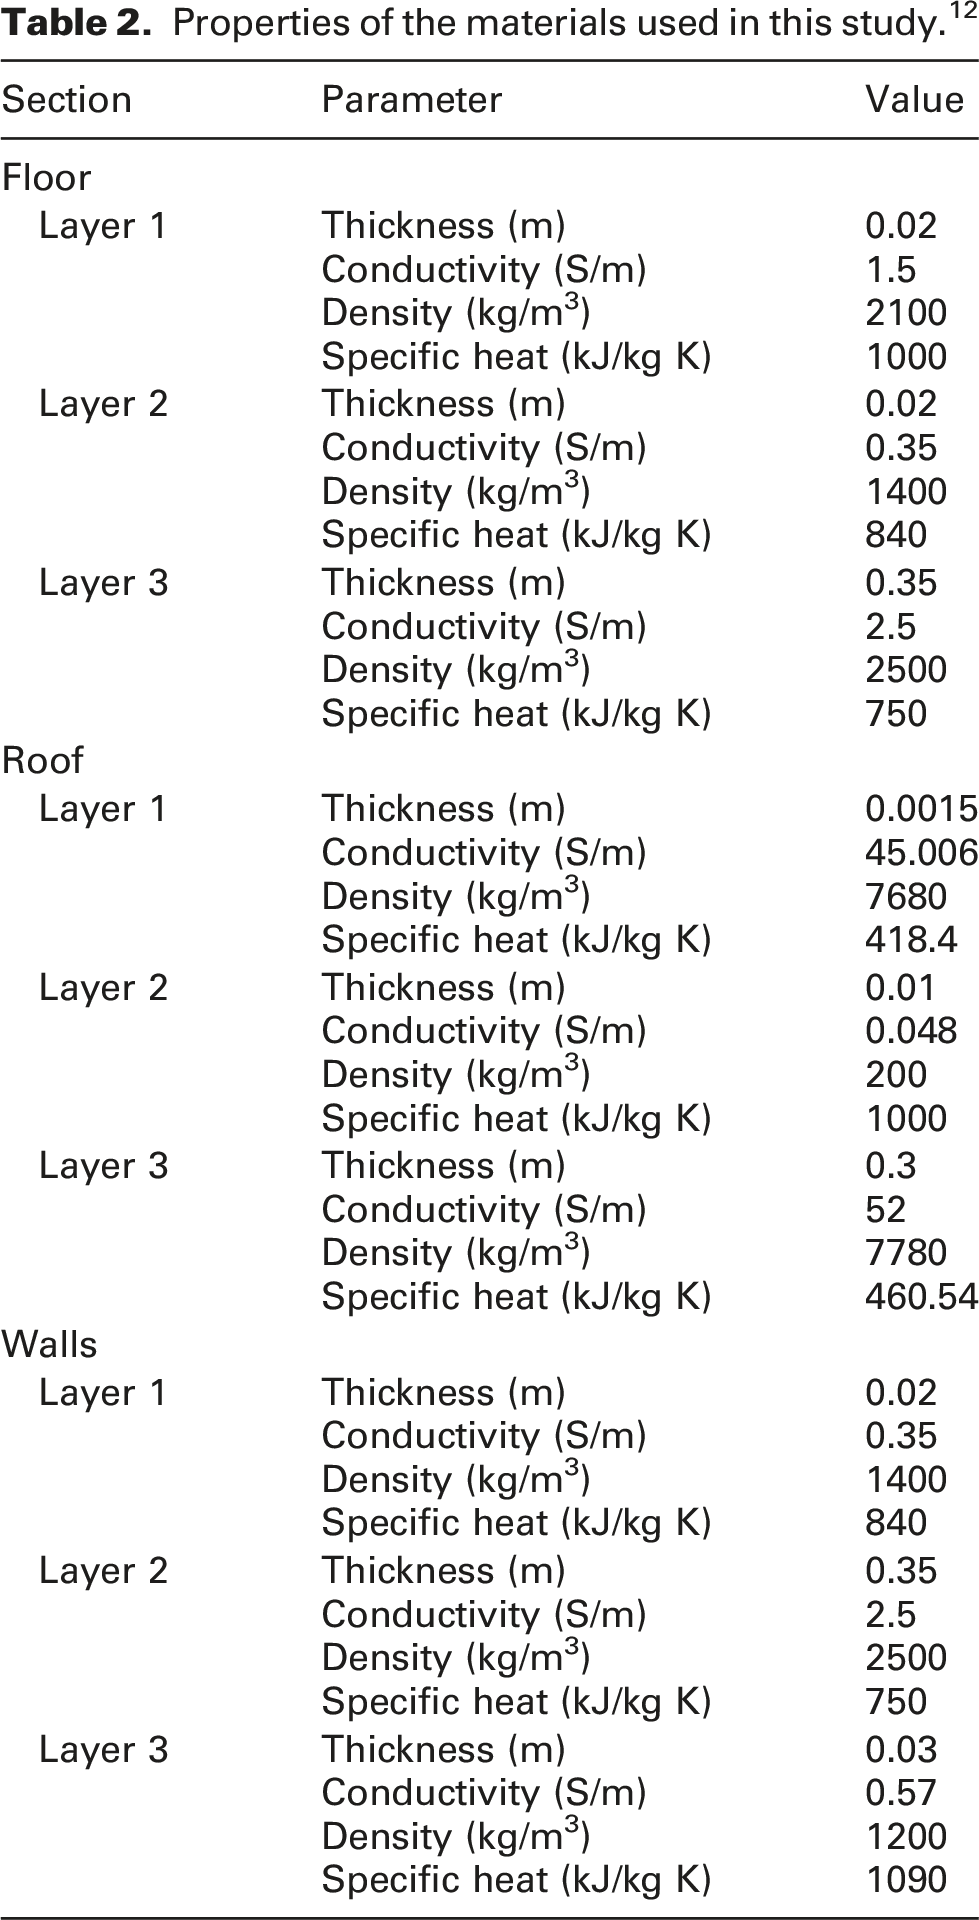
An environmentally friendly research centre in Tehran was chosen as a case study (latitude 51 21`, longitude 35 44`). The area of the research centre is approximately 500 m2 which is located in a north-southern orientation along with one important entrance situated on the western side. According to Figure 1, the building has one laboratory, a meeting room, eight office rooms, a kitchen and two bathrooms on the ground floor. On average, 25 clients refer to this building 5 days a week from 7 a.m. to 6 p.m. Different materials used in the wall section are considered in Table 2 and the wall U-value was premeditated as a comprehensible material in EnergyPlus modelling. The chosen building was simulated based on trustworthy reports and the verified method is defined fully. The investigated research centre. Properties of the materials used in this study.
12
Input features and varieties considering ASHRAE standard.
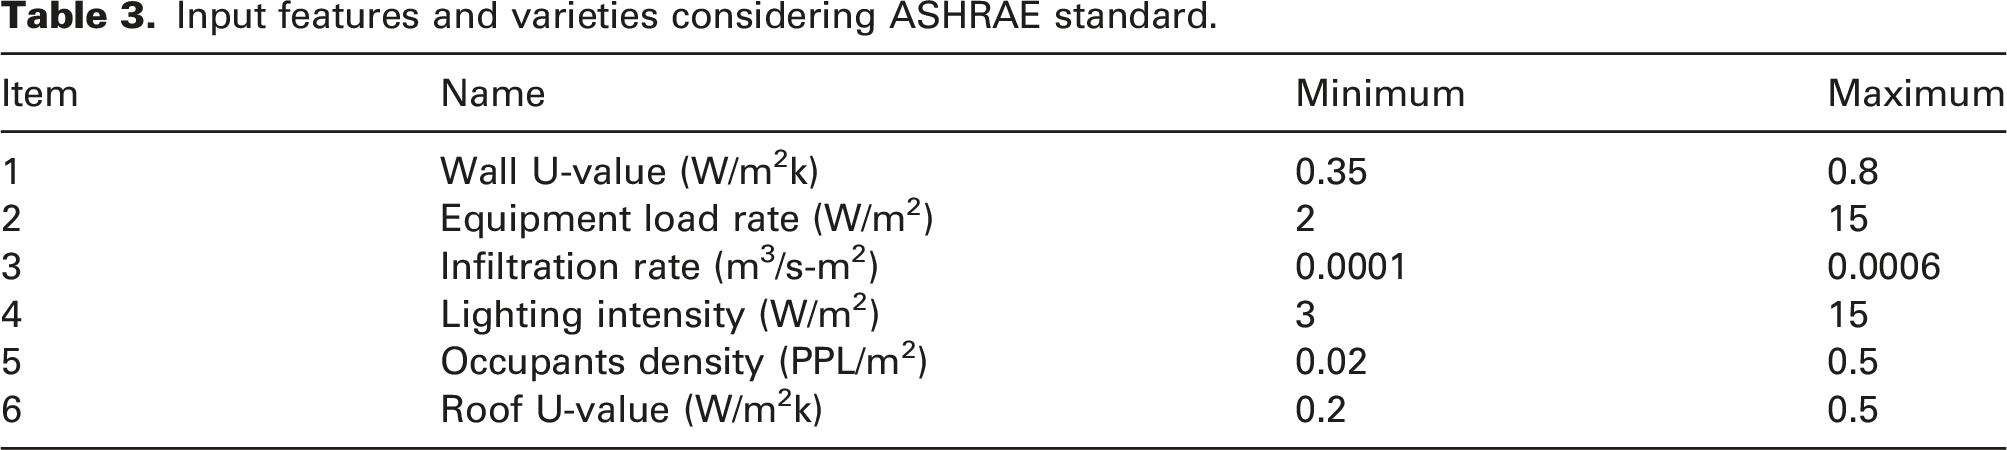
Modelling process
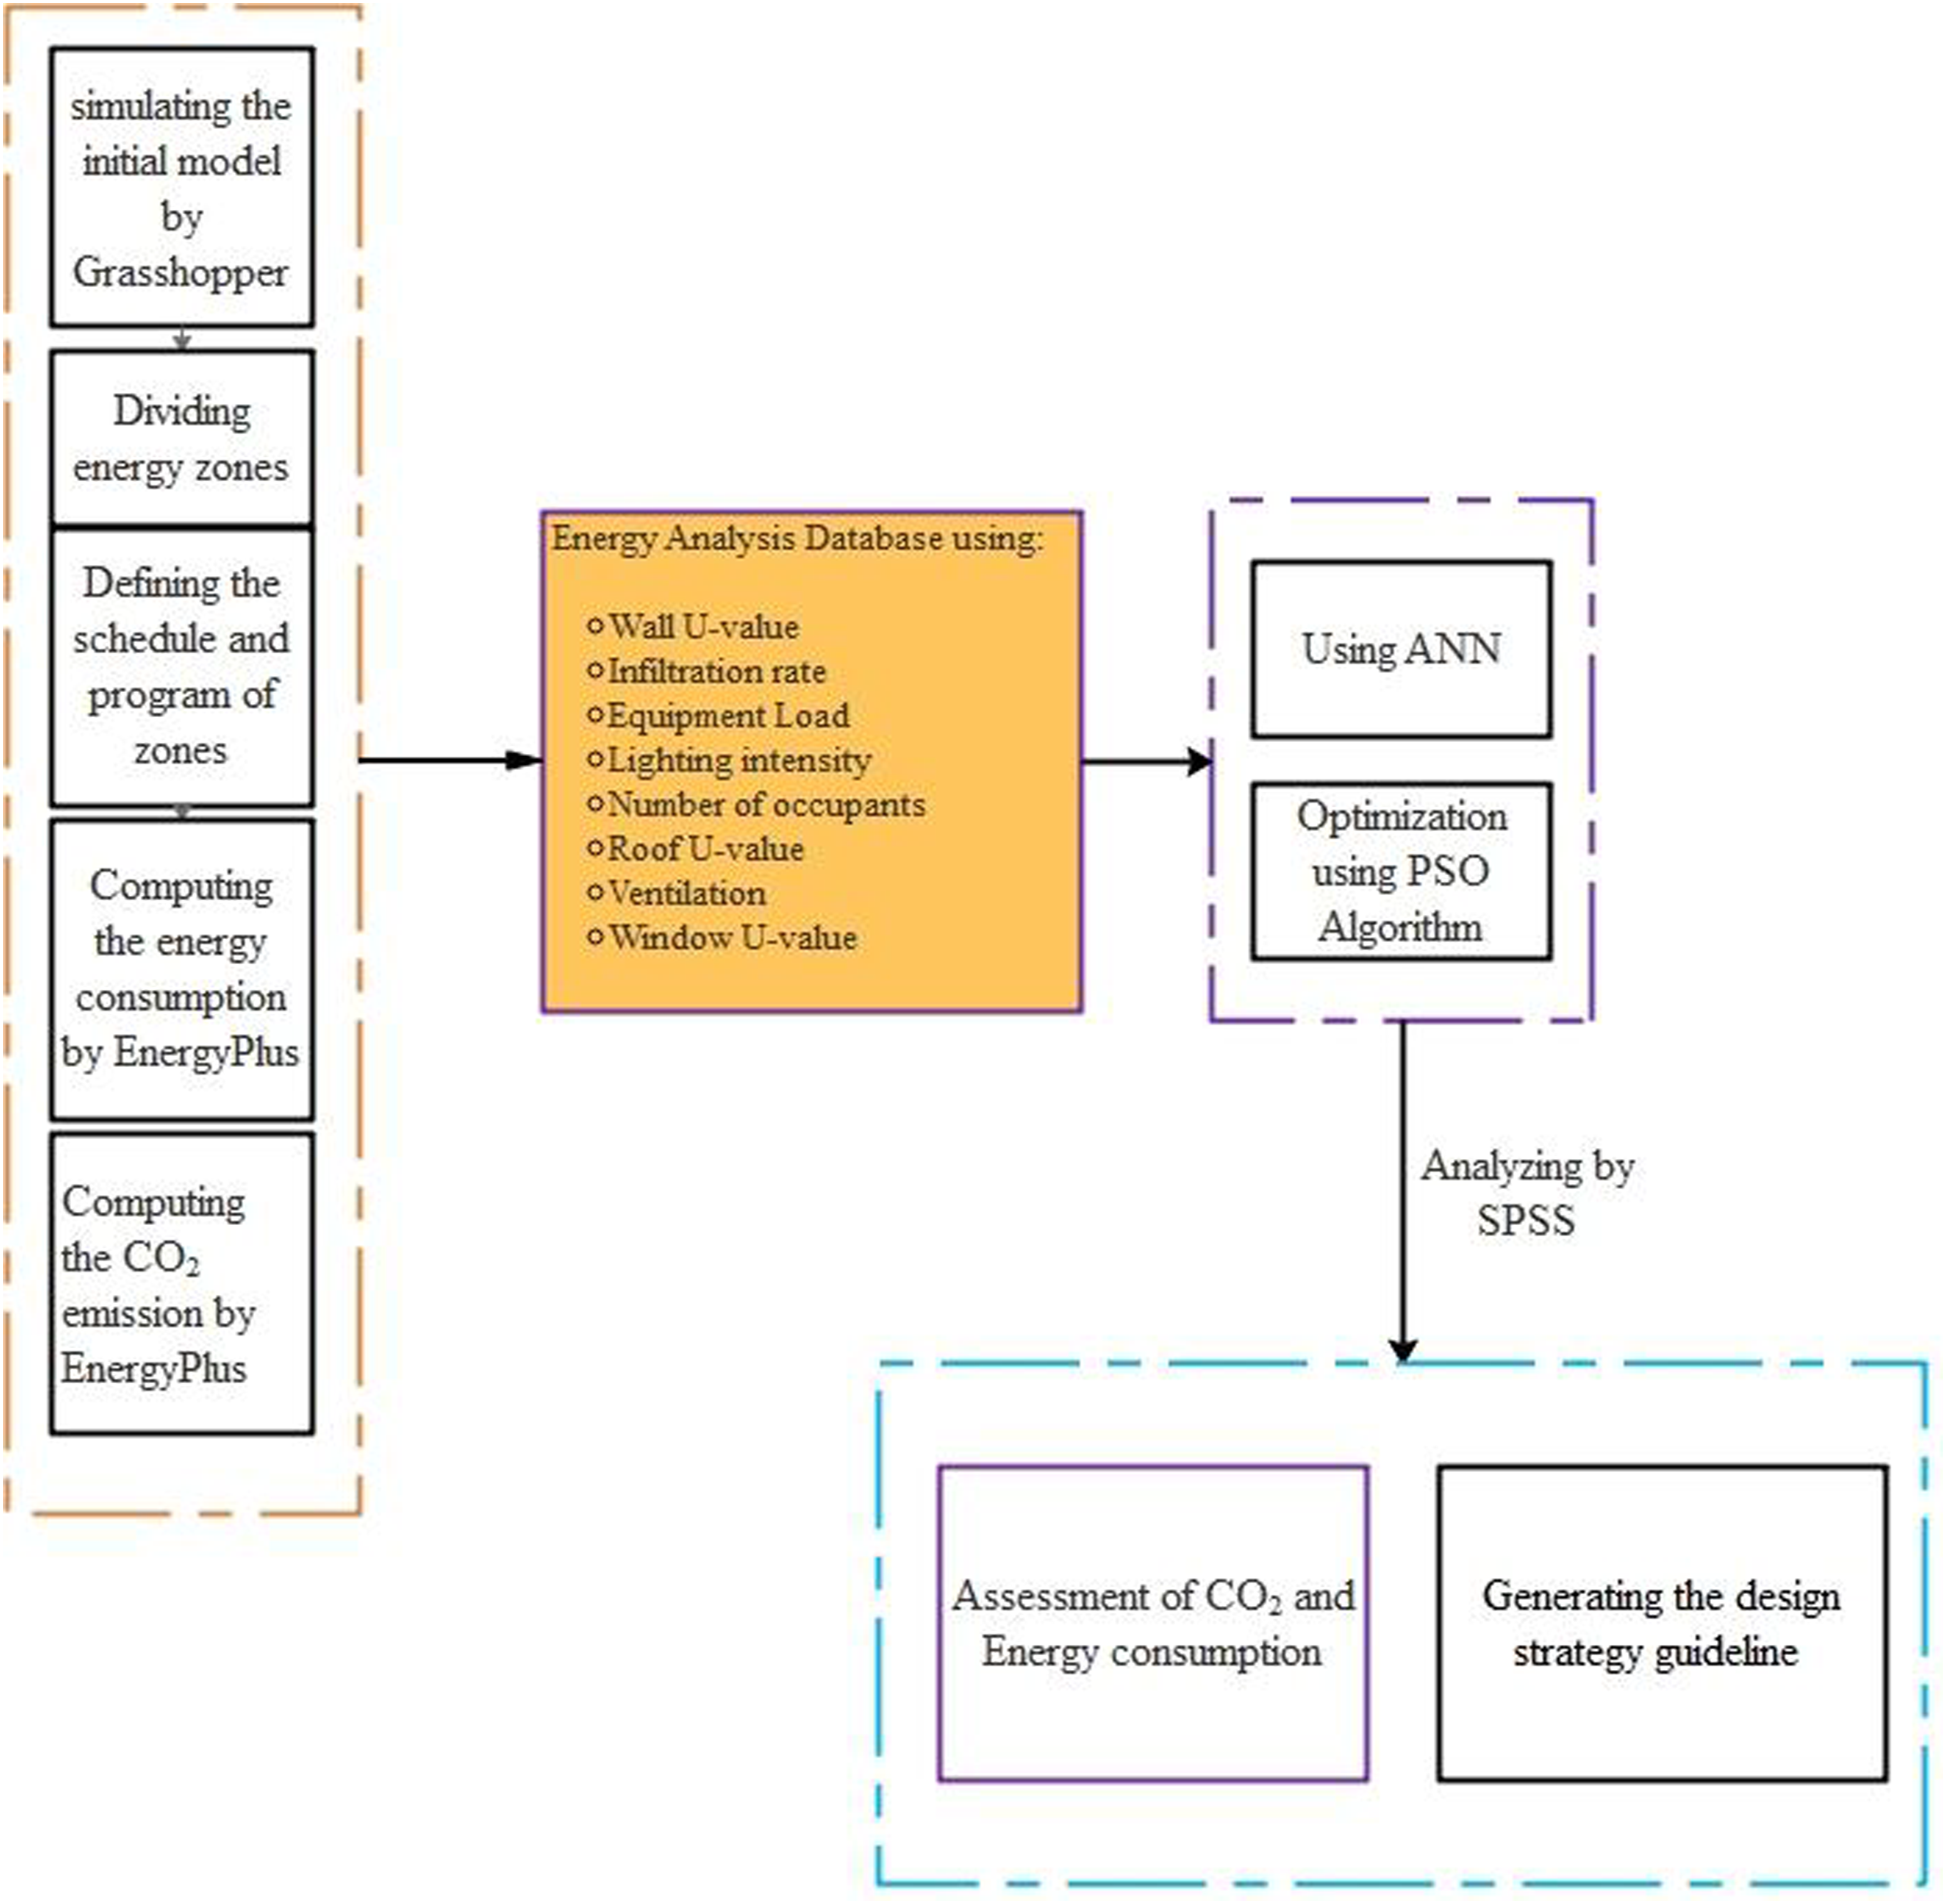
EnergyPlus was preferred for energy computation amongst other engines like DOE-2, ESP-r and IDAICE. In addition, EnergyPlus was chosen because other studies refer to it as the most appropriate appliance for energy calculation. 42 EnergyPlus software is applicable to forecasting energy consumption and examining the system further from an energy evaluation standpoint. To this end, the 3D model of a current research centre was modelled by Grasshopper in Rhino software. Therefore, energy zones were produced by Ladybug and Honeybee Plugins which enjoy the benefit of EnergyPlus engine for computing energy consumption. Subsequently, wall, roof and floor materials, windows, and the minimum and maximum of parameters rate were defined. Afterward, the schedules, loads and program of zones were defined. Although the established model with all details was challenging in performance, it was required for calculating energy consumption appropriately.
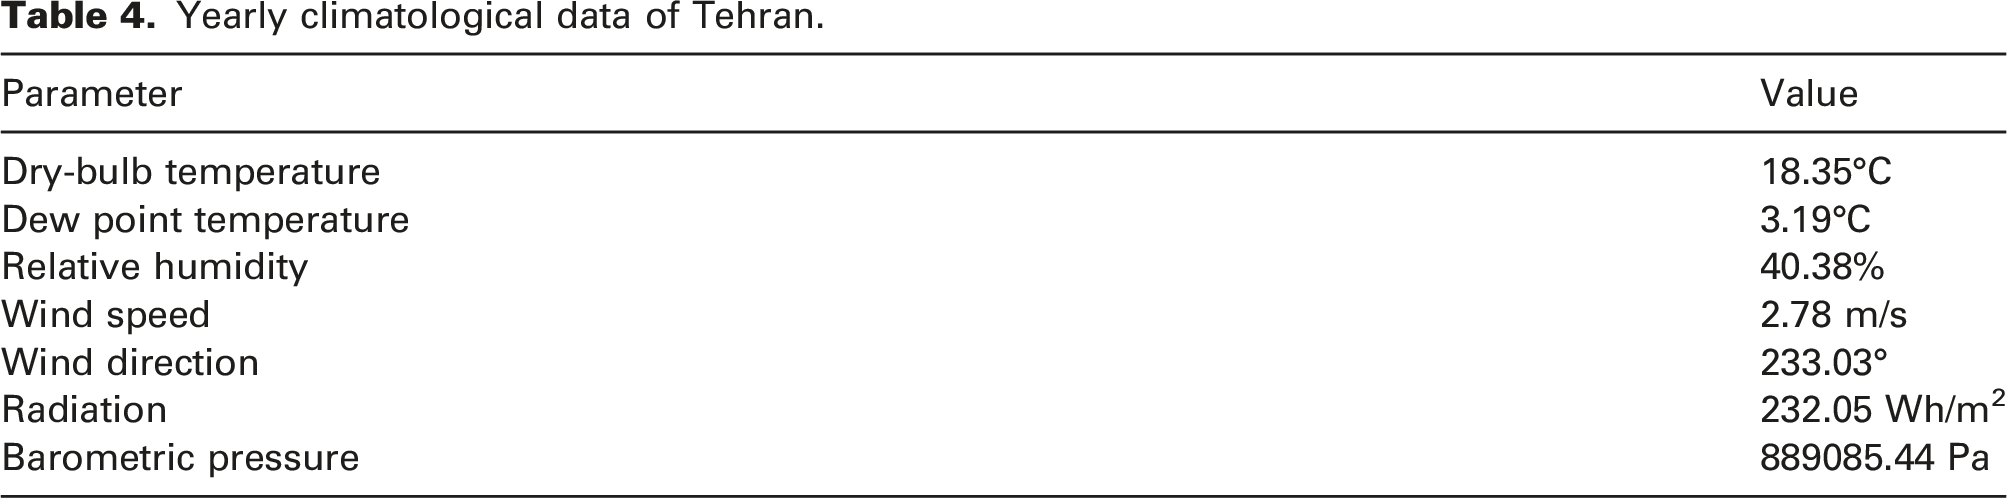
Weather data
Yearly climatological data of Tehran.
CO2 calculation
CO2 emission was calculated as prescribed by equation (1)
Optimization
Particle swarm optimization algorithm
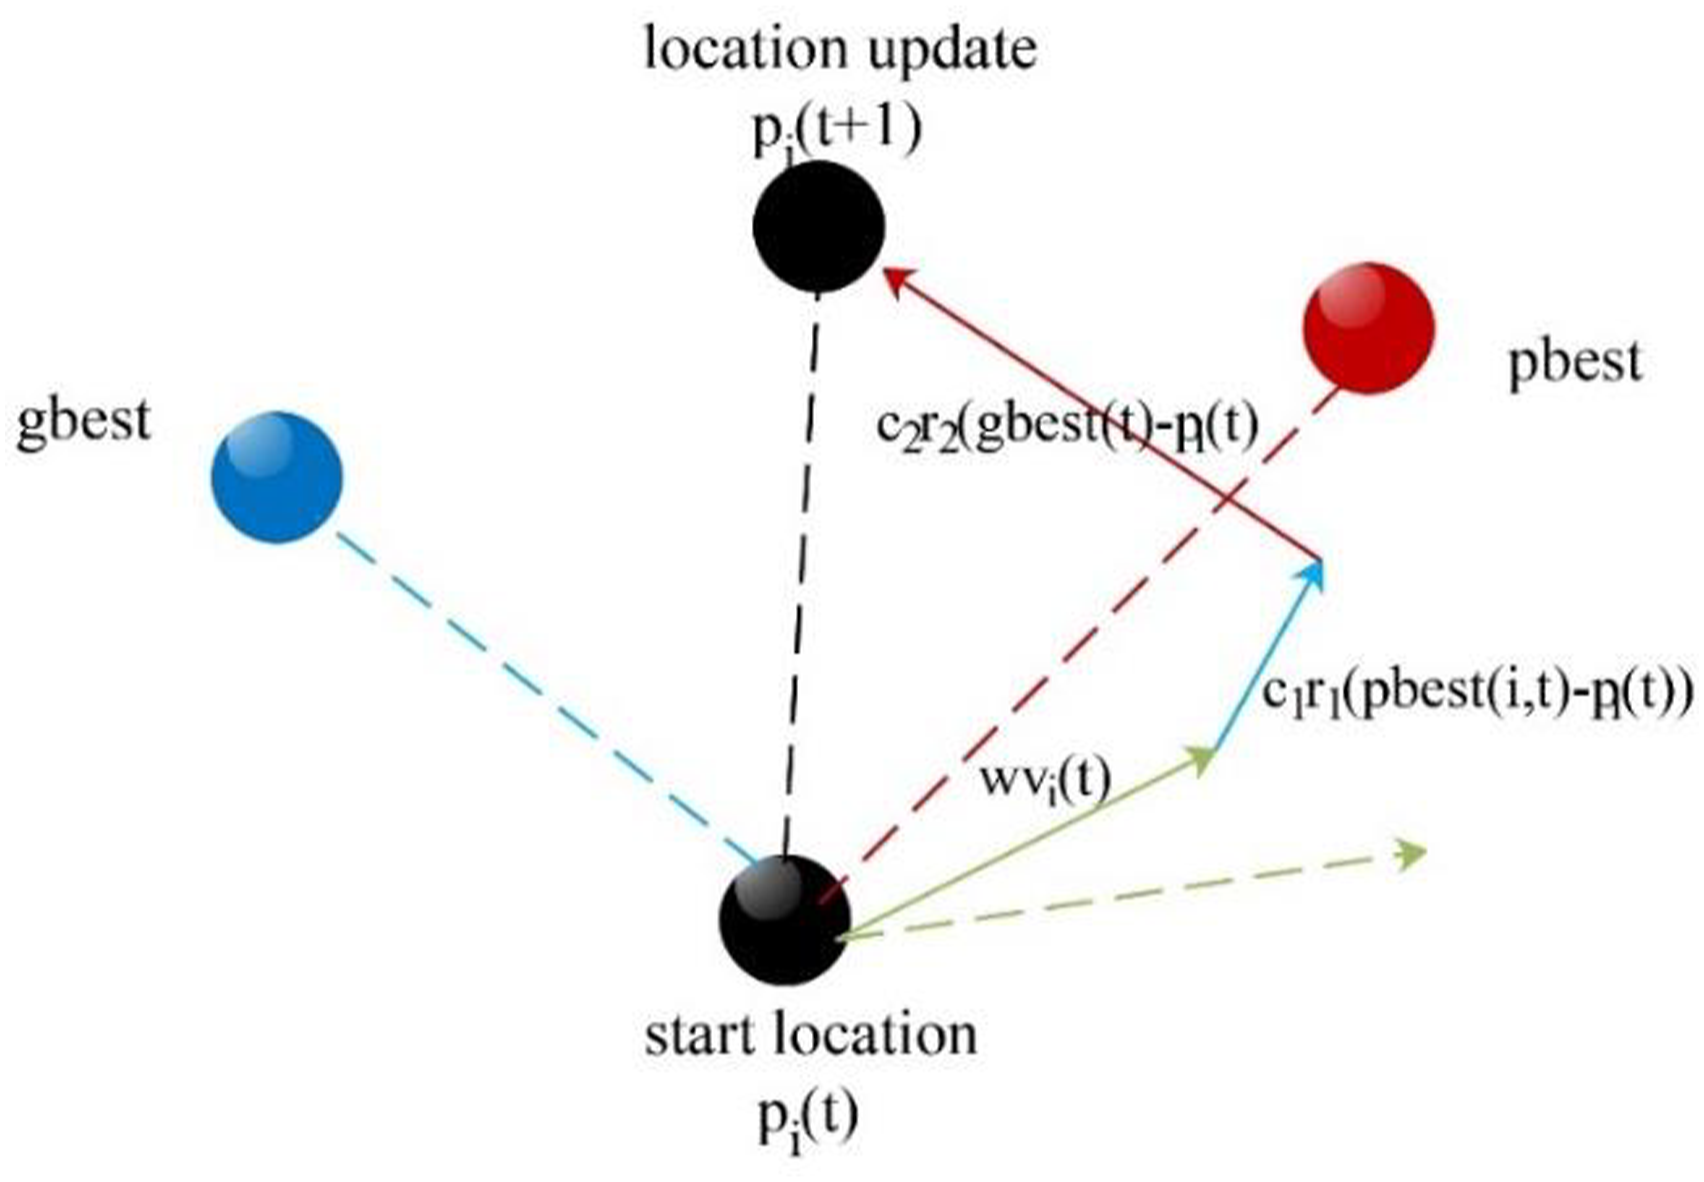
Particle swarm optimization was proposed in 1995 and inspired by birds’ behaviour and fish schooling. Particle swarm optimization is implemented more effortlessly with high accuracy rather than other swarm algorithms.
44
Therefore, it can be nominated as the most widespread algorithm for solving engineering and scientific problems.
45
Optimization of energy consumption can be conducted by Silvereye plugin using PSO algorithm as a reliable way for architects.
46
Based on equation (2), pbest demonstrates the best position and gbest of equation (3) shows the global position. Besides, the velocity is fabricated based on current velocity, gbest and pbest.
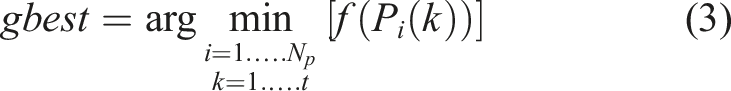
Upon determining the mentioned parameters, the position (P) and the velocity (V) of each particle are restructured as shown in equations (4) and (5): PSO algorithm. Flowchart of this research.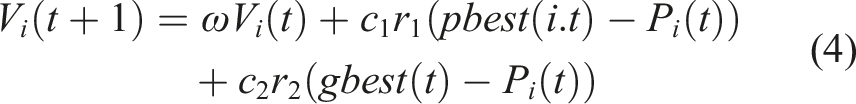

Results and discussion
Validation
Validation of optimization
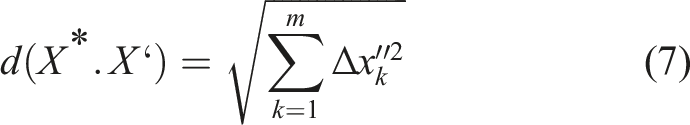
The ability to detect an optimal solution to the optimization problem by considering objective function evaluations is validation. Therefore, based on the brute-force search method, validity was achieved by investigating the closeness between the finest solution and the accurate optimum as prescribed by equation (6).
47
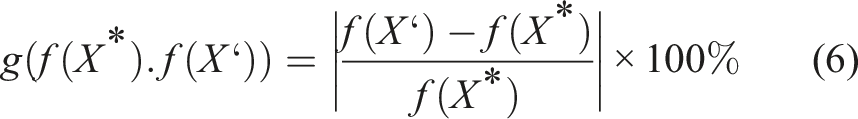
While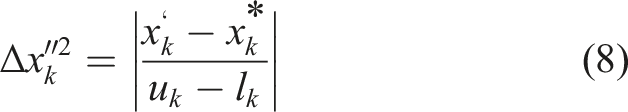
Obviously, X` is the established optimal solution by the algorithm composed of (
Validation of modelling
In order to evaluate the accuracy of modelling the building, a comparison was made between electrical consumption bills of the existing research centre and the result of the simulation (see Figure 4). The considered bills were collected from the existing building monthly over a year in a standard situation. According to Figure 4, the maximum error of simulation was 11.8%, which is counted as good accuracy. A comparison between the results of numerical simulation and electrical use bills.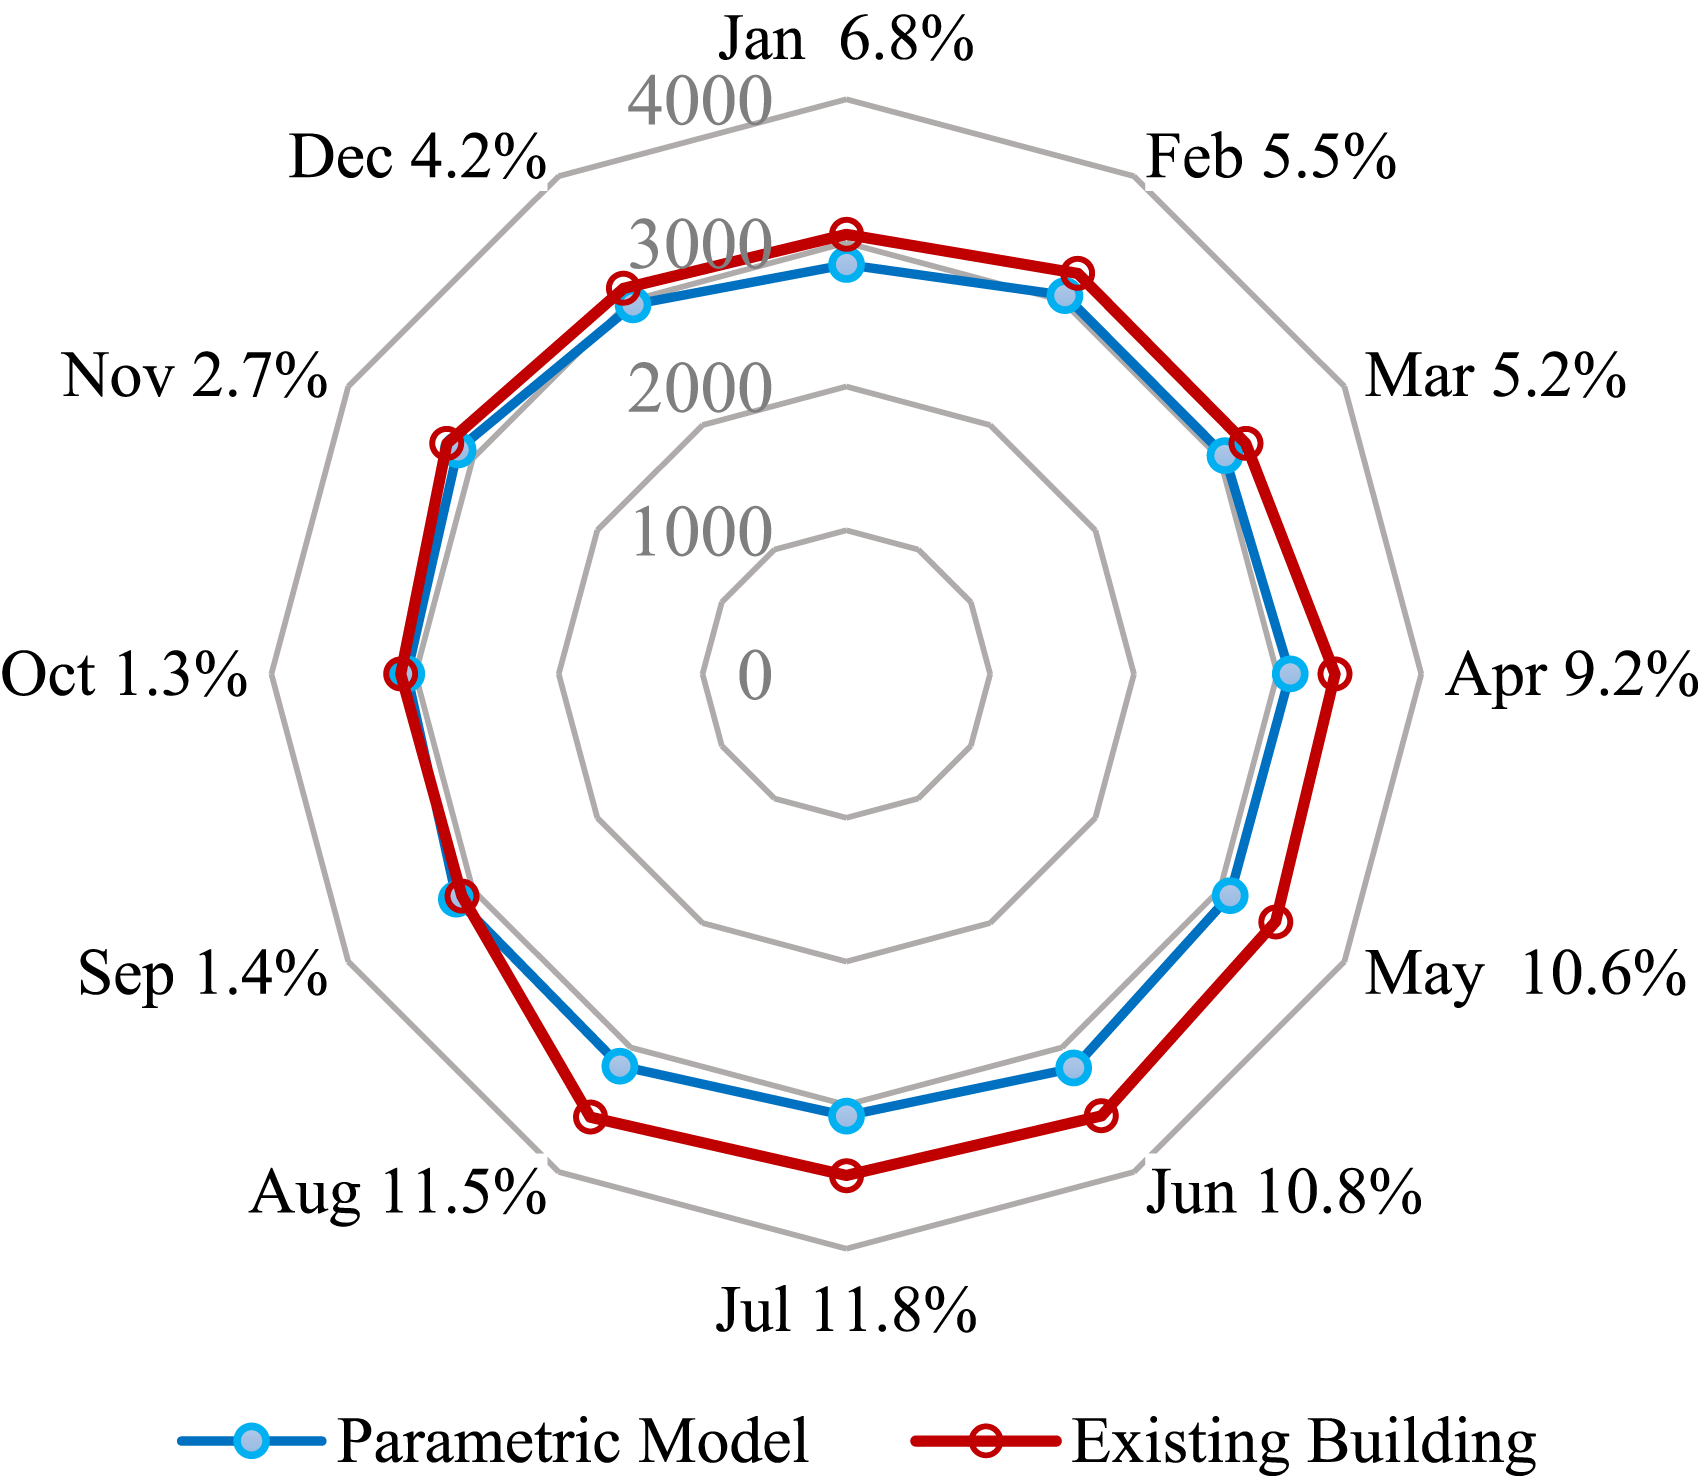
Validation of ANN
Regarding the validation of ANN calculation, a toolbox of SPSS software was employed. Following the validation of all toolboxes of the software, ANN results were validated.
Results
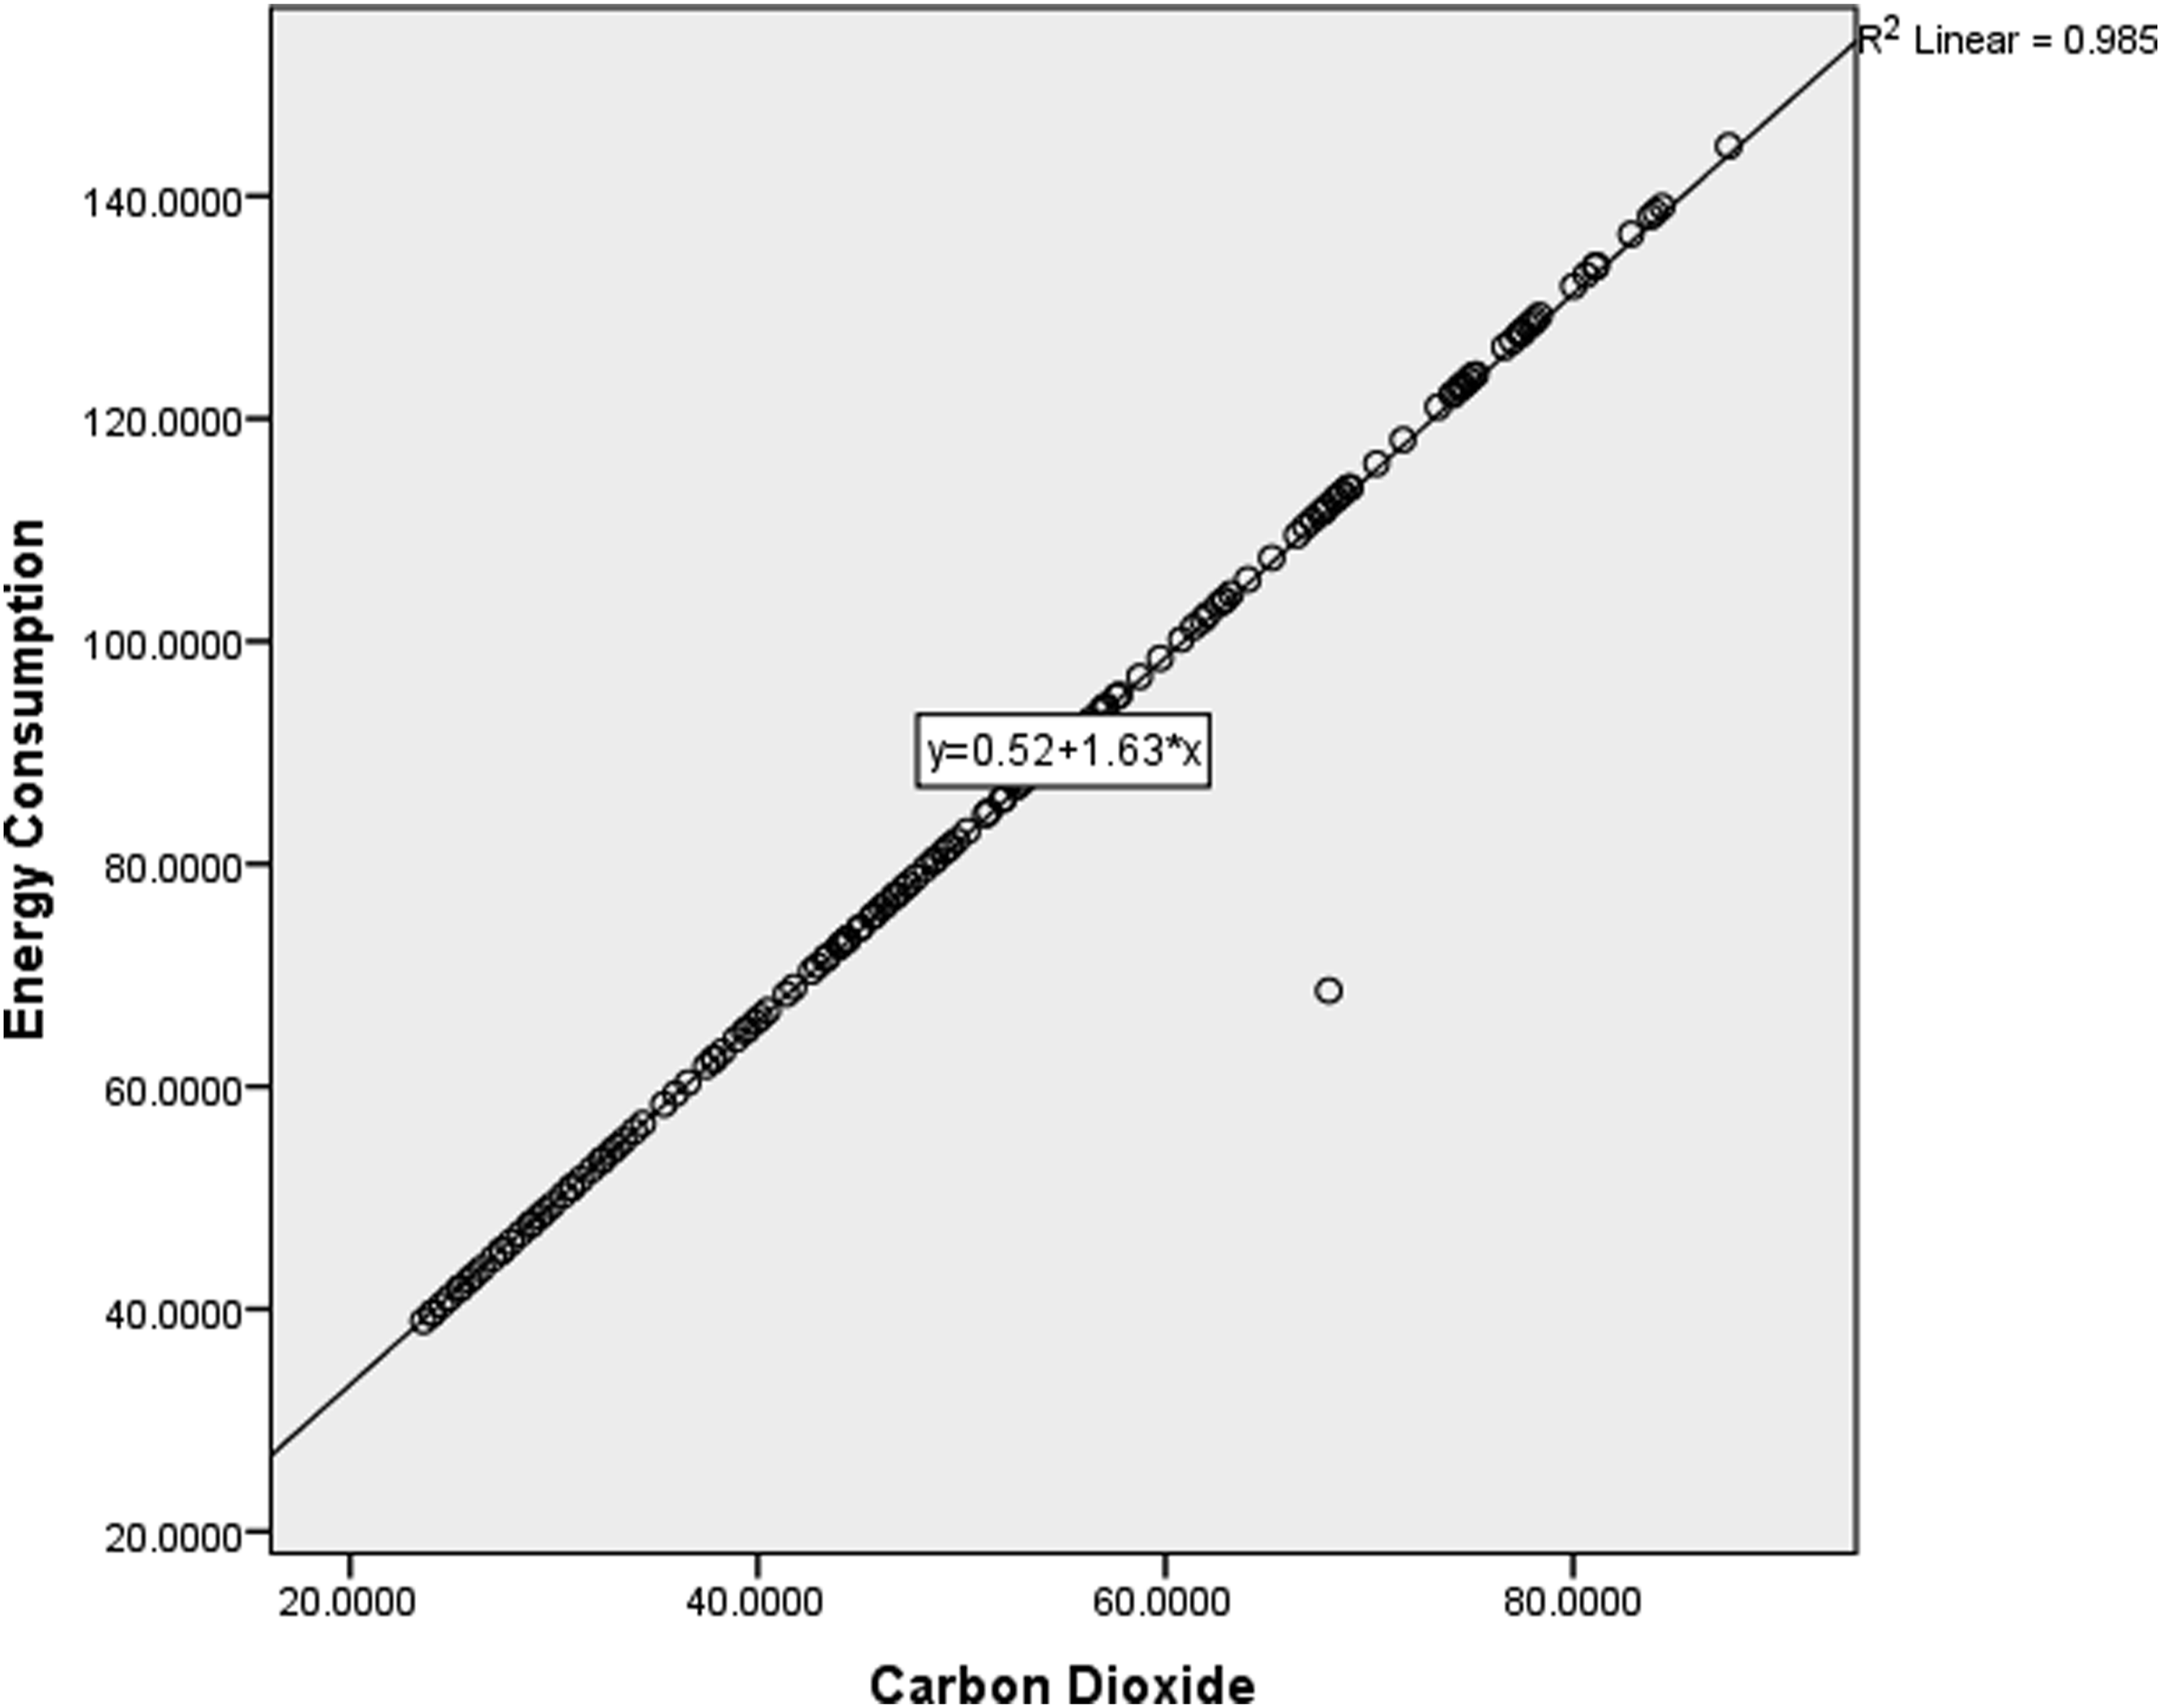
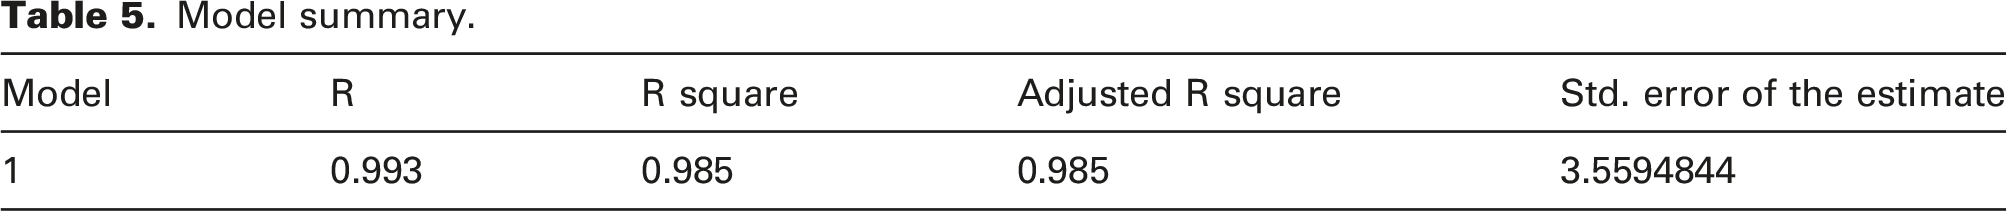
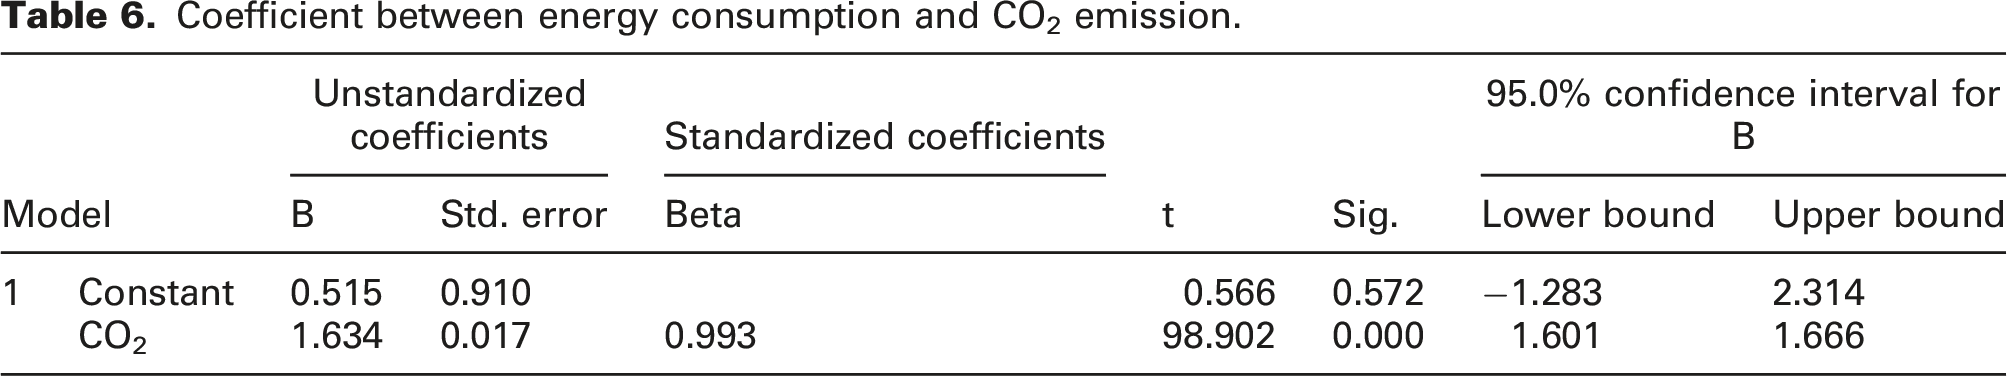
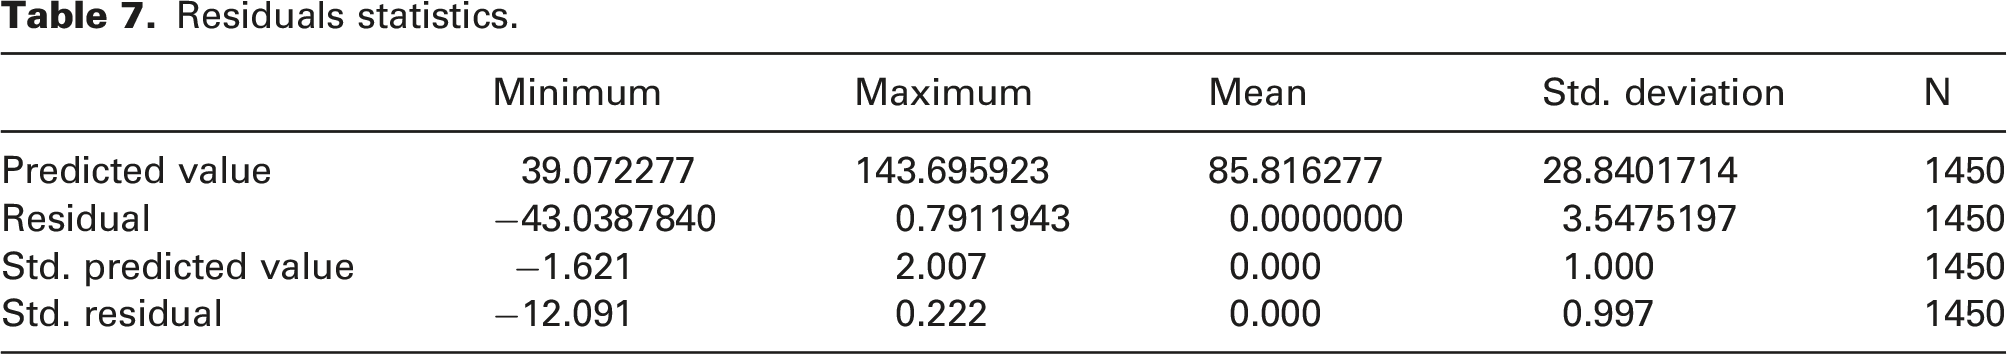
Particle swarm optimization was conducted to model the research centre to reduce CO2 emission and energy consumption. Figure 5 demonstrates the optimization of CO2 emission from 70.56 kg/m2 to 18.91 kg/m2 by PSO algorithm. Energy consumption was reduced by 35% through optimization and CO2 emission was reduced by 73.21%. Figure 6 reveals the comparison concerning energy consumption and CO2 emission trends. As can be seen in Figure 6, the relationship between CO2 emission and energy consumption is a positive linear relation. Based on the conducted ANOVA test, R2 linear was 0.985 and R was 0.993 which enjoyed great accuracy and linearity (Table 5). In this test, energy consumption is a dependent variable and carbon dioxide is the predictor (as a constant variable). In order to find the equation between energy consumption and CO2 emission, regression coefficients or the estimation of parameters appear in the coefficients table (Table 6). The fixed value or ‘width from the origin’ is equal to 0.515 and the ‘slope of the line’ is 1.634, which can be seen in Figure 6. Moreover, the Residuals Table lists descriptive indicators for standardized residues and predicted values (Table 7). As can be seen in Table 8, the ‘mean’ estimate of the error or residuals is 0.00, which is a confirmation of the above statement. Optimization of carbon dioxide. The relationship between energy consumption and carbon dioxide. Model summary. Coefficient between energy consumption and CO2 emission. Residuals statistics. Pearson correlations between CO2 emissions and parameters.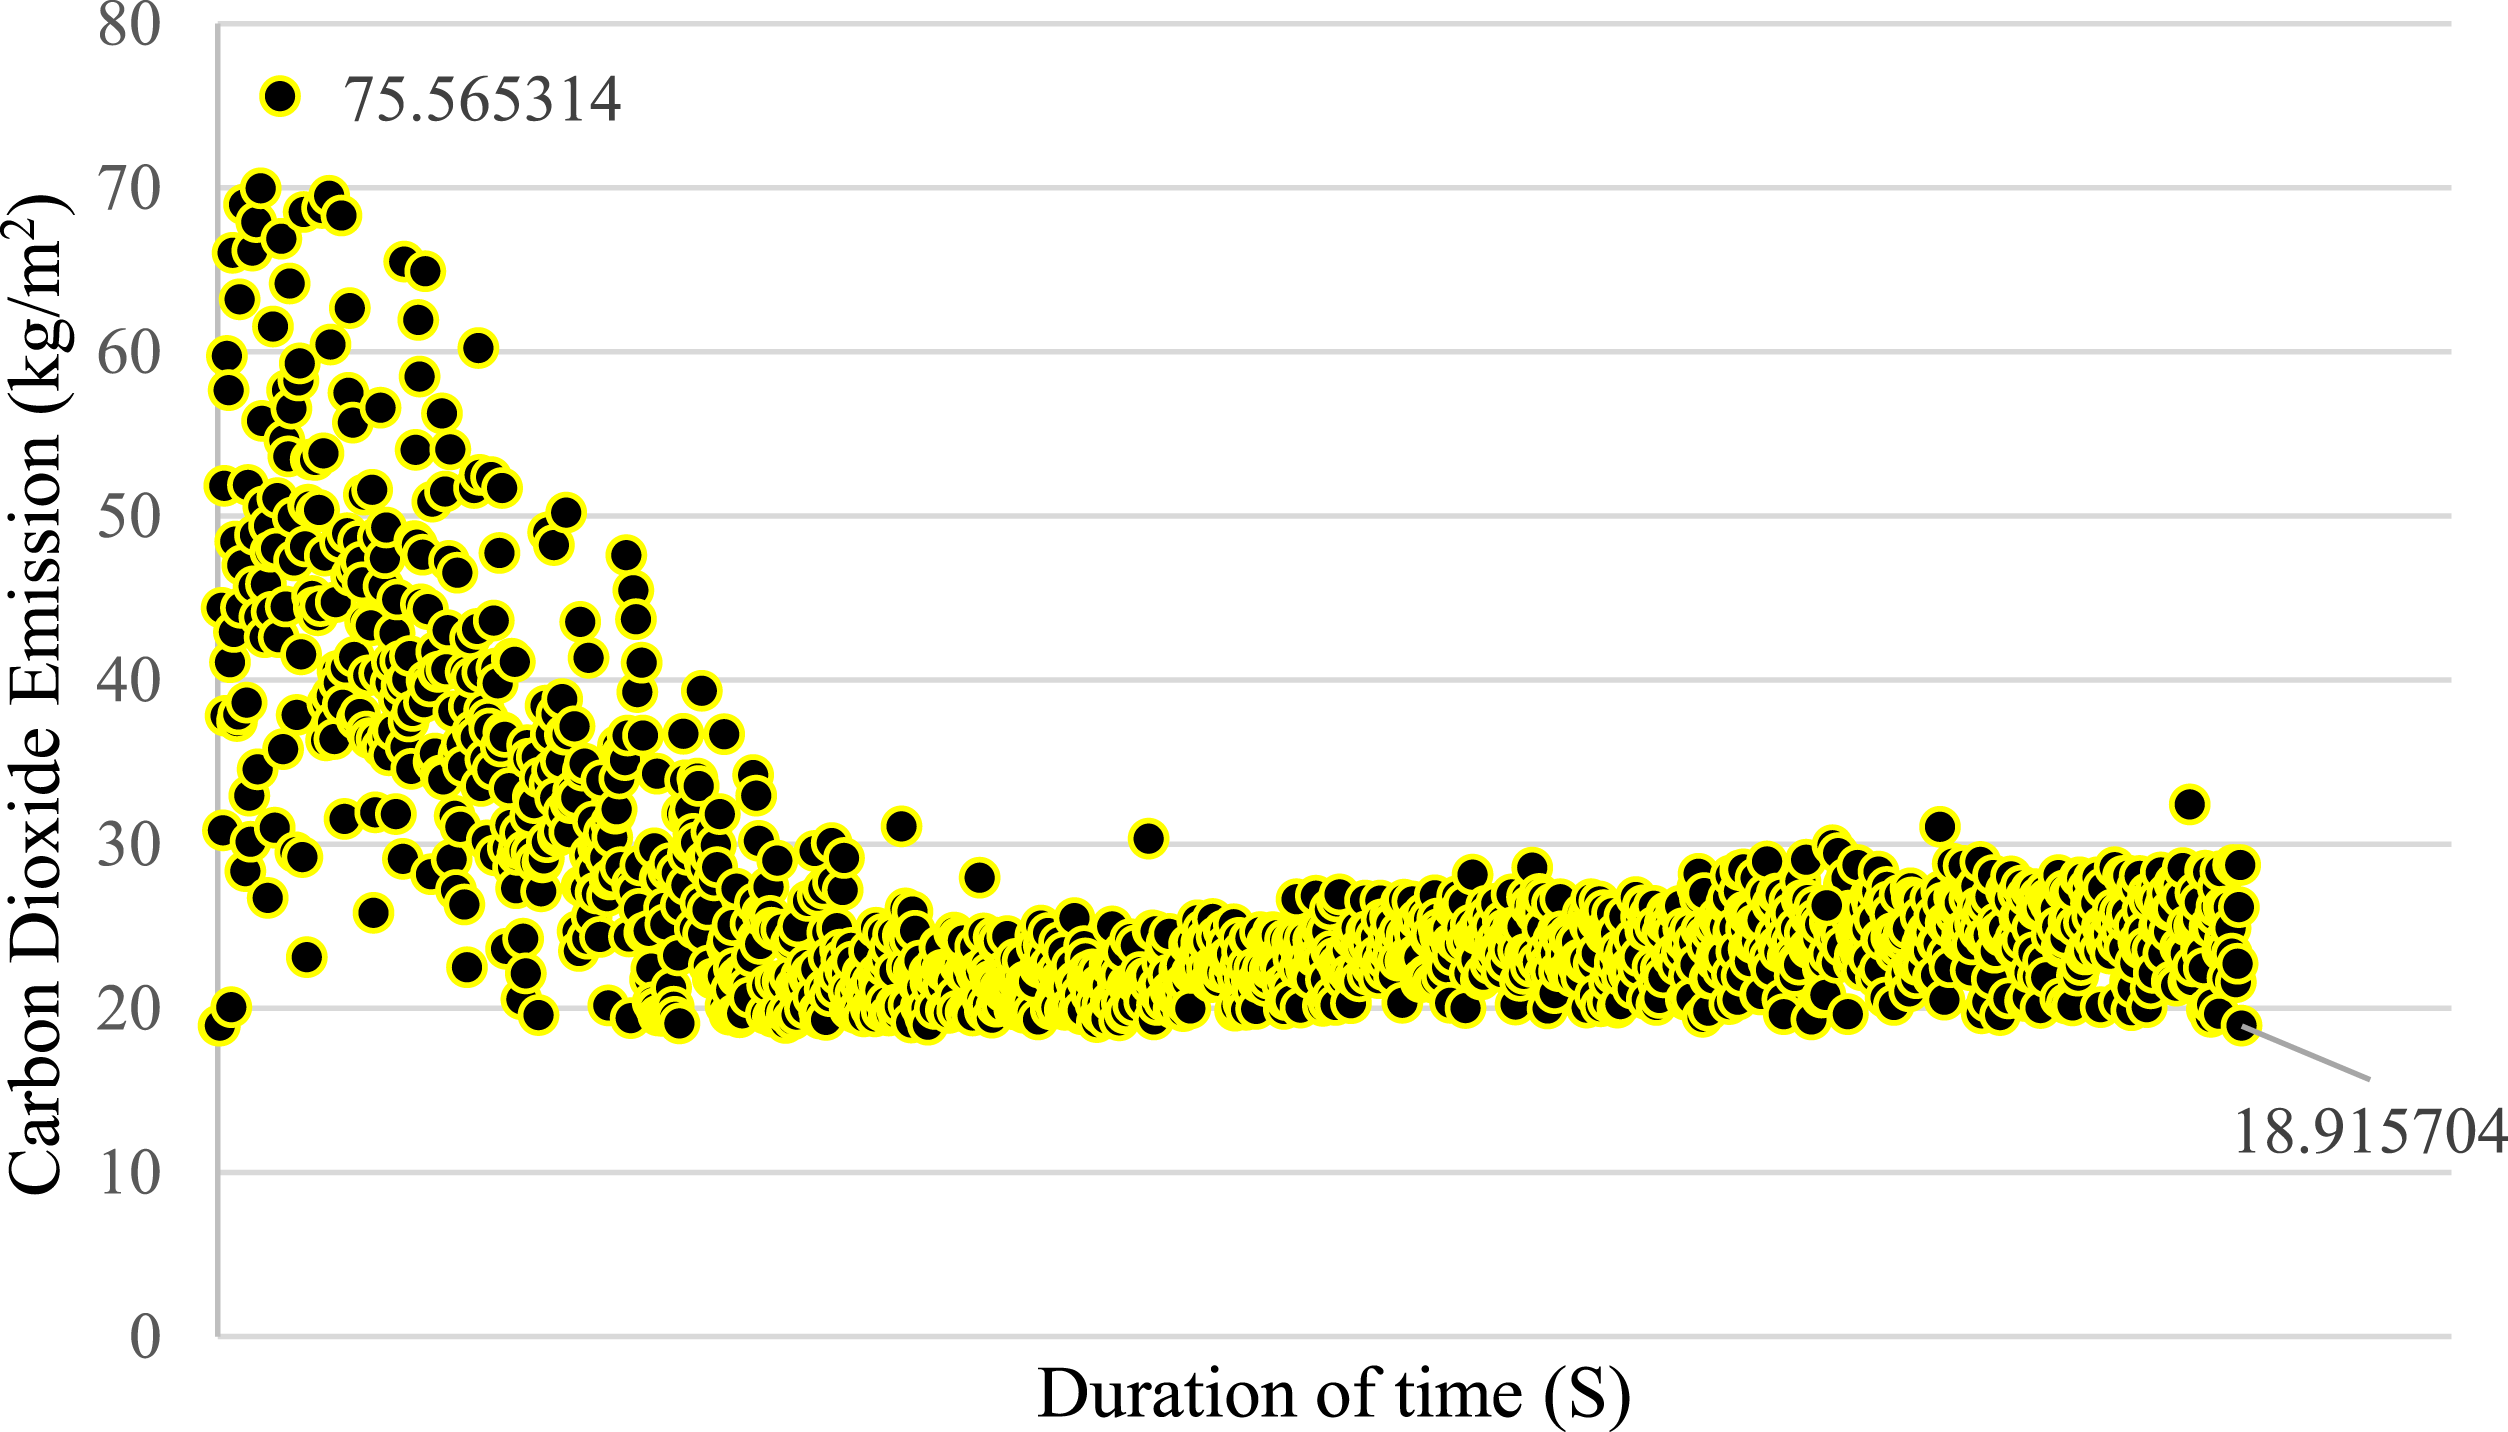
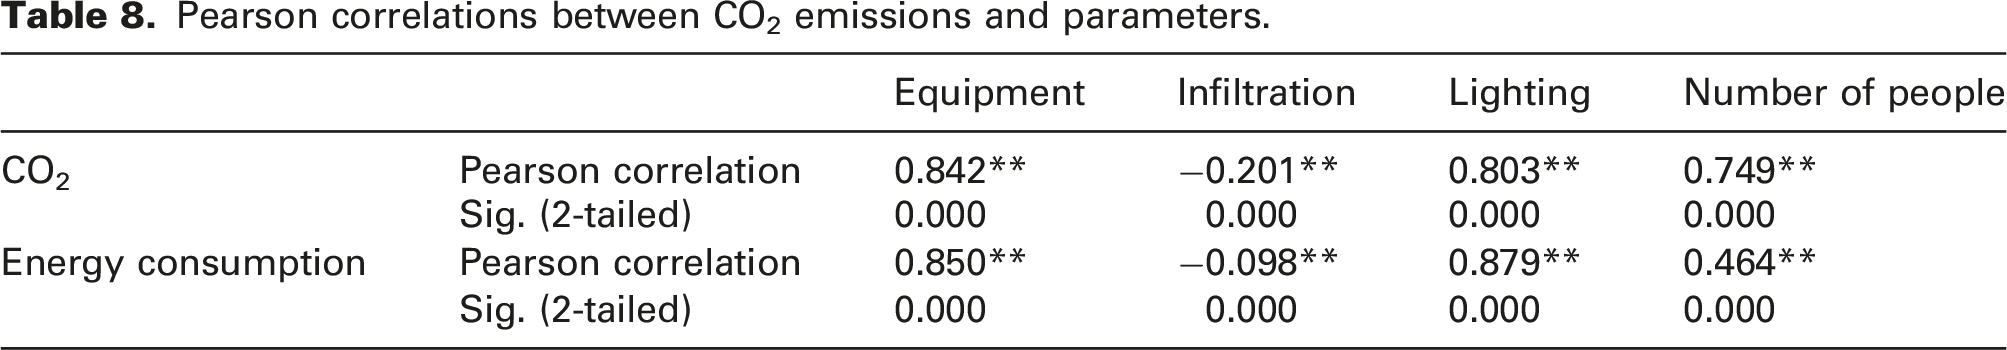
As shown in Table 8, the Pearson correlations among CO2 emissions, energy consumption and considered parameters are made possible. Results indicate that CO2 emissions and energy consumption have an inverse relationship with infiltration rates (−0.201) and (−0.098). Besides, equipment load rate (0.842), lighting (0.803) and number of people (0.749) have a linear relation with CO2 emissions. However, lighting (0.879), equipment load rate (0.850) and the number of people (0.464) have a linear relation with energy consumption.
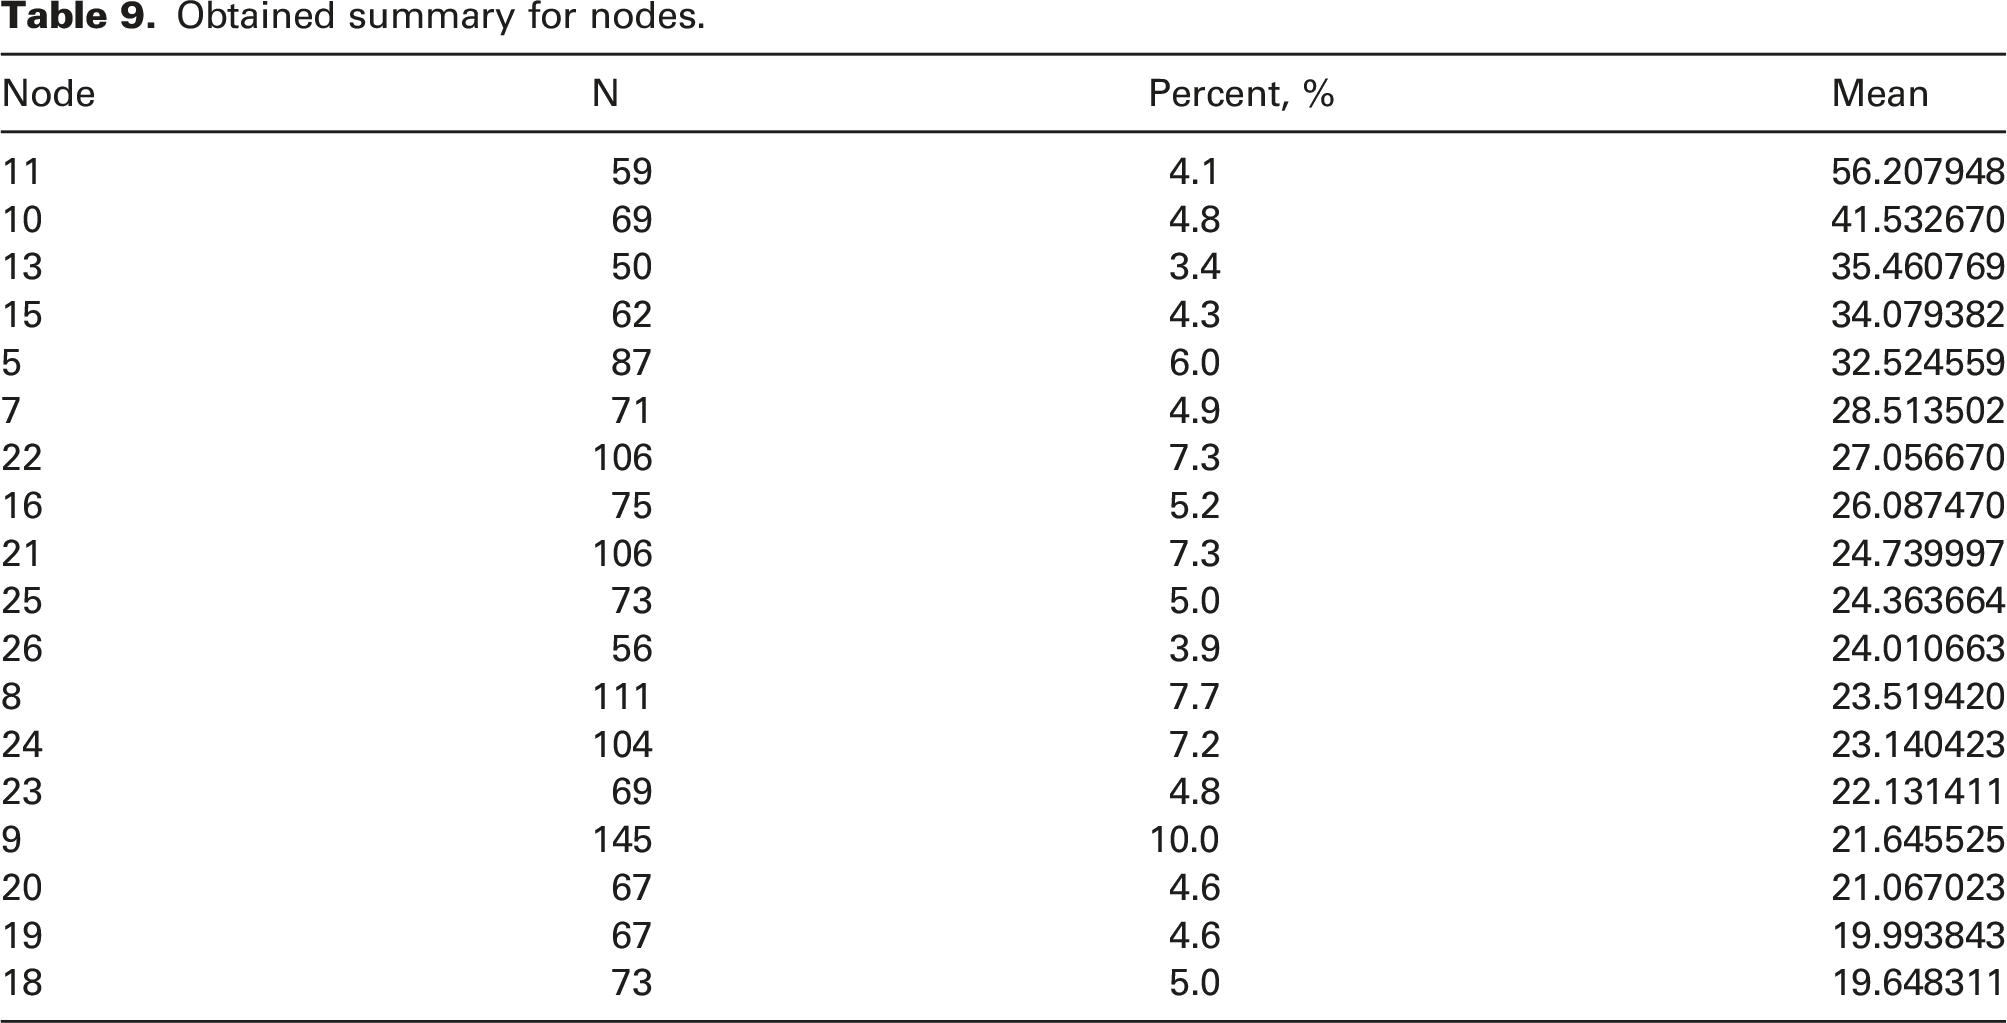
Given that decision tree is recognized as a data mining tool, Figure 7 demonstrates the decision tree from the CO2 emission and effective parameters. The findings can be considered as operative strategy guidelines in a modest design to optimize CO2 emissions. The used decision tree was applied based on Chi-squared Automatic Interaction Detection (CHAID) growing method. According to Figure 7, CO2 emission may decrease effectively by controlling equipment loading rate, lighting and the number of people at the same time with a probability of 36.8%. Lighting enjoyed a maximum significance with a probability of 30.3%, followed by the roof U-value with 8.9%. Moreover, except for the two possible conditions, CO2 emission can be managed by controlling equipment loading rate and lighting. In Table 9, Node 11 has a higher mean of probabilities, while Node 18 has a lower mean and less effect on CO2 emission. Decision tree for CO2 emission. Obtained summary for nodes.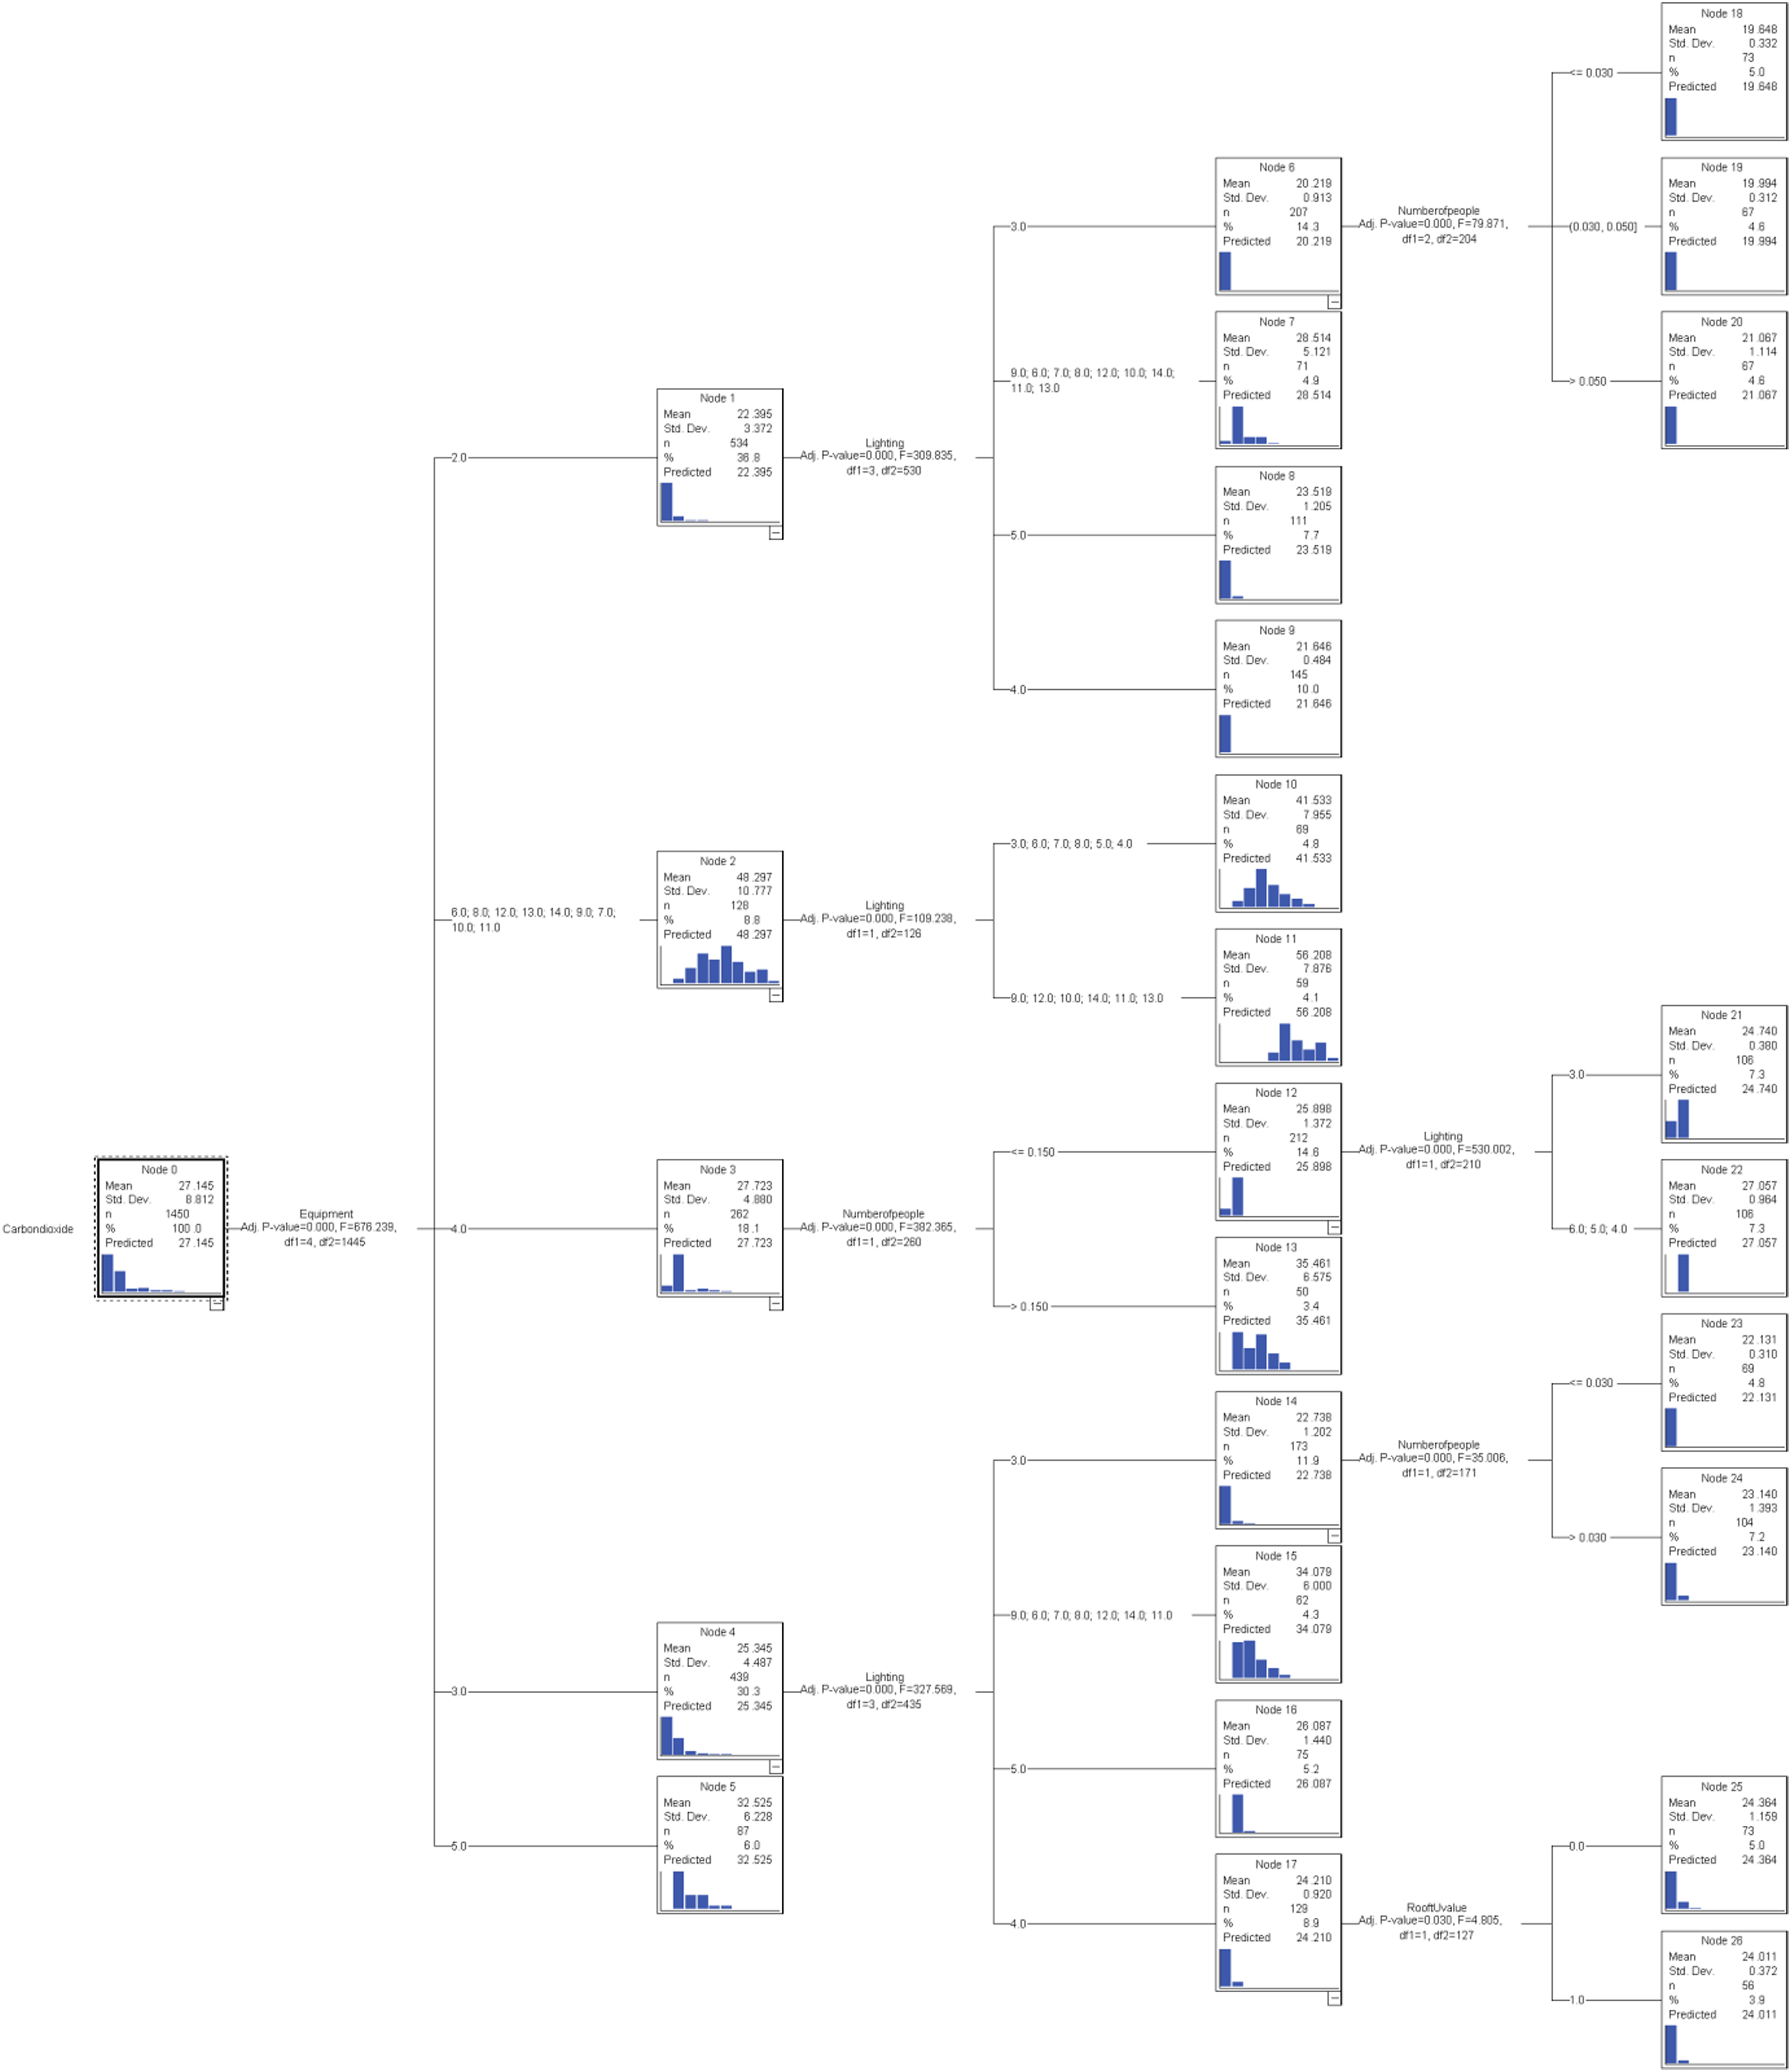
Artificial neural network
Model summary.
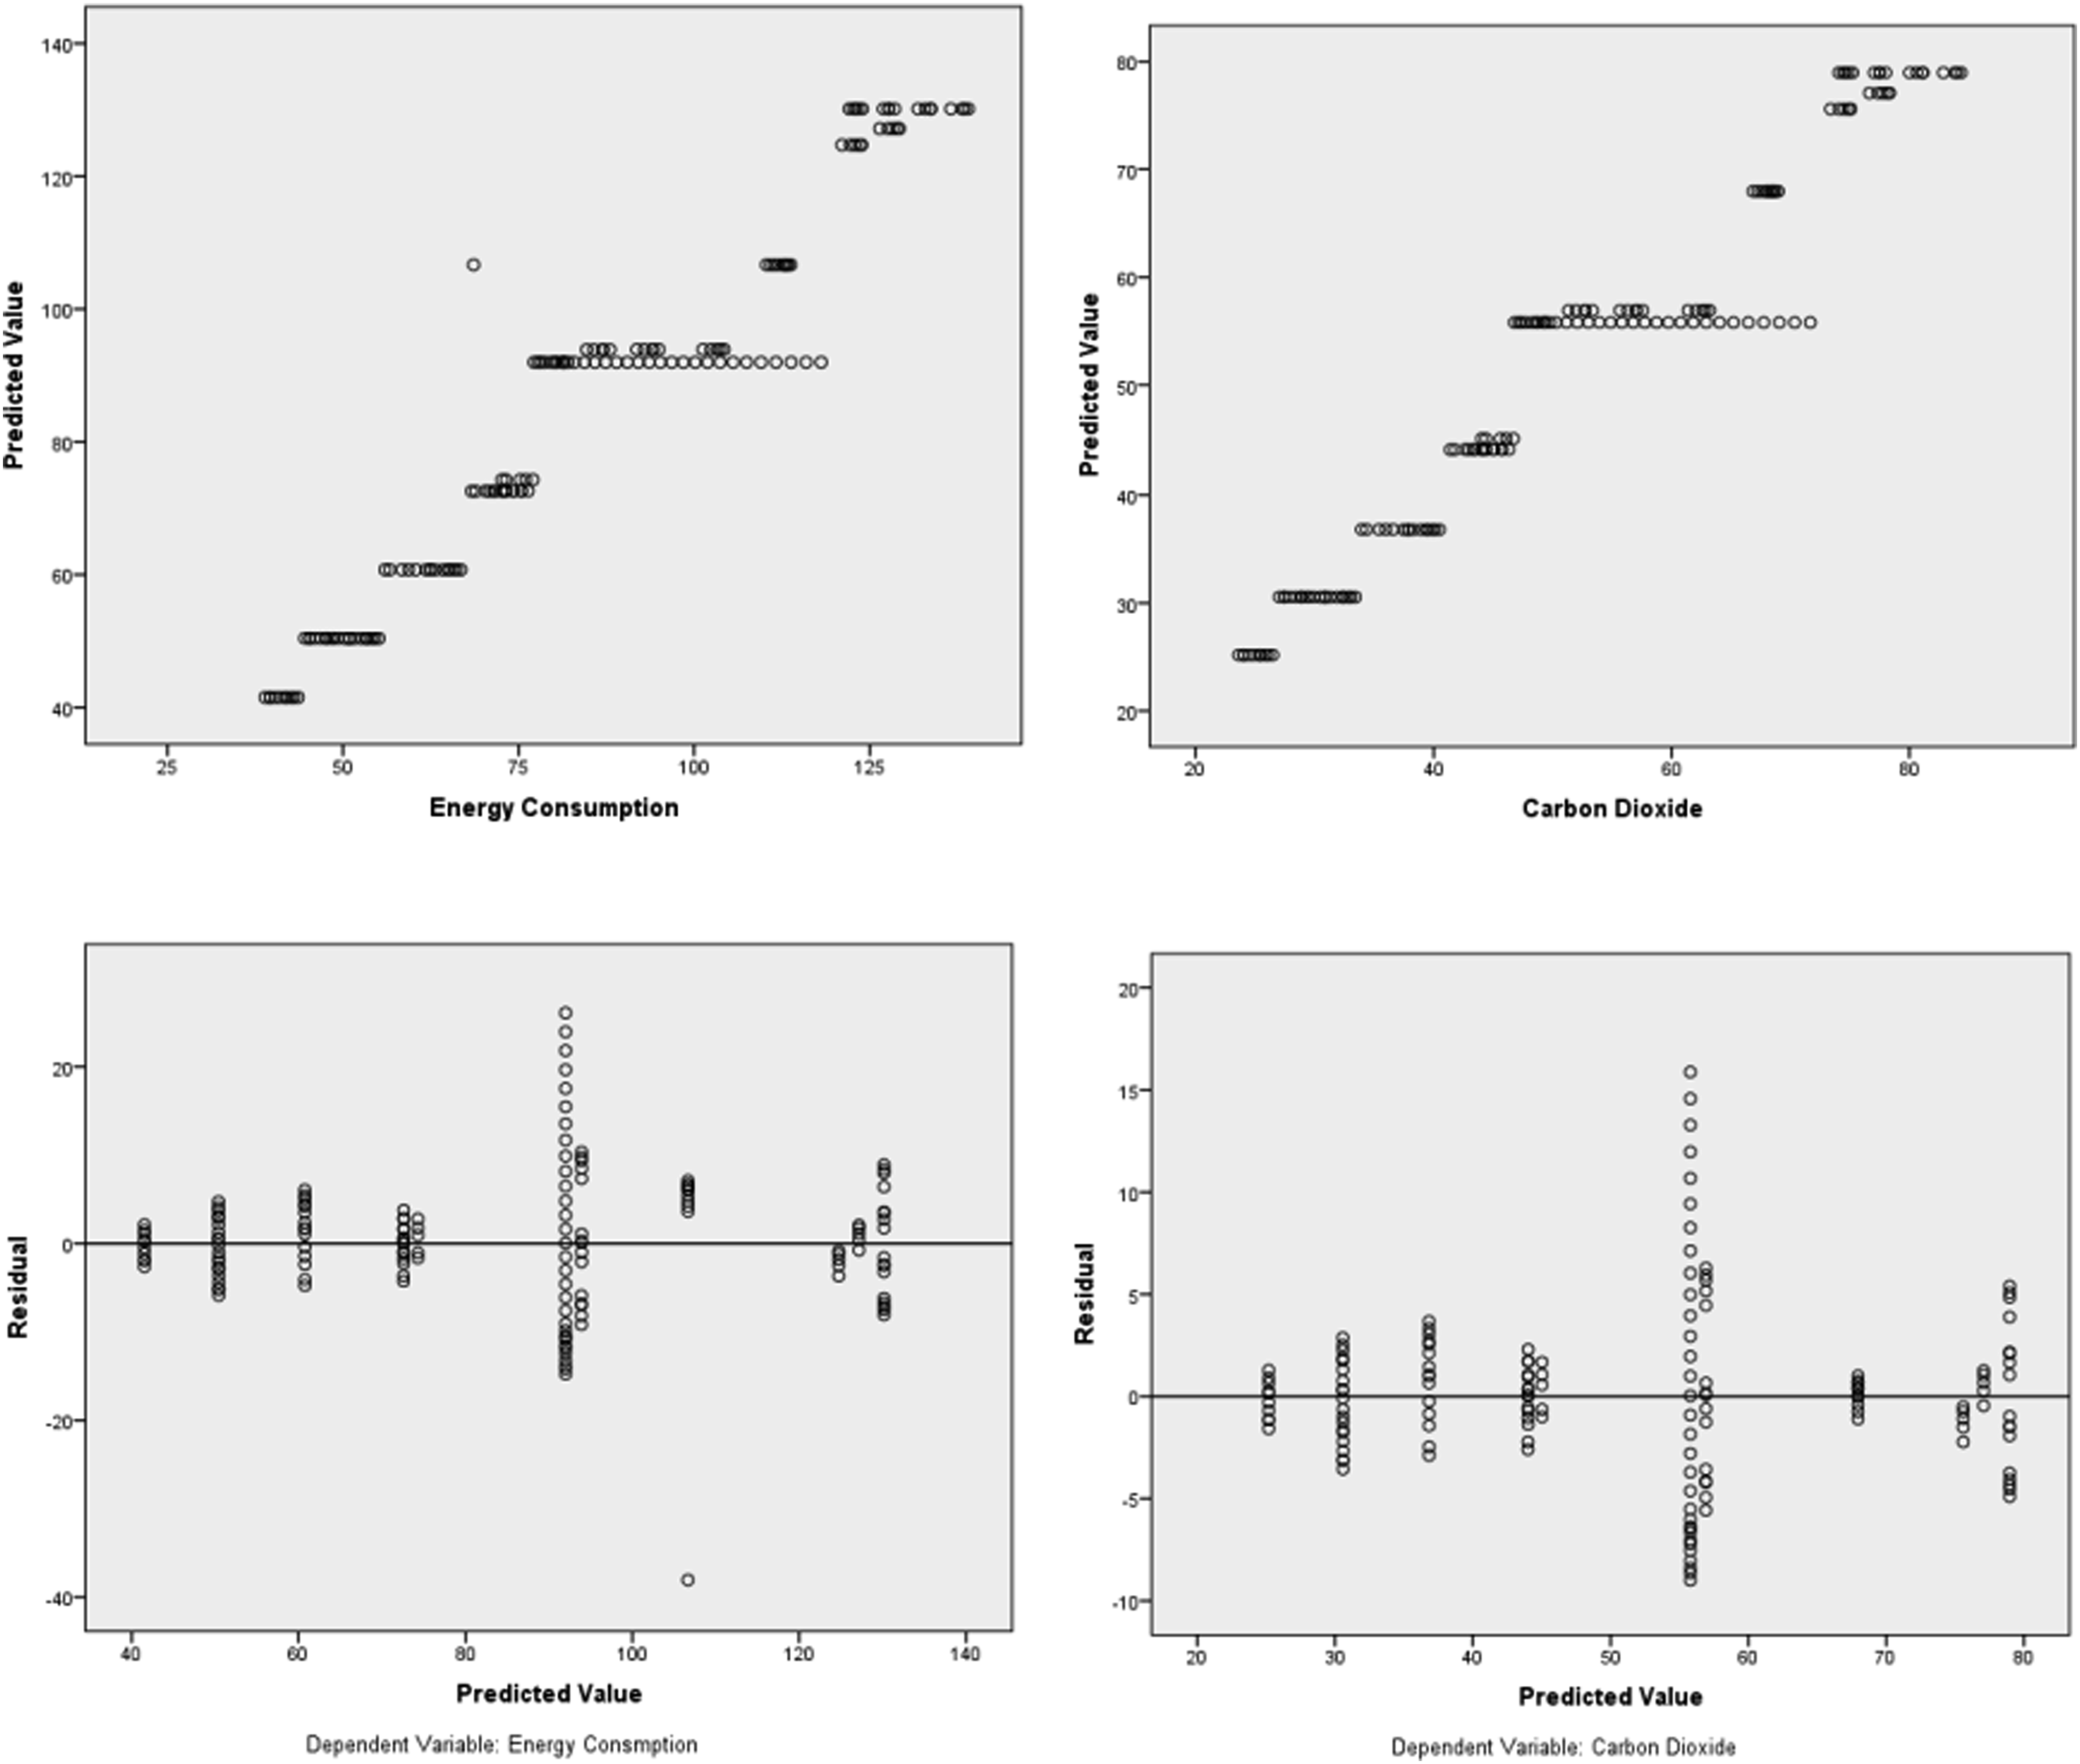
Predicted-by-observed charts of carbon dioxide and energy consumption.
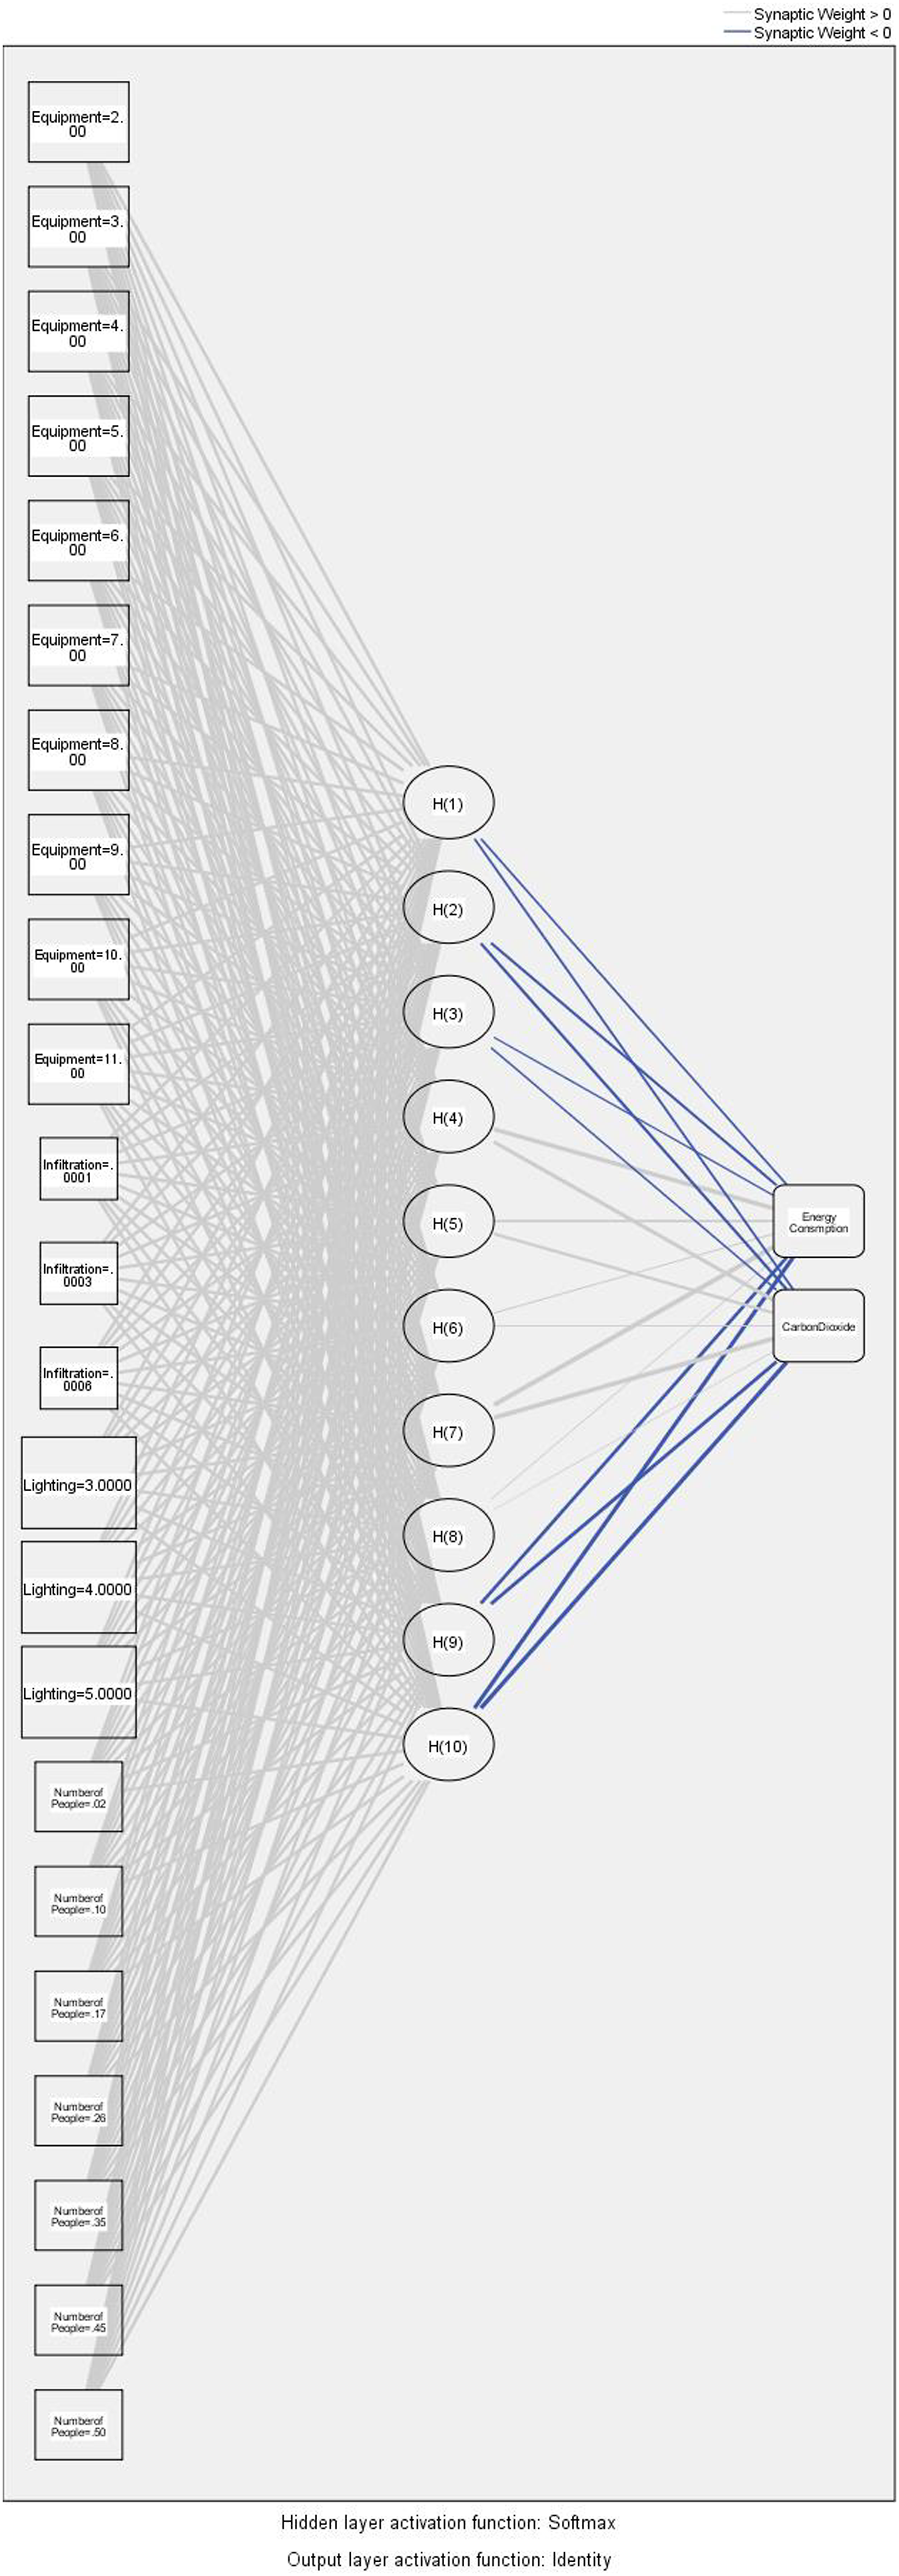
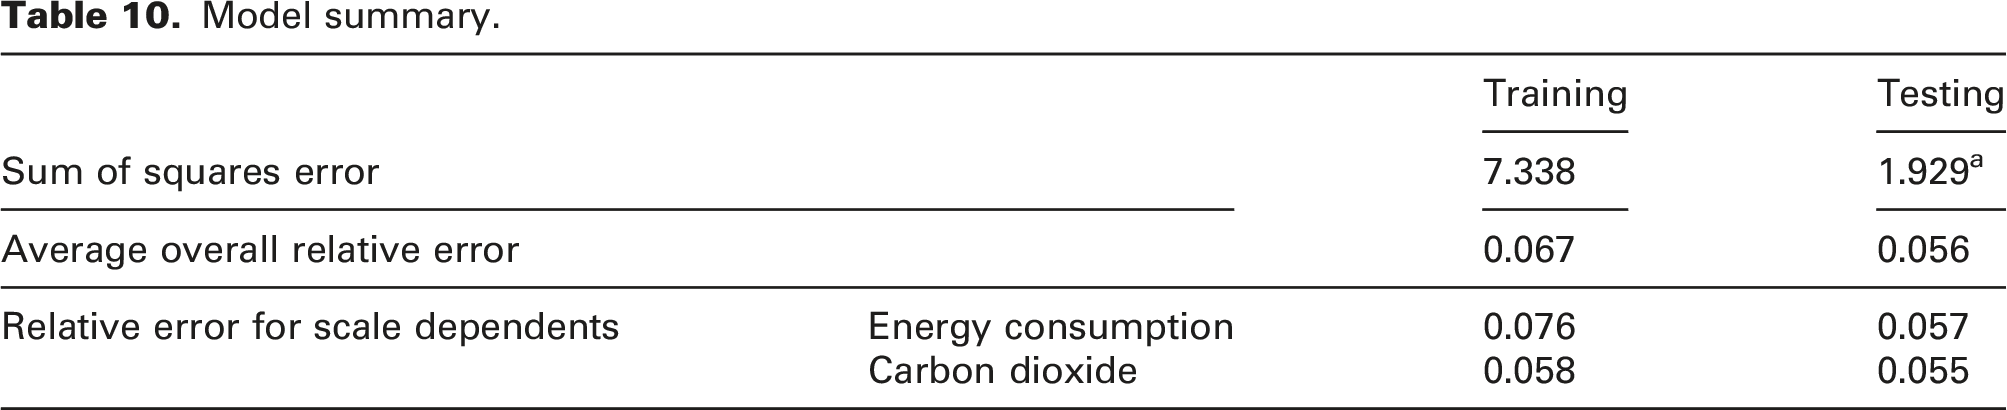
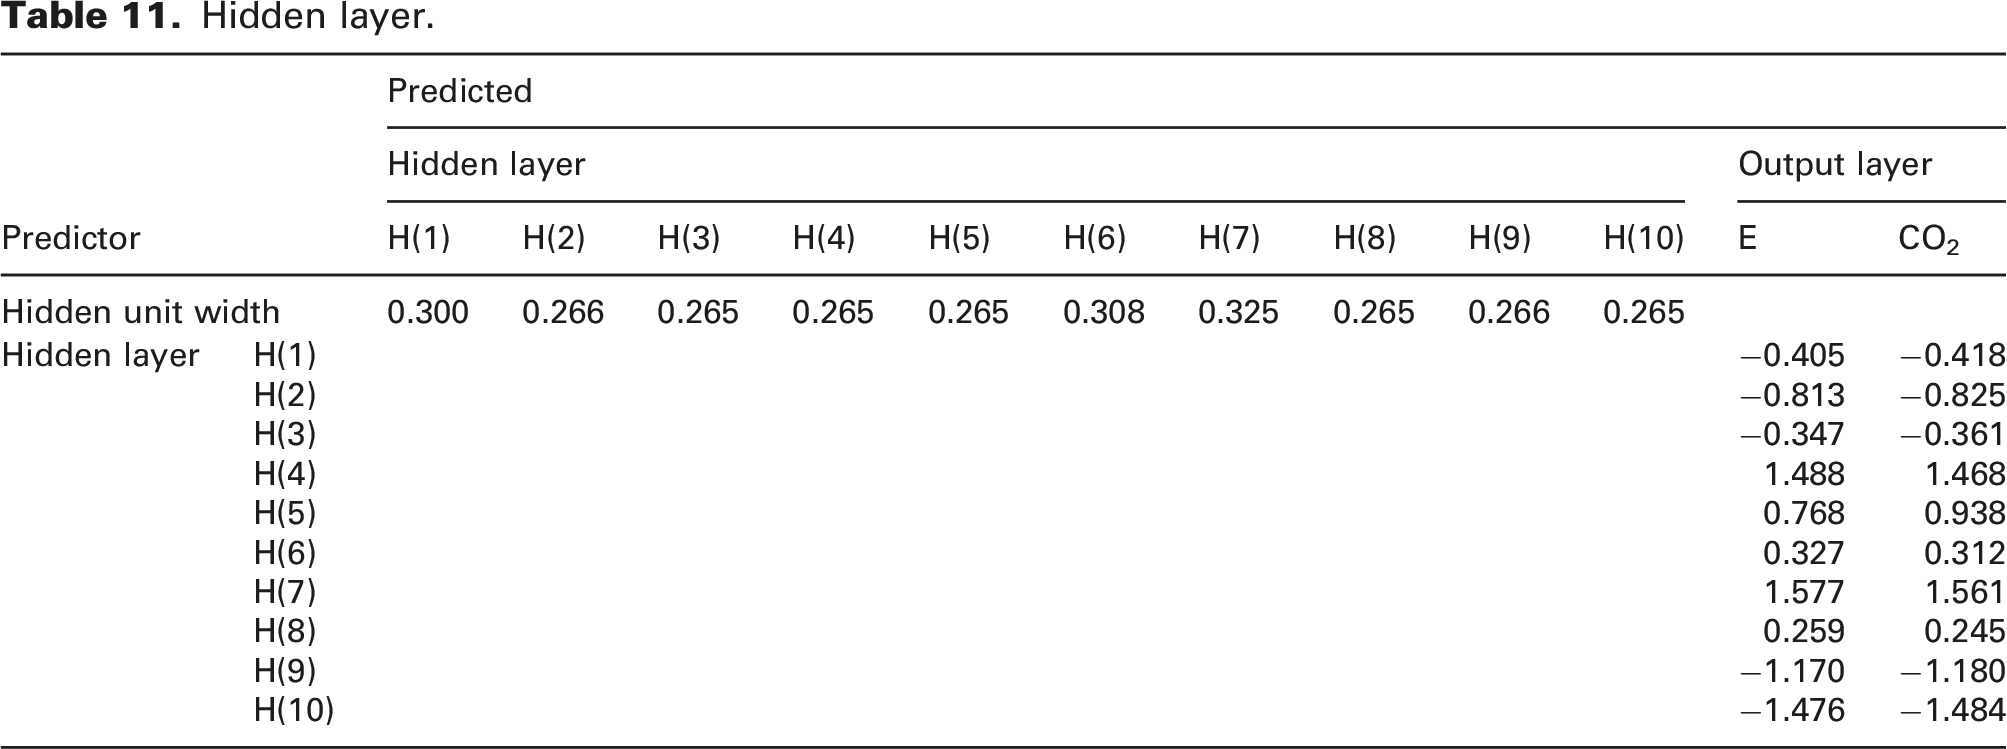
Moreover, the normalization test was conducted for energy consumption data and CO2 data. As can be seen in Figure 9, the gathered data were normal and reliable. Also, based on Table 11, the hidden layer was divided into 10 units in line with the testing data criterion. The best number of hidden units is the one that yields the smallest error in the testing data. Therefore, the hidden layer (10) was found as the best hidden layer. Test of data normalization. Hidden layer.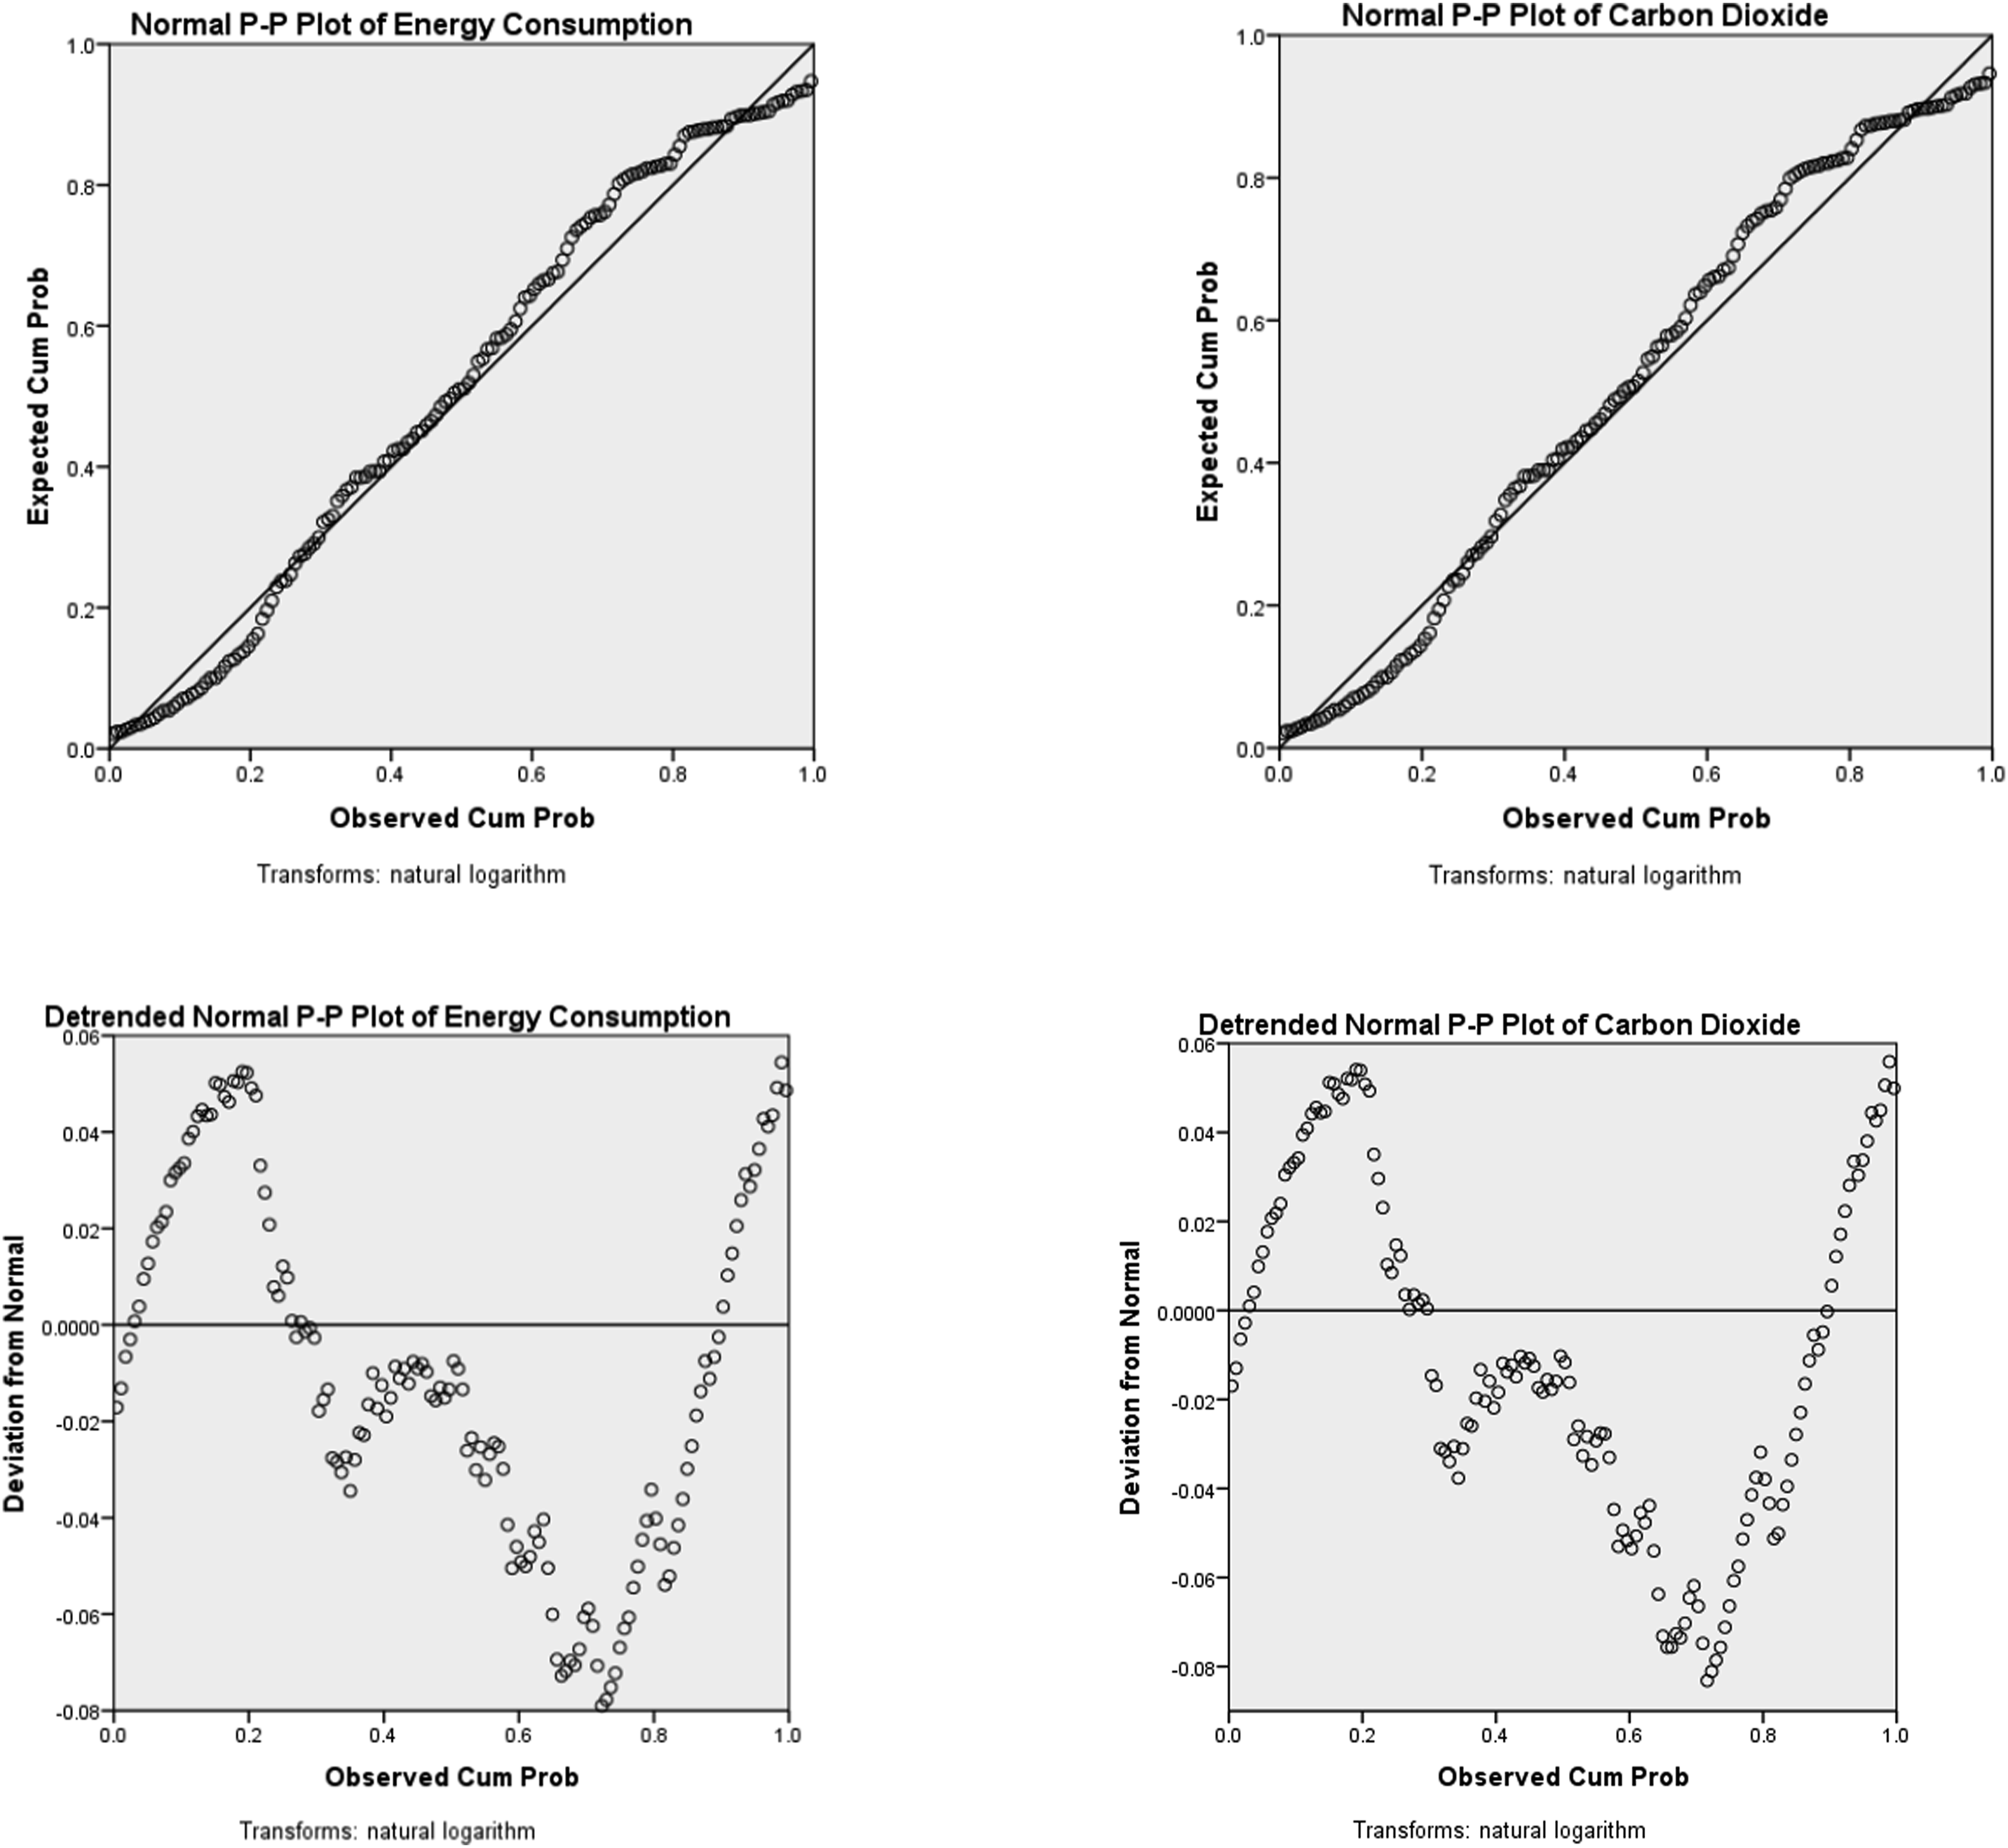
Equipment loading rate, lighting, number of people and infiltration rate were found as effective parameters in an orderly fashion in terms of their significance with regard to CO2 and its emission (Figure 10). However, the order of effective parameters for energy consumption varied in terms of lighting and equipment loading rate. Analysis of the importance of the considered parameters.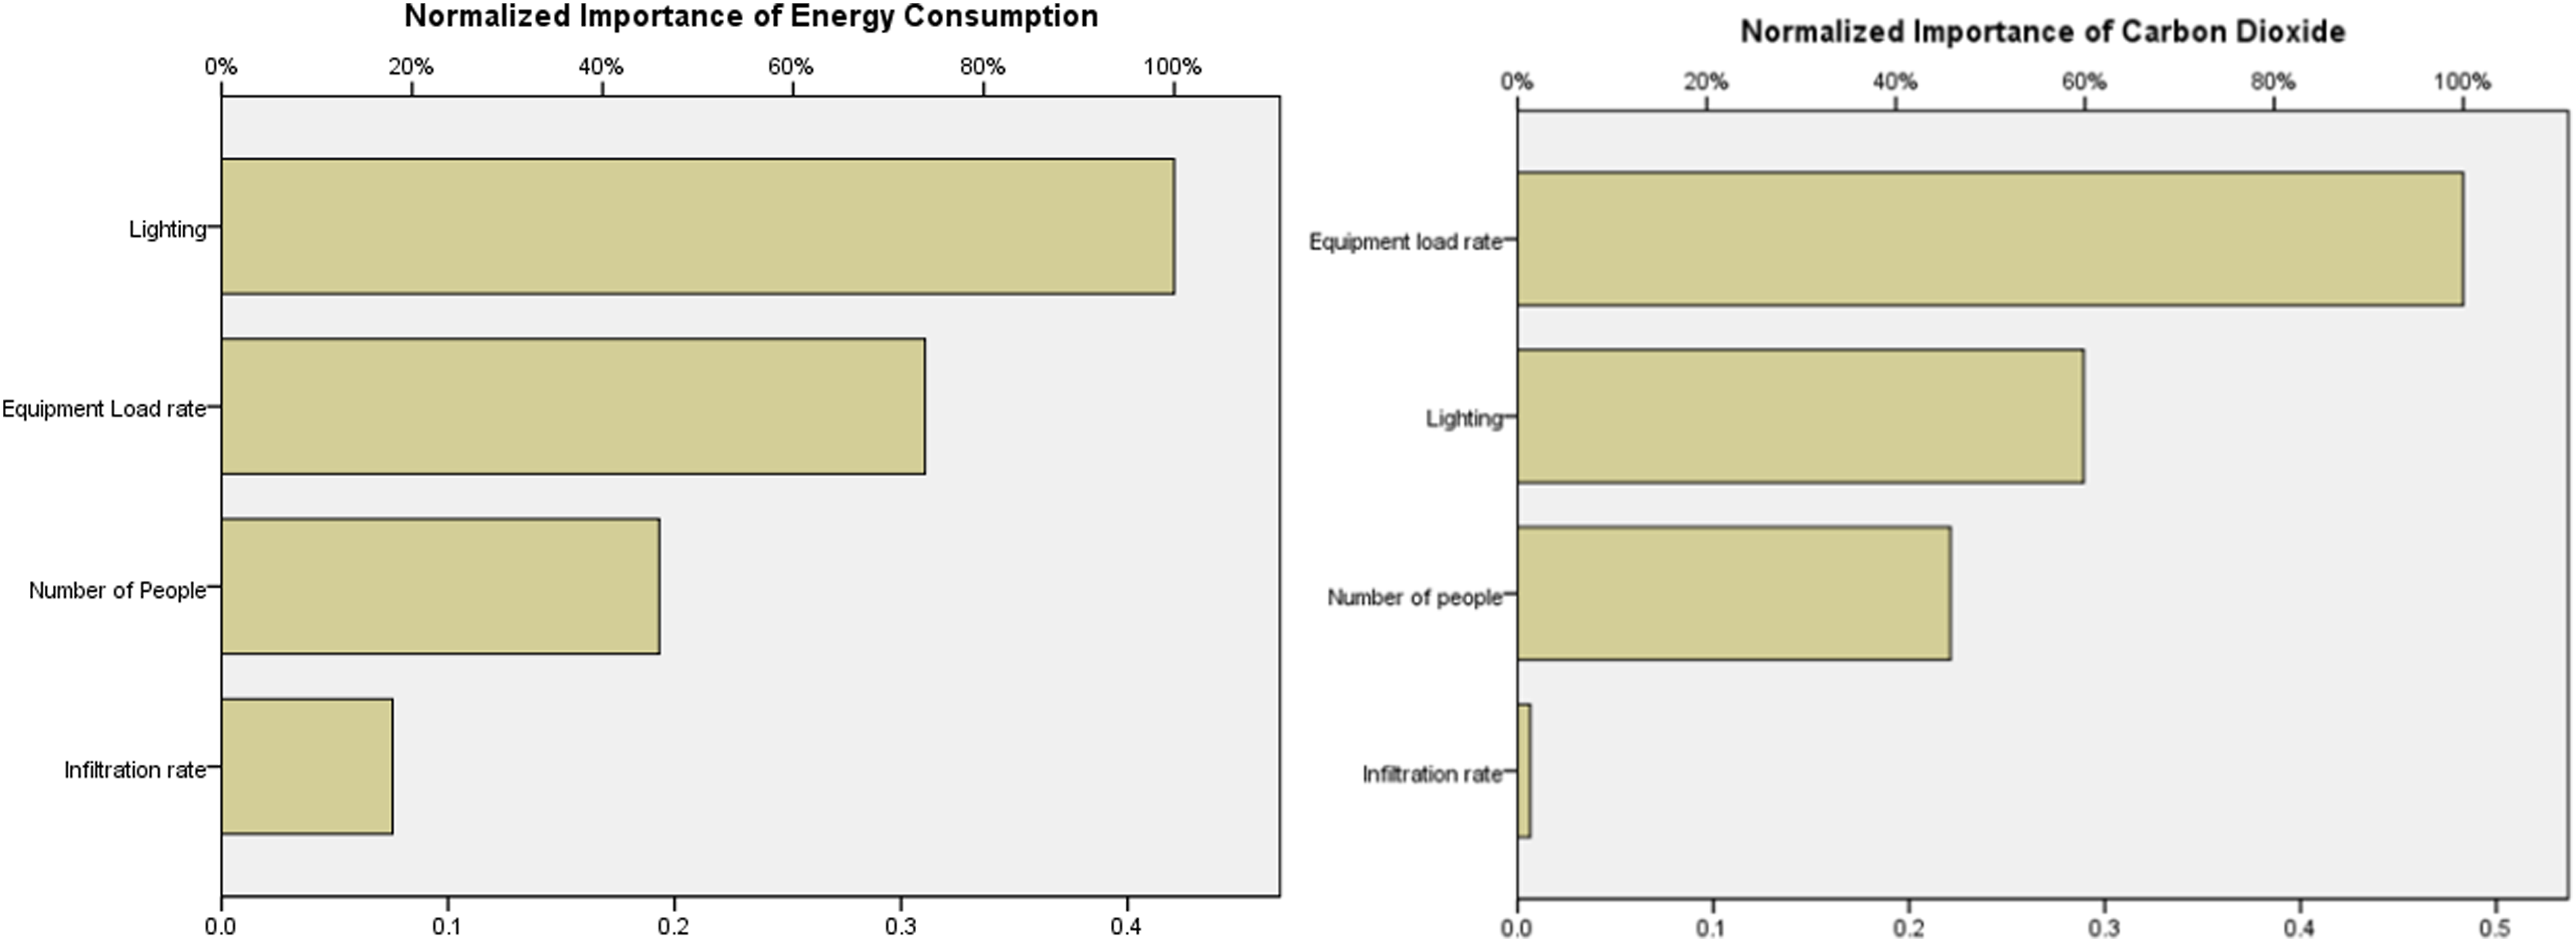
Discussion
In this paper, ANN was employed to evaluate CO2 and energy consumption data. Lighting, equipment loading rate, people density, infiltration rate, wall U-value and roof U-value were considered as input parameters. Results demonstrated good accuracy at R2 = 99%. After a comparative survey of the related conducted research, we employed the same software and input parameters as other research except for wall U-value and roof U-value. The R2 was estimated more than 95%. 8 The results of this study exhibited higher accuracy than those reported 8 and the same accuracy with others.12,29 Moreover, Huang et al. 32 revealed that electrical applicants, space heating, DHW, lighting, cooking, space cooling and air movement were effective parameters for CO2 emission. Based on our findings, the significance of equipment loading rate, lighting, number of people and infiltration rate with regard to CO2 emission was determined in an orderly fashion. The order of effective parameters for energy consumption differs from that for CO2 emission. Consequently, the pollution rate associated with the equipment in buildings was higher than other parameters. Unlike the research of Pulido-Arcas et al., 34 our findings demonstrated the same R2 for both CO2 emission and energy consumption. The relation between CO2 emission and energy consumption was another aspect of this research. As a confirmation of our findings, several other research studies have illustrated the linear relation between energy consumption and CO2 emission.35–37 However, the equation-wise findings differed from each other due to the distinct conditions and energy resource usage of each country.
Conclusion
This study aimed to determine the CO2 relation to energy consumption in Iran through deep analysis with the help of ANN and statistical methods. In order to facilitate optimizing the energy consumption and CO2 emission, PSO algorithm was employed in Grasshopper software which used EnergyPlus engine. Then, the ANN was created, trained and prepared to conduct the required analysis so as to investigate the possible relationship between CO2 emission and energy consumption. The created ANN used RBF algorithm for 1450 sampling cases and considered such parameters as lighting, equipment load rate, wall U-value, roof U-value and people density. The answers to research questions were found as CO2 emission and energy consumption have a linear relationship in Iran with the equation of y = 1.63x + 0.52 and the other answer was that effective parameters have affected CO2 emission with a linear effect. A decrease in energy consumption up to 35% and CO2 to 73.21% was achieved using PSO algorithm. The other obtained results are listed below: • Based on ANOVA test, R2 linear was 0.985 and R = 0.993, which showed high accuracy. • CO2 emissions and energy consumption have an inverse relationship with infiltration rates (−0.201) and (−0.098). • Equipment loading rate (0.842), lighting (0.803) and number of people (0.749) have a linear relationship with CO2 emissions. • Lighting (0.879), equipment loading rate (0.850) and number of people (0.464) have a linear relationship with energy consumption. • Given the decision tree result, CO2 emission can be controlled by managing equipment load rate and lighting in any buildings.
Of note, several parameters affect energy consumption and CO2 emissions. Results can vary from one region to another or in the case of using other effective parameters; this is an issue for future study. Our findings can act as proper guidelines for renovating and designing efficient buildings. Moreover, the environmental effects of construction must be evaluated and considered in future research studies, similar to what we did in our research.
Footnotes
Acknowledgements
The authors would like to express their appreciation to Omid Rashidi for his leadership on Grasshopper software.
Authors' contribution
All authors contributed equally.
Declaration of conflicting interests
The author(s) declared no potential conflicts of interest with respect to the research, authorship, and/or publication of this article.
Funding
The author(s) received no financial support for the research, authorship, and/or publication of this article.
Appendix
Hidden layer of RBF.