
Abstract
This study evaluated the effect of ventilation rate and air supply angle of an air purifier using computational fluid dynamics to determine the dispersion of airborne COVID virus exhaled by an infected person. The risk of infection for an occupant was determined based on the virus concentration in the active area and accumulated particle dose within the breathing zone by varying the ventilation parameters. The air purifier was found to provide a local dilution and would block the development of an expiratory jet for a short time to reduce transmission risk. Compared to the case without an air purifier, the maximum reductions were 94.27% in the accumulated dose and 53.2% in the particle count concentration. In the breathing area, the larger air supply angle (90° > 60° > 30°) is better when the ventilation rate was 27.0 m3/h and 40.5 m3/h. Otherwise, 60° air supply angle is preferable where the ventilation rate was 54.0 m3/h. Assessing the results with the grey relational analysis revealed that the relational degree for particle count concentration was greater by varying the ventilation rate than by varying the air supply angle. However, the relational degree according to the accumulated dose was greater by varying the air supply angle than by increasing the ventilation rate. These findings may provide an important control strategy to effectively mitigate the risk of infection in a confined room by using an air purifier.
Keywords
Introduction
In recent years, respiratory diseases such as SARS, H1N1 and COVID-19 have greatly threatened human health, productivity and life.1,2 The influenza A (H1N1) subtype caused 17,000 deaths worldwide in 2009–2010. 3 The 2019 coronavirus disease (COVID-19) has caused 504,807,758 infected cases in 228 countries, of which 6,223,267 million have died as recorded on 18 April 2022, 4 and there is still a large number of new cases every day. Research has found that in indoor environments with poor ventilation, airborne particles exhaled when an infected person coughs, talks and breathes, 5 may accumulate in the air over time and could cause infection to people nearby. 6 Mixtures of accumulated particles and microorganisms in the air form aerosols that are transported by airflows and could cause infection when inhaled.7–9 Oliveira et al. 10 found that if two people talk normally in a poorly ventilated room, then particles could be dispersed by indoor air activity from the infected person to remote areas of the room within a few seconds, with an infection risk greater than that of coughing. Alsved et al. 11 also found that when a person talks normally, they exhale more particles than when they are breathing, which indicates the risk of infection is higher in talking than when breathing. Additionally, the long-distance transmission risk depends on the background concentration of the airborne particle, while at a short distance, both relatively large droplets and relatively small droplet nuclei may become transmission medium, resulting in a high risk of infection.12–14
To reduce the short-distance transmission risk, Heating, Ventilation and Air-Conditioning (HVAC) system can be important control against the spread of the disease. 15 Personalized ventilation (PV) was reported to provide clean air for occupants and reduce the risk of infection. 16 Bolashikov and Melikov 17 reviewed different ventilation strategies used for the control of airborne disease and suggested that PV may provide a better protection than total volume room air replacement. In addition to the protective effect of PV, it may facilitate the transport of exhaled particles, 18 and its efficiency depends to a large extent on the relative orientation between the design and occupants.19,20 In general, ventilation is an effective method to reduce the risk of infection. In this regard, the published guidelines documented by ASHRAE, REHVA and WHO also point out that better ventilation is a major way to control the spread of airborne disease. 21 Similarly, Thatiparti et al. 22 found that increasing the ventilation to provide a sufficient level of dilution could prevent the dispersion of viral contamination in confined spaces. The target of ventilation is to replace polluted air with clean air. 23 However, present ventilation systems designed for normal operating conditions may not have the capacity to significantly increase ventilation rates to meet the dilution requirements during a pandemic, 24 and the minimum ventilation rate to control respiratory diseases is unclear. 25 Additionally, in most public buildings, such as offices, schools and public transportation, the ventilation rate is usually not sufficient for economic purposes.26,27 More importantly, ventilation via dilution cannot effectively control the short-distance transmission dominated by airborne particles exhaled by infected humans. 28
Air purifiers, as an active air purification technology, are used to provide clean air and could effectively reduce indoor infection risk in confined spaces.29,30 Some studies have shown that air purifiers can remove viral particles from the airflow in indoor environments.31,32 In the COVID-19 pandemic, the published guidelines documented by ASHRAE recommend the use of high-efficiency filter (HEPA) air purifiers. 33 REHVA considers air purifiers that achieve high-efficiency filter levels to be effective. 34 The guidelines for office buildings to deal with emergency operational measures for the new coronavirus also advise that air purifiers should be put into operation during work hours. 35 However, there are various types of air purifiers that can impact the distribution of indoor pollutants due to their different ventilation parameters, such as ventilation rates and air supply angles, 36 and might increase the transmission risk. Dbouk et al. 37 found that the air inlet of an air purifier induces airflow circulation, leading to an increase in the spread of airborne particles in the indoor environment. Although some studies have reported associations between the use of air purifiers and reducing the risk of infection, these are focused more on the effects of air purifiers in confined spaces for longer periods of time such as hours 32 and days. 36 Indeed, the application of air purifiers to reduce the risk of short-time infection is very important due to the infection that could occur within a few seconds. Thus, an understanding of the role of air purifiers is necessary to protect occupants against the risk of airborne transmission in a short time.
Considering the above, we evaluated the effect of ventilation parameters of air purifiers on the dispersion of airborne particles exhaled by infected persons within a few seconds, and we considered two key factors, namely, ventilation rate and air supply angle. In these cases, the particle accumulated dose in the breathing area and particle count concentration in the activity area were used to investigate and assess the risk of infection when people were indoors. The benefits, ventilation design and possible negative effects of using air purifiers were explored. Meanwhile, the relational grades of ventilation rate and air supply angle on infection risk were determined using grey relational analysis.
Model and computational method
Case description and geometric model
A confined room with an air purifier was modelled in this study. The overall computational dimensions, length (L), width (W) and height (H) of the confined room were 4.0 m (L) × 3.8 m (W) × 3.0 m (H). There was a table measuring 0.6 m (L) × 0.3 m (W) × 0.5 m (H) in the confined room. The dimensions of the air purifier for removing particles were 0.2 m (L) × 0.2 m (W) × 0.25 m (H). The HEPA (high-efficiency particulate air) filter was installed inside the air purifier to ensure a clean air supply (removal efficiency of PM1.0 is 99.99%), and the air purifier can be adjusted for different air supply rates (27m3/h, 40.5 m3/h and 54.0 m3/h) and different air supply angles. Two occupants facing each other were placed in the confined room (Figure 1). The infected human with a contagious virus is shown in red, and the exposed human is shown in grey in Figure 1. The distance between their mouths was approximately 1.1 m. (a) Geometric model of a confined room with an air purifier. (b) The air supply angle of the air purifier.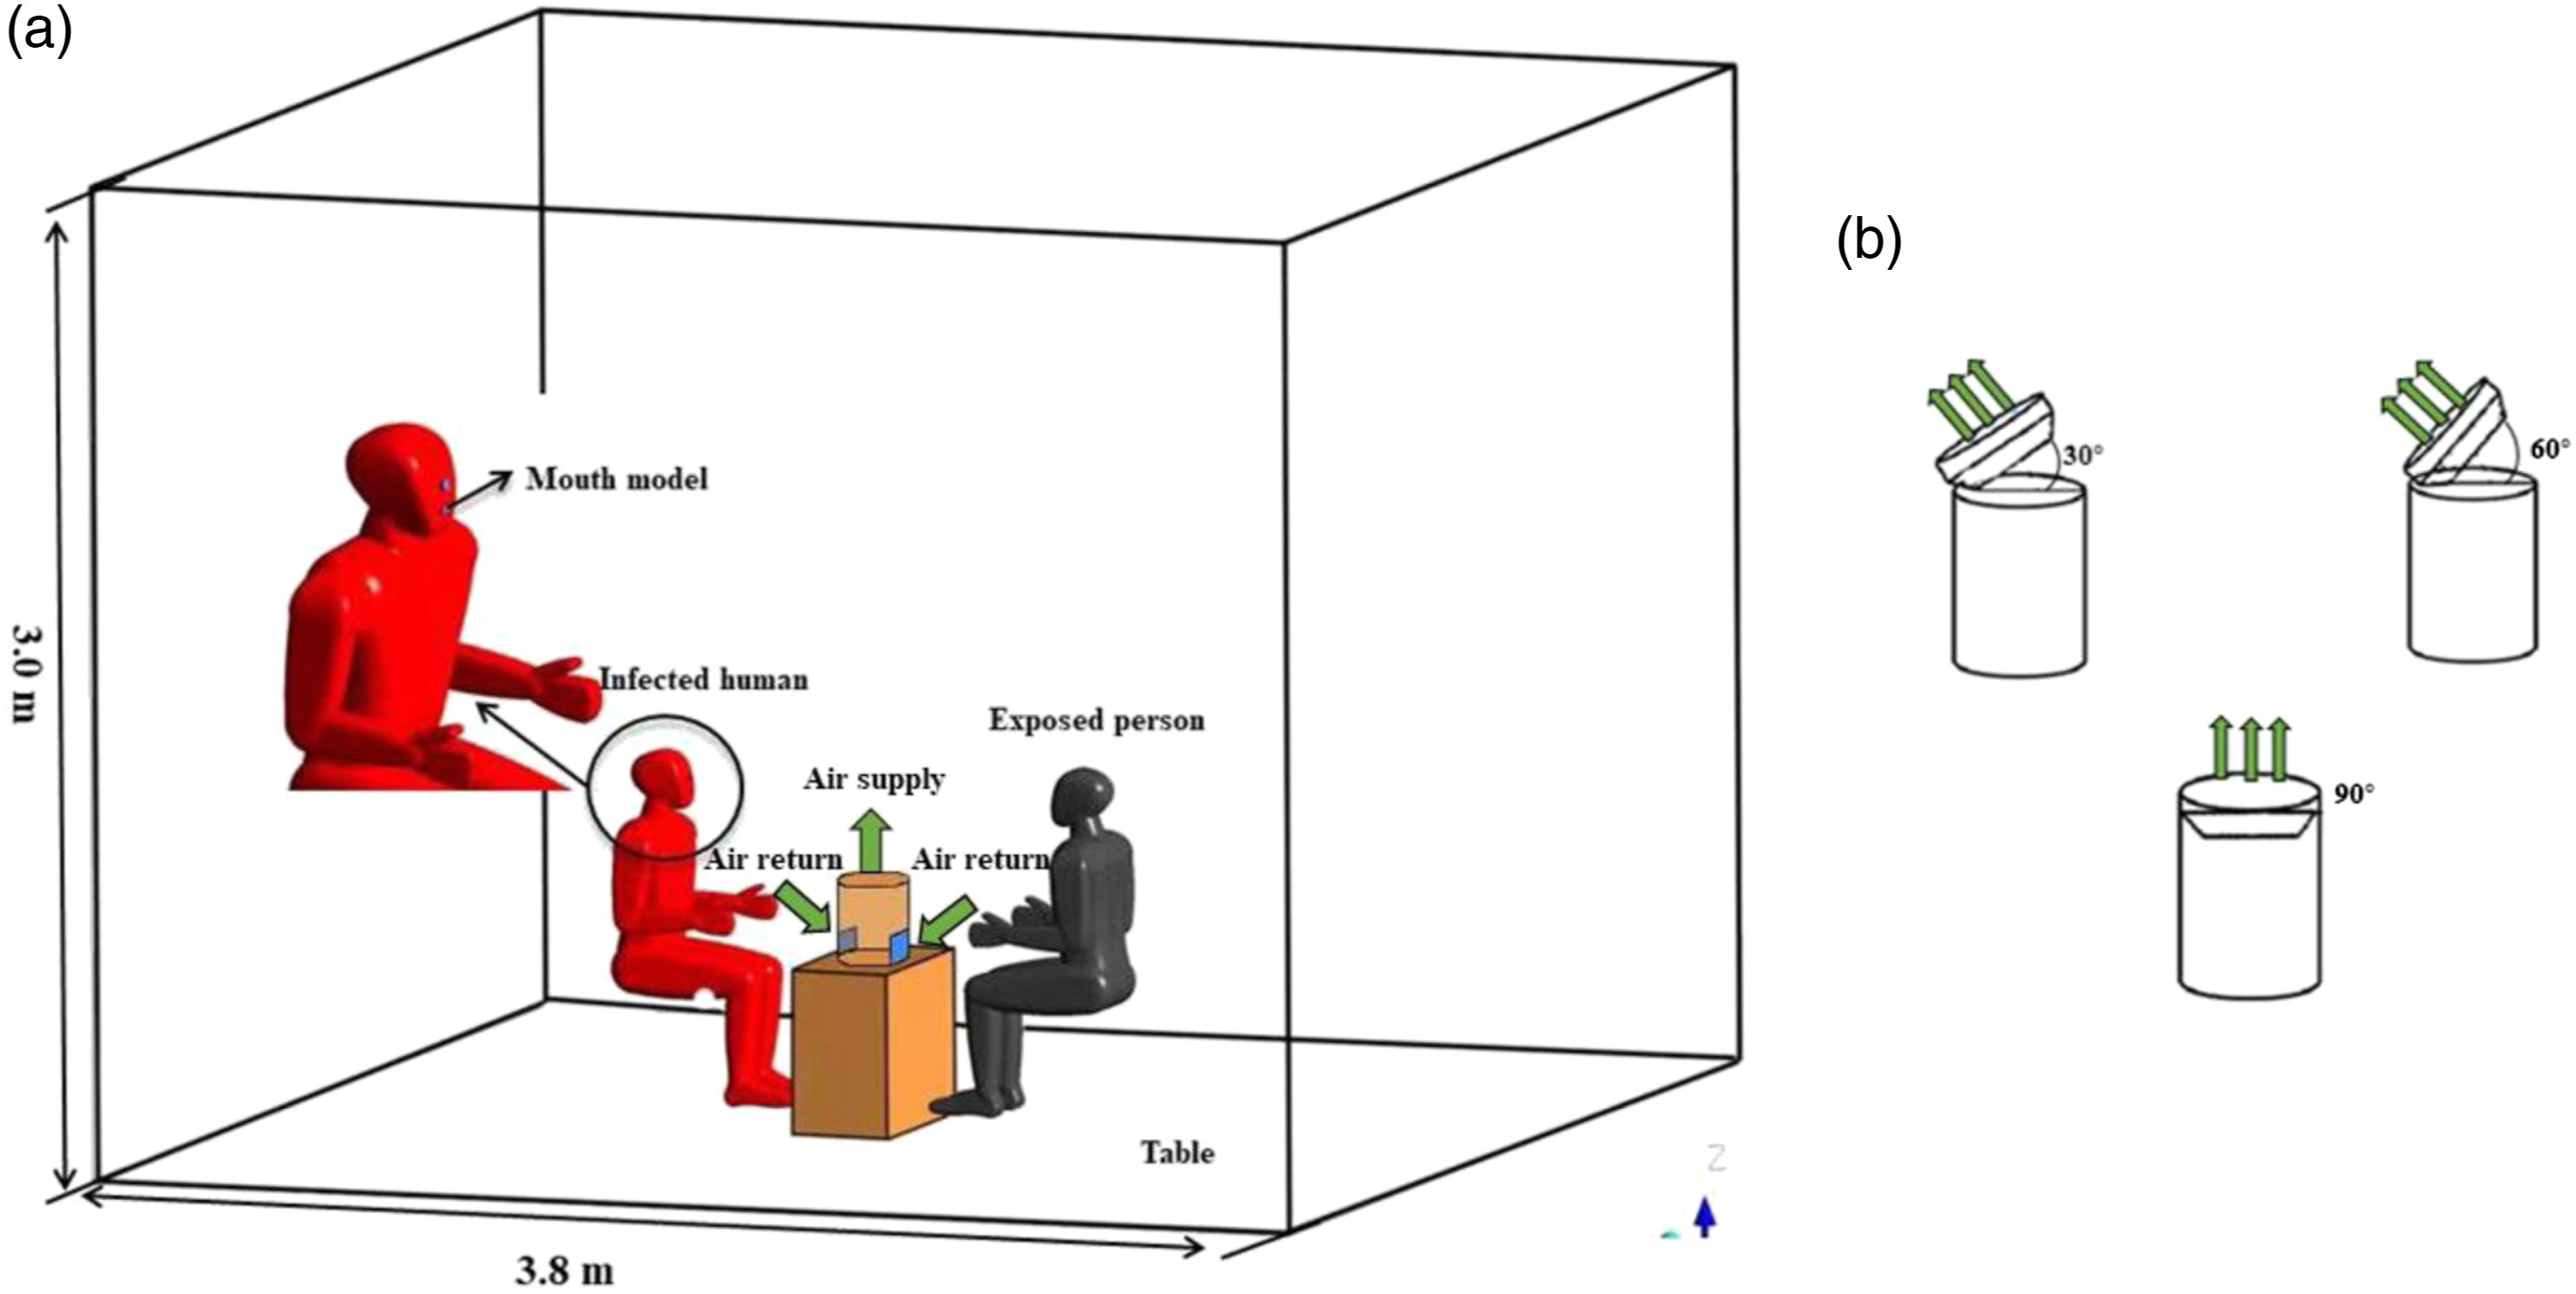
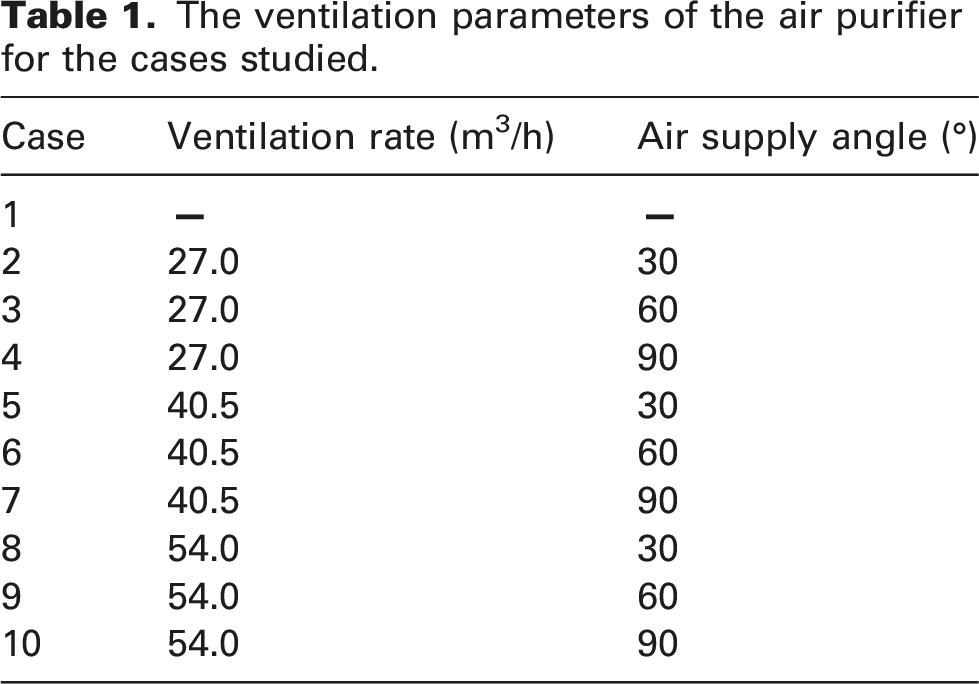
The ventilation parameters of the air purifier for the cases studied.
Numerical procedure
Computational fluid dynamics (CFD) modelling was conducted with ANSYS Fluent version 2021R (ANSYS, Inc) in the present study. The standard
The discrete particle model (DPM) of the Lagrangian method was used to simulate particle dispersion in the confined room. According to a previous study,
43
due to the high evaporation rate of small droplets, the evaporation effect of small droplets considered in this study could be neglected. The research found that the pressure gradient force, virtual mass force and basset force could be neglected due to being two orders of magnitude less than the drag force.
44
A previous investigation found that the thermophoretic force and Saffman force play important roles in the turbulent boundary layer.
45
Therefore, gravity, drag, thermophoresis and Saffman forces were considered in this study to simplify the orbital particle model. The motion of particles was governed by Newton’s second law, which was determined by equation (1):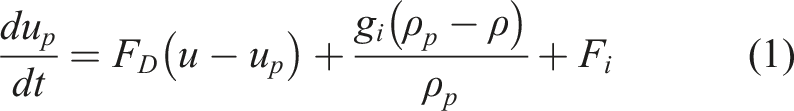
The gravity F1 of the particle was determined by equation (2):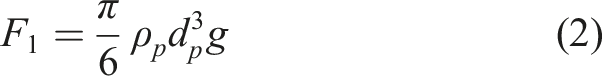
The drag force F2 of the particle was determined by equation (3):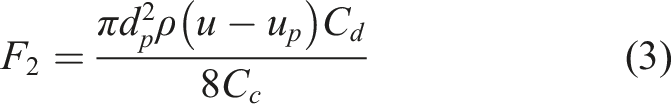
When calculating the drag force of fine particles, especially for submicron particles. The actual resistance of particulate matter is less than the value calculated by Stokes formula due to the phenomenon of molecular sliding, and it must be modified. The correction of the Canning correction coefficient can be obtained by equations (4) and (5):

The thermophoretic force F3 of the particle was determined by equation (6):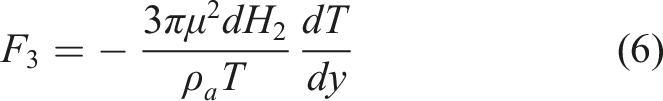
The Saffman force F4 of the particle was determined by equation (7):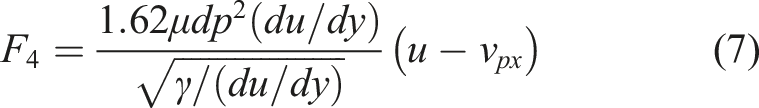
In this study, the discrete random walk (DRW) model was used to calculate the turbulent dispersion of the particles, 46 which was one of the main mechanisms of particle dispersion due to its association with transient flow fluctuations. In addition, a particle was considered to be trapped once it reached the wall. When the dispersion of aerosol particles is in contact with the boundary of physical model (such as wall surface, air supply vent and exhaust vent), Fluent software applies discrete boundary conditions to determine the conditions of the particle motion, which are respectively set as reflect, trap, interior and escape. Reflect represents the bounce of particles when they collided with the surface of the physical model. Escape represents the particles leaving the calculation domain when they collided with the surface of the physical model. Trap represents the particles colliding with the surface of the physical model. When the particles stopped moving, Fluent would terminate the particle trajectory calculation.
Boundary conditions and grid independence
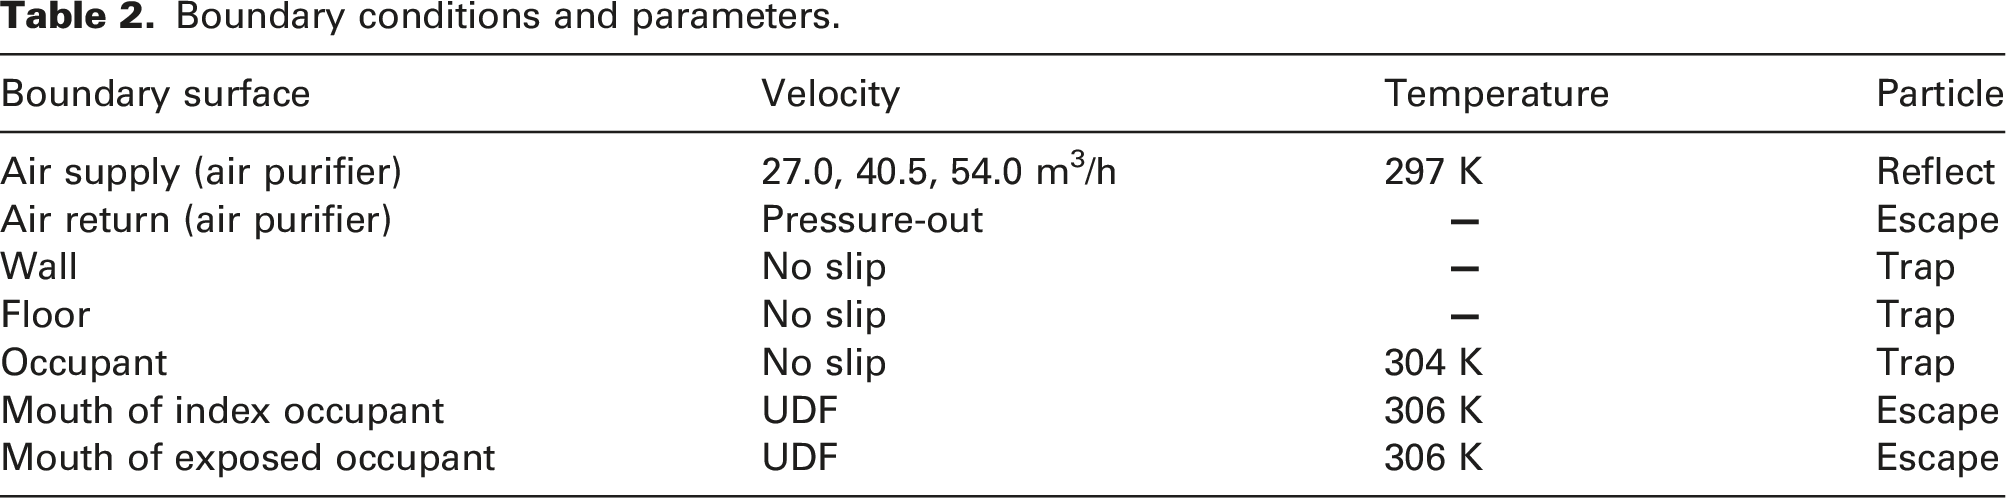
In this modelling, all the walls of the room were set as adiabatic, and the occupants were set as the solid boundary condition with a constant surface temperature of 304 K and an air exhalation temperature of 306 K.
47
For the air purifier, the specific velocities and temperatures were adopted for inlet boundary conditions, and the pressure-out was used for the outlet of the air purifier. The breathing flow rate from the mouth of the exposed person was set according to the measured data from Gao et al.
48
through a user-defined function (UDF), which is shown in Figure 2(a). From the Gupta et al. study,
49
the flow rate was set as a constant of 0.015 m3/s for talking, as shown in Figure 2(b). The boundary conditions and parameters used in the CFD model are shown in Table 2. Boundary conditions for breathing and talking: (a) Flow generated over time for the exposed person. (b) Flow generated over time for the index person. Boundary conditions and parameters.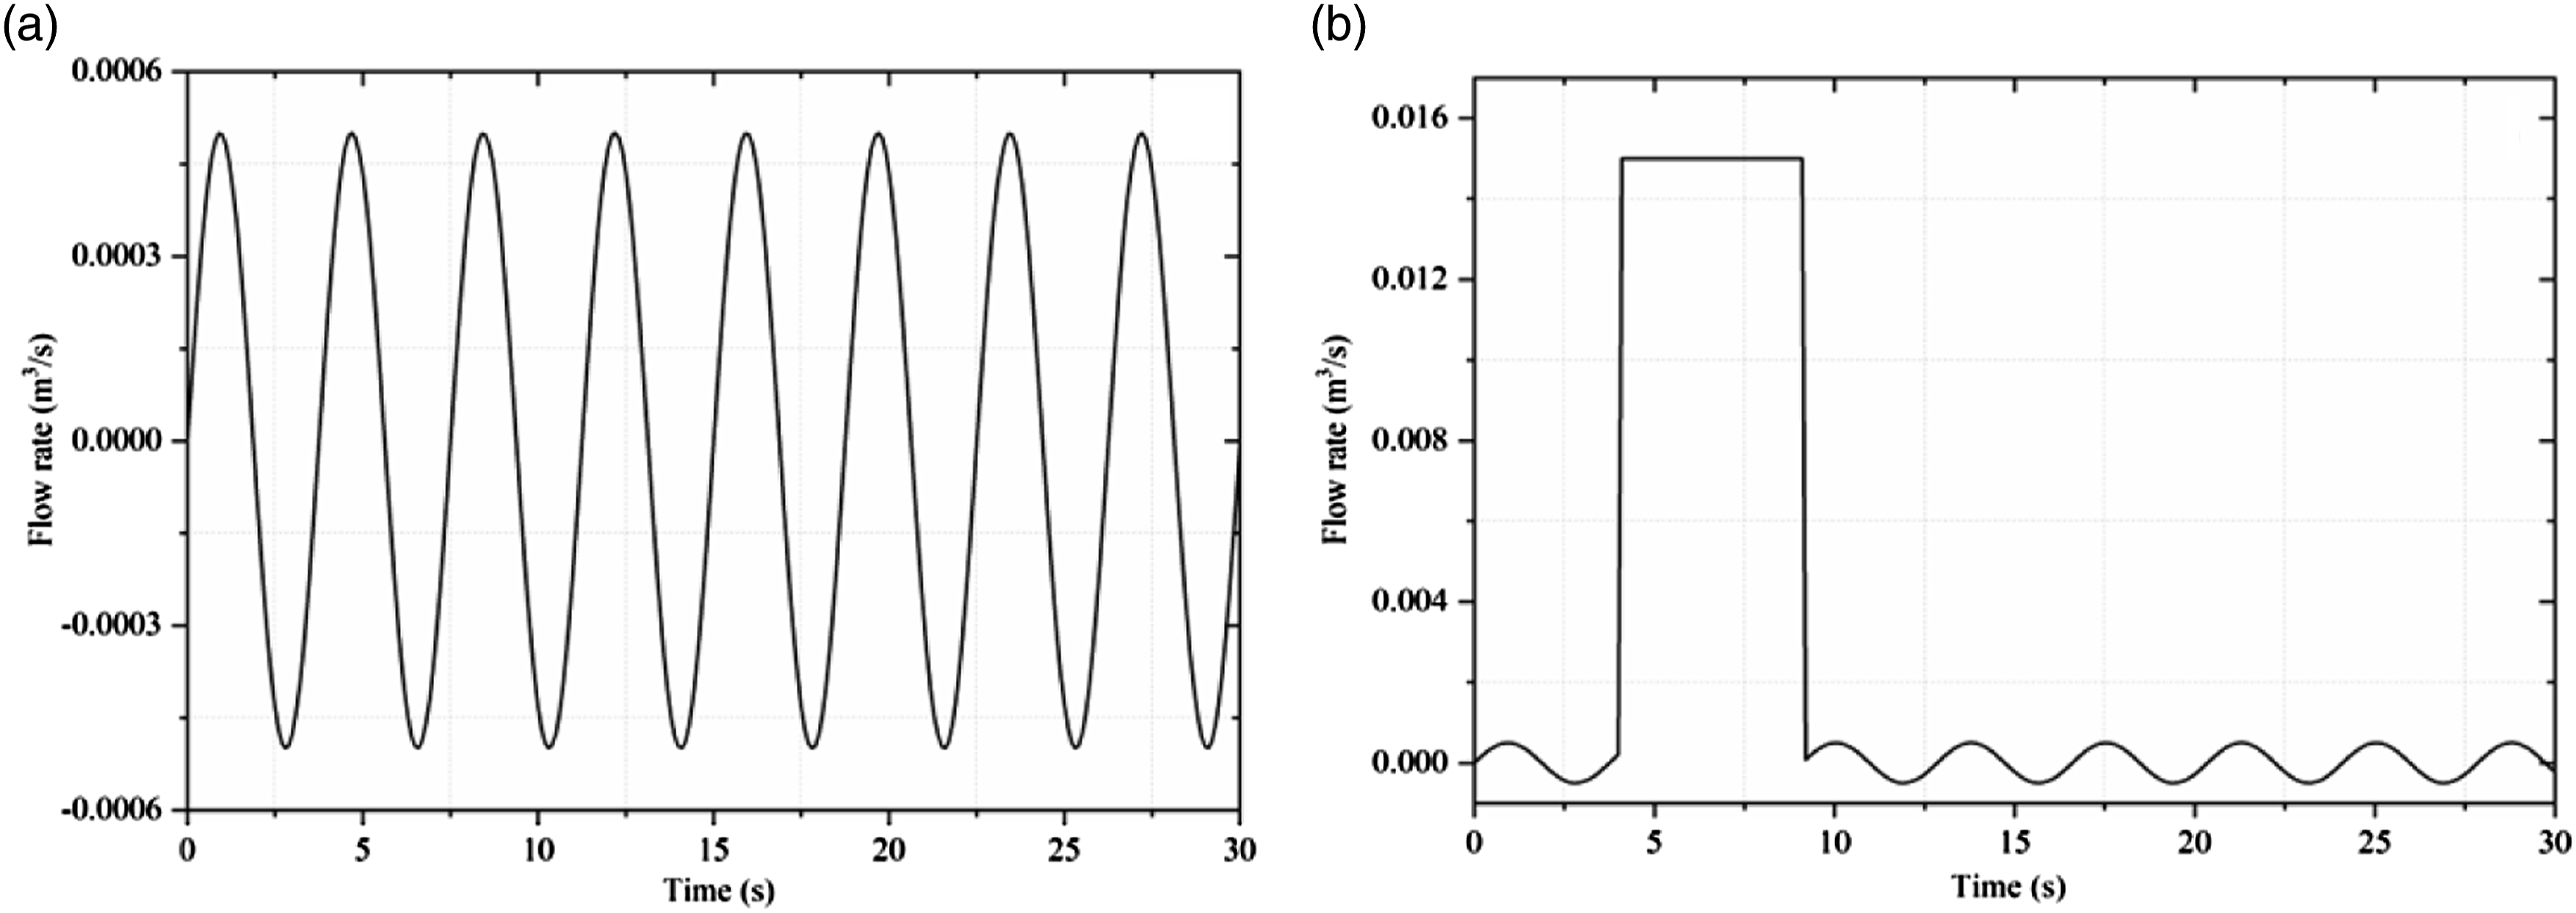
In this study, particles were exhaled by an index person through talking. The average particle size exhaled by an index person was given as 16.0
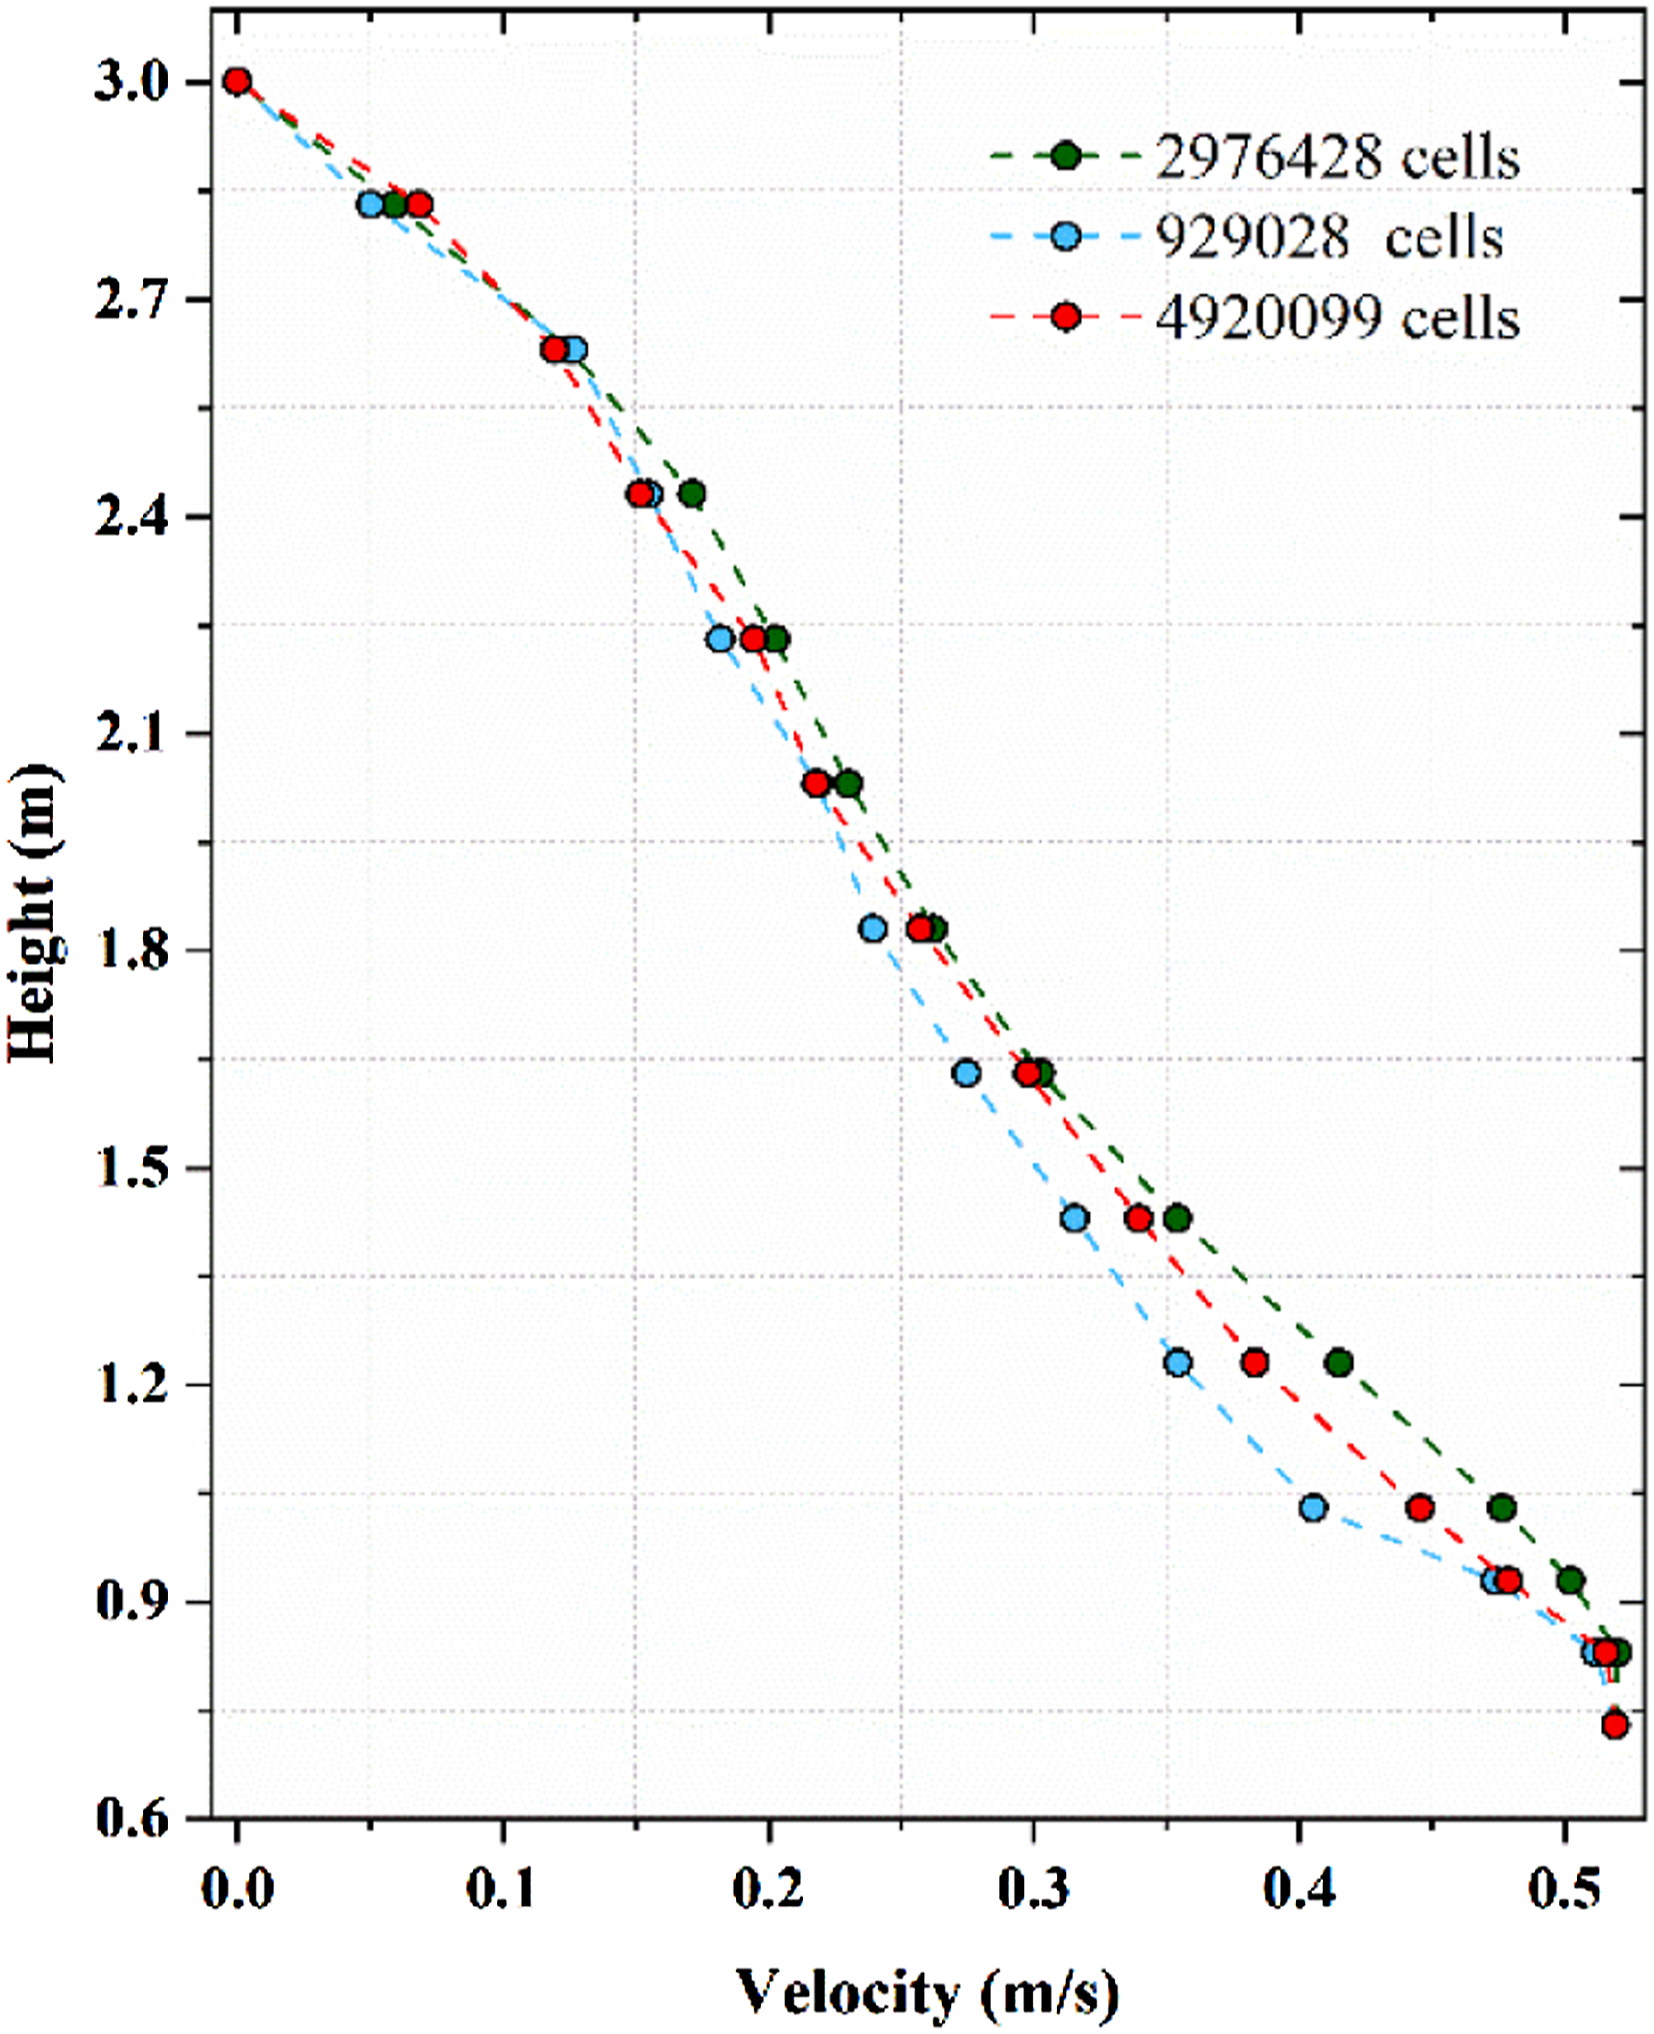
For the grid-independent tests, a CFD model with 929,028 (coarse), 2,976,428 (moderate) and 4,920,099 (fine) poly-hexacore grids was selected for comparison. To achieve high resolution, grid refinement was performed around the air supply inlet and the heat source due to the high velocity and temperature gradients (see Figure 3). The velocity distributions at lines of X = 0.5 m and y = 3 m of the three grids were compared under identical conditions. The results are displayed in Figure 4, show sufficient accuracy was ensured when the number of grids was 2,976,428. Mesh of the computational domain (X = 0 m). Comparison of the velocity distributions for the three grids (X = 0.5 m, y = 3 m).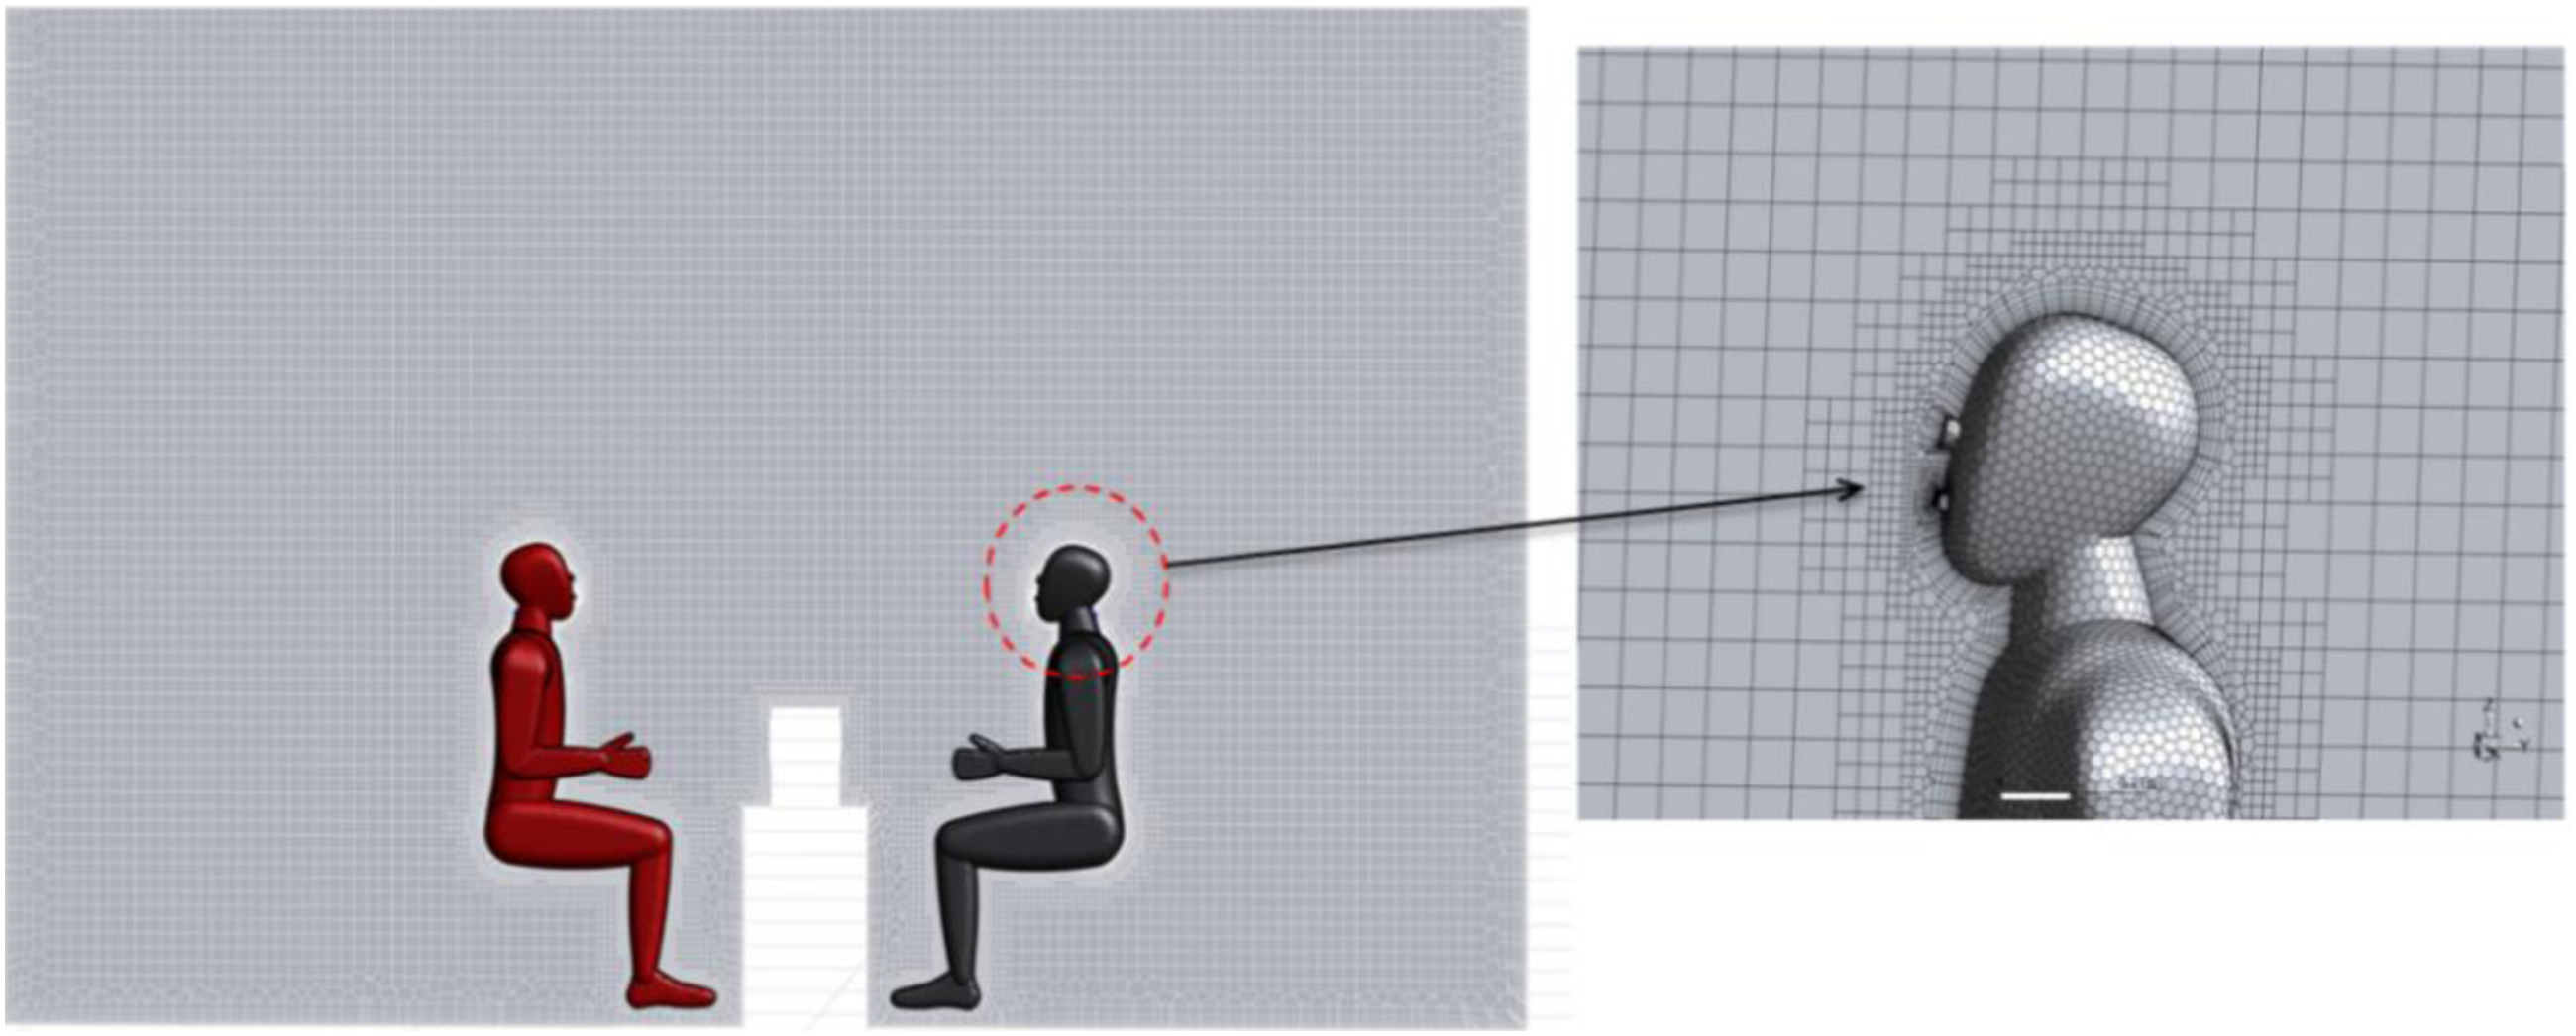
Evaluation of particle exposure risk
To evaluate the risk of exposure to particles for occupants in the confined room, the accumulated particle dose was determined by equation (8).
47
In this study, the particles were suspended in the breathing zone of the occupant and were inhaled by the occupant. Thus, the accumulated dose was increased with time even when the number of particles in the breathing zone was the same.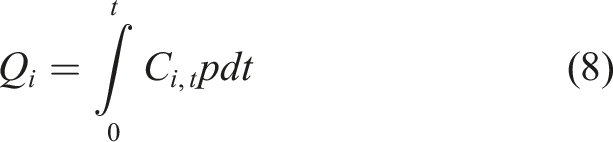
The particle concentration in the breathing zone was determined by equation (9):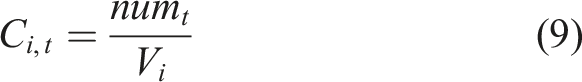
Grey relational analysis
Grey relational analysis is a method proposed by Deng 53 in 1982 to analyze the correlation between reference parameters and comparison parameters. By establishing a grey relational grade through a small amount of data, the importance of the influencing factors can be determined. Grey relational analysis does not lead to discrepancies between quantitative and qualitative results, which can compensate for problems caused by regression analysis, principal component analysis and statistical methods for systematic analysis. 54 Thus, grey correlation analysis is a good comprehensive evaluation method to determine the importance amongst various parameters.
Grey relational analysis has a wide range of applications in many domains, such as industry, agriculture, economics and energy. 41 In this study, grey relational analysis was used to obtain the importance of each parameter in reducing the risk of infection and particle count concentration. Grey relational analysis proceeds as follows:
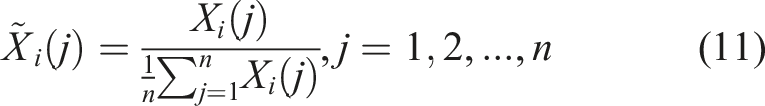
The results were normalized to eliminate the dimension of each parameter, that is, to obtain the correct conclusion when making comparisons. equations (10) and (11) show the normalizing method.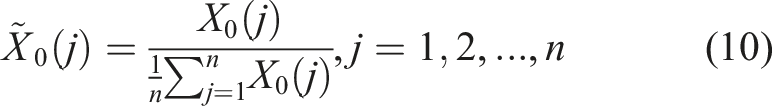
The grey relational coefficient 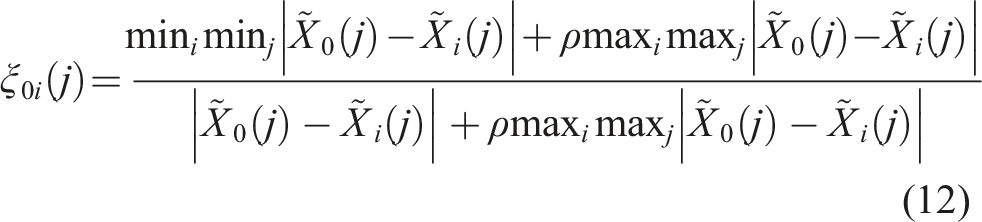
Then, the grey relational degree 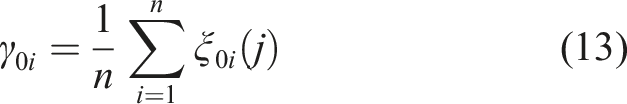
The grey relational degree indicates the degree of correlation between the reference sequence and comparison sequence. The grey relational degree ranges between zero and one, and the closer the relationship is between the reference sequence and comparison sequence, the higher the grey relational degree. Thus, the grey relational degree is a good index to determine which ventilation parameters of the air purifier are more important to reduce the risk of infection for the occupant.
Results and discussion
CFD validation
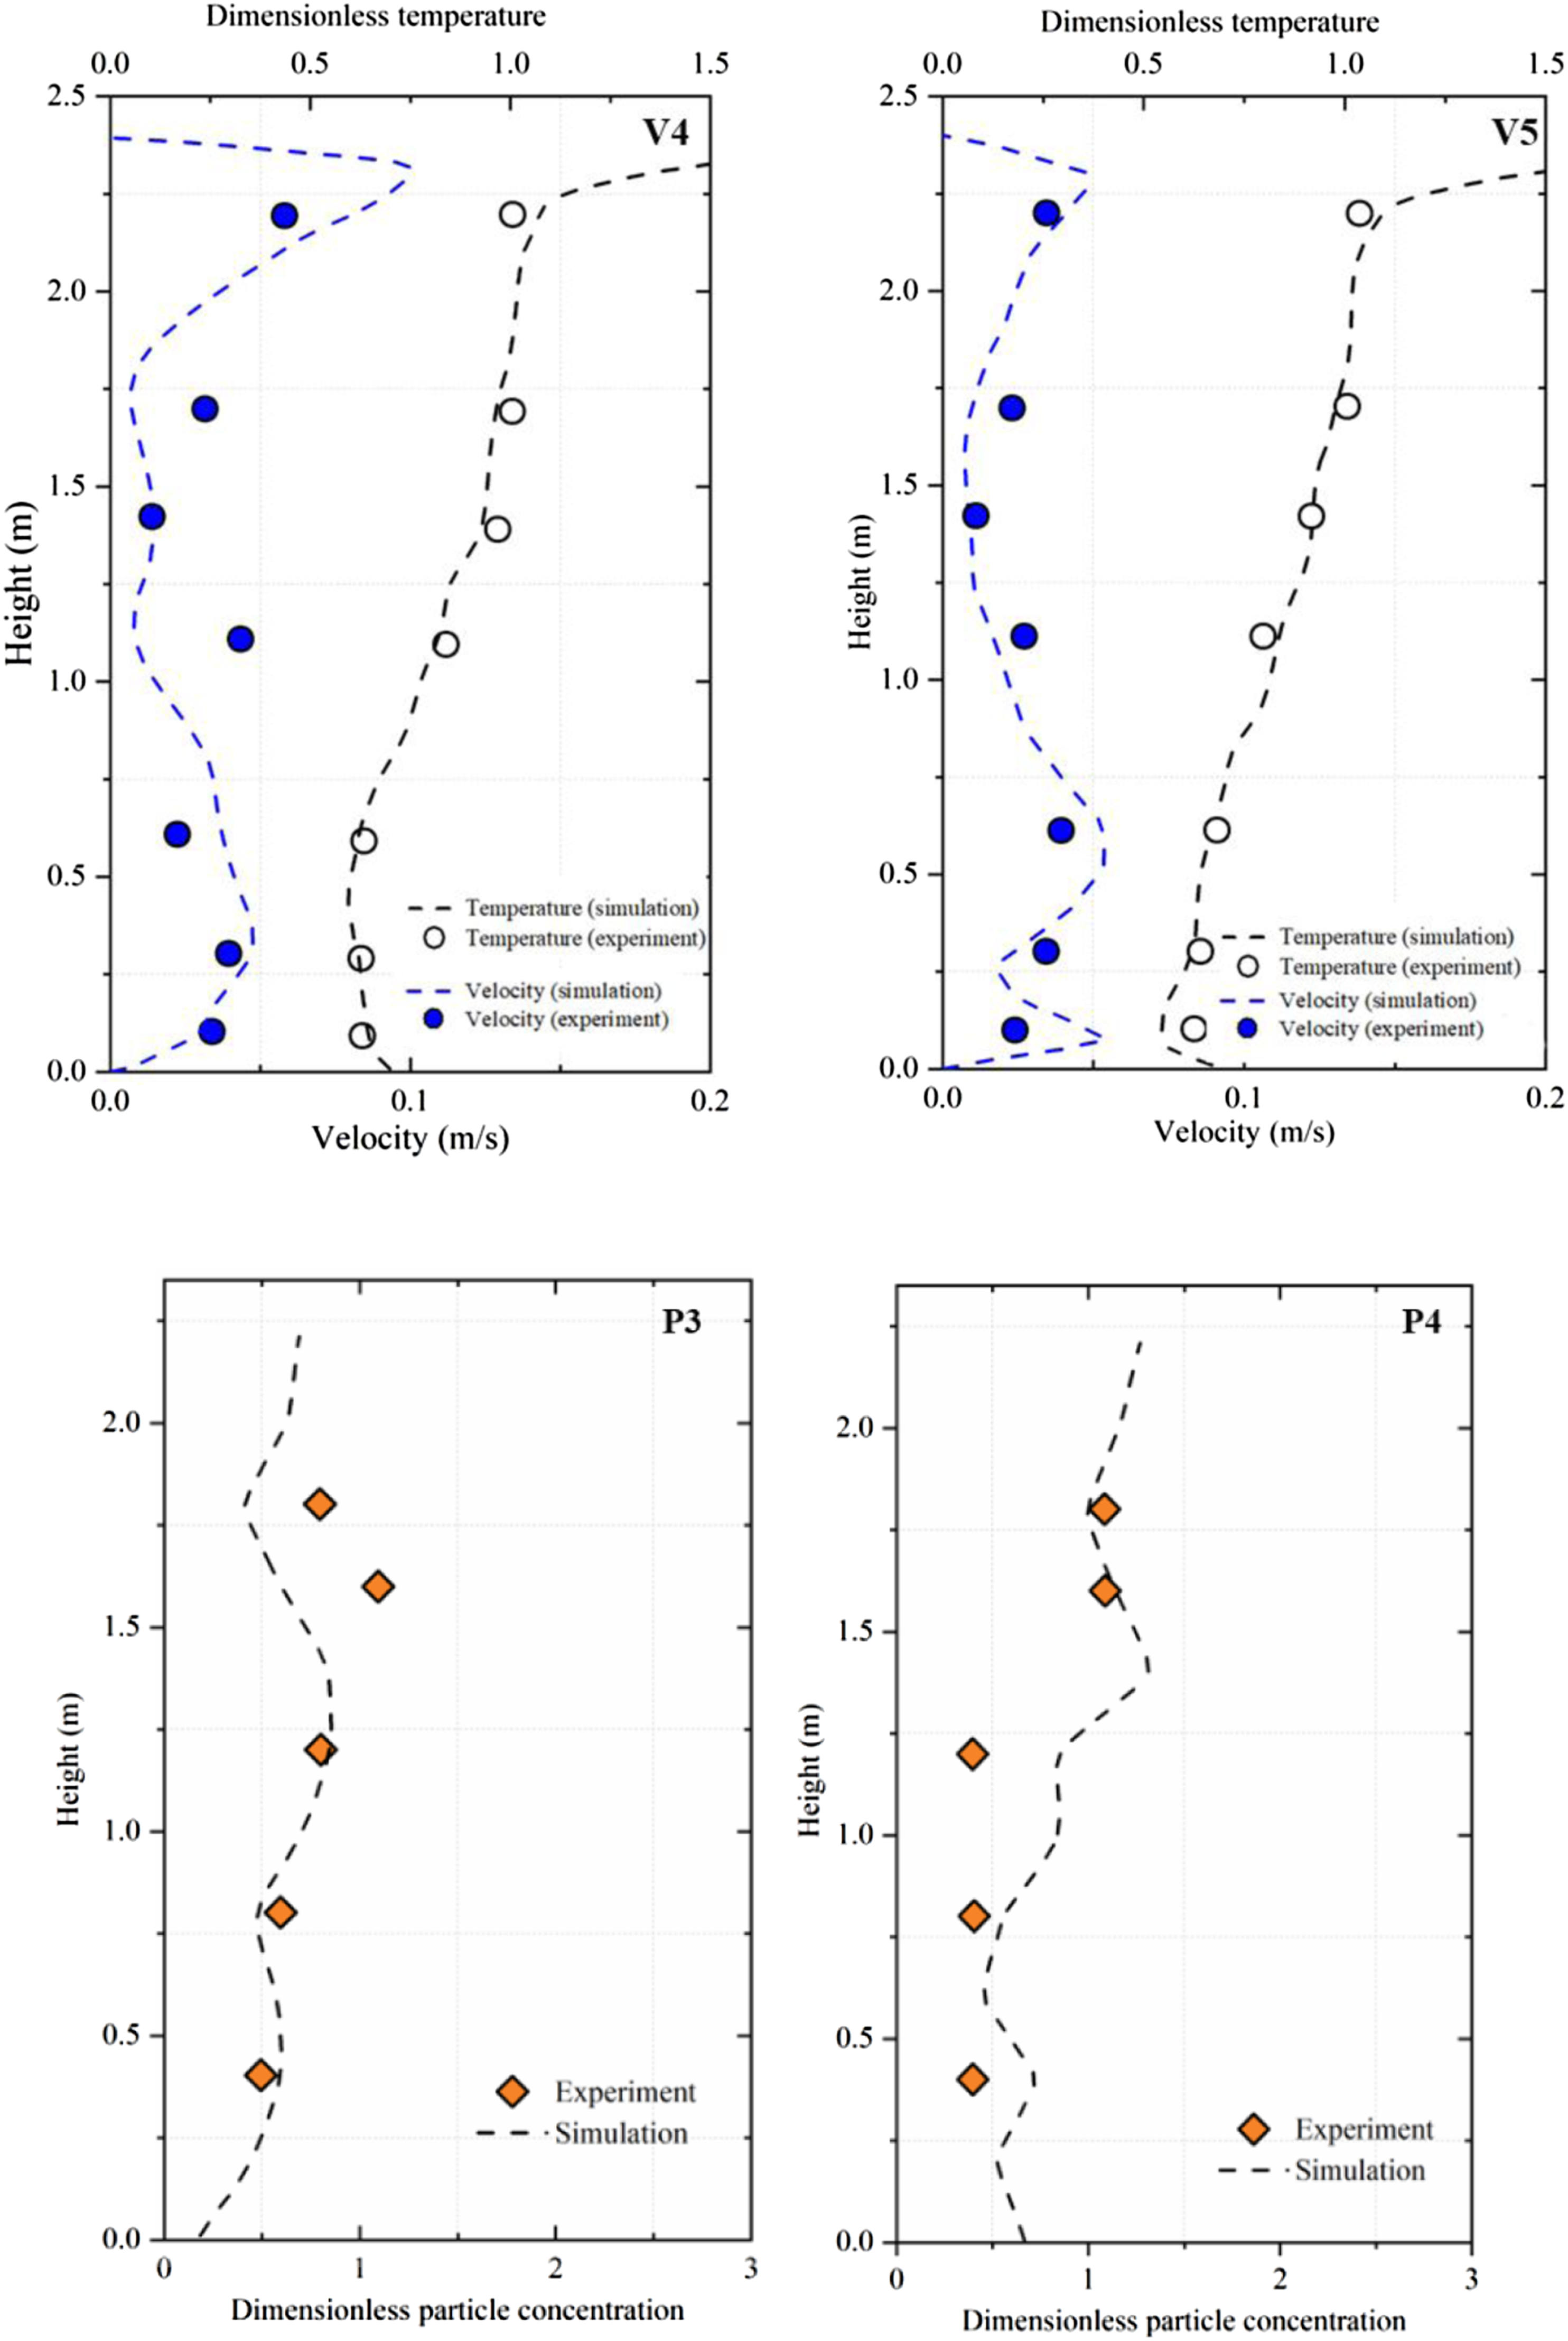
To verify the accuracy of the CFD model for calculating particle dispersion, we validated the CFD simulation by comparing our simulation data with experimental results for a room where displacement ventilation had been installed,
55
as shown in Figure 5. The comparisons of the velocity, temperature and particle concentration from the simulated and measured results are shown in Figure 6. The results are in reasonable agreement with the experimental data, thus validating the simulation technique presented in this study. As for the validation of velocity and temperature fields, we adopted the same turbulence model, and the Boussinesq assumption was also adopted for air density. The numerical scheme used the SIMPLE algorithm to couple the pressure and velocity coupling iterative solution method. A second-order upwind scheme was used to solve the basic discrete governing equations of momentum. As for the validation of particle dispersion, we used the DPM of the Lagrangian method, and the DRW model was used to calculate the turbulent dispersion of particles. The diagram of the environmental chamber and the measurement point layout used by Zhang and Chen.
55
Comparison of simulated and measured data at different locations. Note: dimensionless temperature (T − Tsupply)/(Texhaust − Tsupply); dimensionless particle concentration (C − Csupply)/(Cexhaust − Csupply).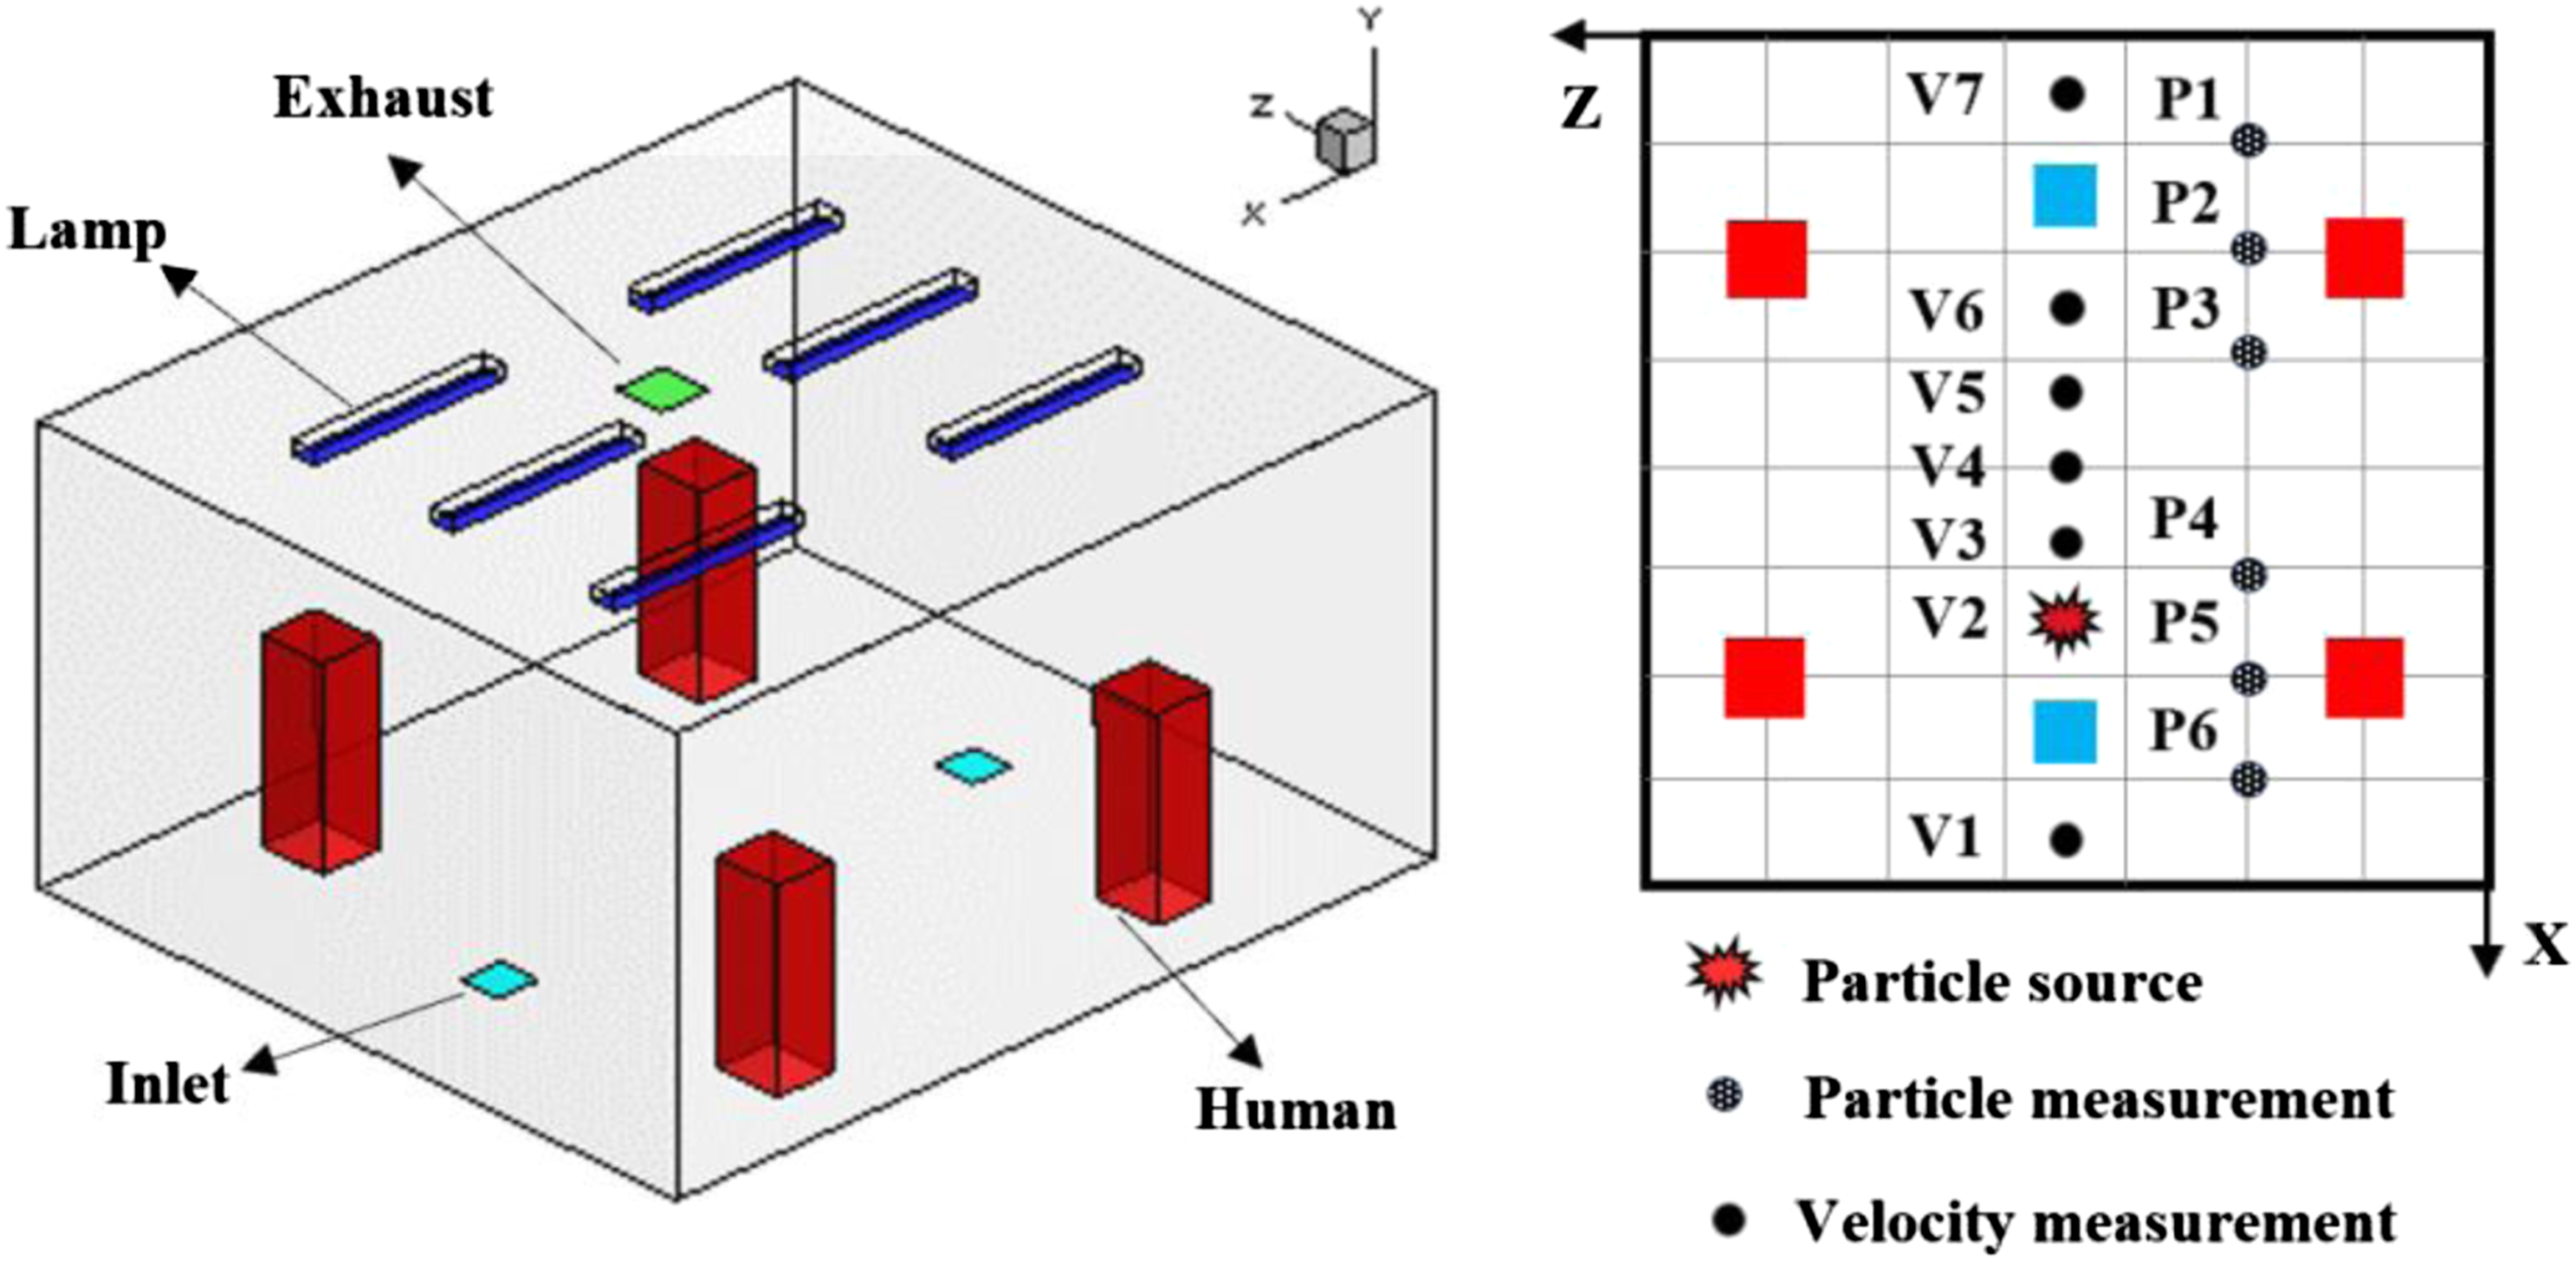
Particle dispersion in a confined room without an air purifier (reference case)
To research the effect of an air purifier on particle dispersion, the particle distribution exhaled by an infected person in a confined room, without an air purifier, which was used as a reference case, is shown in Figure 7. In a confined room without an air purifier, the airborne particles exhaled by the infected occupant flowed directly to the uninfected occupant within 6.0 s, and then the particles moved upwards due to the thermal plume of the occupant, resulting in the dispersion of particles to the upper part of the room. Particle distribution in a confined room without an air purifier (red person is infected person, black person is exposure person).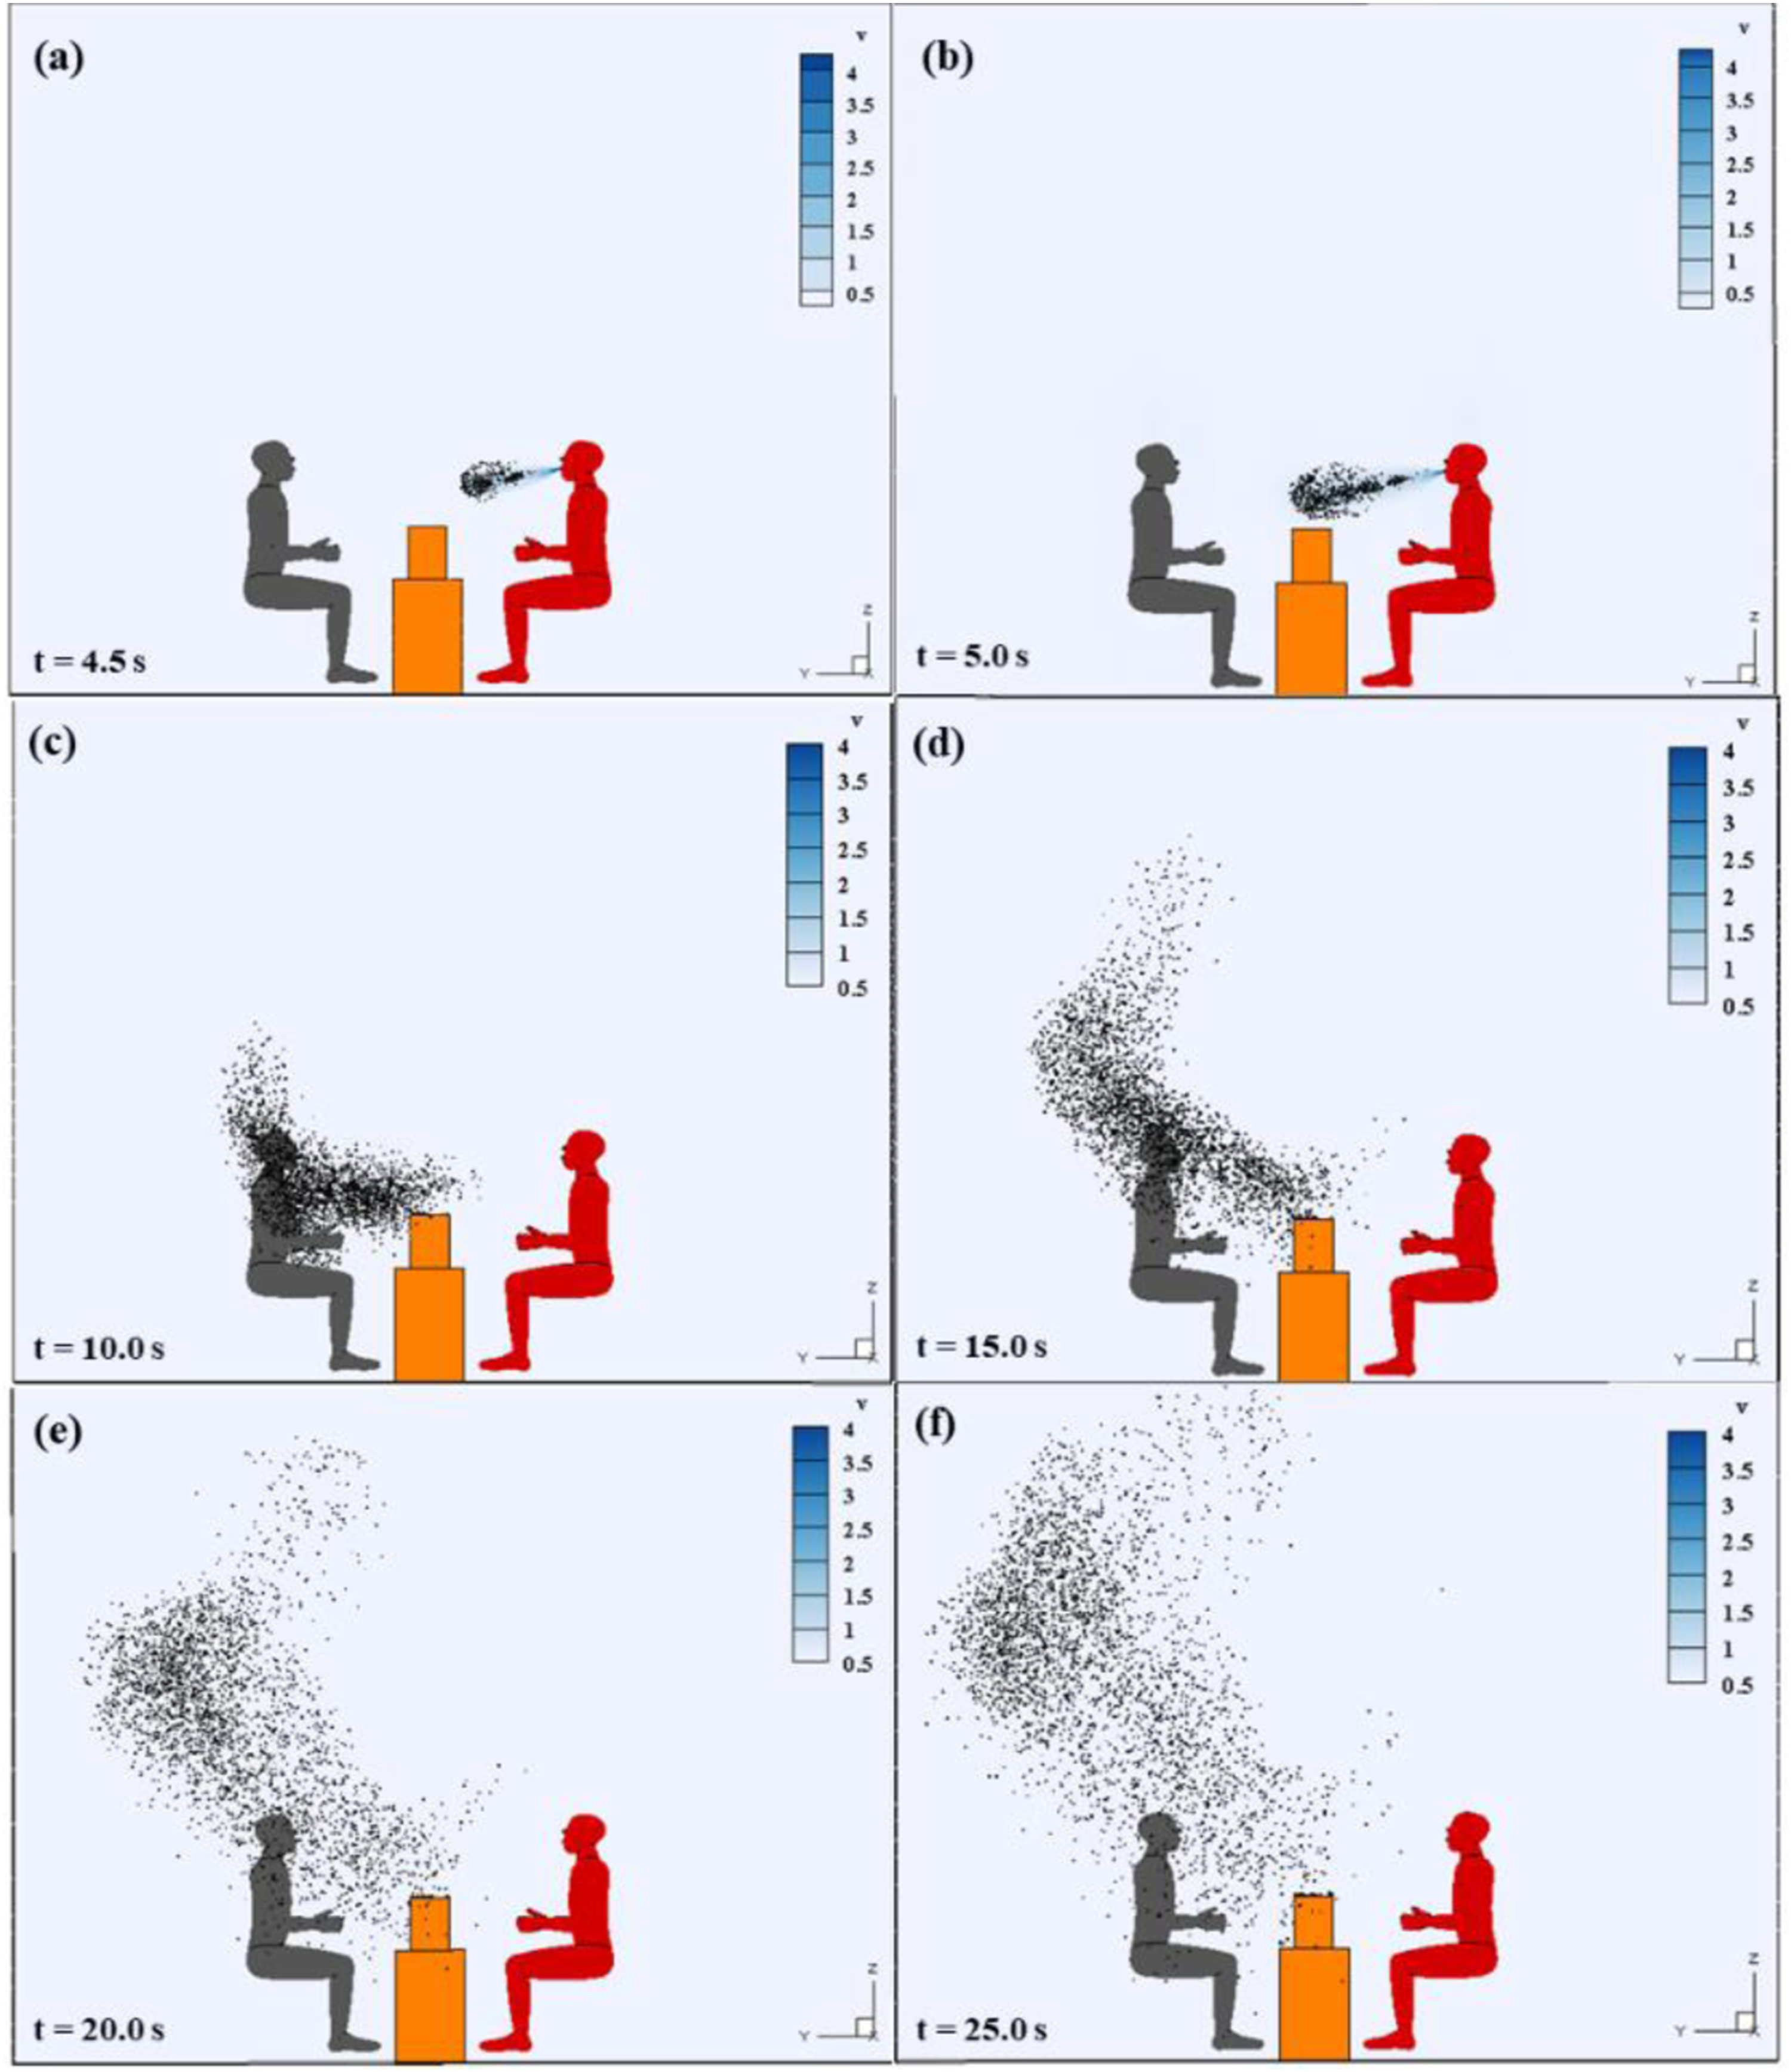
Figure 7(a) shows the airborne particles were exhaled by infected person, and rapidly dispersed to the susceptible person. As shown in Figure 7(b), the particles exhaled by the infected person flowed to the centre of the area between two occupants 1.0 s after the infected occupant spoke, and the particles did not reach the breathing zone of the occupant. Figure 7(c) shows the particles exhaled by the infected occupant directly reached the head and shoulders of the uninfected occupant 6.0 s after the occupant spoke, and the risk of infection risk was very high over time. Therefore, the uninfected occupant was exposed to particles when the room was confined without the air purifier and the infection risk was increased over time. Figures 7(d) to (f) show most of the particles moved upwards due to the thermal plume of the occupant. However, there was still a large number of particles around the uninfected occupant. Therefore, the uninfected occupant was exposed to the particles when the room was confined without the air purifier, and the infection risk was increased over time.
The effect of the ventilation parameters of the air purifier on particle dispersion
Ventilation parameters have an important impact on the particle distribution.
56
Thus, Figure 8(a) displays the distributions of particles in a confined room without an air purifier, while Figure 8(b) to (j) show the distributions of particles in a confined room with an air purifier at different ventilation rates and air supply angles. Airborne particle distribution in a confined room with an air purifier; (a) without an air purifier (b) ventilation rate 27.0 m3/h, air supply angle 30° (c) ventilation rate 40.5 m3/h, air supply angle 30° (d) 54.0 m3/h, air supply angle 30° (e) ventilation rate 27.0 m3/h, air supply angle 60° (f) ventilation rate 40.5 m3/h, air supply angle 60° (g) ventilation rate 54.0 m3/h, air supply angle 60° (h) ventilation rate 27.0 m3/h, air supply angle 90° (i) ventilation rate 40.5 m3/h, air supply angle 90° and (i) ventilation rate 54.0 m3/h, air supply angle 90°.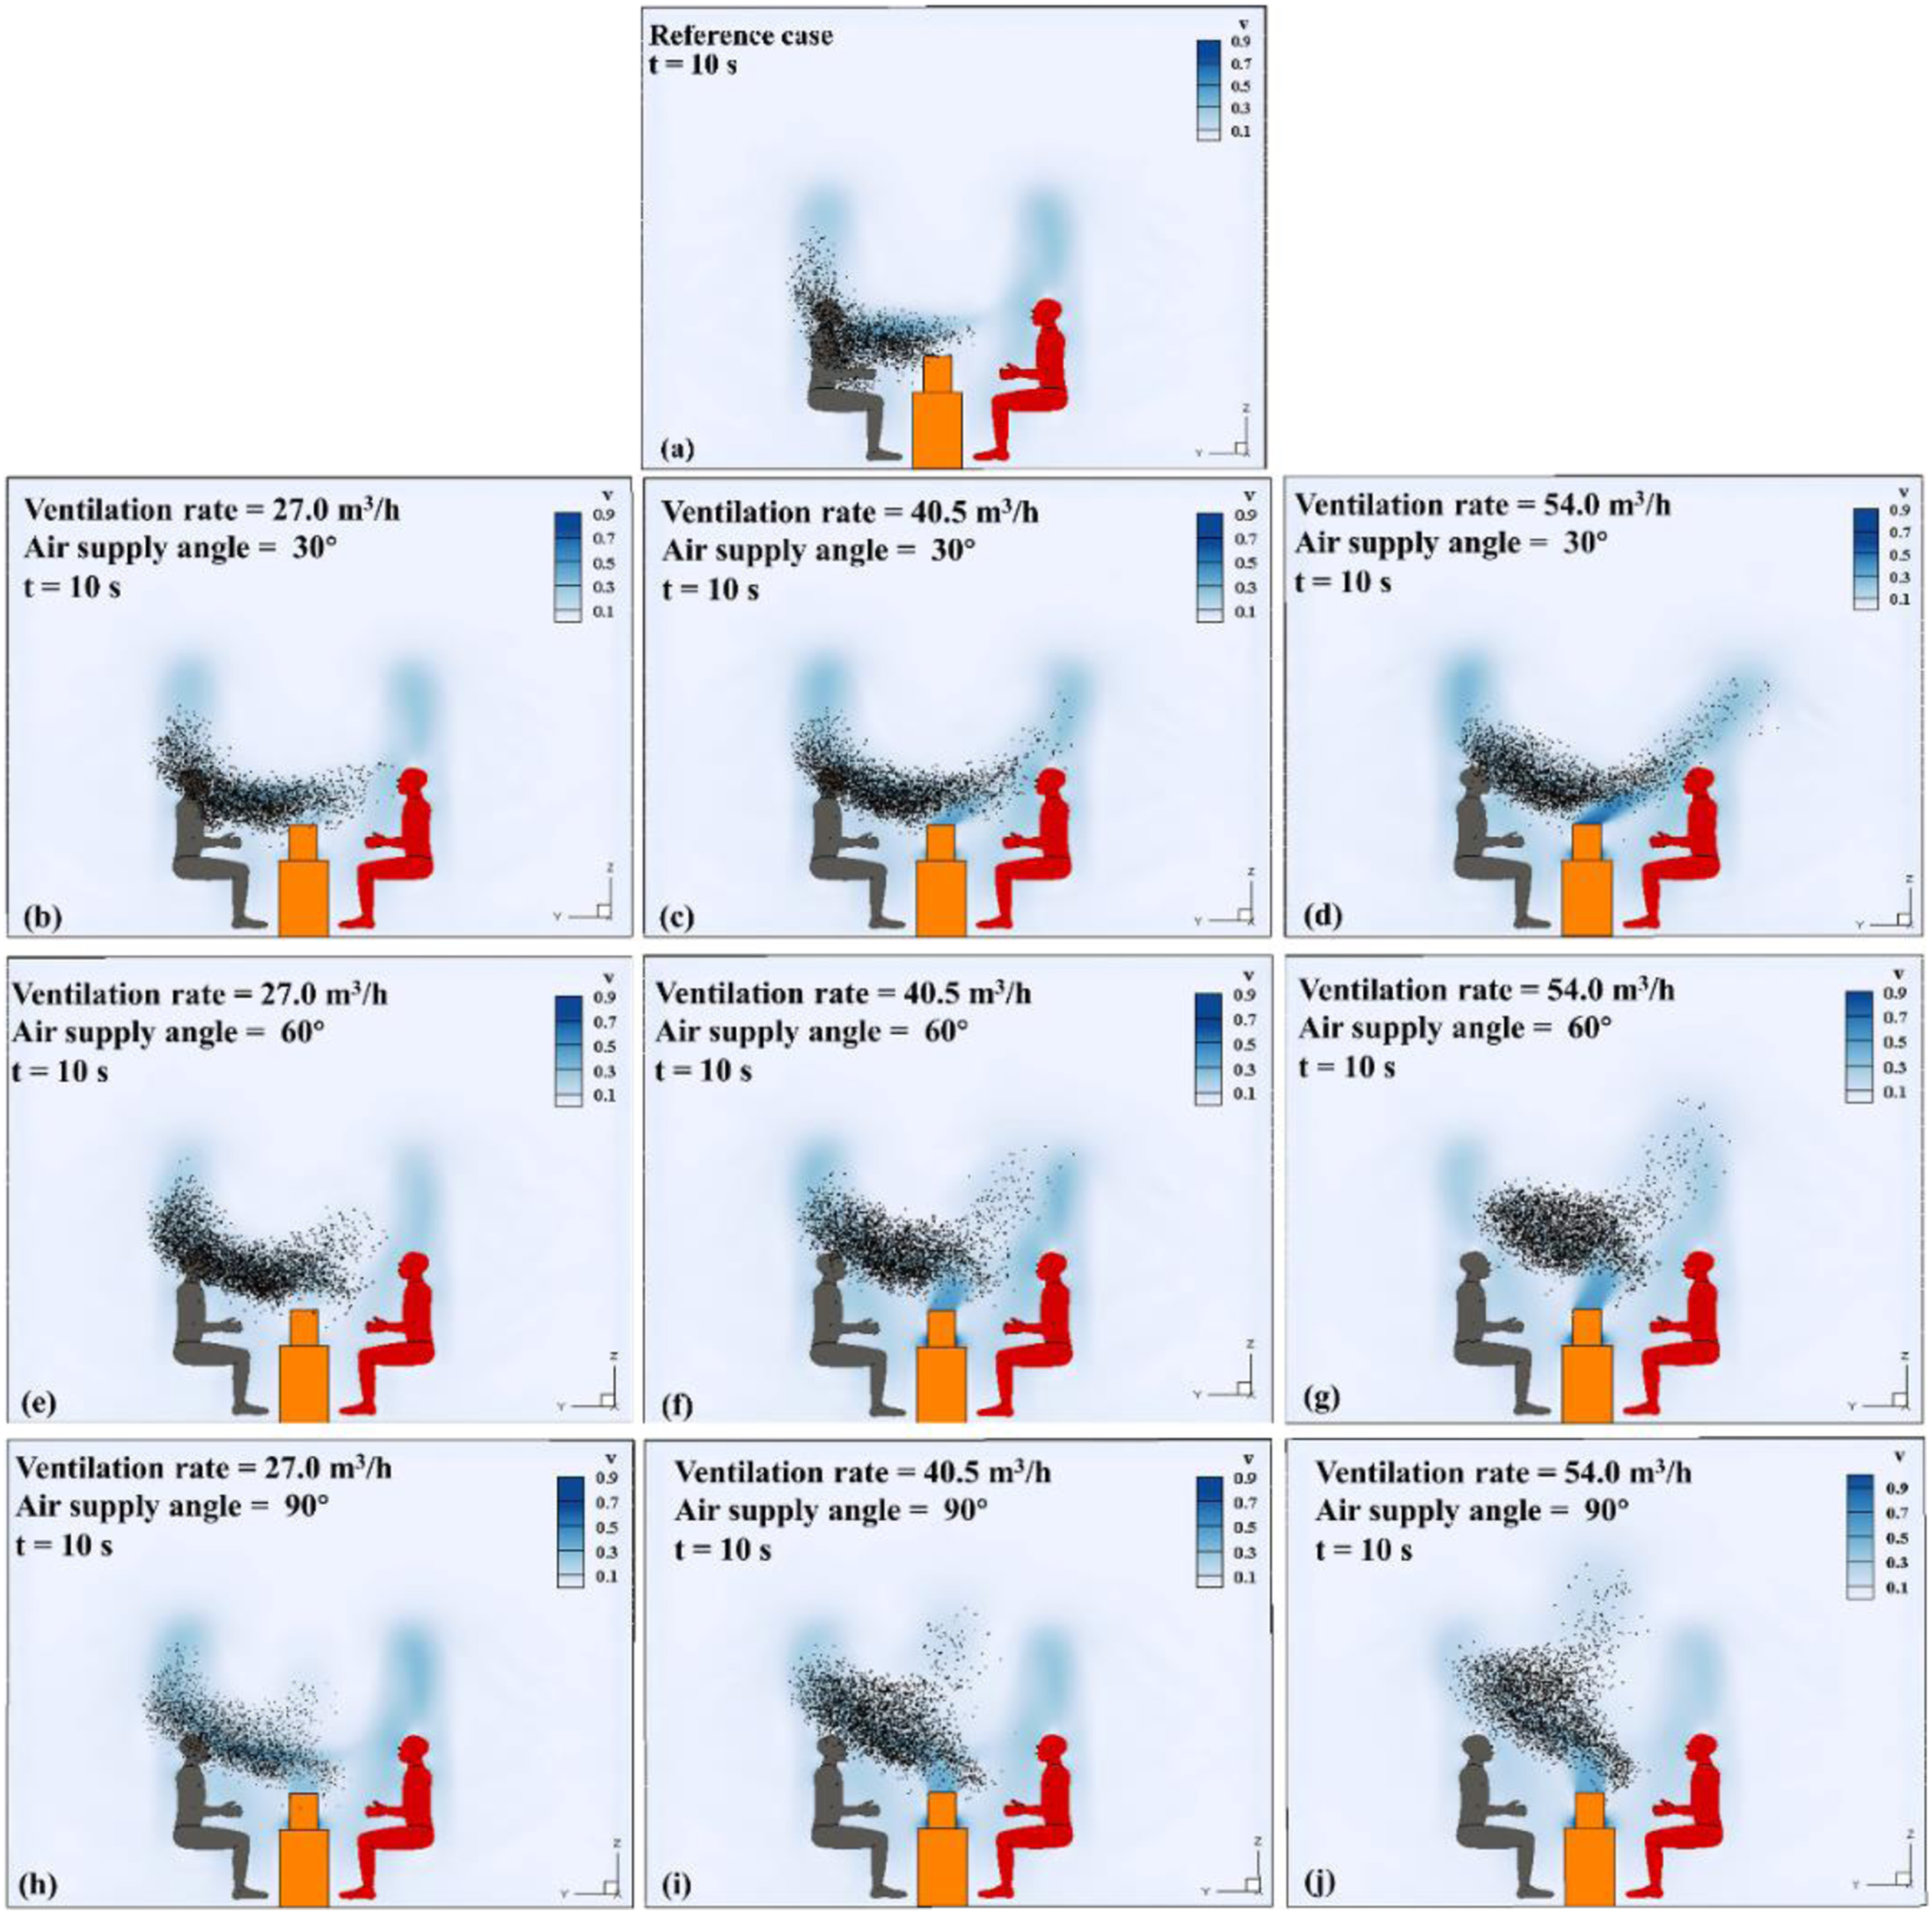
To research the effect of the ventilation rate from an air purifier on the dispersion of particles, Figure 8 illustrates the dispersion of particles exhaled by an infected occupant in the confined room under different ventilation rates of 27 m3/h, 40.5 m3/h and 54 m3/h with different angles (30°, 60° and 90°). Figures 8(h) to (j) shows the exhaled particles and airflow under different ventilation rates with an air supply angle of 90°. The particles dispersed towards the uninfected occupant, as shown in Figure 5(h), indicating that the particles exhaled by the infected occupant were not suppressed by the airflow of the air purifier, and the particles could easily penetrate the breathing area of the uninfected occupant. This was attributed to the limitation of the height of the air supply from the air purifier, which was lower when the ventilation rate was insufficient, thus failing to separate the particles exhaled by the infected occupant. As the ventilation rate was increased, the jet flow of the air purifier was stronger, pushing the airflow and particles exhaled by the infected occupant upwards and reducing the number of particles around the breathing zone of the uninfected occupant.
Figure 8(e) to (g) indicates the particles exhaled by the infected occupant at different ventilation rates for an air supply angle of 60°. The particles exhaled by the infected occupant were suppressed by the airflow of the air purifier and moved upwards and backward. When the ventilation rate was increased from 27 m3/h to 54 m3/h, the particles were blocked due to the increasing strength of the jet flow of the air purifier, resulting in a reduction in the number of particles around the breathing zone of the occupant. In Figure 8(b) to (d), the particles dispersed towards the uninfected occupant when the ventilation rate was increased from 27 m3/h to 54 m3/h at an air supply angle of 30°, showing that the particles could easily penetrate the breathing zone of the occupant. Research showed that the airflow of the air purifier was increased with the increased ventilation rate, which blocked the particles and kept them away from the breathing zone of the uninfected occupant.
We also investigated the effect of the air supply angle on the dispersion of particles from the infected occupant. Figure 8(b), (e) and (h) show the particles exhaled by the infected occupant under different air supply angles with a ventilation rate of 27 m3/h. These figures show the number of particles was reduced when the air supply angle was increased from 30° to 90°. However, at any angle, the particles exhaled by the infected occupant flowed towards the uninfected occupant over the airflow of an air purifier, and the uninfected occupant was exposed to the particles, which increased their risk of infection in the confined room. Figure 8(c), (f) and (i) depict the dispersion of particles exhaled by the infected occupant under different angles with a ventilation rate of 40.5 m3/h. The particles were dispersed and flowed forward to the breathing zone of the uninfected occupant with an air supply angle of 30°, as shown in Figure 8(c). When the air supply angle was increased from 30° to 90°, the particles exhaled by the infected occupant were partly suppressed when the air supply angle was increased from 30° to 90°, which moved particles away from the breathing zone of the uninfected occupant.
Figure 8(d), (g) and (j) depict the particle dispersion under different air supply angles with a ventilation rate of 54.0 m3/h. The air supply angles of 60° and 90° controlled the particles exhaled by the infected occupant and kept them away from the breathing area of the uninfected occupant. When the air supply angle was 30°, the particles exhaled by the infected occupant penetrated the airflow of the air purifier towards the uninfected occupant, who was directly exposed to the particles, which increased their risk of infection in the confined room.
The effect of the ventilation parameters of the air purifier on the particle count concentration in the active area
Figure 9 shows the effect of the ventilation parameters of the air purifier on the particle count concentration in the indoor activity area. According to BS EN 12792:2003,
57
the activity area of a person was defined by a plane from the wall to 0.5 m as the boundary with a height from 0.1 m to 1.3 m above the ground. In the research cases, the infected person continuously exhaled airborne particles for 4–9 s, and the particle count concentration in the active area was increased with time. When the infected person stopped talking after 9 s, the particle count concentration in the active area was reduced. In the reference case, the particle count concentration was 79 #/m3 in the activity area when the time was 34 s. Compared with the reference case, the particle count concentration in the active area with an air purifier was significantly reduced (8.8%–53.2%), and the particle count concentrations in the activity area were dependent on different ventilation rates and air supply angles. The particle count concentration was reduced with an increase in the ventilation rate and the air supply angle. The lowest particle count concentration was 37 #/m3 when the ventilation rate was 54.0 m3/h with an air supply angle of 90°. When the ventilation rate was increased from 27.0 m3/h to 54.0 m3/h, the particle count concentration was reduced with the air supply angle of 30° (from 72 #/m3 to 55 #/m3), 60° (from 62 #/m3 to 45 #/m3) and 90° (from 48 #/m3 to 37 #/m3). Comparison of the particle count concentration in the activity area under different ventilation parameters of the air purifier.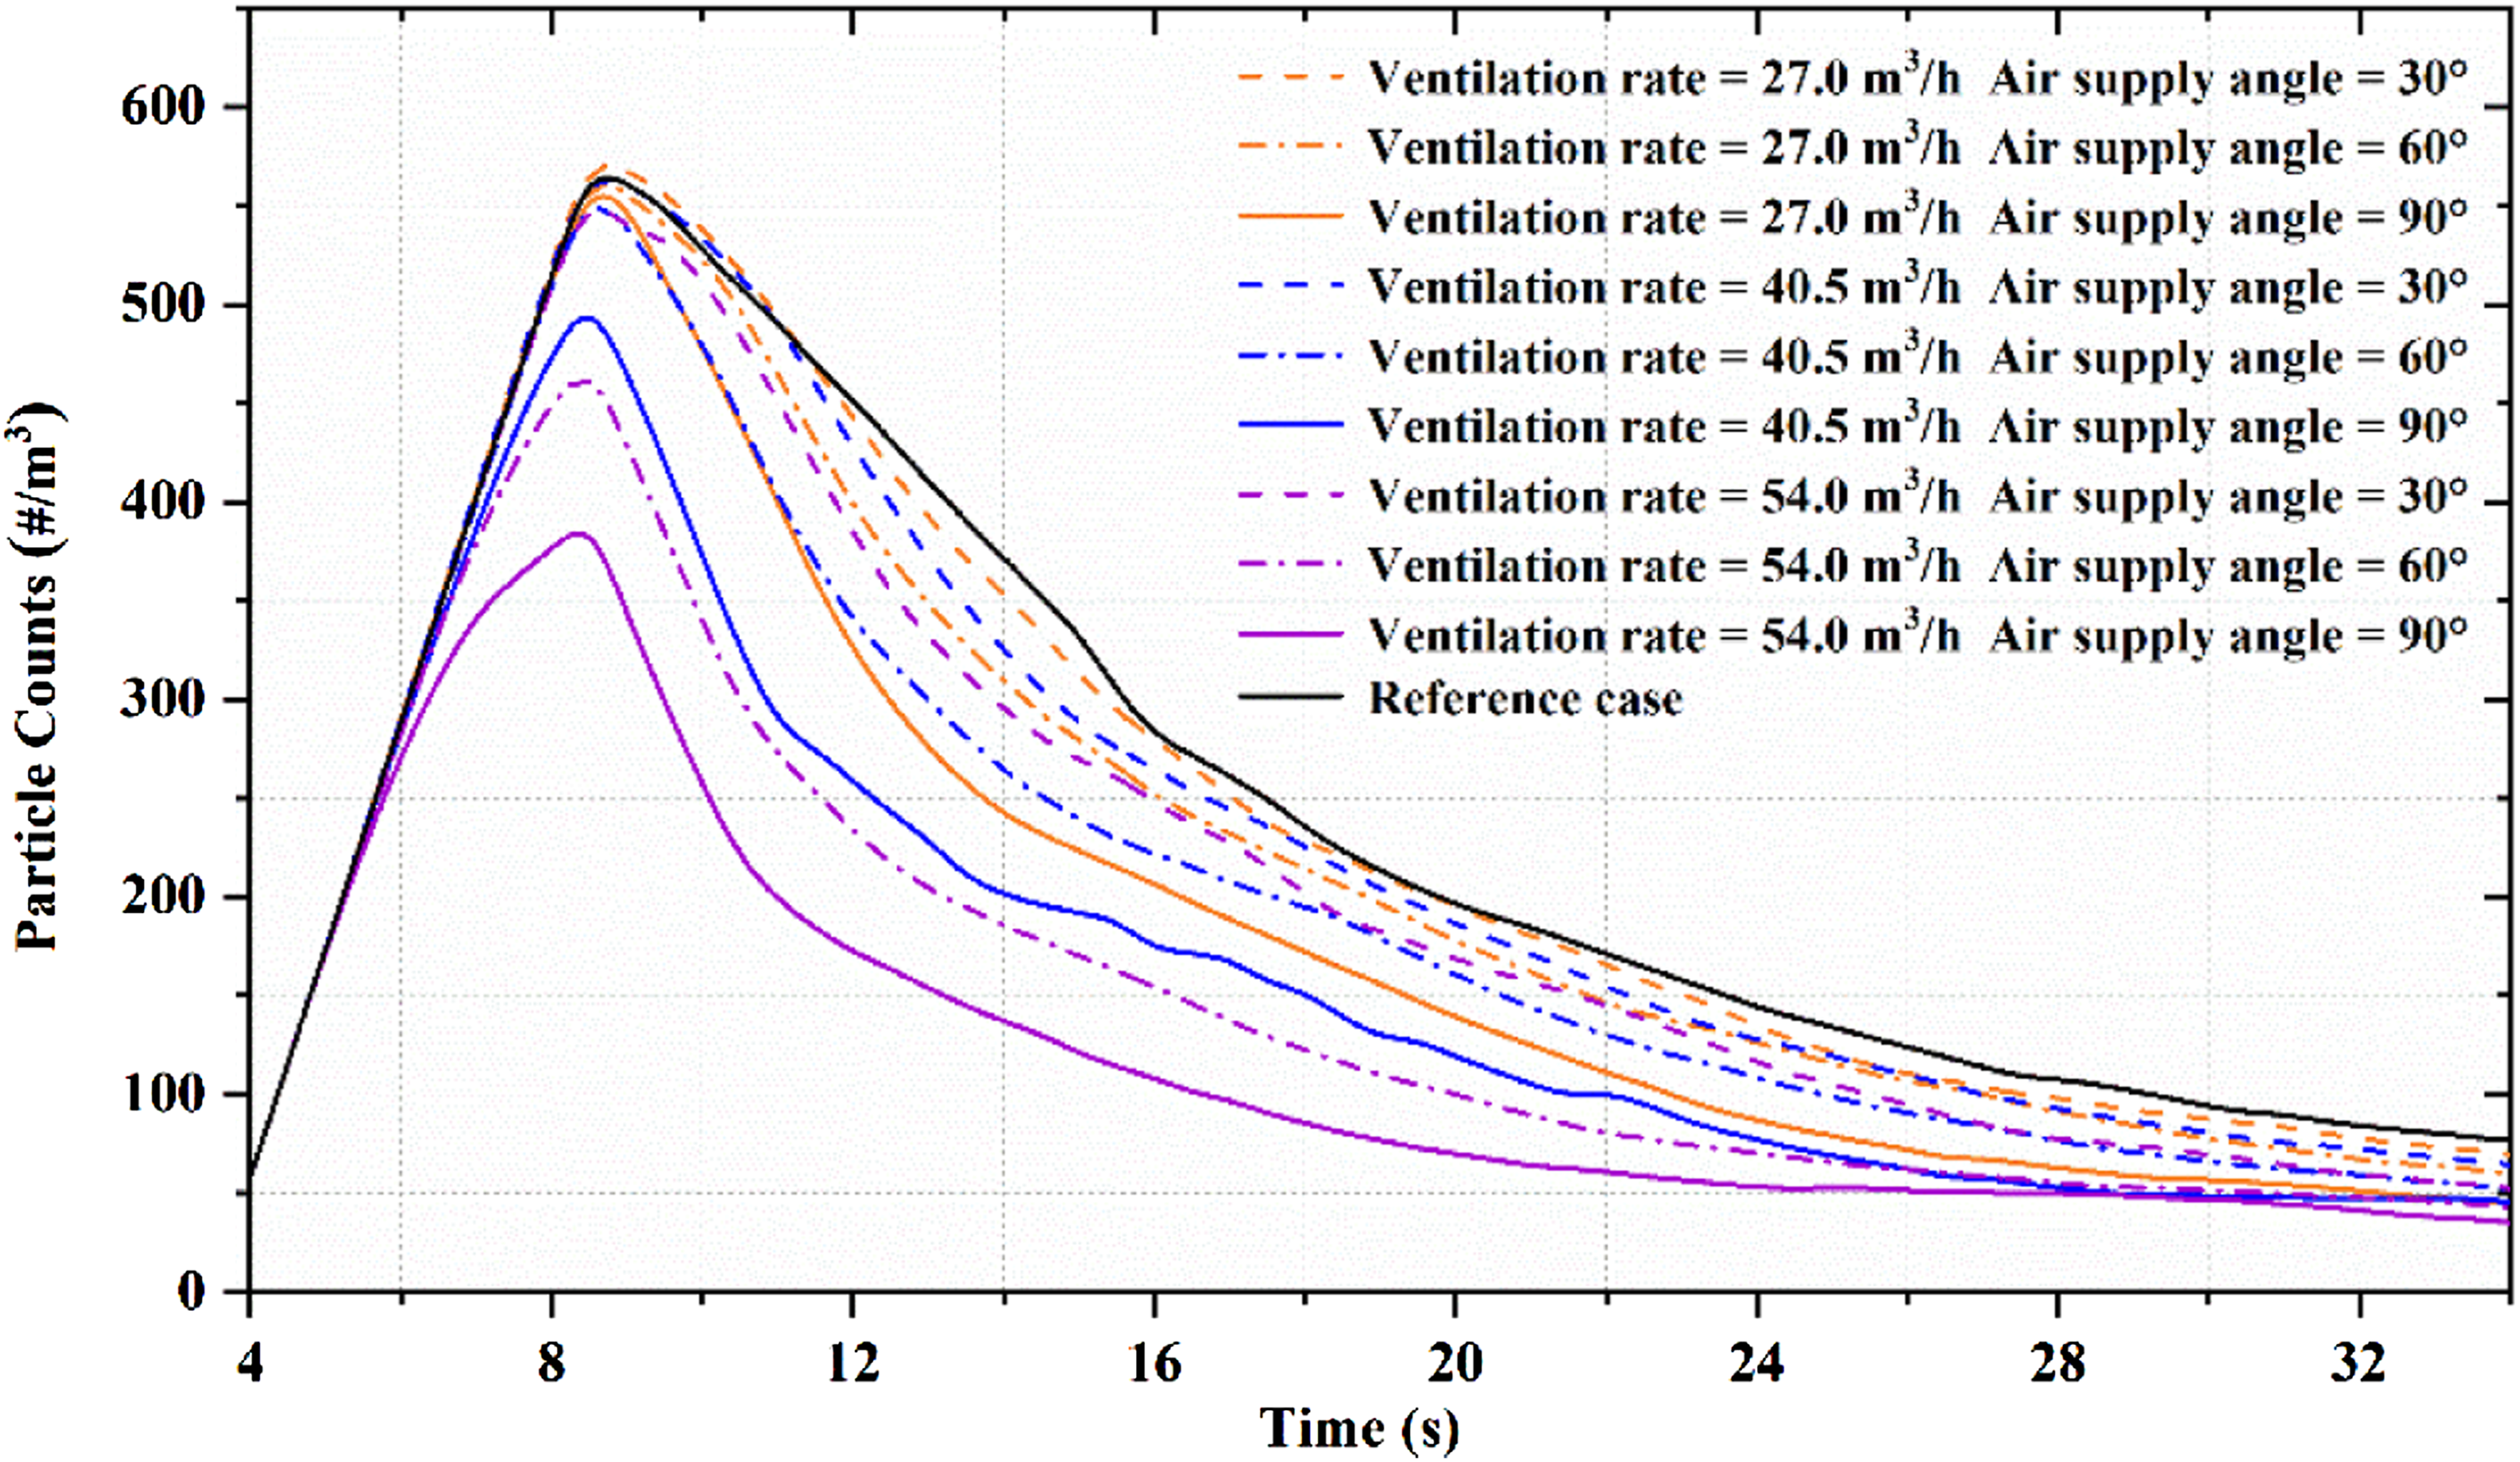
The effect of the ventilation parameters of the air purifier on the accumulated particle dose in the breathing zone
To evaluate the overall performance of the air purifier with respect to the risk of exposure, the particulate matter accumulation in the personnel breathing area was analyzed according to the simulation results. Figure 10 displays the effect of the ventilation parameters of the air purifier on the accumulated dose in the breathing zone. Compared with the reference case, the accumulated dose in the breathing zone with an air purifier was significantly reduced (7.64–94.27%). In the confined room without an air purifier, the accumulated dose of the uninfected occupant was 11.00. Notably, the accumulated dose was reduced to 0.63–11.00, depending upon different ventilation rates and air supply angles. The lowest accumulated dose was 0.63 when the ventilation rate was 54.0 m3/h with an air supply angle of 60°. A larger ventilation rate could produce a better performance in terms of the accumulated dose in the breathing zone. With the increase in ventilation rate from 27 m3/h to 54 m3/h, the air supply angle 30°, 60° and 90°, the accumulated dose of the uninfected occupant was reduced from 10.16 to 5.01 (30° angle), from 9.02 to 0.63 (60° angle) and from 8.01 to 0.90 (90° angle), respectively. However, the optimal air supply angle was linked to the ventilation rate. For example, when ventilation rates were 27.0 m3/h and 40.5 m3/h, the accumulated dose was reduced with the increase in the air supply angle. For a ventilation rate of 54.0 m3/h, the accumulated dose was first reduced and then increased. Comparison of the accumulated particle dose in the breathing zone under different ventilation parameters of the air purifier.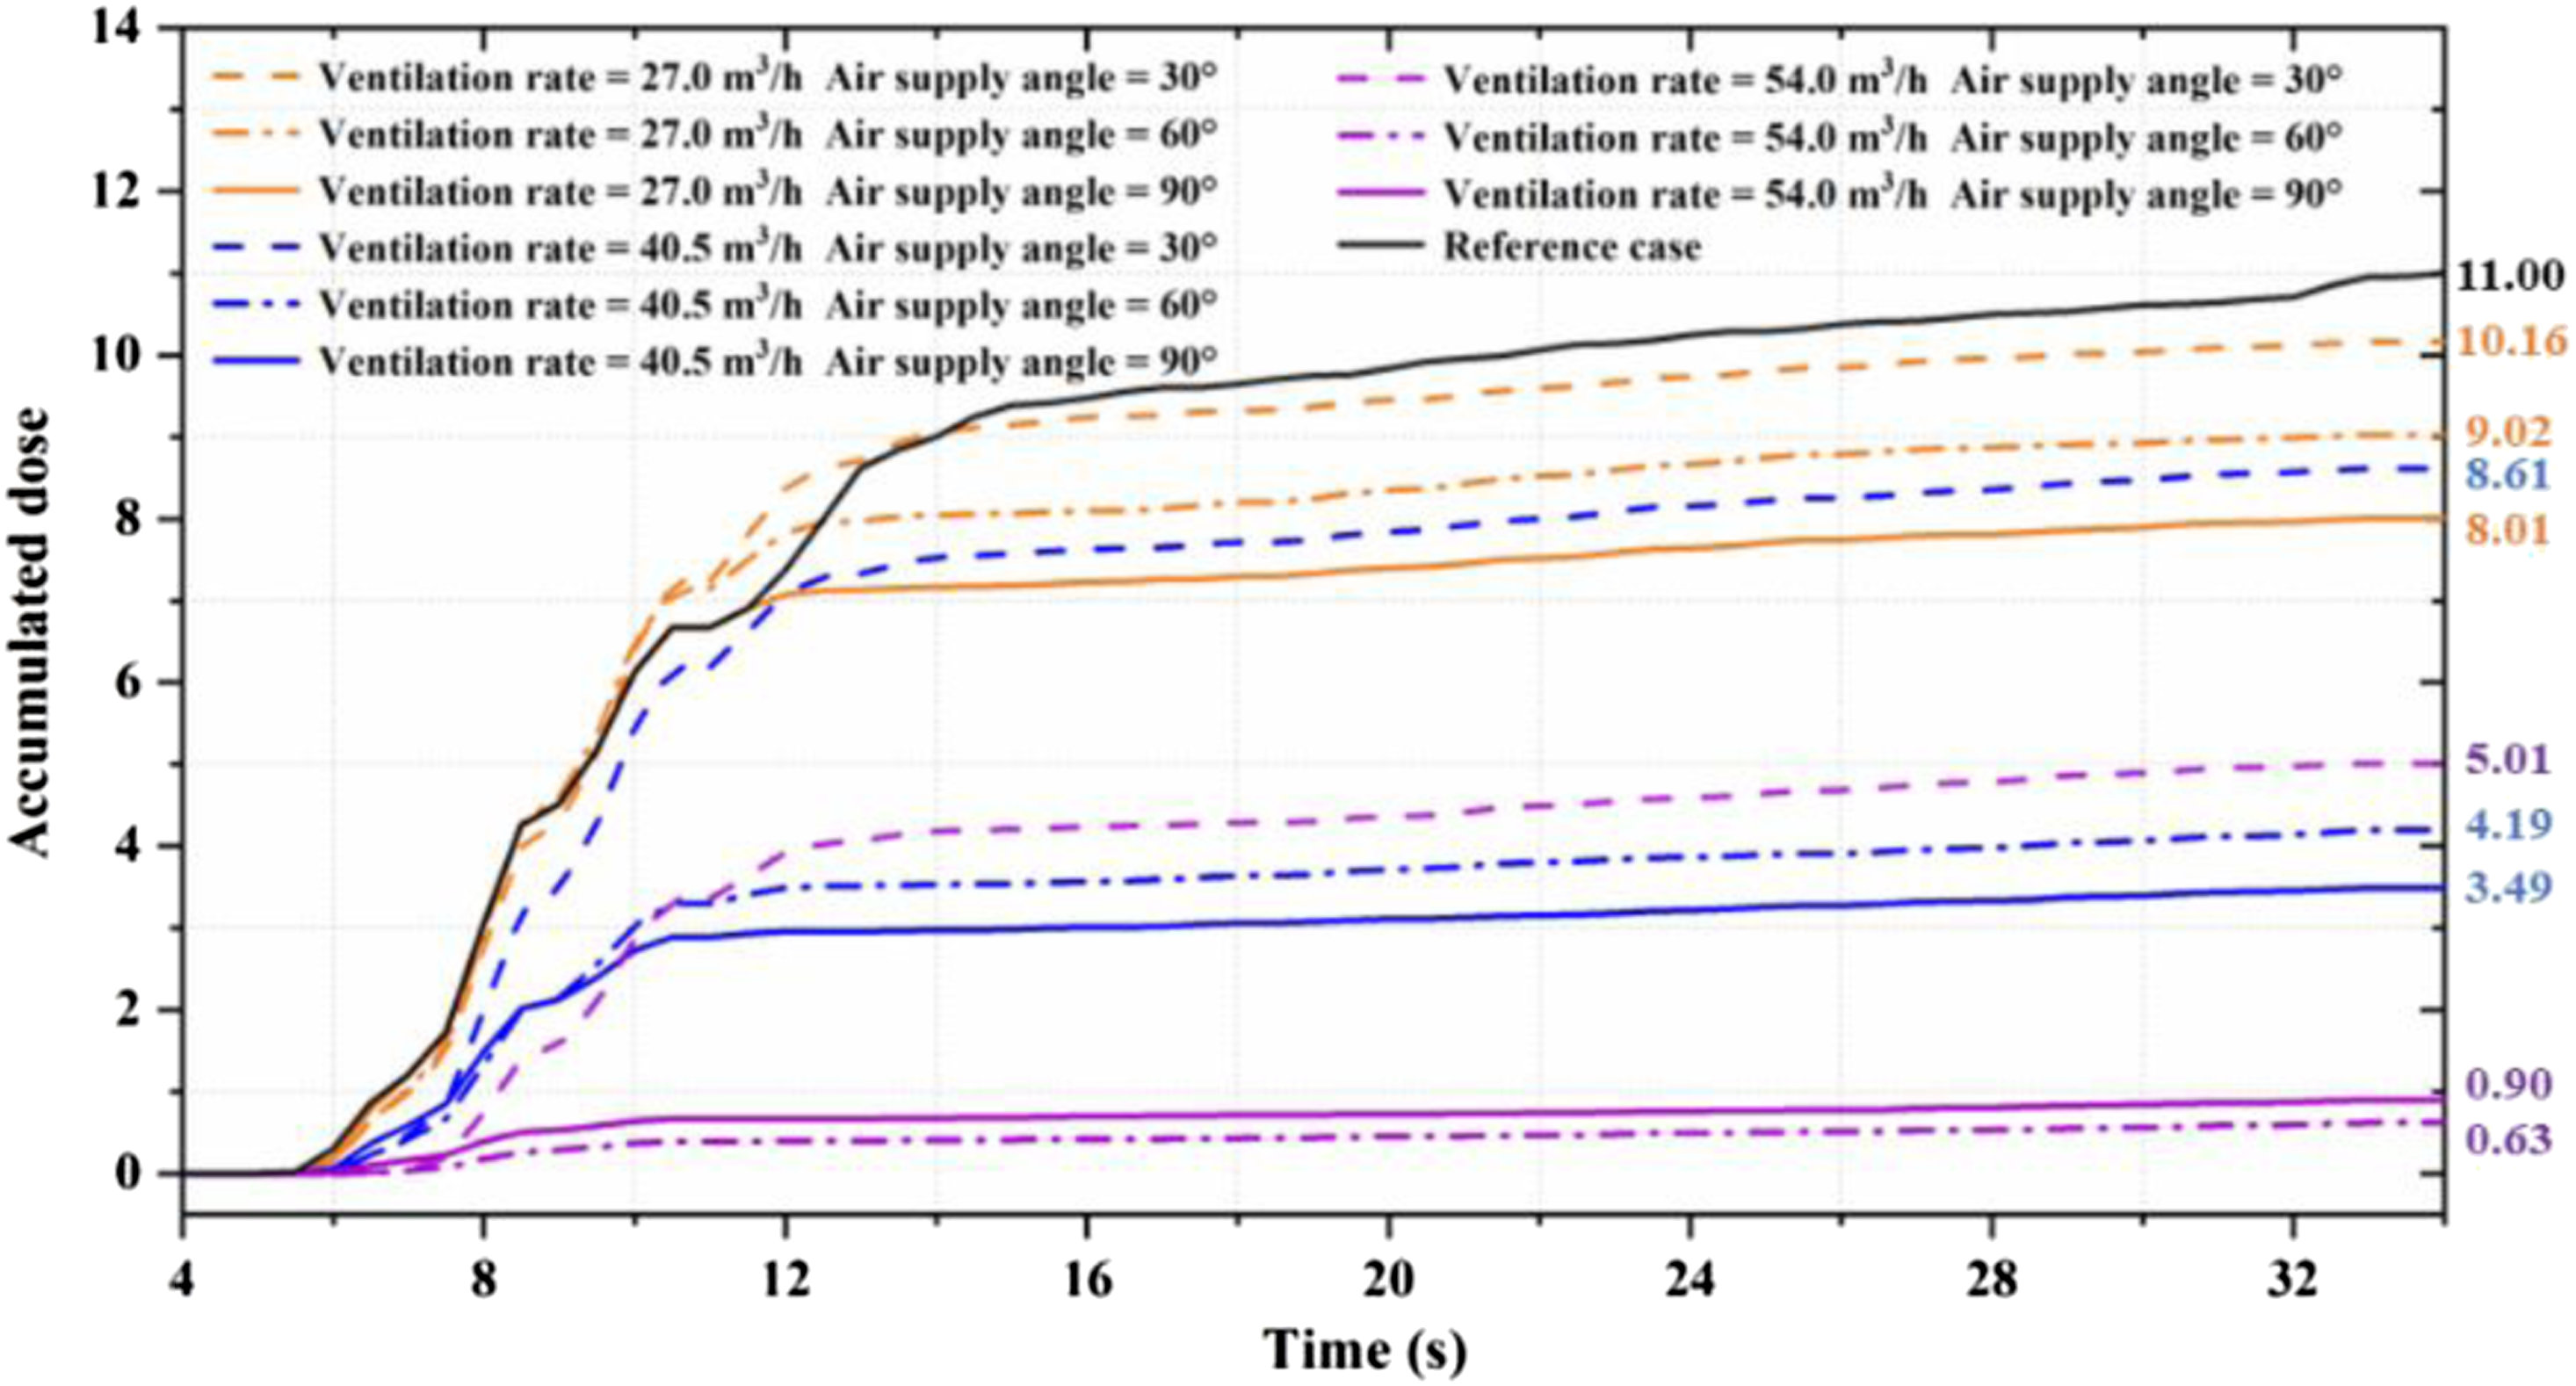
Grey relational analysis
Using CFD results, the grey relational grades between ventilation parameters and particle count concentration and accumulated dose were determined by grey relational analysis, as shown in Figure 11. For the accumulated particle dose, the grey relational grades for the air supply angle were slightly higher than for the ventilation rate (grey relational grade values of 0.57 and 0.54). This means that the air supply angle of the air purifier had a greater impact than the ventilation rate on the accumulated particle dose in the breathing zone of the occupant. However, the grey relational grade of the ventilation rate was higher than the air supply angle (grey relational grade values of 0.60 and 0.52), which indicates that the ventilation rate had a greater effect on the particle count concentration in the active area. The comparison of these cases indicates that the air supply angle could significantly affect the accumulated dose in the breathing zone of the occupant, and the ventilation rate had an impact on the particle count concentration in the active area. Grey relational grades of ventilation parameter of the air purifier on particle count concentration and accumulated dose.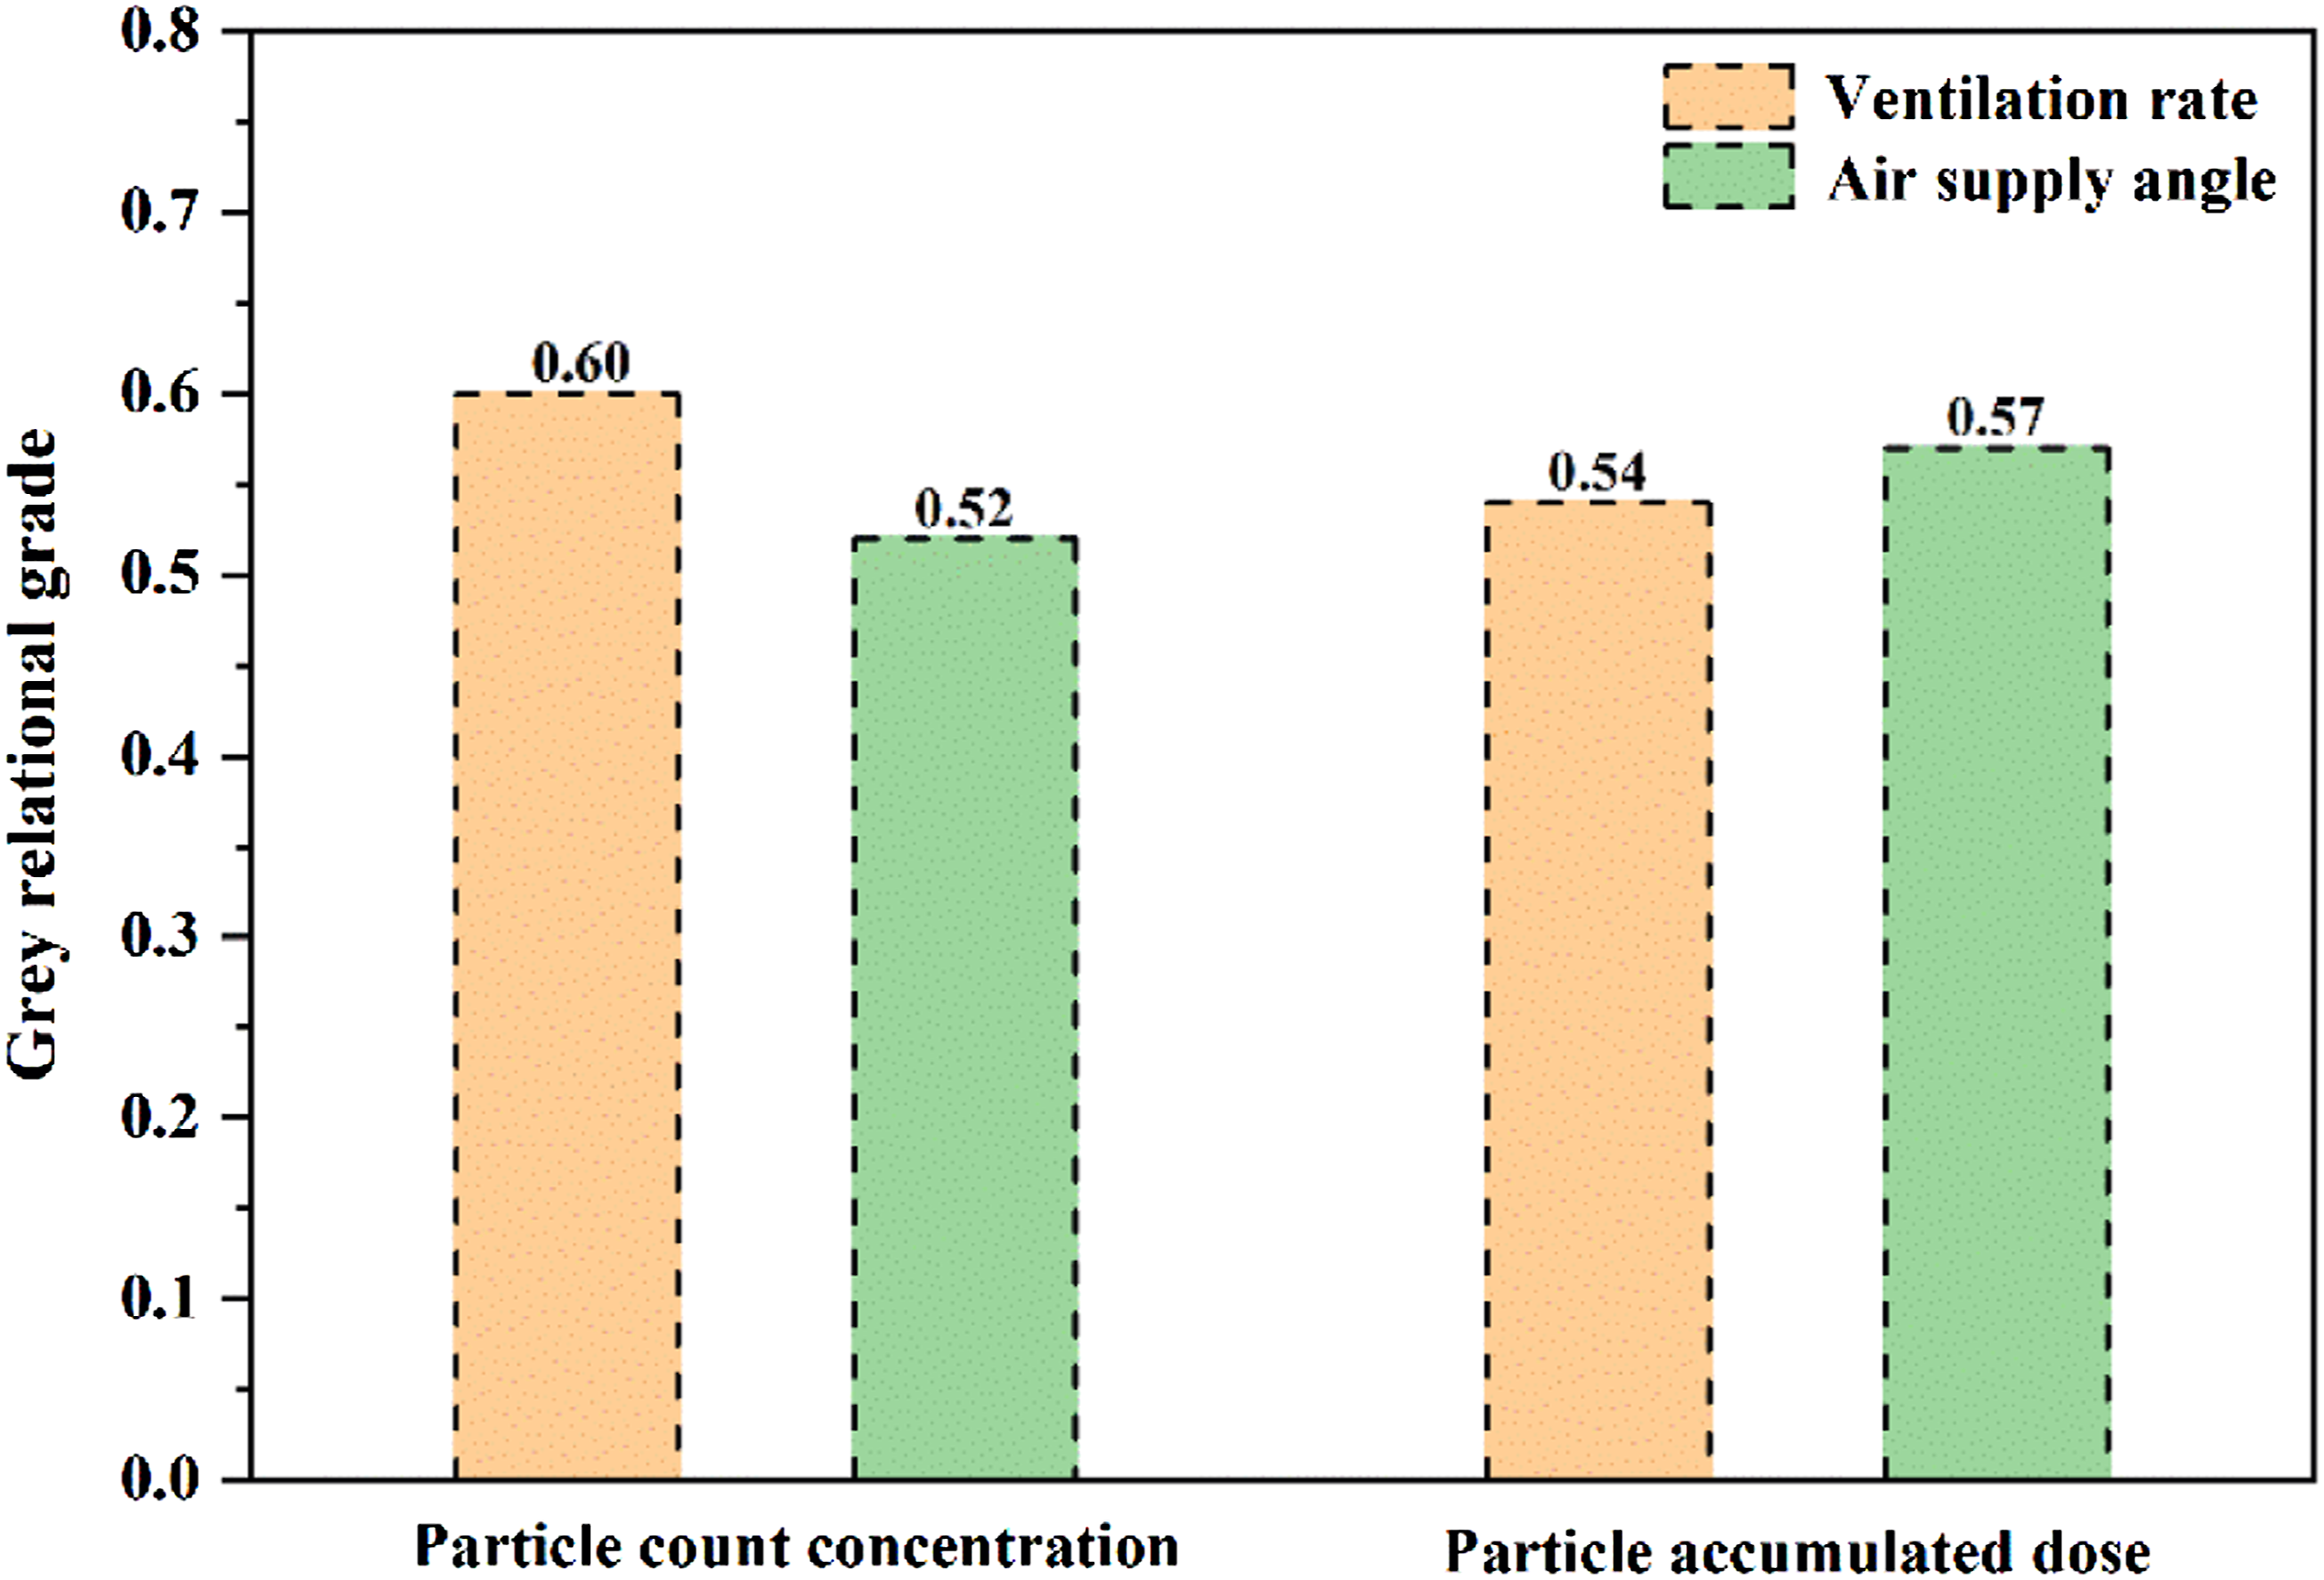
Discussion
Effect of air purifier on infection control
This study demonstrates that the air purifier was effective in mitigating exposure to airborne particles exhaled by infected people, which mainly provides local dilution and air blocking for a short time, avoiding short-distance exposure, therefore, it could help to reduce the risk of infection between people sitting opposite to each other at the same desk. Furthermore, the ventilation rate and air supply angle can have important roles in the dispersion of particles exhaled by an infected occupant, and they caused different impacts on the particle count concentration of the active area and accumulated particle dose in the breathing zone. When considering the link between a higher risk of infection and poor ventilation in indoor environments, we believe that air purifiers may provide a solution for reducing the risk of airborne transmission. In this study, we found that the air purifier provides a local dilution and blocks the development of an expiratory jet for a short time, which may reduce transmission risk. An air purifier is relatively inexpensive, easy to obtain, targets problem areas within a confined room and is easy to operate without resorting to detailed engineering controls and expensive ventilation upgrades.
Although this study focused on airborne transmission for infection, the air purifier had little effect on contact transmission due to contact transmission occurring via direct contact with infected people or indirect contact with contaminated surfaces. This can be avoided by measures such as social distancing, frequent surface disinfection and hand washing. 32 In addition, the use of an air purifier provides more surfaces for the attachment of virus-carrying particles. They can contact the deposited particle through physical contact and resuspension and inhalation. Increasing the disinfection frequency is recommended. The filter element of the air purifier should also be replaced regularly to prevent secondary pollution. 58
Limitations of this study
The findings of this study could serve as a guideline for the improved design and application of air purifiers to formulate effective mitigation control strategies for reducing indoor infection risk. However, this investigation has limitations. In most office (and other) buildings, ventilation systems are installed to ensure air mixing in the space. Therefore, the design of room ventilation may have a great impact on the effect of air purifiers placed face to face between two occupants. In further research, more consideration should be given to the dispersion of particles under the combined effect of ventilation systems and air purifiers. In some cases, the exposure to particles exhaled by the infected occupant was almost zero; in reality, this may not always be true. Since the numerical simulation of the whole process was very time-consuming, in this study, we simulated the dispersion of particles for 30 s after the infected person spoke for 5 s. The settings for the cases in this study was not general, and more cases should be considered in further studies.
This study considered the position of the air purifier at the centre of a desk shared between two people, but in general, the location and configurations of the air purifier may have an effect on indoor pollutant distribution, 40 and more cases should be considered in further studies. In addition, since anyone may be infected, in some cases, there is no guarantee that placing an air cleaner between two people can protect either of these people.
This study did not consider the body movements, especially the head movements, of occupants, which may have a significant effect on the dispersion of exhaled airflow. Besides, the numerical calculation method may have introduced errors and ignored less influential parameters. Therefore, the simulation results may be different from an actual situation. Generally, the significant factors were controlled during the simulation. Under most conditions, the actual situation of infection risk among people staying indoors is much worse than that was considered in this study due to people talking for longer and staying in the room for longer, which proves the necessity of using air purifiers.
Conclusions
This study investigated the effects of air purifier ventilation parameters on the dispersion of airborne particles exhaled by an infected occupant in a confined room. The results showed that the air purifier provides a local dilution and blocks the development of an expiratory jet for a short time, which may reduce transmission risk. Compared with using no air purifier, the maximum reduction was 94.27% in the accumulated dose, and the maximum reduction was 53.2% in the particle count concentration.
In the activity area, the higher ventilation rate and larger air supply angle could better reduce the particle count concentration. For the breathing area, when the ventilation rate was 27.0 m3/h and 40.5 m3/h, the order of risk of infection according to the air supply angle used, was as follows: 90° > 60° > 30°. When a higher ventilation rate (54.0 m3/h) was used, the order of risk of infection according to the air supply angle used, was as follows: 60° > 90° > 30°.
Based on the grey relational analysis, the relational degree for the particle count concentration was higher for the ventilation rate than for the air supply angle. However, the relational degree for the accumulated dose was higher for the air supply angle than for the ventilation rate. The results of this research should provide guidance for developing a control strategy to mitigate the risk of infection in a confined room by using an air purifier.
Footnotes
Authors’ contribution
All authors contributed equally to the preparation, drafting, review and execution of this paper.
Declaration of conflicting interests
The author(s) declared no potential conflicts of interest with respect to the research, authorship, and/or publication of this article.
Funding
The author(s) disclosed receipt of the following financial support for the research, authorship, and/or publication of this article: This work was funded by the National Natural Science Foundation of China (Grant U1867221).