
Abstract
Duct bend is one of the important parts of ventilation and dust removal systems, and particles deposited in curved ducts can reduce system efficiency or cause erosion on the bend wall. To investigate whether particle deposition is affected by imposed swirl on fluid flow, this article combines the RSM turbulence model and the Discrete Phase Model (DPM) to predict the deposition efficiency of particles in the bend under high Reynolds number conditions. The results show that the imposed swirl flow modifies the secondary flow initially dominated by the pressure gradient caused by the curvature effect. With the gradual increase of the swirl number (S n ), the deposition efficiency of the particles gradually decreased. However, when the swirl number is low (S n ≤ 0.17), particles with smaller Stokes numbers are more susceptible to the intensity of turbulence. The higher the turbulence intensity near the wall, the easier it is for low inertia particles (St ≤ 0.456) to deposit. The higher swirl intensity dominates the centrifugal force, reduces the turbulent intensity in the central region of the duct, improves the stability of the airflow and makes it easier for particles with larger inertia (St ≥ 0.811) to pass through the bend.
Introduction
Ventilation and dust removal systems have an important role in transporting aerosol pollutants generated during industrial production. Deposition of the aerosol particles during the dispersed phase on the wall ducts is unavoidable during the transportation process.1,2 Particles deposited in ducts can restrict airflow, create fire risks, cause failure of overhead supports and provide a growth medium for biological contaminants.3–5 One of the most important ventilation and dust removal parts is duct bends that could alter the flow direction and pattern. 6 Several studies have shown a significant portion of the total particle deposition may occur at bends rather than on surfaces of straight ducts.7,8
The deposition of particles in the bend is usually affected by various factors, such as surface roughness, flow state, bending curvature and Stokes number.9,10 Pui et al. 11 conducted experiments in circular-section bends with diameters ranging from 5.03 mm to 8.51 mm in order to obtain the deposition efficiency of liquid aerosol particles. They found that particle deposition efficiency increased nonlinearly with increasing Stokes number and proposed an empirical model to predict changes in particle deposition efficiency in the bend. Tian et al. 12 analysed the effect of wall roughness on the flow characteristics of particles in a 90° bend. Their results showed that wall roughness could reduce the ‘particle free zone’ and smoothed the particle number density distribution by changing the particle bounce behaviour. Guo et al. 13 investigated the gas-solid two-phase flow process in a 90° bend. Their results showed that with the increase of the curvature ratio, the secondary flow in the bend would become smoother, and the deposition efficiency of particles on the inner wall of the duct would decrease with the increase in the curvature ratio. Unfortunately, most of these studies have focused on duct bends with much smaller hydraulic diameters and wind speeds than typical ducts in dust collection systems. Peters and Leith 14 experimentally investigated the deposition of polydisperse glass particles in industrial dust extraction ducts with high Reynolds numbers of 203,000 and 368,000. When the Stokes number of the particles is small, the experimental results are basically consistent with the previous research conclusions in the small bend. However, for larger Stokes numbers, they found that past empirical models underestimated the effect of drag, and the experimentally obtained particles deposited less efficiently in the large bend.
Swirl is a widespread flow phenomenon in nature, which is characterized by a flow field with a significant tangential flow component, and the change in the tangential flow velocity has a decisive influence on the characteristics of the flow field.15,16 Relevant research in the field of pneumatic conveying shows that the use of swirling flow generated by swirling devices such as three-blade helical tubes and helical blades to make particles move in a spiral form can slow down the collision between particles and the wall to a certain extent and contribute to the reduction in the energy consumption.17–19 Li et al. 20 studied the key parameters of swirl pneumatic conveying and found that the axial and tangential components of the particle velocity distribute symmetrically along the radial and axial directions of the pipeline, respectively. In the process of conveying large particles of 5–15 mm, the optimum swirl number range is 0.3–0.4. Yu et al. 19 experimentally studied the migration process of micron-sized fine particles in the presence of swirling flow. The results show that both the tangential inlet and the helical blades generate swirls in the tube, prolonging the movement path of particles, and the vortex along the tube wall would reduce the collision probability between large particles. Li 21 experimentally studied the swirl transport process of micron-sized particles at 90° bends when the Reynolds numbers are about 50,000 and 100,000. The results show that a moderately strong swirl can reduce the effect of particles on the bend. Wood et al. 22 studied the effect of spiral pipe induced swirl flow on particle impact angle and impact velocity at the bend in a slurry pipeline. The results show that the swirling flow would improve the distribution of solid particles and the particle impact conditions in the bend, which could help to reduce the deposition of particles and alleviate the erosion of the wall. However, due to the complex flow field in the bend (with strong secondary flow), it is still difficult to fully elucidate the particle settling and local aggregation behaviour experimentally.
In recent years, numerical simulations based on computational fluid dynamics (CFD) methods have gradually become a powerful tool for studying particle settlement and particle-wall interactions.23–25 Arsalanloo and Abbasalizadeh 26 used the Reynolds Stress Model (RSM) and the Lagrangian method to study the deposition and infiltration of particles in a 90° bend with a small diameter of 8.51 mm in the presence of swirling flow. The results show that both decreasing the swirl pitch and increasing the blade height increase the swirl intensity at higher Stokes numbers, while higher swirl intensity could reduce the particle deposition rate. Based on the two-way coupled Eulerian-Lagrangian method, Zhou et al. 27 conducted a numerical simulation study on the gas-solid two-phase flow in the bend. They found that the spiralling motion of the particles may be encouraged by the swirling flow, which would disturb the particle-wall collision patterns and weaken the collision strength. Zhou et al. 28 established a small diameter pipe simulation model with a twisted tape inserted upstream of the elbow and studied the mechanism of swirling flow to slow down the erosion of the bend. They found that the particles were suspended and more evenly distributed in the pipe due to the swirl imparted by the twisted tape, which reduced the focussing and impact frequency of the particles at the same location on the wall of the bend.
The above results show that the use of swirling flow can help reduce particle deposition on the wall. However, the data obtained from small diameter bends are not yet sufficient to fully explain particle behaviour in industrial bends with high Reynolds numbers, and existing empirical models may underestimate the effect of drag. This article aims to explore the effect of swirl on particle transport and deposition behaviour in large diameter industrial bends. The RSM turbulence model and Discrete Phase Model (DPM) were used to predict the deposition efficiency of particles at bends. Using a user-defined function (UDF), the swirling device was defined as a velocity inlet with different tangential flow components to generate different inlet swirl intensities. Drag, inertial forces and secondary flow were considered in the study. The effects of Stokes number (St), swirl number (S n ), pressure coefficient (C P ) and turbulence intensity (I) on particle deposition are discussed in this paper. The conclusions of this research are helpful for the optimal design of ventilation and dust removal systems in industrial workshops.
Simulation method
Airflow model
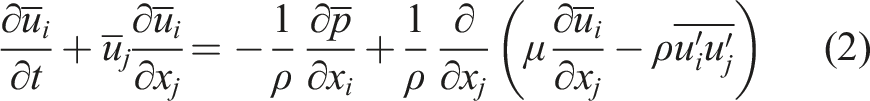
The air in the industrial ducts can be defined as a stable, isothermal, continuous and incompressible fluid. Since the anisotropy of turbulent flow is considered in the research, the continuity equation and momentum conservation equation for the mean motion of the particles are by equations (1) and (2), as follows:29,30
Continuity equation:
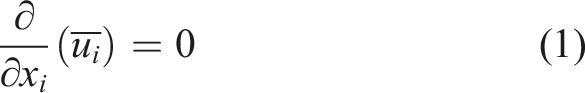
Momentum conservation equation:
In numerical simulations, when curvature, rotation and other additional strain effects are present, the Reynolds Stress Model (RSM) has been shown to provide more accurate predictions of particle deposition than other models because it takes into account the anisotropy of turbulent flow.
31
The Reynolds stress transport equation is expressed as equation (3):2,32

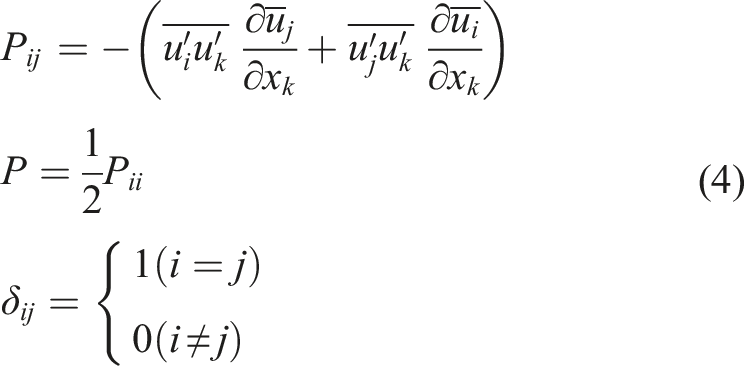
The production term is given as equation (4):
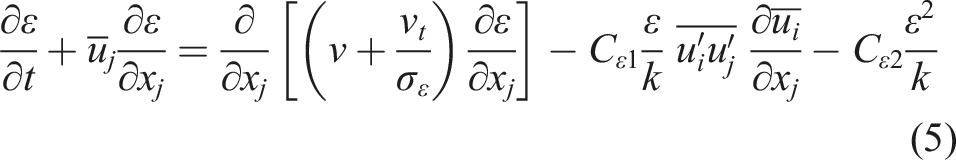
Turbulent dissipation rate is described by equation (5):
Near-wall area treatment
In CFD simulation, considering that the near-wall region is the main source of eddy and turbulent flow, a large gradient is prone to occur when solving the relevant variables. In order to obtain accurate flow field information near the duct wall, it is necessary to adopt a finer meshing scheme for the boundary layer near the wall region. The Wall Functions and the Enhanced Wall Treatment (EWT) are common approaches for the near-wall processing in the ANSYS FLUENT. 33 ‘Wall Functions’ does not need to solve the viscous sublayer and transition layer, and the computational cost is low, but it is not suitable for the turbulent near-wall region under large pressure gradients and curved streamlines. 10 EWT combines a two-layer model with enhanced wall functions, which allows it to accurately capture boundary layer turbulence, but requires a finer meshing. 34 Since the flow parameters near the wall in this work directly affect the deposition rate, EWT is considered to avoid the defects of the ‘Wall Functions’ and improve the solution accuracy.
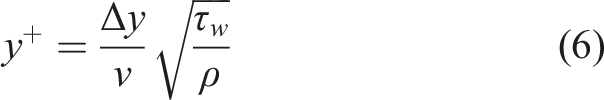
The dimensionless wall distance y
+
was used in this research to evaluate the mesh resolution requirements for each method, which is defined by equation (6):13,35
Aerosol transport model
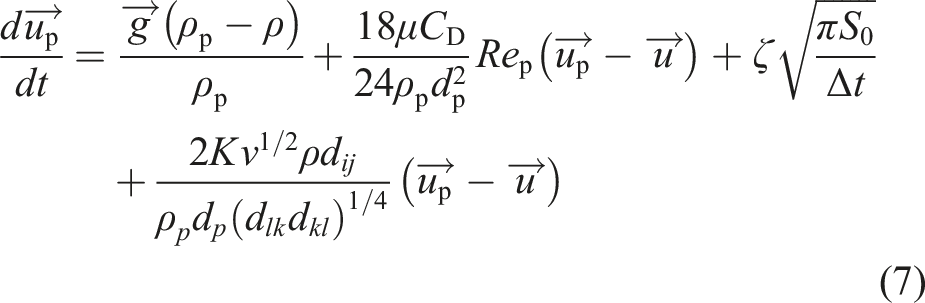
Integrate the force balance equation according to Newton's second law of motion to obtain the particle's trajectory. Therefore, the force balance for a single particle can be described by equation (7):2,36,37
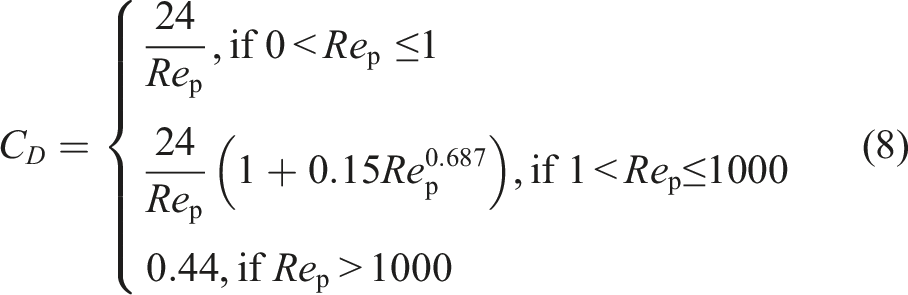
The drag coefficient CD is related to the Reynolds number Rep of particles, and its size can be obtained by equation (8):38,39
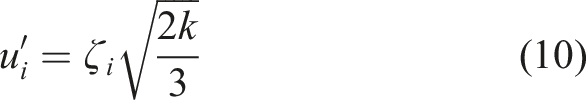
The discrete random walk model (DRW) was used to predict the particle transport behaviour caused by fluid turbulence, as given by equation (9). The model predicts the particle trajectories from the instantaneous velocity (u
i
) of the continuous phase based on the random format:

The turbulence dispersion in the process of turbulent vortex flow was sampled, and the pulse velocity was assumed to satisfy a Gaussian probability distribution. So the pulse velocity
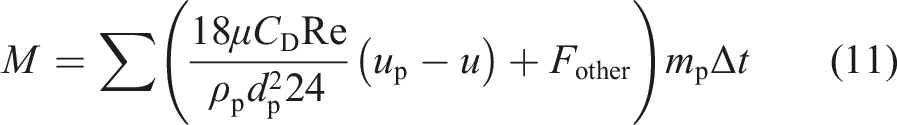
Considering the transfer of momentum between particles and airflow, the two-way coupling method was selected to solve the momentum exchange between discrete and continuous phases at each moment.40,41 The momentum exchange between two-phase flows is defined by equation (11):
Deposition efficiency
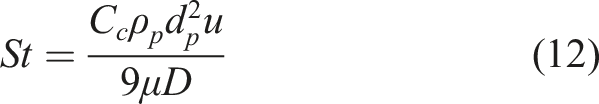
The deposition efficiency can be expressed as a function of the Stokes number. The Stokes number is a dimensionless parameter representing the response time of particles to the system, which can be expressed as equation (12):
42
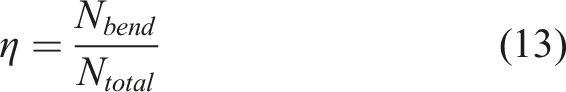
The deposition efficiency (η) of the particles was obtained in this study by dividing the mass of particles deposited on the bend wall by the total mass of particles entering the bend. Because the size and density of the particles are uniform for each injection, the number of particles was used instead of mass to obtain deposition efficiency. Finally, the deposition efficiency was determined as the ratio of the number of particles deposited on the bend wall to the total number of particles entering the bend, as given by equation (13):
13
Swirl number
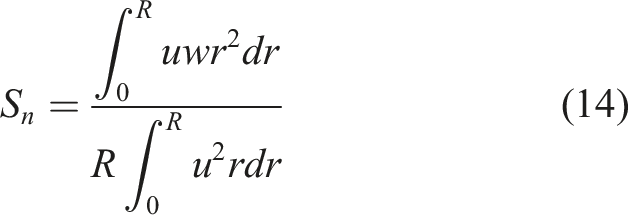
The swirl number is a crucial dimensionless parameter of swirling flow and has been widely used to indicate the swirl intensity.43–45 This research used the swirl number to show the effect of swirl on particle deposition. It is defined by equation (14) as the ratio of the axial flux of angular momentum to the axial flux of axial momentum:
26
Simulation results and analysis
Numerical details
This research used computational fluid dynamics (CFD) software, ANSYS FLUENT 2021, to predict both air motion and particle transport. Based on Figure 1, after creating geometry and calculating the computational domain, in the next step, the computational grid was established through the transformation of the model. Then, the two-way coupled Eulerian-Lagrangian approach is presented. Amongst them, the Eulerian method was used for the calculation of airflow motion, and the Lagrangian method was used for the calculation of particle trajectories. When solving the continuous phase, the second-order upwind scheme was used to achieve spatial discretization, and the coupled scheme was used for the pressure-velocity coupling. When solving the dispersed phase, the tracking schemes were automatically ordered between low-order implicit and high-order trapezoidal schemes according to the stability of the solution. Aerosol particles were injected into the computational domain in the form of parcels. Also, settings were applied for the simulation and boundary condition step. The overall numerical formulation was of the second order of accuracy. To ensure the accuracy of particle deposition predictions, the simulation results were validated with experimental data on particle deposition efficiencies obtained in bends without imposed swirling flow. Finally, the independence of the grid was checked with different mesh sizes to ensure that the grid size would not affect the simulation results. For all variables, 10−6 was set as the residual criterion for residuals' convergence. Flowchart of CFD simulation process.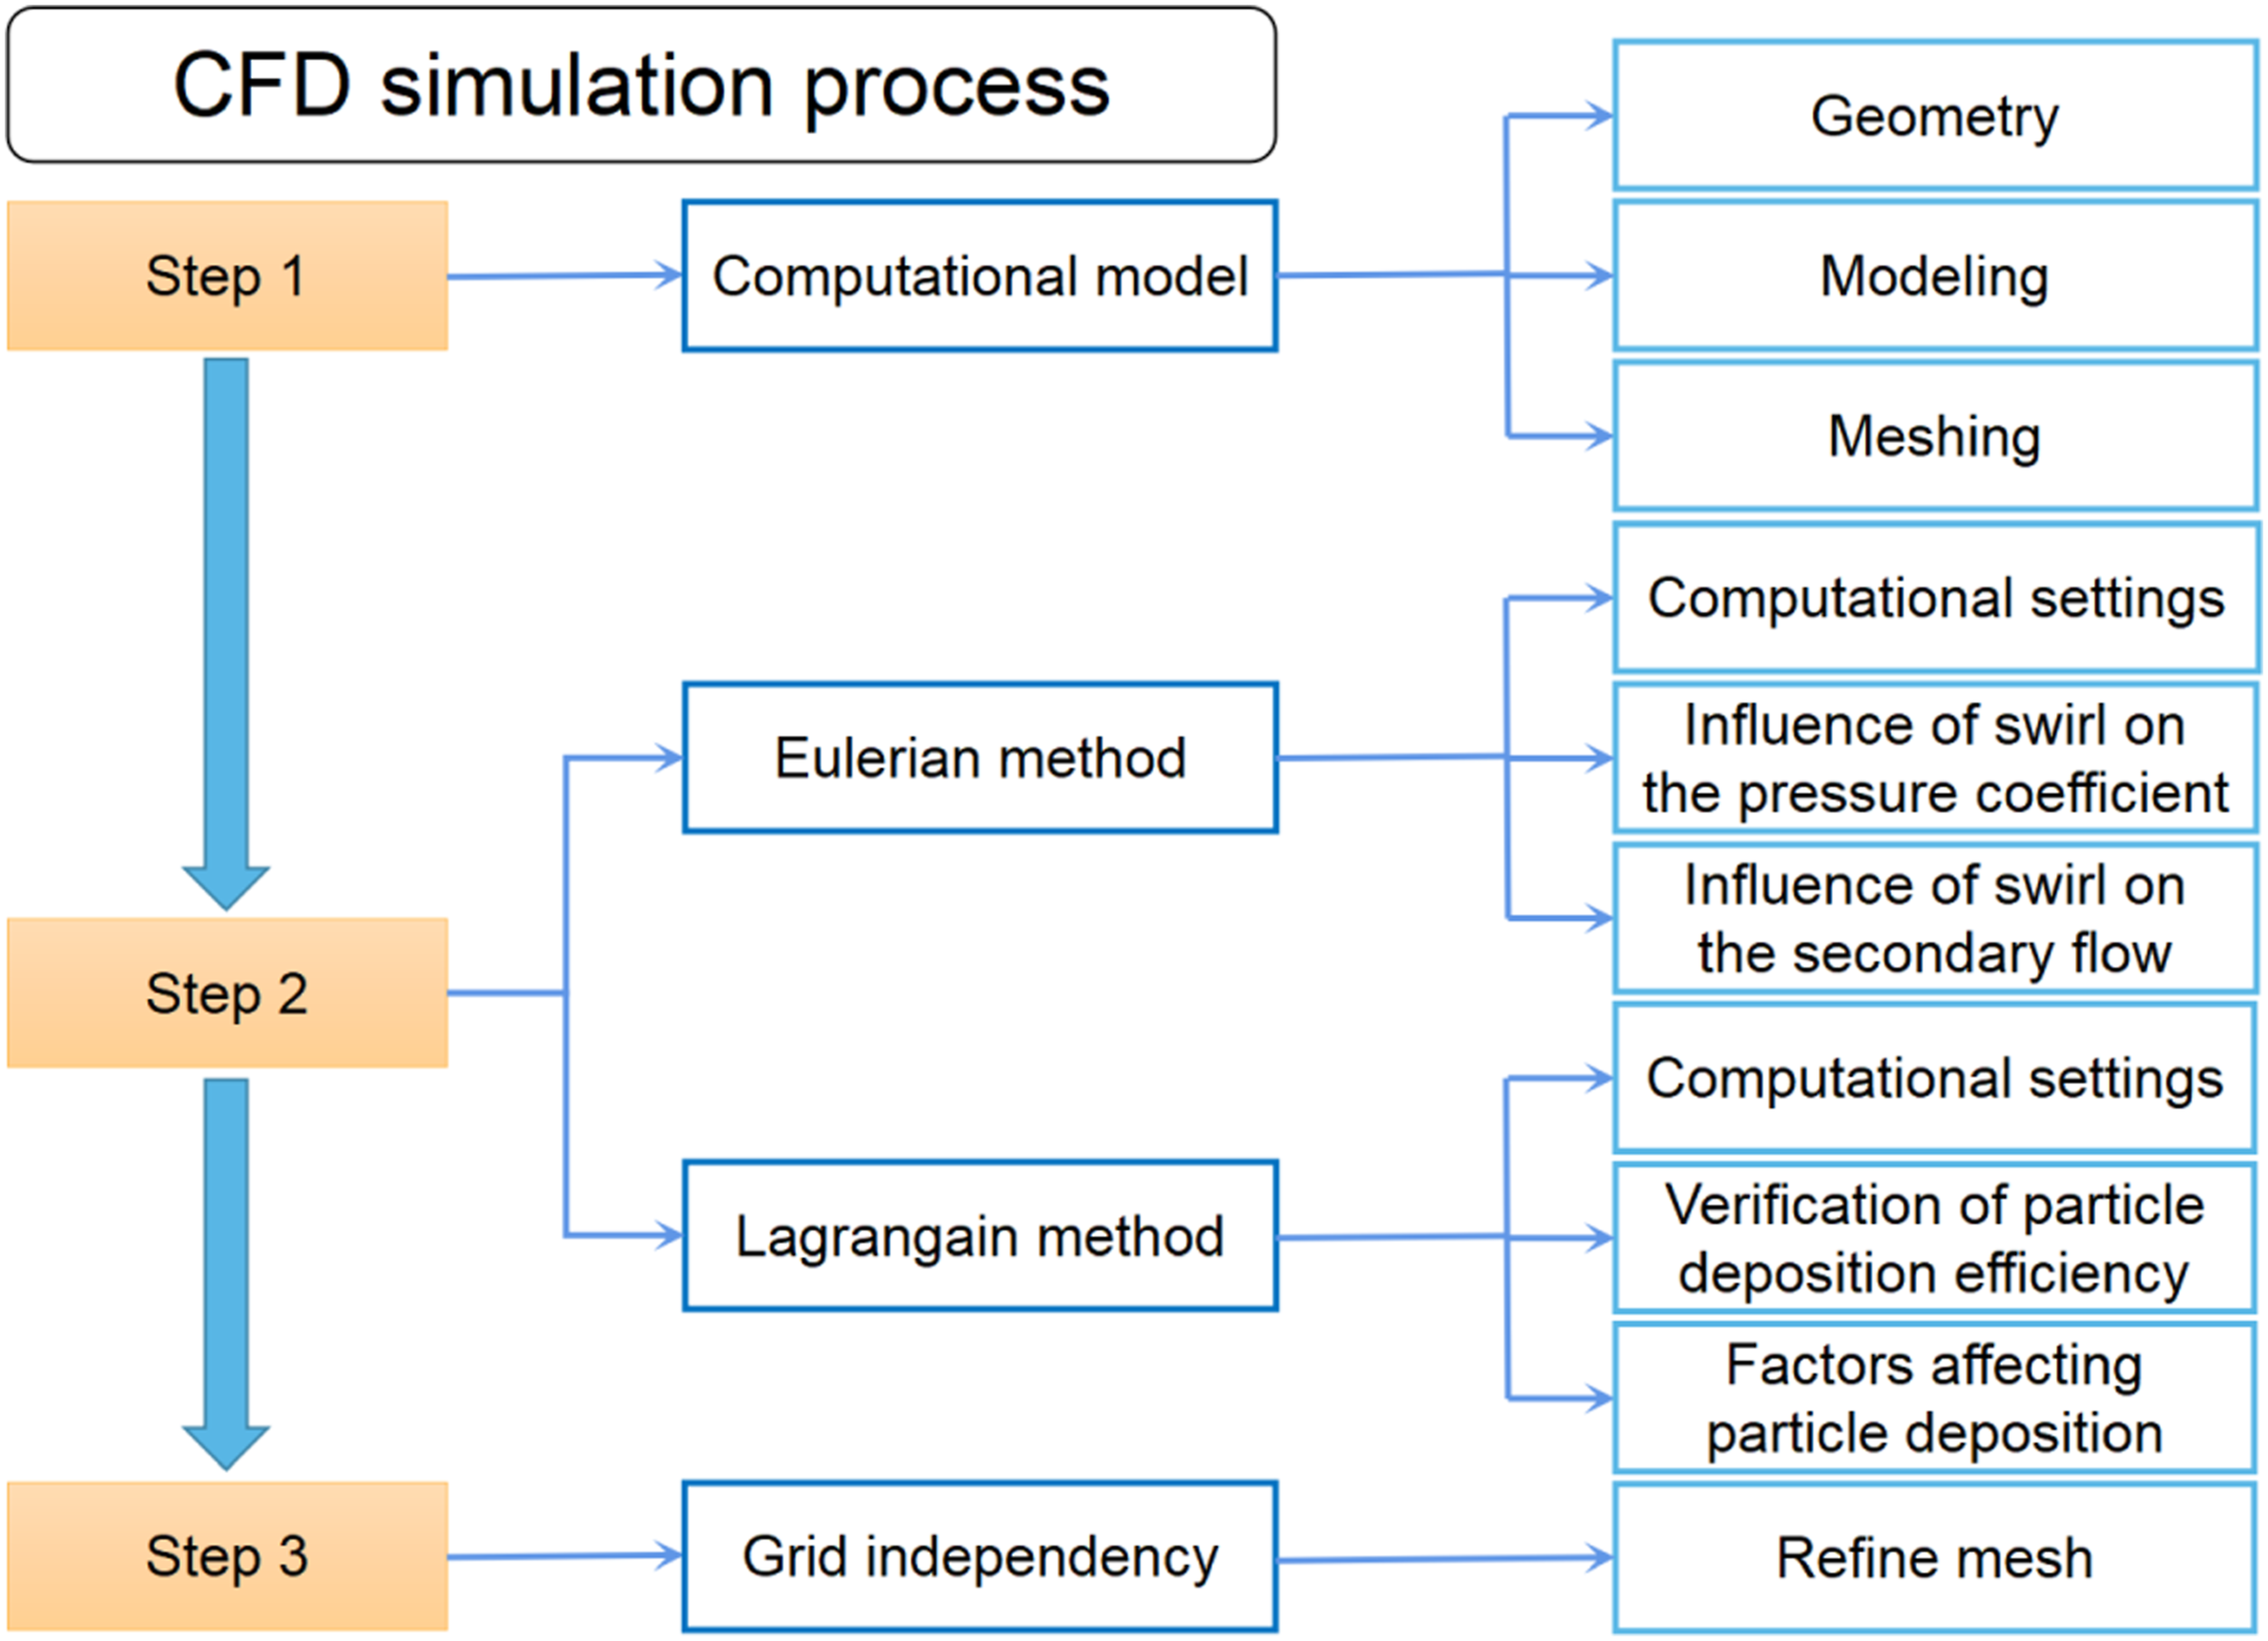
The physical model was established by the research and is shown in Figure 2. A user-defined function (UDF) of Fluent was used to simplify the swirling device into a velocity inlet with a tangential flow component. Physical model.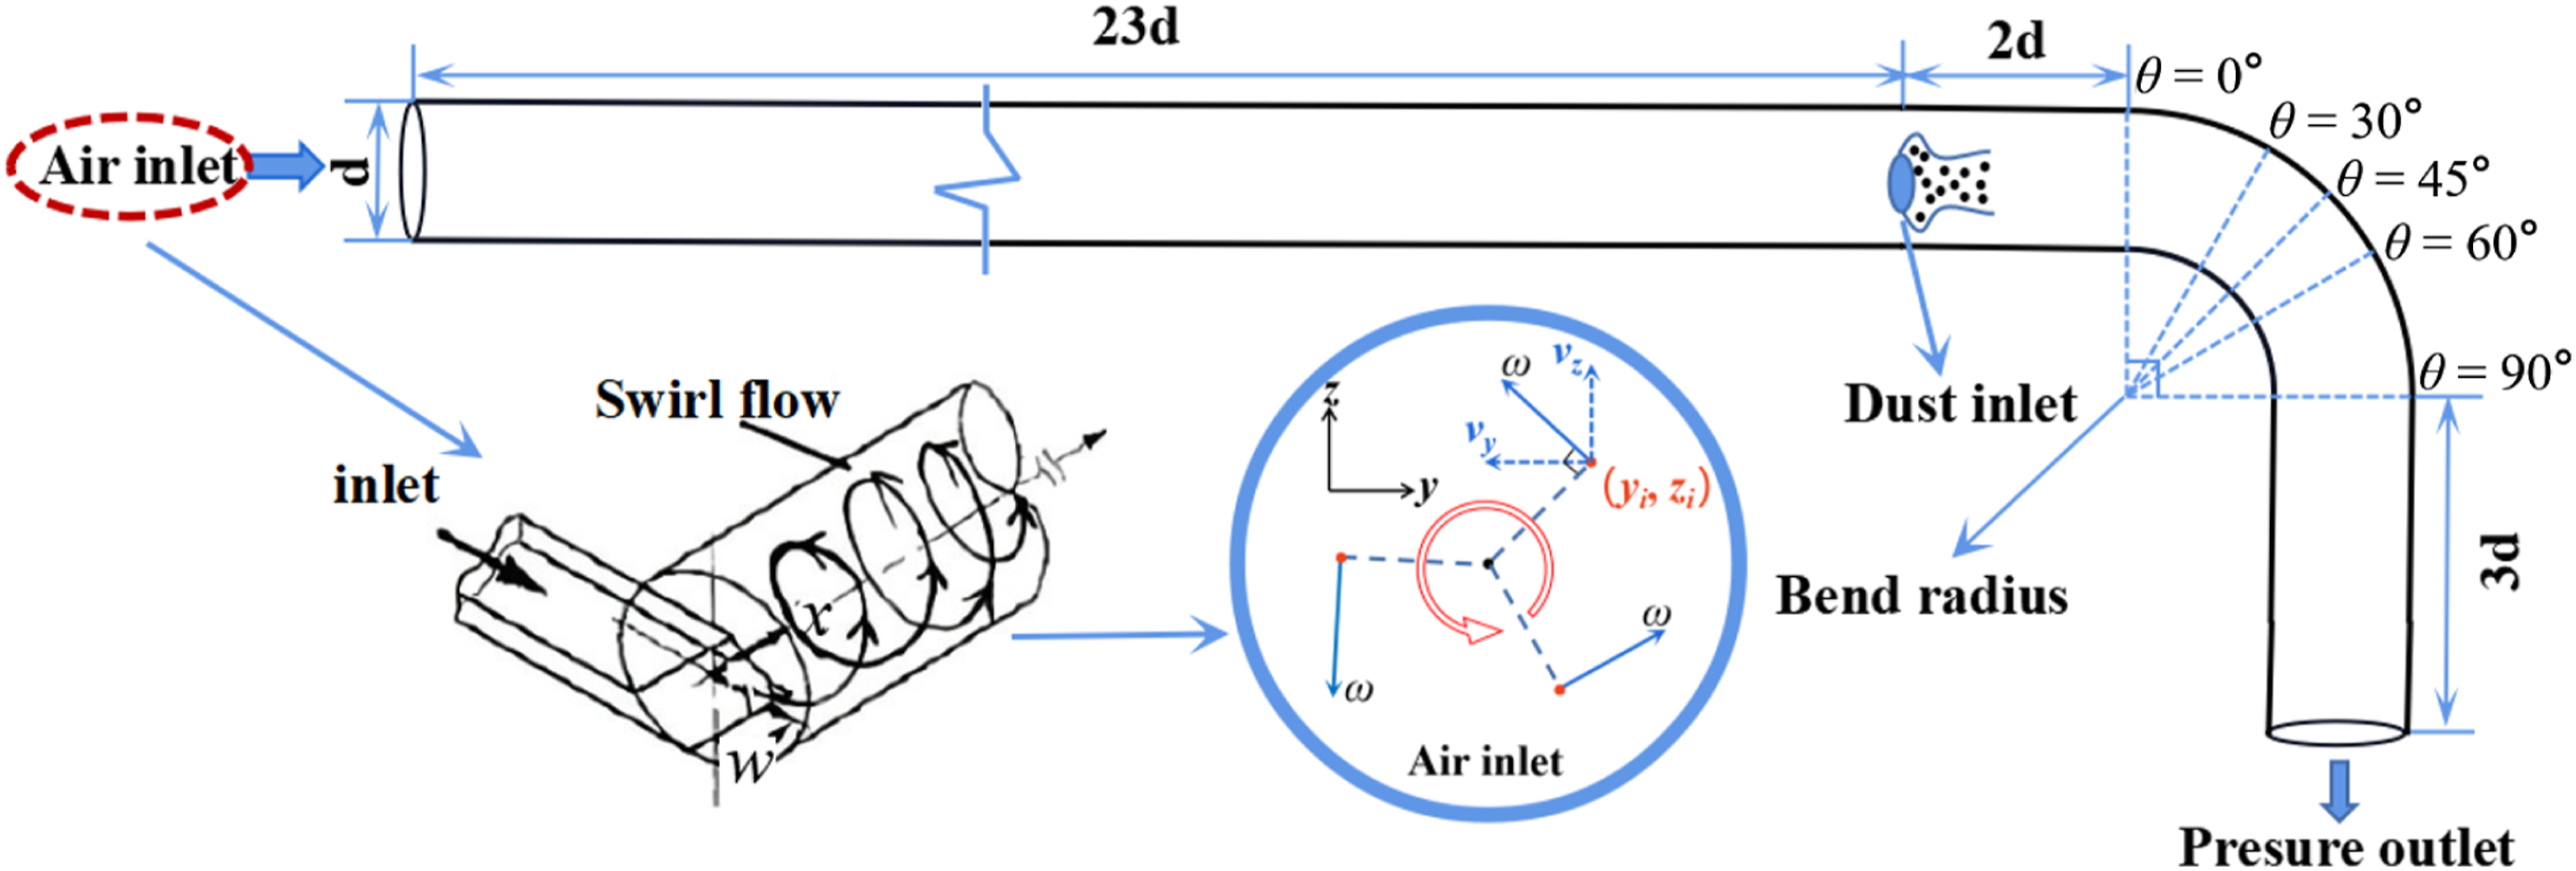
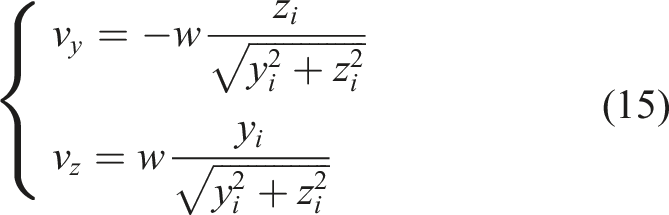
For any point (y
i
, z
i
) on the plane of the entrance, the component of its tangential velocity is expressed as equation (15):
Mesh independence verification
In this research, the fluid domain was discretized using the ANSYS Workbench 2021 meshing module. Figure 3 shows the meshing of the inlet, outlet and bend section. The mesh was constructed of tetrahedron-shaped cells and used a patch conforming technique. Inflation layers were also applied near the bend wall for more accurate results. Three geometries with 976,916, 1,322,729 and 1,899,266 cells were created for mesh independence studies to ensure the maximum validity of grids generated. The grids of numerical simulation domain.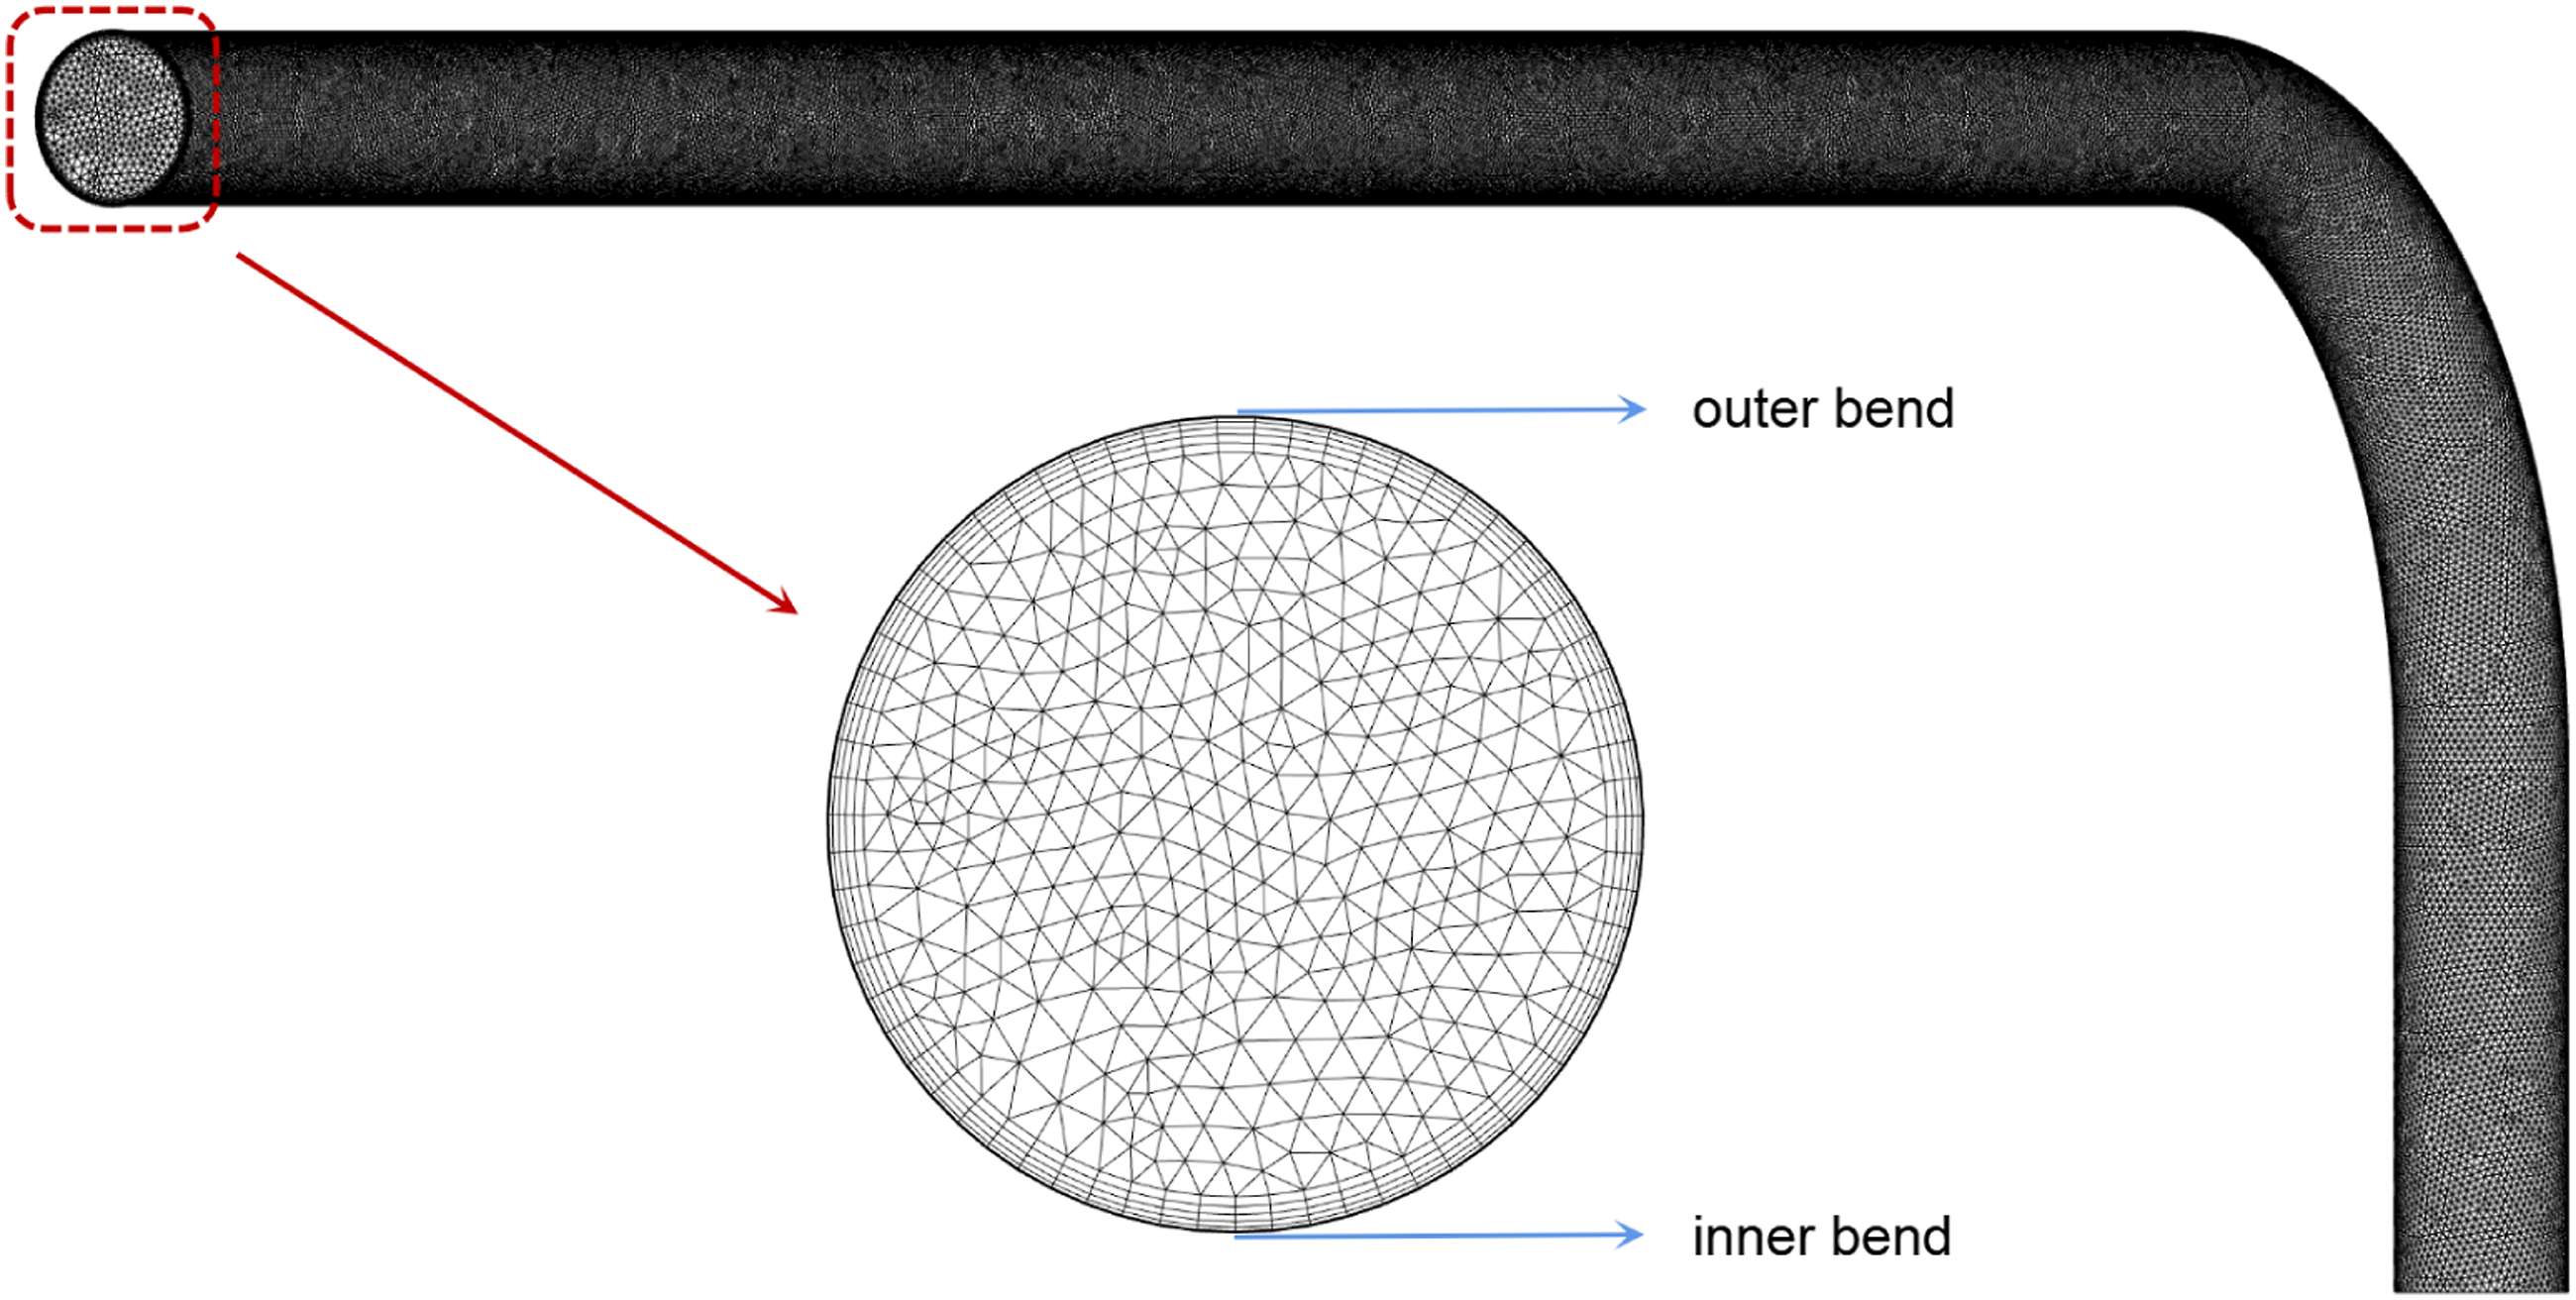
For fully developed turbulence in the bend, the convergence of the mesh was investigated using the velocity distribution at the outlet of the bend, where x is the vertical distance from the inner bend. Figure 4 shows that the velocity profile gradually slopes towards the outer bend due to the centrifugal force exerted on the fluid. The fluid transported to the outer bend was transported to the inner bend under the influence of the secondary flow, and another peak with a smaller amplitude was formed near the inner bend. When the cell numbers were 1,322,729 and 1,899,266, the predicted values of velocity magnitude were relatively close. A significant deviation occurred when the cell numbers was decreased to 976,916. Considering the simulation accuracy and time cost, a mesh in the domain of 1,322,729 cells was finally selected for future calculations. The minimum and maximum cell volumes were in the domain of 6.8233 × 10⁻⁹ m3 and 6.8856 × 10⁻⁷ m3. The maximum skewness of the grid was 0.83. Grid independence verification.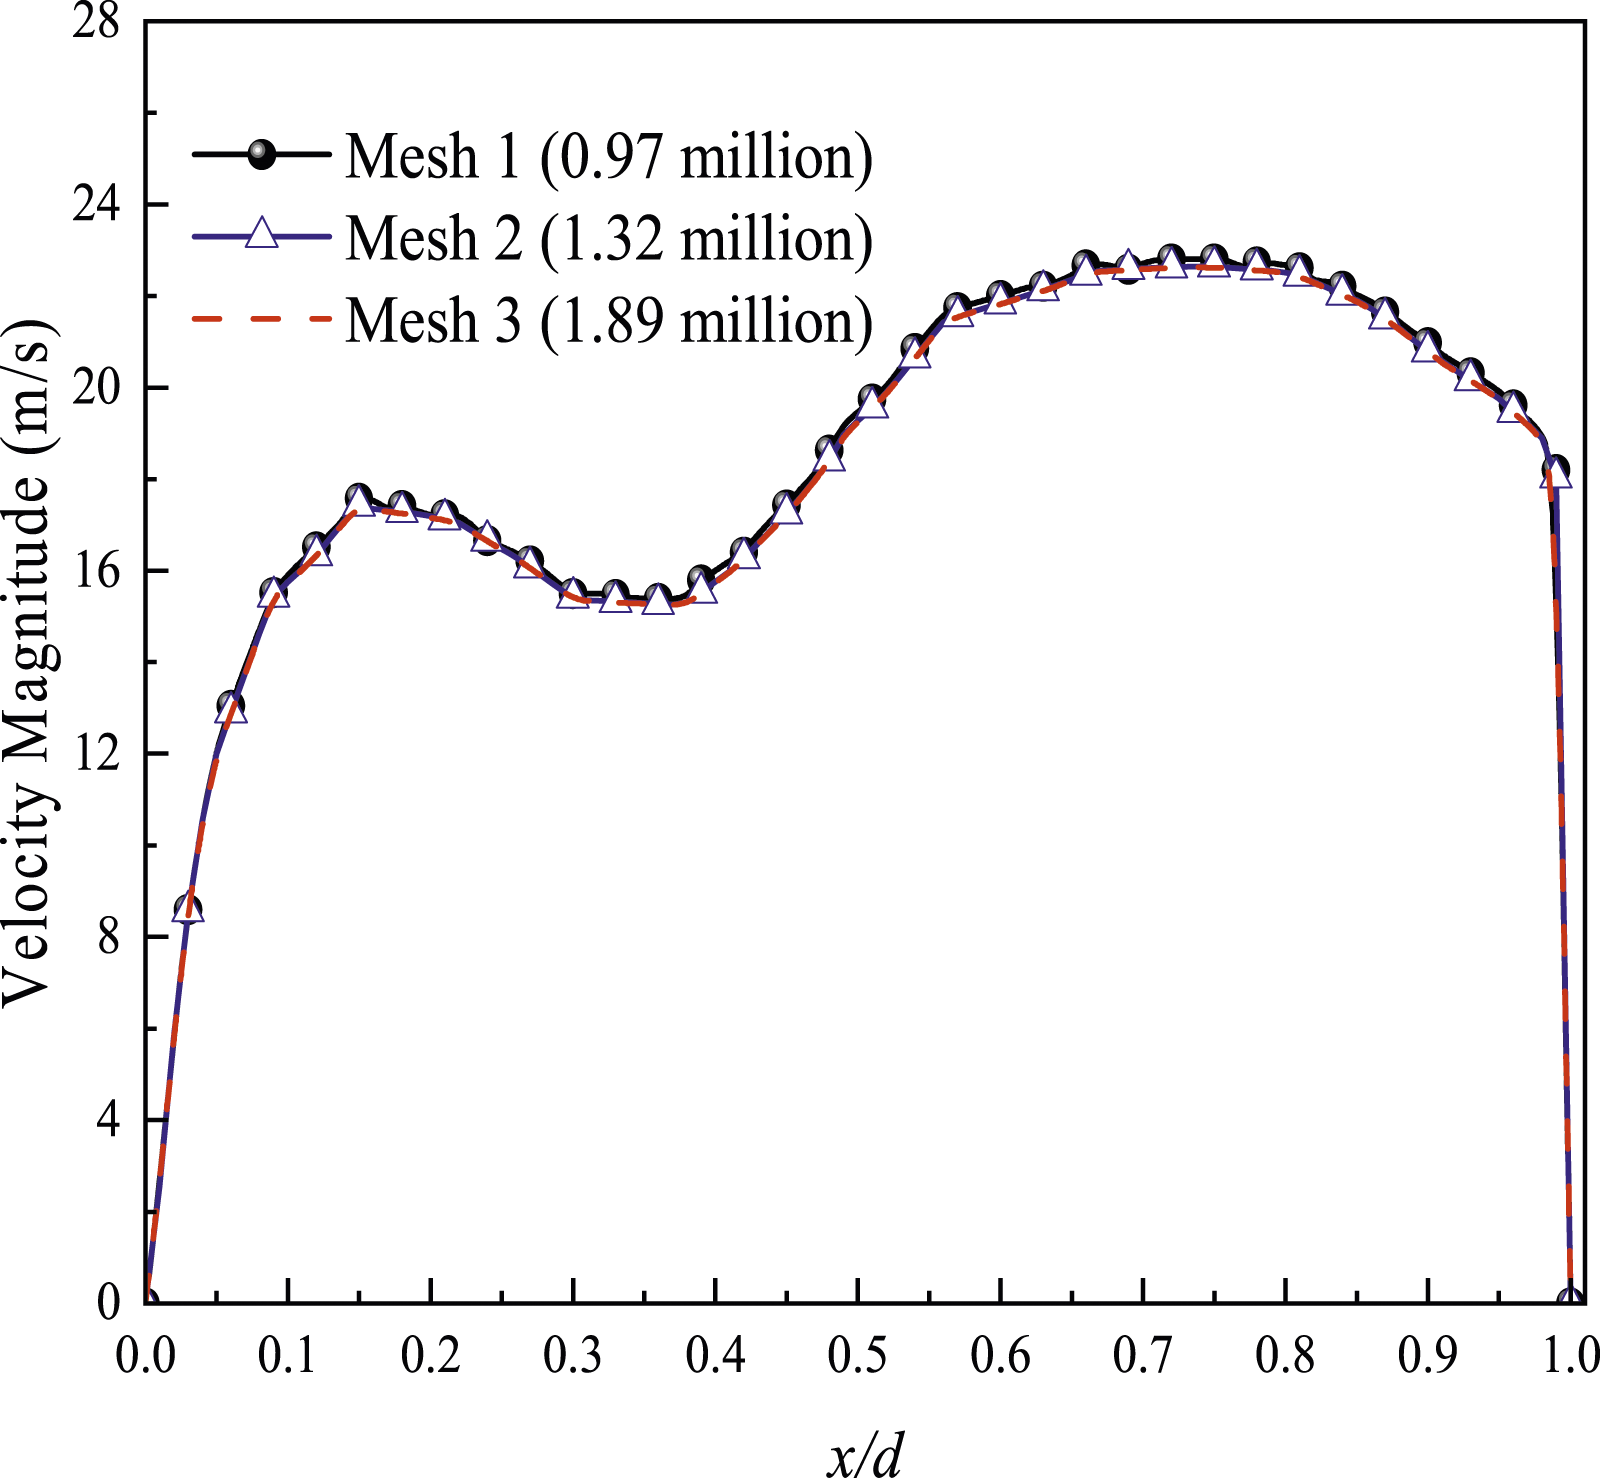
Reliability verification of simulation
In order to ensure the reliability of the simulation method, the experimental results of Pui et al.
11
in a small diameter bend and the experimental data obtained by Peters and Leith
14
in a large diameter industrial bend were used to verify the particle deposition model when no swirl was imposed where the fitted curve of Pui et al.
11
expresses the particle deposition efficiency as a function of the particle Stokes number, as shown in equation (16):
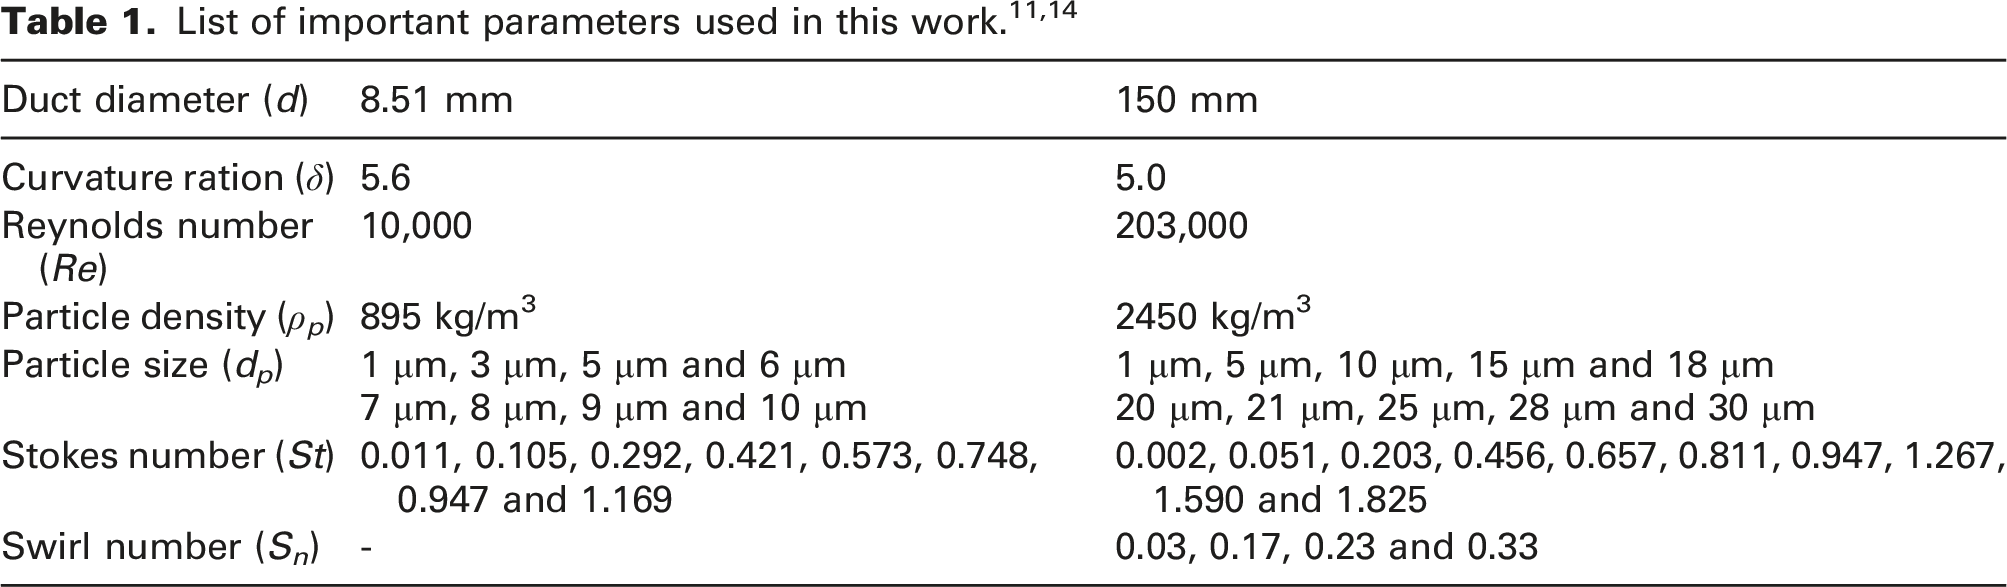
Pui et al. 11 experimentally obtained the deposition efficiency of a monodisperse liquid aerosol in a 90° circular bend with Re = 10,000, curvature ratio δ = 5.6 and a hydraulic diameter of 8.51 mm. Peters and Leith 14 experimentally analysed the variation of deposition efficiency of glass particles with different particle sizes in an industrial bend with a hydraulic diameter of 150 mm when Re = 203,000. In the experiments, they prevented the particles from bouncing off the wall by smearing grease on inner wall of the bend.
In the verification process, the physical models of these two different diameters of bends were established, respectively. The detailed parameter settings such as hydraulic diameter, curvature ratio, turbulence state and particle information are shown in Table 1. As mentioned earlier, a straight duct of sufficient length was provided before bending to ensure that turbulence was fully developed in the duct. The boundary condition for the discrete phase on the bend wall was set to ‘trap’ so that as soon as the particle touched the wall, the particle would immediately attach to the wall to provide the same state as in the experiment. This boundary condition was also used in the next section to further consider the impact of swirling intensity on particle deposition. Due to this assumption ignoring the possibility of secondary suspension of particles caused by airflow after particle deposition, the current setting was more suitable for situations where the wall has a certain viscosity, the inner wall was humid or the surface of the particles was liquid, making it difficult for the particles to rebound. Amongst them, the particle Reynolds numbers Re p in the small diameter bend ranged from 1.2 to 11.6, and those in the large diameter bend ranged from 1.4 to 40.5.
The variation trend of particle deposition efficiency with Stokes number is shown in Figure 5. The simulation results obtained in the bend model with small hydraulic diameter and moderate turbulence intensity are in good agreement with the experimental data of Pui et al.,
11
with a maximum deviation of 2.51%. For large diameter, high Reynolds number industrial bend, when the Stokes number was small (St < 0.25), particles with less inertia follow fluid motion closely, including secondary flows. These particles adjusted their direction of motion in time when they encountered obstacles, and the simulation results were basically consistent with the data obtained in the experiments of small diameter bend. When St > 0.25, the deposition efficiency obtained by experiments and simulations was gradually lower than that of a small diameter bend. This may be due to the predominance of particle inertia relative to other flow characteristics in industrial bends with high Reynolds numbers. When the particle motion was outside the Stokes zone (Re
p
> 3), the fitted curves obtained from experiments in the small diameter bend increasingly underestimated the effect of drag, leading to an overestimation of particle deposition. Although the wall was set to be completely smooth during the simulation, the actual wall has a certain roughness. For the large diameter bend, although Peters and Leith
14
smeared grease on the wall of the bend during the experiment, the particles still have a certain chance of rebounding after hitting the wall. Therefore, the deposition efficiency obtained by numerical simulation was slightly higher than the experimental value, and the maximum deviation was 2.56%. Comparison between numerical results and experimental data of particle deposition efficiency.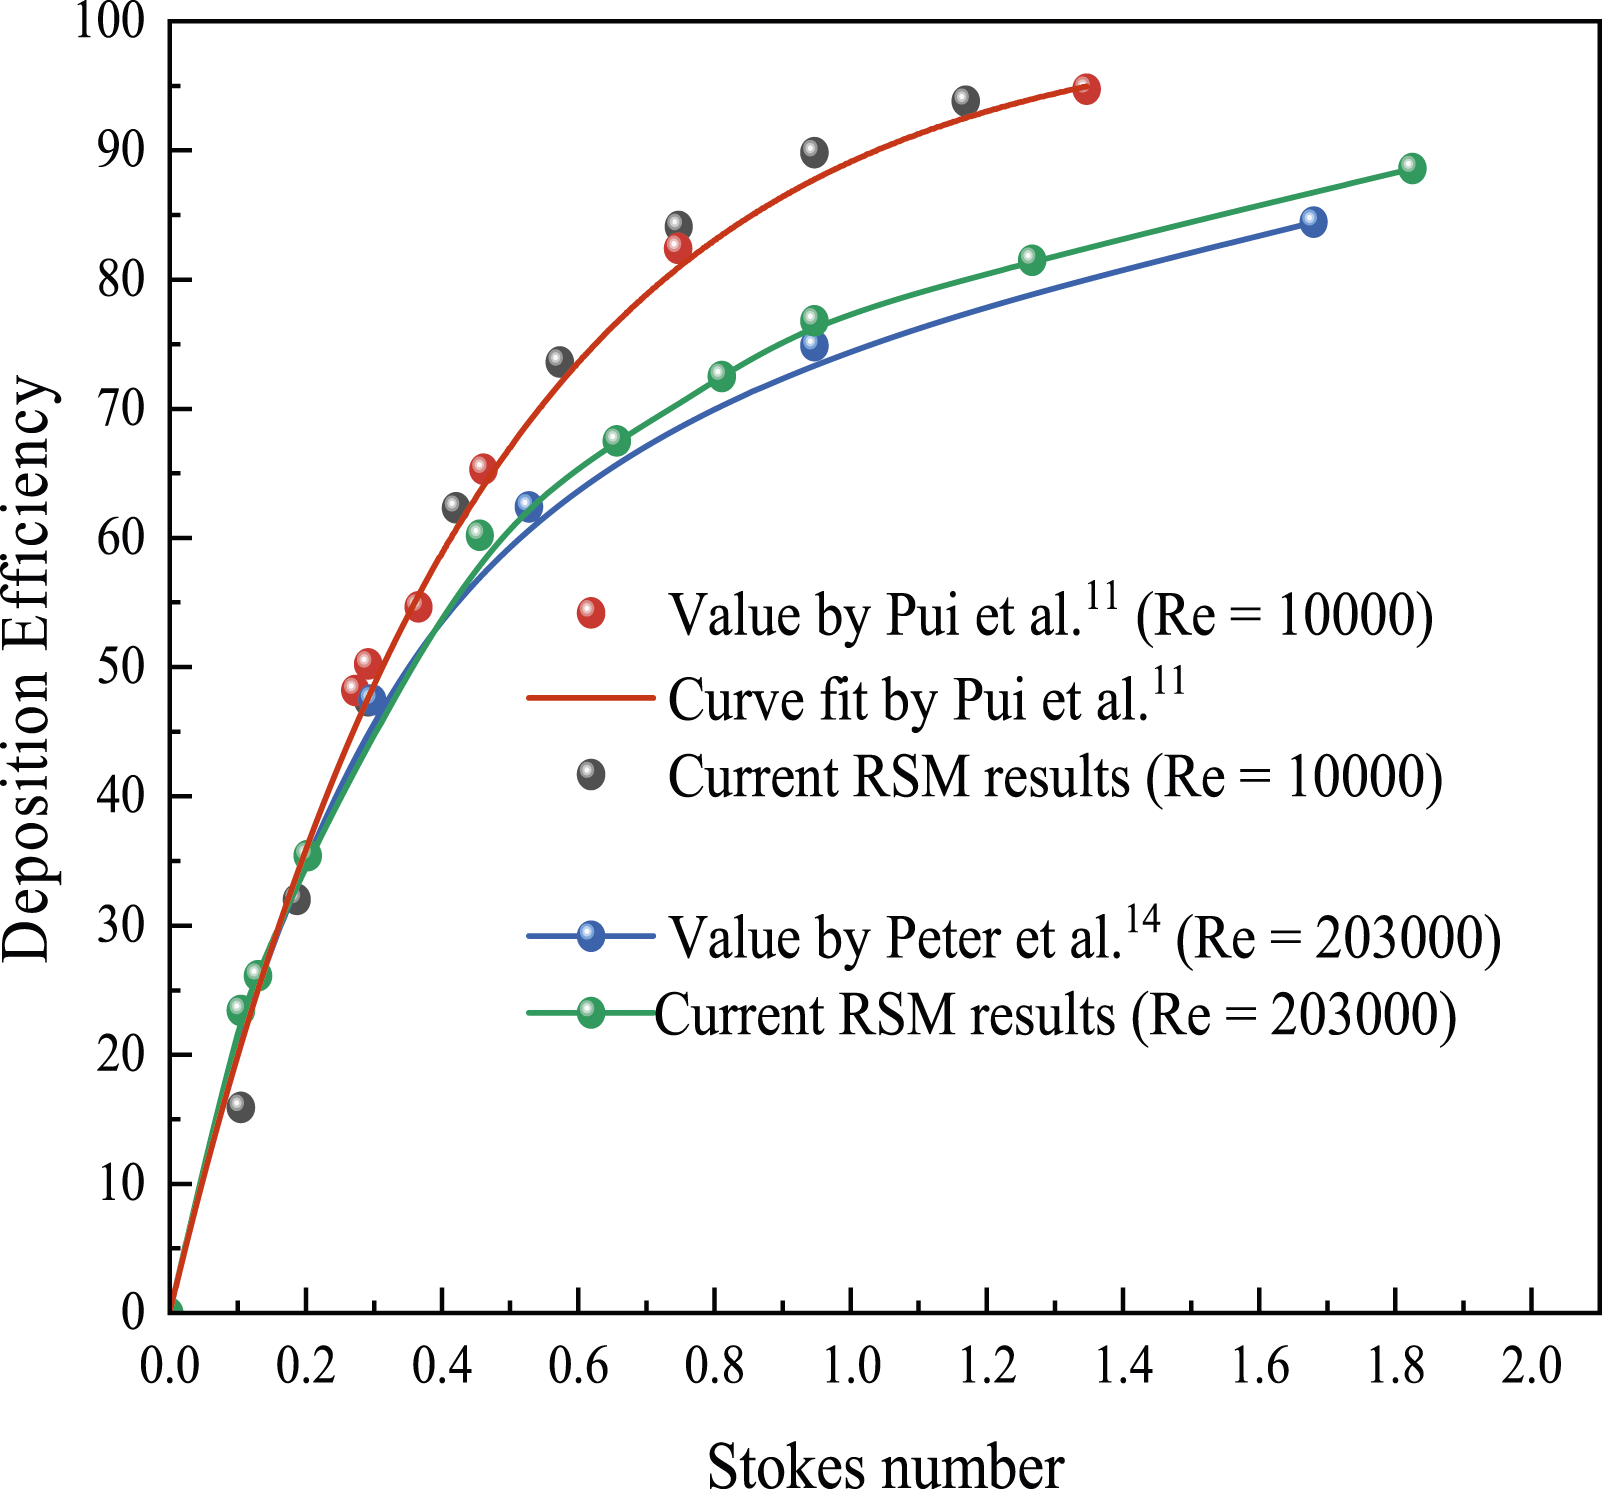
Airflow characteristics
A visualization study of the airflow in the bend was carried out in both cases without swirl and with an imposed swirl. The airflow streamline trajectories in the bend and the horizontal part of the duct are shown in Figure 6. Compared with the ordinary axial flow conveying process, under the influence of the tangential momentum, the swirl flow produced continuously intersecting spiral streamlines. Comparison of velocity streamline trajectories. (a) S
n
= 0 and (b) S
n
= 0.23.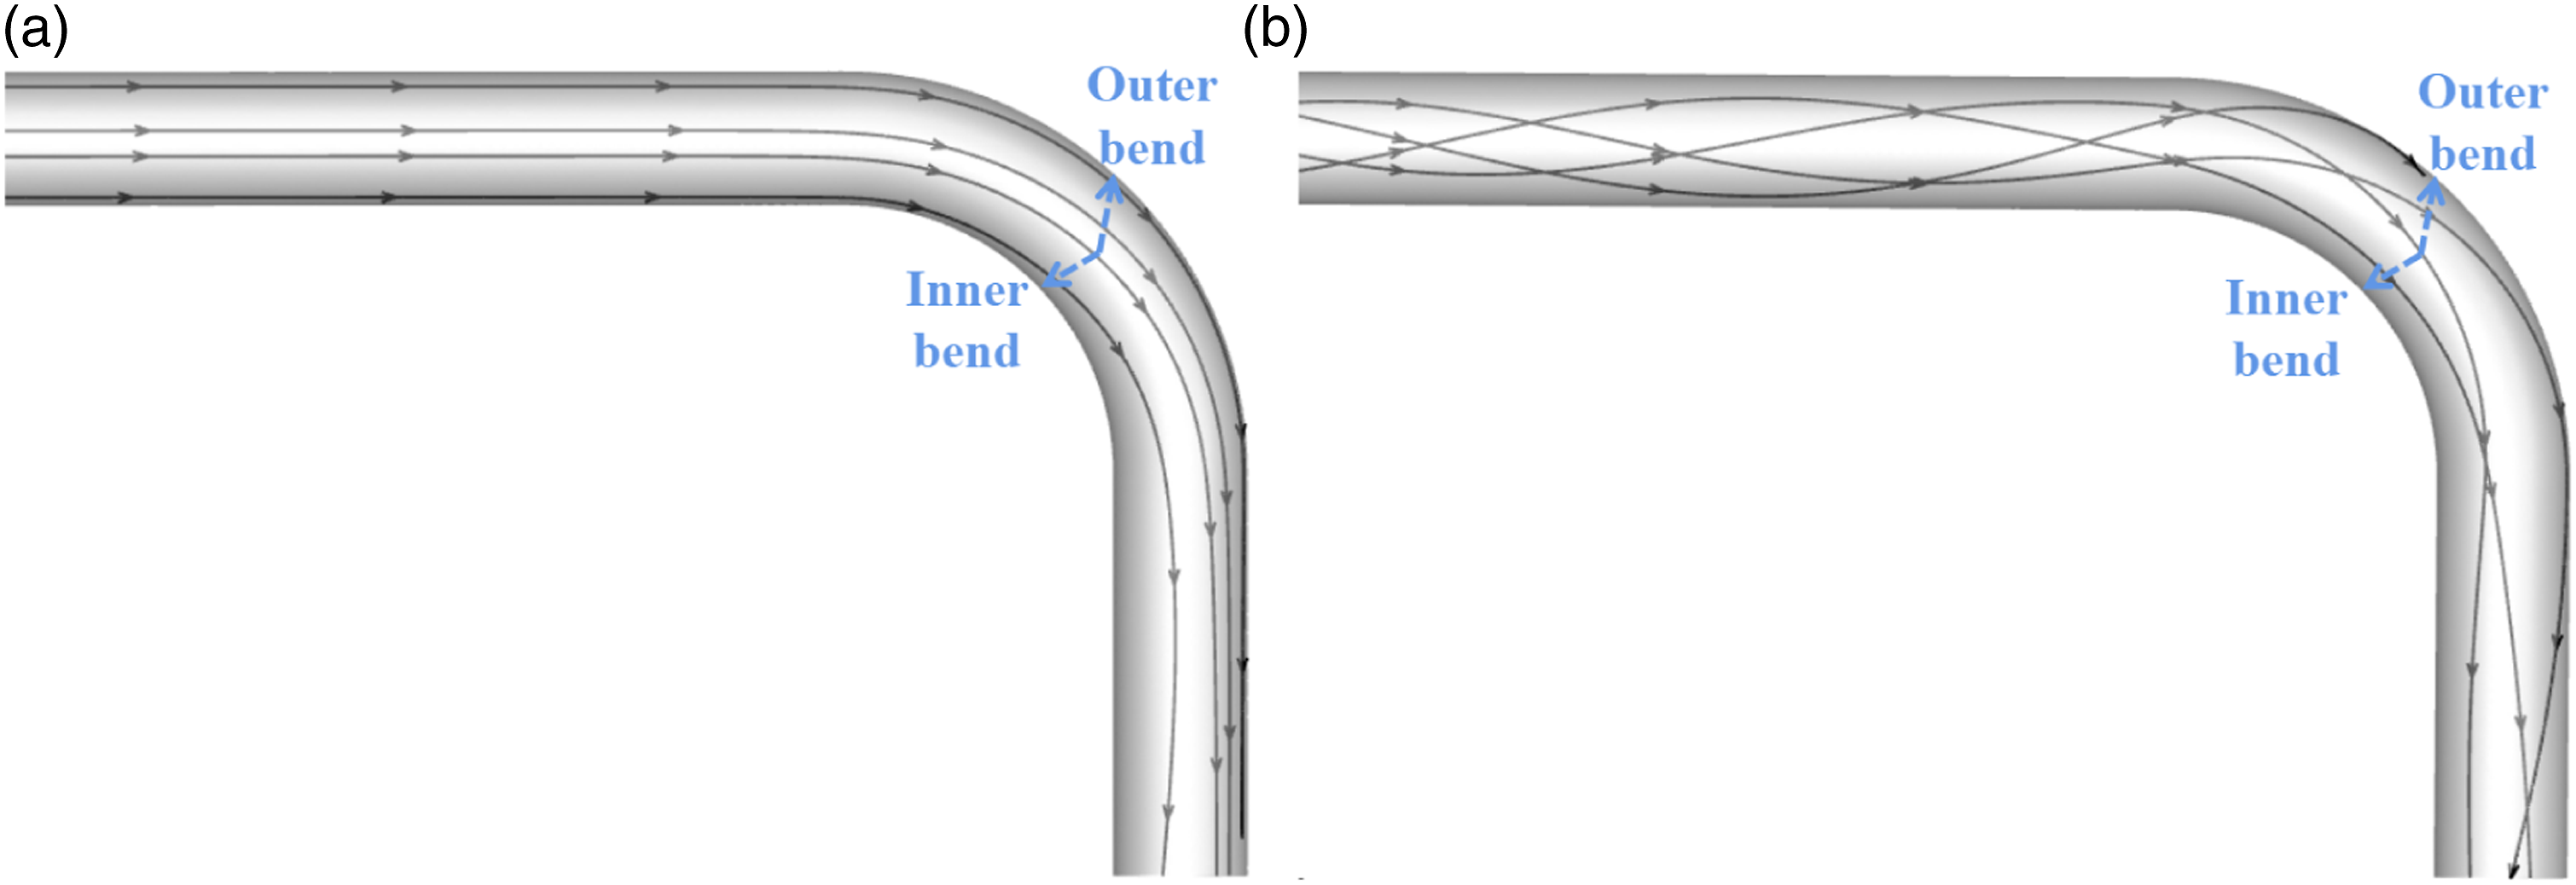
Figure 7 shows the static pressure distribution of the bend under different swirl numbers. As the fluid passed through a straight duct and was redirected into the bend, the distribution of pressure on the straight section was uniform and must be adjusted in the bend to counter the effects of centrifugal force. The numerical static pressure was greatest at the outer bend farthest from the centre of curvature, and the least at the inner bend closest to the centre of curvature. The increase in swirl intensity resulted in a gradual decrease in pressure near the inner bend and outer bend compared to normal axial flow (S
n
= 0). Static pressure distribution in the bend with different swirl numbers.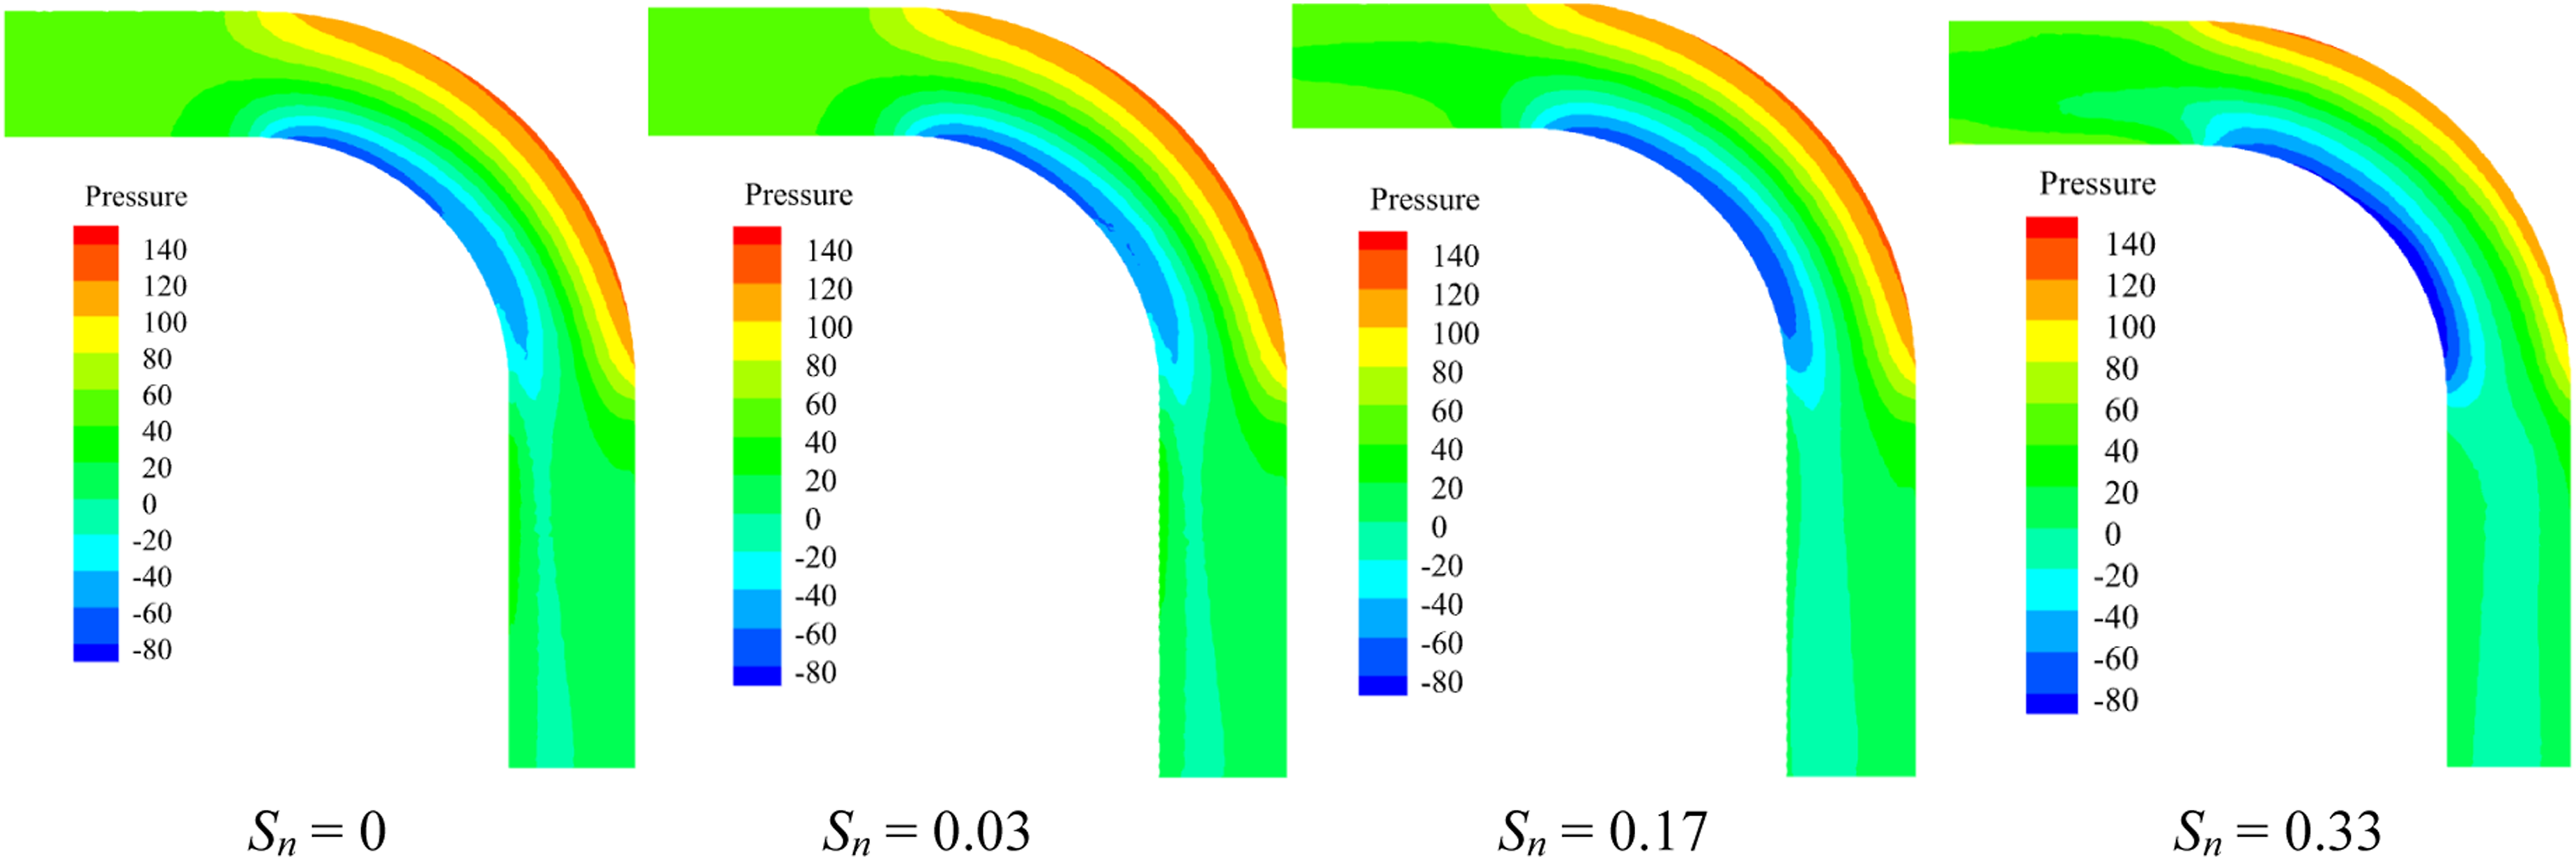
In order to further clarify the resistance change near the wall of the bend, the pressure coefficient was considered in the research, which was a dimensionless parameter used to study the relative pressure in a certain area and was defined by equation (17) as:
33
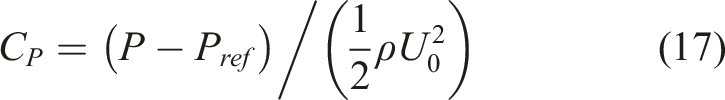
The average velocity of the airflow was 20 m/s, and the curvature ratio of the bend was 5. The variables z' and z were the longitudinal coordinates of the duct used to locate the cross section in the direction of the duct and d was the hydraulic diameter of the duct. The sections where the bending starts and ends were located at z'/d = 0 and z/d = 0, respectively. The reference pressure was taken from the cross section z' = 25d before the inlet of the bend.
At z'/d = −1, the airflow was not affected by the bend, and the pressure difference between the inner bend and outer bend was small.
46
At the bend innet, θ = 0° (z'/d = 0), the airflow was slightly accelerated near the inner bend according to the initially favourable longitudinal pressure gradient (Figure 8). At the same time, the fluid near the outer bend began to decelerate according to the initially unfavourable pressure gradient. This resulted in a secondary flow towards the inner bend over the entire cross section (Figure 10, S
n
= 0). The secondary flow has a significant impact on particle deposition behaviour. For the bend without imposed swirl, the immediate effect of the secondary flow was to move the region of the maximum velocity of the fluid from the bend centre to the outer bend (Figure 9(a)), which may make it easier for particles to concentrate around the outer bend. Variations in pressure coefficient near the inner bend and outer bend. Air velocity distribution in the bend (Re = 203,000). (a) Sn = 0 and (b) Sn = 0.17. Variations in the velocity streamline trajectory with bend deflections.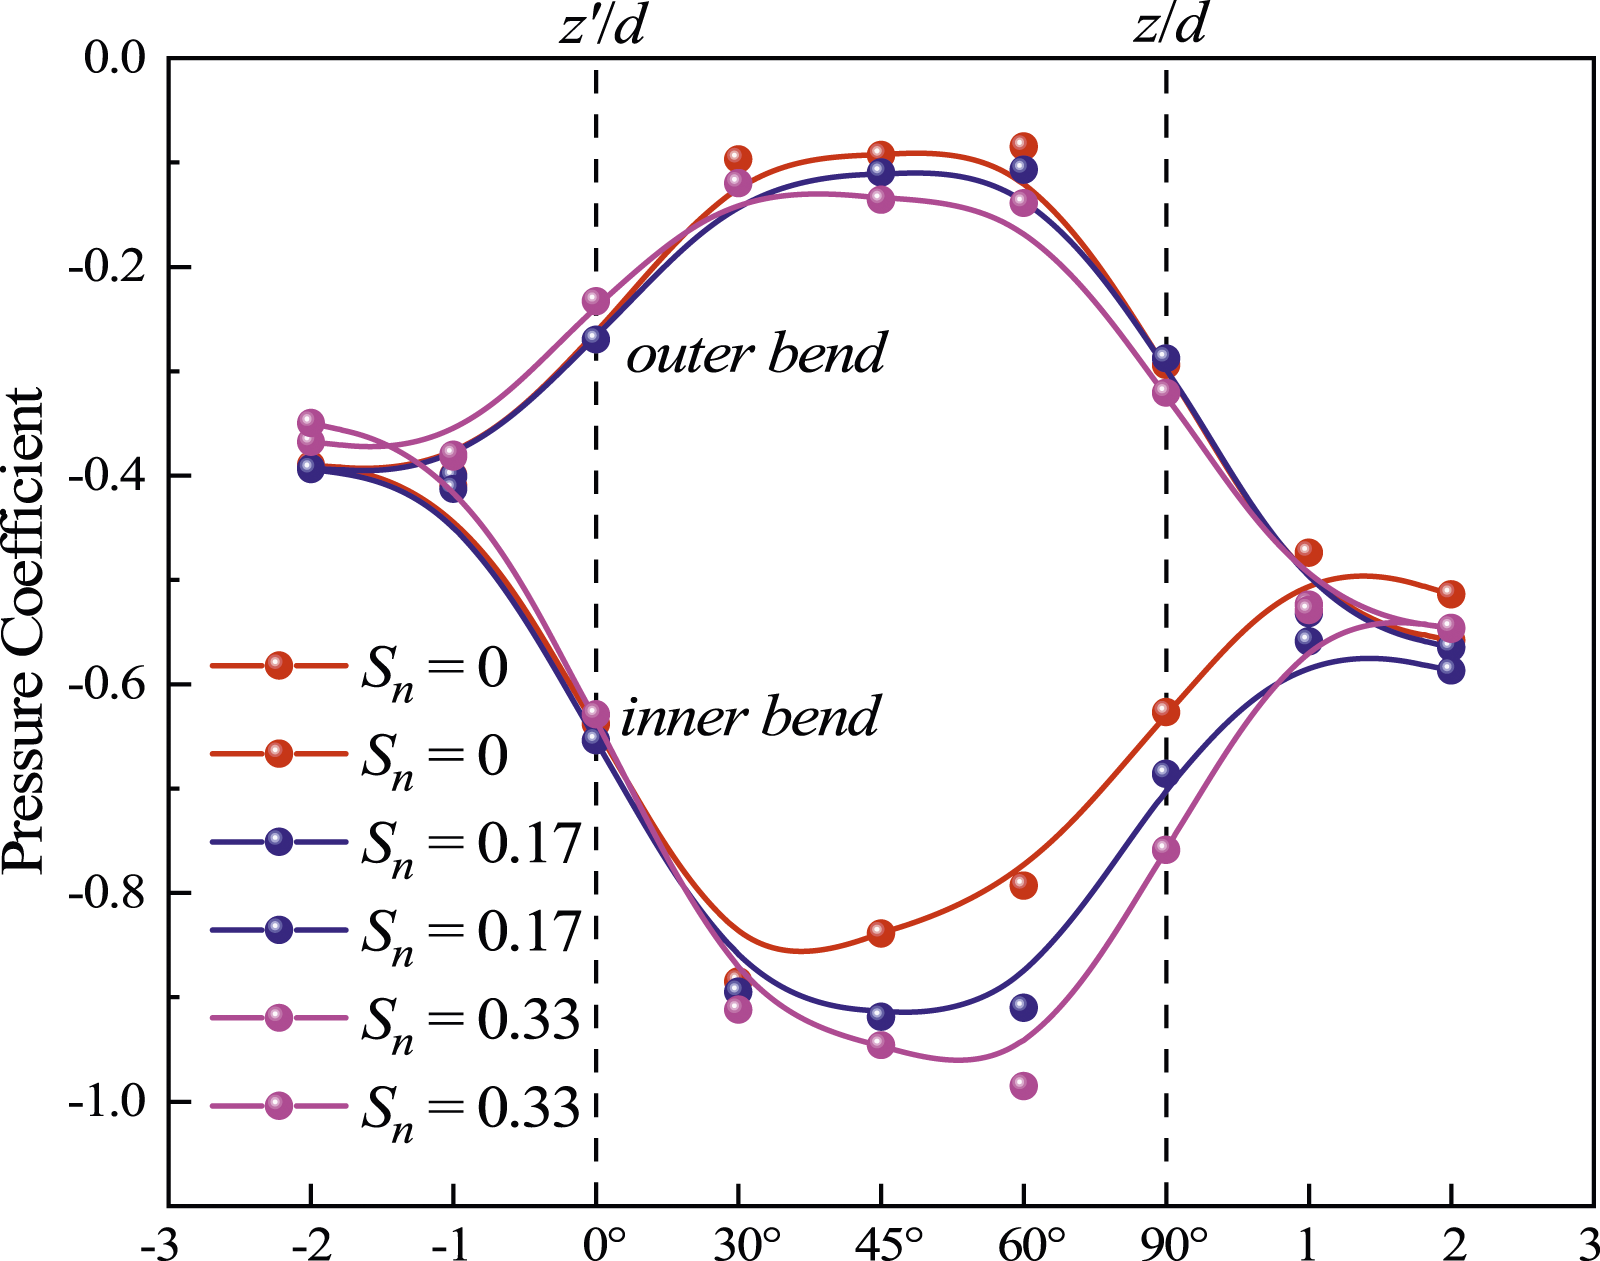
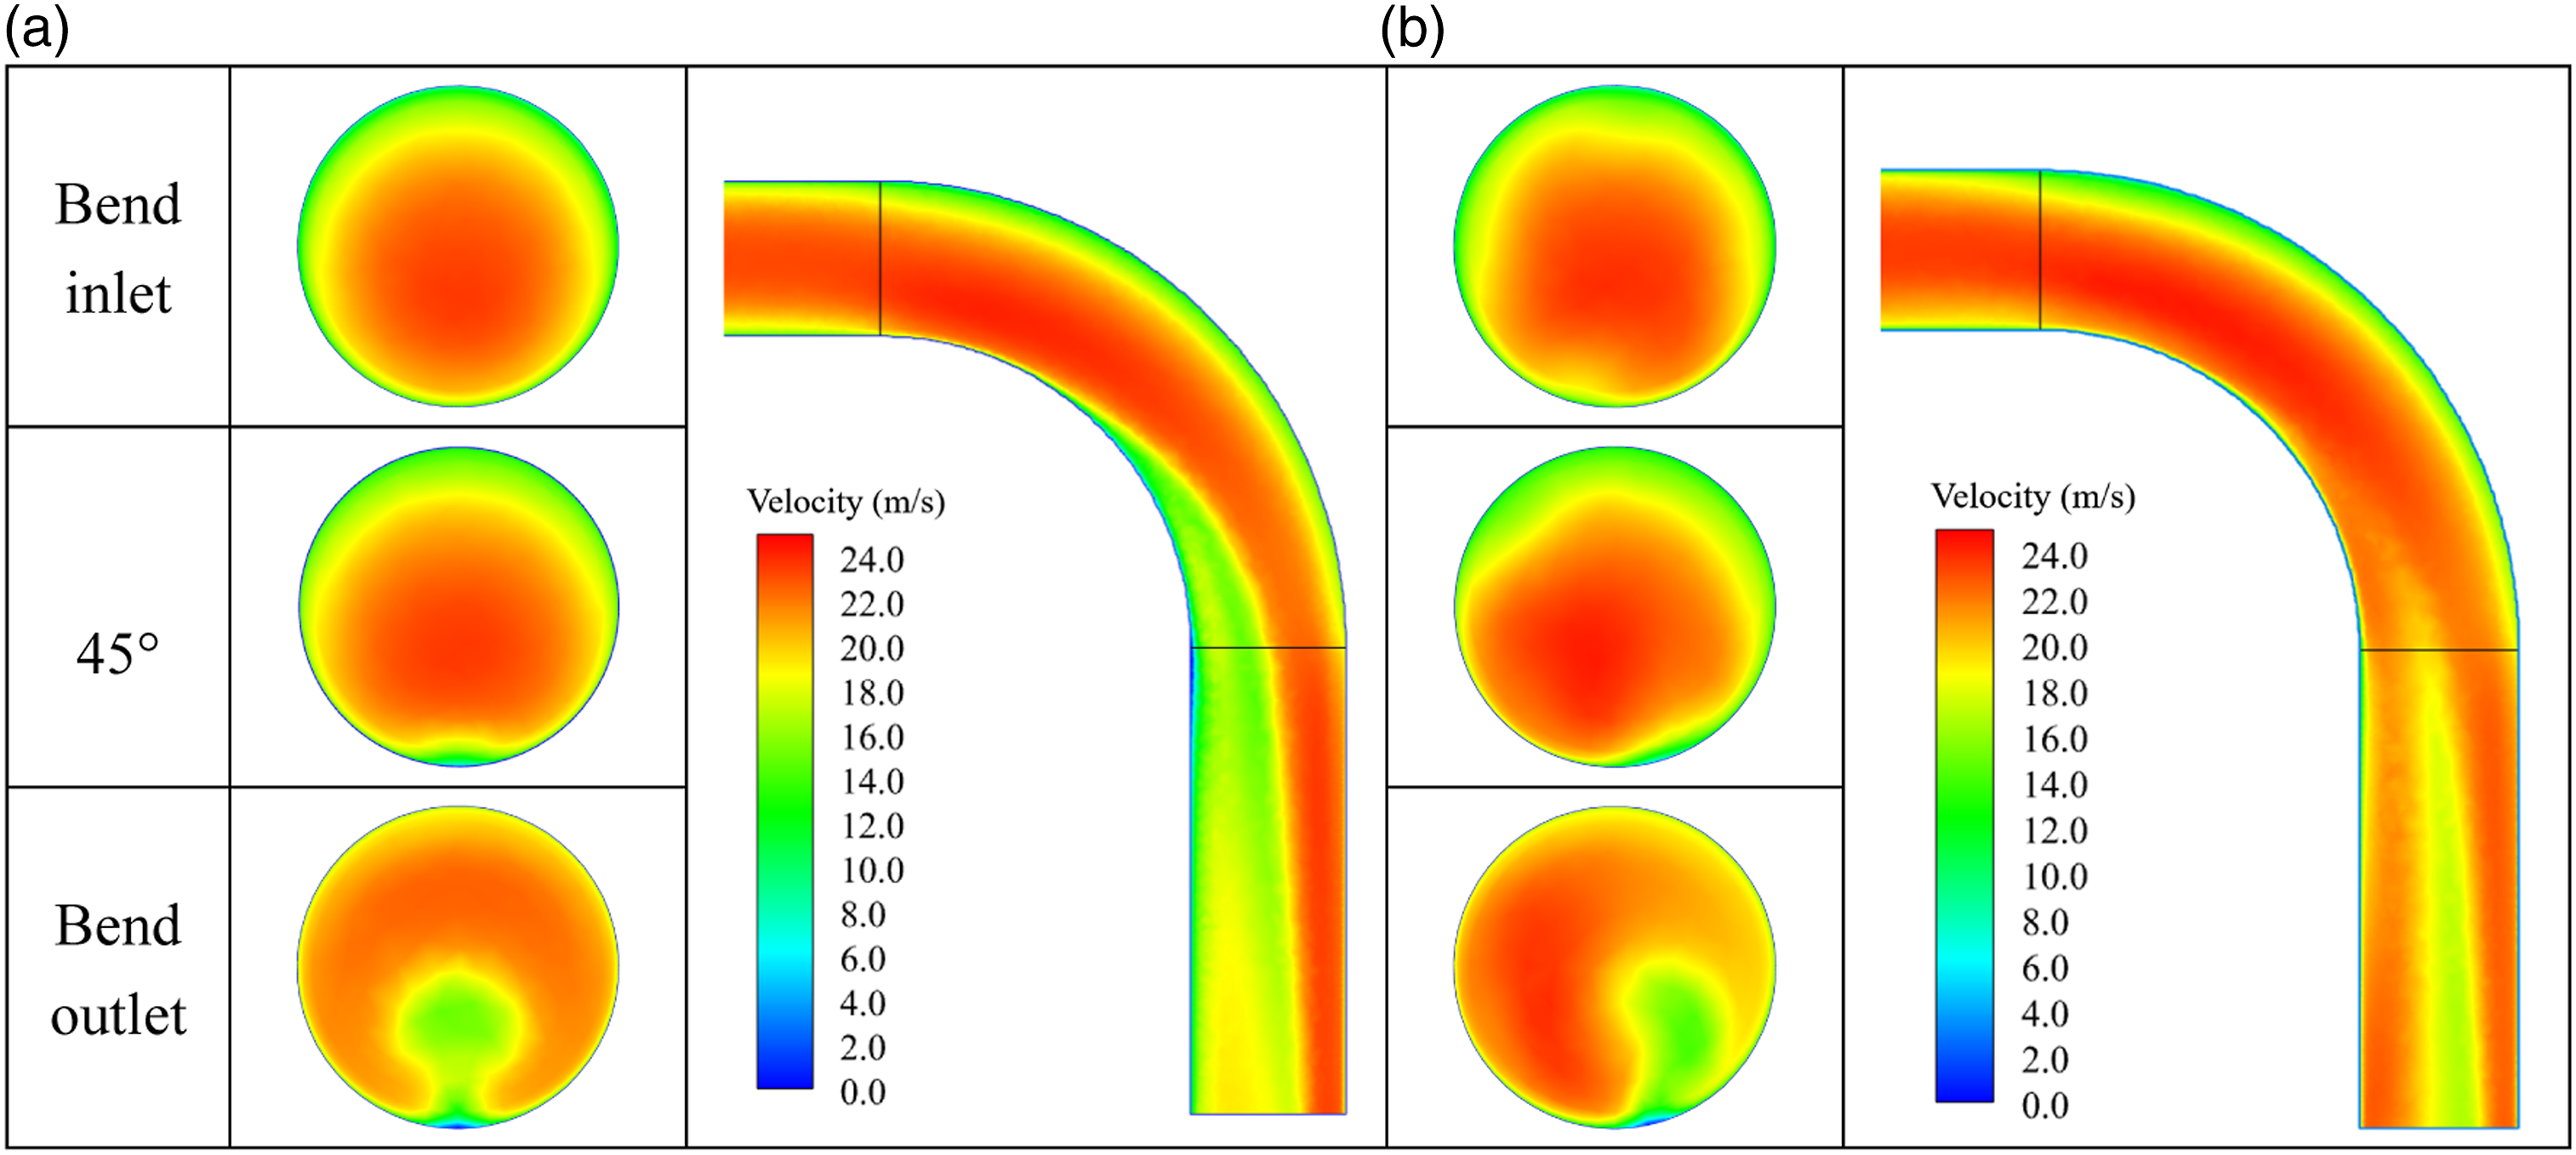

When no swirl was imposed, after θ = 45°, the pressure near the inner bend was increased along the flow direction, and the velocity of the fluid near the inner bend began to decline gradually. As the deflection angle was increased, the centrifugal force became larger, so the secondary flow intensity was gradually increased, causing the pressure near the outer bend to gradually decrease along the airflow direction. After the swirl was imposed, the higher swirl intensity dominated the centrifugal force, which changed the secondary flow originally caused by the curvature effect, reducing the pressure near the inner bend and delaying the pressure build-up, which relocated the maximum velocity region from the outer bend to the centre of the duct (Figure 9(b)). Due to the competition between the curvature of the bend and the radial pressure gradient caused by the swirling motion, the shape of the airflow velocity profile also changed.
Velocity streamline trajectory in the bend is presented at the cross-sections with bend deflections (Figure 10). For the turbulent flow, at θ = 30°, the secondary flow induced by centrifugal force began to appear in the cross section, which formed two counter-rotating symmetrical vortices. These vortices were first discovered by Dean 47 and named ‘Dean vortices’ after him. When the swirl was imposed on the flow, the symmetry of the Dean vortices was broken and the airflow field was gradually dominated by the imposed azimuthal component. When the swirl number was increased, the imposed swirl gradually dominated the fluid flow in the bend, delaying the development of the Dean vortices, and the curvature effect gradually weakened. For lower swirl intensities, such as S n = 0.03, the Dean vortices changed at θ = 30°. For larger swirl intensities, such as S n = 0.23, the Dean vortices started to reappear at θ = 45°, while for S n = 0.33, this occurred at θ = 60°. When the swirl number continued to increase, the Dean vortices caused by the curvature effect would disappear, resulting in a single large scale motion located almost at the centre of the bend in the swirl-dominated flow field. These flow phenomena are in good agreement with the experimental results of Kalpakli and Örlü 48 and the numerical results of Arsalanloo and Abbasalizadeh 26 on the small diameter bend.
Particle transport and deposition
The visualized motion trajectories of particles with different Stokes numbers are shown in Figure 11. When no swirl was imposed, particles with a small Stokes number (St = 0.203) were less affected by inertial forces, and there was good followability between particles and airflow. However, particles with a large Stokes number (St = 0.947) were more susceptible to inertial forces due to their increased size. Affected by the secondary flow, the maximum velocity region of the airflow moved from the central region to the outer bend, and the large diameter particles were gradually concentrated near the outer bend under the drive of inertial force. Visualization of particle motion trajectories. (a) S
n
= 0, St = 0.203, (b) S
n
= 0, St = 0.947, (c) S
n
= 0.23, St = 0.203 and (d) S
n
= 0.23, St = 0.947.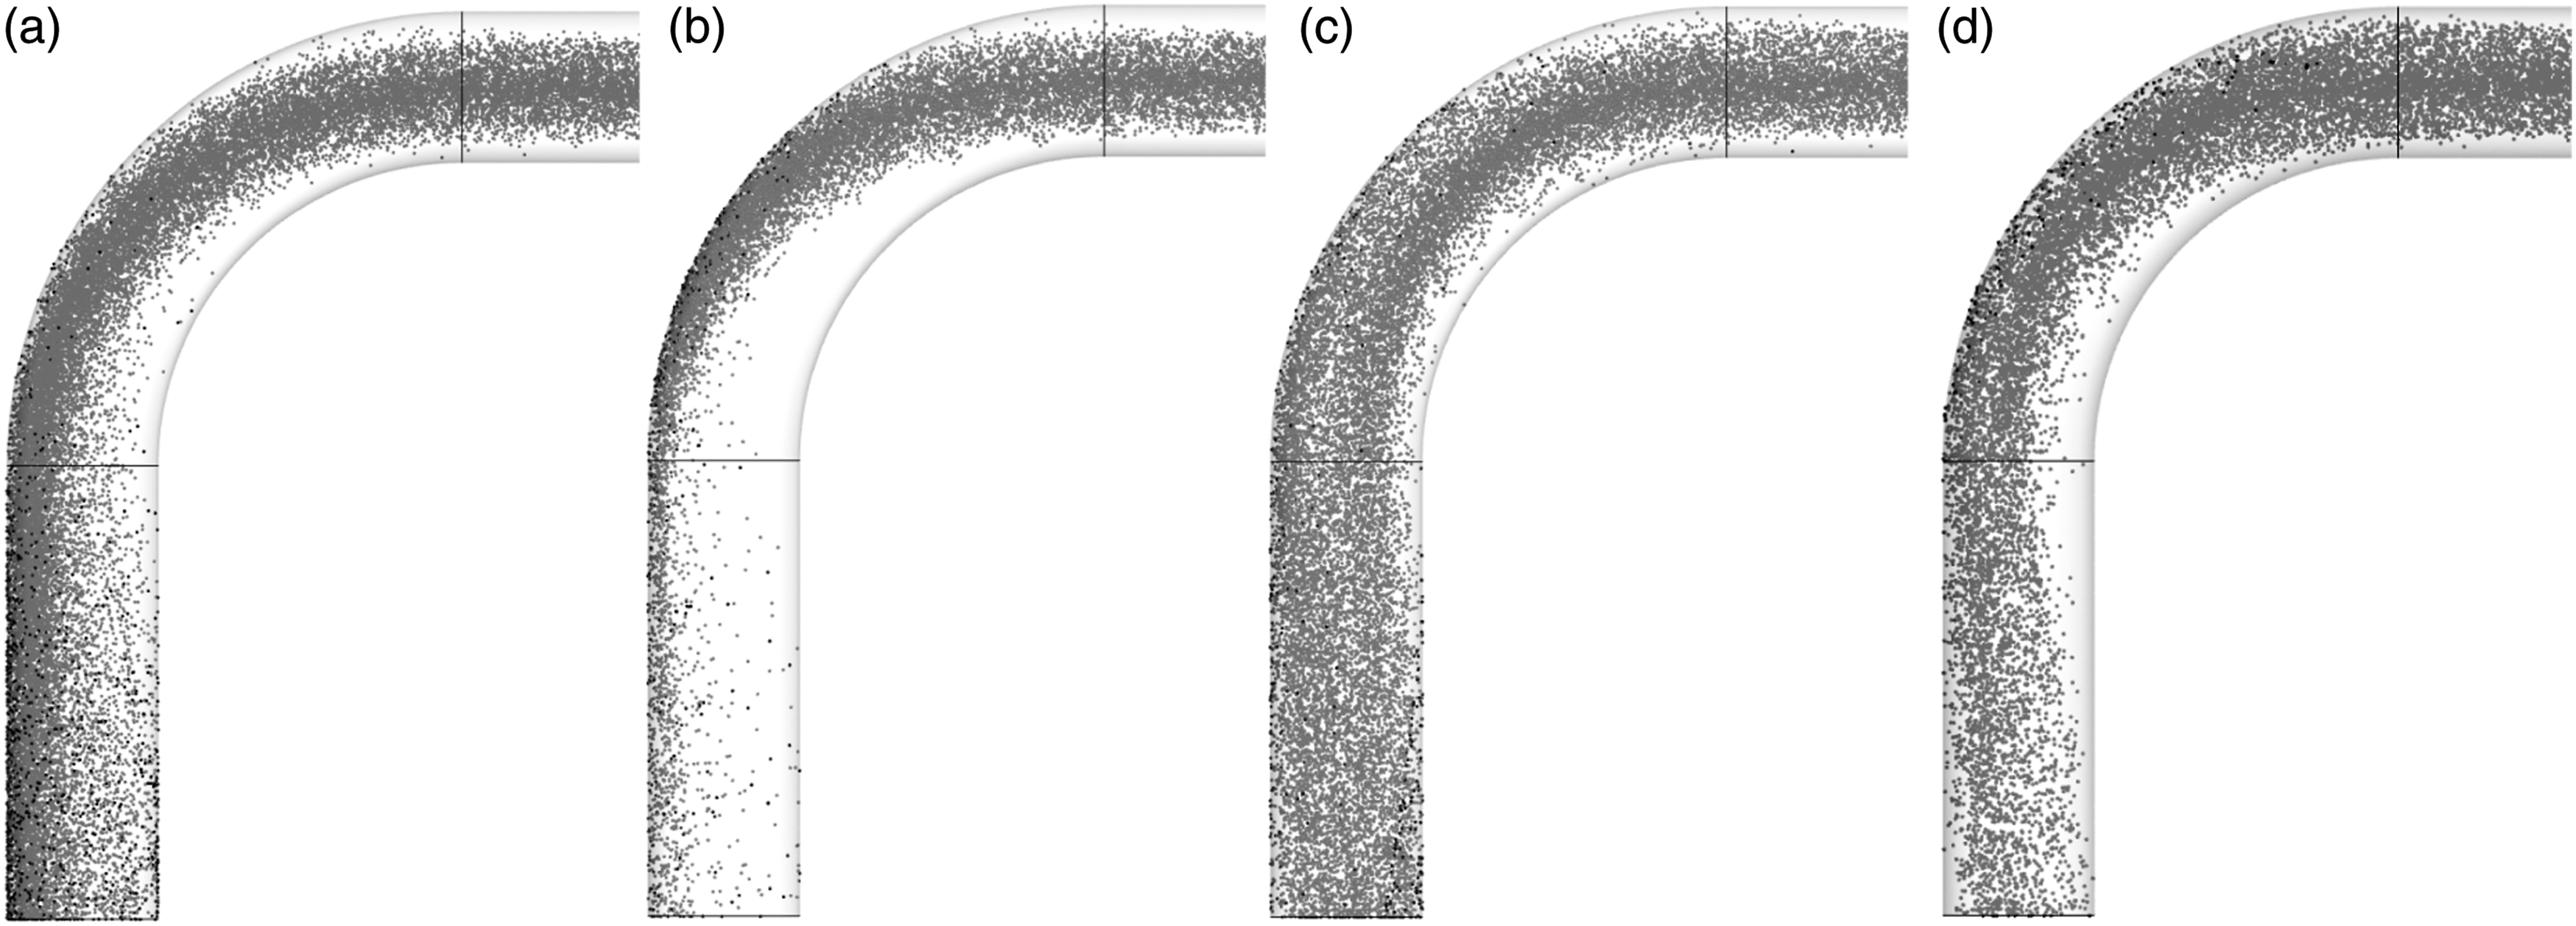
The imposed swirling flow significantly changed the distribution of particles with different Stokes numbers in the bend. Because the swirl dominated the centrifugal force to relocate the region of the maximum velocity of the airflow to the centre of the duct, the distribution of particles in the bend was more uniform. Especially for particles with larger Stokes number (St = 0.947), the imposed swirl retarded the development of secondary flow caused by curvature effects in the bend, allowing more particles to move away from the outer bend.
The deposition efficiencies of particles in the bend are expressed as a function of Stokes number in Figure 12. In general, as the swirl number increased gradually, the deposition efficiency of particles decreased gradually. However, for particles with a Stokes number less than 0.456, the swirl flow with a low swirl number (S
n
≤ 0.17) would improve the deposition efficiency of the particles compared with no swirl flow imposed. For particles with a large Stokes number (St ≥ 0.811), the generation of swirling flow of any intensity would reduce the deposition efficiency of the particles. This means that for smaller particles, lower swirl strength may lead to increased deposition rates for low inertia particles when the particles are exposed to swirling flow. For larger particles, imposing a reasonable intensity of swirling flow could effectively alleviate the deposition of particles on the wall. In the current study range, the maximum reduction in particle deposition was 9.2%, which occurred at St = 1.825, compared with no swirl imposed. Variations in the particle deposition efficiency with Stokes number under different swirl numbers.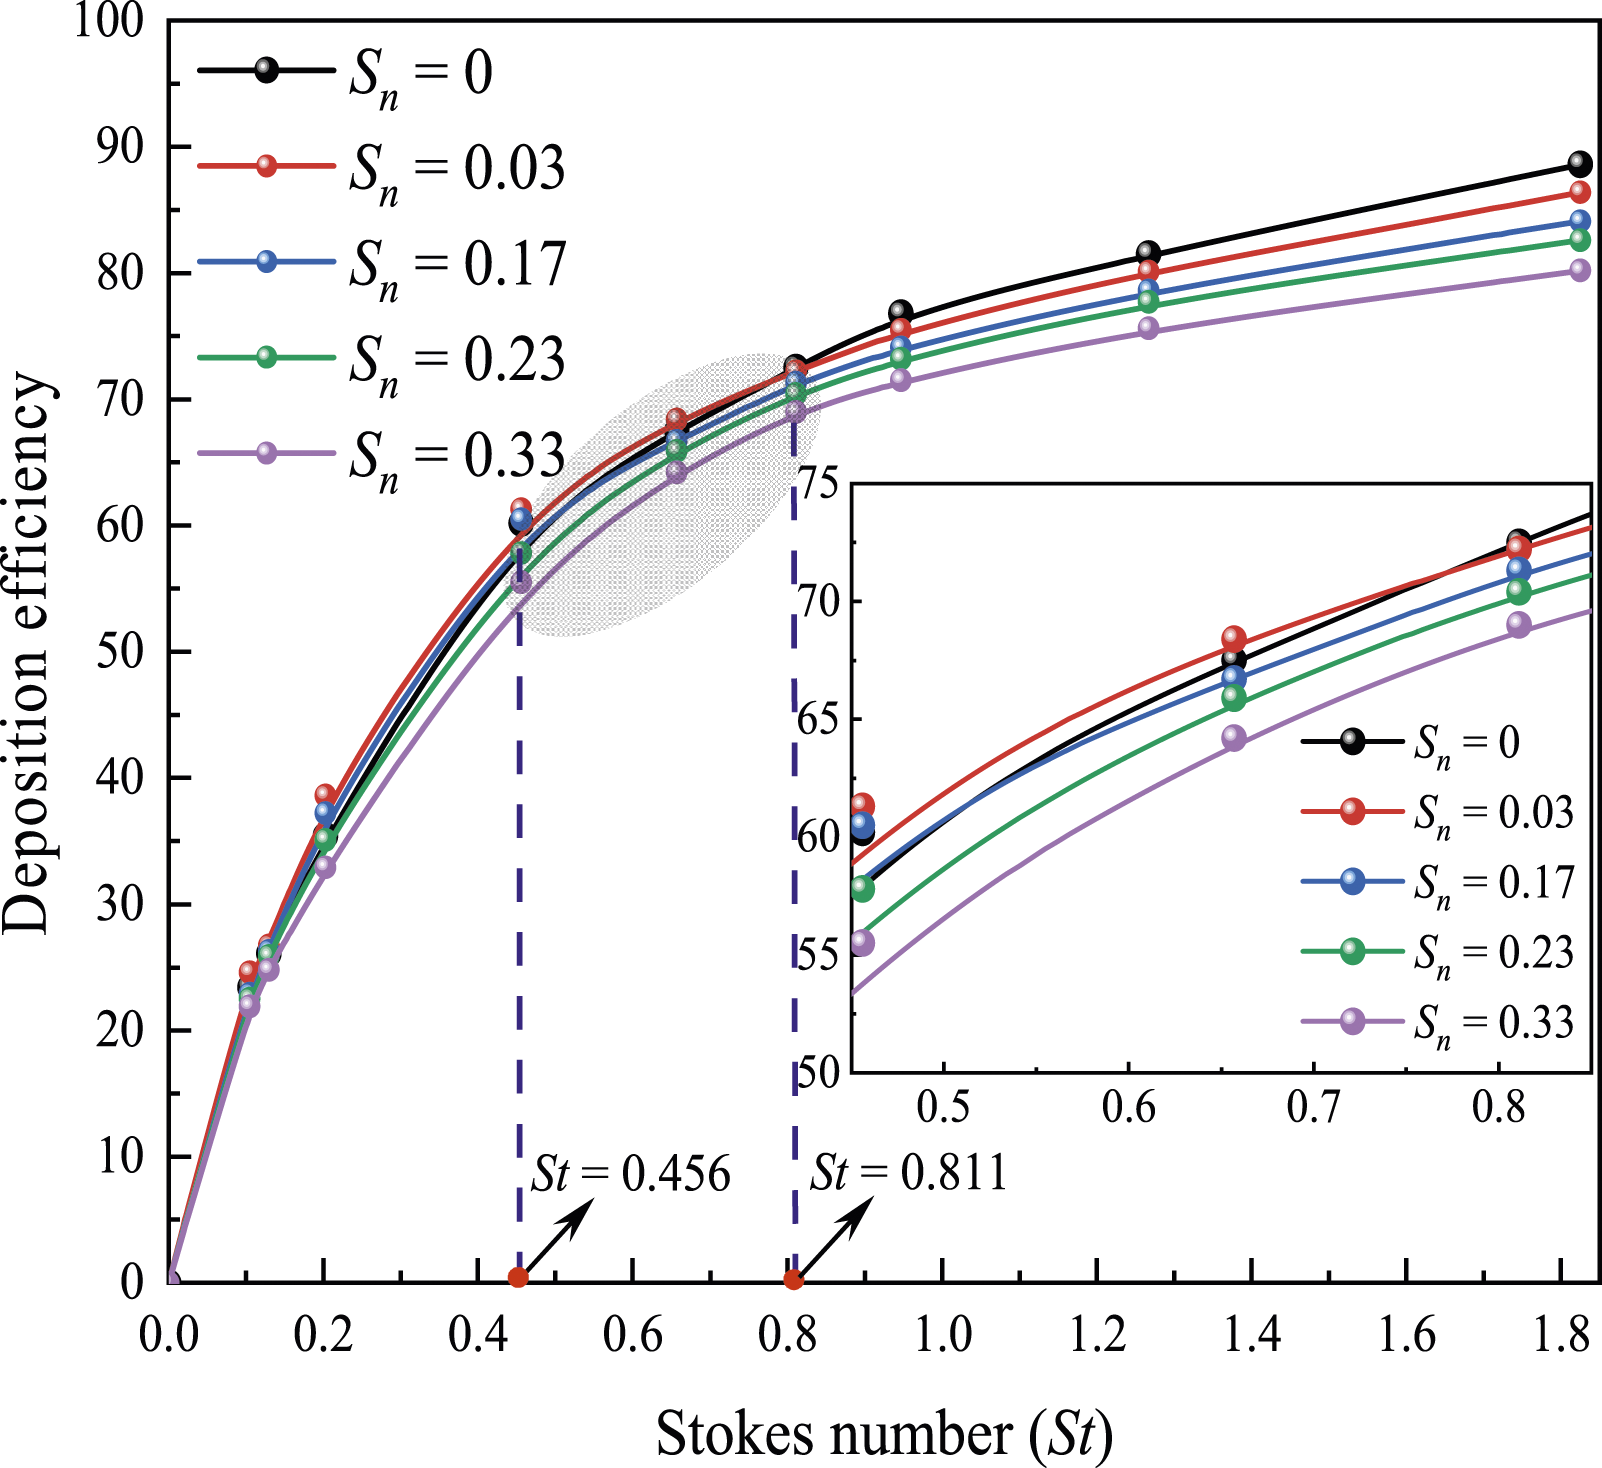
To explore the difference in particle deposition patterns at low and high swirl numbers, the effect of turbulence intensity was considered. Figure 13 shows the turbulence intensity (I) at the bend inlet, half-way around the bend and at the bend outlet. The turbulence intensity (I) based on the mean flow velocity was determined by equation (18):
49
Turbulence intensity at different sections of the bend.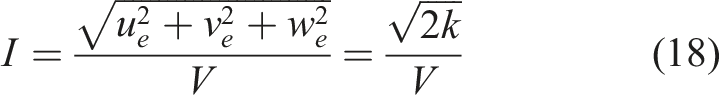
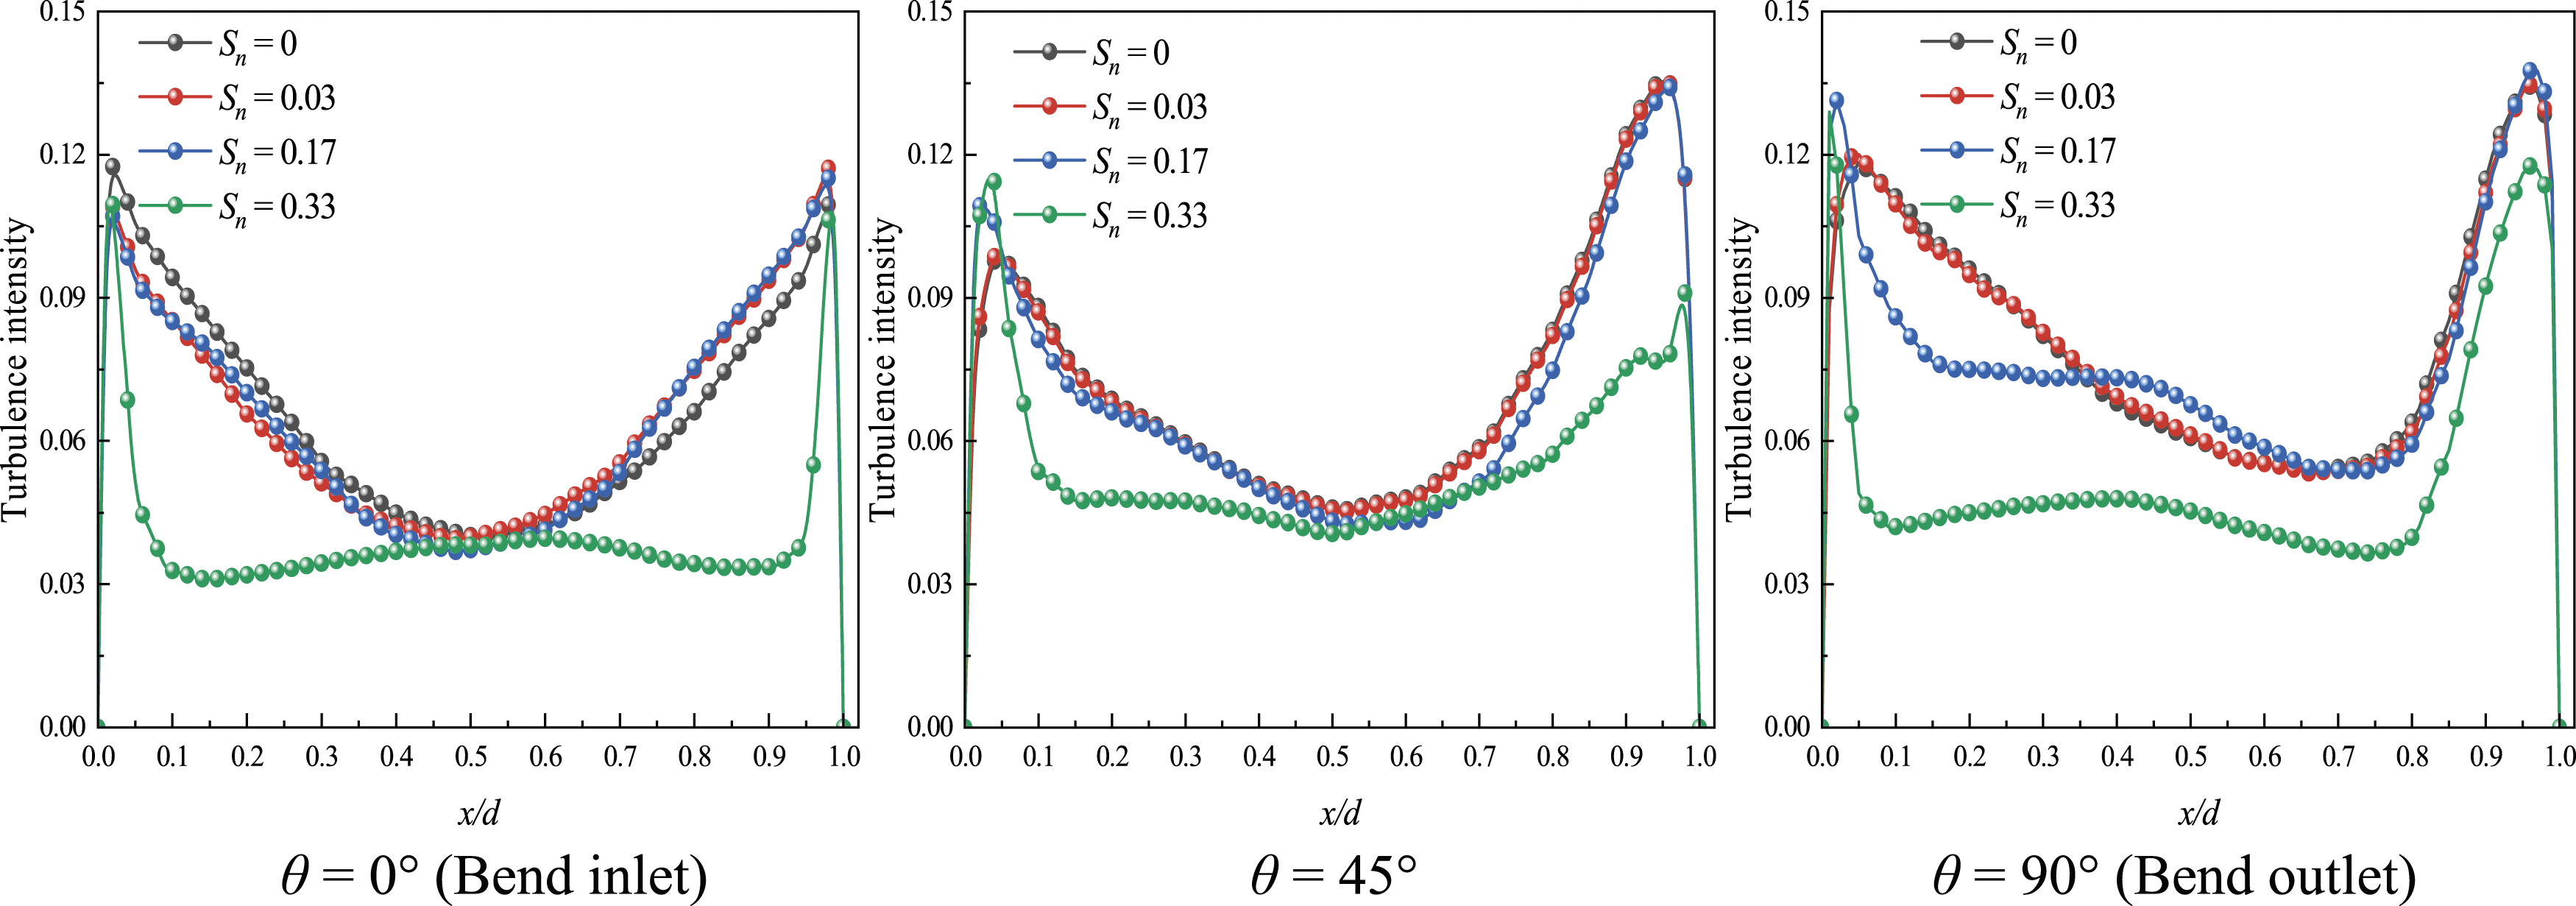
The turbulence intensity was greater near the inner bend and the outer bend, while the variation in the turbulent intensity in the central region was relatively stable. At θ = 0°, the airflow was not affected by the curvature effect, and the turbulence intensity of the inner and outer elbows was almost the same. As the deflection angle was increased, the low swirl intensity (S n ≤ 0.17) would suppress the secondary flow weakly, resulting in a gradually higher turbulent intensity near the wall than when S n = 0. When the swirl number was increased to 0.33, the turbulent intensity near the duct wall was decreased significantly. This was due to the fact that particles with small Stokes numbers are more susceptible to the intensity of turbulence. Higher turbulence intensity near the wall could cause low inertia particles to be more likely to deposit on the wall. The higher swirl intensity would almost dominate the fluid flow in the bend, reducing the turbulent intensity in the central region of the duct and improving the stability of the airflow, making it easier for particles with greater inertia to pass through the bend.
To further elucidate the effect of the imposed swirl on the deposition pattern of the particles, the deposition distribution of particles with different Stokes numbers on the wall of the bend was visualized (Figure 14). For the simple bend without imposed swirling flow, the deposition of particles with different Stokes numbers on the wall was mainly affected by secondary flow and inertial force. Small-sized particles were subject to lower inertial force and could overcome the influence of the curvature effect during the flow process, and the distribution of particles on the bend wall was relatively uniform. For the particles with larger Stokes numbers (St ≥ 0.811), the region of the maximum velocity of the fluid gradually moved from the centre of the duct to the outer bend driven by the secondary flow. With the increase in Stokes numbers, the particles were gradually concentrated and deposited to the outer bend under the action of inertial force. Visualization of particle deposition in the bend. (a) S
n
= 0 and (b) S
n
= 0.33.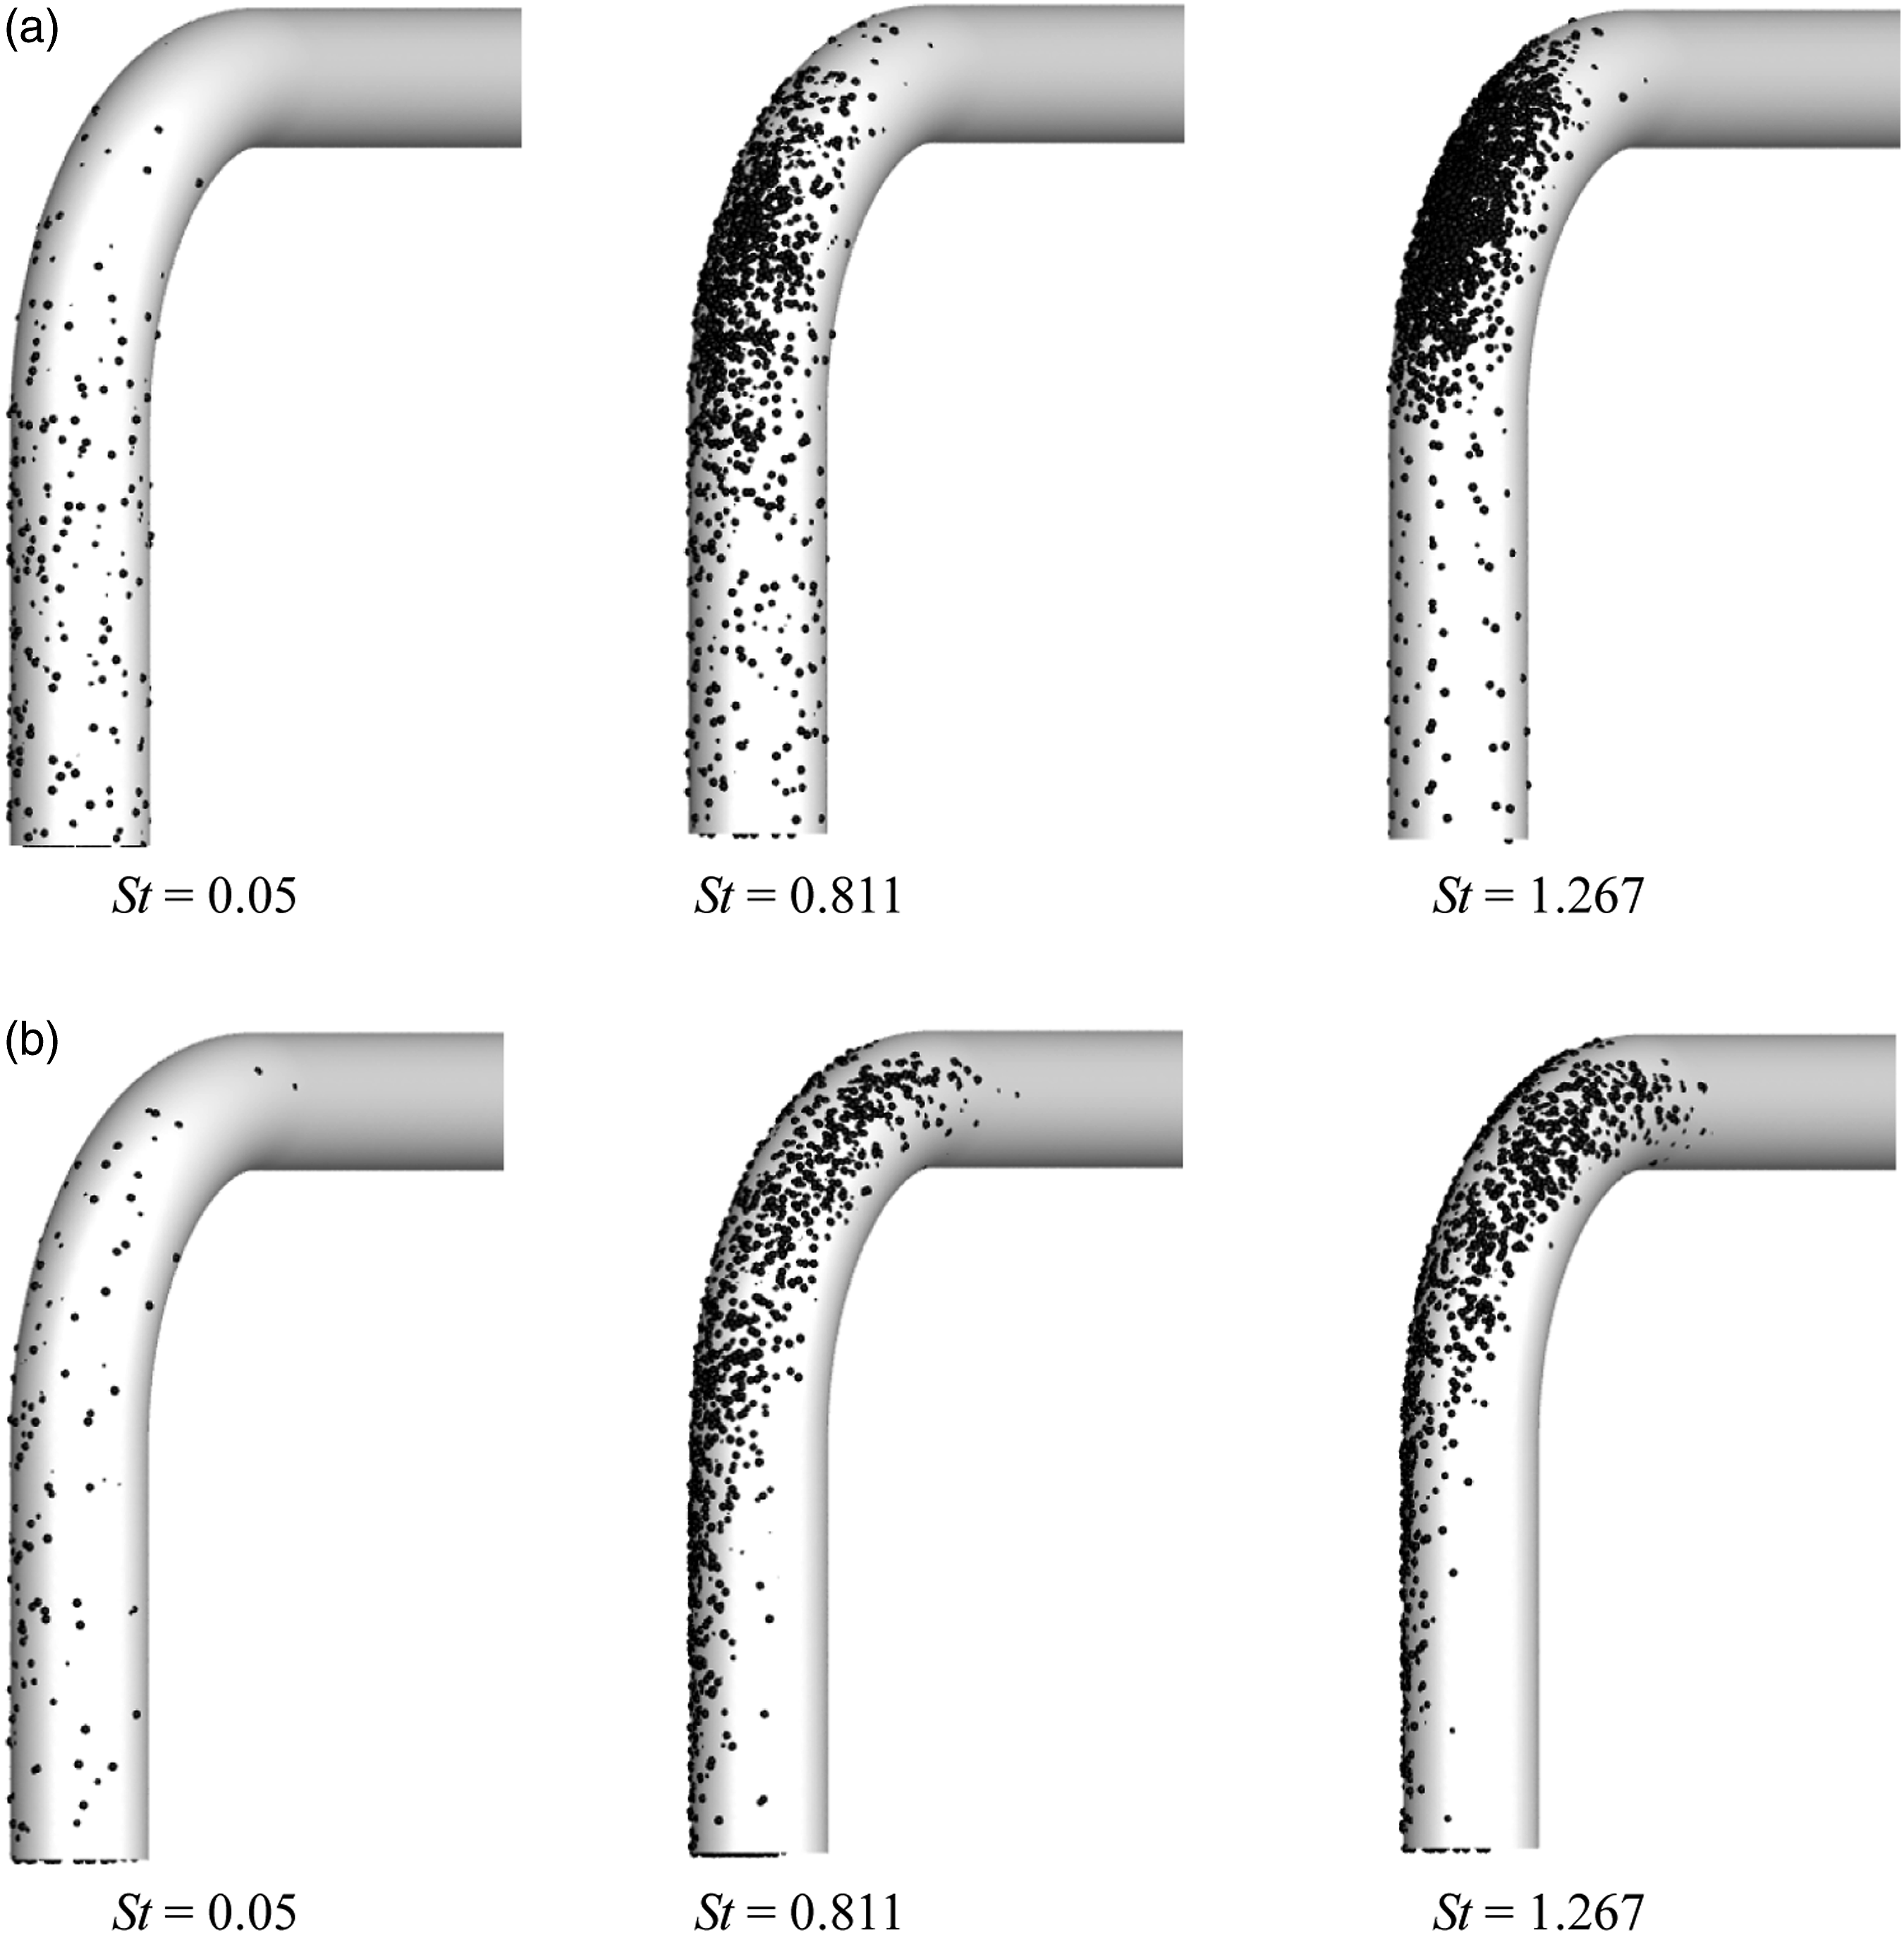
As mentioned in the previous section, the imposition of the swirl changes the secondary flow that was originally dominated by the pressure gradient caused by the curvature effect. The higher swirl intensity would dominate the centrifugal force, relocating the maximum velocity region from the outer bend to the centre of the duct, and the distribution of particles on the wall was more dispersed. Unlike the particles with small Stokes numbers, although the imposed swirling flow almost dominated the flow in the bend, many large-sized particles were still deposited around the bend under the action of inertial force.
Conclusion
To better understand the deposition behaviour of particles in a 90° industrial bend in the presence of a swirl, this article combines the RSM turbulence model and the Discrete Phase Model (DPM) to predict the deposition efficiency of particles in the bend under high Reynolds number conditions. Using a user-defined function (UDF), the swirling device is defined as a velocity inlet with different tangential flow components to generate different inlet swirl intensities. The effects of Stokes number, Swirl number, pressure coefficient, secondary flow and turbulence intensity are discussed in detail in the research. The main research conclusions are as follows: (1) Compared with no swirl, the imposed swirl changed the secondary flow that was originally dominated by the pressure gradient caused by the curvature effect. As the swirl number was increased, the imposed swirl would gradually dominate the fluid flow in the bend, delaying the development of the Dean vortices, and the curvature effect gradually weakened. The higher swirl intensity would reduce the pressure near the inner bend, delaying the pressure build-up, thereby relocating the region of maximum velocity from the outer bend to the centre of the duct. (2) In general, as the swirl number was increased gradually, the deposition efficiency of particles declined gradually. However, for particles with a Stokes number less than 0.456, the swirl flow with a low swirl number (S
n
≤ 0.17) would improve the deposition efficiency of the particles compared with when no swirl was imposed. For particles with a large Stokes number (St ≥ 0.811), the generation of swirling flow of any intensity would reduce the deposition efficiency of particles. (3) Particles with smaller Stokes numbers are more susceptible to the intensity of turbulence. The higher the turbulence intensity near the wall, the easier it is for low inertia particles to deposit. The higher swirl intensity would dominate the centrifugal force, reduce the turbulent intensity in the central region of the duct, improve the stability of the airflow, and make it easier for particles with larger inertia to pass through the bend.
Footnotes
Author contributions
All authors contributed equally to the preparation of this manuscript.
Declaration of conflicting interests
The author(s) declared no potential conflicts of interest with respect to the research, authorship, and/or publication of this article.
Funding
The author(s) disclosed receipt of the following financial support for the research, authorship, and/or publication of this article: This work was supported by the National Key Research and Development Program (Grant No. 2018YFC0705300) and the Fundamental Research Funds for the Central University of Donghua University (Grant No. 2232017A-09).