
Abstract
In a fire, stairways are the primary avenues for building evacuation. Previous studies focused on investigating evacuation flow through evacuation drills in a high-rise office building to assess the accuracy of evacuation scenarios and compared them with evacuation dynamics. However, the effectiveness of evacuation drills in estimating many scenarios is limited by actual drills. The evacuation simulations present a promising approach to objectively evaluating evacuation scenarios. This study verifies whether evacuation simulations can faithfully replicate actual evacuation flow and effectively predict suitable evacuation scenarios or potentially involve parameter calibration. Through a comprehensive comparison analysis, this study scrutinized the reliability of evacuation simulations and calibrated the simulation parameters. The analysis revealed that factors, including adjustments to the door width, personal space considerations for occupants in both conflict and normal situations and variations in staircase structure configuration, can significantly influence the evacuation flow within staircases. Manipulating these parameters in simulations would enable a more precise replication of evacuation flow within staircases, thereby enhancing the simulation’s accuracy in target evacuation scenarios. The findings of this research have underscored the significance of employing advanced simulation techniques to model evacuation dynamics accurately, facilitating a robust framework for devising effective emergency evacuation strategies in high-rise office buildings.
Keywords
Introduction
Background
In urban areas, the prevalence of high-rise buildings has significantly increased due to their efficient utilization of limited land. These structures are capable of accommodating higher population densities as they rise in height. 1 However, their complex and intricate indoor environments pose considerable challenges concerning disaster safety.2–5 Regulatory measures pertaining to exit stairs, fire-rated construction materials, fire and smoke alarms, as well as fire sprinkler systems have been established in numerous countries to enhance the fire safety protocols of high-rise buildings.6–8 Even though there are many countermeasures for an indoor fire, there are possibilities of a fire in an indoor environment, 9 and the evacuation route choice in the indoor environment fire is important. 10 Following the tragic events of the 9/11 World Trade Center disaster, there was a renewed focus on reevaluating fire safety strategies within such structures. In-depth surveys were conducted to analyze evacuation behaviours amongst survivors of the World Trade Center Towers 1 and 2 incidents.11–14 These surveys revealed a significant finding: nearly 70% of respondents chose to evacuate using stairs. 14 Moreover, recent research investigating the selection of evacuation paths in high-rise buildings during fire, especially between stairs and lists, involved a combination of questionnaire surveys and evacuation drills. The results demonstrated that a substantial majority (95.6%) of respondents expressed a preference for using staircases. They reported feeling safer using stairs during the evacuation, and actual evacuation drills indicated that 60–75.5% of participants opted for staircases. 15 Evidently, staircases play a pivotal role in the evacuation process in high-rise buildings. Given the distinctive architectural features of high-rise buildings, occupants are often required to descend lengthy vertical paths during evacuation, which could lead to significant congestion. Consequently, meticulous and well-prepared evacuation plans are imperative to ensure fire safety in such scenarios.
The significance of evacuation procedures in high-rise buildings is paramount when considering the structural contexts in Japan and the potential exigencies that may arise during emergencies. 5 In the Japanese context, high-rise office buildings are mandatorily equipped with a minimum of two direct staircases, serving as primary vertical evacuation routes to the ground floor, regardless of the number of floors and occupants. 9 Unlike some regions, there are no regulations mandating the installation of evacuation lifts in Japanese high-rise buildings. Given this scenario, evacuees predominantly rely on stairwells, which consequently escalates the risk of pronounced congestion. In addressing the challenge, the concept of phased evacuation emerges as a viable strategy for high-rise building evacuations, offering several notable advantages. Foremost, the phased evacuation strategy enables a methodical and efficient evacuation process by avoiding simultaneous evacuations of occupants. 16 This deliberate approach mitigates the potential for overcrowding and congestion in stairwells and exit zones, factors that could potentially hinder evacuation procedures on higher floors and elevate the likelihood of accidents transpiring. 17 To mitigate these risks, Japanese high-rise buildings are advised to adopt a phased evacuation approach like the policy established by London Fire Brigade (LFB) for high-rise office buildings. 18 However, the phased evacuation strategy recommended by the LFB does not comprehensively account for the building evacuation time or the dynamics of evacuation flow at the ultimate exit points.
In the pursuit of establishing an ideal phased evacuation scenario, evacuation drills were conducted at a high-rise office building situated in Tokyo, serving as the headquarters of a company. The drills were organized collaboratively between the company and the disaster prevention centre. The objectives of these evacuation drills encompassed two primary dimensions, each with its respective rationale: Firstly, the drills aimed to minimize the duration of congestion within a designated section of a staircase to less than 3 min. Previous research indicated that, following a questionnaire survey conducted post-evacuation drill, 10% of respondents found it challenging to endure a congestion period ranging from 1 to 2 min. Furthermore, over 50% of respondents reported difficulty in ensuring congestion exceeding 3 min. Consequently, the overarching goal was established to prevent congestion from the 3-minute threshold. 19 Secondly, the evacuation drills were designed to forestall any reduction in evacuation flow at the staircase exit on the 1st floor (including the ground floor as 1st floor). This potential decrease in evacuation flow was anticipated due to the prolonged interval between the initiation of evacuation phases, which could inadvertently waste precious evacuation time. 20 Evacuation drills serve multiple invaluable purposes including enhancing comprehension of the evacuation plan, and fostering confidence amongst participants.21–24 However, practical inefficiencies arise from full-scale evacuation demonstrations. 25 Challenges include the protracted duration required to refine scenarios through annual evacuation drills, as well as the complexity of evaluating diverse evacuation scenarios. 20 Given these considerations, the integration of evacuation simulation emerges as a pragmatic approach to identify suitable evacuation scenarios, thereby affording insights into the regulation of evacuation flow and alleviation of congestion within the staircases prior to conducting physical evacuation drills. 26 To uphold the integrity of evacuation simulations, a systematic Verification and Validation (V&V) process assumes critical importance. The V&V approach plays a pivotal role in evacuation simulations for various reasons. Firstly, it serves as a mechanism to validate the precision of the simulation model.27,28 Secondly, the V&V method facilitates an assessment of the functional efficacy of the evacuation simulation, determining whether the model operates as intended and generates anticipated evacuation flow patterns. Consequently, the scientific community has undertaken studies dedicated to verifying and validating evacuation simulation techniques.29,30
Evacuation flow data from drills are inherently random, reflecting the individual variability in evacuee behaviour. Individual evacuations lack repeatability but the mass evacuation exhibits consistent characteristics such as flow rate and density due to limited space in the staircase. Thus, the flow rates of evacuation crowds passing through doors and stairs, as well as ratios of flow rates when individuals enter the stairs from a floor converging with those descending from upper floors at stair landings, represent steady-state quantities, indicating repeatability. In the validity assessment of evacuation simulation results in this study, comparisons were made with data from steady-state quantities observed in evacuation drills, which demonstrated repeatability.
To establish the credibility of the evacuation simulation methodology, the accuracy of two widely employed evacuation simulations, both in Japan and other countries, was subjected to comprehensive validation. The evaluation encompassed a comparison between the simulation outcomes of evacuation flow across descending flights of stairs and landings, excluding merging with evacuation flow from other floors, with data gleaned from an evacuation drill. The software tools SimTread 31 and FDS+Evac 32 were utilized to facilitate this evaluation. Through the analysis of gathered empirical data, a parallel was drawn between the density and specific flow relationships. The findings demonstrated a degree of congruence between simulation outcomes and observations from the evacuation drill. 33 Expanding on the investigation, an in-depth analysis of specific facets was undertaken, focusing on scenarios without merging at landings of the staircase. A comparative examination between the evacuation drill and the SimTread simulation encompassed aspects such as the flow rate at the staircase exit on the first (ground) floor, the overall building evacuation duration, the evacuation flow dynamics during merging and the merge rate. This meticulous inquiry revealed that the building evacuation duration projected by SimTread closely mirrored the findings of the evacuation drill. Nonetheless, disparities emerged concerning the flow rate at the initial stages of the staircase exit, showcasing variations between the evacuation drill and simulation outputs. Notably, discrepancies in density within the staircase, specifically between the 2nd and 1st floors, were identified. (The flooring system in this paper adopts the American one. For example, the 2nd and 1st floors written in this paper are equal to the 1st floor and ground floor in European system, respectively.) Additionally, slight deviations were evident in the merging rate. 34 For an accurate reproduction of evacuation flow dynamics, certain critical factors warrant consideration: (1) Merge rate and flow rate: The accuracy of the merge rate holds pivotal importance in ensuring reliable evacuation times across each phase. This is because the merge rate could significantly influence the time required for evacuating each floor. (2) Evacuation flow could attribute to the final staircase exit: post-merging on each floor, evacuees regain their density and walking speed. These attributes are instrumental in predicting the accurate building evacuation time. (3) Evacuation flow characteristics during staircase descent: Evacuation simulations are frequently based on the flow rate calculations on path width. While real-life evacuees may not be significantly impacted, simulation outcomes can be sensitive to any structural divergence within the staircase, potentially affecting the evacuation flow dynamics.
Purpose
This paper presents a comparative analysis that seeks to validate the precision of evacuation flow simulations within the staircase using SimTread, in alignment with findings obtained from an evacuation drill. The principal objective of this study is to advance the utility of evacuation simulation technology using SimTread, which is often used in Japan through clarification of similarities and technology, particularly employing SimTread, a prevalent tool in Japan. The core aim is to elucidate both the commonalities and distinctions between the outcomes of the evacuation drill investigation and SimTread simulation. This research was geared towards fostering advancements in evacuation simulations by addressing identified gaps. To achieve the aforementioned purpose, the study outlines the following objectives: (1) Extraction of evacuation flow processes: The initial objective involved the extraction and analysis of key stages within the representative descent of evacuees on stairs, akin to tracers of evacuation flow between floors. The analysis sought to identify factors that potentially influence the characteristics of the evacuation flow. (2) Analysis of density and flow rate at landings during merging: The second goal entailed an in-depth investigation into the density and flow rate at a selected landing during the phase of merging evacuation flow. (3) Analysis of descent and staircase exit flow characteristics: The third objective focused on a comprehensive analysis of both the characteristics of descending evacuation flow and the evacuation flow dynamics at the staircase exit on the 1st floor. (4) Integration of findings and suggested improvements: Subsequent to the analyses detailed in objectives (1) through (3), the study proceeded to synthesize the data with the factors outlined. This synthesis culminated in the proposal of potential enhancements for simulations and the refinement of evacuation simulation methodologies. This study employed a calibrated evacuation flow not applicable to all conceivable evacuation scenarios. The study focused on an evacuation scenario adhering to the following two conditions: (1) absence of congestion stemming from merging within the staircase, where congestion was defined as a duration exceeding 3 min, during which the evacuation flow rate fell below 0.125 p/s; and (2) continuous evacuation flow at the last exit, with no cessation lasting more than 3 s after the conclusion of the first phase, within the time intervals between phases. Through these meticulous objectives and conditions, the study strived to refine the accuracy and practicality of evacuation simulations, contributing to more effective emergency response strategies in high-rise buildings.
Introduction of the evacuation drill and SimTread
Overview of object building
The focal point of the comparative analysis within this study centred on a high-rise office building situated in Tokyo, Japan. The building in question was exclusively occupied by a single company. The architectural configuration of this high-rise establishment encompassed several functional zones, with conference rooms, parlour rooms and cafeterias occupying the 2nd to 9th floors. Conversely, the office rooms were situated on the 10th to 25th floors. Consequently, the majority of occupants were concentrated between the 10th and 25th floors. The evacuation staircase within the building adhered to specific dimensions, with each element meticulously designed for optimal evacuation dynamics. The staircase featured a riser measurement of 0.173 m, a tread width of 0.28 m, a stair width spanning 1.2 m and a door width of 1 m. Notably, deviations in staircase dimensions were observed for floors below the 7th level, as depicted in Figure 1. Dimensions of building stairs.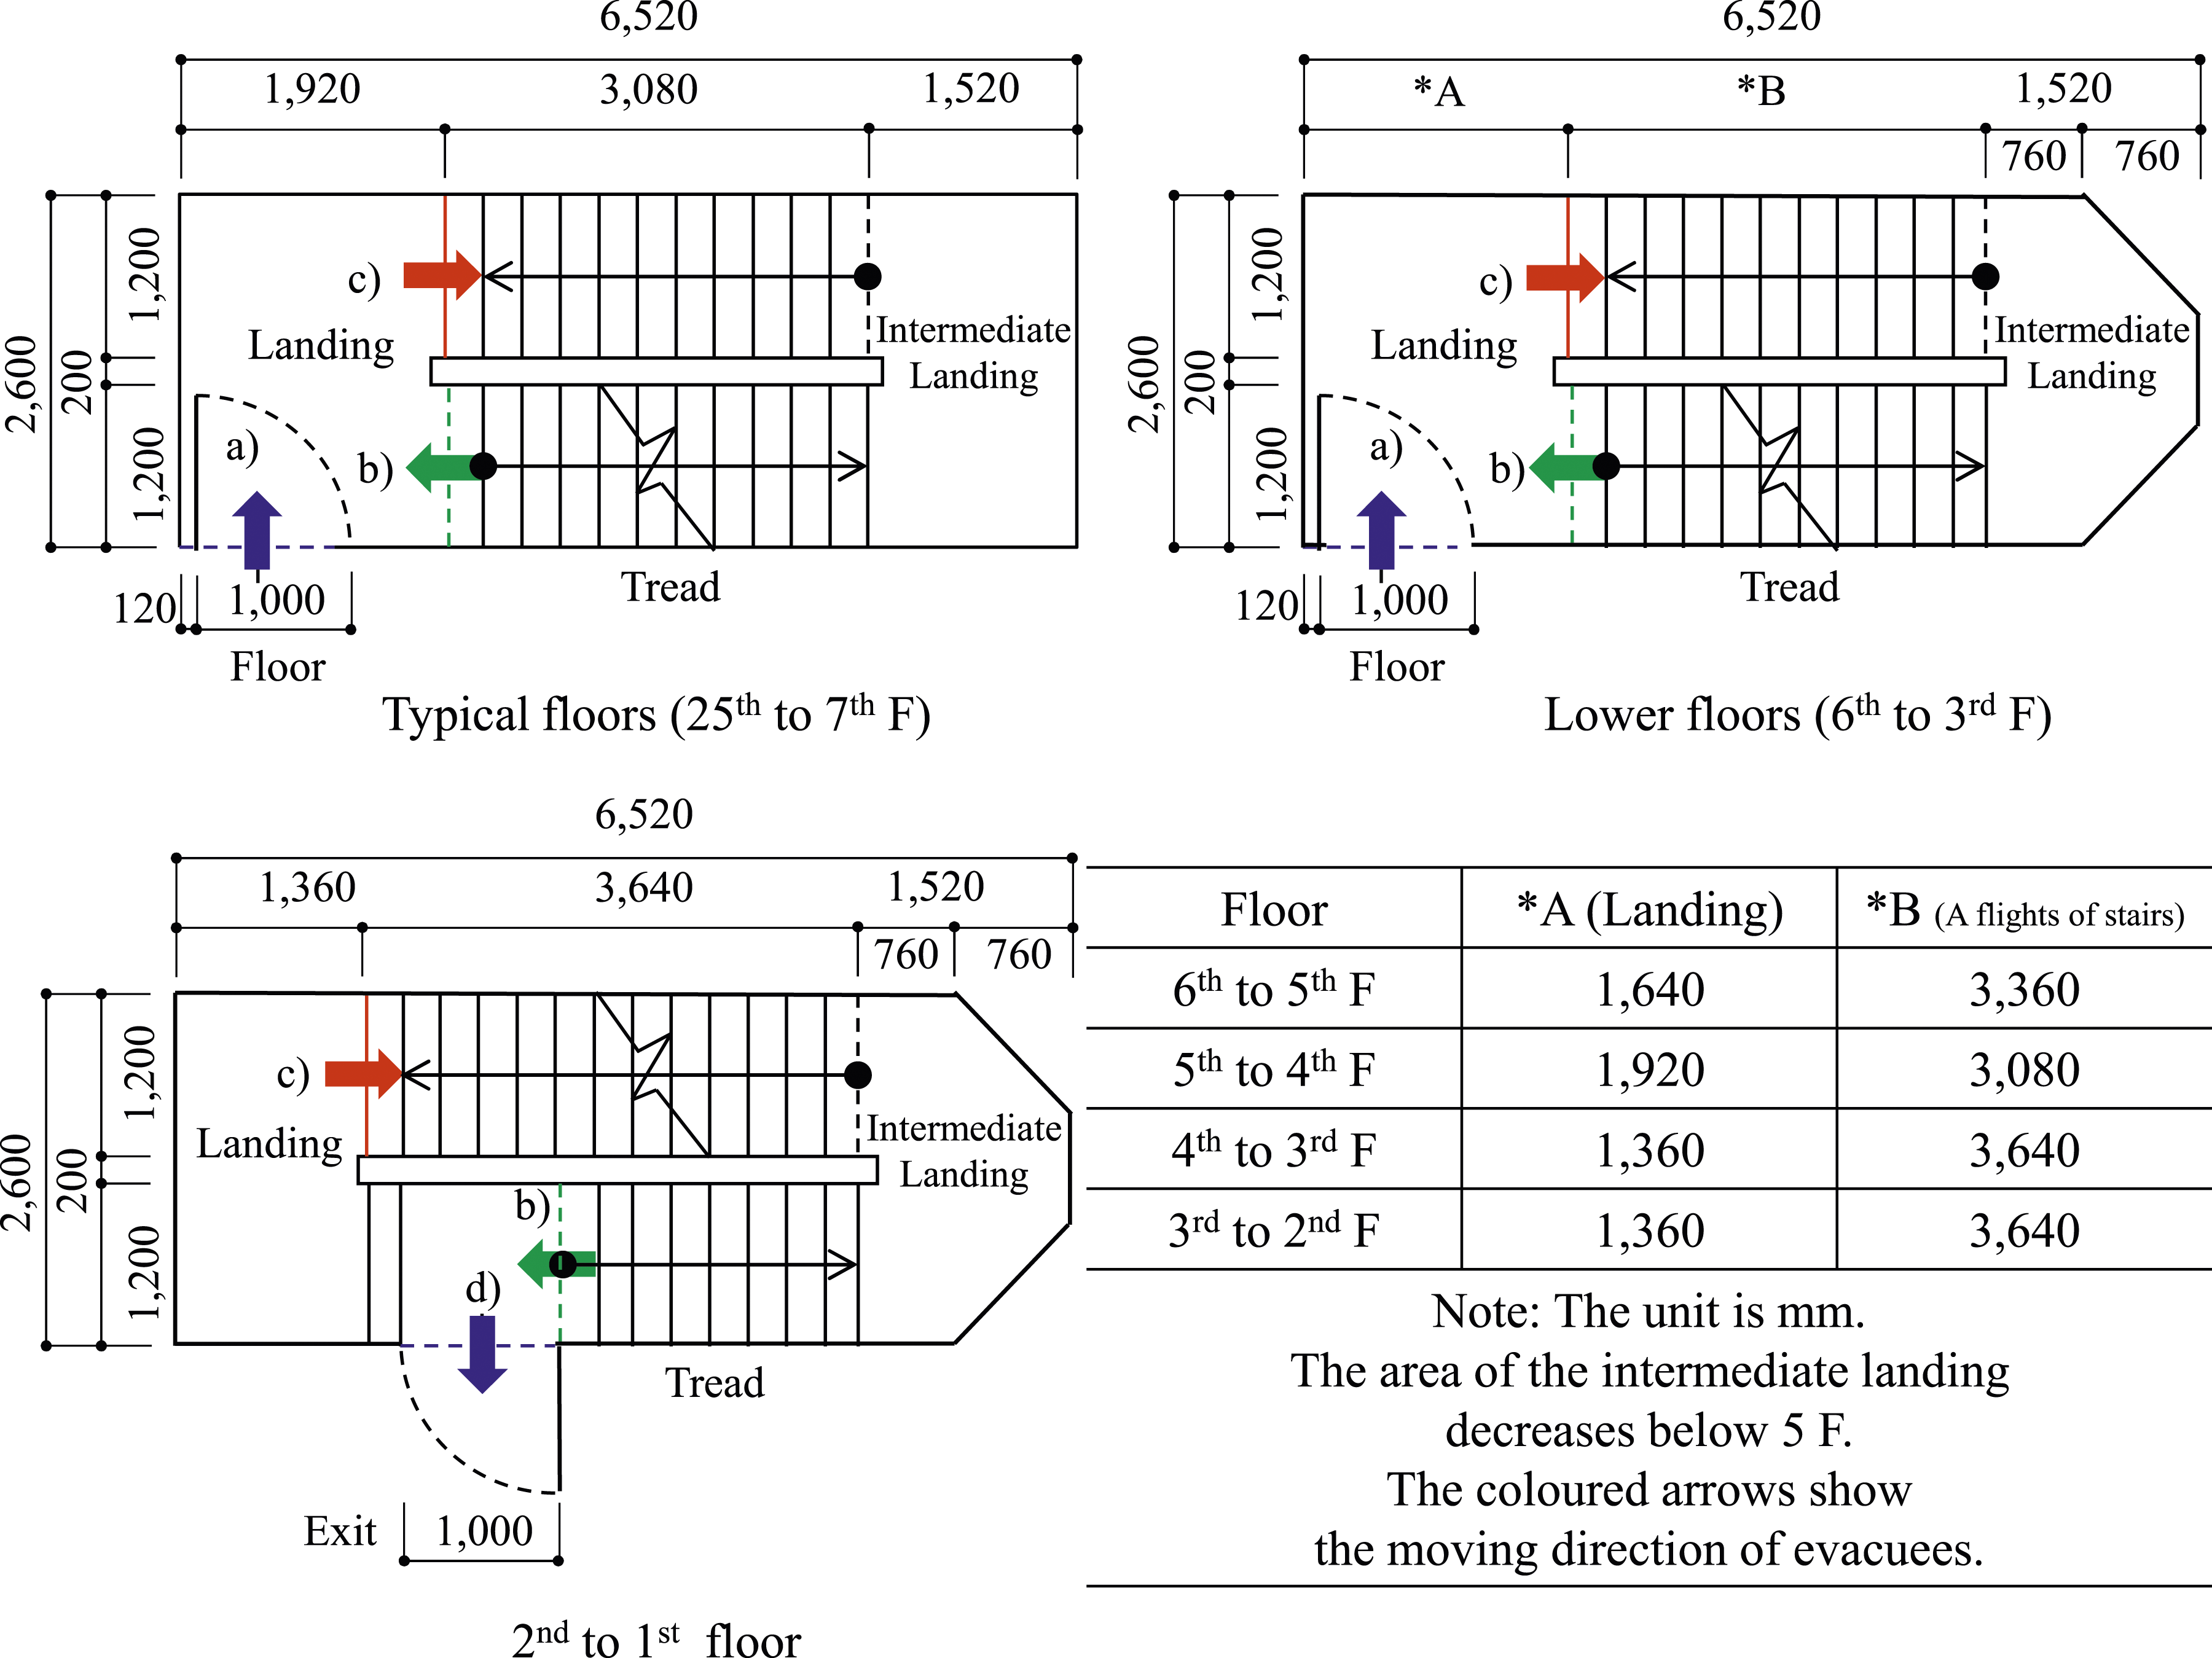
Evacuation drill (hereafter, ED)
The high-rise office building serves as the headquarters for a company situated in Tokyo. The evacuation drills conducted in this study were executed in strict adherence to broadcasted instructions disseminated by the disaster prevention centre within the building. These evacuation drills entailed guiding occupants to move from their respective locations within the building to the designated stairwell via the building’s corridors, following directives issued by the disaster prevention centre. The formation of the evacuation scenario was decided by insights garnered from preceding exercises, aimed at continual refinement. Notably, despite the presence of two evacuation staircases in the building, a single staircase was solely employed in the evacuation drill. This approach was undertaken due to the drill’s selective nature, tailored exclusively for occupants who express a willingness to participate, thus aiming to replicate the evacuation flow as accurately as possible for the entire building population.
In the phased evacuation scenario conducted during the evacuation drill, the goals were as follows: (1) Ensure that the evacuation flow at the stair exit on the 1st floor was not interrupted, avoiding unnecessary extension of the total evacuation time, (2) prevent heavy congestion in the staircase due to merging and (3) prioritize the evacuation of floors that may be affected by smoke spreading from the fire floor to certain shafts, such as the top floors and top floors of the lift bank.
Illustrated in Figure 2 is a visual representation of the evacuation plan for each phase of the conducted drill. The 4th floor was designated as the fire floor, and subsequently, the two floors directly above it comprised the 1st phase of the evacuation scenario (ranging from the 4th to the 6th floors). Progressing to the 2nd phase, encompassing the uppermost five floors (21st to 25th) and the consecutive six floors (7th to 12th) above those covered in the 1st phase, directives were issued 2 min after the onset of the 1st phase. Subsequently, the 3rd phase, which included the 17th to 20th floors along with the 2nd and 3rd floors, was initiated 3 min after the 2nd phase. The final iteration, designated as the 4th phase, encompassed the 13th to 16th floors, with instructions disseminated 4 min after the 3rd phase. All instructions were conveyed via the disaster centre’s broadcasting system, ensuring clarity and uniformity in communication. Evacuation scenario of the timing for comparative analysis.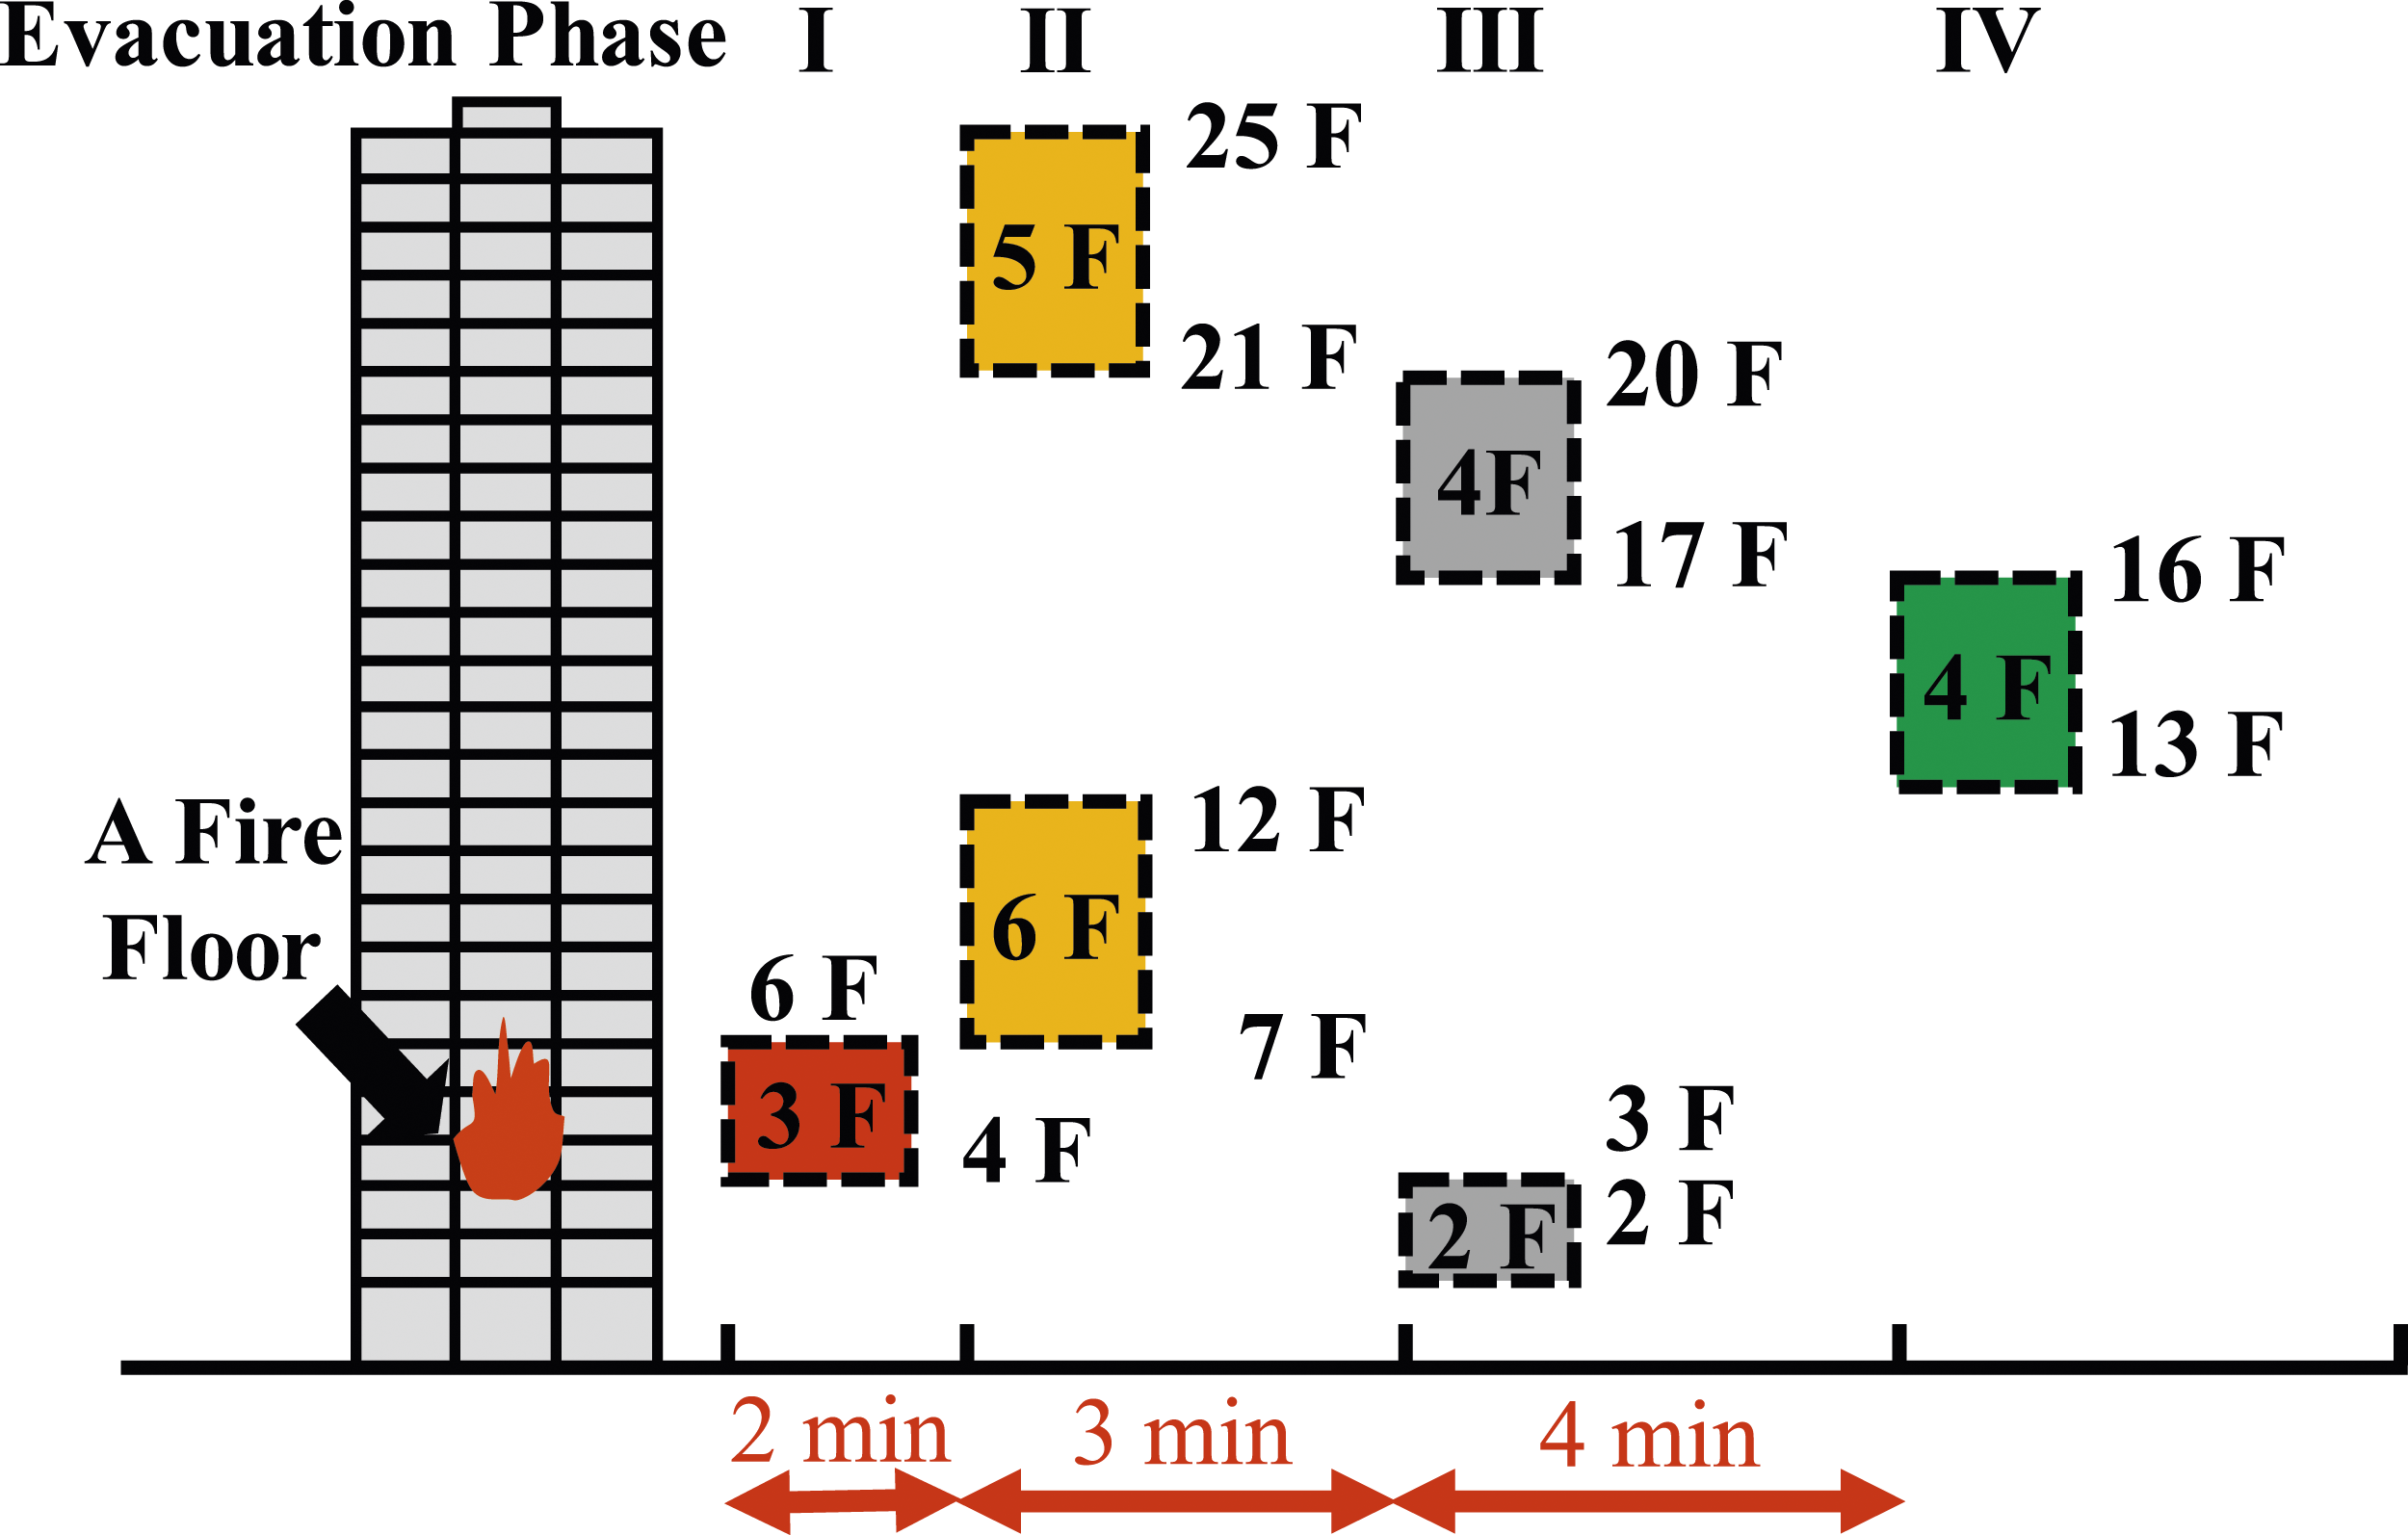
SimTread (hereafter, ST) 31
In this study, the evacuation simulation software ‘SimTread’ was employed, which was a commercial product developed by A&A Co., Ltd. and widely utilized in Japan. SimTread is seamlessly integrated as a plug-in software within the CAD program ‘Vectorworks’. A primary purpose of using SimTread revolves around evaluating evacuation flow dynamics, and its role is officially recognized and endorsed by the Tokyo Fire Department. SimTread operates on a multi-agent model, representing individual pedestrians as discrete agents.
There is evacuation simulation software that can simulate evacuation with agent-based methods such as EXODUS, 35 Pathfinder 36 and FDS+Evac. 37 In EXODUS, agents go to the closest exit considering the fire-hazard and smoke toxicity. In Pathfinder, the movements of agents can be detailed such as designated points to pass, waiting time at designated areas and using lifts. In FDS + Evac, the movement algorithm is called Social Force Model based on the Helbing model 37 (panic situations) describing the smoke that affects the agents’ behaviour. SimTread is one of the agent-based evacuation simulations, but it simulates the evacuation without considering the fire, smoke and panic situations in agents. The staircase is a fire- and smoke-proof space, so the effect of smoke or fire on agents does not need to be considered. Moreover, the scope of this study is to enhance the simulation ability of staircase evacuation in high-rise buildings, so the evacuation by lift and temporary refuge areas (hereafter, TRA) were not used. Thus, panic situations, the effect of the smoke or fire, evacuation using lifts and waiting in the TRA were not needed. Compared to other agent-based evacuation simulations, SimTread excels in its ability to simulate stair evacuation with simplicity. Therefore, it can outperform other simulation software to provide a simple and accurate modelling of stair evacuation.
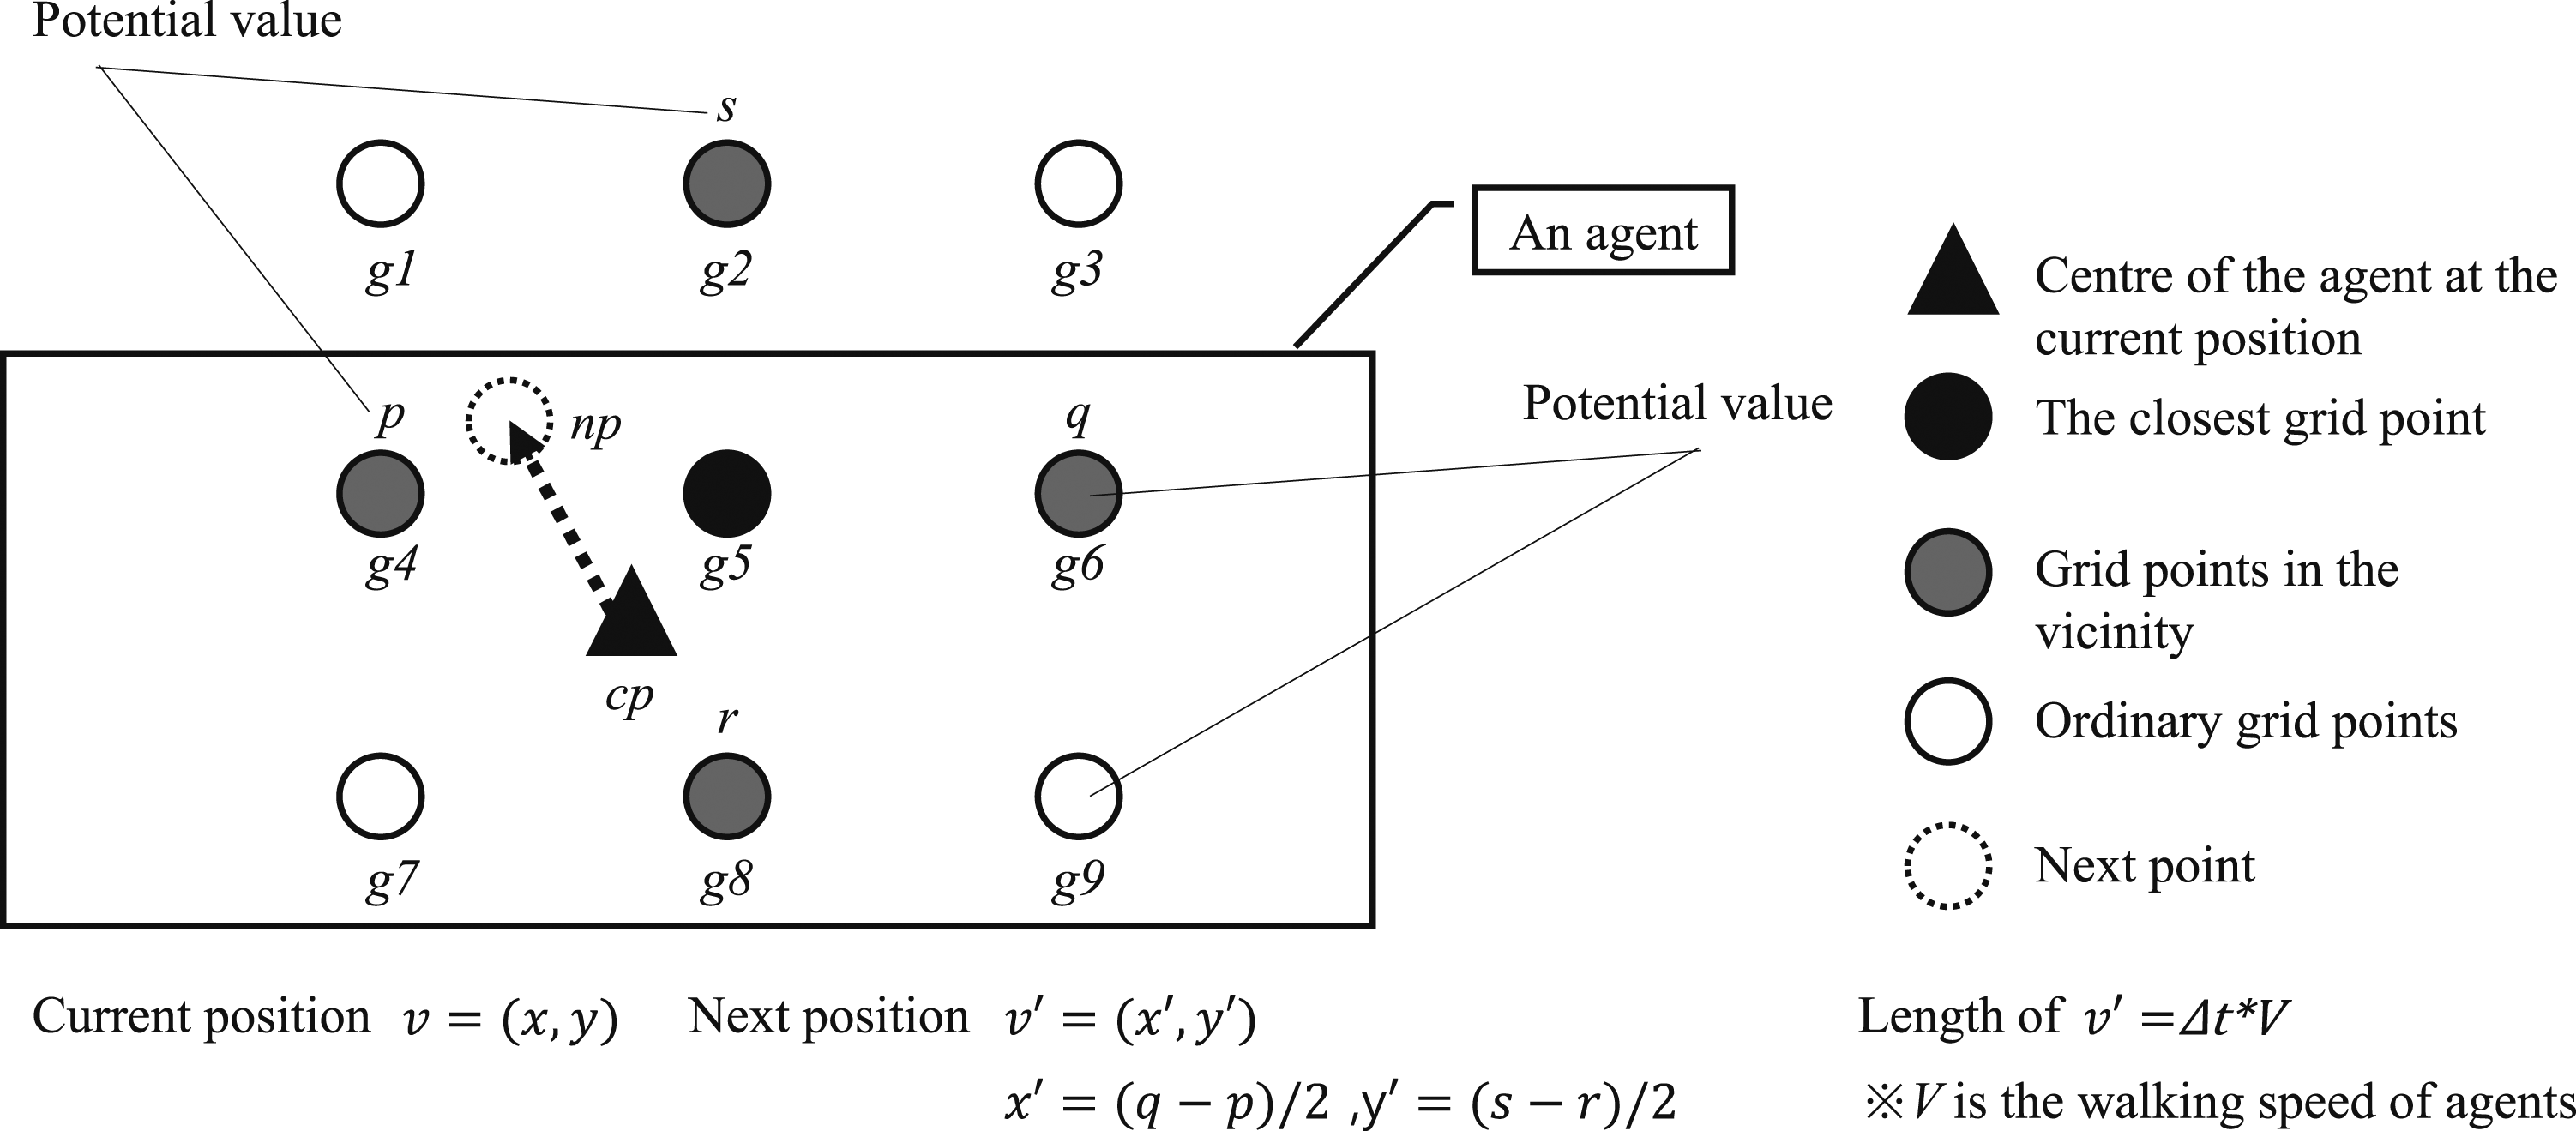
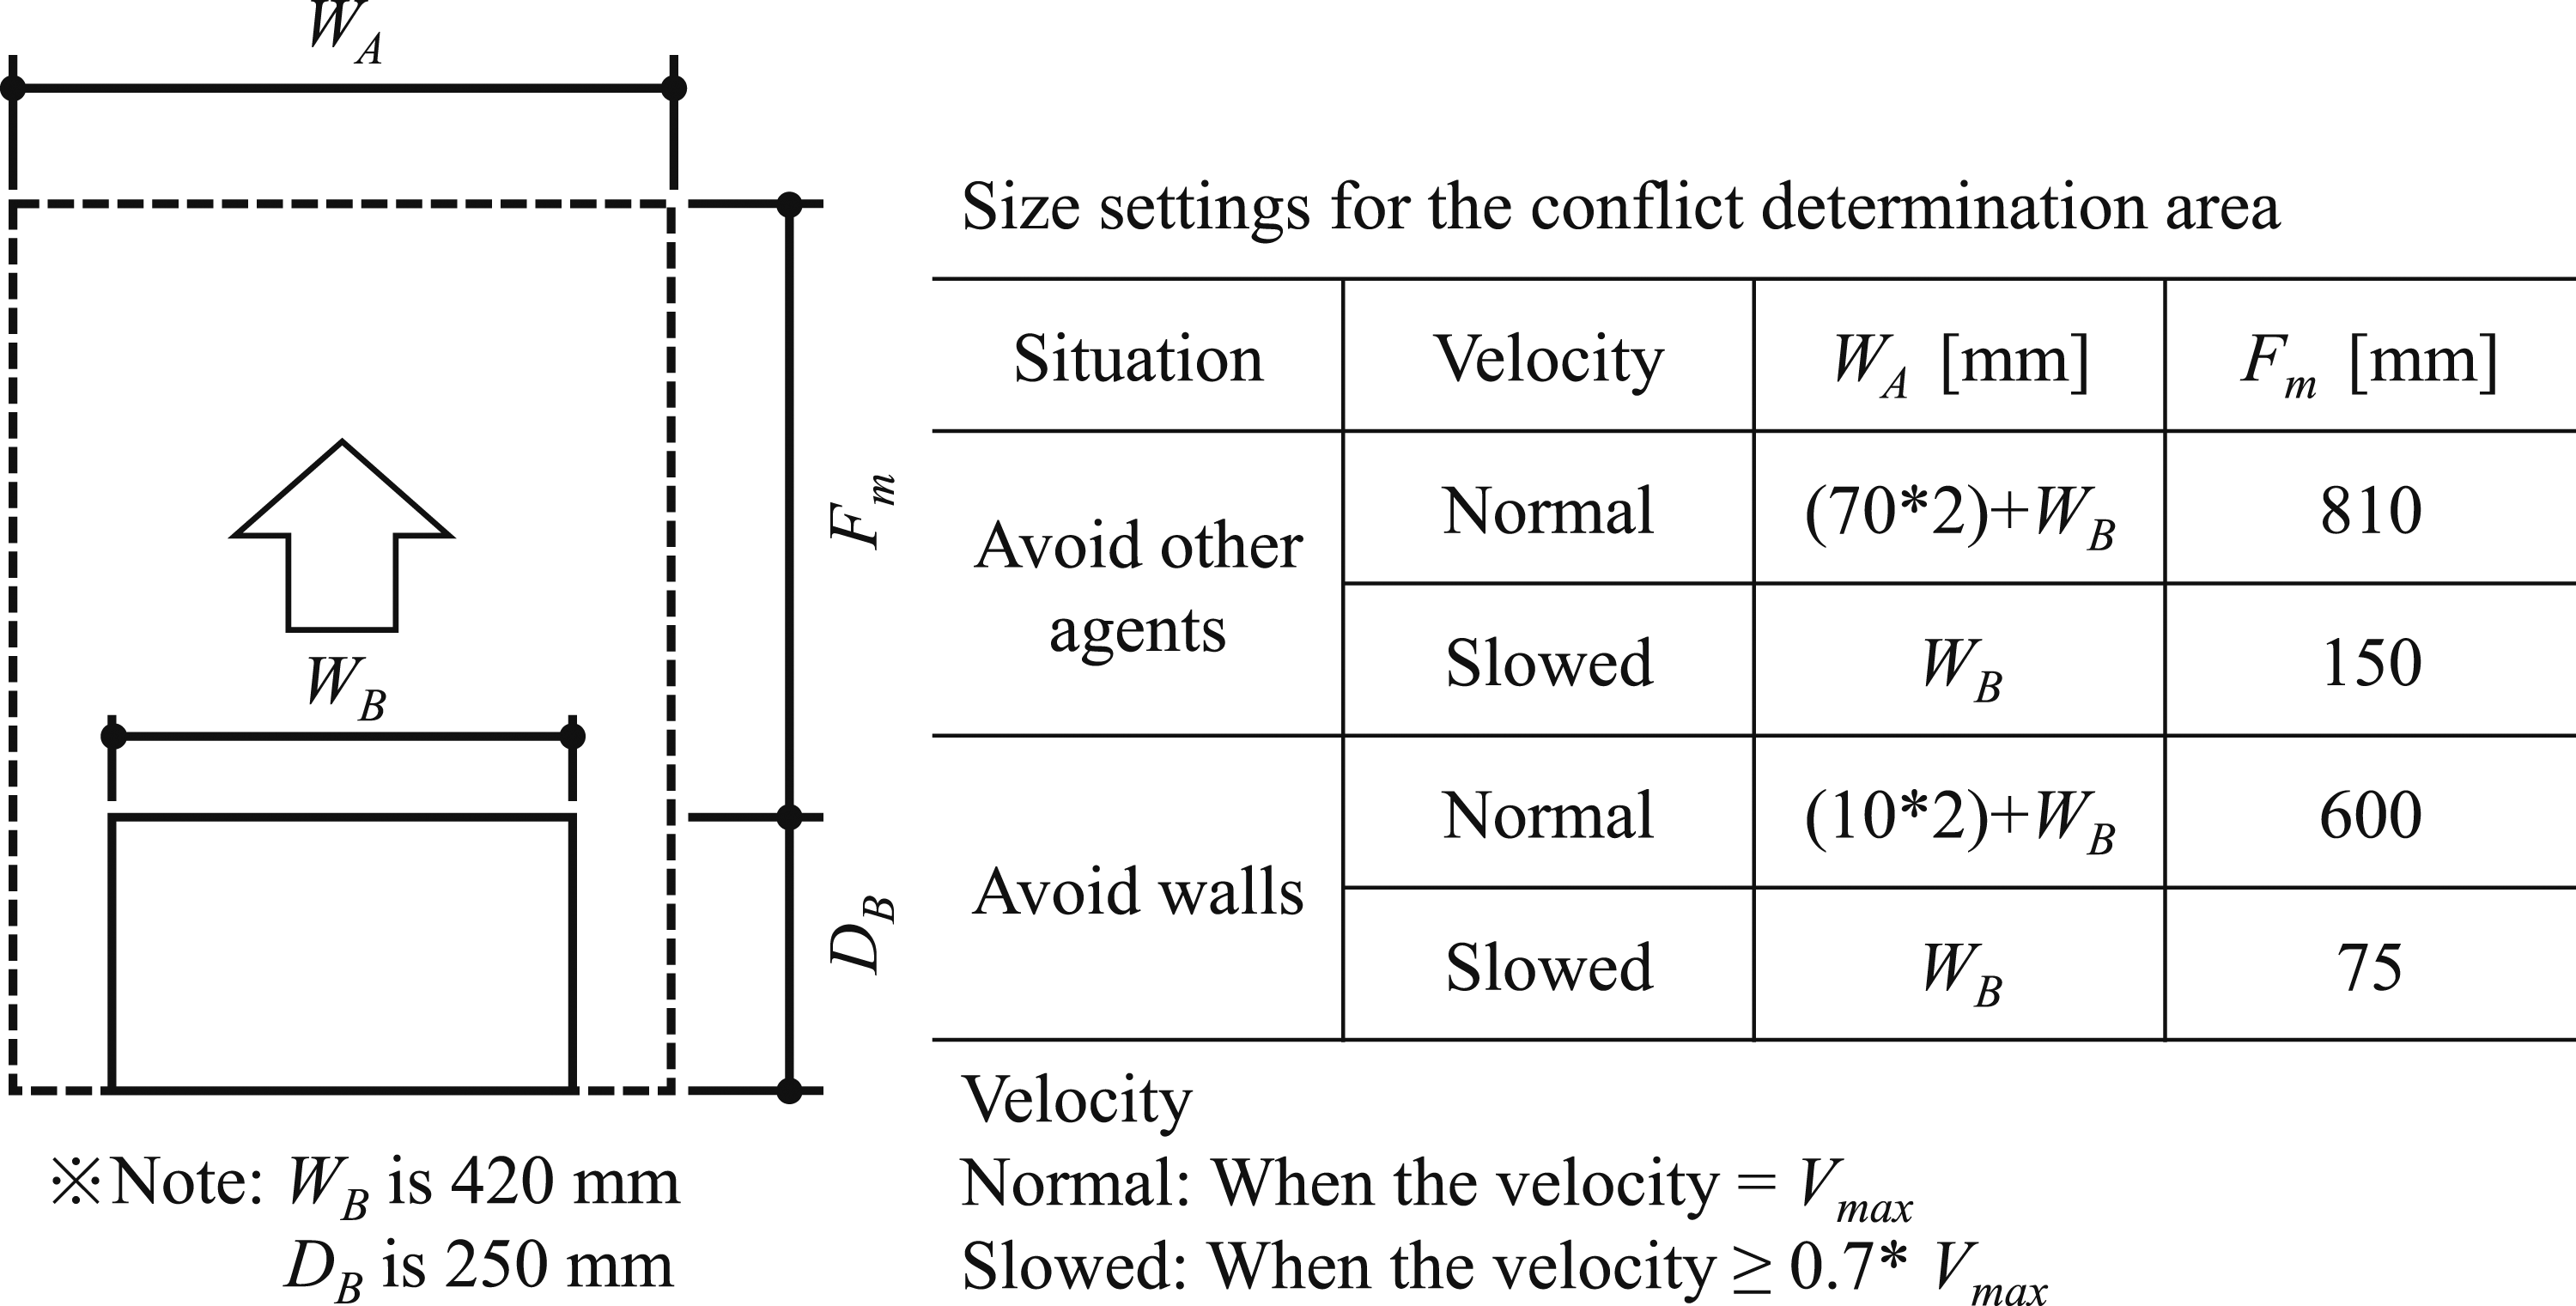
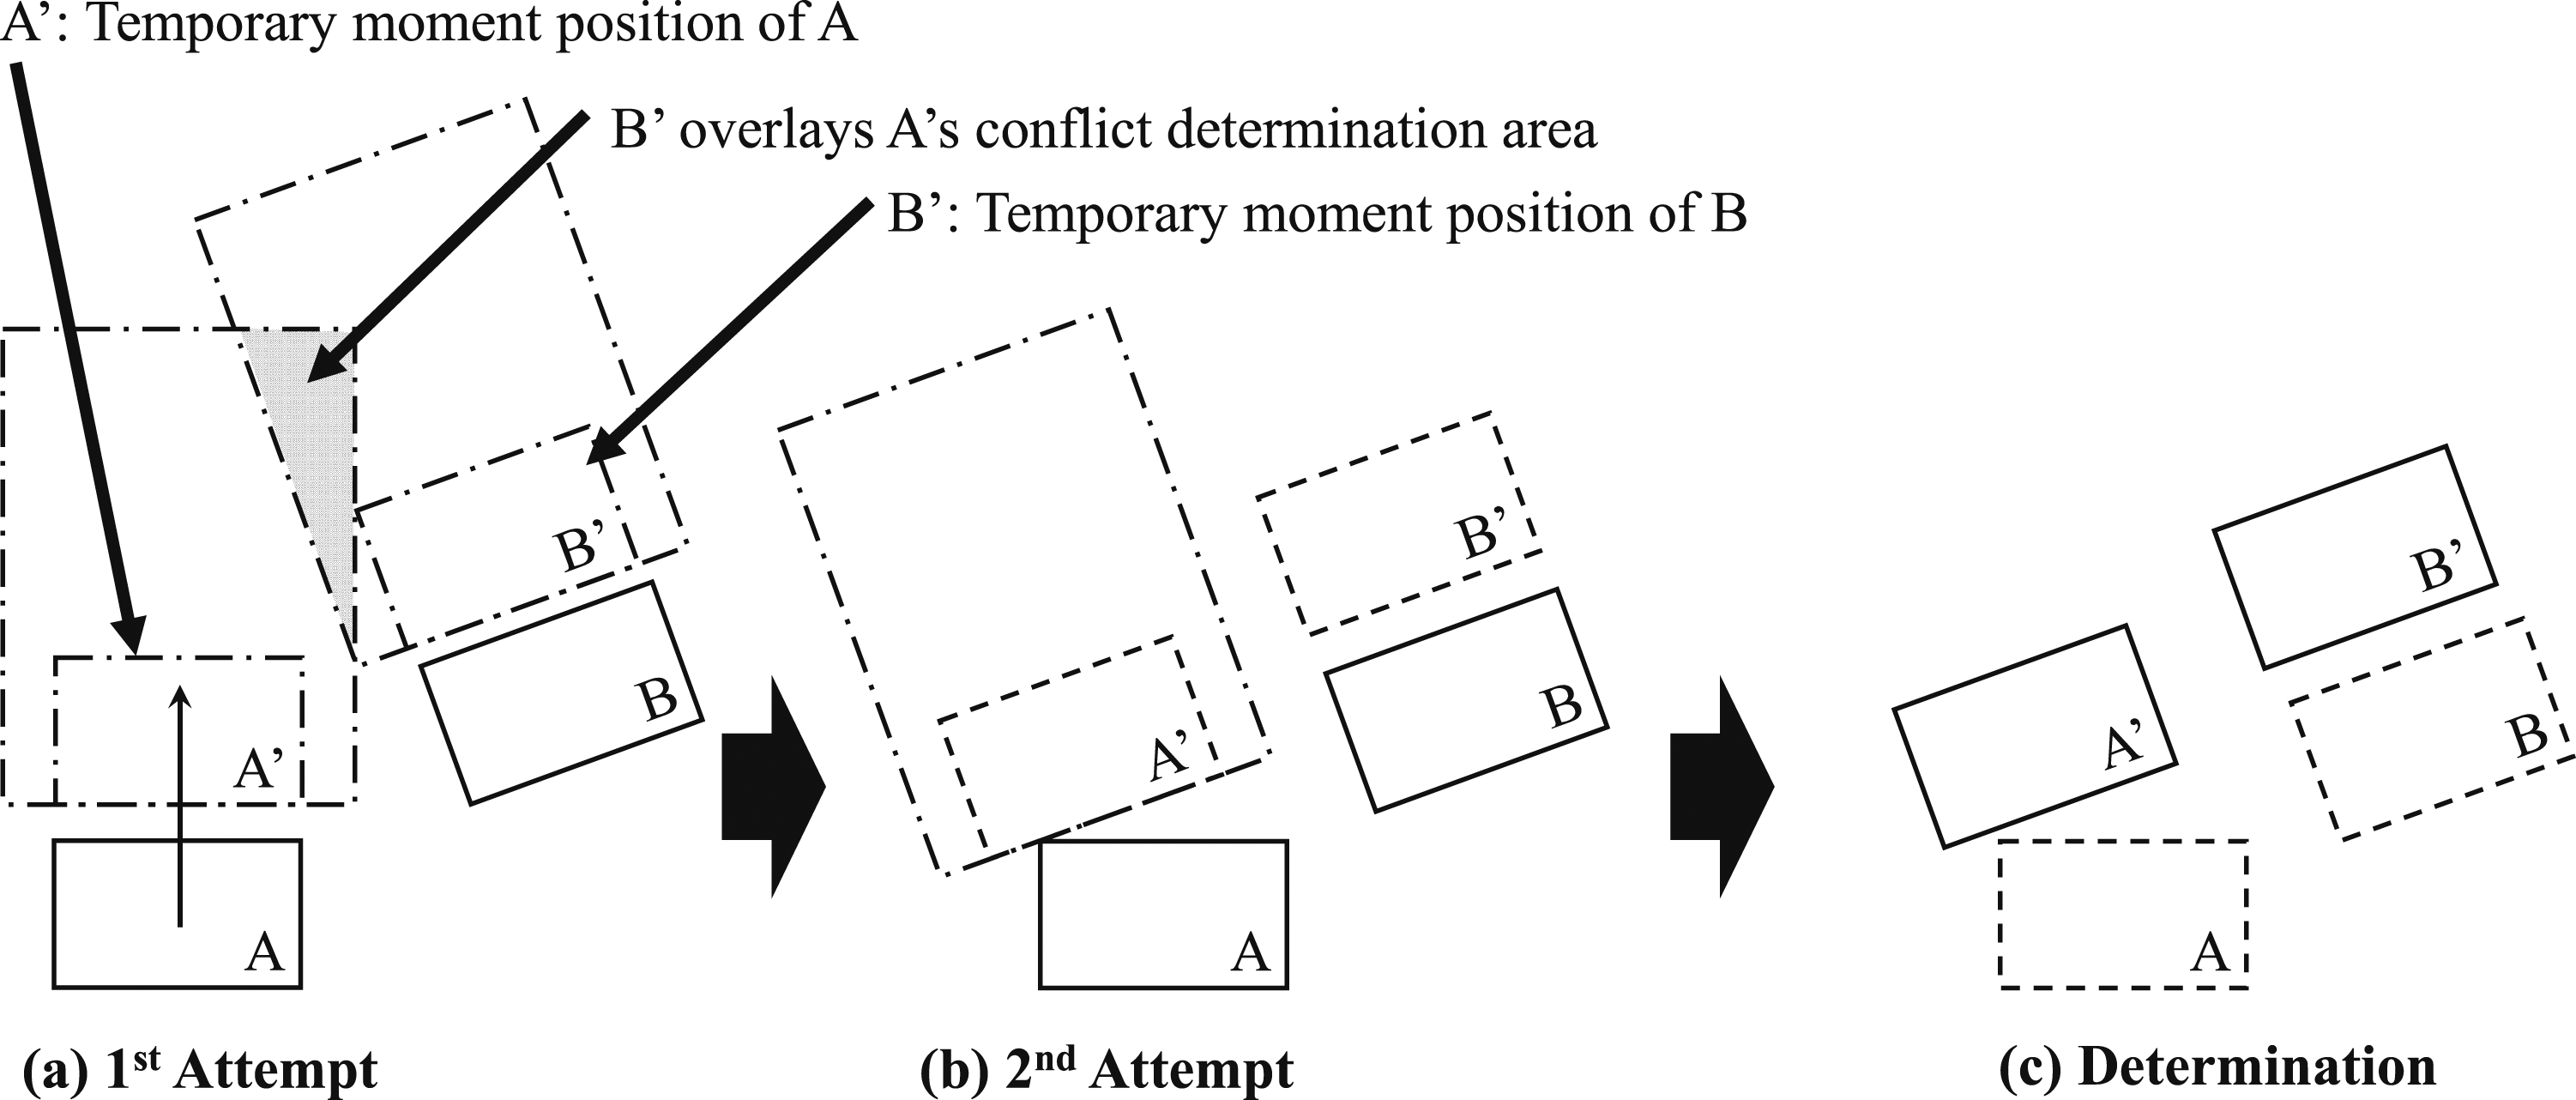
The cumulative crowd movement was emulated through the orchestrated motion of these agents, following specific movement rules outlined as follows. Additionally, the simulation procedures adhered to the subsequent guidelines: (A) Calculation time interval (∆t): The temporal progression of calculations was governed by the time interval ∆t. Calculations encompassed the continuous assessment of “temporary position,” “conflict avoidance” and “movement to temporary positions” for all agents until they reach their final destinations. The preset interval for ∆t was 0.2 s. (B) Distance grid points: The simulation incorporates a system of distance grid points, which was strategically positioned and was set at 100 mm intervals to enable the computation of the shortest path for each agent towards their respective destinations. (C) Temporary position calculation: The determination of temporary positions followed a structured sequence, referring to Figure 3 for visual aid. The process is outlined as 1. Identifying the grid point closest to the agent’s centre. 2. Identifying the horizontally and vertically adjacent grid points, along with their corresponding potential values. 3. Calculating the directional vector v’ and subsequently evaluating its magnitude (length). (D) Conflict avoidance: Once agents have transitioned to their temporary positions, the presence of other agents or obstacles such as walls within the conflict determination area, depicted in Figure 4, could trigger a conflict condition. When such a conflict scenario arises, the temporary position undergoes recalibration, as illustrated in Figure 3. As demonstrated in Figure 3, if a conflict is identified at the current position coordinate (x, y), the ensuing position coordinate (x′, y′) are determined based on the potential value derived from the length and direction of the final exit (x′ = (q − p)/2, y′ = (s − r)/2). (E) Conflict determination area: The conflict determination area (Figure 4) can encompass two distinct stages contingent on agents’ situational contexts. In this model, the intrinsic attributes of crowd flow, such as flow rate or density, wield substantial influence in delineating the dimensions of the conflict area. (F) Recalculation of the temporary position: To elucidate conflict avoidance, Figure 5 offers an illustrative example. In Figure 5(a), the conflict determination area of B’ was encapsulated within the conflict determination area of A.’ Subsequently, to avert this conflict, the position of A’ was adjusted to alter its movement direction, as portrayed in the second attempt depicted in Figure 5(b). With B’ no longer intersecting A’s conflict determination area, as shown in Figure 5(c), the position of A’ was effectively determined during this second endeavour. Following the recalculation of the temporary movement position, the agent proceeded to the newly designated location. The process of recalculating the temporary movement position to resolve conflict avoidance entailed an iterative adjustment of the agent’s rotational direction (∆θ = 12°) within a range of 90° until conflict resolution was achieved. If this rotation does not lead to a suitable position, the agent remained stationary during this calculation step. Subsequently, in the subsequent calculation iteration, the movement distance was curtailed by 30% (i.e. reduced to 70%), accompanied by another attempt at directional rotation. This iterative recalibration of the temporary movement position was limited to 25 iterations. If all attempts were unsuccessful, the agent’s movement distance was set to zero, resulting in the agent’s immobility during the calculation step ∆t. However, following conflict resolution, agents was reverted to moving at their maximum walking speed, a pattern that propagated from the forefront to the tail of the evacuation flow. Process of the temporary position calculation. Conflict determination area of an agent in SimTread. Sample of conflict avoidance between two agents in SimTread: (a) 1st attempt, (b) 2nd attempt and (c) determination.
Within the SimTread framework, the software operates under the assumption that agents traverse on a horizontal plane, as it lacks components to model vertical movement, such as stairs. Consequently, a strategy was employed to simulate agents descending stairs by creating virtual boundaries that link upper and lower floor levels. Moreover, the default walking speed established in SimTread was set at 1.0 m/s. However, in the context of this study, to accurately replicate the evacuation flow observed in the evacuation drill (ED), the walking speed was adjusted to 0.8 m/s. This alteration reflected the fact that evacuees navigating a staircase, forming a low-density crowd, proceeded at a relatively measured pace. Consequently, the average walking speed characteristic of a low-density crowd (below 1.0 p/m2) was adopted within the SimTread simulation environment.
Calculation condition set for ST
The number of evacuees and the entry time of the leading agent to the stairway on each floor in ST.
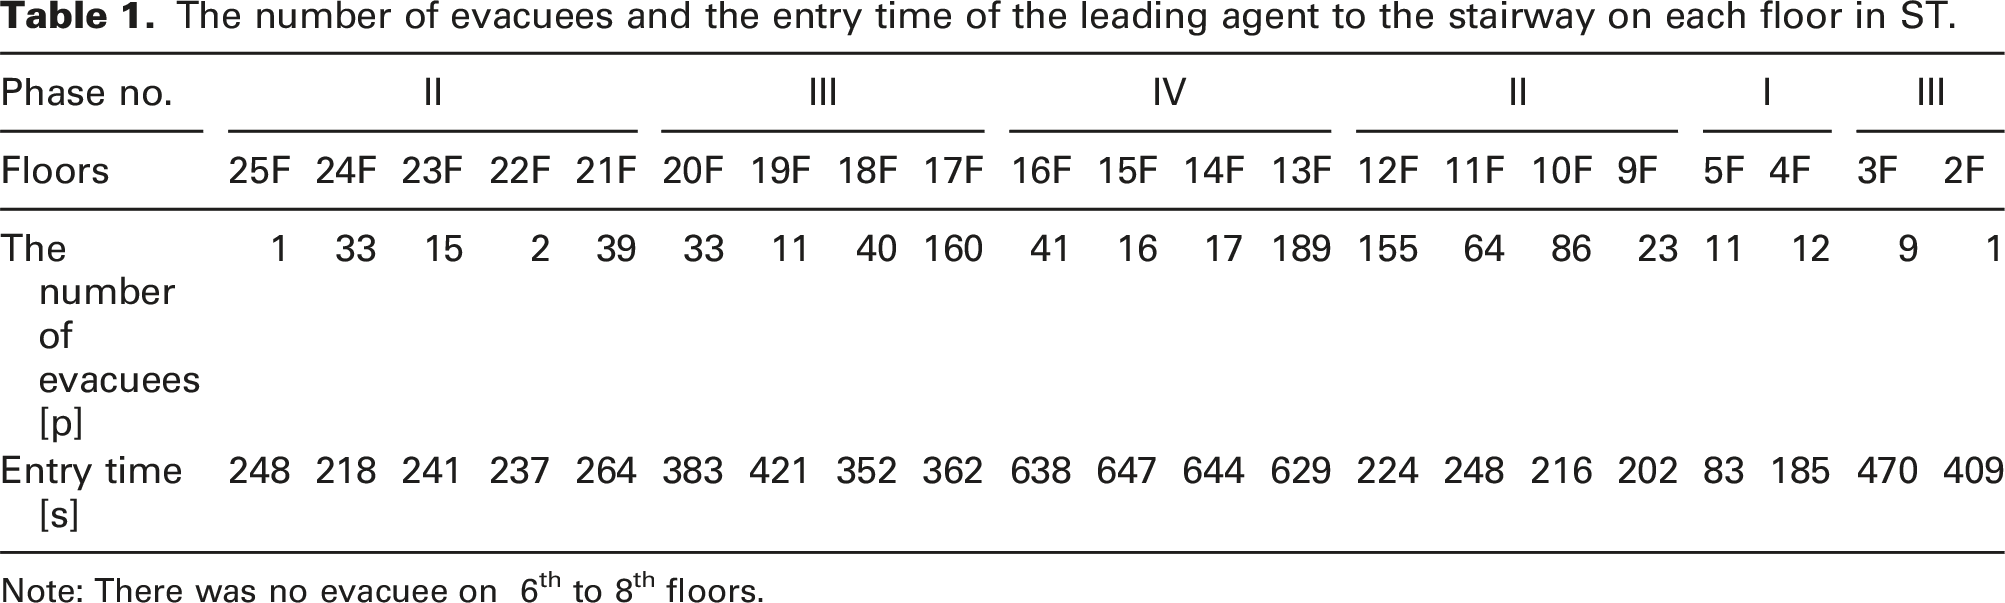
Note: There was no evacuee on 6th to 8th floors.
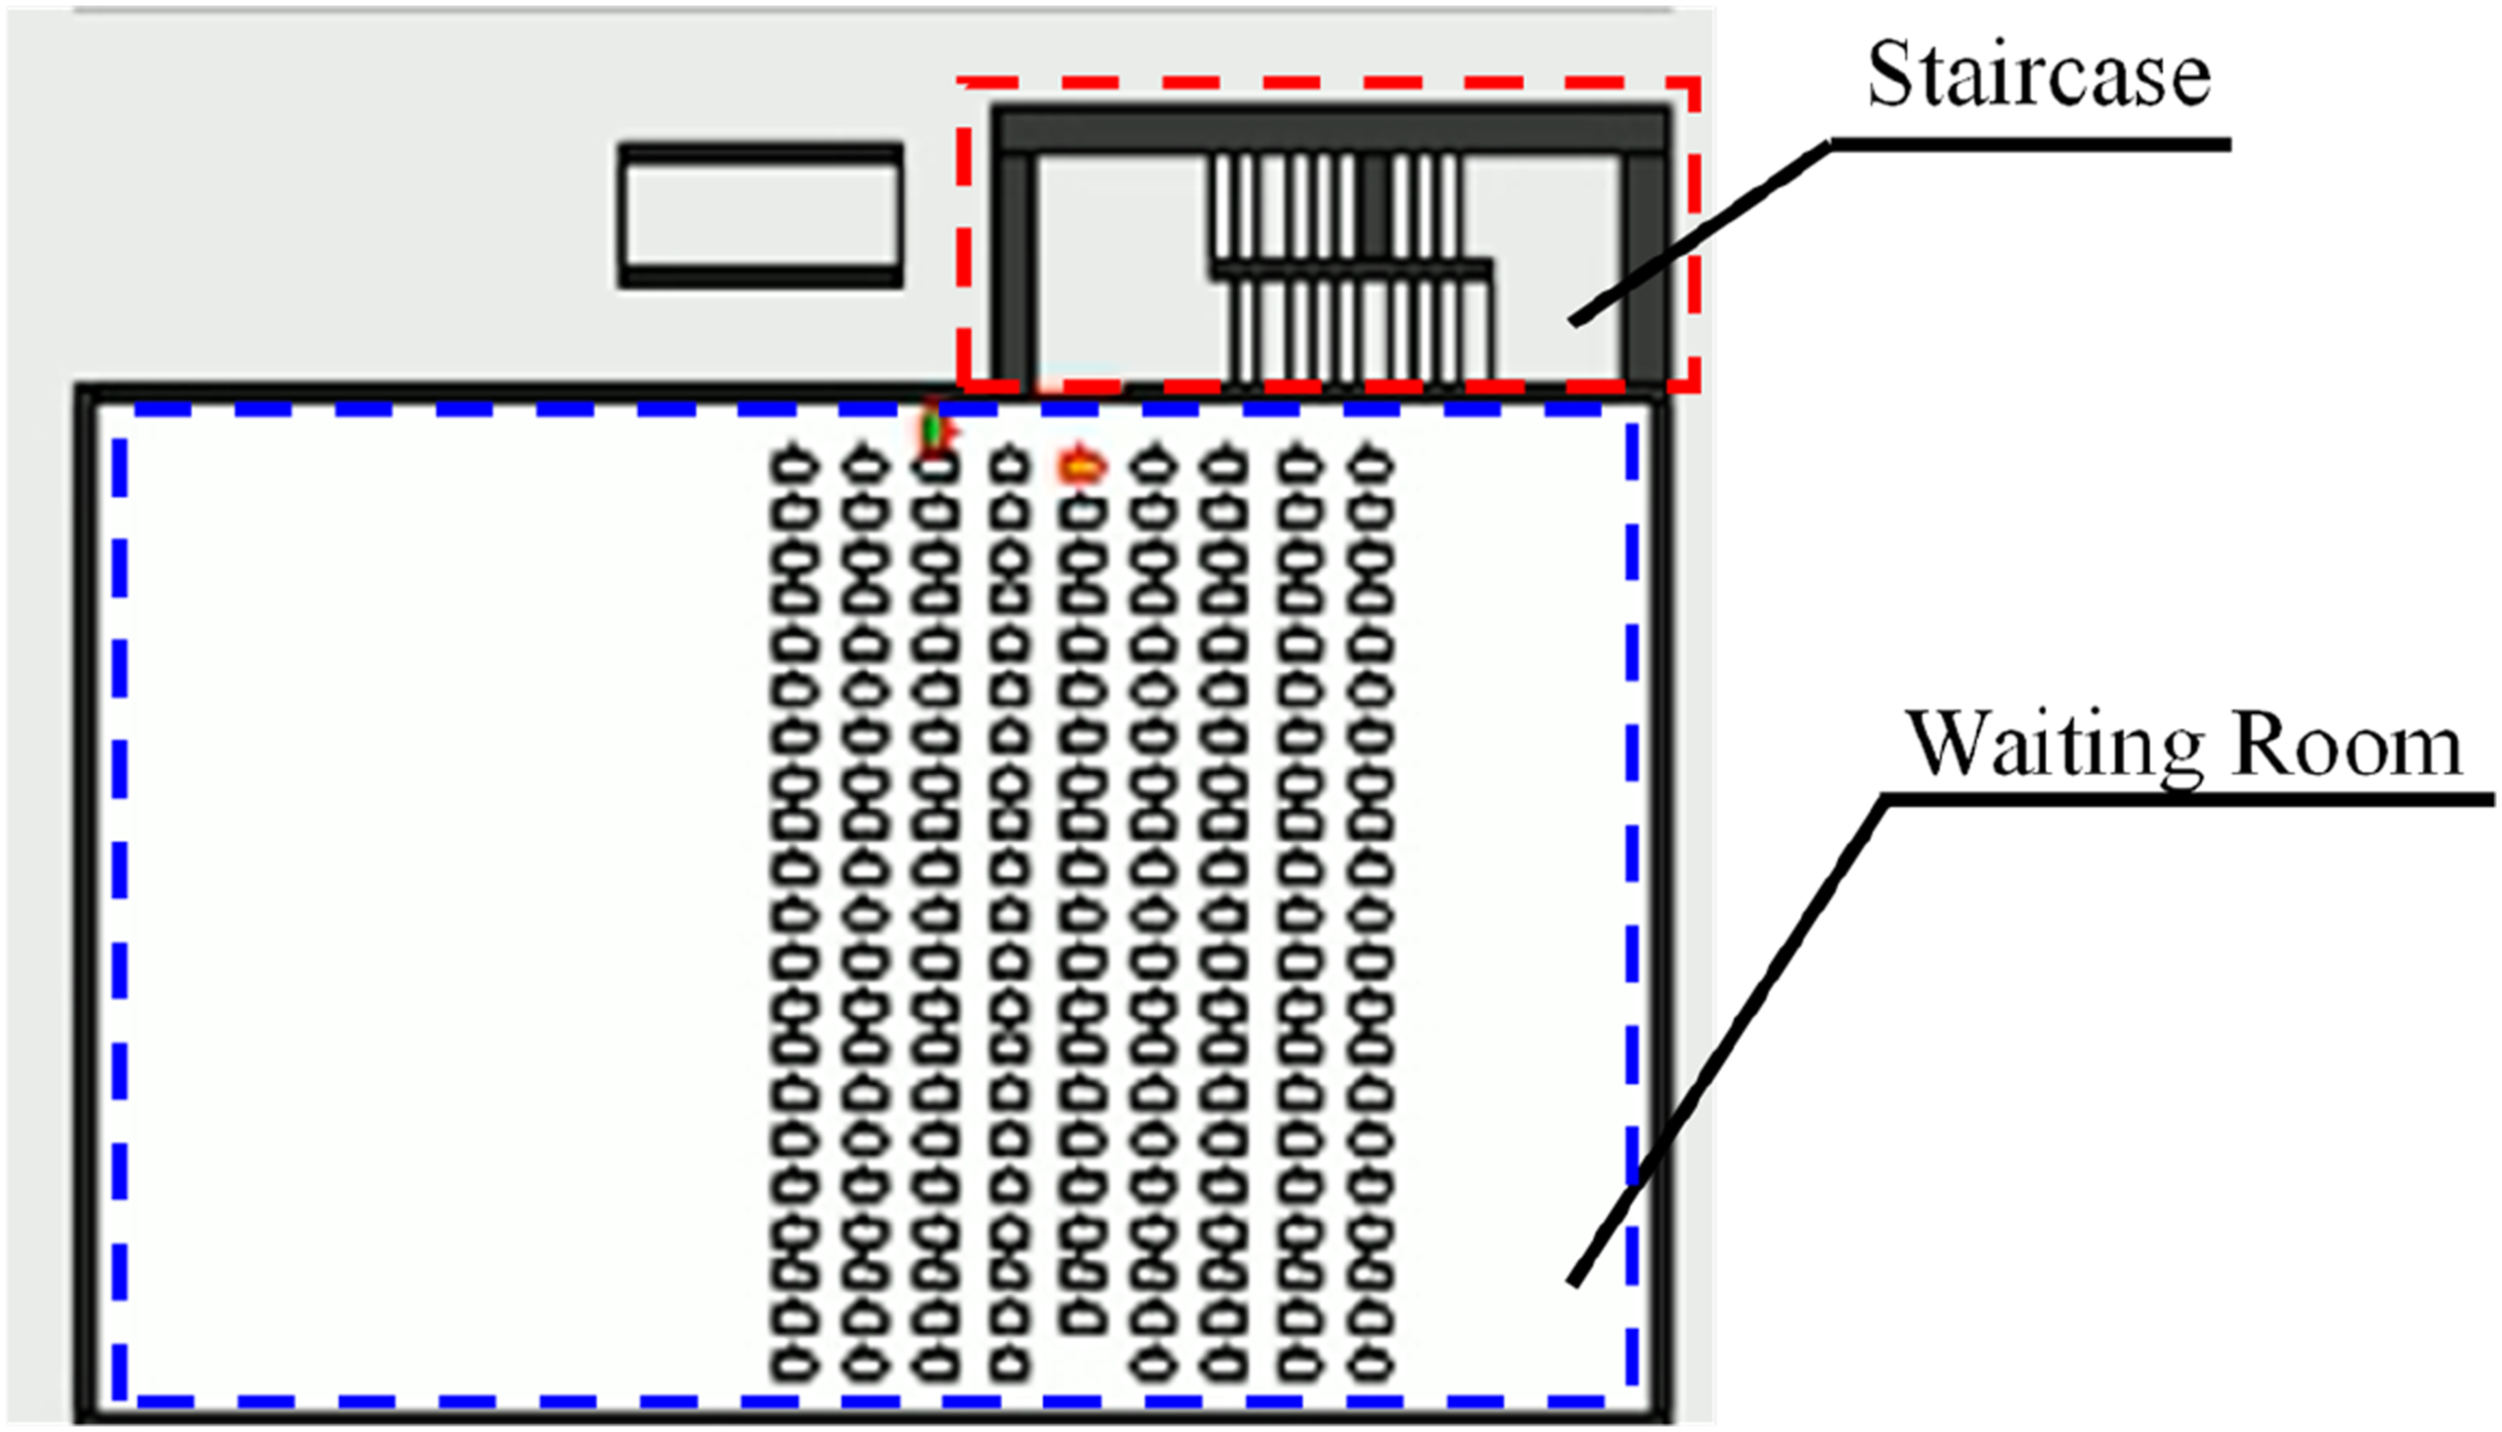
ST’s evacuation standby waiting room and staircase.
Methodology
Recording of the evacuation drill
In order to comprehensively examine the flow dynamics within the stairwell, a systematic approach was employed involving the installation of cameras along the bottom part of the staircase’s handrail on each floor. This strategic camera placement facilitated the recording of the evacuation flow at each landing. Well in advance of the actual evacuation drills, occupants were duly apprised of the recording process, and their participation in the annual drills was entirely voluntary. It is imperative to note that all aspects of the investigation undertaken were meticulously designed to respect the privacy of individuals and avoid any handling of data that could potentially reveal specific personal information. Furthermore, the proposed research protocol underwent rigorous scrutiny and obtained ethical clearance from the ‘Ethics Committee on Research for People’ aligning with the tenets articulated within the ‘Ethics Regulations on Research for People’ at Tokyo University of Science (approval number: 19014).
Data collecting methodology
The accumulation of essential data followed a precise methodology. The counting of evacuees traversing predefined boundaries was conducted at intervals of 1 s, an approach outlined in Figure 1. This process engendered the creation of a meticulously assembled dataset encapsulating pedestrian flow rates over time at these demarcated boundaries. The specific boundaries encompassed the following: Boundary a) Signifying the evacuation flow from a floor to the landing (referred to as FL) Boundary b) Indicative of the evacuation flow transitioning from the upper stairs to the landing (referred to as TL) Boundary c) Denoting the evacuation flow descending from the landing to the lower stairs (referred to as LT) Boundary d) Reflecting the evacuation flow at the 1st-floor exit
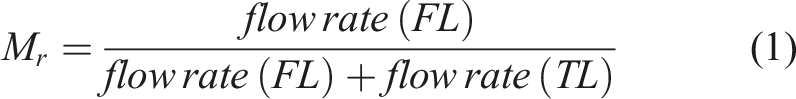
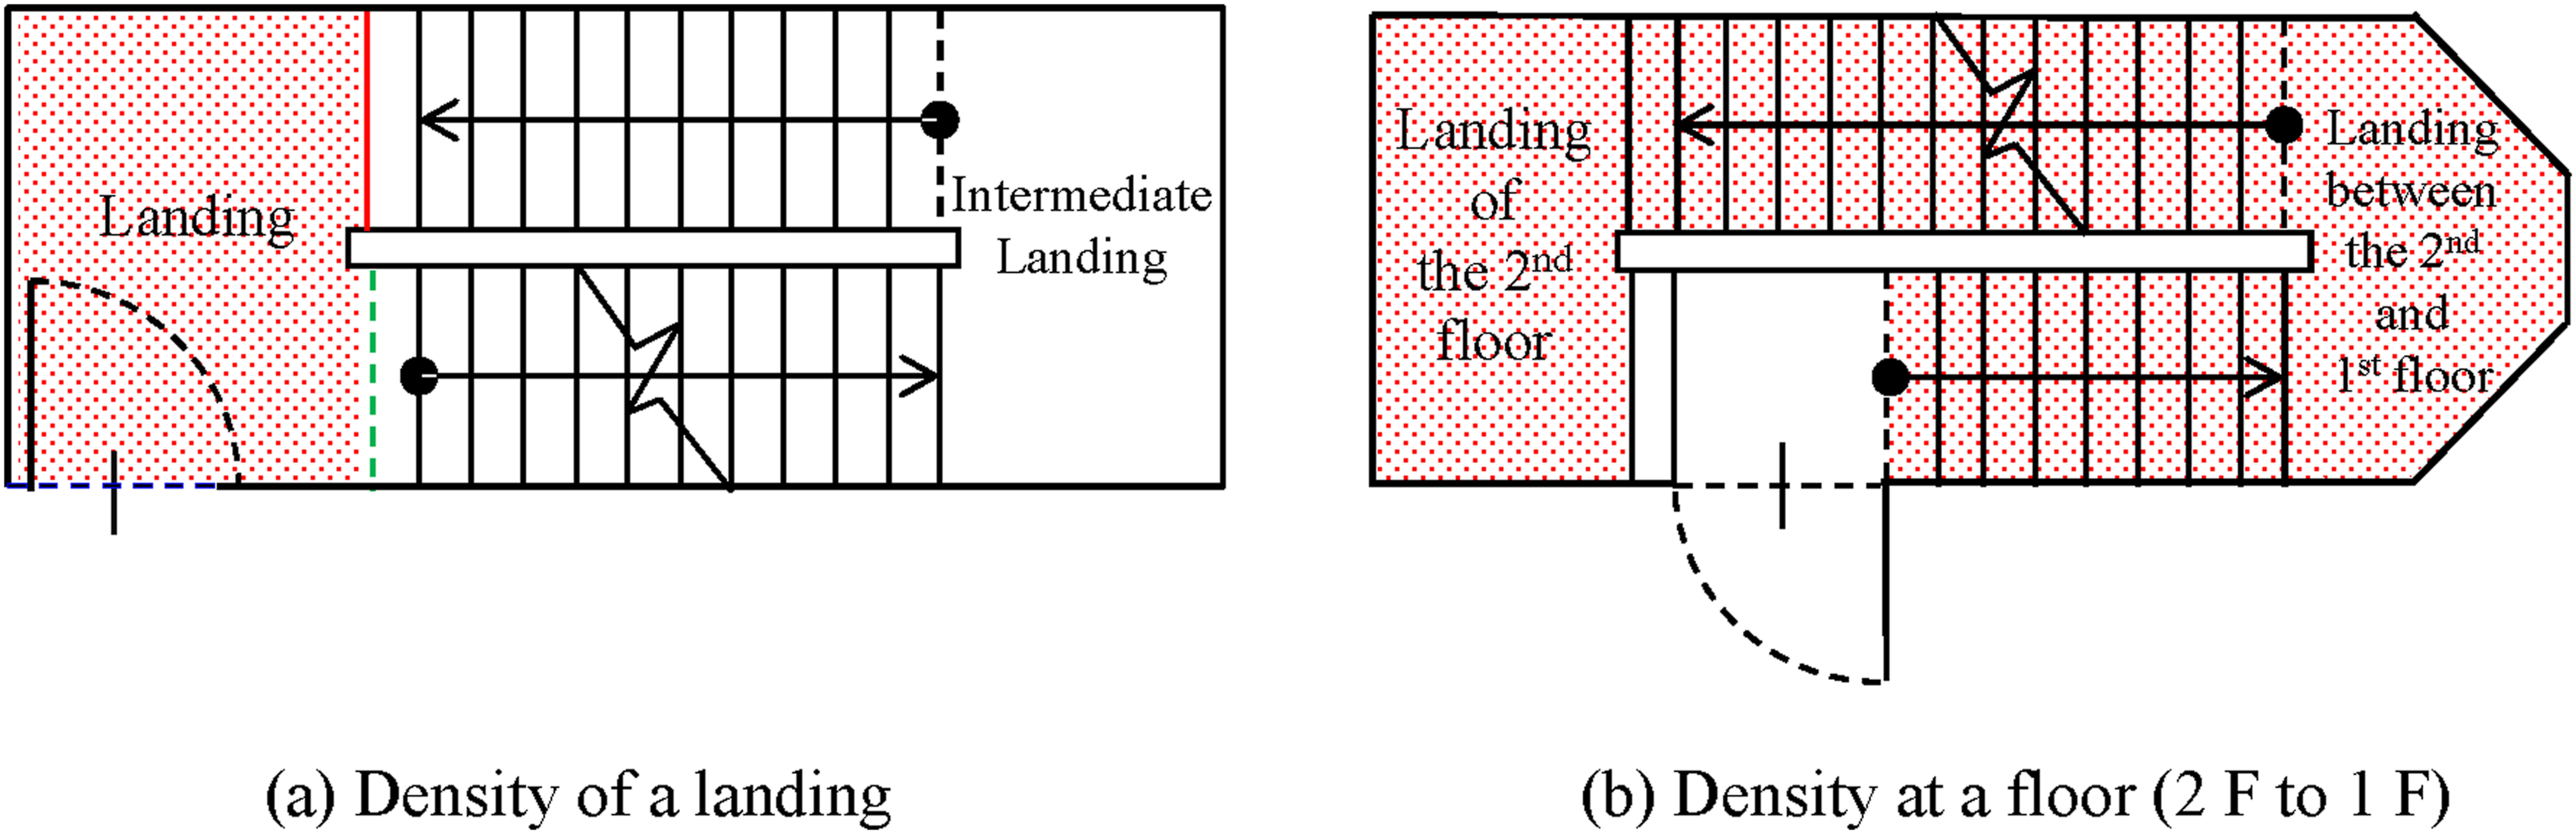
To facilitate a comprehensive comparison and analysis of the evacuation flows across the three specified boundaries on each floor, critical metrics including the flow rate (p/s), merge rate (unitless) and density (p/m2) were methodically calculated. These metrics were computed as outlined below: i. Flow rate: The flow rate signifies the count of individuals traversing the delineated boundaries per second. To obtain robust flow rates, a double moving average was employed over a 15-s interval. ii. Merge rate: The merge rate serves as an evaluative index of the two distinct evacuation flows, FL and TL, converging upon a landing. Within the parameter range of 0 to 0.5, the flow rate TL surpassed the flow rate FL, while in the range of 0.5 to 1, the flow rate FL exceeded the flow rate TL. The computation formula for the merge rate (Mr) is expressed as equation (1): iii. Density: The density was computed as the quotient of evacuees count divided by the floor area specific to the designated location. Within this study, the density region was segregated into two distinctive segments, namely, landings and floors, as illustrated in Figure 7. The landing density served as a pivotal determinant for the merging evacuation flow. Concurrently, the floor density, determined by dividing the number of evacuees in the area with two flights of stairs by the floor area, was proven to be a significant factor influencing the evacuation flow at the 1st-floor exit after merging. The area of two types of densities: (a) density of a landing and (b) density at a floor (2F to 1F).
Tracer’s role in capturing stairwell descent dynamics
In pursuit of comprehensively grasping the intricate dynamics of stairwell evacuation flows, a method involving both individuals descending the stairs alongside evacuees and designated tracers was employed. These tracers were entrusted with the task of close monitoring and tracking the progress of evacuees during the stairwell descent, aptly earning them the moniker of ‘tracers’. Within the ST simulation, the role of front and rear individuals was assumed by these tracers. The empirical ED featured two distinct categories of tracers: the ‘first’ and ‘second’ tracers. On the floors subject to investigation, the first tracers were deployed across the 9th to 25th floors, aligning their movement with the vanguard of evacuee groups. Conversely, the second tracers were positioned between the 9th and 25th floors, where more than 30 occupants were accommodated, closely tailing groups of rearward evacuees. Notably, the criterion for forming a group of evacuees involved four individuals entering the stairwell within a 10-second timeframe. In ST, the role of the first tracers mirrored that of the lead evacuees, whereas the second tracers effectively presented the tail-end evacuees. Distinct identifiers, ‘F’ for ‘First’ and ‘S’ for ‘Second’, were appended to the tracer’s position within the building, thereby categorizing them into their respective roles. For instance, the first tracer on the 25th floor was designated as ‘25F_F’ in the ensuing results.
Results, discussion and improvement suggestions
Stairwell evacuation dynamics: Tracer’s descent analysis
The stairwell evacuation dynamics were meticulously examined by scrutinizing the descent patterns of tracers in both the empirical ED and ST simulation, as depicted in Figure 8. The results of this analysis provided critical insights into the effectiveness of simulation in accurately reproducing the evacuation scenarios. As illustrated in Figure 8(a), the ED tracer descent trends revealed several notable observations. Tracers encountered extended descent times within specific segments, 18→17F, 14→13F, 12→11F, 11→10F and 7→6F. These elongated descent periods correlated with instances of merging evacuees at the 17th, 13th, 11th and 10th floors, leading to congestion and subsequently longer evacuation times. An additional anomaly was identified in the 7→6F segment, attributed to an evacuee experiencing leg pain, impeding the fluidity of evacuation flow and subsequently increasing the tracer’s descent time. Conversely, the ST simulation outcomes, depicted in Figure 8(b), manifested a parallel pattern of prolonged descent in certain sections: 18→17F, 15→14F, 14→13F, 13→12F and 12→11F. Evidently, these outcomes closely aligned with the ED results, where evacuee merging occurred at the 17th, 13th, 12th and 11th floors. However, divergence emerged below the 6th floor in ST, as the descent times of 12F_F, 11F_F and 10F_S notably decreased (indicated by black square plots connected by solid black lines). A similar trend was observed for 10F_F and 9F_F, with their descent times registering lower compared to other tracers. Notably, the average descent time for 12F_F, 11F_F, 10F_F, 9F_F and 10F_S was calculated as 13.4 s according to Figure 8(b). Conversely, the ST simulation presented a contrastingly varied scenario for the remaining tracers (grey lines), with their descent times significantly increasing below the 6th floor. The average descent time for these tracers in that range was recorded as 27.6 s. It is important to highlight that ED results did not exhibit the pronounced decrease in descent times as observed in ST for tracers 12F_F, 11F_F and 10F_S. Stair descent time of tracers between each floor: (a) ED and (b) ST.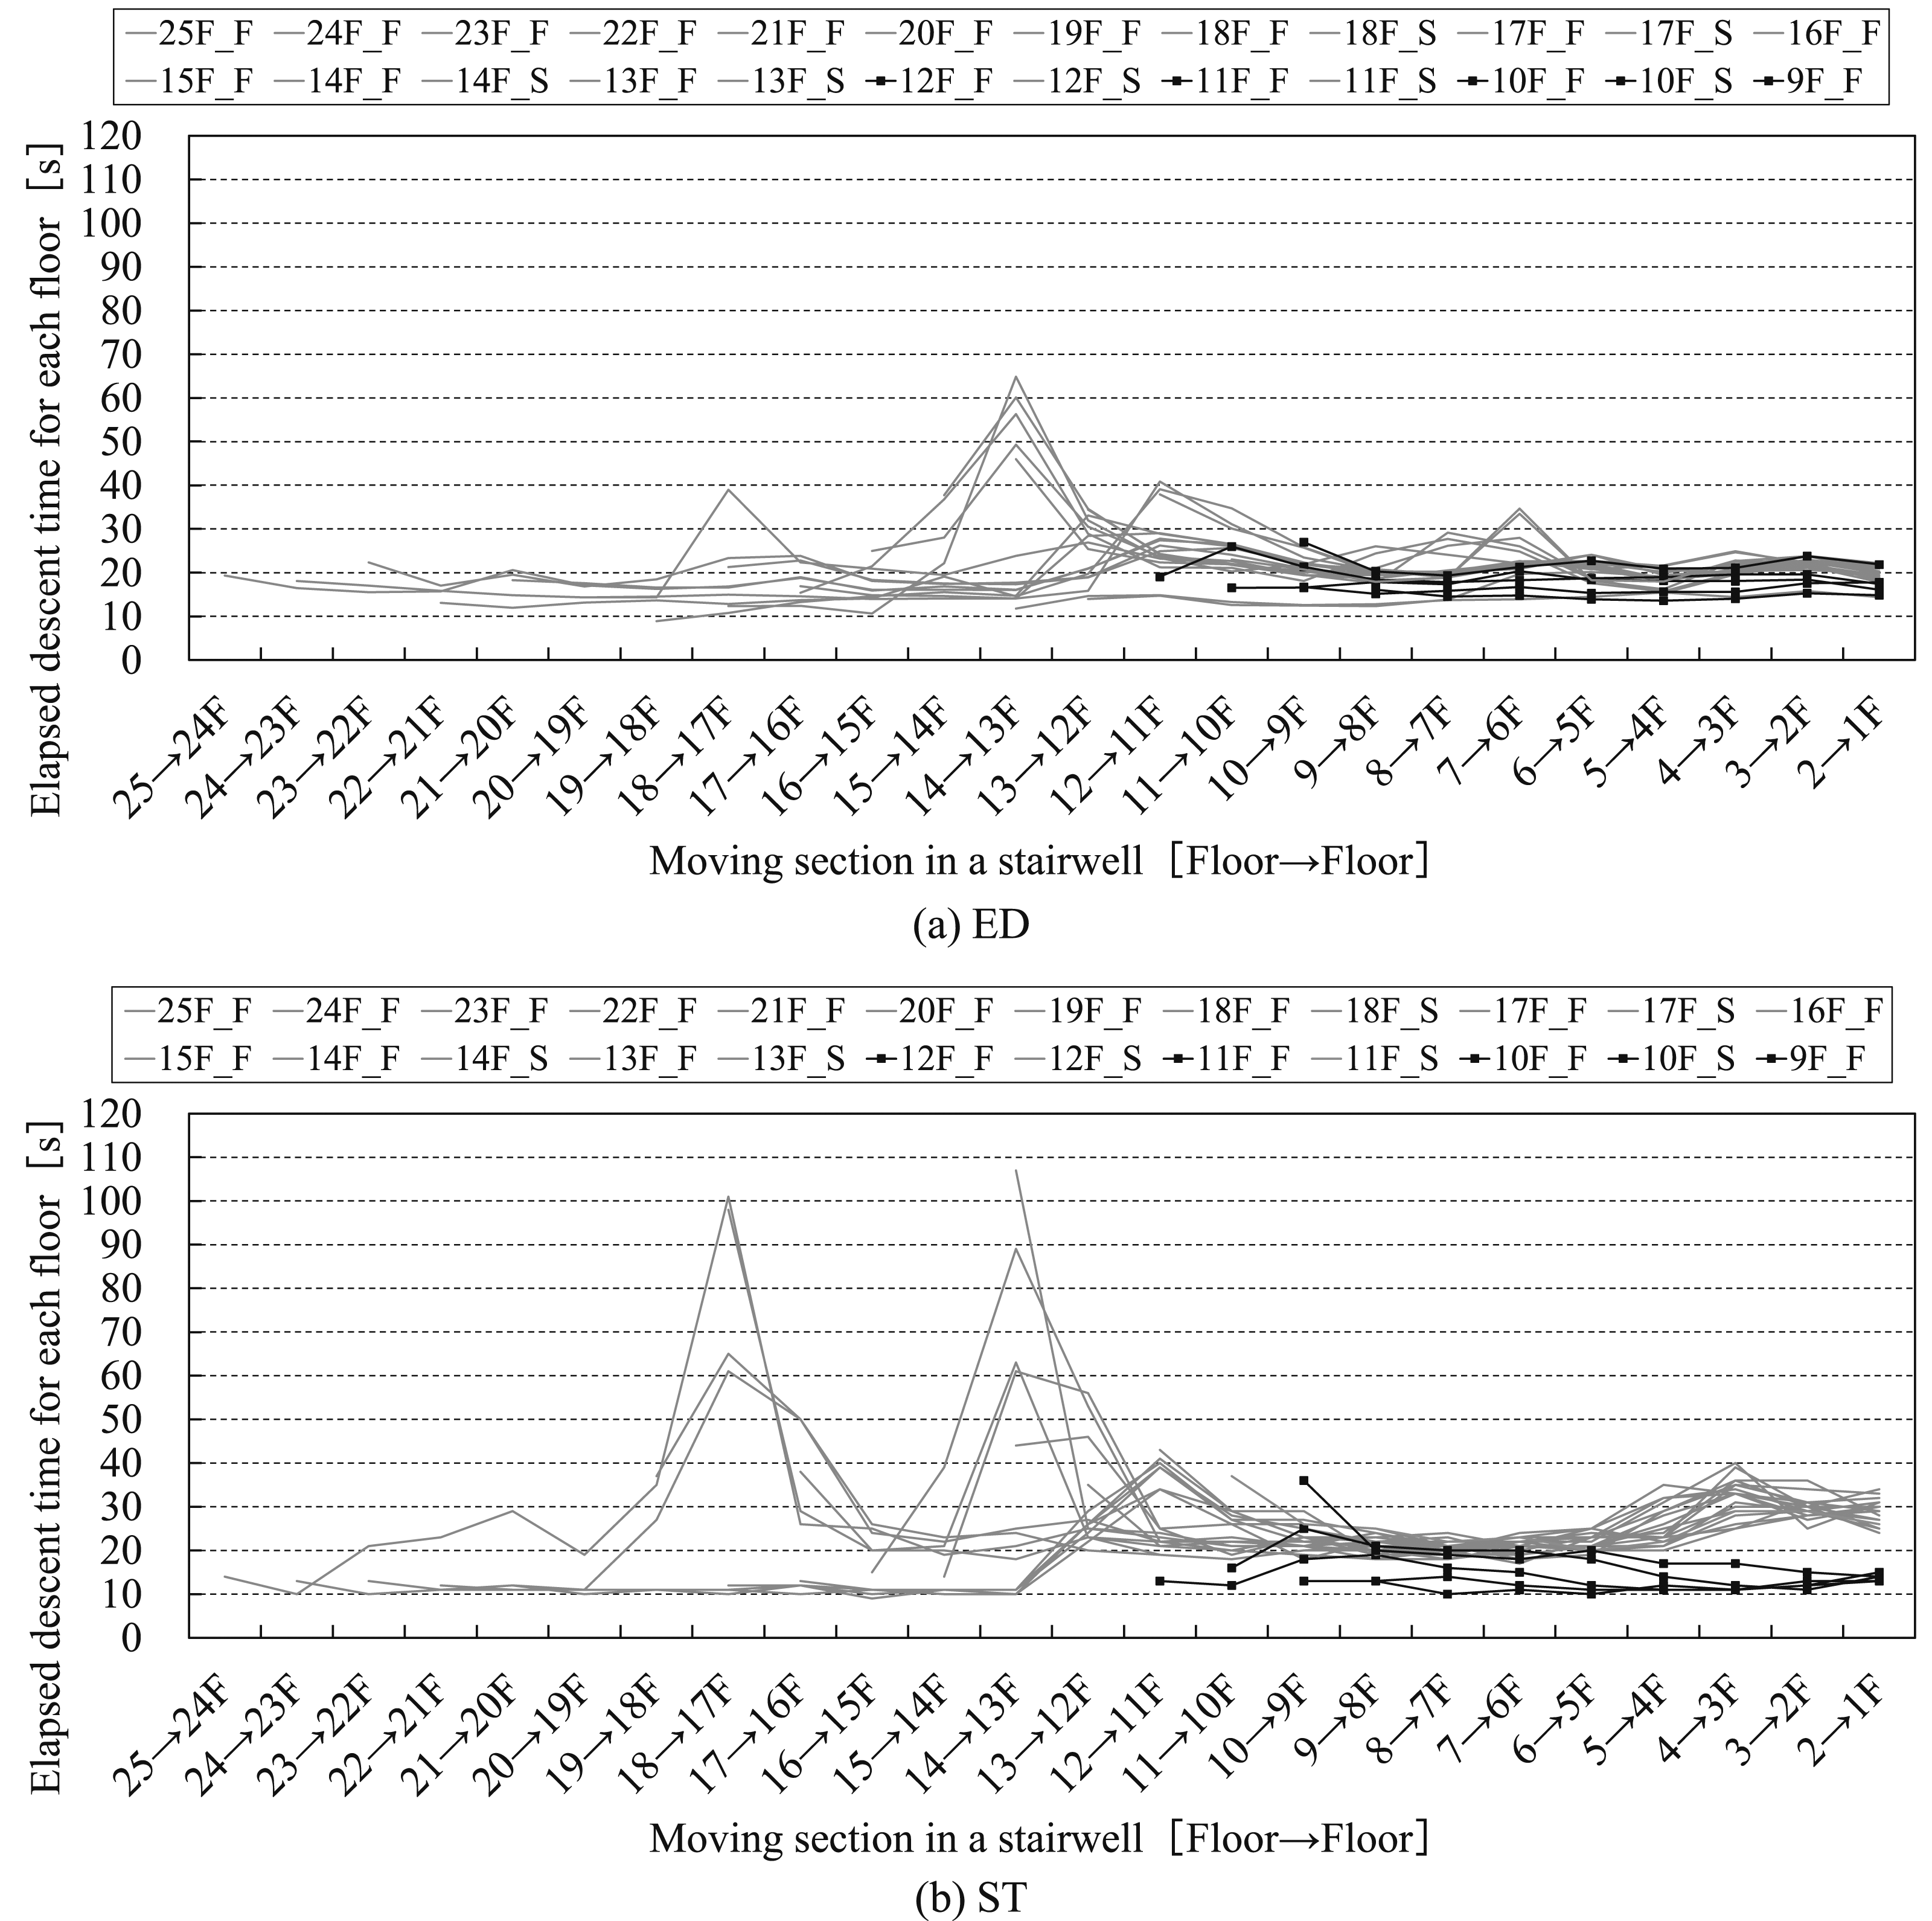
The temporal duration of stairway descent exhibited a noticeable as tracers (12F_F, 11F_F and 10F_S) traversed downward through the staircase, specifically below the 5th floor, as illustrated in the simulation (ST). In contrast, such a trend was not evident in the empirical evacuation drill (ED). This phenomenon can be attributed to the spatial dynamics of intermediate landings beneath the 5th floor. Agents within the simulation, aiming to circumvent conflicts with the wall structures, conformed to a single line from a previously observed dual-line arrangement, aligning their movement trajectory adjacent to the handrail. This transition led to a consequential decrease in the evacuation flow’s density, thereby facilitating an increase in the walking speed of the agents. In Figure 9(a), agents initially formed two lines for their descent. Nonetheless, upon closer examination of the sequential steps (a) through (h) in Figure 9, it becomes evident that an agent marked in red, positioned at the periphery of the line, navigated towards an intermediate landing. In response to the constrained pathway, this agent undertook a series of steps to manoeuvre from the outer position to the interior of the line. Process where two lines of agents merge into a single line depicted over time from 'a' to 'h'.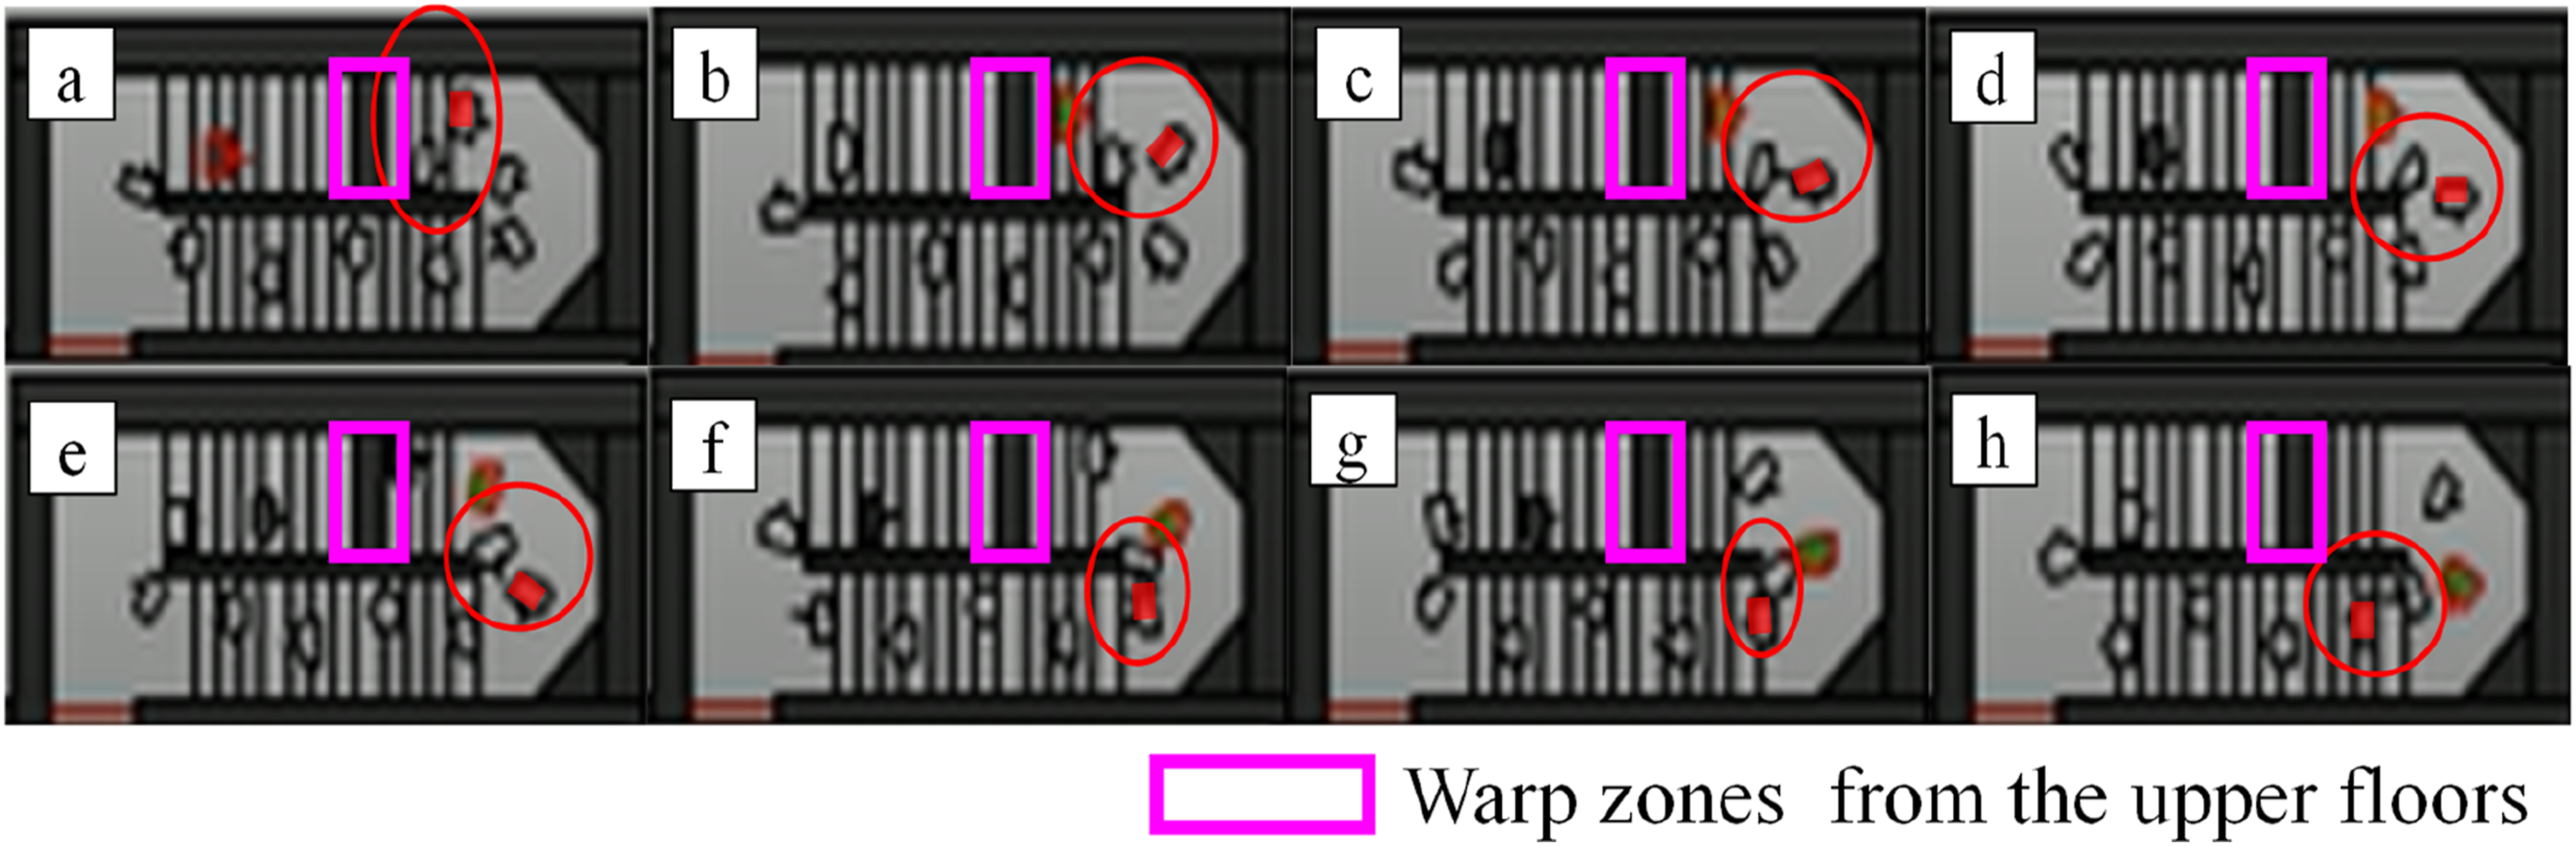
Conversely, in ST, excluding the tracers of 12F_F, 11F_F and 10F_S, the stairway descent durations for other tracers exhibited an increase below the 6th floor in contrast to the times observed above the 6th floor. This phenomenon arose due to the distinctive interplay of factors. Specifically, while the upper floors demonstrated a heightened evacuation flow density due to merging dynamics, the intermediate landing areas below the 6th floor were noticeably constrained. As a result, while agents traversed the restricted zones beneath the 5th floor, collisions with the wall structure occurred, compelling agents to decelerate their walking pace. This diminished speed cascaded upwards, influencing the floors as well. This perturbation in the flow’s dynamics led to a heightened density upon traversing the constricted segments, accompanied by a concurrent decrease in walking speed, a contrast to the unimpeded flow seen in the empirical ED.
In ST, the stairway descent times exhibited variability contingent on the prevailing conditions within the narrowed path of the intermediate landings beneath the 5th floor. Two distinct scenarios emerged: (1) Instances where stair descending times were decreased owing to the resultant reduced density and (2) Cases where stair descending times were increased due to escalating density. To achieve a more accurate replication of the evacuation flow, a compelling suggestion emerged. The fluctuating density scenarios brought about by the presence of narrowed paths are unique to ST, and they do not manifest in the empirical ED. As such, for the sake of isolating and refining the evacuation scenario alone, the inclusion of these narrowed paths is advisable to be omitted.
Evacuation flow during interflow on landings
In previous studies,33,34 the relationship between specific flow and crowd density in ED was compared with that in ST, and it was found that ED and ST exhibited a similar relationship between specific flow and crowd density when evacuees descended without merging on landings. 33 Accordingly, the merge rates between ED and ST were similar in representative floors. However, these merge rates were determined from the point when evacuees from both FL and TL started merging until there was no continuous entry of either FL or TL. In this study, to provide a more precise comparison, we defined merging as a state in which evacuees did not stop entering the landing for more than 3 s from both FL and TL, and this condition persisted for more than 60 s. We compared the flow rates (FL, TL and LT), merge rates and landing densities during merging. To accurately measure the evacuation flow during merging, the analysis subjects had to consist of more than 100 persons on the floor to collect sufficient merge data and not be influenced by merging activities from lower floors since merging on lower floors could impact the merge flow on the selected floor. Amongst the candidate floors, the 12th, 13th and 17th floors, the 13th floor was chosen as the representative analysis subject for merge flow due to having the most suitable conditions. The 13th floor was selected as the representative analysis subject for merge flow due to having the most suitable conditions. On the 11th to 10th floor, there was merging on landings and it affected the merging flow at the 12th floor, and on the 17th floor, there was not sufficient merging time that was below 60 s.
Figure 10 illustrates the flow rates, merge rates and densities on a landing during merging on the 13th floor. In ED, the merging evacuation flow experienced interruptions and restarts, leading to two separate measurements. In the first measurement period, the average flow rates of FL and TL were 0.51 and 0.67 p/s, respectively. In the second measurement period, these average flow rates changed to 0.64 and 0.46 p/s, respectively (Figure 10(a)). As per these flow rates, the merge rates were calculated as 0.43 (= 0.51/(0.51 + 0.67)) for the first measurement period and 0.58 (= 0.64/(0.64 + 0.46)) for the second measurement period. The total average flow rates of FL and TL were 0.58 and 0.55 p/s, respectively, resulting in a total merge rate of 0.51. In ST, the average flow rate of FL and TL were 0.54 and 0.74 p/s, respectively, resulting in a merge rate of 0.58 (= 0.74/(0.74 + 0.54)) (Figure 10(b)). The average flow rates of LT were 1.12 and 1.25 p/s in ED and ST, respectively (Figure 10(c)). A comparison of ST’s results with those of ED revealed that ST’s merge rate was biased in favour of FL. Additionally, the average outflow (LT) in ST was 11% (= (|1.25/1.12 − 1|) × 100) larger than that in ED. Furthermore, Figure 10(d) shows the average densities during merging were 2.15 p/m2 and 2.47 p/m2 in ED, while in ST, it was 3.45 p/m2. The total average landing density in ED was 2.23 p/m2 for all time during merging, and ST’s landing density was 55% (= (|3.45/2.23 − 1|) × 100) higher than ED’s results, indicating that the density in ST tended to increase excessively. Evacuation flow during merging on the 13th floor’s landing: (a) interflow on the 13th floor (ED), (b) interflow on the 13th floor (ST), (c) outerflow on the 13th floor (ED and ST) and (d) density of the landing.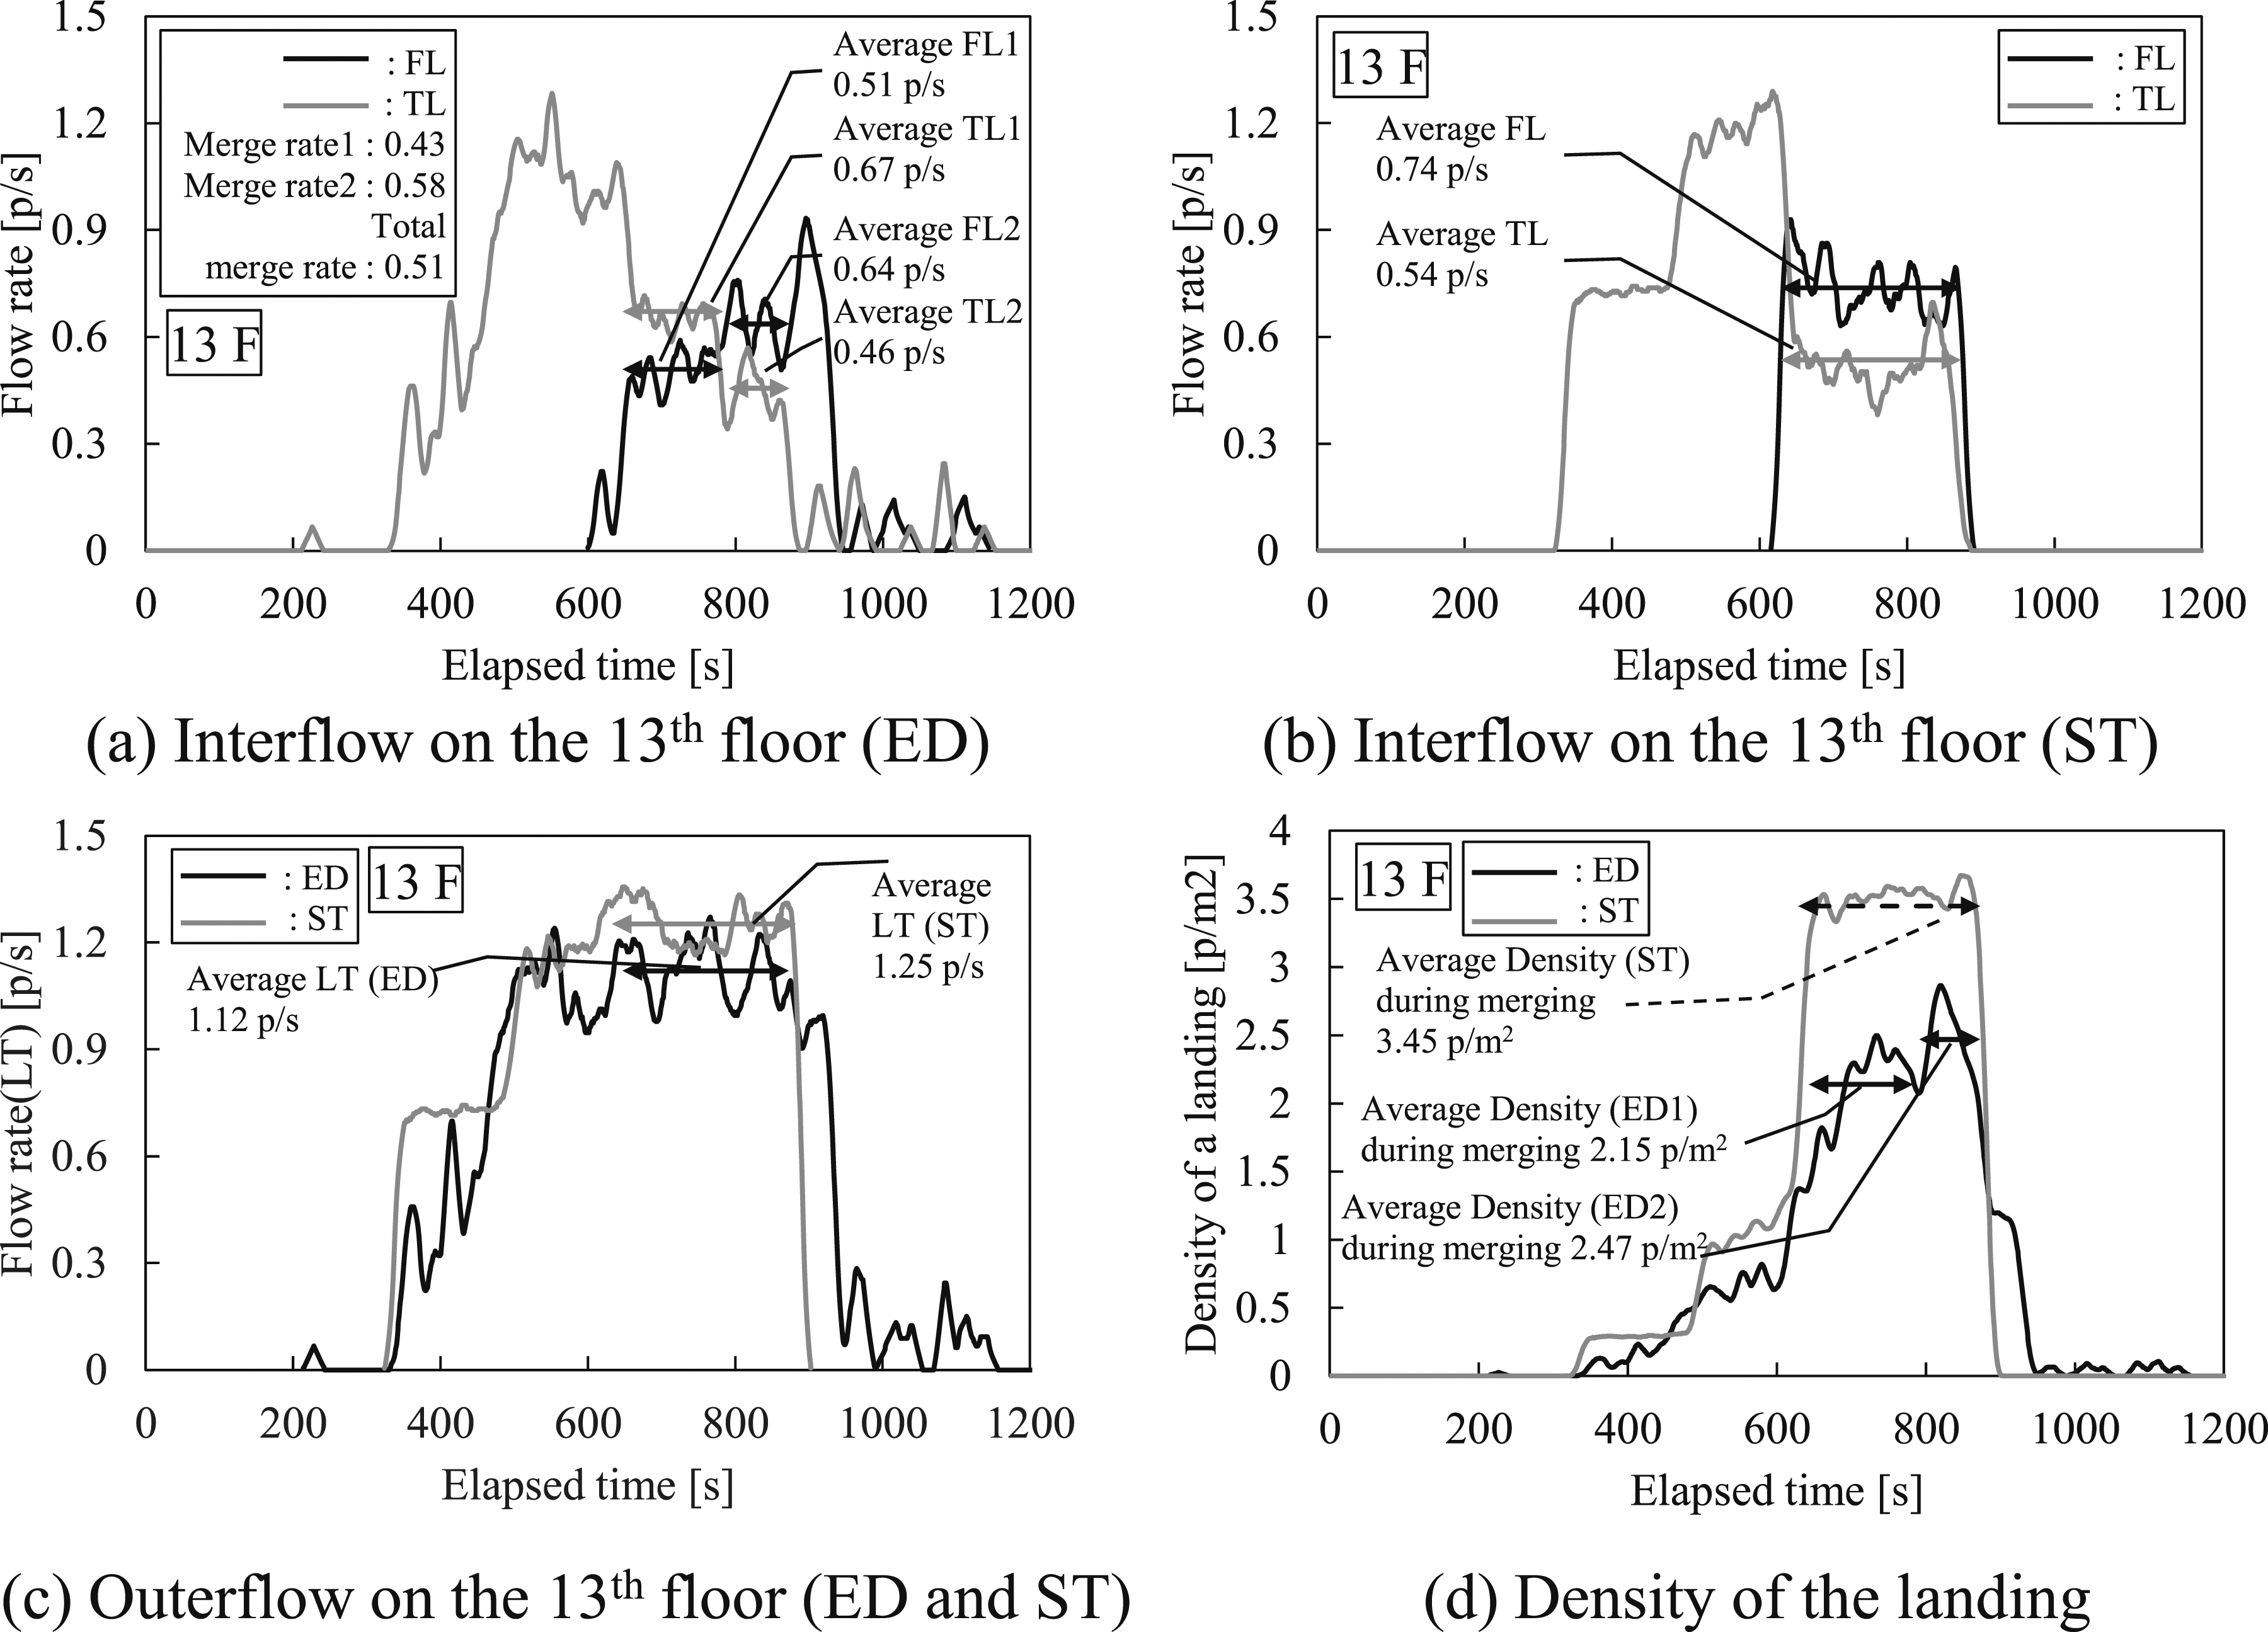
The merging rate on the 13th floor in ED differed from the simulation. The total merge rate was 0.51 and did not significantly favour either FL or TL (Figure 10 (a)) in ED. Figure 11 illustrates FL’s evacuation flow, which formed a single file as evacuees had to hold the door. In contrast, ST does not consider door-opening actions. Agents pass through the door in double files according to their width capacity, as shown in Figure 12. In Figure 11, evacuees in ED entered the staircase by manually pushing the door, leading to most evacuees forming a queue of people and merging with evacuation flow TL. The merge rate of 0.51 in ED closely aligned with the merge rates measured in other studies.38,39 Merge behaviour of evacuees around the door of the landing on the 13th floor in ED: (a) 643 s, (b) 713 s and (c) 777 s. Merge behaviour of agents around the entry to the landing on the 13th floor in ST: (a) 629 s, (b) 749 s and (c) 869 s.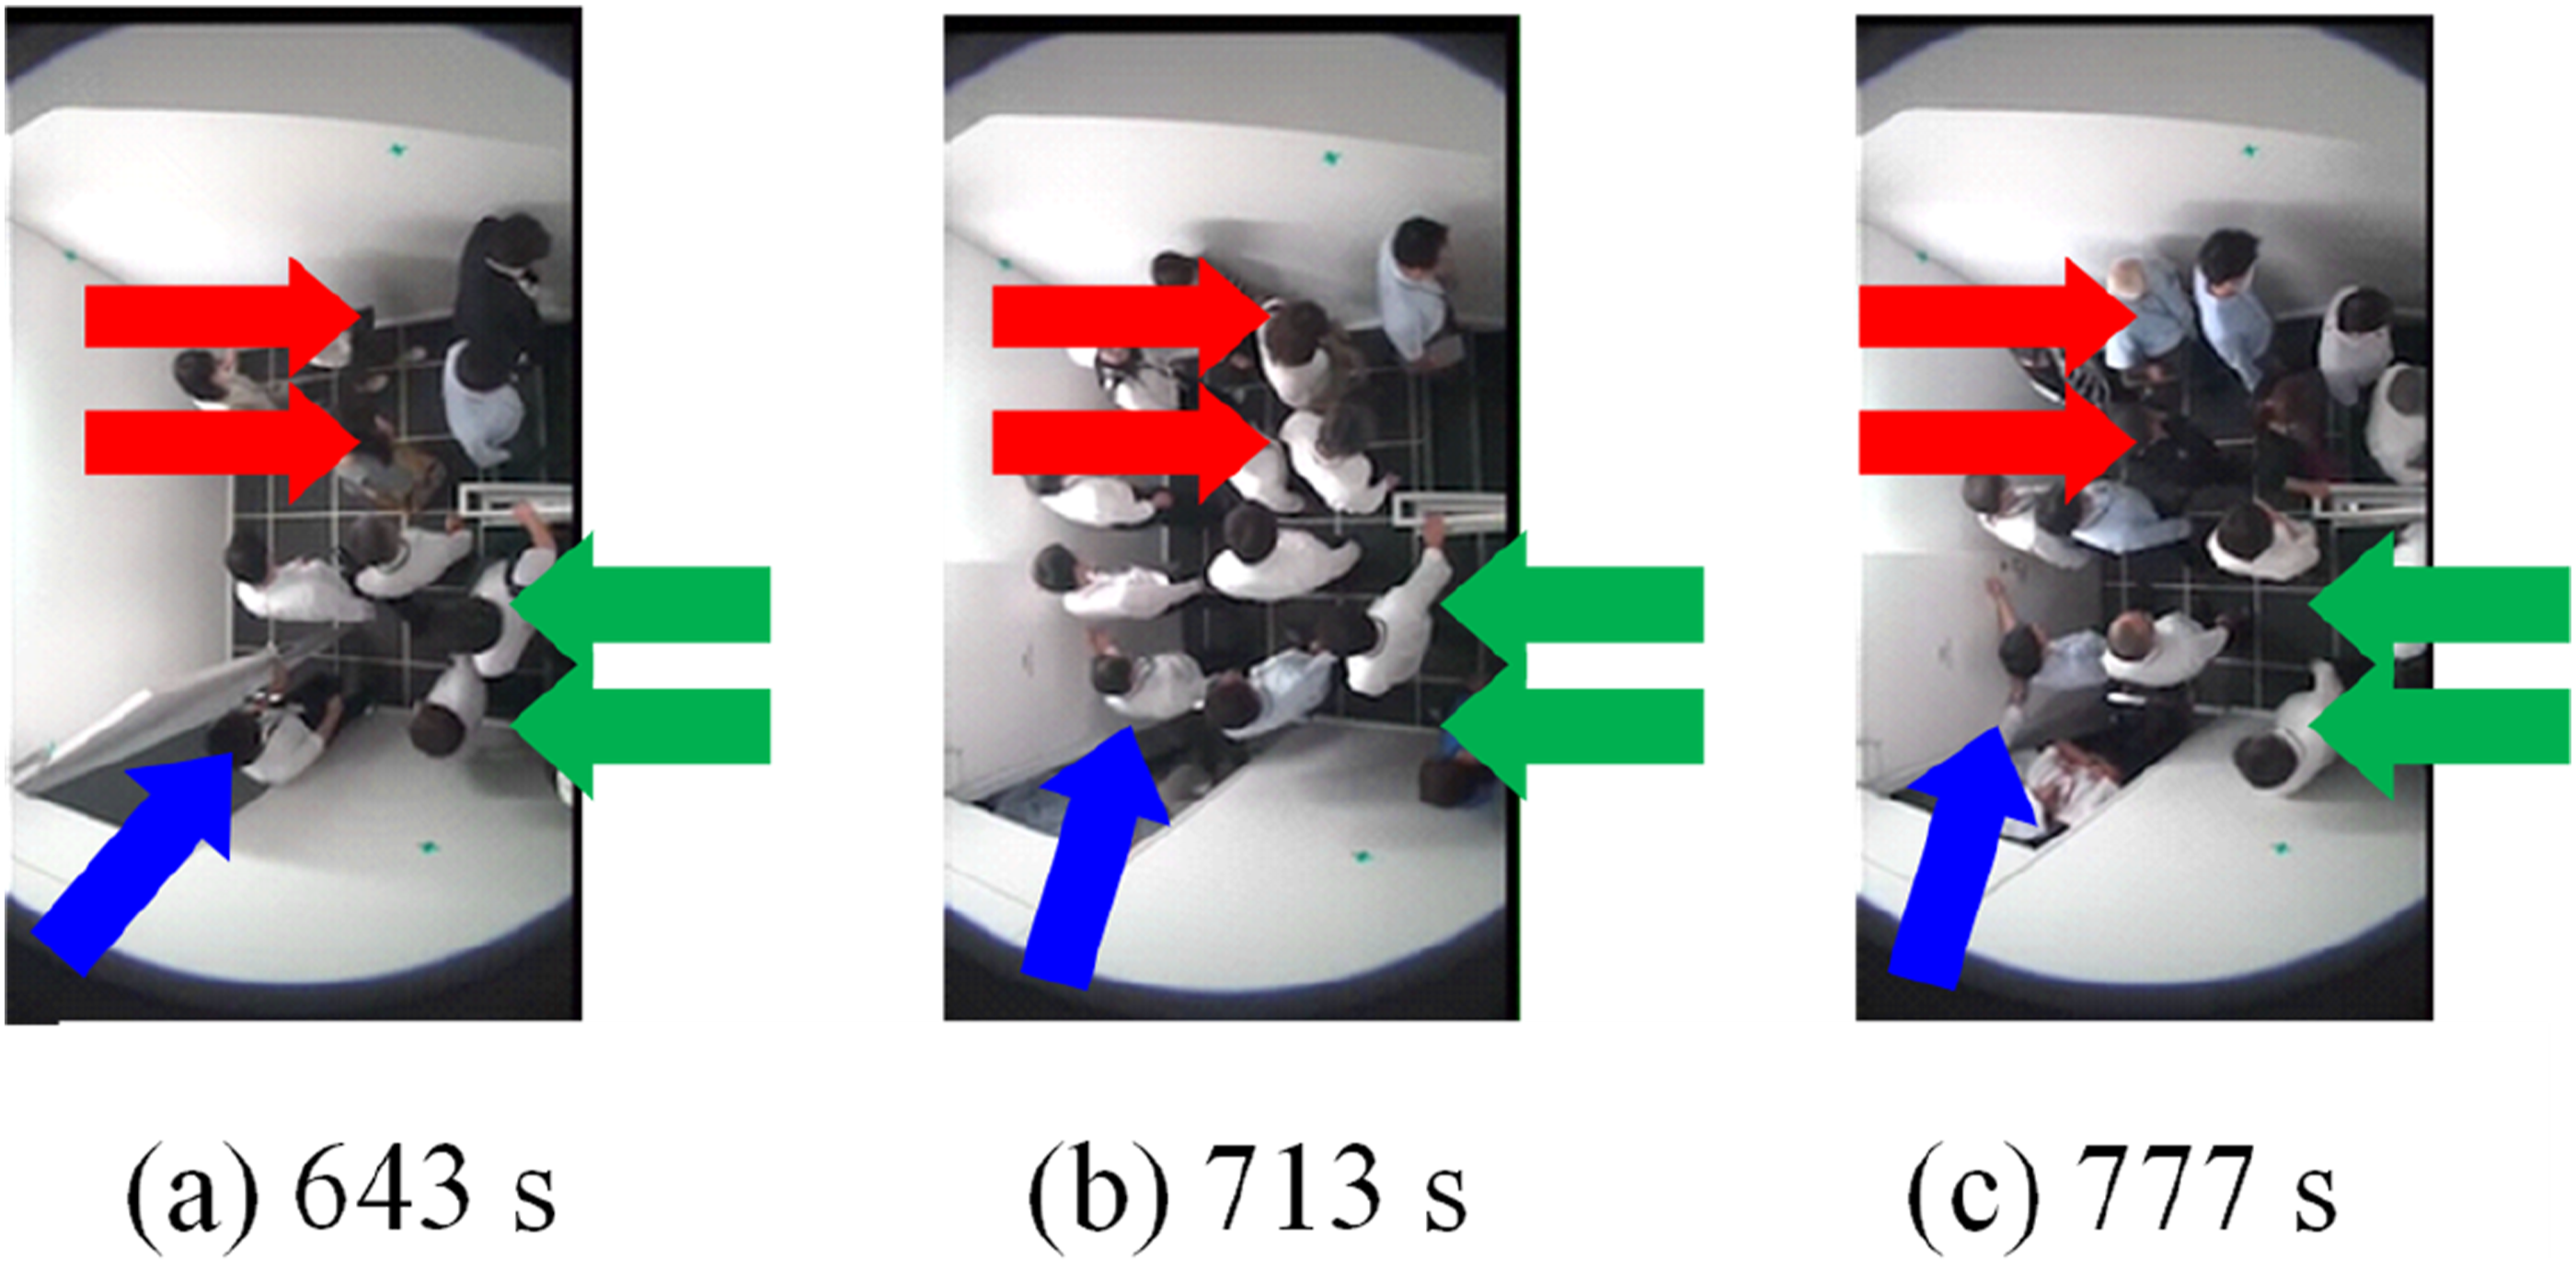
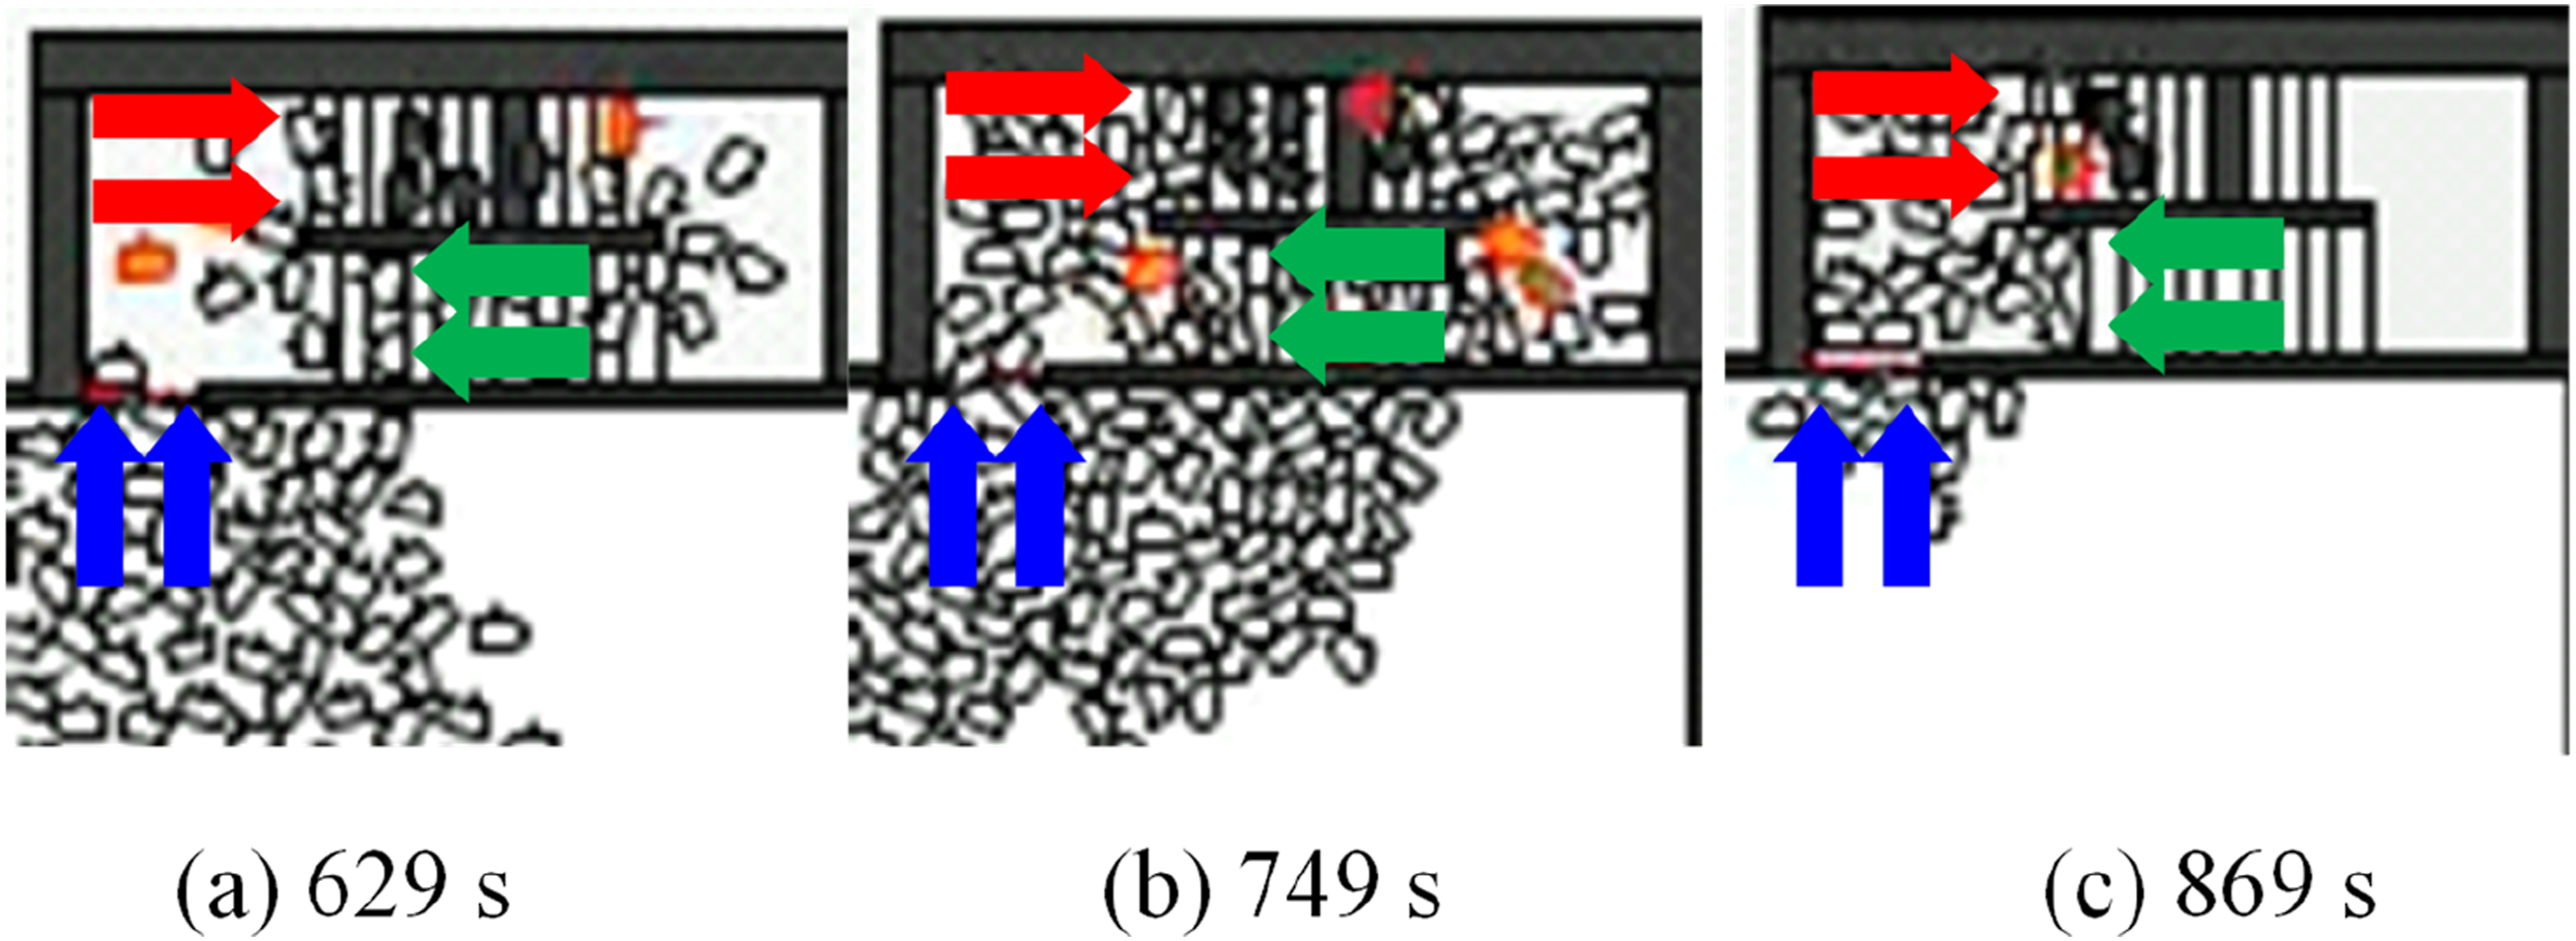
Figure 10 shows that the density at the landing in ST was higher than that in ED during merging. However, according to the Verification Method of Evacuation Safety 40 outlined in the notification of MLIT (Ministry of Land, Infrastructure, Transport and Tourism) in Japan, the capacity of the staircase for building design is set at 4 p/m2 for situations of congestion. The maximum density observed during merging in ST was 3.53 p/m2, thus falling within the range of the density stipulated by MLIT. 40 However, heavy congestion did not occur at the landing during the actual evacuation drill. Moreover, when adopting an ideal phased evacuation scenario instead of a simultaneous one, heavy congestion is unlikely to occur. SimTread tends to reproduce densities near heavily congested situations, making it well-suited for simulating simultaneous evacuation scenarios. To reasonably reproduce situations without heavy congestion, modifications to the agent’s movement model are necessary. Specifically, the forward distance and the width of the conflict determination area for avoiding other agents (Fm and WA in Figure 4) should be extended. Additionally, to replicate the merge rate more accurately, the door width on each floor, except the 1st floor, should be narrowed to simulate agents entering the landing in a single file.
Changes in evacuation flow at the exit of the 1st floor
In a previous study, 34 a comparison was made between the total evacuation time and flow rate at the exit of the 1st floor in ST and ED. The findings revealed that the building evacuation times were 1209 s and 1168 s, in ED and ST, respectively. The error rate of ST compared to ED was 3.4% (= (|1168/1209 − 1|) × 100). However, the relationship between the flow rate and the density of the evacuation flow exhibited differences in density. We delved into the characteristics of the evacuation flow and proposed an improvement method of ST.
Figure 13(a) presents the time series of the flow rate at the exit on the 1st floor. Section 1 represents the evacuation flow from the lower floors of the 2nd phase, merging with evacuees from their respective floors. During the evacuation of 11F_F to 11F_S, the evacuation flow was measured in ED, and it also included a small number of evacuees from the 10th and 12th floors. Section 2 depicts the evacuation flow of evacuees from the lower floors of the 2nd phase, merging with those from the upper floors of the 2nd phase. Section 3 shows the evacuation flow resulting from the merging of the third and fourth phases within the staircase. In ST, these sections were divided differently. Section 1 consisted of the lower floors of the 2nd phase: 10F_F to 10F_S, including 11F_F and 12F_F. Section 2 encompassed the higher floors of the 2nd, 3rd and 4th phases. In ED, Section 1 correlated with Section 1 in ST. The average flow rates in Section 1 were 0.96 p/s in ED and 0.73 p/s in ST. Consequently, ST’s average flow rate in Section 1 was 32% (=(|0.73/0.96 − 1|) × 100) smaller than that in ED. Sections 2 and 3 in ED corresponded to Section 2 in ST. In ED, the average flow rates in Sections 2 and 3 were 1.01 p/s and 1.12 p/s, respectively. In comparison, the result of ST, the result of Section 2 in ST was 15% (= (|1.16/1.01 − 1|) × 100) larger than ED’s result, and for Section 3, ST’s result was 4% (= (|1.16/1.12 − 1|) × 100) larger than ED’s results. Characteristics of the evacuation flow at the exit of the 1st floor (ED vs ST): (a) flow rate at the exit of 1F and (b) density of a floor (2F to 1F).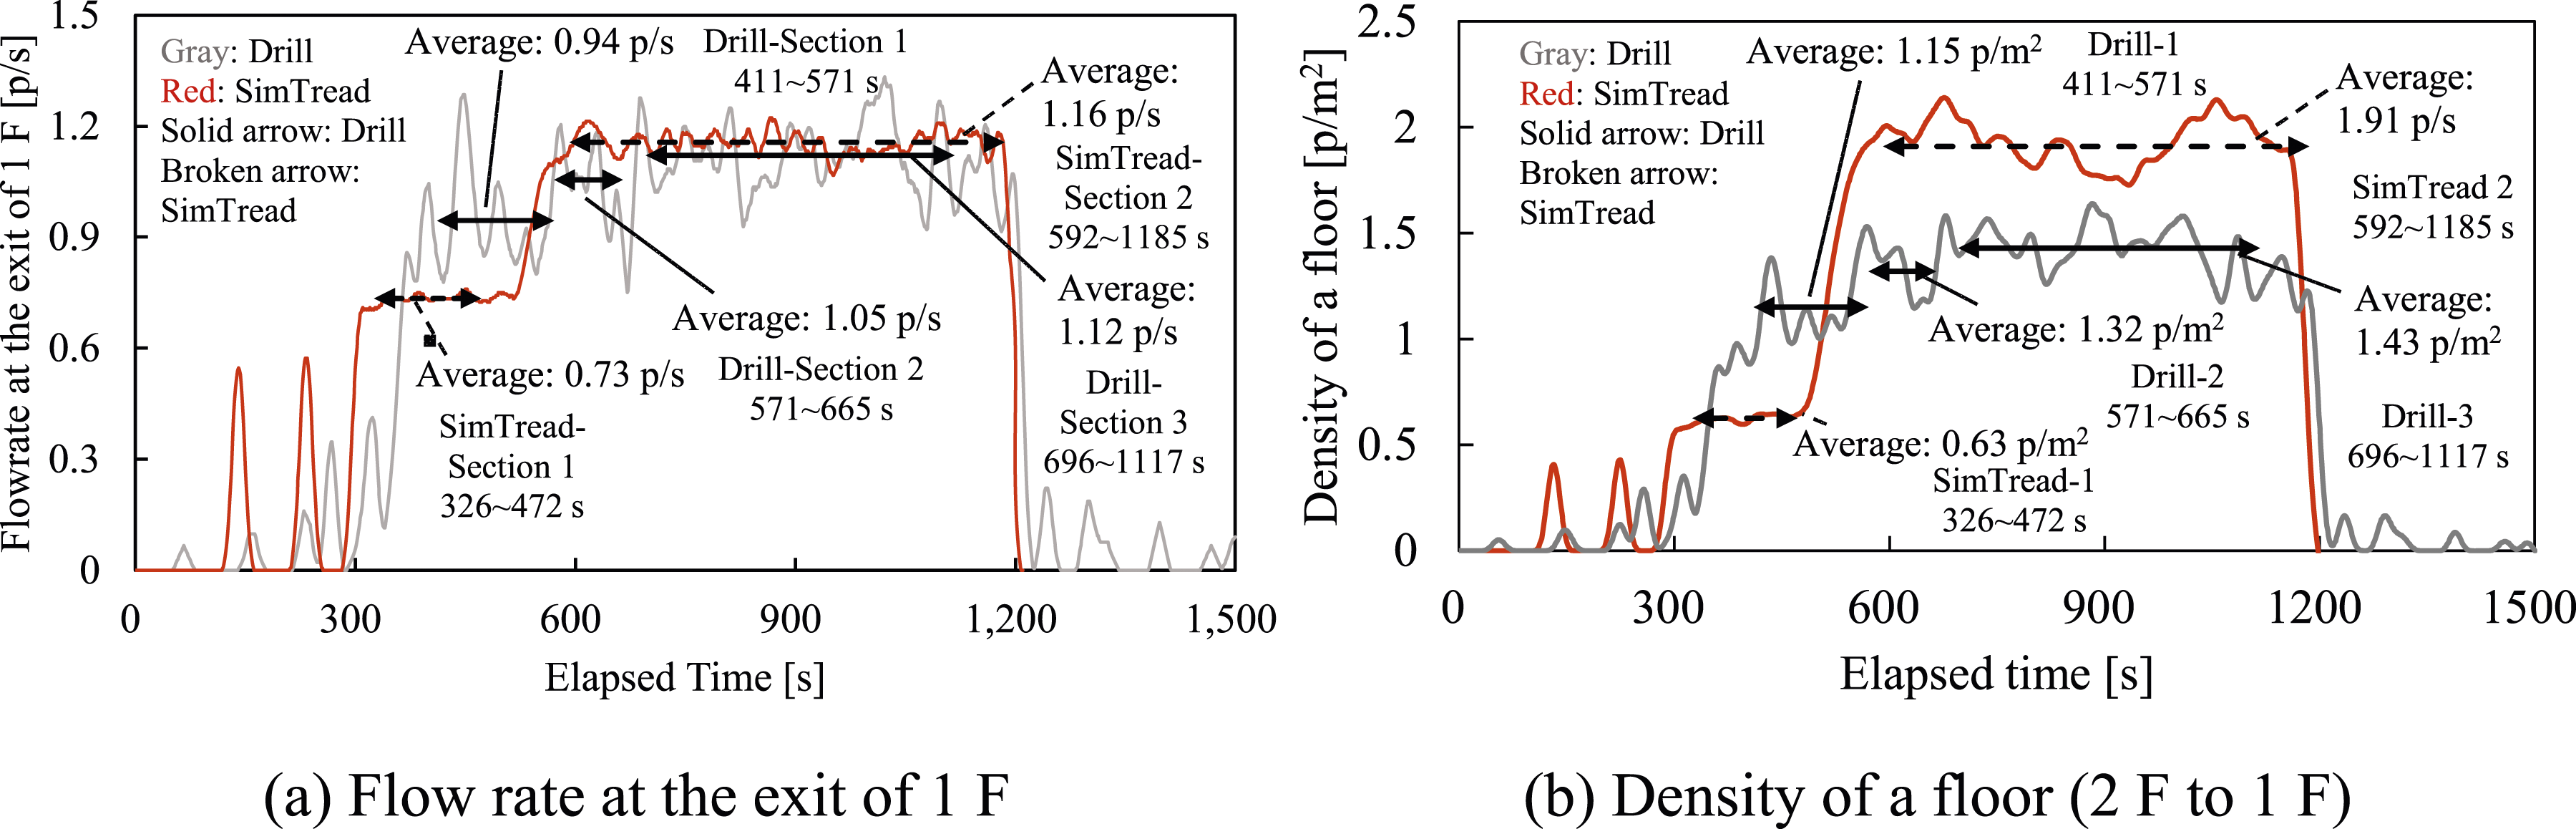
In Figure 13(b), we present the density on the landing floor of the 2nd floor and two flights of stairs leading to the 1st floor. The evacuation flow in Section 1 of ED primarily consisted of evacuees from the lower floors of the 2nd phase, who experienced minimal merging, as depicted in Figure 8(a). The average density in Section 1 was 0.63 p/m2 in ED and 1.15 p/m2 in ST. In ST, Section 1 was also composed of evacuees from the lower floors of the 2nd phase, with minimal merging, as shown in Figure 8(b). The average density in ST’s Section 1 was 45% smaller than in ED’s, as calculated by (|0.63/1.15 − 1|) × 100). The average densities in Sections 2 and 3 in ED were 1.32 p/m2 and 1.43 p/m2, respectively. When comparing the results of Sections 2 and 3 in ED with Section 2 in ST, the average density in ST’s Section 2 was 45% larger than ED’s Section 2, and 34% larger than ED’s Section 3, as calculated by (|1.91/1.32 − 1|) × 100) and (|1.91/1.43 − 1|) × 100), respectively.
The analysis also considered the average flow rates and the crowd density near the final exit for each section. The structure of the staircase below the 5th floor and the conflict determination area in normal situations impacted the flow rate and the density near the exit on the 1st floor. High-density evacuation flow near the final exit resulted from merging at the landings and the bottleneck situations on intermediate landings below the 5th floor. Conversely, low-density evacuation flow near the final exit occurred when evacuees transitioned from forming double files to a single file on intermediate landings below the 5th floor. To accurately reproduce the evacuation flow, it is recommended to extend the forward distance of the conflict determination area in normal situations. Additionally, the evacuation density was influenced by the narrowed area on intermediate landings below the 5th floor, suggesting that these areas should be consistent with other intermediate landings for assessment purposes.
Enhancement of SimTread
A comparative analysis was conducted between the results of the evacuation drill and SimTread, revealing disparities between SimTread simulations and the actual evacuation drill. To improve the accuracy of SimTread results, the following calibration methods were conducted: (1) Calibrating entry situation by adjusting door width: One notable difference was observed in the merge rate between SimTread and the evacuation drill. This discrepancy stemmed from the fact that agents in SimTread moved in double files of people at the floor exit (FL), while evacuees in the evacuation drill moved in a single file (see Figures 11 and 12). To determine the door width that can accurately replicate the actual merge rate, an iterative trial-and-error approach was employed. The door widths were evaluated at 800 mm, 850 mm and 900 mm. (2) Preventing bottleneck phenomenon on intermediate landings below the 5th floor: Another issue observed was the variation in the movement speed of tracers below the 5th floor, which impacted the flow rate and density at the final exit. This discrepancy resulted from structural differences in the intermediate landings below the 5th floor. Specifically, the narrow pathway width of these intermediate landings created a situation where low-density evacuation flow remained in a single line. However, when high-density evacuation flow passed, bottleneck phenomena occurred, leading to an increased density. To ensure an accurate replication of evacuation flow, the deformed area of the intermediate landings should be modified to match that of other intermediate landings. (3) Calibrating characteristics of evacuation flow during merging: Suggestions were made to adjust the size of the conflict determination area of agents. (4) Calibrating characteristics of evacuation flow after merging: Similarly, it was recommended to modify the size of the conflict determination area of agents. These modifications aimed to accurately replicate flow rates and densities by extending the personal spaces of agents.
By implementing these calibration methods, SimTread can be enhanced to provide more accurate representations of real-world evacuation scenarios, bridging the gap between simulation results and actual evacuation drills.
Calibrating the characteristics of evacuation flow during merging
As discussed, disparities were observed in the flow rates, densities and merge rates during merging between ED and ST. These discrepancies stemmed from differences in the personal space allocated to agents for avoiding conflicts during merging in ST, which was smaller than that in ED. In order to align ST more closely with the observed data from ED, adjustments to the personal space in ST were deemed necessary, with the assumption that evacuation flow would reach maximum density. The maximum densities recorded during merging were 2.87 p/m2 in ED and 3.53 p/m2 in ST. A key factor in this calibration was the occupied area per person, which measured 0.348 m2/p in ED and 0.283 m2/p in ST. Notably, the occupied area in ED was 1.348 times greater than that in ST, indicating the need to extend ST’s occupied area. In ST, when the agents encountered conflict situations, the forward distance plus the diameter of the body (F m + D B ) was set to 400 mm, and the width buffer (W B ) was 420 mm. In the calibration process, it was determined that F m + D B should be extended to 455 mm, with F m adjusted to 205 mm.
Figure 14 illustrates the calibrated results in ST. During merging, the flow rates of FL and ST were recorded at 0.58 and 0.55 p/s, respectively, while the merge rate remained at 0.51 (Figure 14(a)). These values were consistent with the total average flow rates observed during Measurement periods 1 and 2 in ED (Figure 10(a)). Additionally, the flow rates of LT in ED and ST measured 1.12 and 1.14 p/s, respectively, with the latter being approximately 3% larger than the former (Figure 14(b)), as calculated by (1.14/1.12) − 1) × 100. In terms of maximum densities at the landing, both ED and ST exhibited values of 2.87 and 2.84 p/m2, respectively, which were closely aligned (Figure 14(c)). However, when the door width was set to 850 mm in ST, agents entered the stairwell in a single file, mirroring a natural entry scenario, and the merge rate matched ED at 0.51. Nevertheless, Figure 14(c) indicates that the density at the landing increased before merging started. This phenomenon was attributed to the merging activity on the 12th floor, where the lower floors of the 2nd phase (10th to 12th floors) were merging. This resulted in agent accumulation on the 12th-floor landing, with agents from the 3rd phase moving down to the 12th floor. Consequently, the density on the 13th floor was increased due to the accumulation of agents. While ED did not experience congestion on the 13th floor because evacuees from the 10th to 11th floors did not enter simultaneously, the simulation suggests that a similar situation could occur if they moved all at once. Evacuation flow during merging on the 13th floor’s landing (ST calibrated): (a) interflow on the 13th floor, (b) outerflow on the 13th floor and (c) density of the landing.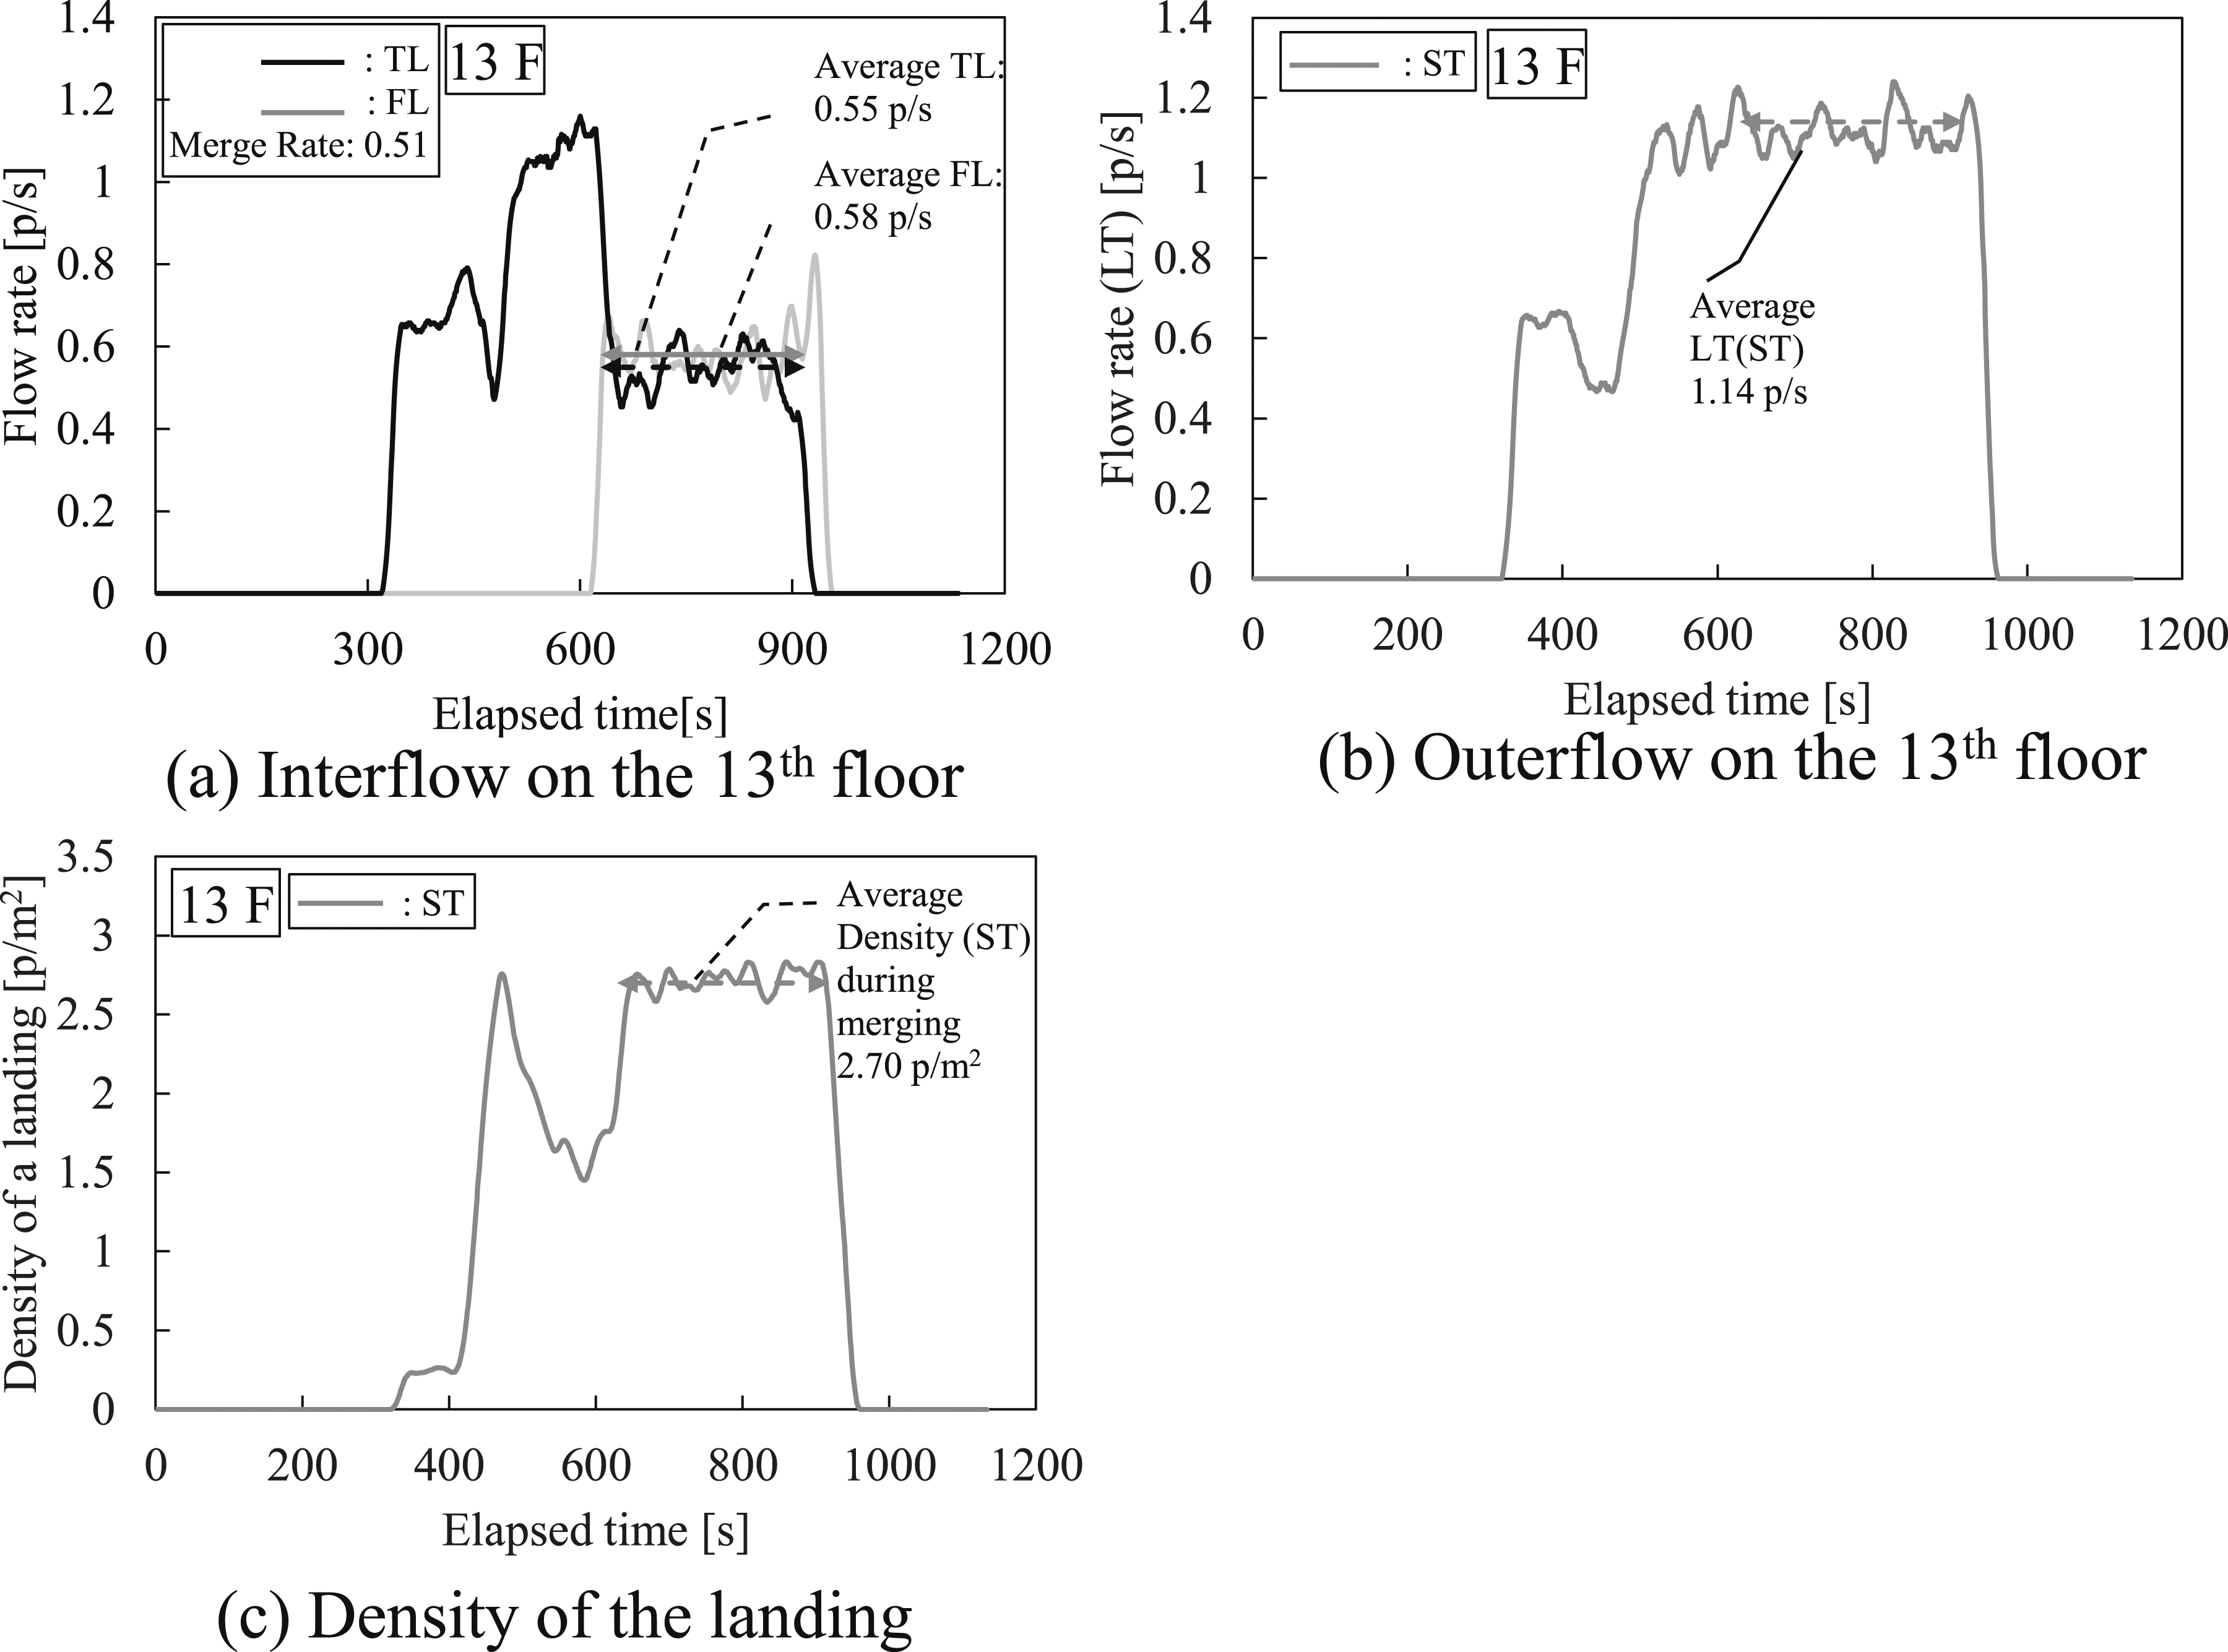
Calibrating the characteristics of evacuation flow after merging
As detailed, variations were observed in the crowd’s average flow rates and average densities at the exit of the 1st floor between ED and ST simulations. These differences were primarily attributed to variations in personal space allocated to agents to avoid conflicts under normal situations in ST, which were smaller than those in ED. To rectify this and align ST more closely with observed data from ED, adjustments to the personal space in ST were implemented. It was determined that the personal space in ST should be increased in accordance with the observed density during the descent into ED. The maximum density recorded was 1.64 p/m2 in ED and 2.01 p/m2 in ST. Occupied areas per person were measured at 0.609 m2/p in ED and 0.497 m2/p in ST, with ED’s occupied area being 1.225 times larger than that of ST. Consequently, ST’s specific area needs to be extended. In ST, under normal situations, the forward distance plus the diameter of the body (F m + D B ) was 1070 mm, with the width buffer (W B ) being 560 mm. This led to a determination that F m should be 1049 mm. A decrease in the movement speed below the 5th floor was indicated (Figure 8), resulting in higher density near the exit (Figure 13). This congestion was primarily attributed to the deformed intermediate landing area below the 5th floor. As suggested, the calculation in ST was conducted with the intermediate landings area restored to its original state, matching that of other intermediate landings.
Figure 15 presents the flow rates at the exit and the floor densities (2F to 1F) in a time series. After calibration, the average flow rates for Sections 1 and 2 in Figure 15(a) were 0.78 and 1.08 p/s, respectively, and the average floor densities in Sections 1 and 2 in Figure 15(b) were 0.78 and 1.62 p/m2, respectively. In Section 1 in Figure 13, the average flow rate and average density were approximately 17% (= (|0.78/0.94 − 1|) × 100) and 41% (= (|0.78/1.15 − 1|) × 100) smaller than ED’s results, respectively. Agents in this section moved in a mix of single and double files, and the evacuation flow under low-density conditions was considered to be well-reproduced. In Section 2 of Figure 13, the average flow rate and average density were approximately 3.6% (= (|1.08/1.12 − 1|) × 100) smaller and 13.2% (= (|1.62/1.43 − 1|) × 100) larger than ED’s results, respectively. Adjusting the length of F
m
under normal situations impacted the crowd’s density after merging. This occurred because agents tended to recover their forward distance (F
m
) under normal situations after merging. Characteristics of the evacuation flow at the exit of the 1st floor (ST original vs calibrated): (a) flow rate at the exit of 1F and (b) density of a floor (2F to 1F).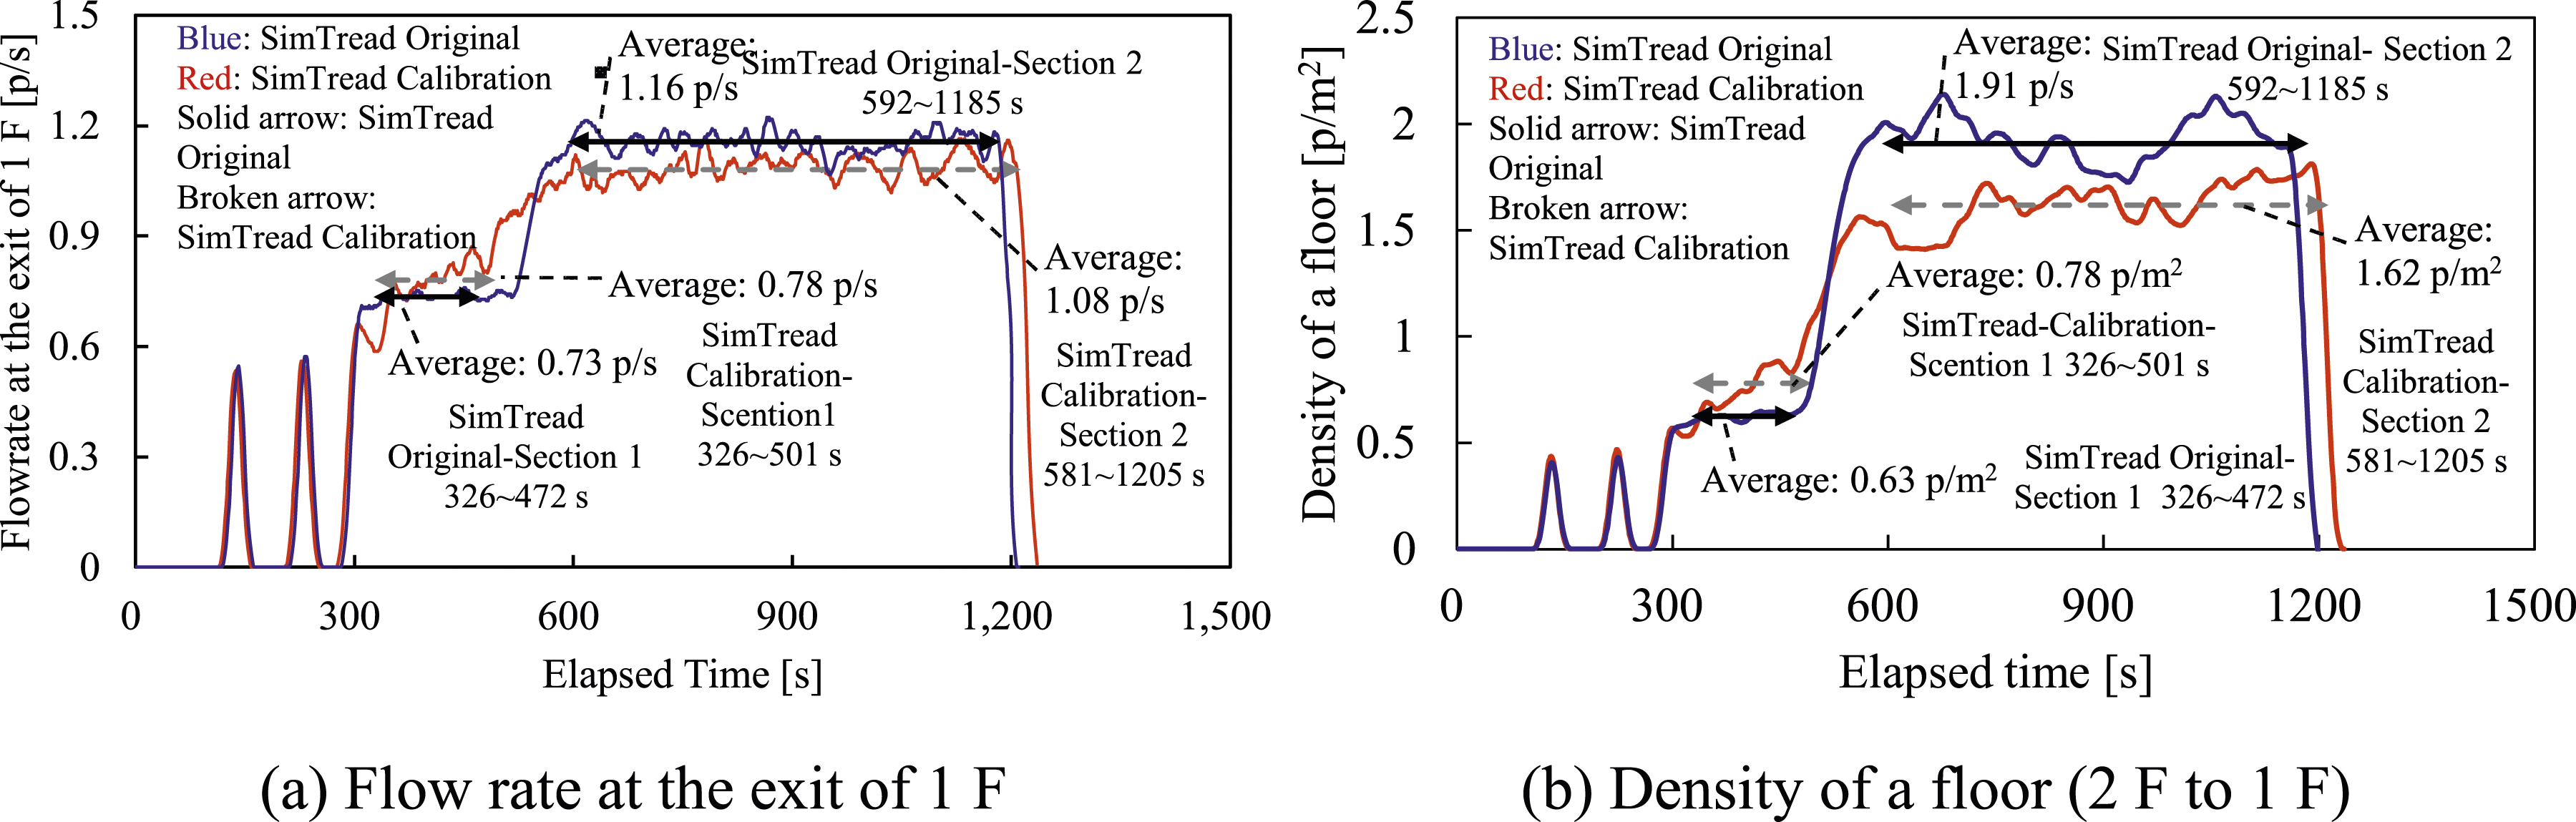
Figure 16 compares the total evacuation time and evacuation flow at the exit of the 1st floor between ED, ST original and ST recalculation. The results showed that the total evacuation times were 1209 s, 1168 s and 1187 s in ED, ST original and ST recalculation, respectively. The error rate of ST recalculation was 1.2% (= (|1194/1209 − 1|) × 100) faster than ED’s, indicating a higher degree of accuracy than ST original’s 3.4% (= (|1168/1209 − 1|) × 100). Comparison of evacuation finish time.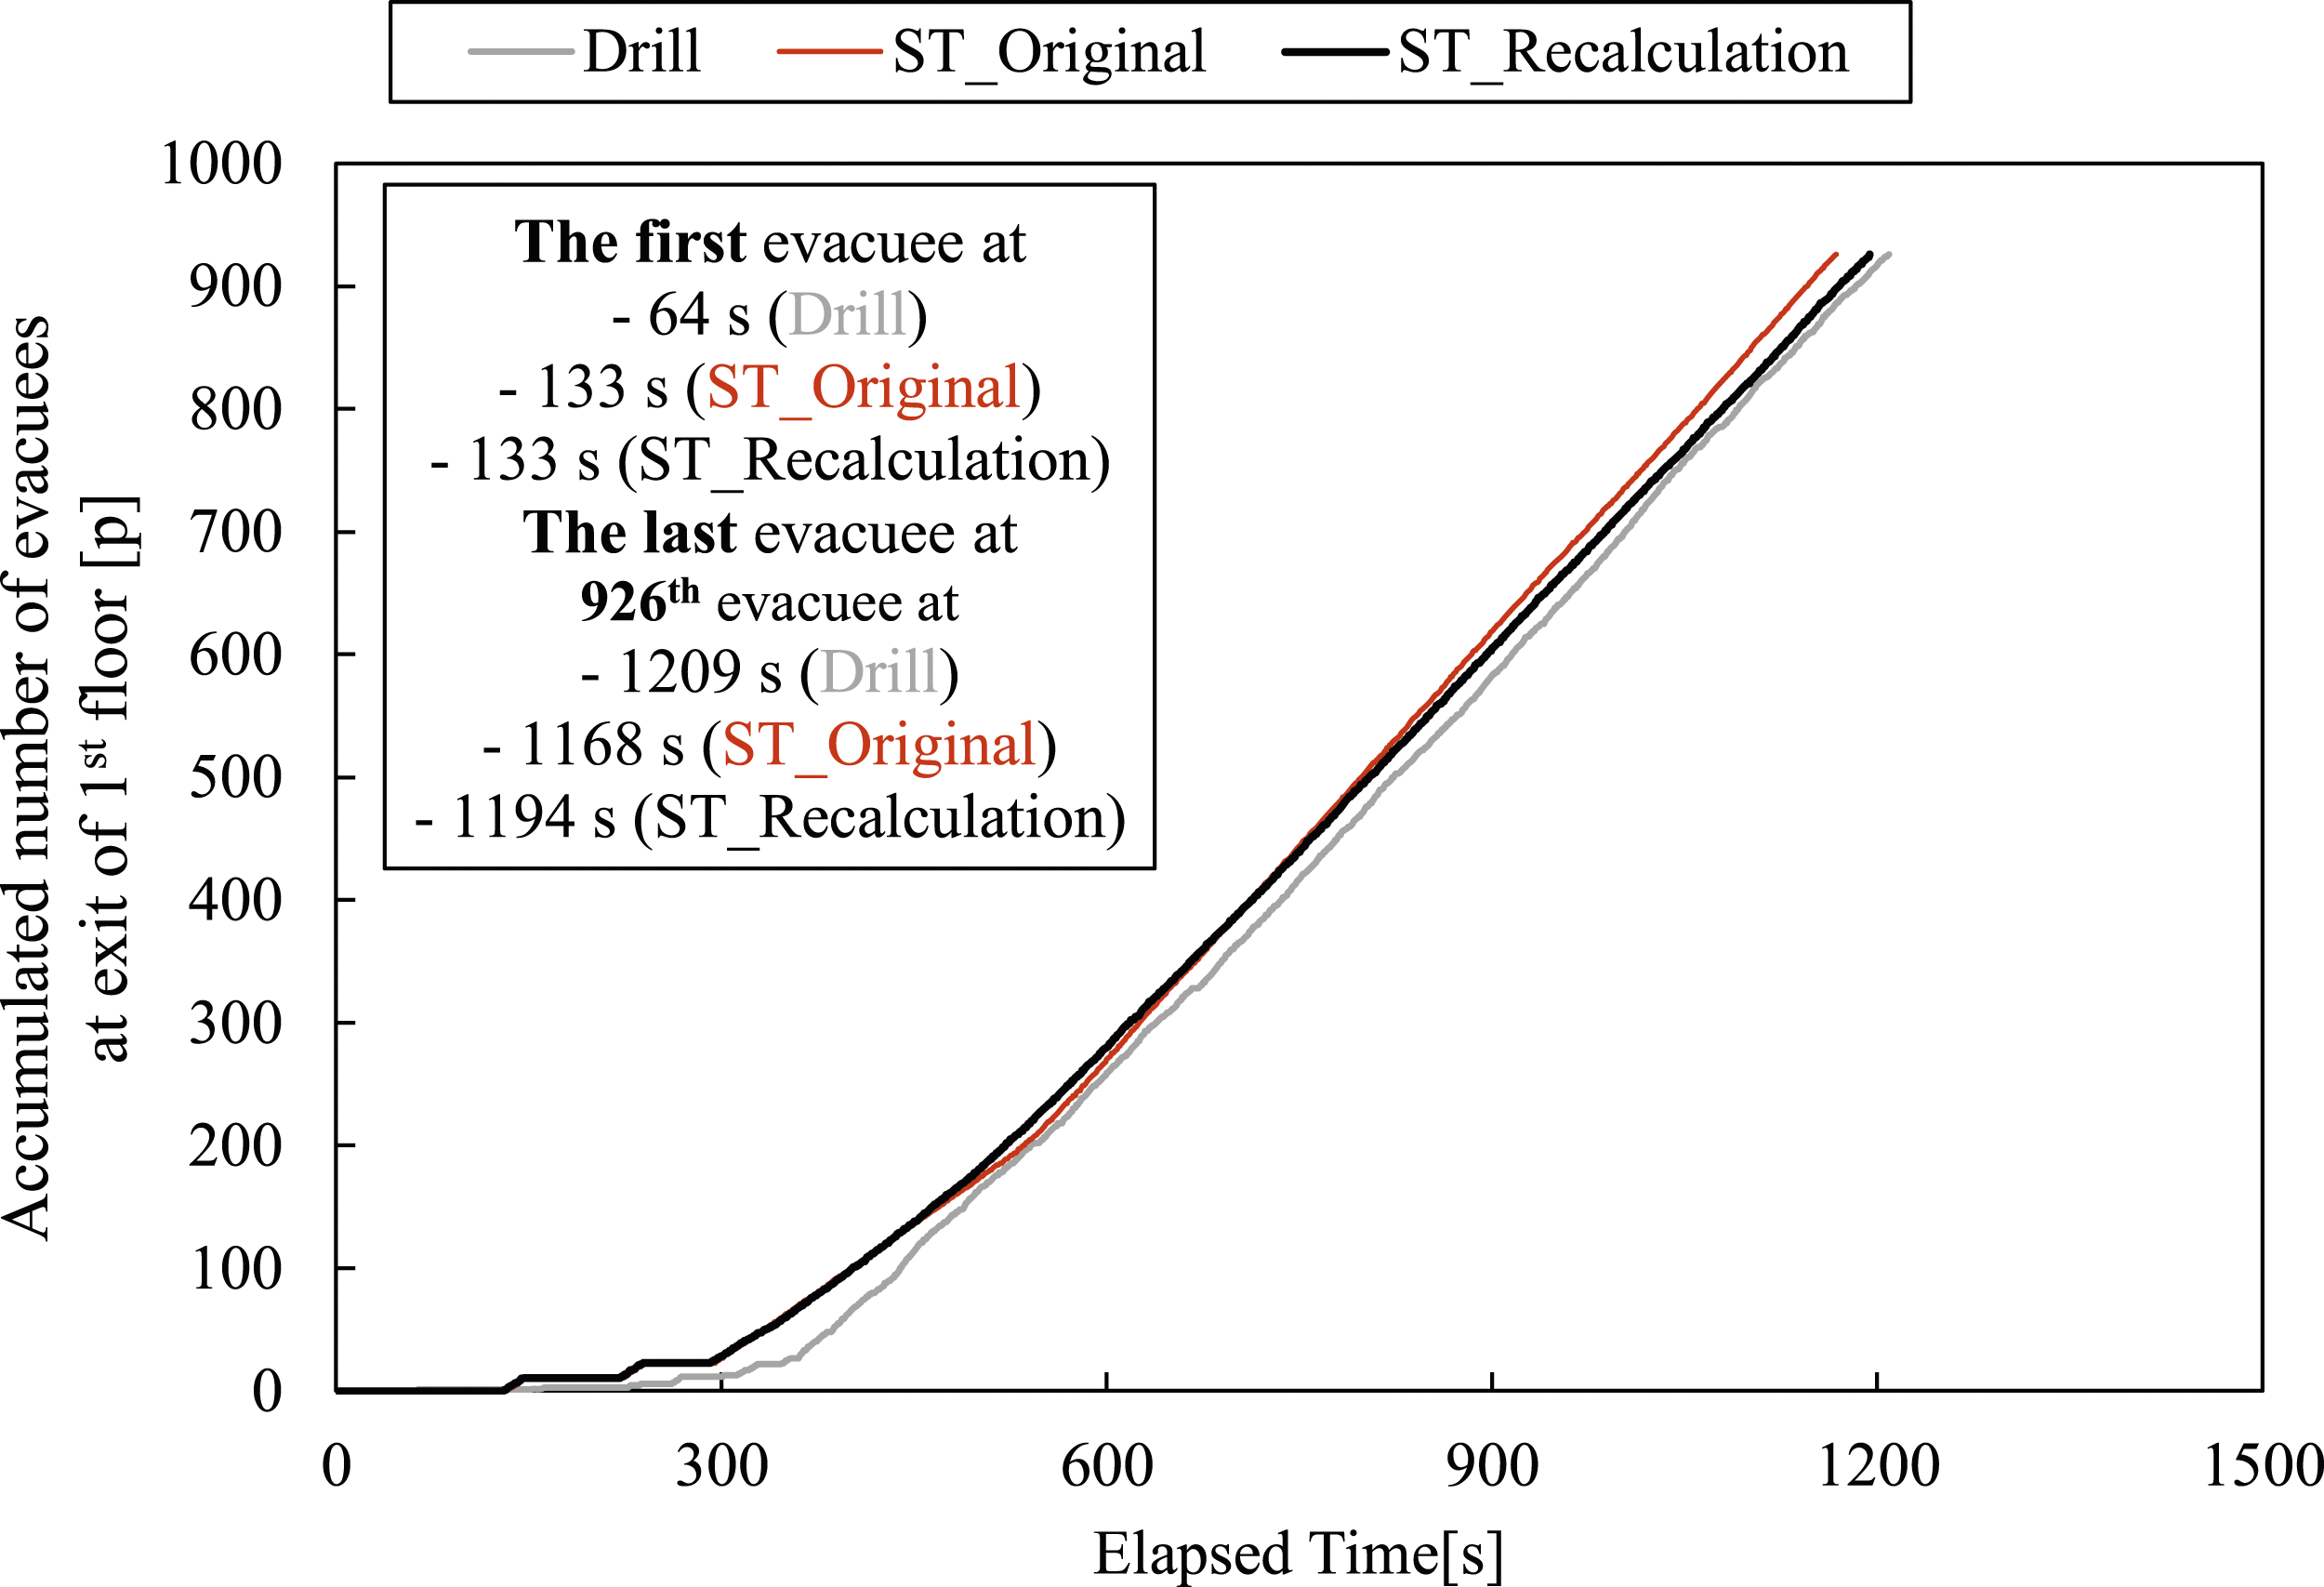
Conclusions
This study has proposed enhancements to the evacuation simulation software SimTread, through a comprehensive analysis of various aspects of staircase evacuation dynamics. The key objectives of this research were as follows: (1) Extracting tracer processes: We focused on extracting the processes of representative evacuees’ stair descents using tracers to determine the evacuation flow from various floors to investigate factors that may affect evacuation flow characteristics. (2) Merging analysis: We conducted a detailed analysis of density and flow rates at a representative landing during merging. (3) Flow characteristics analysis: We examined the characteristics of evacuation flow during descent and at the exit of the staircase on the 1st floor. (4) Integration with evacuation drill results: We compared the results of an evacuation drill with those obtained from SimTread, using the insights gained from steps 1) to 3). Subsequently, we proposed several improvements to enhance the evacuation simulation.
Several critical differences and key factors for improvement were identified in this study. Key findings and improvement suggestions for SimTread are as follows: I. Merge rate discrepancies: During merging, a significant bias favouring FL was observed. To address this issue, we modified the entry condition to the staircase in SimTread by adjusting the door width, ultimately aligning the merge rate with observations in ED. This adjustment underscores the importance of accurately replicating evacuees’ behaviour when passing through a staircase door in simulations. II. Landing density during merging: A substantial increase in density at a landing during merging was noted. This phenomenon was primarily influenced by the forward distance of the conflict determination area for avoiding other agents. Increasing this factor resulted in similar flow rates and maximum densities on the landing, effectively rectifying the issue. III. Crowd density dynamics during stair descent: As agents descended the stairs, fluctuations in crowd density were observed, particularly concerning the intermediate landings below the 5th floor, significantly influencing evacuation characteristics on the 1st floor. When experiencing the low-density evacuation flow, the movement formed a single line, resulting in a decrease in crowd density. Conversely, during high-density evacuation flow, a bottleneck phenomenon occurred, leading to increased density. This bottleneck was a direct result of the narrowed pathways on the intermediate landings below the 5th floor. Moreover, the high-density evacuation flow, often stemming from merging, tended to become the normal situation. However, in comparison to ED’s result, the front distance of the agents fell short. Consequently, we recommend increasing the distance to achieve more accurate simulations. Following modifications to the area of the intermediate landings and the front distance under the normal situation, the average flow rate and density of the evacuation flow closely mirrored the outcomes observed in ED. Hence, considerations of these parameters during simulation setup are crucial to ensure accuracy.
By implementing these enhancements, SimTread can better reproduce desired evacuation scenarios. Moreover, the calibration methods introduced in this study, involving adjustments to various simulation factors, hold the potential for broader application in other staircase evacuation simulations. In this study, the comparative analysis has been investigated to elucidate the commonalities and distinctions between the evacuation drill and the SimTread simulation. However, it is not universal to use one drill result to correct some influencing factors in any software including SimTread. The accuracy of the modified software needs to be verified by more evacuation experiment data. Now, more fire drills for various conditions of the mass phased evacuation in high-rise buildings will be conducted to validate and modify the SimTread in further works in Japan.
Footnotes
Acknowledgements
The use of a developer version of SimTread for enhancement was collaborated with A&A Co., Ltd., and Professor T. Sano from Waseda University. The evacuation drill was conducted with the cooperation of Professors A. Sekizawa from Tokyo University of Science and H. Kadokura from Tohoku Gakuin University.
Author contributions
Declaration of conflicting interests
The author(s) declared no potential conflicts of interest with respect to the research, authorship, and/or publication of this article.
Funding
The author(s) disclosed receipt of the following financial support for the research, authorship, and/or publication of this article: The authors received Grant-in-Aid for JSPS Fellows Grant Number 22J13643 of this article, and the data collection of the evacuation drill was supported by Grant-in-Aid for Scientific Research (C) of JSPS KAKENHI Grant Number 17K06722.