
Abstract
This study evaluates the effects of heat waves on habitability conditions, energy consumption and cooling expenses through on-site measurements in two houses in Buenos Aires Province: an urban house located in La Plata, with low thermal quality of the envelope and two air conditioners; and a rural one in Brandsen, with an intermediate thermal quality of the envelope and one fan. Energy strategies were simulated on both houses that, simultaneously, allow the adaptation to heat waves and reduce, or generate the least possible, impact on electricity grids: a photovoltaic (PV) system and a ground source heat pump (GSHP) system. Both locations experienced similar average outdoor temperatures (∼28°C), but La Plata had fewer fluctuations due to heat accumulation in built surroundings. Indoor temperatures were comparable (∼29°C living spaces/∼27°C bedrooms), but the house in La Plata experienced lower thermal fluctuations due to its air-conditioning (ACs) and outdoor temperatures. Average heat index values were alike (∼30°C living spaces/∼29°C bedrooms). Although La Plata’s dwelling had ACs, results show the influence of envelope performance and nighttime ventilation in the Brandsen’s rural setting. Adaptation assessment revealed that PV and GSHP systems are adequate measures to face heat waves; however, they require important incentives to achieve massiveness.
Keywords
Introduction
Over the last years, the impact of climate change has become increasingly evident at a global level, manifesting itself in significant consequences that directly affect the population. In this regard, as reported by the World Meteorological Organization, 2021 was the seventh consecutive year in which the global temperature has exceeded pre-industrial levels (1850–1900) by more than 1°C. Additionally, these 7 years were the warmest years recorded so far. The organization also highlights that in recent decades there has been an increasing trend in global temperature, and this is expected to continue in the future. 1 This global warming has led to various extreme climate events, including heat waves, which pose significant risks to human health. 2
In accordance with these trends, climate scenarios project a rise in the occurrence, duration and severity of heat waves, alongside an overall escalation in worldwide temperatures. These changes are attributed to the heightened concentration of greenhouse gases, as outlined by the World Meteorological Organization. 3
There are several definitions for heat waves. For this paper, we use the criteria of the National Meteorological Service of Argentina (SMN, by its acronym in Spanish),
4
which indicates that it is: A period in which the maximum and minimum temperatures equal or exceed, for at least three consecutive days and simultaneously, certain thresholds that depend on each locality. These benchmarks are determined using the concept of the 90th percentile (P90), which corresponds to the temperature beyond which it falls into the top 10% of recorded temperatures for that specific area, as per historical data. When temperatures surpass this threshold, they are categorized as extreme occurrences.
4
Heat waves have various impacts on society. Mainly, they cause health problems in the population, increasing mortality and lead to failures in the electrical networks and, consequently, to power outages. These outages considerably reduce the comfort level in homes, further aggravating the health risks for the affected people.
Some scientific works address the impact of heat waves on the mortality rates of the population. For example, Chesini et al. 5 identified that in the city of Buenos Aires the risk of death was increased by 14% during heat waves recorded between 2005 and 2015, with the most affected groups being those under 15 years old and those over 84 years old. Culqui et al. 6 evaluated the impact of heat waves on mortality in the population of Madrid during the period 1990 to 2009 and identified increases ranging from 11.21% to 45.7% for each °C above the threshold temperature. Martínez Navarro et al. 7 evaluated the mortality recorded during three heat waves in Spain between 1 June and 31 August of 2003 and observed an excess of deaths of 8%, which affected people over 65 years old. While Fouillet et al. 8 identified that the heat wave from 1 to 20 August 2003 caused 55% excess deaths in France. Also, Zhu et al. 9 demonstrated that an increase in temperature could reduce heart rate variability time-domain indices, indicating a greater sympathetic activity with a decreased cognitive performance due to heat stress.
Based on the above, it is evident that heat waves have a significant impact on the quality of life of the population but also on the electrical infrastructure. Hence, the implementation of adaptation and mitigation strategies becomes imperative across multiple domains concerning these occurrences. This includes housing, where efforts are necessary to enhance livability conditions during such phenomena, all while circumventing the strain on electrical grids. Relying exclusively on air conditioning equipment in homes as practically the only method of adaptation generates significant pressure on electrical systems. In this regard, it is important to note that during successive heat waves in Argentina, records have been broken in electricity generation.
As an example, on days of extreme temperatures such as 13 March 2023, at 15:00 hs the electricity demand of the Argentine Interconnection System reached a peak of 29,105 MW, which if compared to a less warm day such as 3 February its peak resulted in 20,000 MW. That represents a difference of 9000 MW associated with the use of cooling systems. 10 In this line, the cost of generation also reflects significant differences, given that the highest marginal cost operated on 13 March was 479.4 USD/MWh, while that of 3 February reached 161.6 USD/MWh. This represents a marginal cost almost three times higher for a day of extreme heat. Regarding this, as reported by the National Household Expenditure Survey 2017/2018, 11 47.1% of Argentine households have at least one air conditioner, while the provisional results of the 2022 census reported a total of 17,780,210 private homes. 12 That means that the calculation indicates that there would be, at least, about 8,374,478 appliances in the country. This is consistent with the increase of the additional 9,000 MW reached in a day with extreme temperatures if we estimate that about six million air conditioners were operating simultaneously and that their electrical power was on average 1.5 kW.
These data underscore the importance of implementing effective measures to enable homes to meet the challenges of heat waves in the future. It is also crucial that such actions do not overtax the electricity grids, thus avoiding possible failures that could aggravate the situation in the event of a generalized lack of supply.
In this regard, there are studies that address indoor thermal conditions during hot periods, but also there are papers that address the implementation of adaptation strategies in housing during heat waves and the impact of this phenomenon over electricity networks. In the case of indoor thermal assessment, we can highlight, for example, the work of Khambadkone et al. 13 who evaluated thermal comfort in architectural studio classrooms in India during the hottest and driest months. Zhang et al. 14 simulated and evaluated thermal comfort of indoor environment of a heritage building in gate tower in Beijing’s summer from the application of a floor-type fan coil air conditioning system. In this line, Lei et al. 15 predicted indoor thermal conditions in two-bedroom heritage apartments in two different Chinese climate zones, focusing on the overheating conditions that would occur under 2050 climate change scenarios. Also, Cruz and Cunha 16 evaluated the impact of climate change on the thermal-energy performance of prefabricated wall systems for social housing in Brazil, using computer simulations built from the Climate Change World Weather File Generator (CCWorldWeatherGen) tool. Kaudeer and Venkannah 17 assessed the thermal discomfort levels under future climate scenarios in Mauritius islands and indicated the necessity to change from natural ventilation as traditional cooling method to other active methods, that is, heating, ventilating and air conditioning (HVAC) and hybrid mixed-mode systems to address climate change adaptation. Huang and Liao 18 developed an indoor environment evaluation model for intelligent HVAC control systems of office buildings considering indoor health and thermal comfort in Guangzhou. Also, García-Arellano et al. 19 performed a comparative study of indoor thermal comfort conditions with self-constructed dwellings with different roofing in the Lower Papaloapan River Basin in Mexico. In turn, other works that evaluated interior conditions and overheating risks in summertime and in different types of buildings have been identified.20–24 Also, works oriented to the evaluation of low impact strategies for cooling living spaces are highlighted.25–27
In the case of papers that addressed specifically heat waves, the research of Stone et al. 28 simulated the effects of a heat wave period in conjunction with a citywide power grid failure event in Phoenix and identified that more than one million residents could be exposed to dangerous heat levels. In the study by Zhou et al., 29 they identified that the indoor temperature of a home during a heat wave can be reduced by an average of 0.43°C from cooling prior to the onset of the event; likewise, using desorption cooling the reduction can reach 1.31°C. Zeng et al. 30 evaluated a strategy of pre-cooling homes during off-peak hours to mitigate overheating during heat waves. Simulation results indicated that the measure is effective in reducing thermal discomfort during peak hours, although it increases the expenditure for cooling rooms. The study by Tawsif et al. 31 investigated the strategies most used by citizens of the city of Rajshahi (Bangladesh) to adapt to heat waves. They identified formal structural actions, such as installing cooling and ventilation systems; formal non-structural actions, such as hydration and bathing; and, finally, informal actions, such as using multiple windows, using the floor for sleeping or incorporating water reservoirs inside the rooms. In this way, Sun et al. 32 emphasized the effectiveness of passive measures, such as utilizing natural ventilation by opening windows and doors, as well as reducing additional loads, in mitigating extreme hazards during heat waves.
Osberghaus and Abeling 33 investigated the impact and adaptive capacities of German households disaggregated by income level, identifying greater vulnerability in those with lower purchasing power. On the other hand, Beckmann et al. 34 investigated temperature thresholds for subjective heat stress in urban apartments in Augsburg and identified a range from 24.8°C to 26.7°C. Kiarsi et al., 35 on the other hand, made a comprehensive literature review where the adaptive strategies of communities to heat waves applied in studies conducted during the last 10 years. Also, Xing and Jones 36 have compared the dynamic, energetic and hydrological performance of green and white roofs during a heat wave, using a test bench. The energy performance results indicated that the green roof could reduce solar heat gains by 76% during the day, improving the U-value by 28% and reducing the indoor air temperature by 2.5°C.
Regarding studies on heat waves in Argentina, the following works were identified. In Flores Larsen and Filippín, 37 a study of the indoor environment of social housing located in La Pampa province was carried out. They evaluated energy and thermal resilience in periods of extreme heat based on simulations, energy bills and health statistics. The underuse of refrigeration equipment due to the inability to pay for the service was identified, indoor temperatures above 33°C were obtained, the heat index reached values indicating ‘extreme caution’ and an increase in consultations associated with hot periods was verified. In Flores Larsen et al., 38 a method for detecting the impact of heat waves on the indoor environment of dwellings was proposed. Heat waves occurring during a 15-year period (2006–2020) in the city of Buenos Aires were analysed, and dynamic simulations of two paired dwellings were used to determine thresholds for grouping heat waves according to their impact: moderate, strong and extreme on the indoor environment. Meanwhile, in Flores Larsen, Filippín and Bre, 39 the thermal resilience to heat waves of a bioclimatic office building with passive strategies for indoor comfort in La Pampa province was evaluated through thermal simulations and in situ monitoring of the building.
Based on the literature review, there is a lack of studies that use empirical hygrothermal and energy measurements during heat waves in homes to analyse the impact of these meteorological phenomena on habitability conditions and to evaluate the impact of adaptation strategies on the dwellings themselves considering the electrical networks.
Objectives and scope of work
Based on the above mentioned, the objective of this work was to evaluate the effects of a heat wave on the habitability conditions, energy consumption and economic expenditure for cooling in two single-family houses located in the northwest of the Buenos Aires Province based on empirical measurements. The first one has a low thermo-energetic performance, it has two air conditioning units, and it is located in the district of La Plata. The second one has an intermediate thermo-energetic performance, it has one fan and it is located in the district of Brandsen.
For each case, an adaptation option to this meteorological phenomenon with a low impact on power grids was evaluated: in the first case, the insertion of a photovoltaic (PV) system was evaluated to cover a proportion of the electricity consumption for cooling; and in the second case, the incorporation of a high-efficiency ground source heat pump (GSHP) system was evaluated to achieve comfort conditions inside the house.
From this, conclusions related to empirical measurements and the possibilities of adaptation to heat waves were obtained for each case.
Methodology
For 13 days, from 6 to 18 March 2023, thermo-energetic measurements were taken in two single-family dwellings. These 13 days coincided with two heat waves that occurred between 28 February and 19 March 2023. The houses are located in the districts of La Plata and Brandsen, respectively. Both districts are contiguous, situated in the northeast of the Buenos Aires province, and are adjacent to the Metropolitan Area of Buenos Aires (MABA) – see Figure 1. Locations of the districts of La Plata and Brandsen (Red) in Buenos Aires Province (Argentina). The yellow marks the Metropolitan Area of Buenos Aires.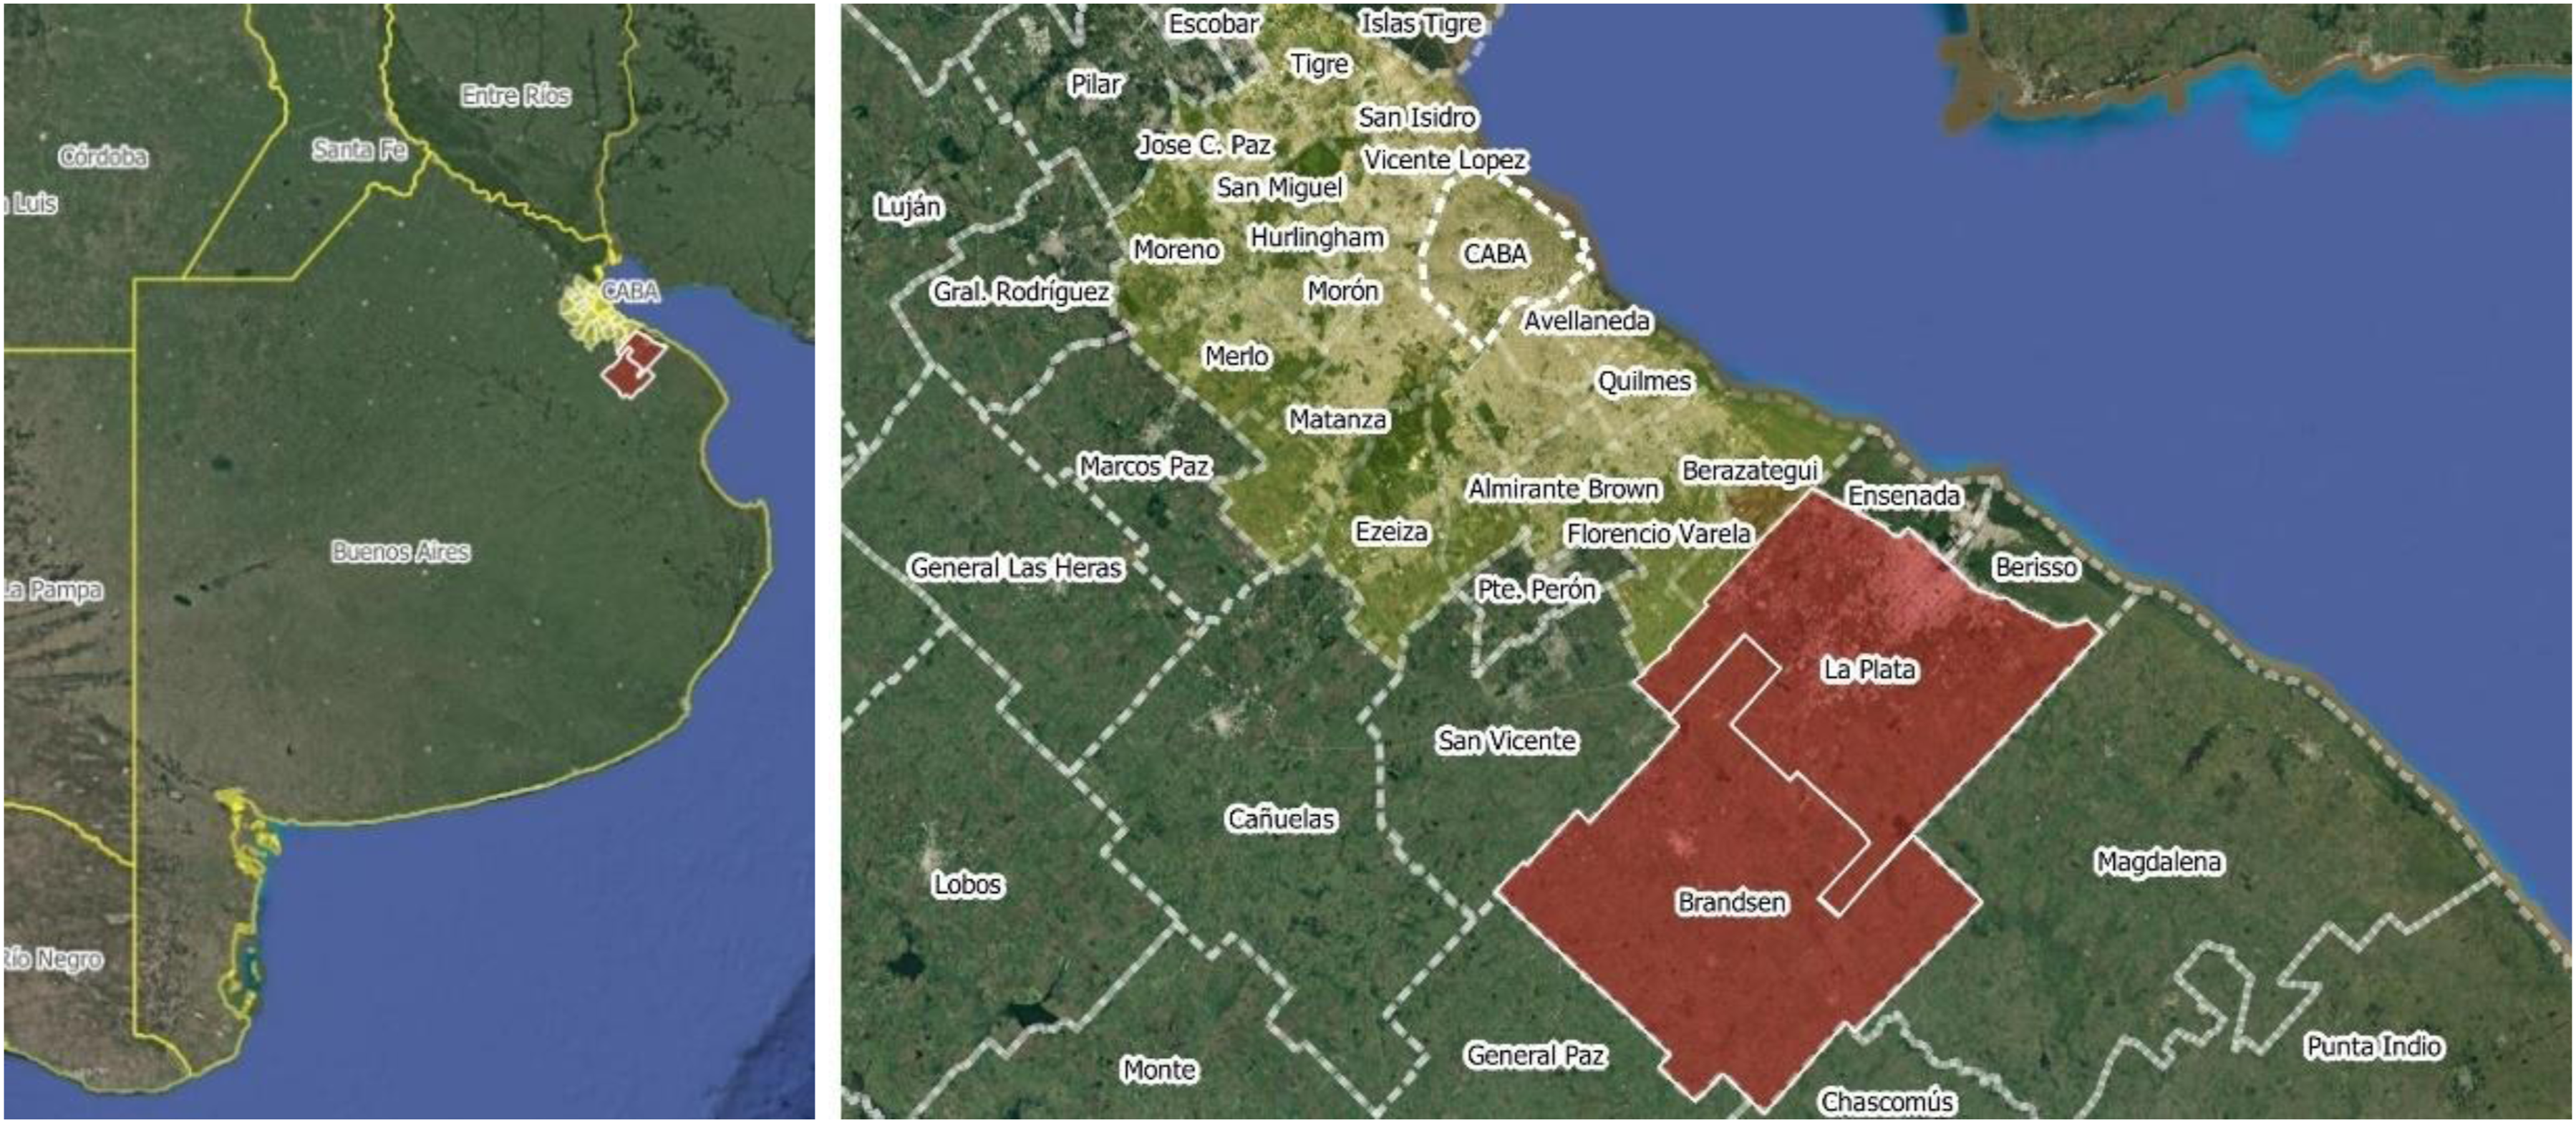
Heat waves in Argentina between 28 February and 19 March 2023
Based on the National Meteorological Service of Argentina (SMN), the first heat wave extended over the Metropolitan Area of Buenos Aires and partially the southern Litoral, northern Buenos Aires, northwestern Córdoba and northern San Luis between 28 February and 7 March 2023 (SMN 40 ). The second heat wave extended over central and northern Buenos Aires, central and southern Litoral, Córdoba, southeastern NOA region between 8 and 19 March 2023 (SMN 41 ). In other words, the measurements taken corresponded mostly to the second heat wave.
According to the SMN, 40 the causes of these events were associated with the formation of a very intensified South Atlantic anticyclone on the surface, which brought northern wind and humidity to the centre of the country and atmospheric blocking conditions in the middle and upper levels of the atmosphere in that area, preventing cooler air from entering the region. This caused temperatures to be persistently very high for the time of the year and gave rise to the development of these two very intense and late heat waves. In this sense, SMN 41 pointed out that: ‘It should be noted that these last two heat wave events are unprecedented in the southern area of the Litoral and northern Buenos Aires, especially in the Metropolitan Area of Buenos Aires, where the persistence of oppressive hot nights and afternoons set new historical records. Average temperatures for the first half of March were between 7°C and 9°C above normal’.
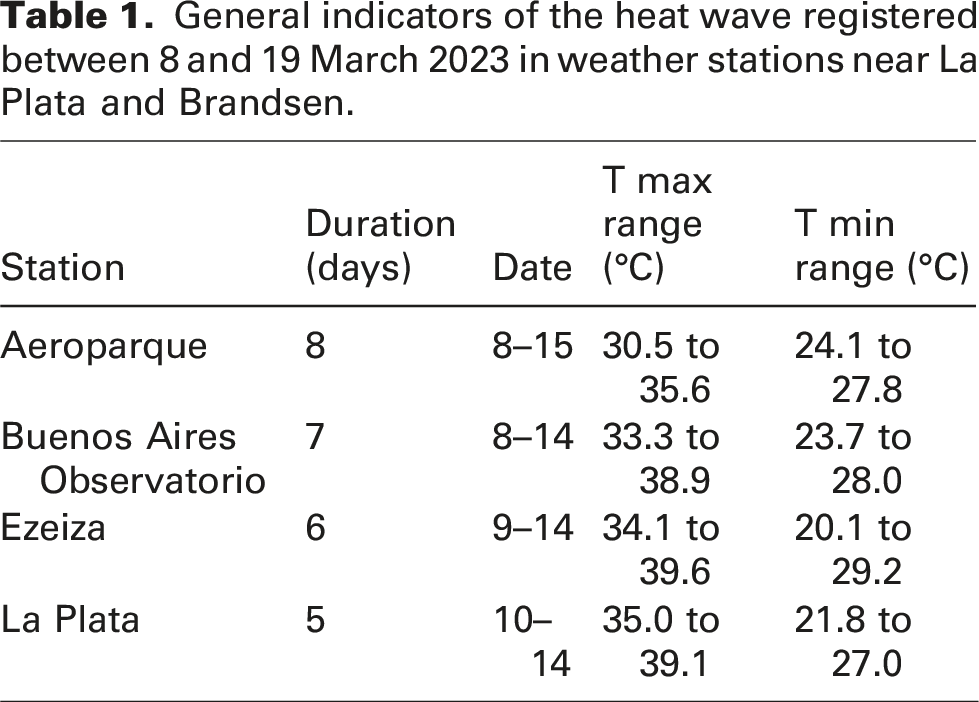
General indicators of the heat wave registered between 8 and 19 March 2023 in weather stations near La Plata and Brandsen.
Characteristics of the case studies
Regarding the houses used as case studies, the first one is located in an urban area of La Plata district, while the second one is located in a rural area of the Brandsen district. They are located about 32 km away from each other.
The region where the houses are located has a warm temperate climate with low thermal amplitudes throughout the year. In winter, it has an average temperature of 11.08°C and a relative humidity of 83%. In summer, it has an average temperature of 21.89°C and a relative humidity of 76% (IRAM Standard 11603 42 ). This region has an annual total of 1754 heating degree days based on a reference temperature of 20°C and 140 cooling degree days based on a reference temperature of 24°C. (Degree Days - Weather Data for Energy Saving 43 )
Main characteristics of each of the dwellings used as case studies.
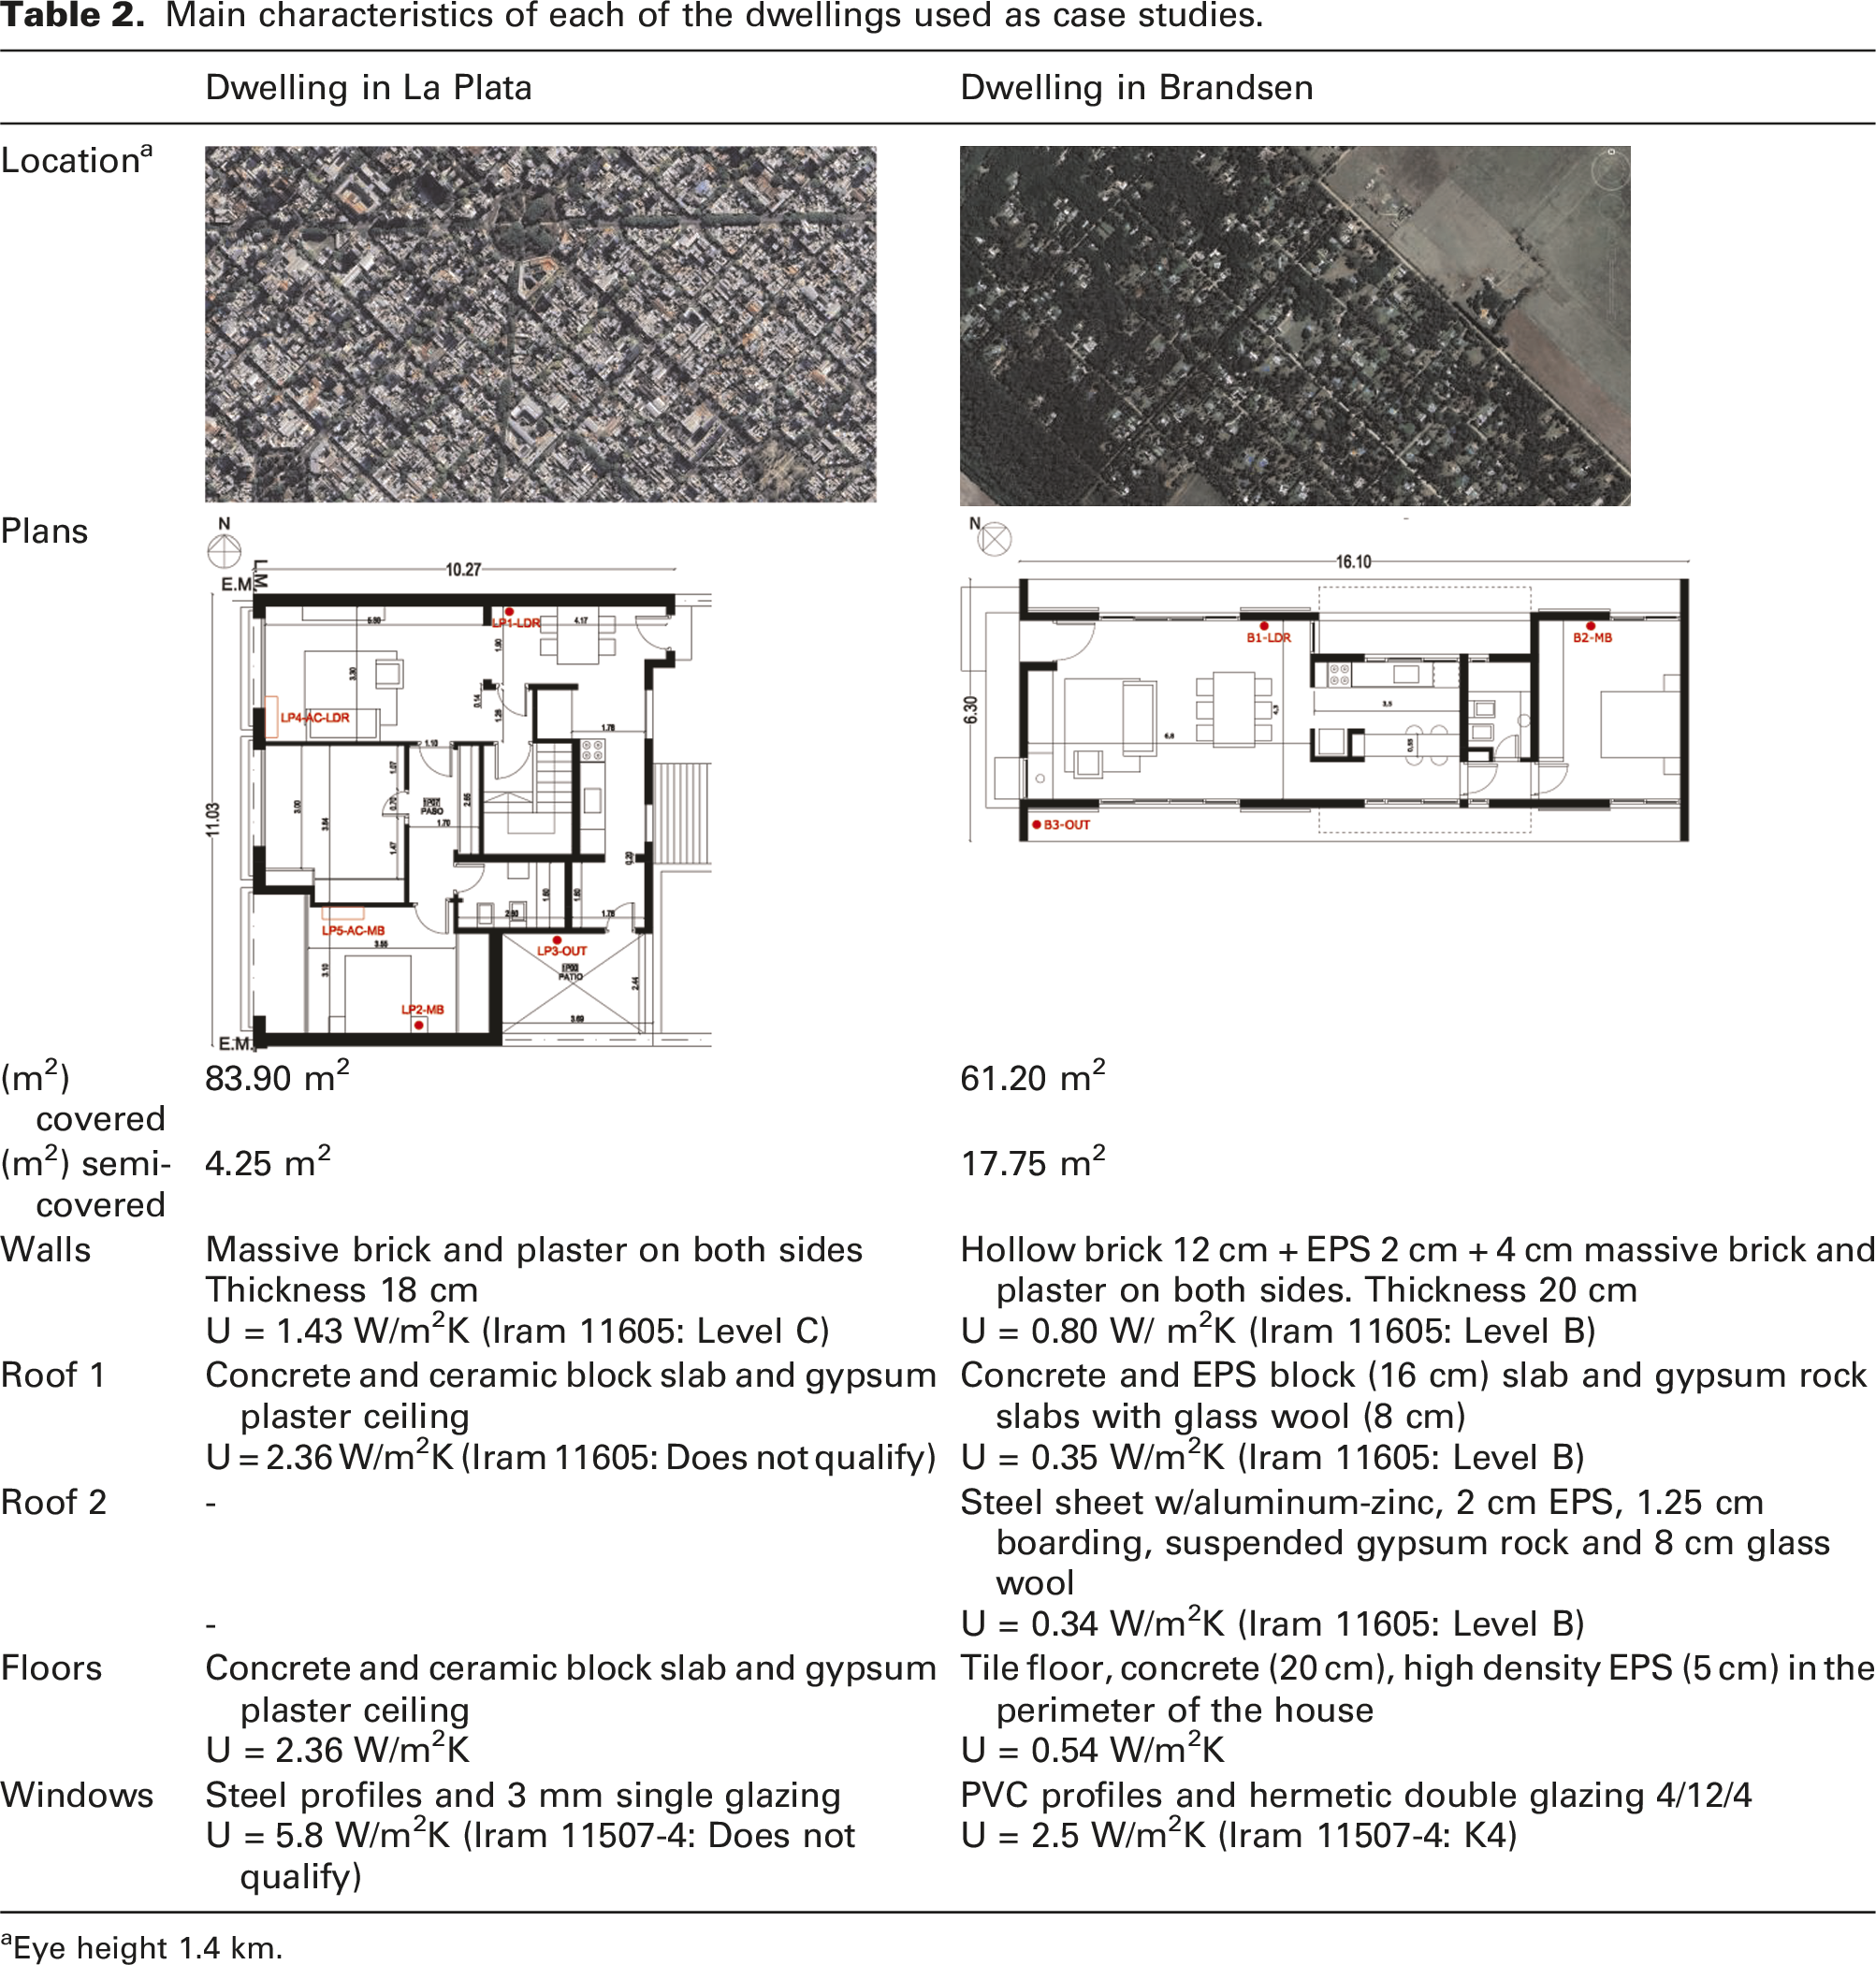
aEye height 1.4 km.
Materials and methods
Summary of the volume of spaces analysed and measurement equipment used between 6/3/2023 and 18/3/2023.
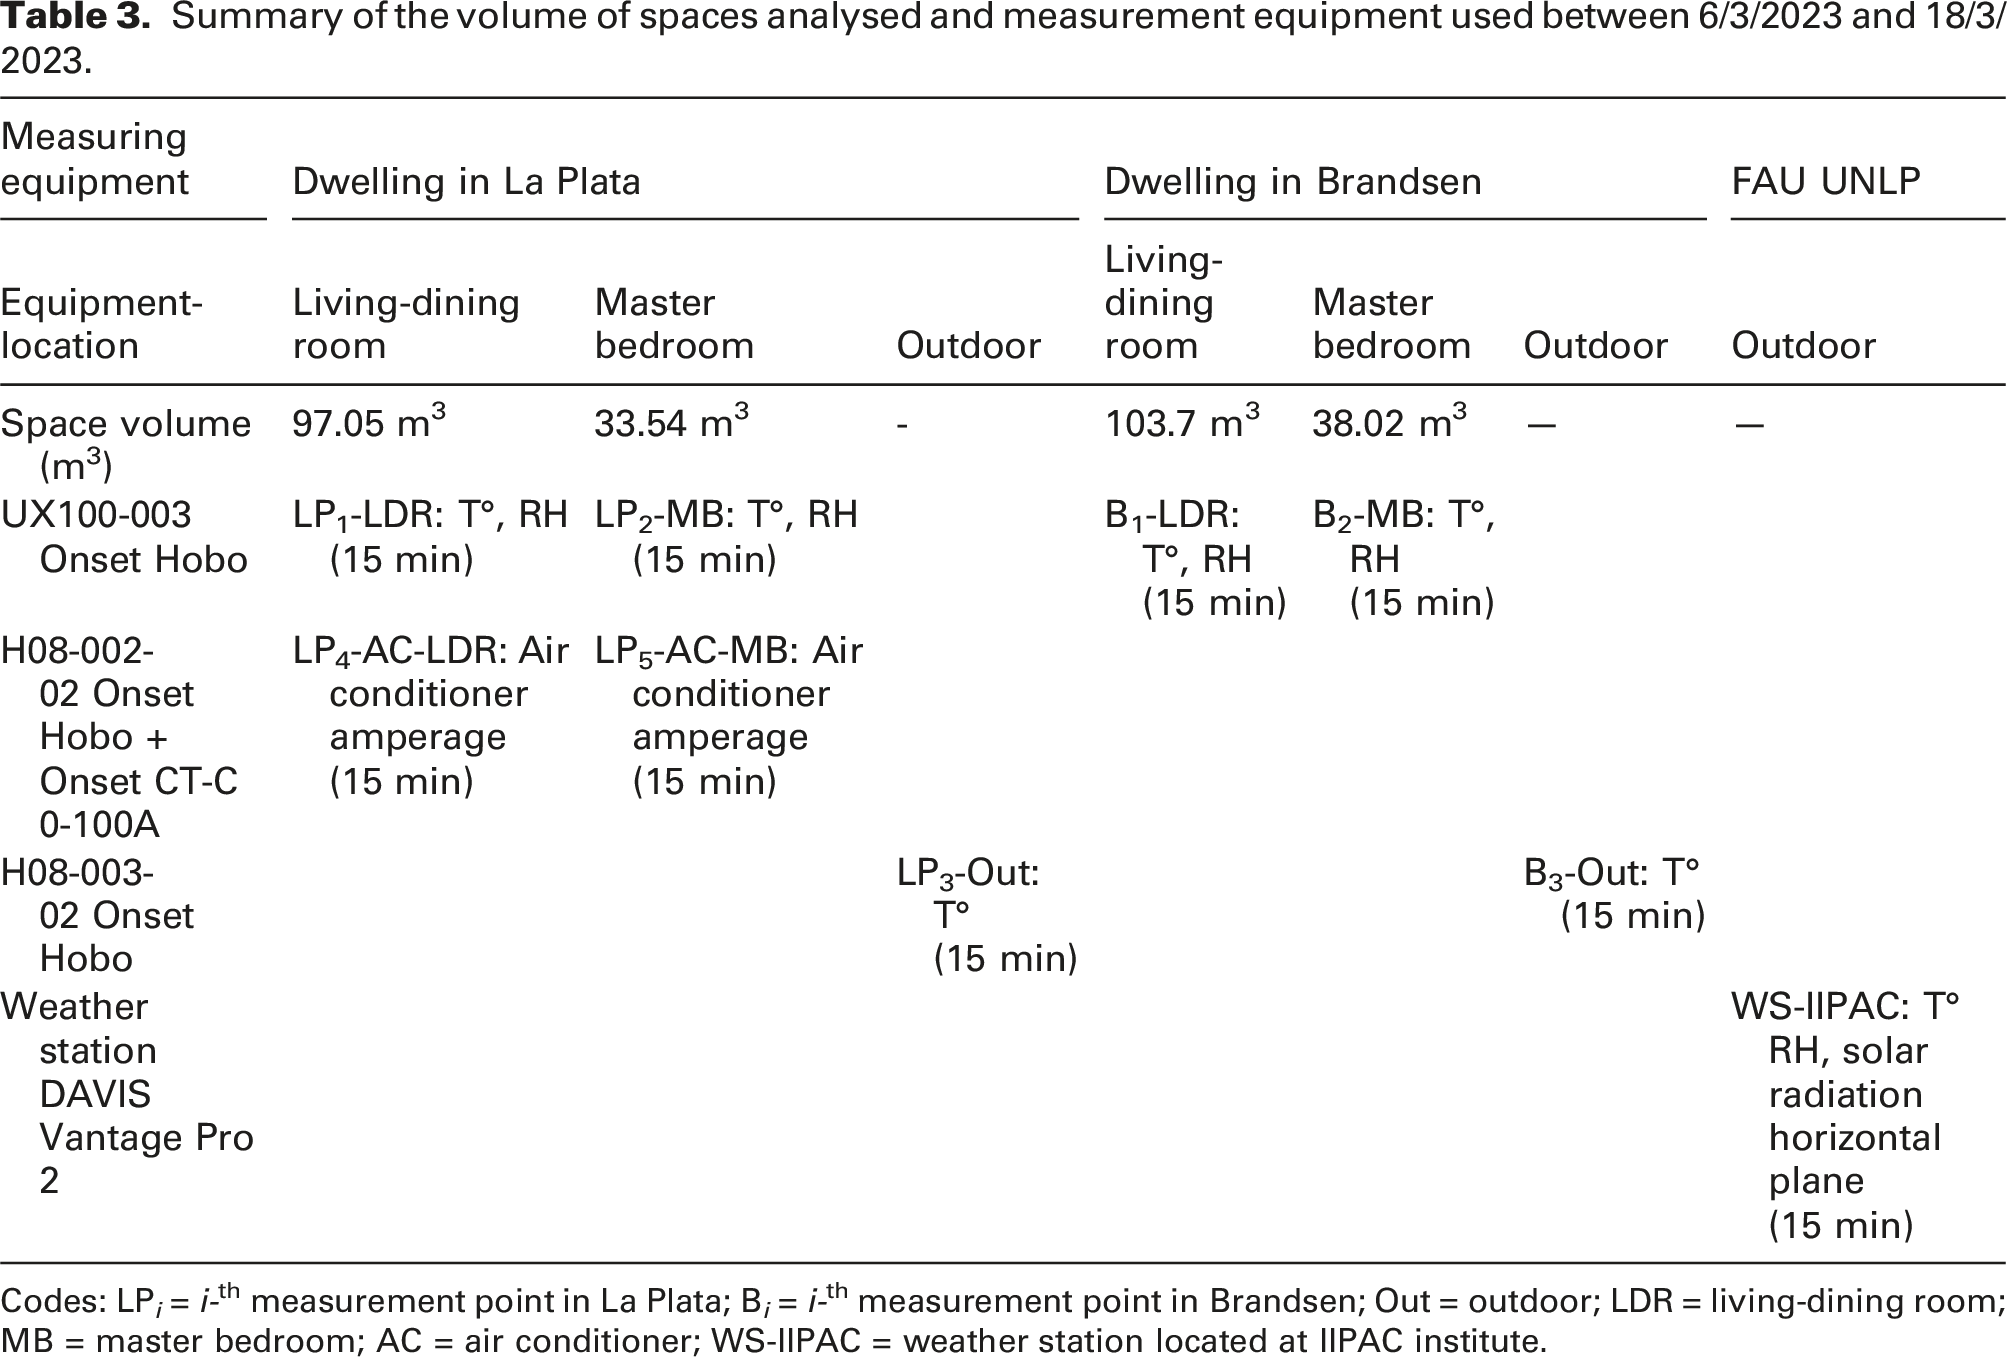
Codes: LP i = i-th measurement point in La Plata; B i = i-th measurement point in Brandsen; Out = outdoor; LDR = living-dining room; MB = master bedroom; AC = air conditioner; WS-IIPAC = weather station located at IIPAC institute.
Based on the measurements taken to analyse the effects of the heat wave, the following evaluations were made: (i) Habitability conditions, (ii) Energy consumption and cooling costs and (iii) Adaptation to heat waves.
Habitability conditions
To investigate the habitability conditions, the heat index (HI) was used. The HI determines the apparent temperature or the temperature that the body feels (NOAA 44 ), and it is widely utilized in the United States of America and internationally because it serves as a robust indicator of heat stress. 37 For example, it is used by the U.S. Occupational Safety and Health Administration and the U.S. National Weather Service. 32
Following the works of Steadman, 45 HI depends on several variables: vapour pressure, dimensions of a human, effective radiation area of skin, significant diameter of a human, clothing cover, core temperature, core vapour pressure, surface temperatures and vapour pressures of skin and clothing, activity, effective wind speed, clothing resistance to heat transfer, clothing resistance to moisture transfer, radiation from the surface of the skin, convection from the surface of the skin, sweating rate, ventilation rate, skin resistance to heat transfer, skin resistance to moisture transfer, surface resistance to heat transfer and surface resistance to moisture transfer.
To facilitate the use of the model, Steadman 45 established some fixed variables (i.e. wind speed, vapour pressure, amongst others) and summarized the results of the HI in a table that depends on dry-bulb temperature and relative humidity to determine the temperature that the body feels. Subsequently, in order to further facilitate the implementation of the model, Rothfusz 46 developed a multiple regression from the information in the Steadman table with the aim of obtaining a general equation to find the HI from the two aforementioned variables (dry-bulb temperature and relative humidity).
Hence, in this work, the Rothfusz
46
equation was used to calculate the HI (equation (1)), which is also used by the National Oceanic and Atmospheric Administration of U.S. (NOAA)
47
and several scientific articles (i.e. Flores Larsen and Filippín
37
or Sun, Specian and Hong
32
). Based on its application, descriptive statistical analysis of the different sectors of the two dwellings was performed, and conclusions are drawn.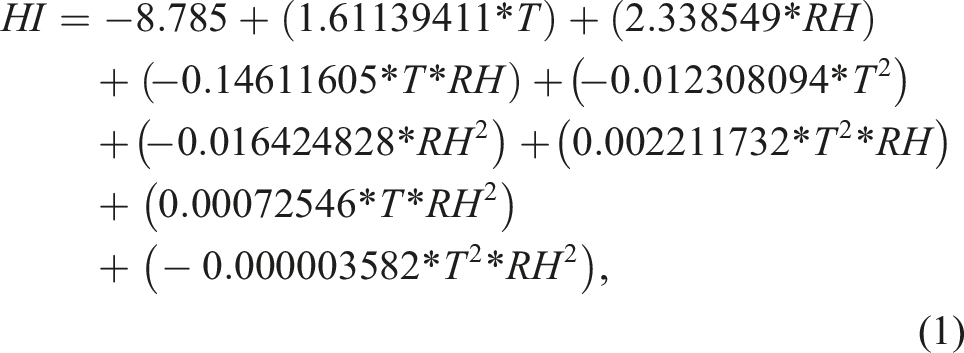
Also, if HI results were less than 26.7°C, it must be applied to a simpler formula of equation (2).
Risk from continued exposure to excessive heat as a function of Heat Index (HI).
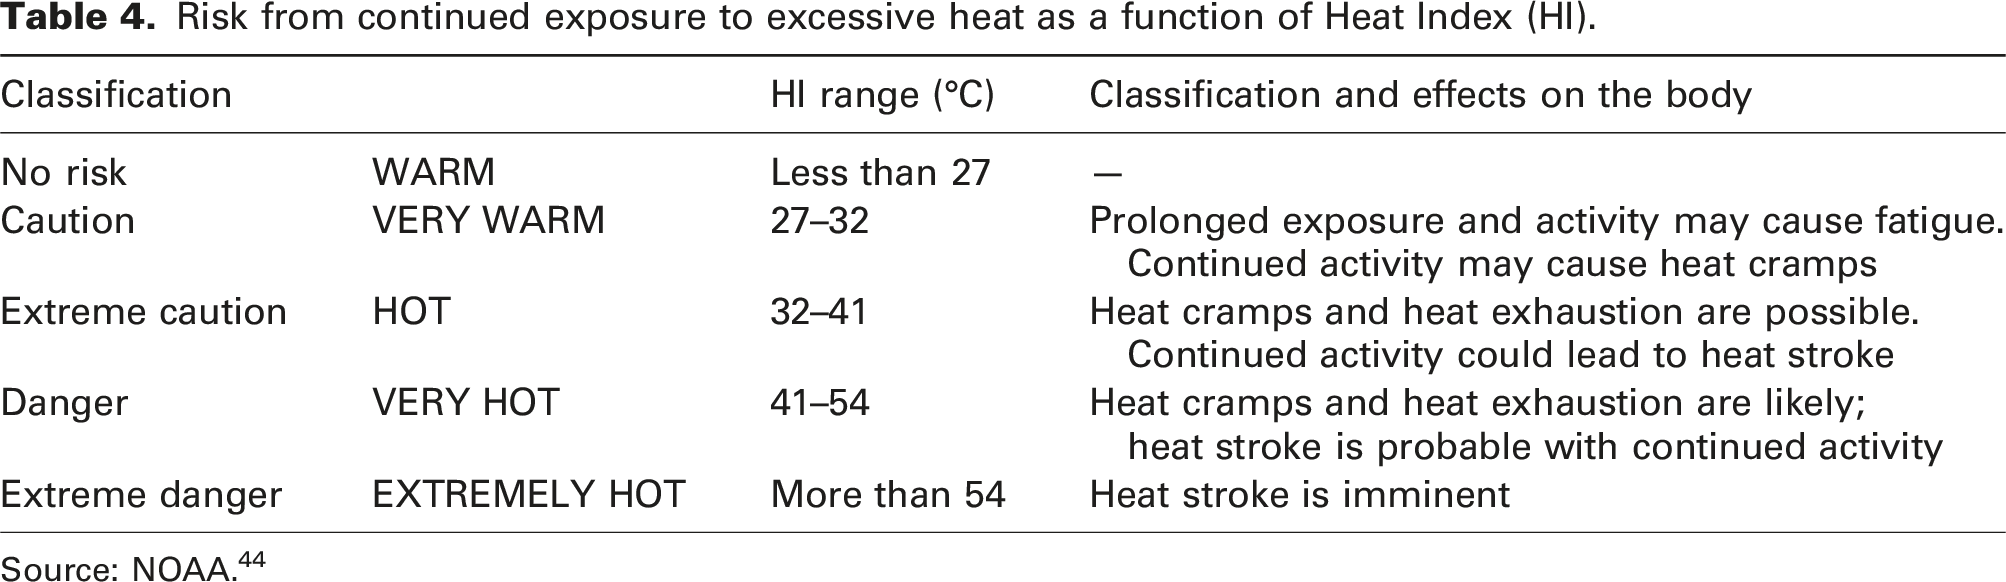
Source: NOAA. 44
Energy consumption and cooling costs
Two approaches were used to evaluate energy consumption.
On the one hand, the house located in La Plata has two air conditioners whose electric current was measured during the studied period. Since the measuring instrument records the current (I) flowing to the appliance, to determine the electric power, the voltage of the network (V) was assumed to remain fixed at 220 V during the entire measurement period. From this, the electrical power (P) of each measured interval in W was calculated from Ohm’s Law. This power was multiplied by the time and the energy used in kWh for each air conditioner was obtained.
On the other hand, the house located in Brandsen has only one fan, with a power of 100 W (0.45 A), whose consumption was not measured. To determine the electrical demand of this equipment, it was assumed used during three quarters of the time during which the T and RH measurements were taken.
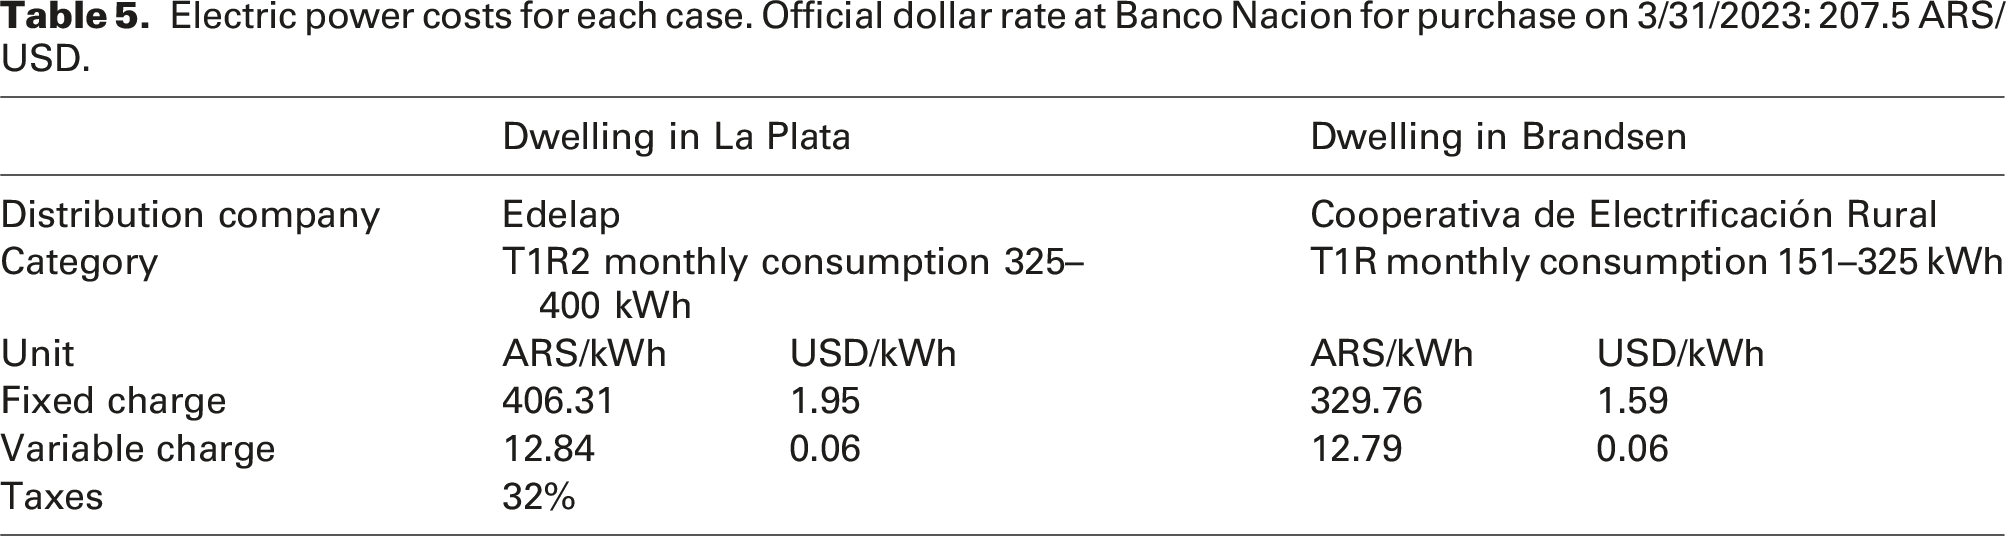
In both cases, and for illustrative purposes, the total electricity consumption for cooling or ventilation systems during the period measured was calculated, and daily consumption indicators and per square metre of air-conditioned space were obtained. Likewise, the consumption of this period was compared with the demand of each dwelling during the whole year.
Electric power costs for each case. Official dollar rate at Banco Nacion for purchase on 3/31/2023: 207.5 ARS/USD.
Adaptation to heat waves
For the house located in La Plata, a 1.2 kWp photovoltaic system was implemented without storage, to cover the cooling electricity demand. For this purpose, climatic information from the Davis Vantage Pro2 station was used and the daily generation curves during the heat wave were simulated using the PVSol software for the days considered in this study. From the superposition of the daily supply and demand curves, and the average of these curves, conclusions related to the coverage of consumption peaks and the behaviour of the proposed system in relation to the electric grid were obtained.
For the house located in Brandsen, a Ground Source Heat Pump (GSHP water-to water) was essayed as cooling system. It was compared against a conventional air conditioner, which was indeed an Air Source Heat Pump (ASHP air-to-air). To estimate its consumptions, a dynamic simulation model was first built with SIMEDIF software (UNSa
48
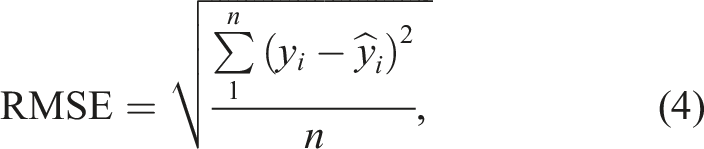
). To calibrate the building energy model, simulated indoor air temperatures were compared against real monitored data. Mean Absolute Error – MAE – was determined by equation (3) and Root Mean Square Error – RMSE – was determined by equation (4) based on the disparities between measured and simulated temperature values, providing metrics for result validation (Aljundi et al.
49
). MAE and RMSE are two standard metrics used to measure model performance in meteorology, air quality and climate research studies. (Hodson,
50
Chai and Draxler,
51
Willmott and Matsuura
52
)
Once the model was validated, the thermal demand for cooling was estimated based on the setting of the following indoor temperatures: 26°C in the living-dining room between 8:00–20:00 hs and 26°C in the bedroom between 20:00–8:00 hs. 26°C was considered based on the UK National Health Service criteria (NHS 53 ). From this, two curves were obtained with the thermal load to be removed (cooling of the living-dining room and the bedroom), thus obtaining a single total curve for the dwelling. The latter was used to evaluate the average daily electrical load curve required by GSHP and ASHP systems.
The GSHP cools water that it sends to fan coils inside the house and transfers the heat to a brine that delivers the heat into the ground. The machine considered was manufactured by Carrier,
54
and it has an Energy Efficiency Ratio (EER) of 4.50 when entering water temperature (EWT) to the source coil at 32°C and the water flow rate is 2.04 m3/h in load and source coils. Equation (5)55,56 shows the performance curve built for the selected GSHP using the datasheet of the manufacturer,
54
from which the EER was obtained depending on EWT. For this study, EER was considered a constant of 4.5 because the soil temperature undergoes little, if any, seasonal variation below about 10 m and indoor temperature was set to a fixed value. This assumption was verified in the paper of Battaglia et al.
57

For modelling the functioning of the ASHP, the works of Cherem-Pereira and Mendes
58
and Meissner et al.
59
were followed, where the empirical performance curves of different air conditioners were obtained. In this case, the AC #03 published in Meissner et al.
59
was used, which has a nominal EER of 3.00 (for standard test conditions: outdoor dry-bulb temperature = 35°C; and indoor dry-bulb temperature = 26.7°C). In order to determine the ASHP electricity consumption under the real conditions of each time interval in which the measurements were taken, the EER characteristic curve was built using equation (6).
59
This is a quadratic function that depends on the indoor wet-bulb temperature and the outdoor dry-bulb temperature. It results in a dimensionless factor Z that represents the ratio between the EER on a given environment condition and on nominal condition.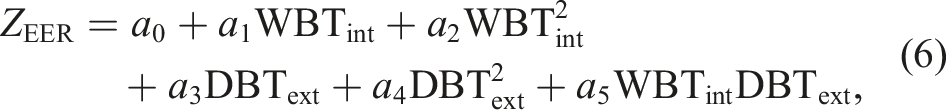
Results
Figures 2 and 3 show the measurements taken in two houses during 13 days of March 2023 showing the heat wave in La Plata and Brandsen (06/03/2023 to 18/03/2023): Temperature and electric power measurements for cooling rooms in La Plata dwelling during the March 2023 heat wave. Source: own elaboration. Codes: LP
i
= i-th measurement point in La Plata; Out = outdoor; LDR = living-dining room; MB = master bedroom; AC = air conditioner. Temperature measurements in Brandsen dwelling during the March 2023 heat wave. Source: own elaboration. Codes: B
i
= i-th measurement point in Brandsen; Out = outdoor; LDR = living-dining room; MB = master bedroom.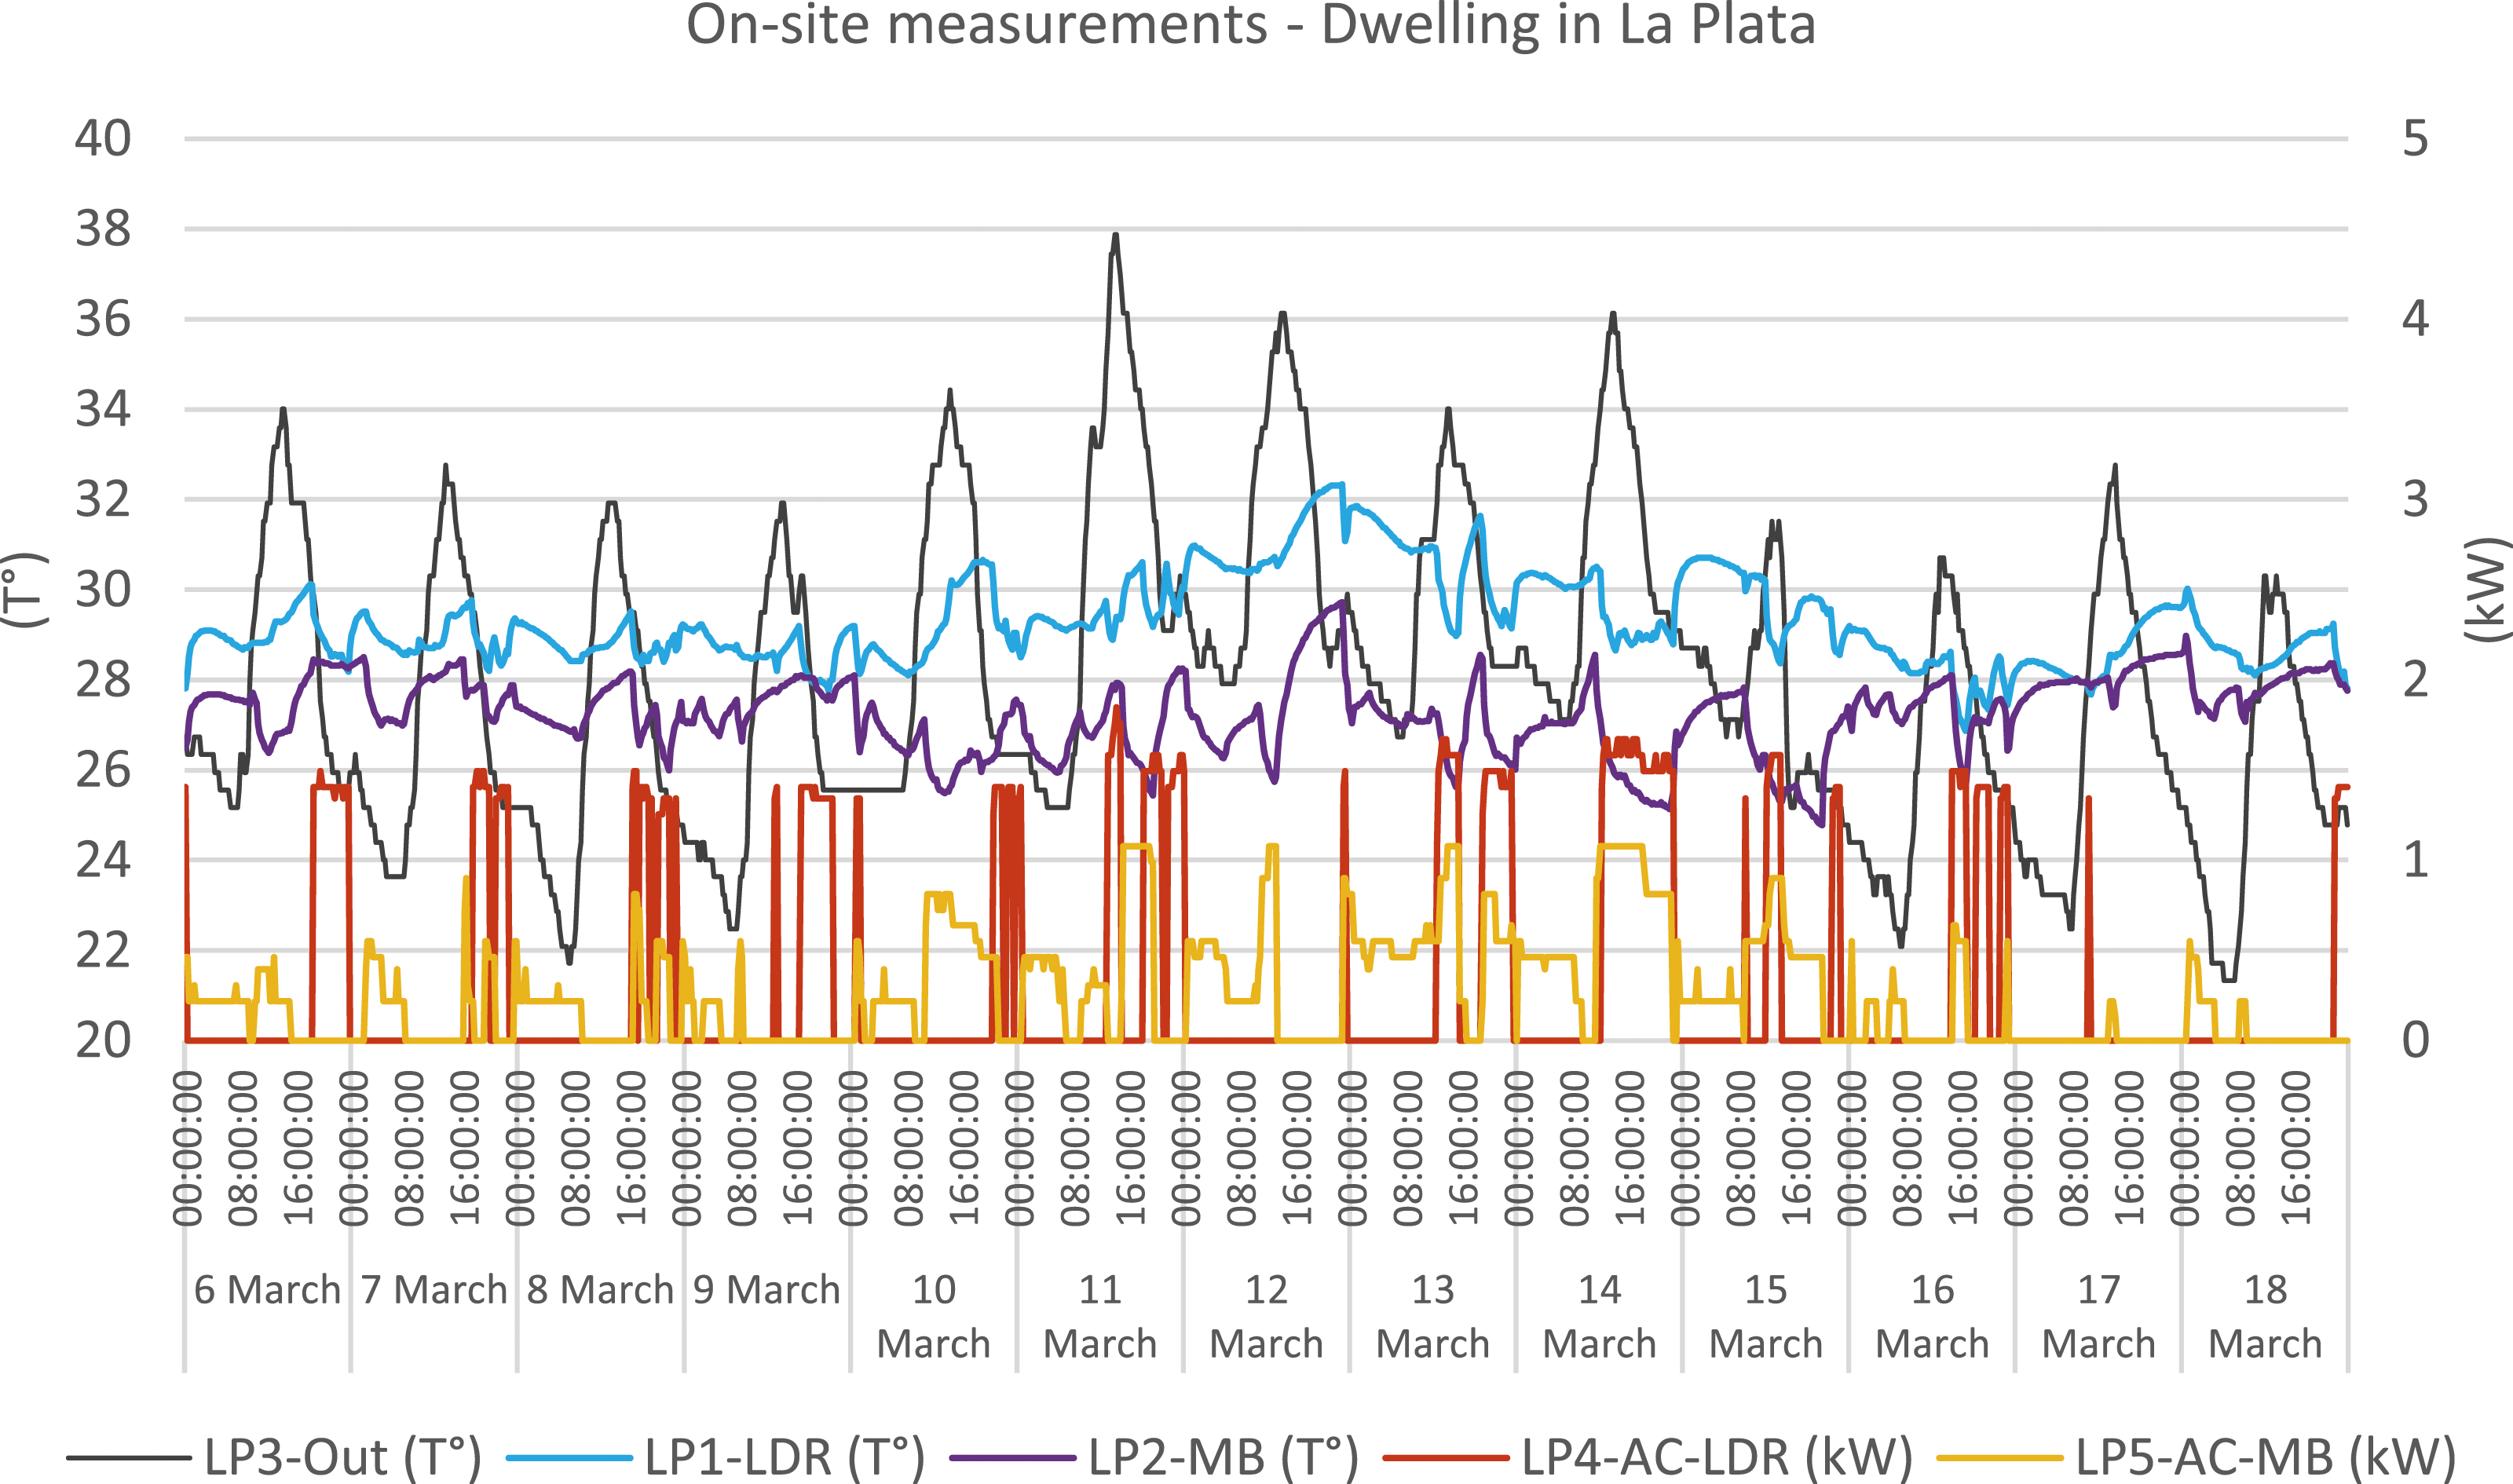
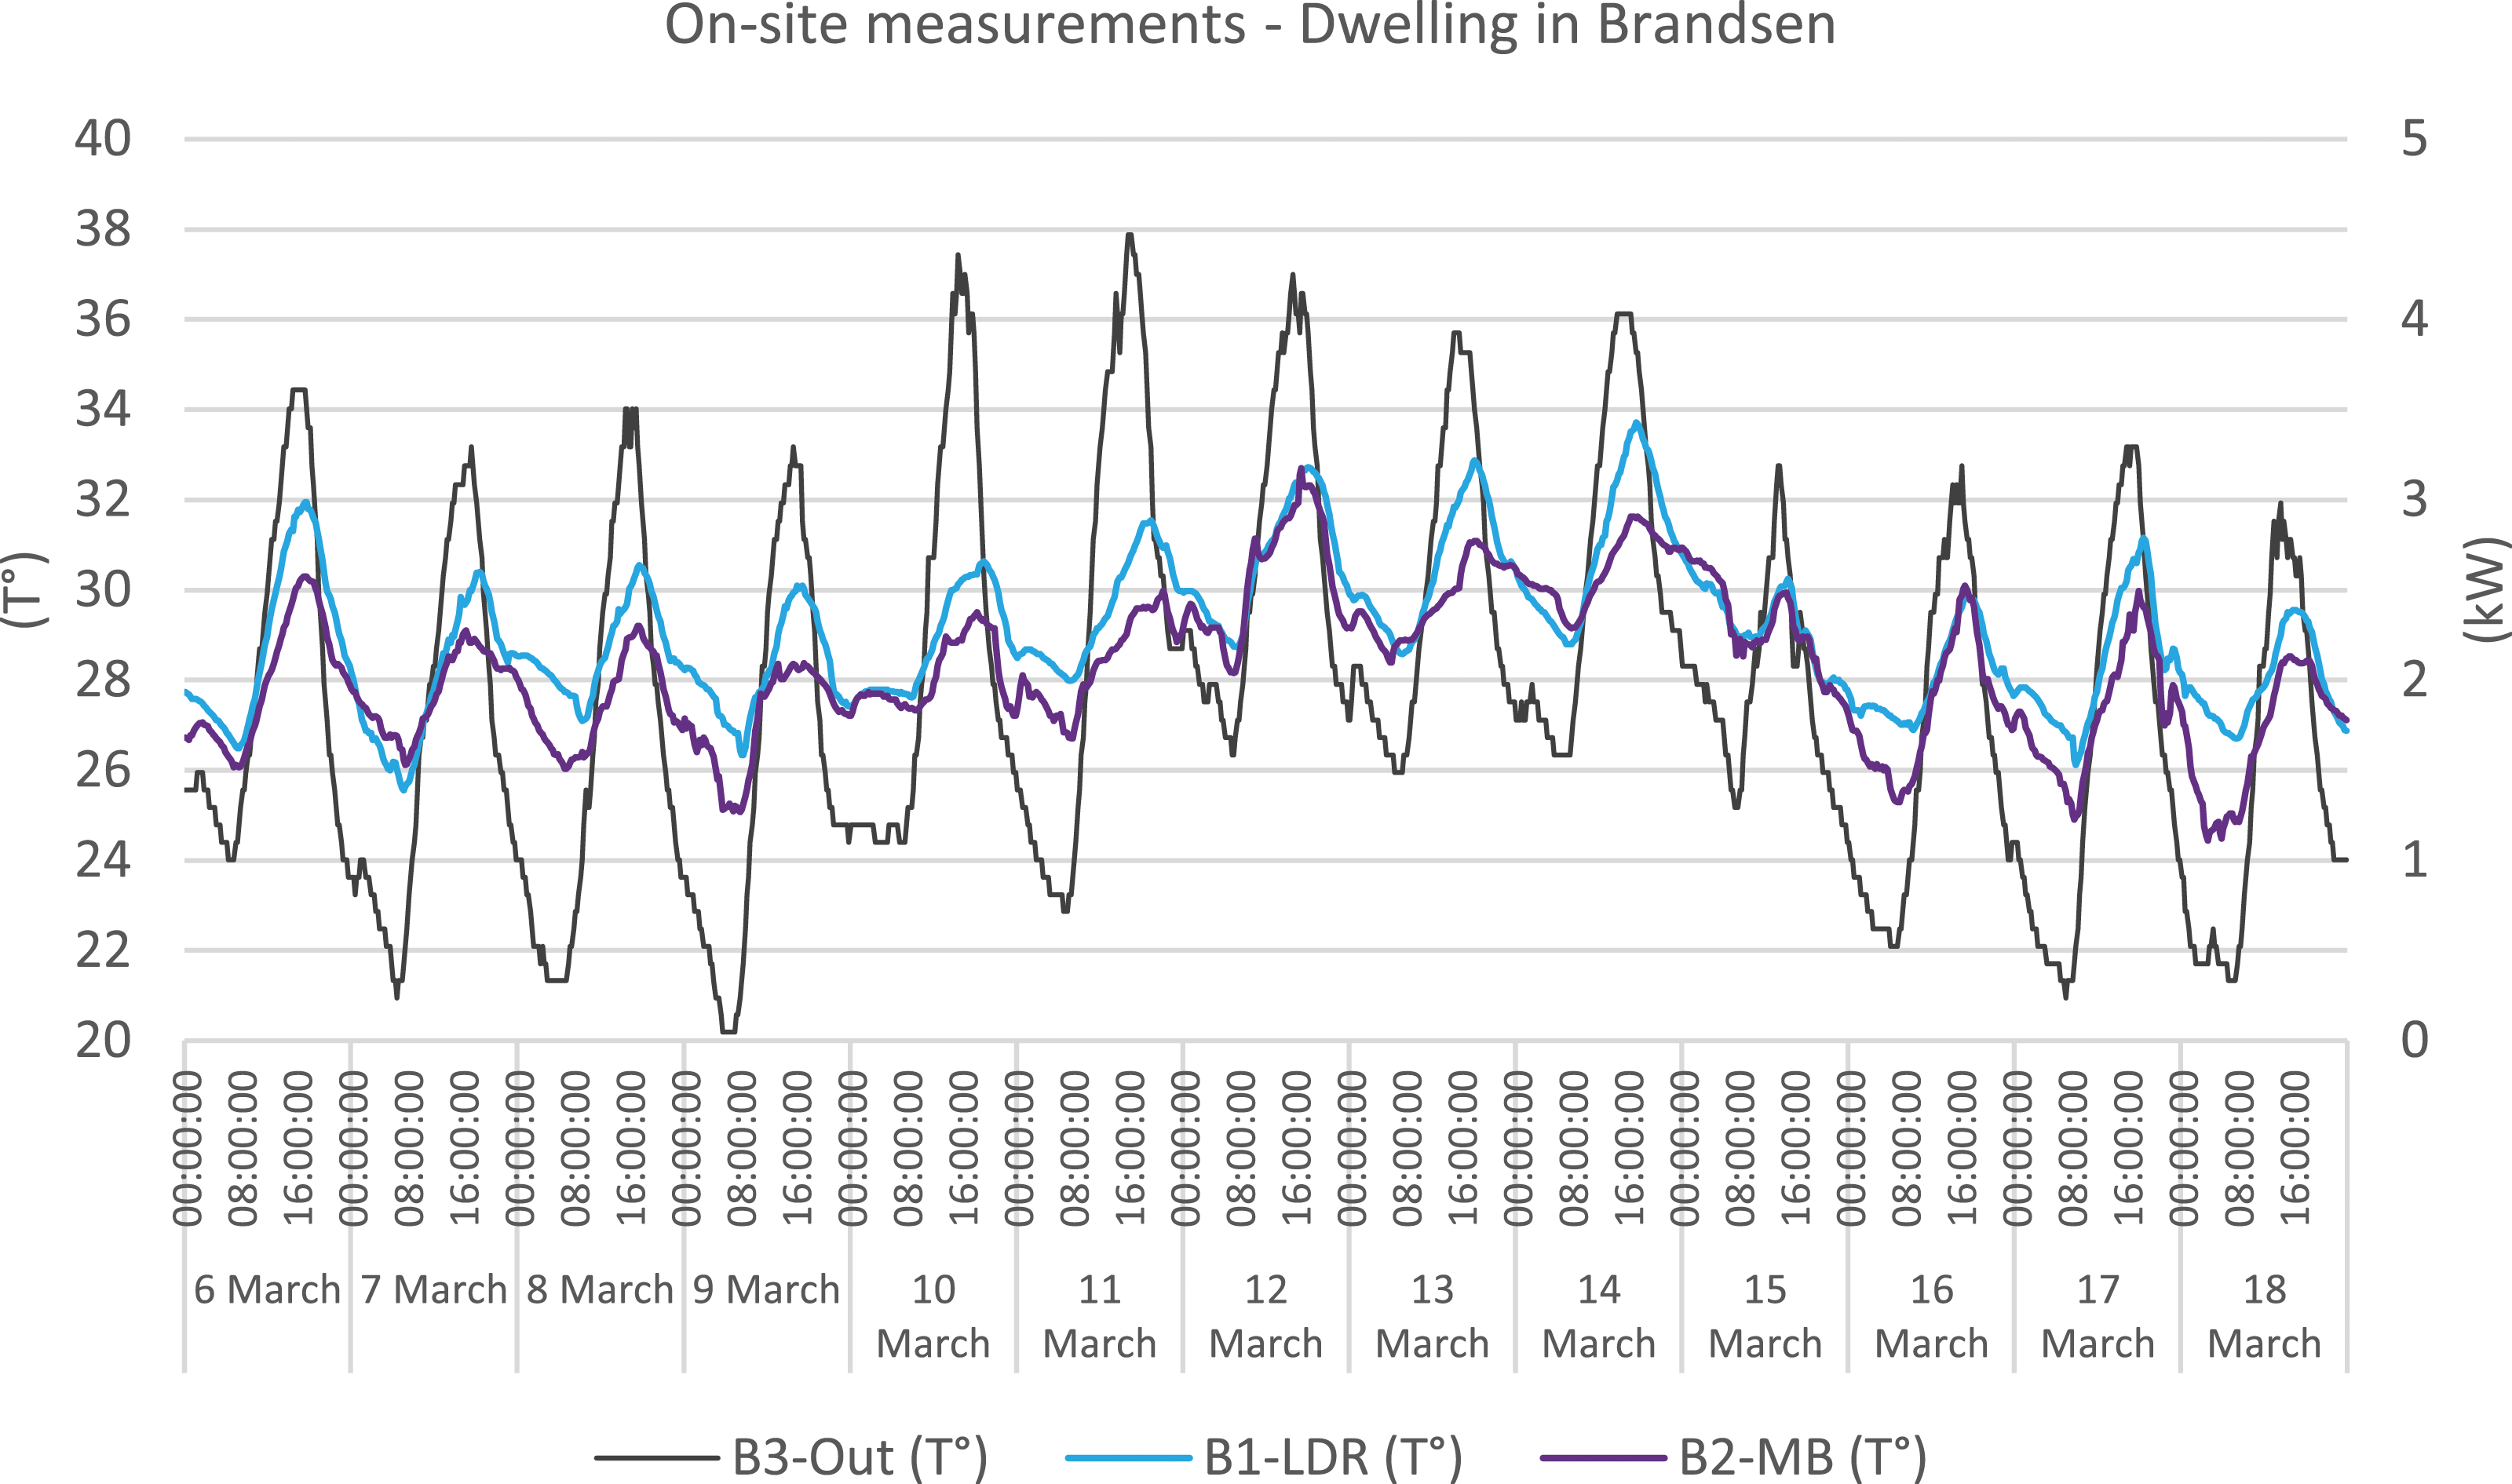
From Figures 2 and 3, a disparate in the thermal amplitude of both sites was identified. The outdoor measurements in the La Plata dwelling show smaller oscillations due to the surrounding urban condition, as opposed to the rural environment of the Brandsen dwelling. Despite this, the average outdoor T° was similar in both cases (28.00°C and 27.81°C, respectively). However, the difference in thermal oscillations due to the heat accumulation in built massive elements was verified by the standard deviations (3.35°C and 4.13°C, respectively).
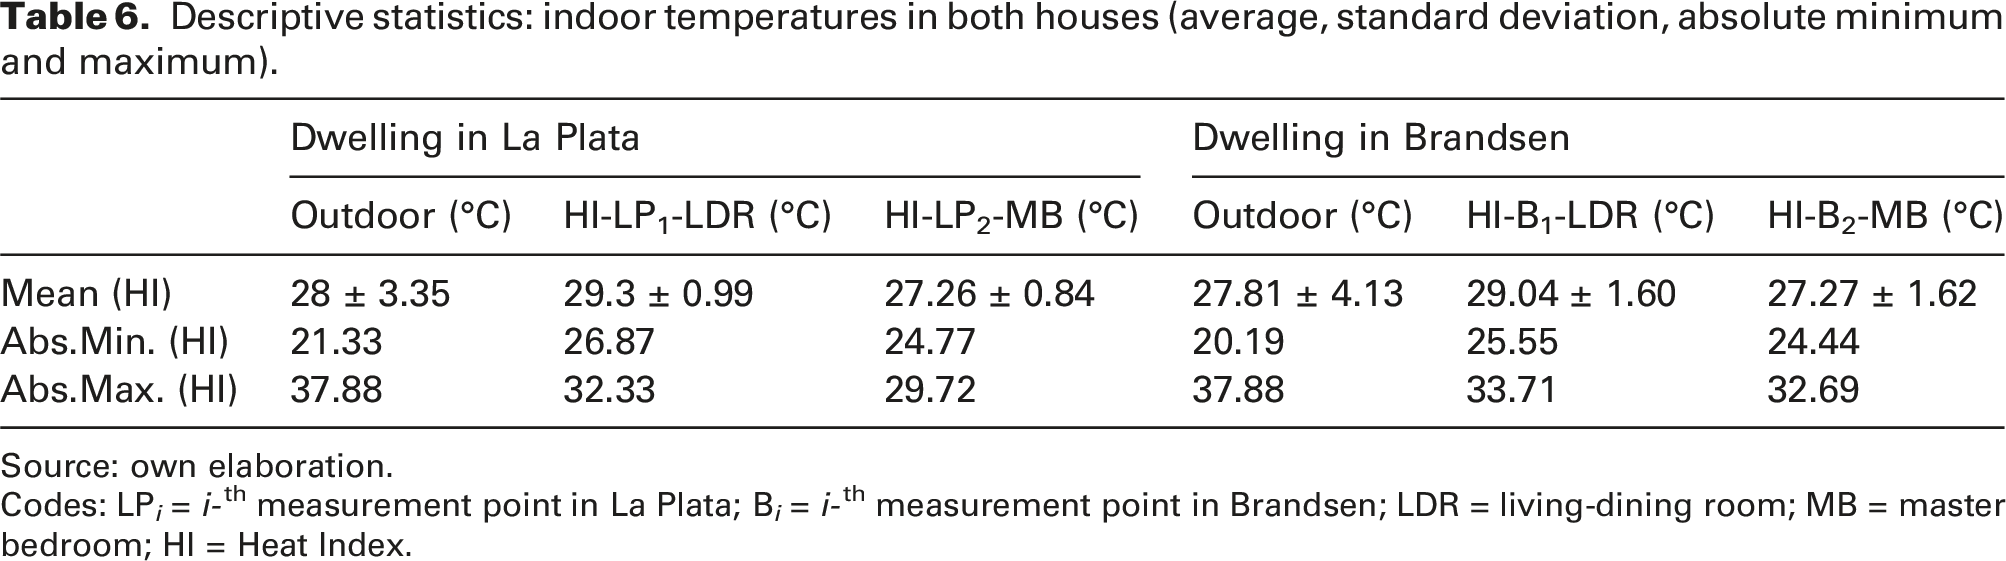
Descriptive statistics: indoor temperatures in both houses (average, standard deviation, absolute minimum and maximum).
Source: own elaboration.
Codes: LP i = i-th measurement point in La Plata; B i = i-th measurement point in Brandsen; LDR = living-dining room; MB = master bedroom; HI = Heat Index.
As shown in Figures 2 and 3 and Table 6, indoor minimum temperatures were higher than outdoor minimum temperatures, which highlight the possibilities and the relevance of night cooling that can be exploited by means of natural ventilation.
Heat index statistical analysis
As for the heat index, the results obtained for each dwelling are shown below (Figures 4 and 5). Evolution of the HI during the 13 measured days of the heat wave in La Plata’s dwelling. Source: own elaboration. Codes: HI = Heat Index; WS-IIPAC = weather station located at IIPAC institute; LP
i
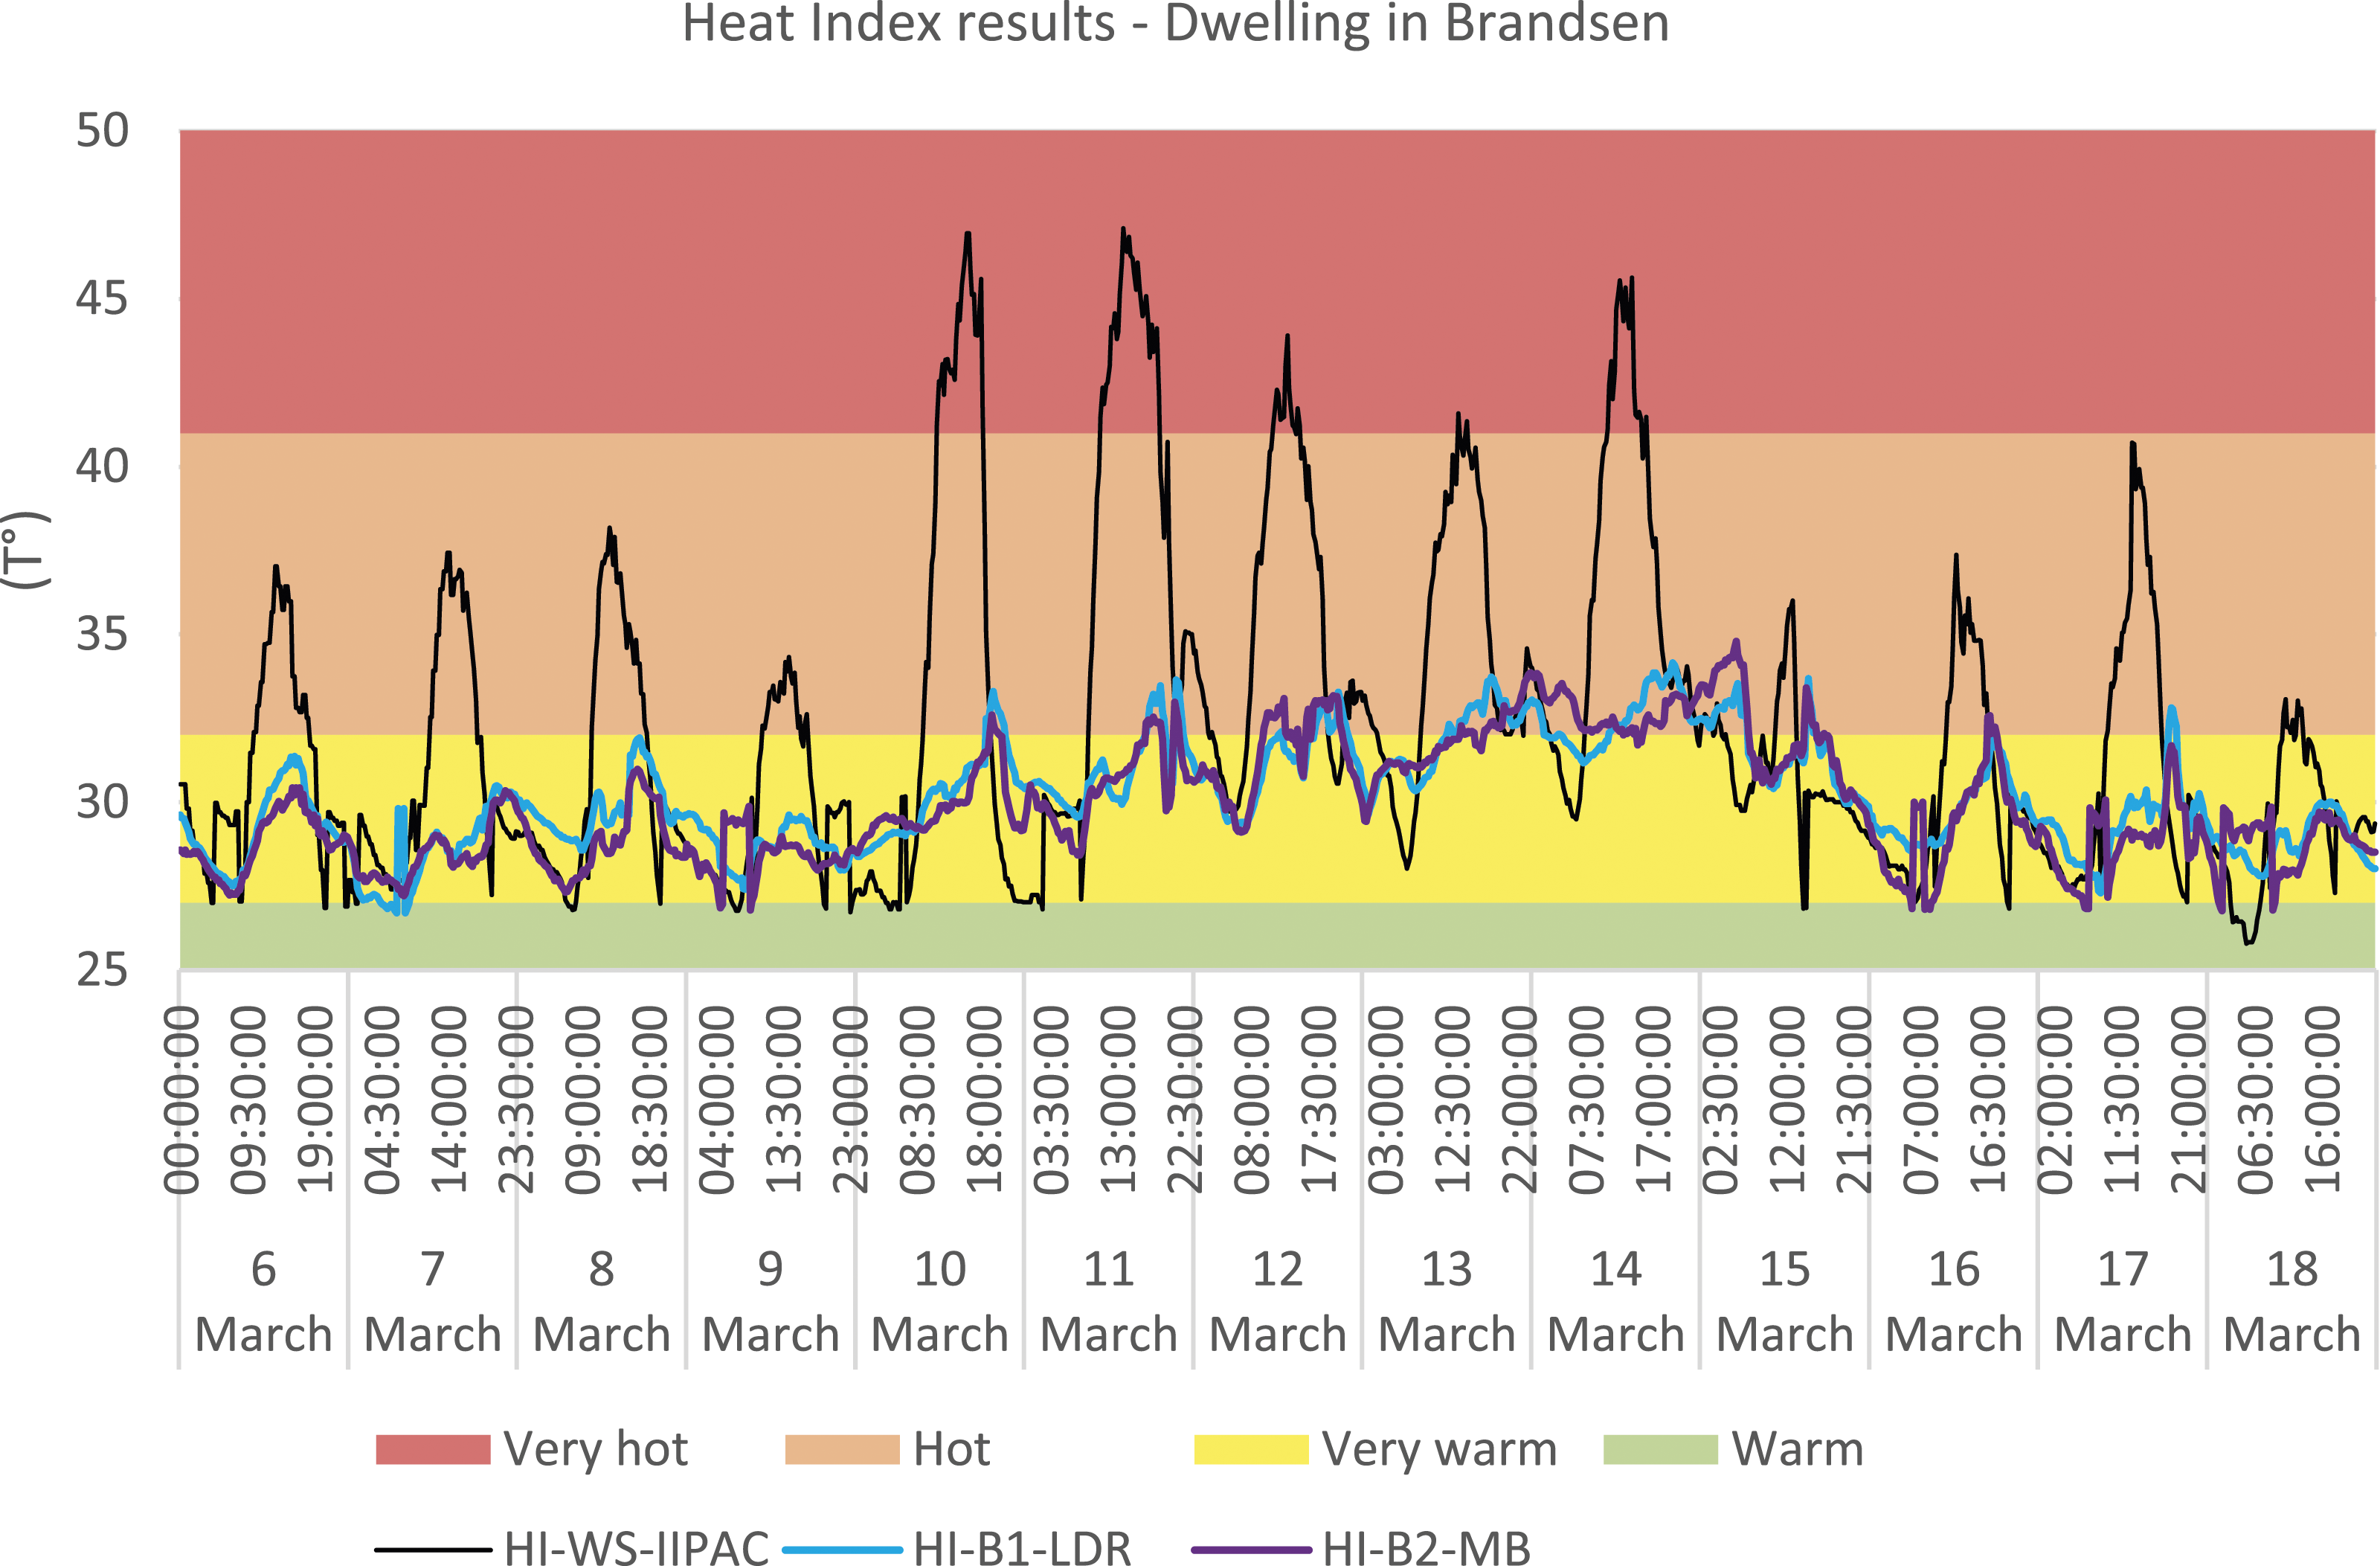
= i-th measurement point in La Plata; LDR = living-dining room; MB = master bedroom. Evolution of the HI during the 13 measured days of the heat wave in Brandsen’s dwelling. Source: own elaboration. Codes: HI = Heat Index; WS-IIPAC = weather station located at IIPAC institute; B
i
= i-th measurement point in Brandsen; LDR = living-dining room; MB = master bedroom.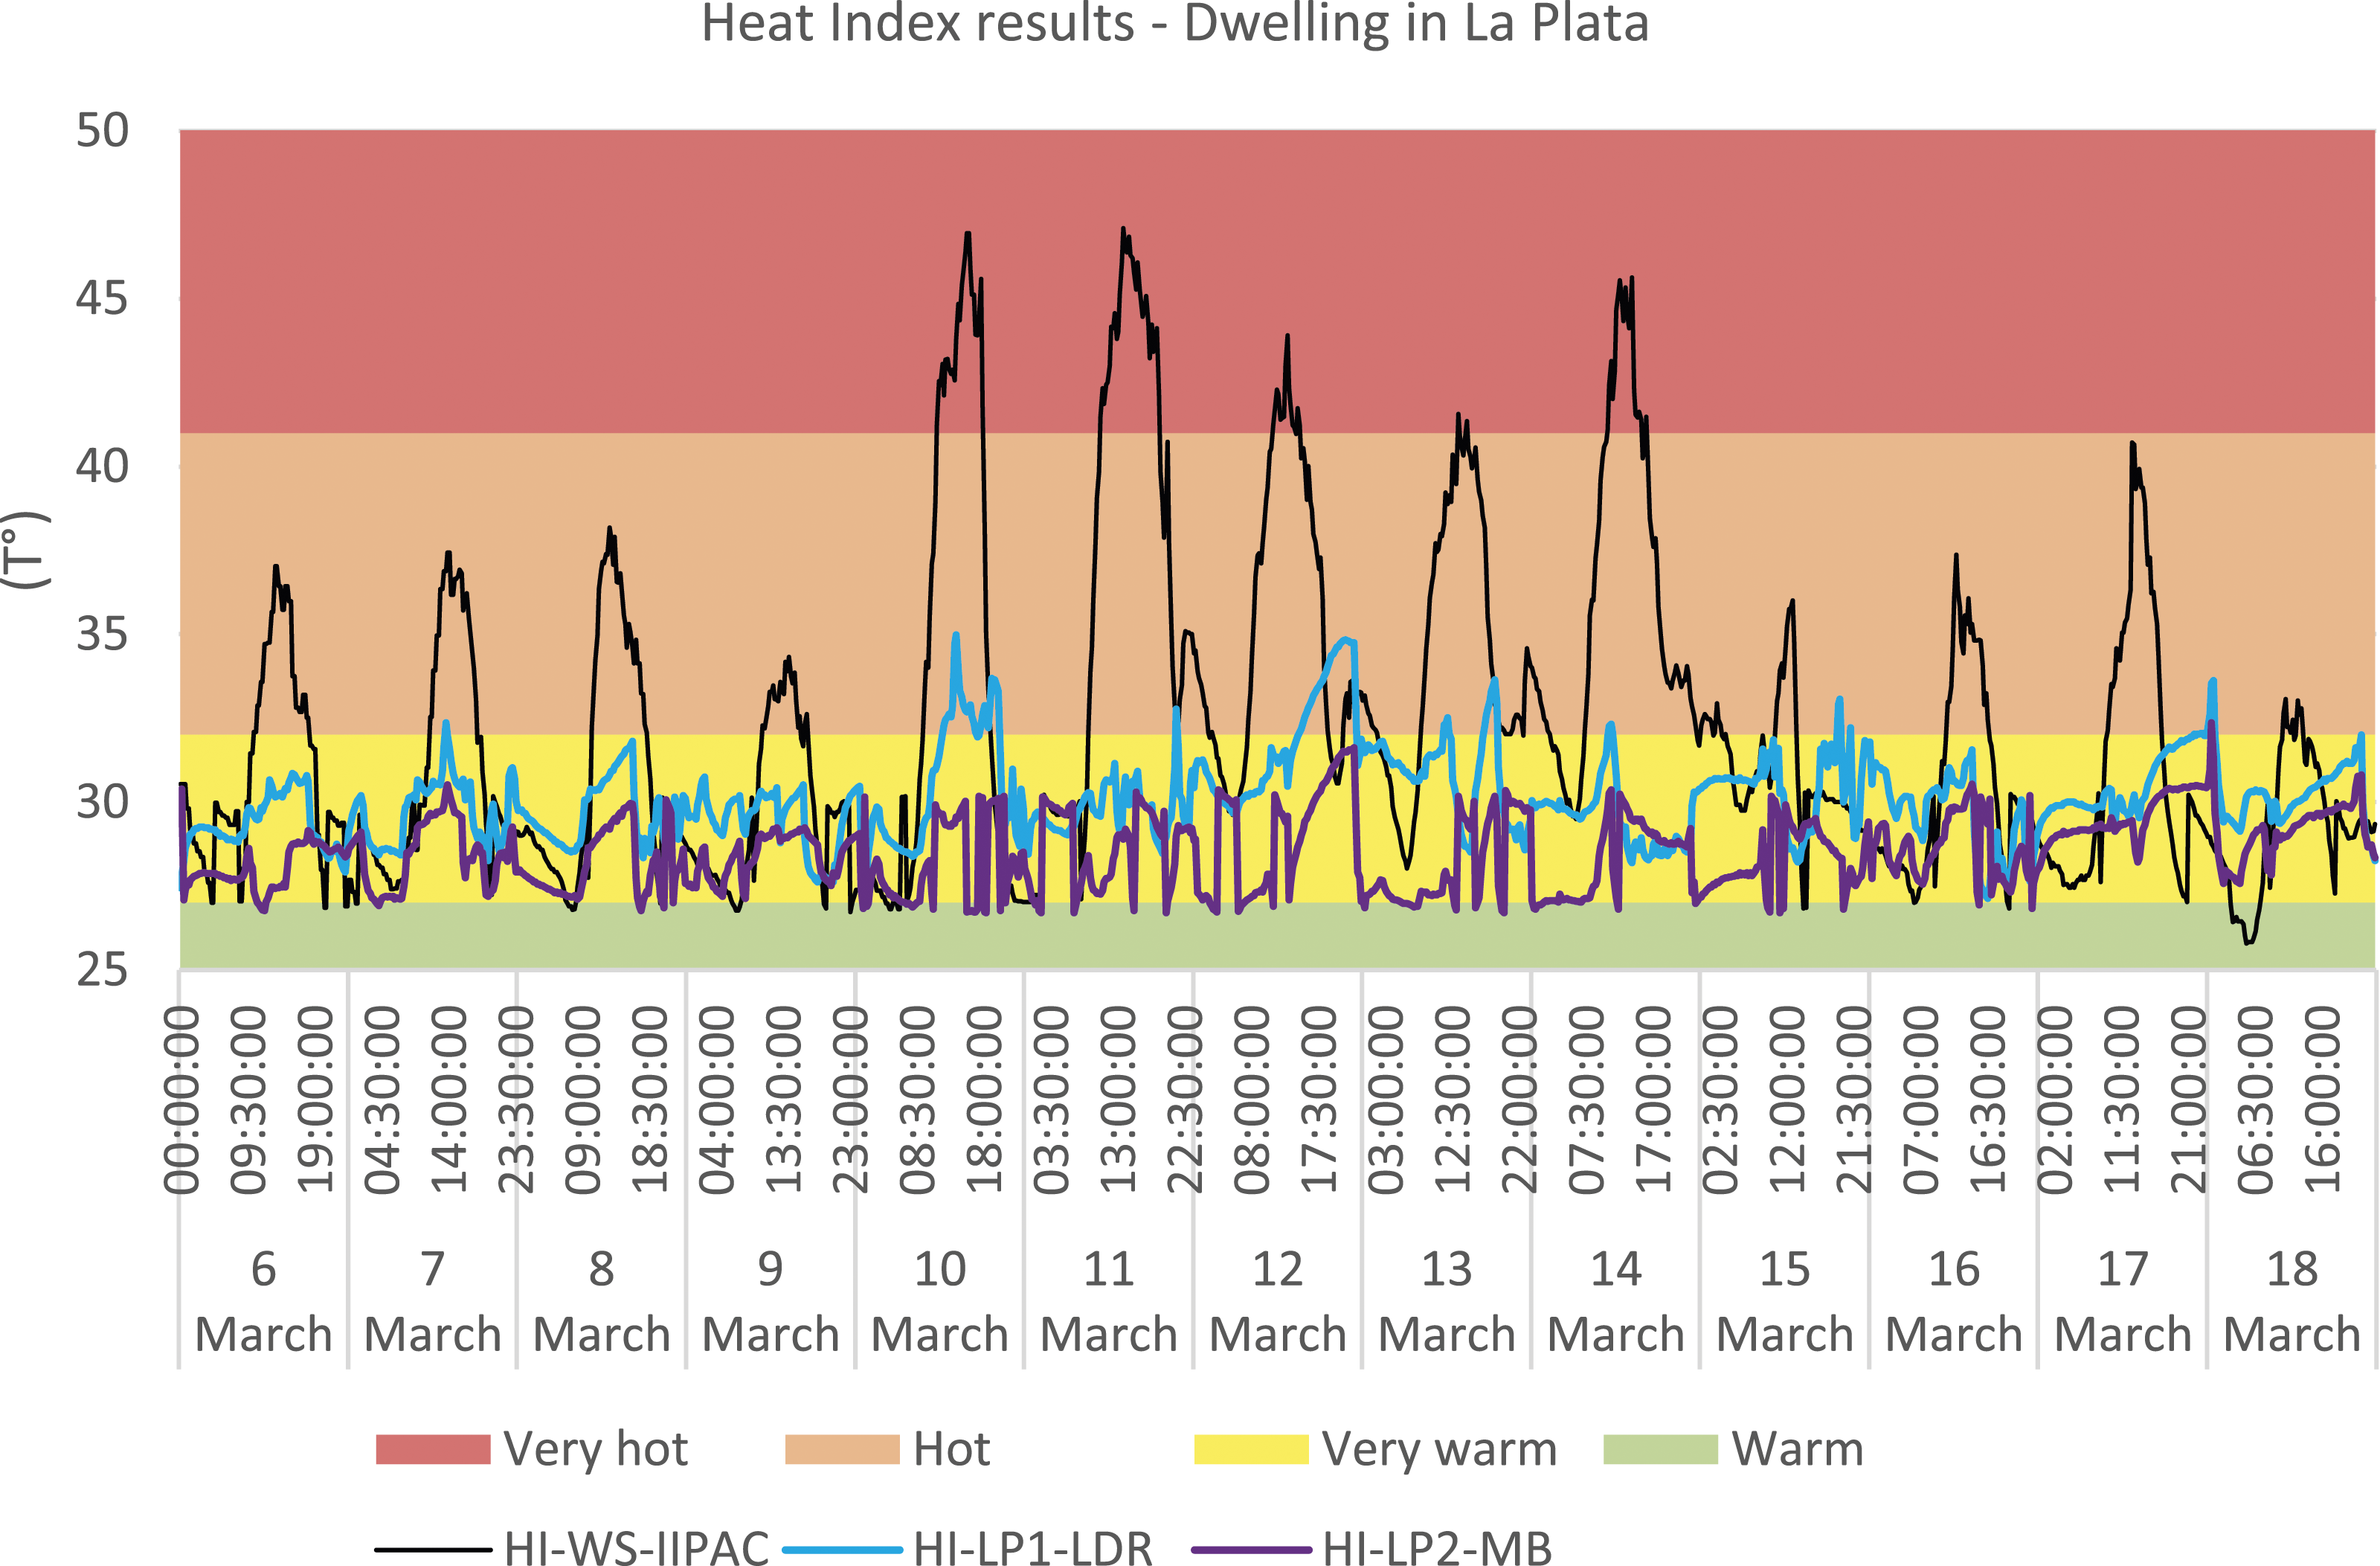
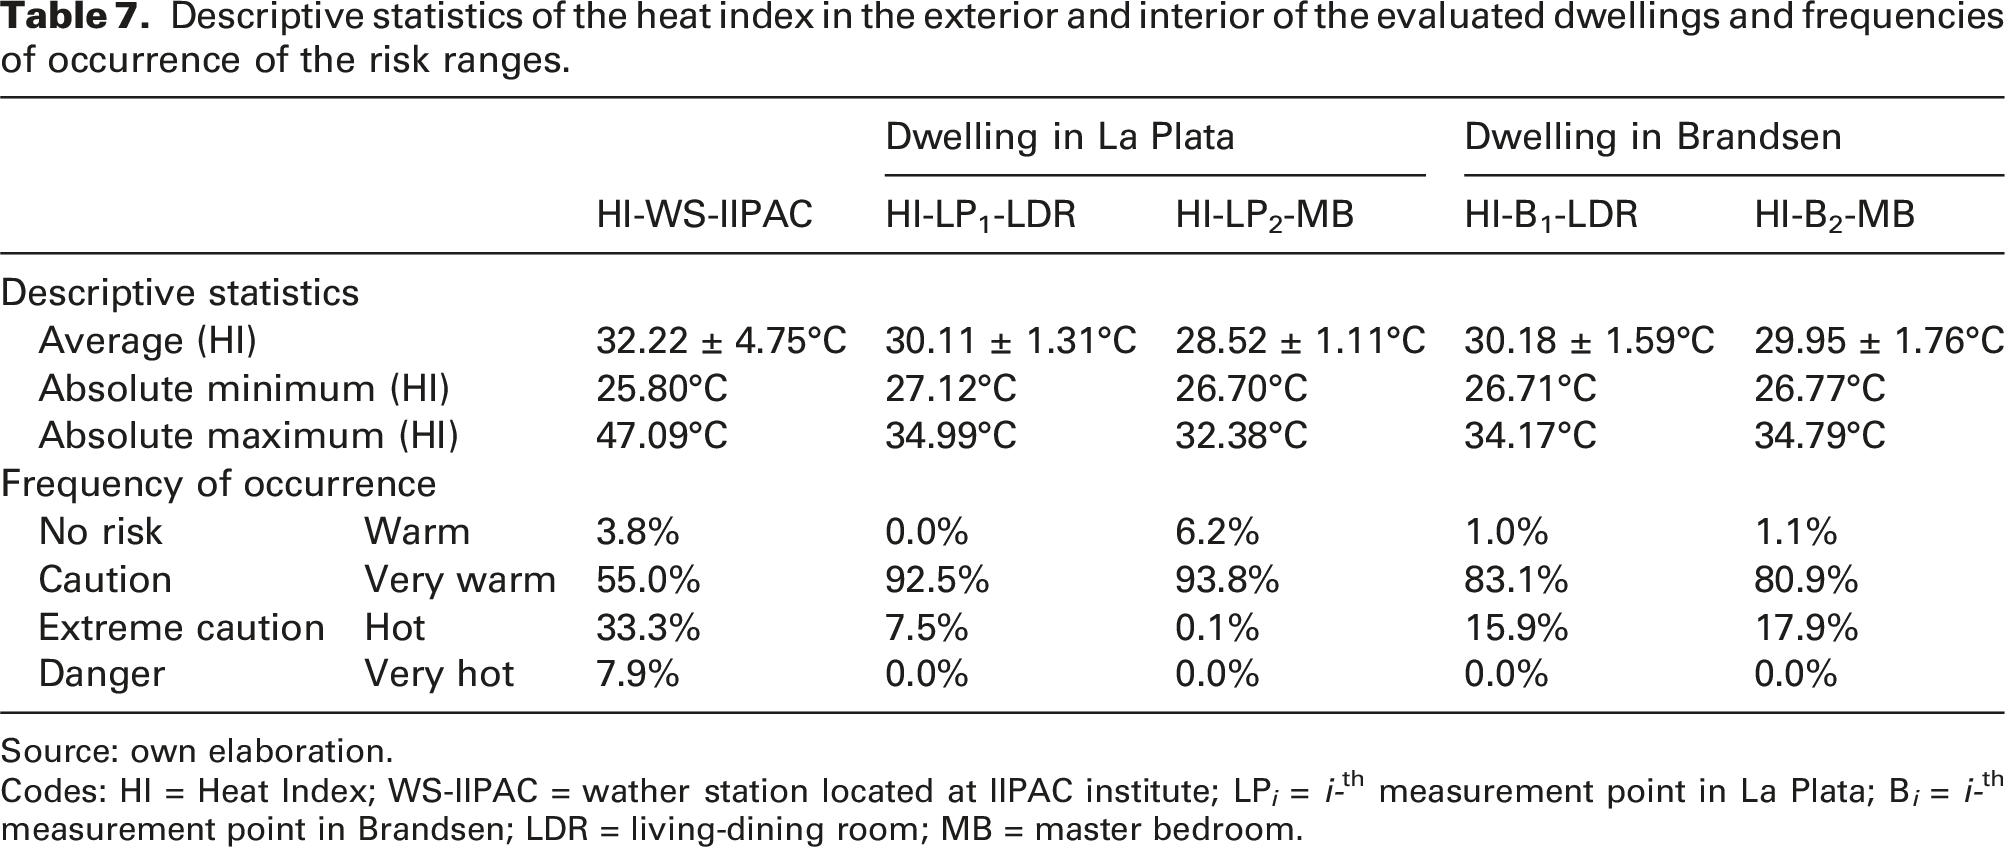
Descriptive statistics of the heat index in the exterior and interior of the evaluated dwellings and frequencies of occurrence of the risk ranges.
Source: own elaboration.
Codes: HI = Heat Index; WS-IIPAC = wather station located at IIPAC institute; LP i = i-th measurement point in La Plata; B i = i-th measurement point in Brandsen; LDR = living-dining room; MB = master bedroom.
From the analysis of the frequency of time intervals, the outdoor HI spent very little time in the ‘No risk’ range (3.8%) and was mostly in the ‘Caution’ range (55% of the time), followed by the ‘Extreme caution’ range (33% of the time). On the other hand, the ‘Danger’ range was reached 7.9% of the time.
Observing the HI in the interior spaces, the La Plata dwelling reached the situation of ‘No risk’ for a short time (0% -LDR- and 6.2% -MB-); it remained in most of the time in a ‘Caution’ situation (92.5% -LDR- and 93.8% -MB-); while the situation of ‘Extreme caution’ was identified in 7.5% of the time in LDR and 0.01% in the MB. The ‘Danger’ condition was not reached at any time.
In the case of Brandsen dwelling, the situation of ‘No risk’ was identified marginally (1% -LDR- and 1.1% -MB-). In most of the time it was positioned in the ‘Caution’ condition (83.1% -LDR- and 80.9% -MB-), while the ‘Extreme caution’ condition was identified in 15.9% -LDR- and 17.9% -MB-. In this case, ‘Danger’ condition was not reached either.
In general terms, the mean values were similar. However, the house in Brandsen, which has just a fan, was approximately 15% of the time in the ‘Extreme caution’ condition, which was significantly lower in the house in La Plata (0.1%–7.5%) because it has an air conditioning system that allows immediate reduction of temperature peaks.
Energy consumption and cost
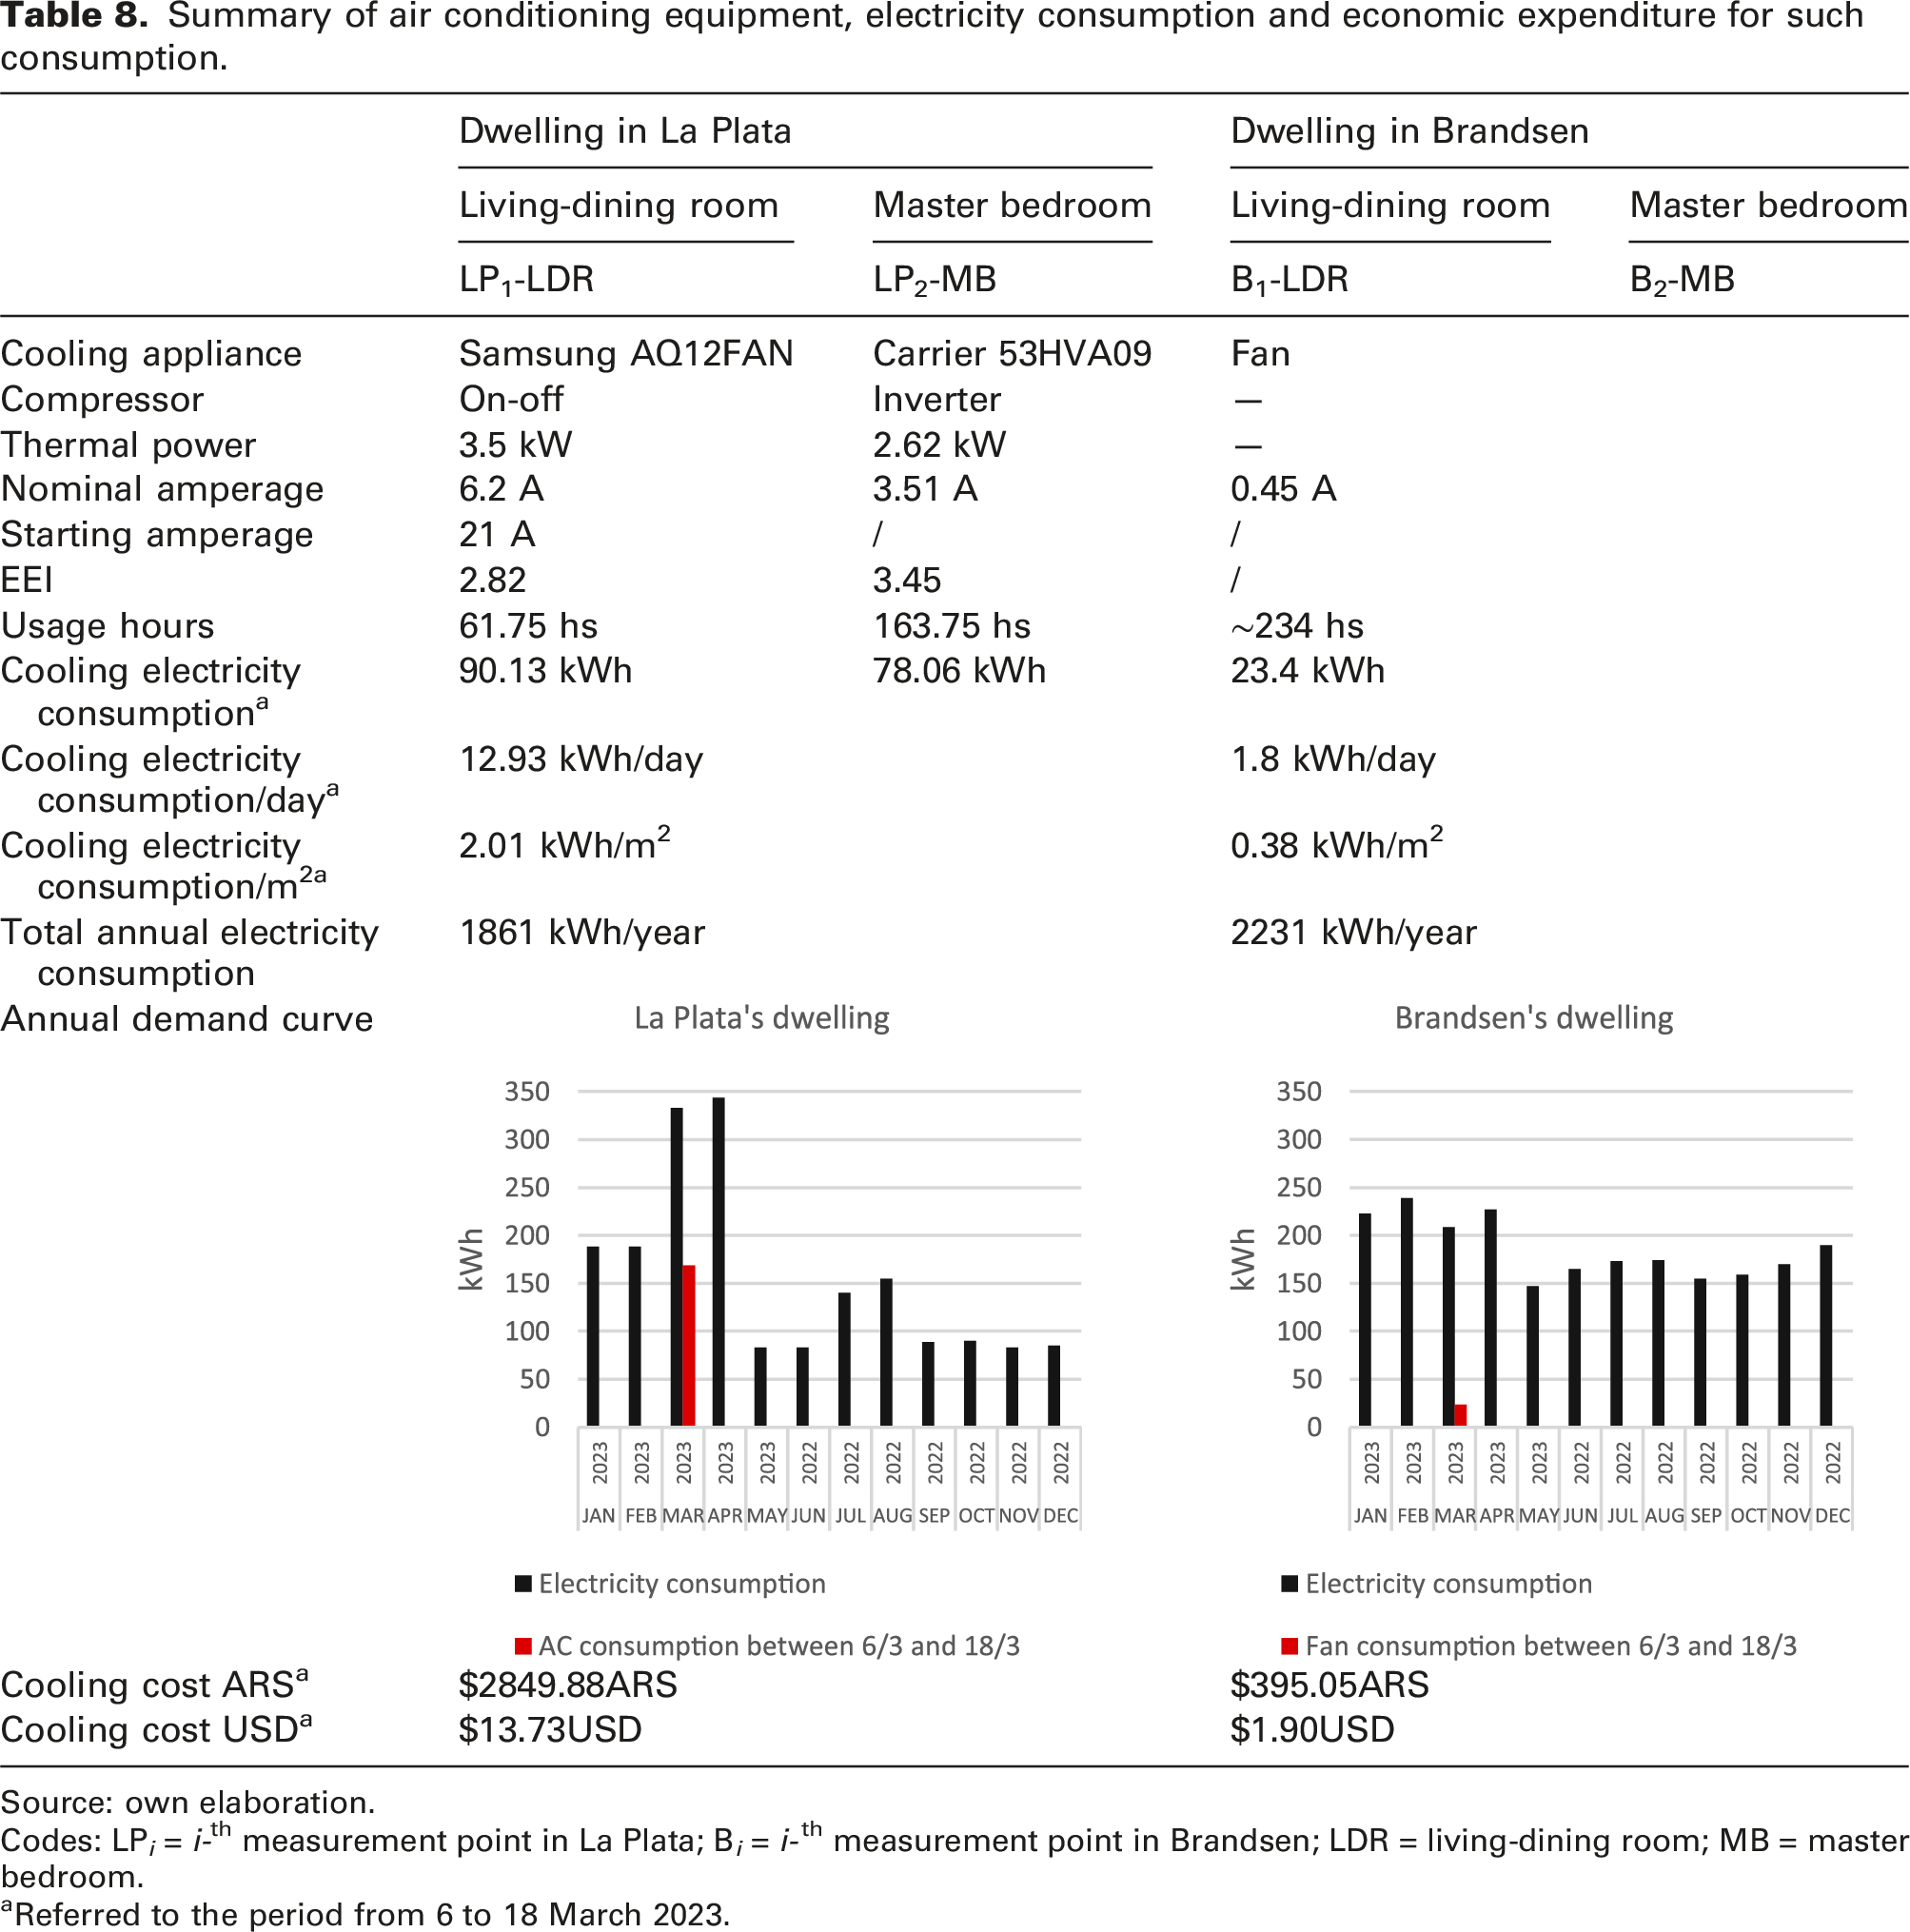
Summary of air conditioning equipment, electricity consumption and economic expenditure for such consumption.
Source: own elaboration.
Codes: LP i = i-th measurement point in La Plata; B i = i-th measurement point in Brandsen; LDR = living-dining room; MB = master bedroom.
aReferred to the period from 6 to 18 March 2023.
Evaluation of heat wave adaptation strategies
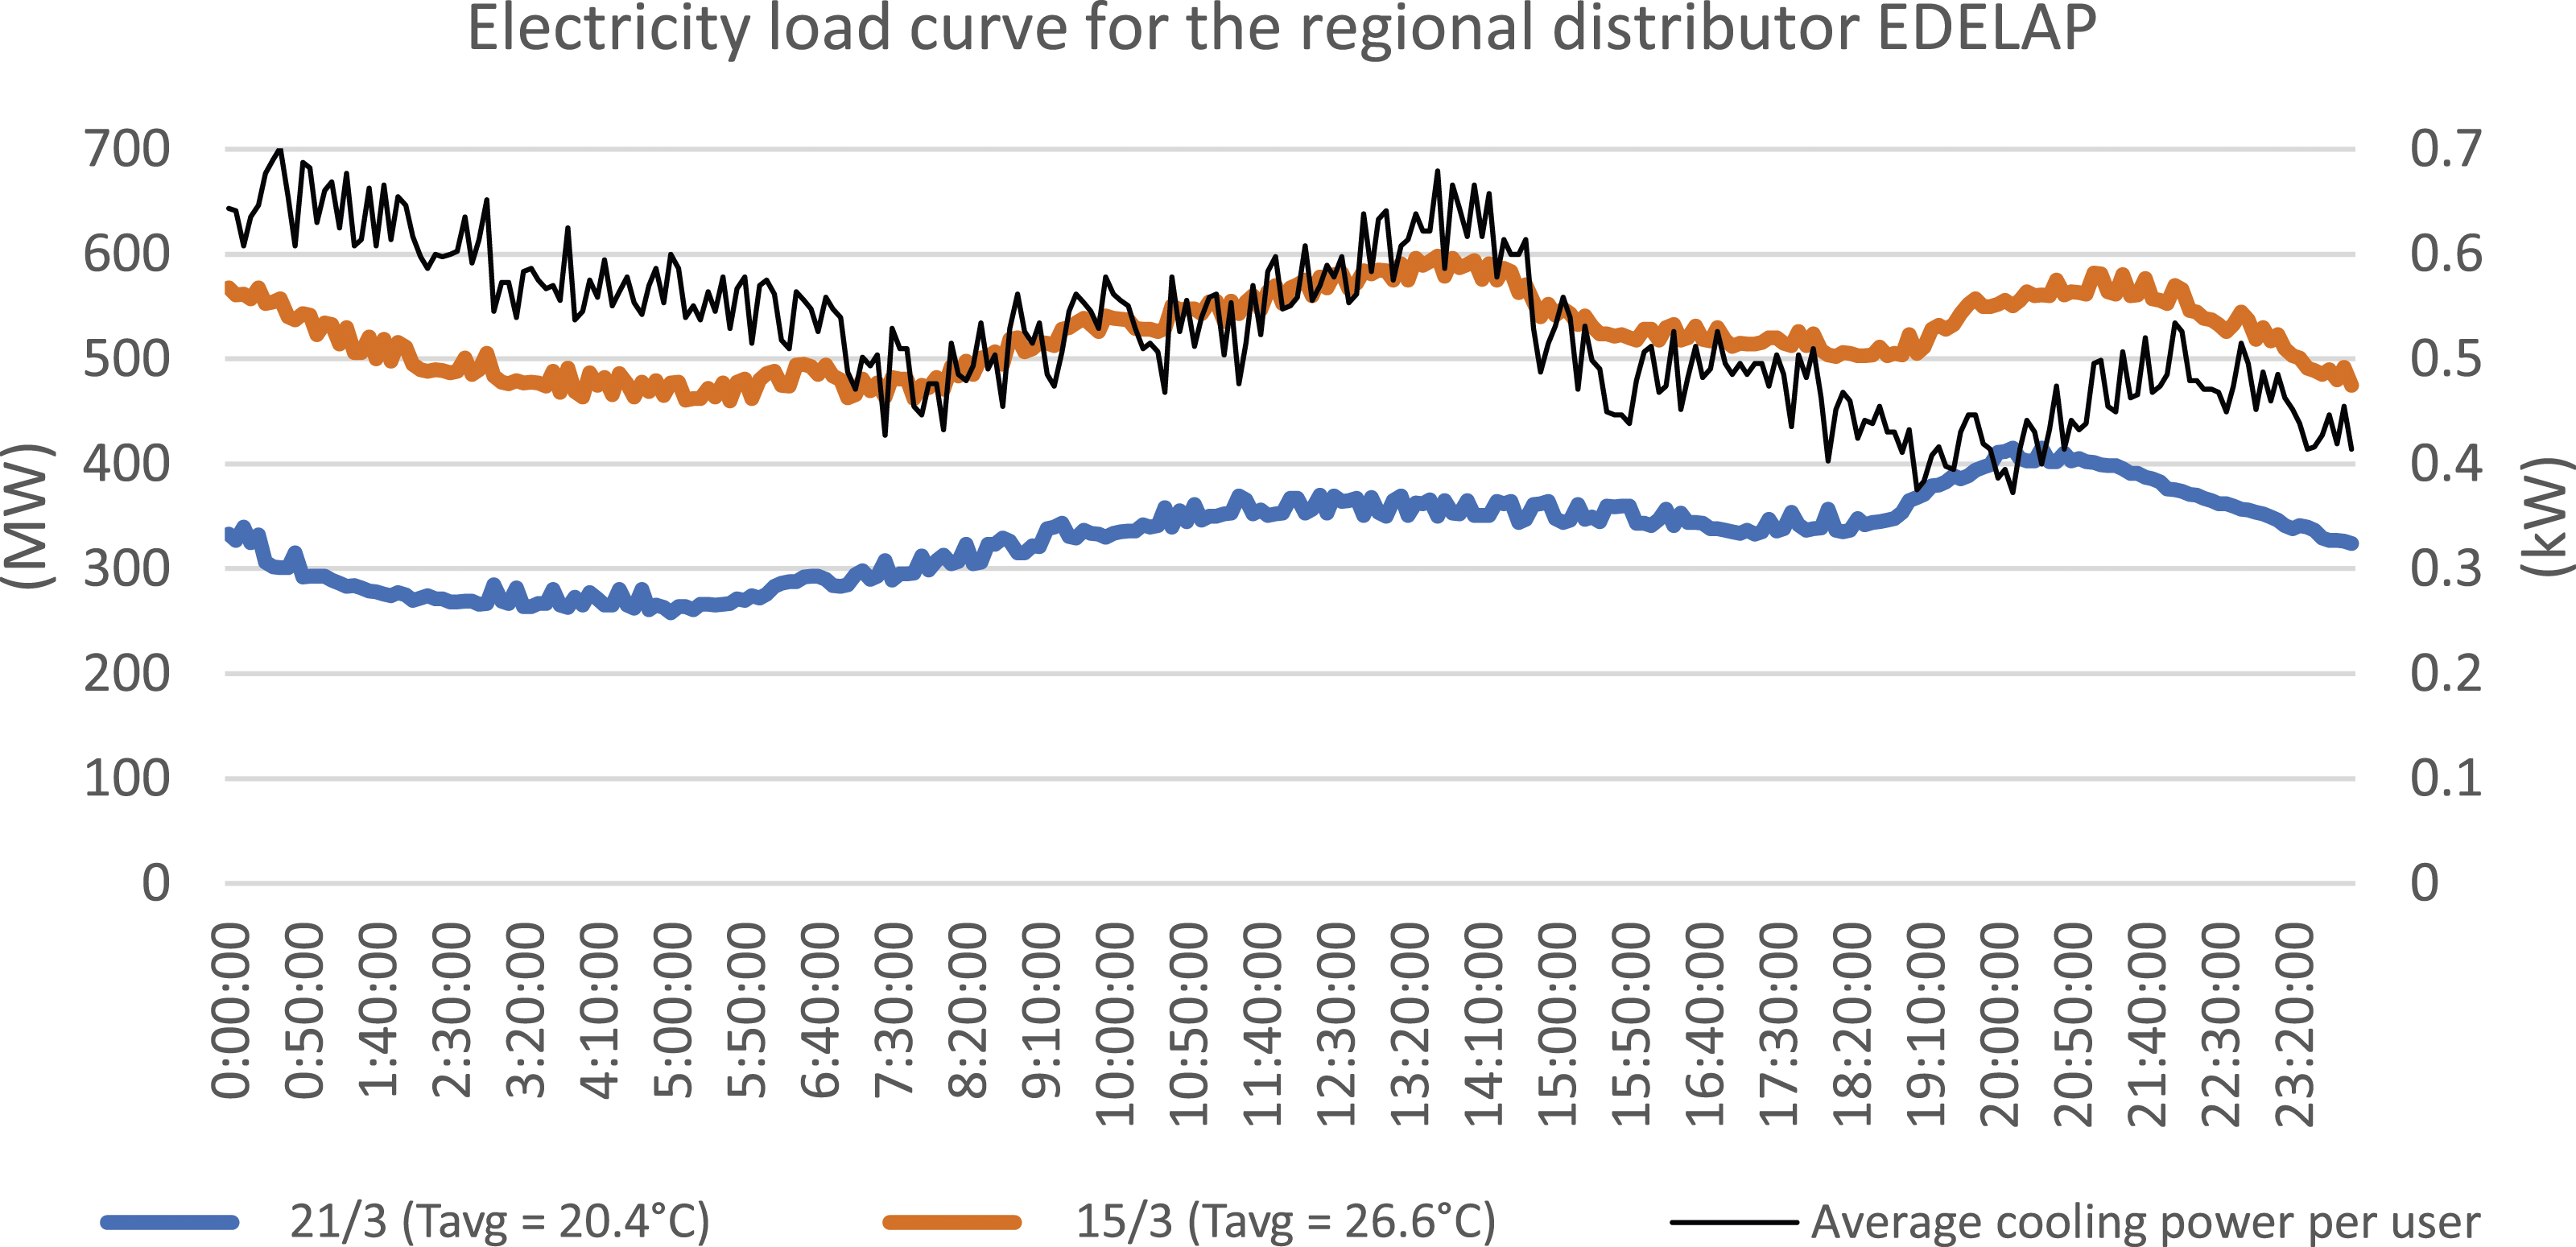
This section presents the testing of a heat wave adaptation strategy for each case study, considering its impact on power grids. As a reference, Figure 6 shows the net demand of a day belonging to the heat wave studied (15 March with an average of 26.6°C) and a day of the following week (21 March with an average of 20.4°C) for the local distribution company that serves La Plata, Berisso, Ensenada, Magdalena, Punta Indio and Brandsen. The electricity demand of the heat wave’s day was 58% higher (12.6 GWh vs. 7.96 GWh), and a peak power of about 598 MW was recorded (70% higher than a day with warm temperature which was 350 MW). The difference between the curves for 15 March minus 21 March was used to estimate the power of the refrigeration equipment in the region. This power was divided by the 365,000 users of the distribution company to obtain reference values for cooling consumption per user. The maximum demand per user was 0.7 kW in the late evening and early afternoon, while valleys close to 0.4 kW at 7:00 and 20:00 hs were identified. The power demand per user for cooling reached an hourly average of 0.52 kW and the daily average electricity consumption for cooling was about 12.71 kWh/day during the heat wave (note that the dwelling of La Plata resulted in 12.93 kWh/day for cooling during the heat wave – see Table 8). Load curves for the region’s distribution company on a heat wave day (15 March with an average temperature of 26.6°C) and a day with a warm temperature (21 March with an average temperature of 20.4°C). Source: own elaboration based on Cammesa.
8
Once the impact of the cooling systems on the daily electricity demand at the local distribution company had been reviewed, two adaptation strategies were evaluated for the study cases.
Dwelling in La Plata
Figure 7 analyzes the incorporation of a 1.2 kWp photovoltaic system (PV) for the La Plata dwelling. It displays the electrical demand curve of the sum of the two air conditioners (blue) and the electrical generation curve of the solar generation system (red). With the insertion of the PV system, approximately 85.43 kWh of the 168.19 kWh demanded by the cooling systems during the measured period was generated. Of these 85.43 kWh, 41.5% would directly cover the energy demanded by cooling appliances, while the remaining 58.5% would be used for other purposes or injected into the grid due to the mismatch between supply and demand. Moreover, the system could generate about 2105 kWh in the year, representing 115% of the total yearly electricity consumption of the house, making it a system compatible with the dwelling. Electricity demand curves for cooling and generation of the PV system in the La Plata house. Source: own elaboration.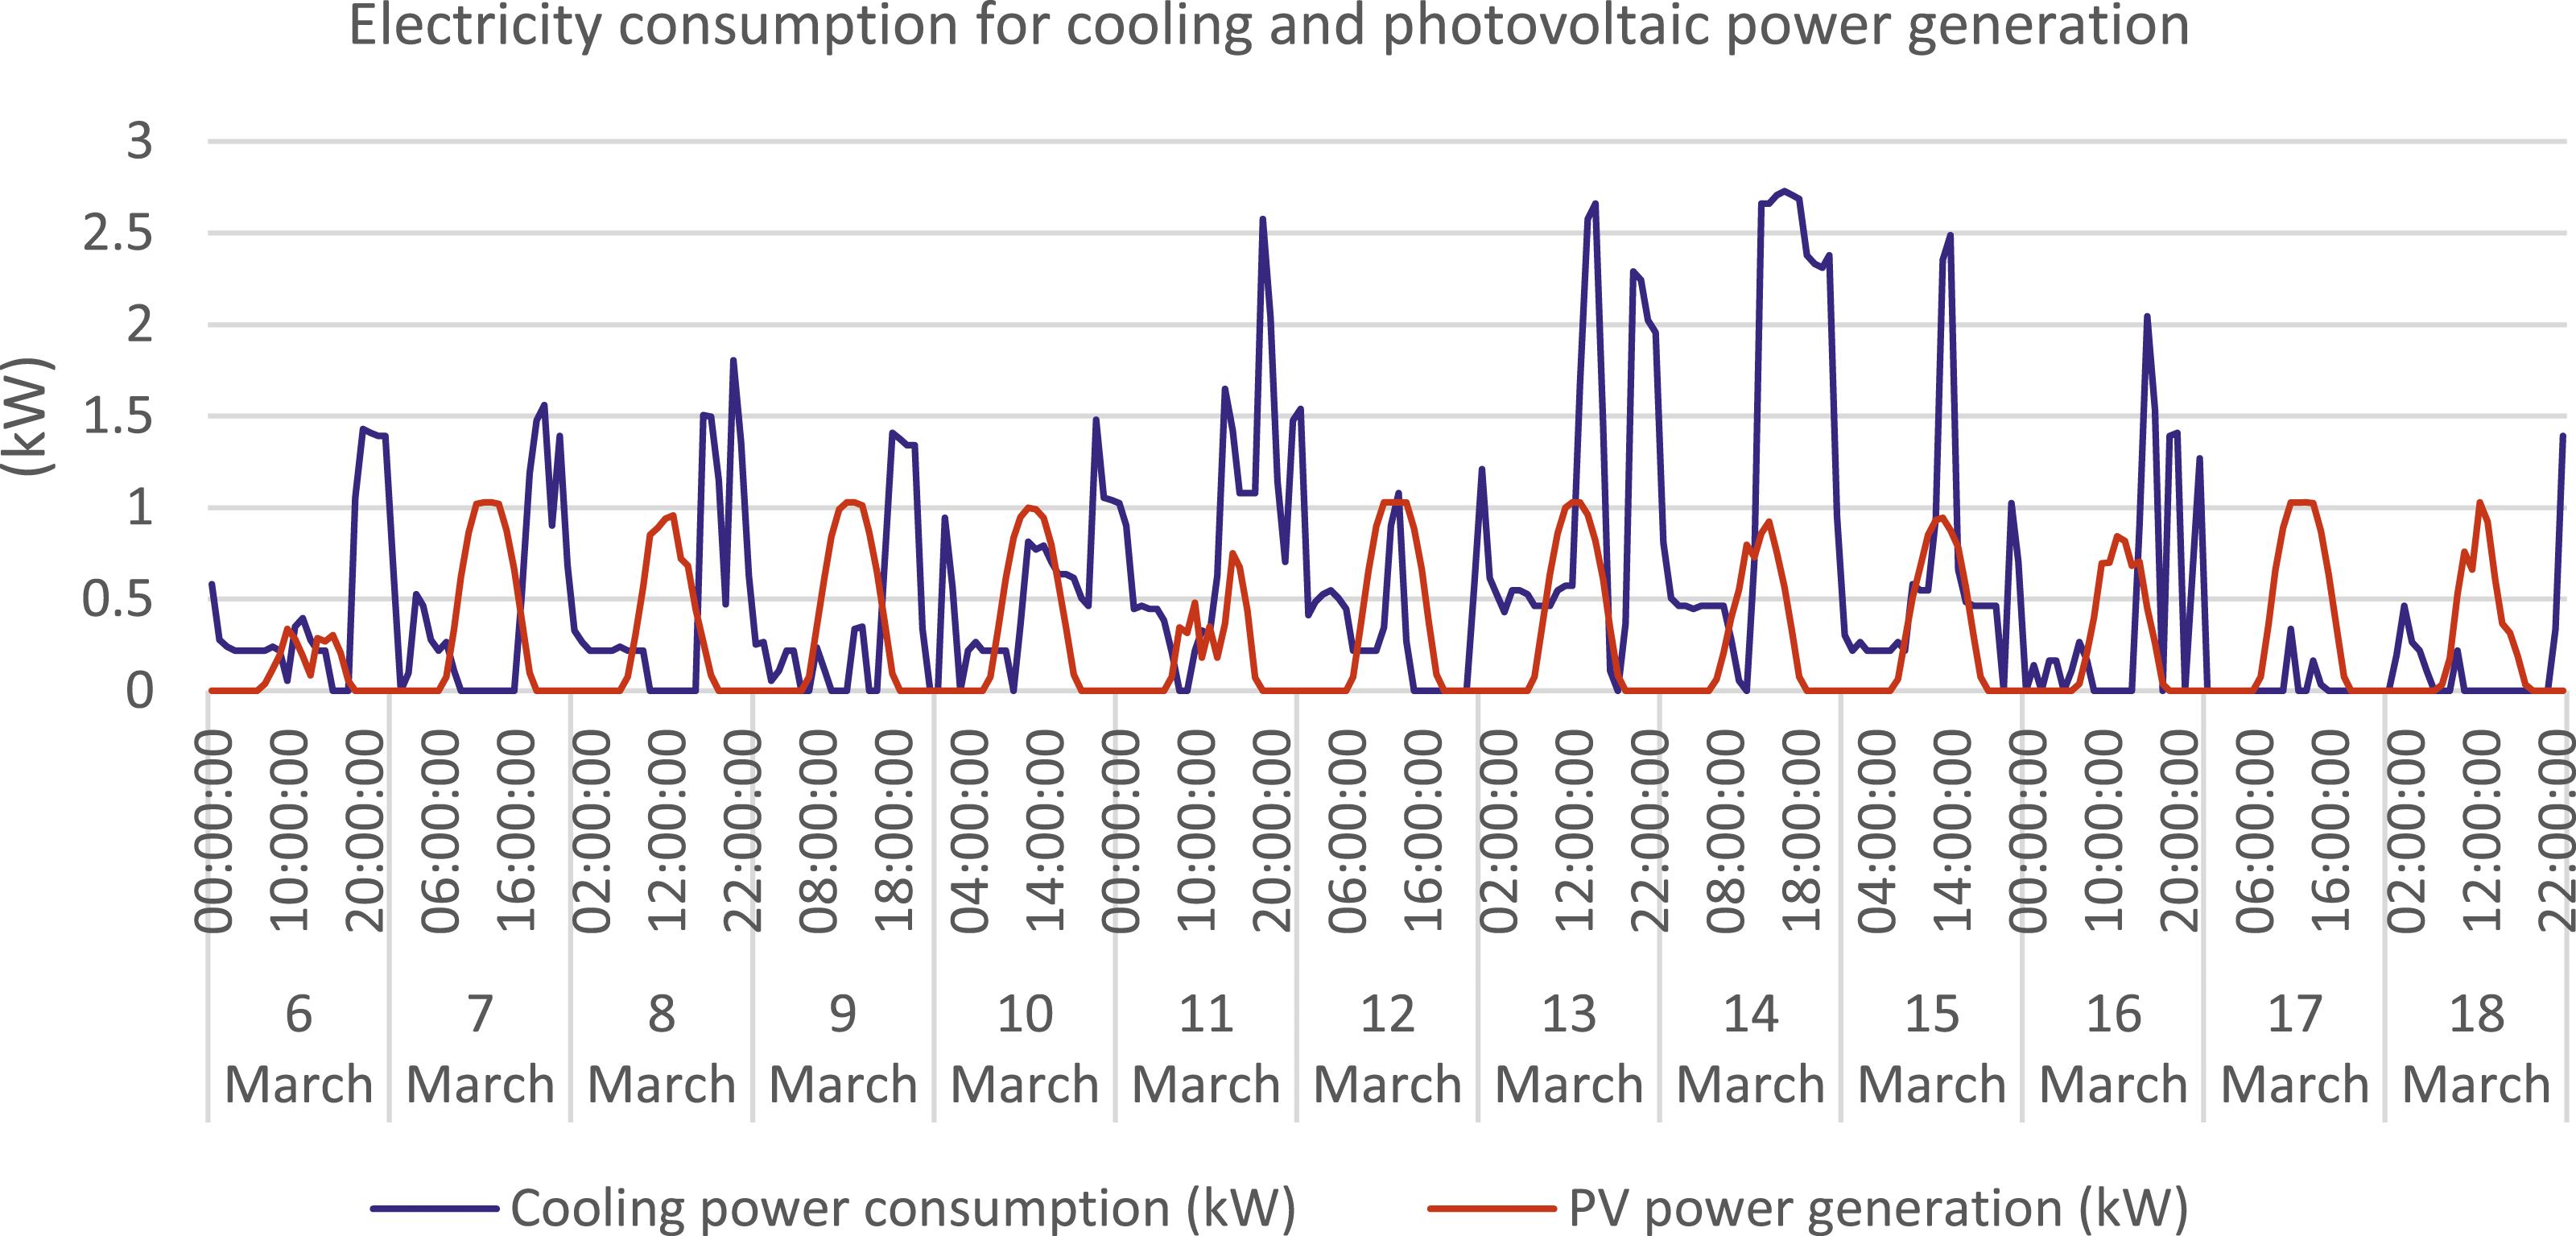
During the studied period, complete coverage of the cooling demand by PV generation was achieved only during the afternoons of days 6/3, 10/3, 12/3 and 17/3 (Figure 7). In contrast, during the remaining afternoons and in the night peaks, the demand could not be met by the PV system alone. Additionally, surplus energy was identified during the mornings and early noon hours, which could be injected into the grid to supply nearby users.
Figure 8 (left) shows the behaviour of electricity demand curve for cooling during an average day of the heat wave and its interaction with PV generation (1.2 kWp). It depicts the maximum demand peaks occurred during the night (between 19:00 and 23:00 hs) and during the afternoon (between 13:00 and 18:00 hs). During this second interval, there was a significant contribution of solar PV energy, covering the peak demand until approximately 16:00 hrs, after which PV production began to decline. Additionally, during the morning and until noon, there were energy surpluses that could be injected into the grid. Left: average curves of electricity demand for cooling and generation of the PV system in La Plata during the heat wave. Right: comparison between load curve with or without solar PV. Source: own elaboration.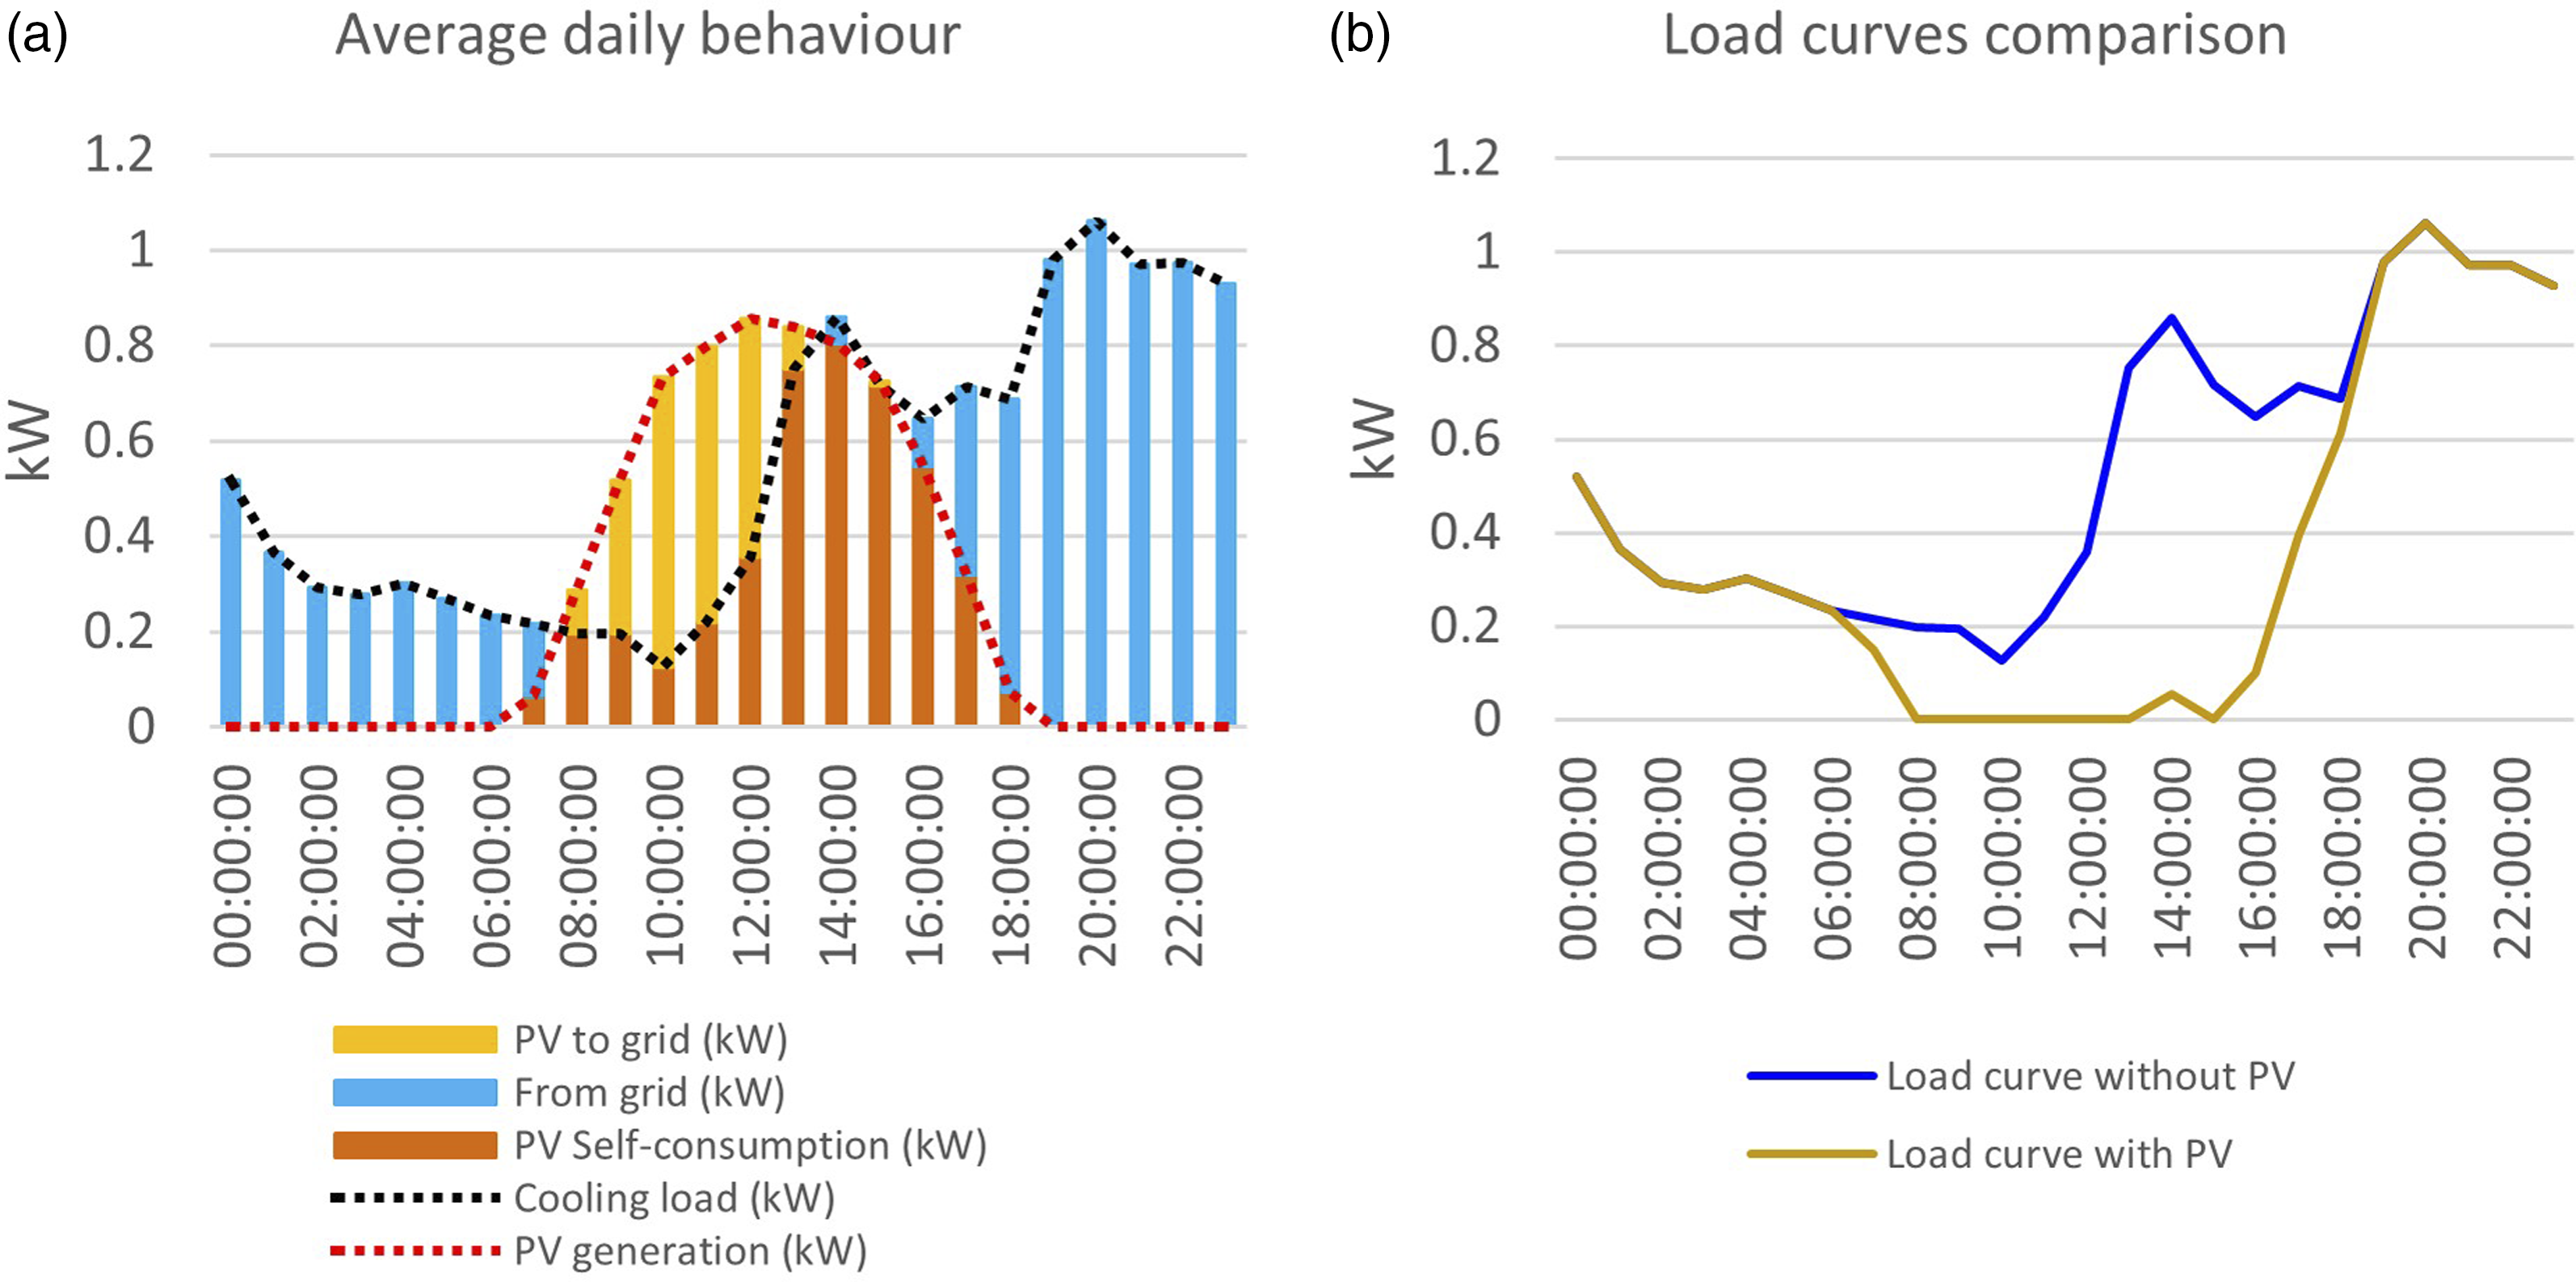
Figure 8 (right) compares the average power for cooling taken from the grid with and without the PV system. Noticeable differences in behaviour were observed between the two scenarios. Firstly, with the PV system, energy taken from the grid was virtually eliminated between 8:00 and 16:00 hrs. The afternoon peak began at around 16:00 hs instead of 13:00 hs. However, the system could not cover the evening peak.
In summary, the PV system could cover nearly half of the cooling demand in terms of net energy. It could also partially mitigate power peaks in the house, reducing the afternoon peak but unable to address the nighttime peak due to the mismatch between PV supply and cooling demand. Moreover, the injection of surplus energy into the grid during mornings and early afternoons could assist in meeting the demand of nearby users, thereby alleviating grid congestion, help maintain voltage and frequency and reducing losses during periods of surplus. To achieve this, distribution networks, traditionally hierarchical, unidirectional and capillary will need to evolve into systems with sufficient capacity, capable of operating bidirectionally and managing greater complexity (Pagani and Aiello 60 ). Indeed, they will have to be especially prepared for the circulation of distributed generation surpluses in the so-called ‘last mile’. Additionally, the widespread adoption of PV systems would directly contribute to the generation and transmission sectors, leading to savings in generation fuels (e.g. natural gas, diesel or fuel oil) and reducing the load on high-voltage transmission lines.
Dwelling in Brandsen
Brandsen house was modelled and simulated in SIMEDIF software. The simulated temperature curves for B1-LDR yielded an MAE of 1.3°C and an RMSE of 1.50°C, while B2-MB showed an MAE of 0.7°C and an RMSE of 0.83°C. In Figures 9 and 10, the measured and simulated temperature curves for the living-dining room (LDR) and the master bedroom (MB) are illustrated. In the LDR, the margin of error is more pronounced compared to the MB. The main disparities in LDR occur at night when the simulation indicates lower temperatures than the actual measurements. This points to a nighttime heat retention effect and slower dissipation rate, phenomena likely influenced by nighttime ventilation, a complex interplay of human behaviour, home security and indoor and outdoor activities, amongst other variables. Conversely, in the MB, discrepancies primarily manifest during afternoon temperature peaks, with the simulated model not achieving the highest values. This variance could be attributed to direct radiation factors. Comparison of measurement and simulation temperatures of living-dining room in Brandsen’s dwelling. Source: own elaboration. Codes: B
i
= i-th measurement point in Brandsen; LDR = living-dining room; SIM = simulated; MAE = mean average error. Comparison of measurement and simulation temperatures of master bedroom in Brandsen’s dwelling. Source: own elaboration. Codes: B
i
= i-th measurement point in Brandsen; MB = master bedroom; SIM = simulated; MAE = mean average error.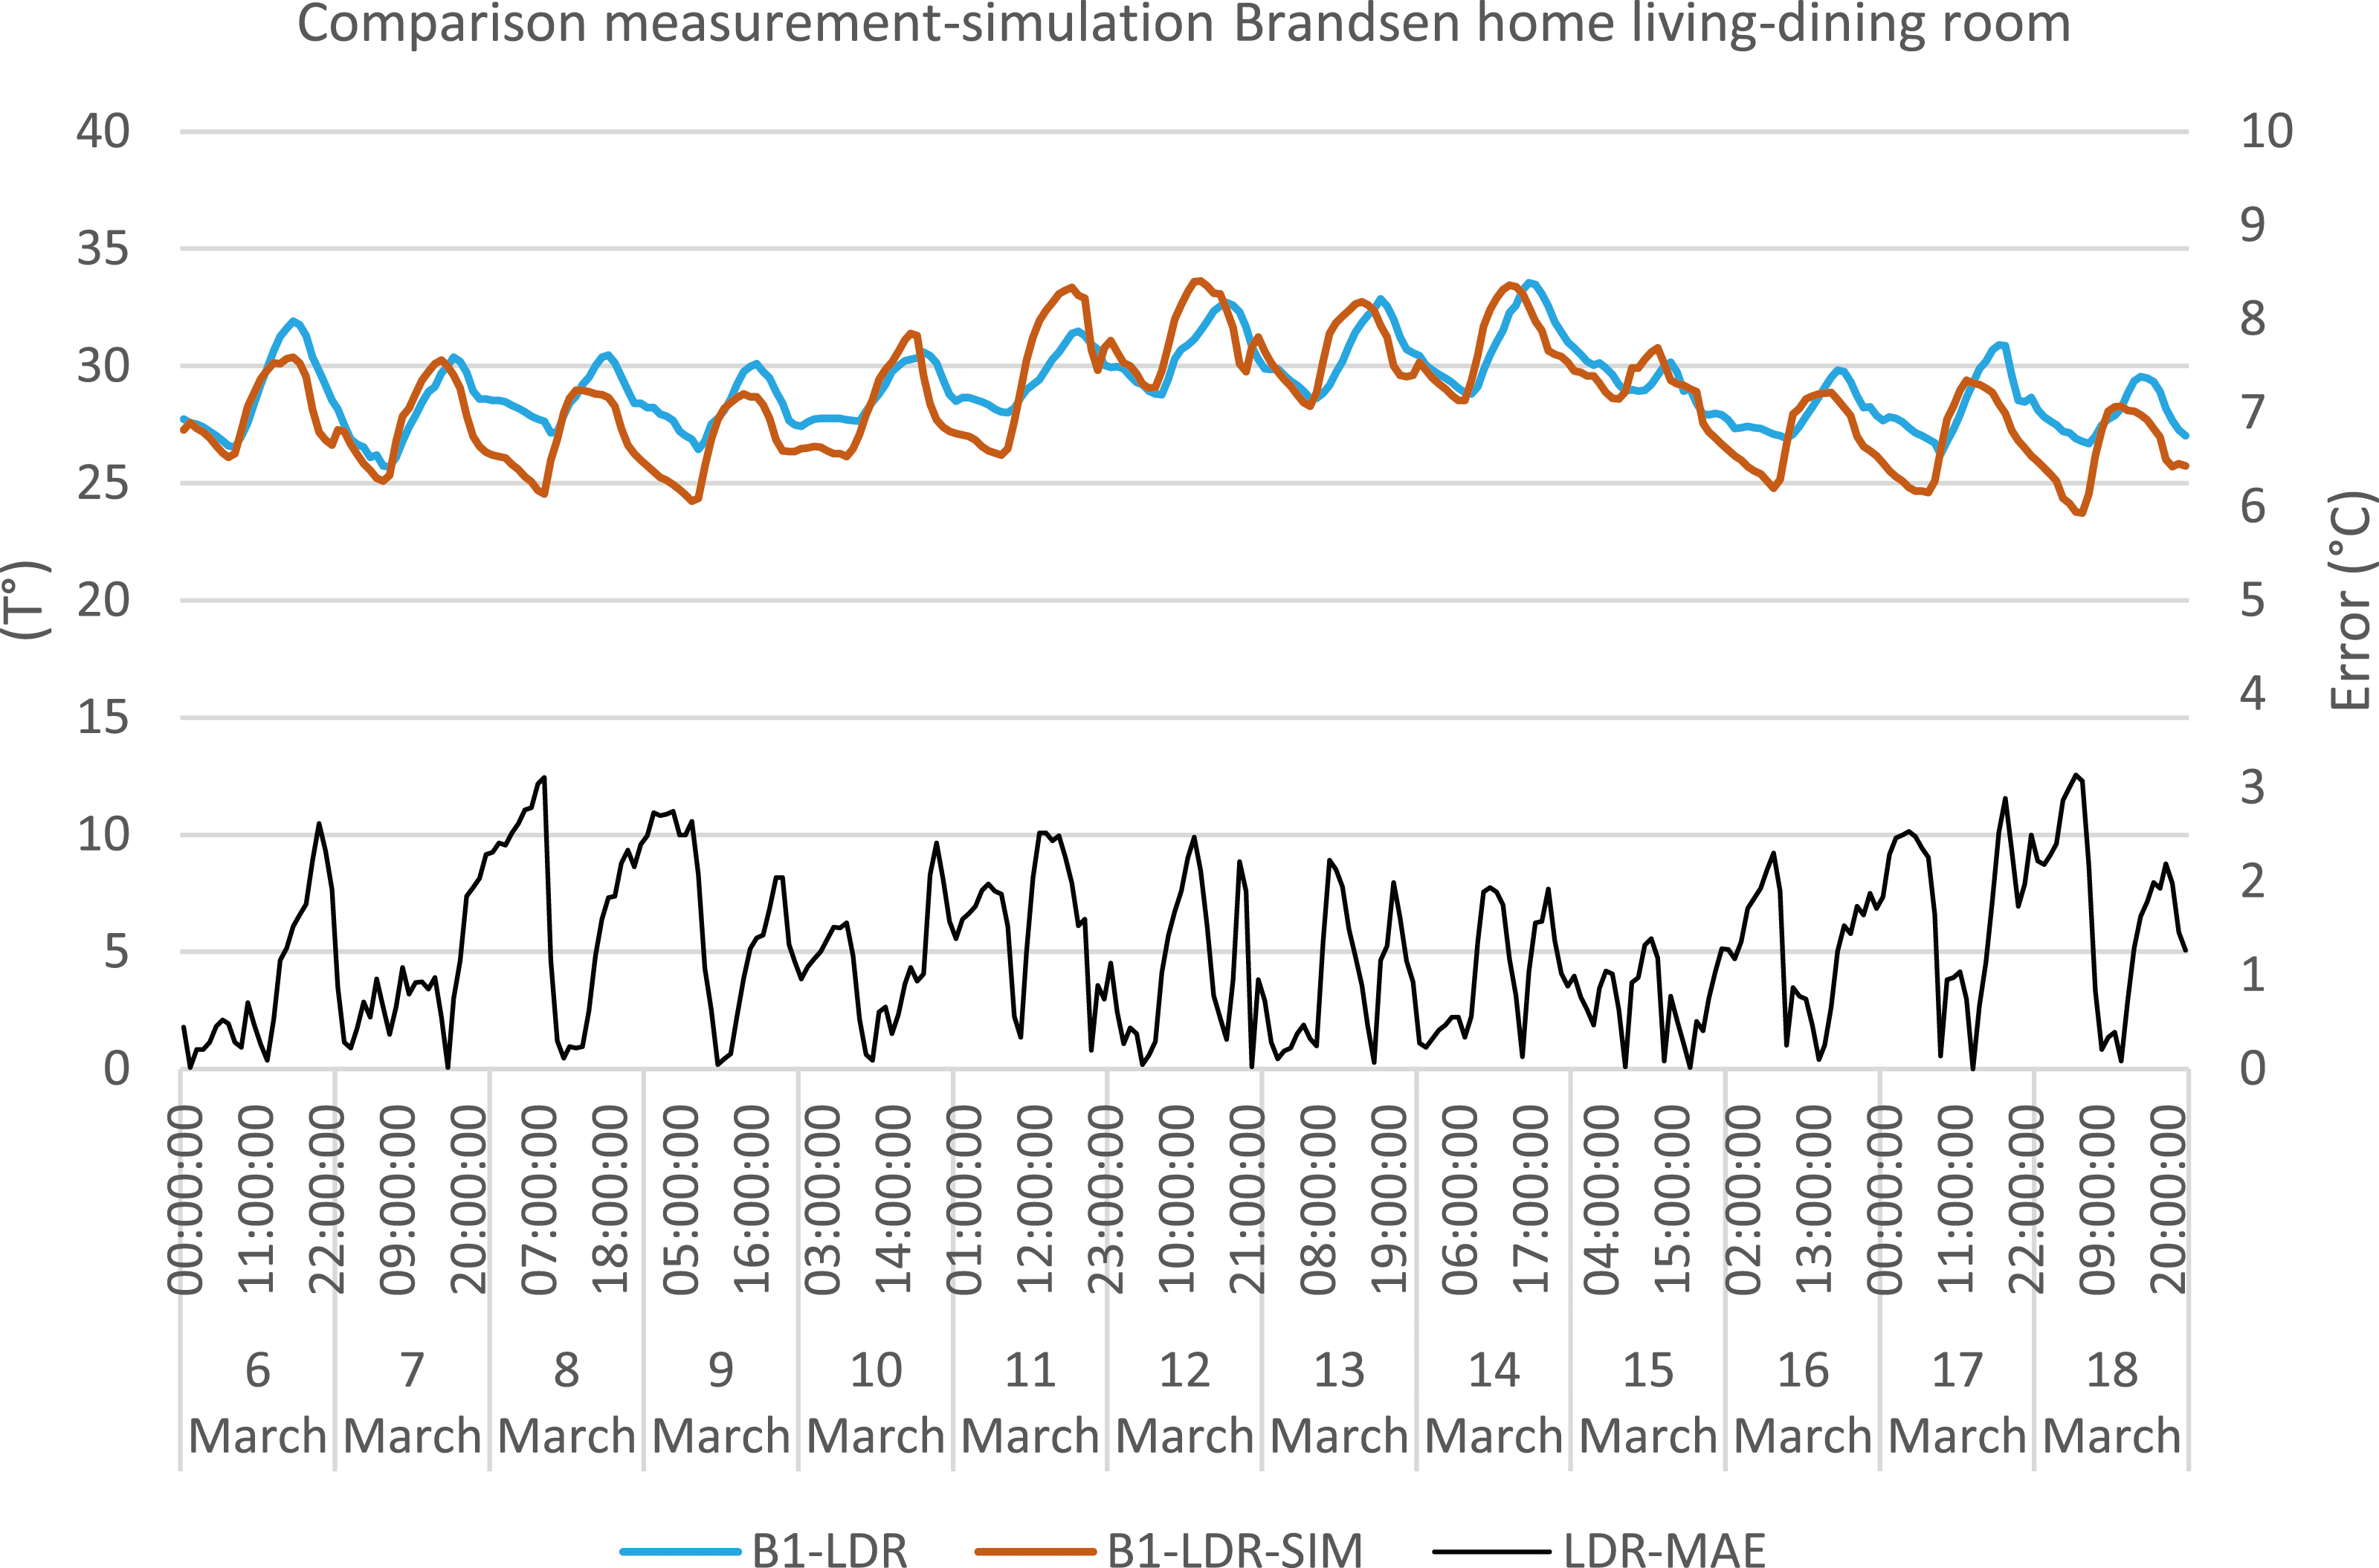
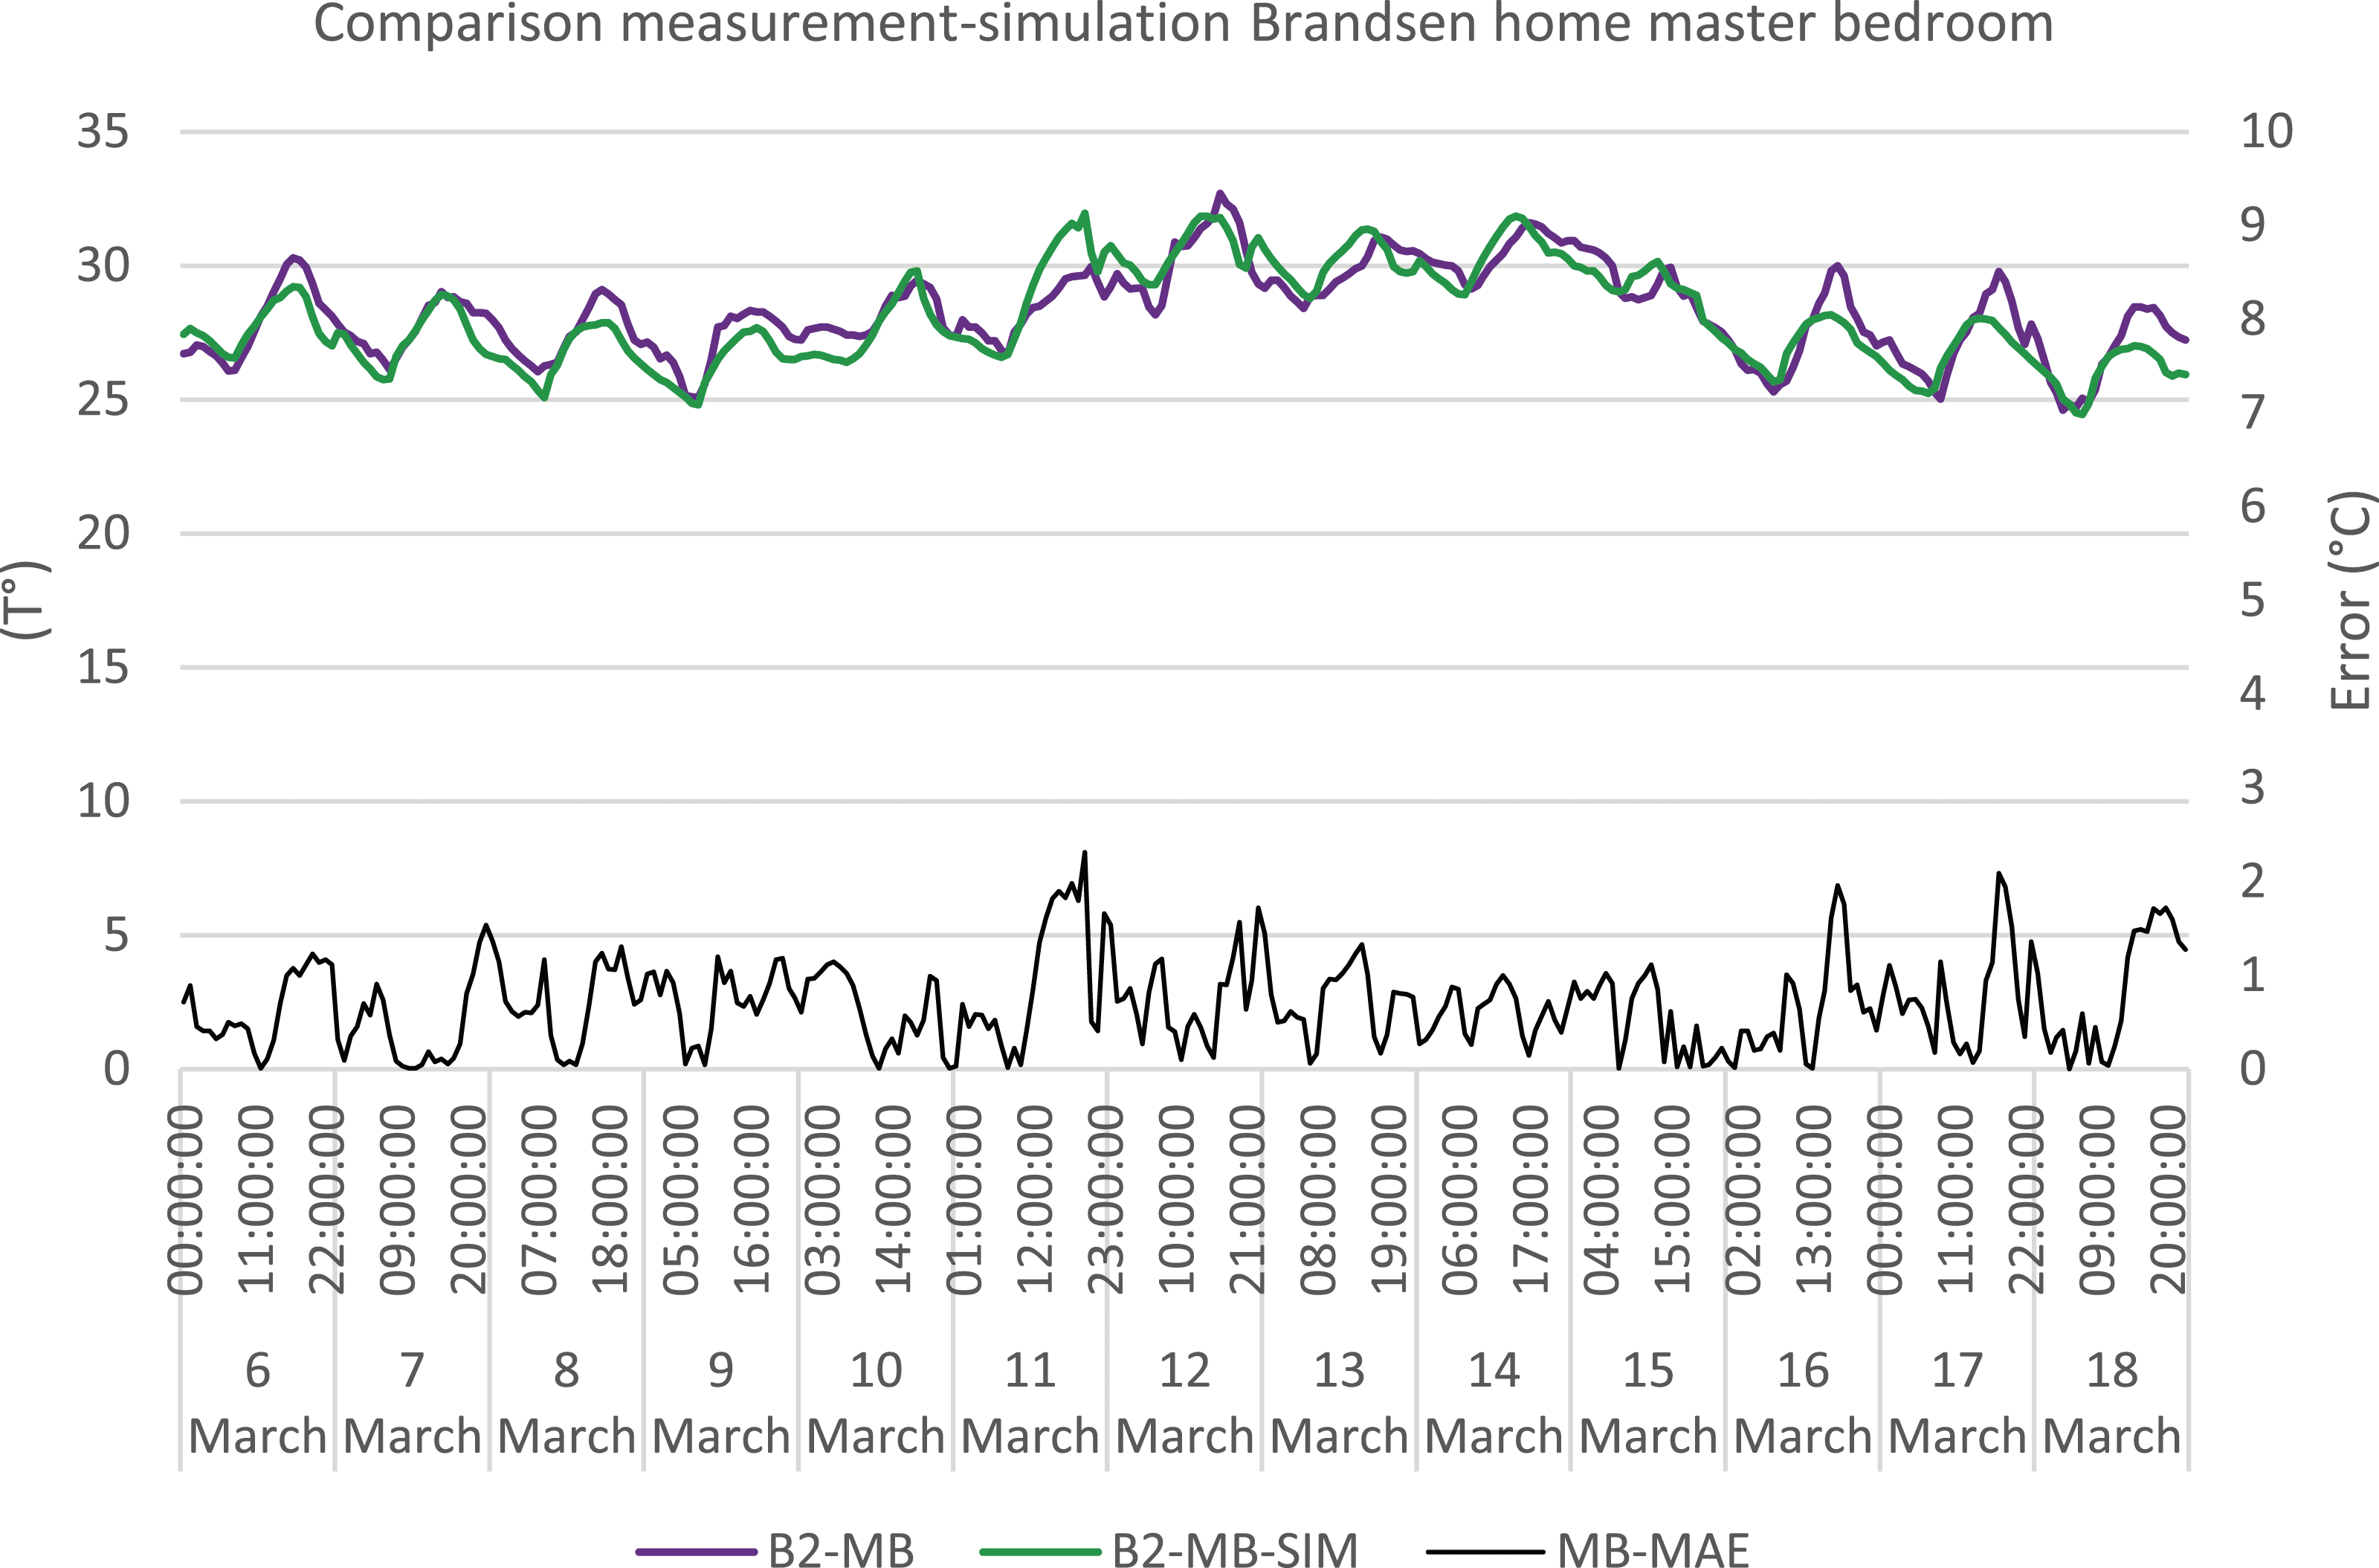
Despite this, the general thermal behaviour patterns were effectively replicated by the model. Furthermore, the average MAE and RMSE values remained within acceptable ranges. These results indicate that the simulation model exhibited a satisfactory level of fit against the real measurements, suggesting its suitability for evaluating the integration of different cooling equipment.
Once the model was obtained, the temperatures of the LDR and the MB were set at 26°C (from 8:00 to 20:00 hs and from 20:00 to 8:00 hs, respectively). Then, the thermal energy to be removed and the consequent electrical energy demanded by a GSHP were obtained (Figure 11). Results indicate that electricity demand of the LDR would be 42.15 kWh and that of the bedroom 16.65 kWh, with a total of 157 and 154 hours of use, respectively. This would represent a consumption of 58.80 kWh for the period analysed. Simulation of the energy demand of the Brandsen’s dwelling with the temperature set at 26°C. Source: own elaboration. Codes: Codes: B
i
= i-th measurement point in Brandsen; LDR = living-dining room; MB = master bedroom; SIM = simulated; GSHP = ground source heat pump; ASHP = air source heat pump.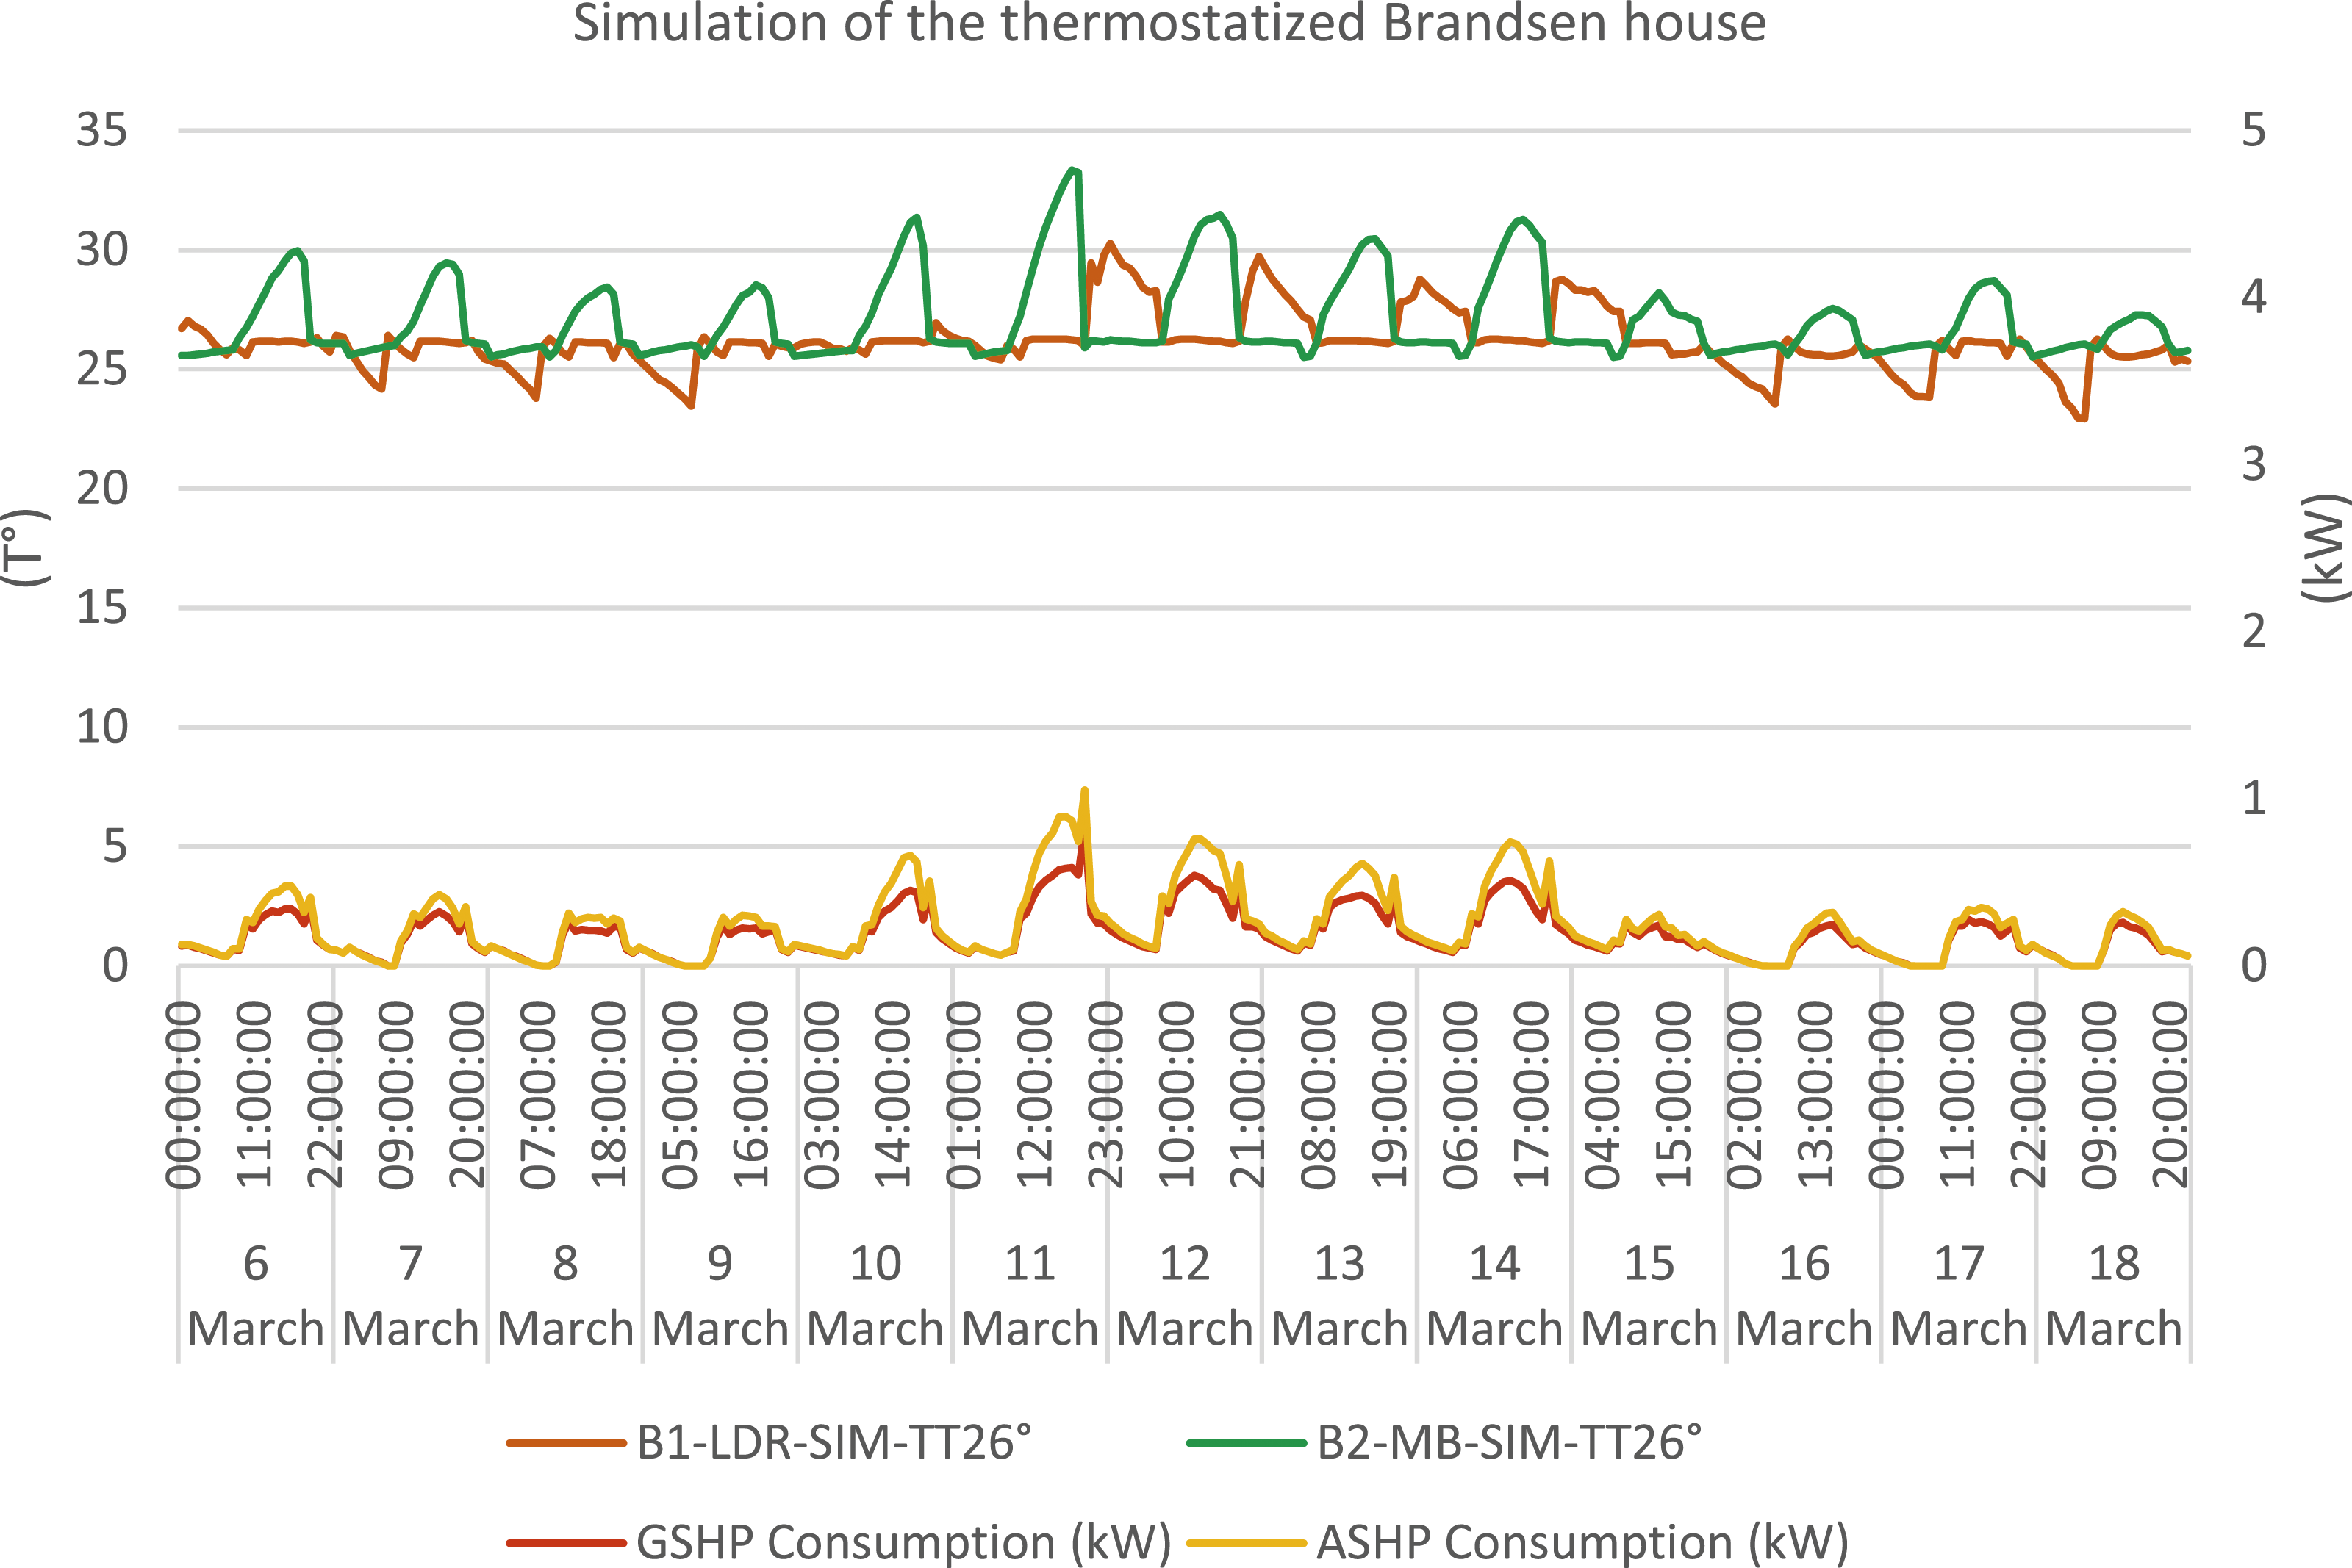
In Figure 12 the average daily electricity consumption required by the purposed GSHP system was evaluated. The highest power peak was about 0.33 kW at 20:00 hs, while the afternoon power peak was also around 0.33 kW. These low values are explained both by the high EER of the equipment, which additionally remained unchanged during the day, and by the performance of the envelope. In Figure 12 is the plot the daily electricity consumption required by the purposed ASHP, where the highest power peak was about 0.46 kW at 16:00 hs, because it has a variable EER during the day. In fact, considering the peak demand, a 28.2% lower value was identified in the case of GSHP. In addition, the average daily energy consumption would be 4.52 kWh/day (0.074 kWh/m2-day) for the GSHP and 5.67 kWh/day (0.09 kWh/m2-day) for the ASHP, representing a 20.3% lower consumption for the first case. Average electric demand curves for cooling by a geothermal heat pump and an air conditioner in the Brandsen house during the heat wave. Source: own elaboration.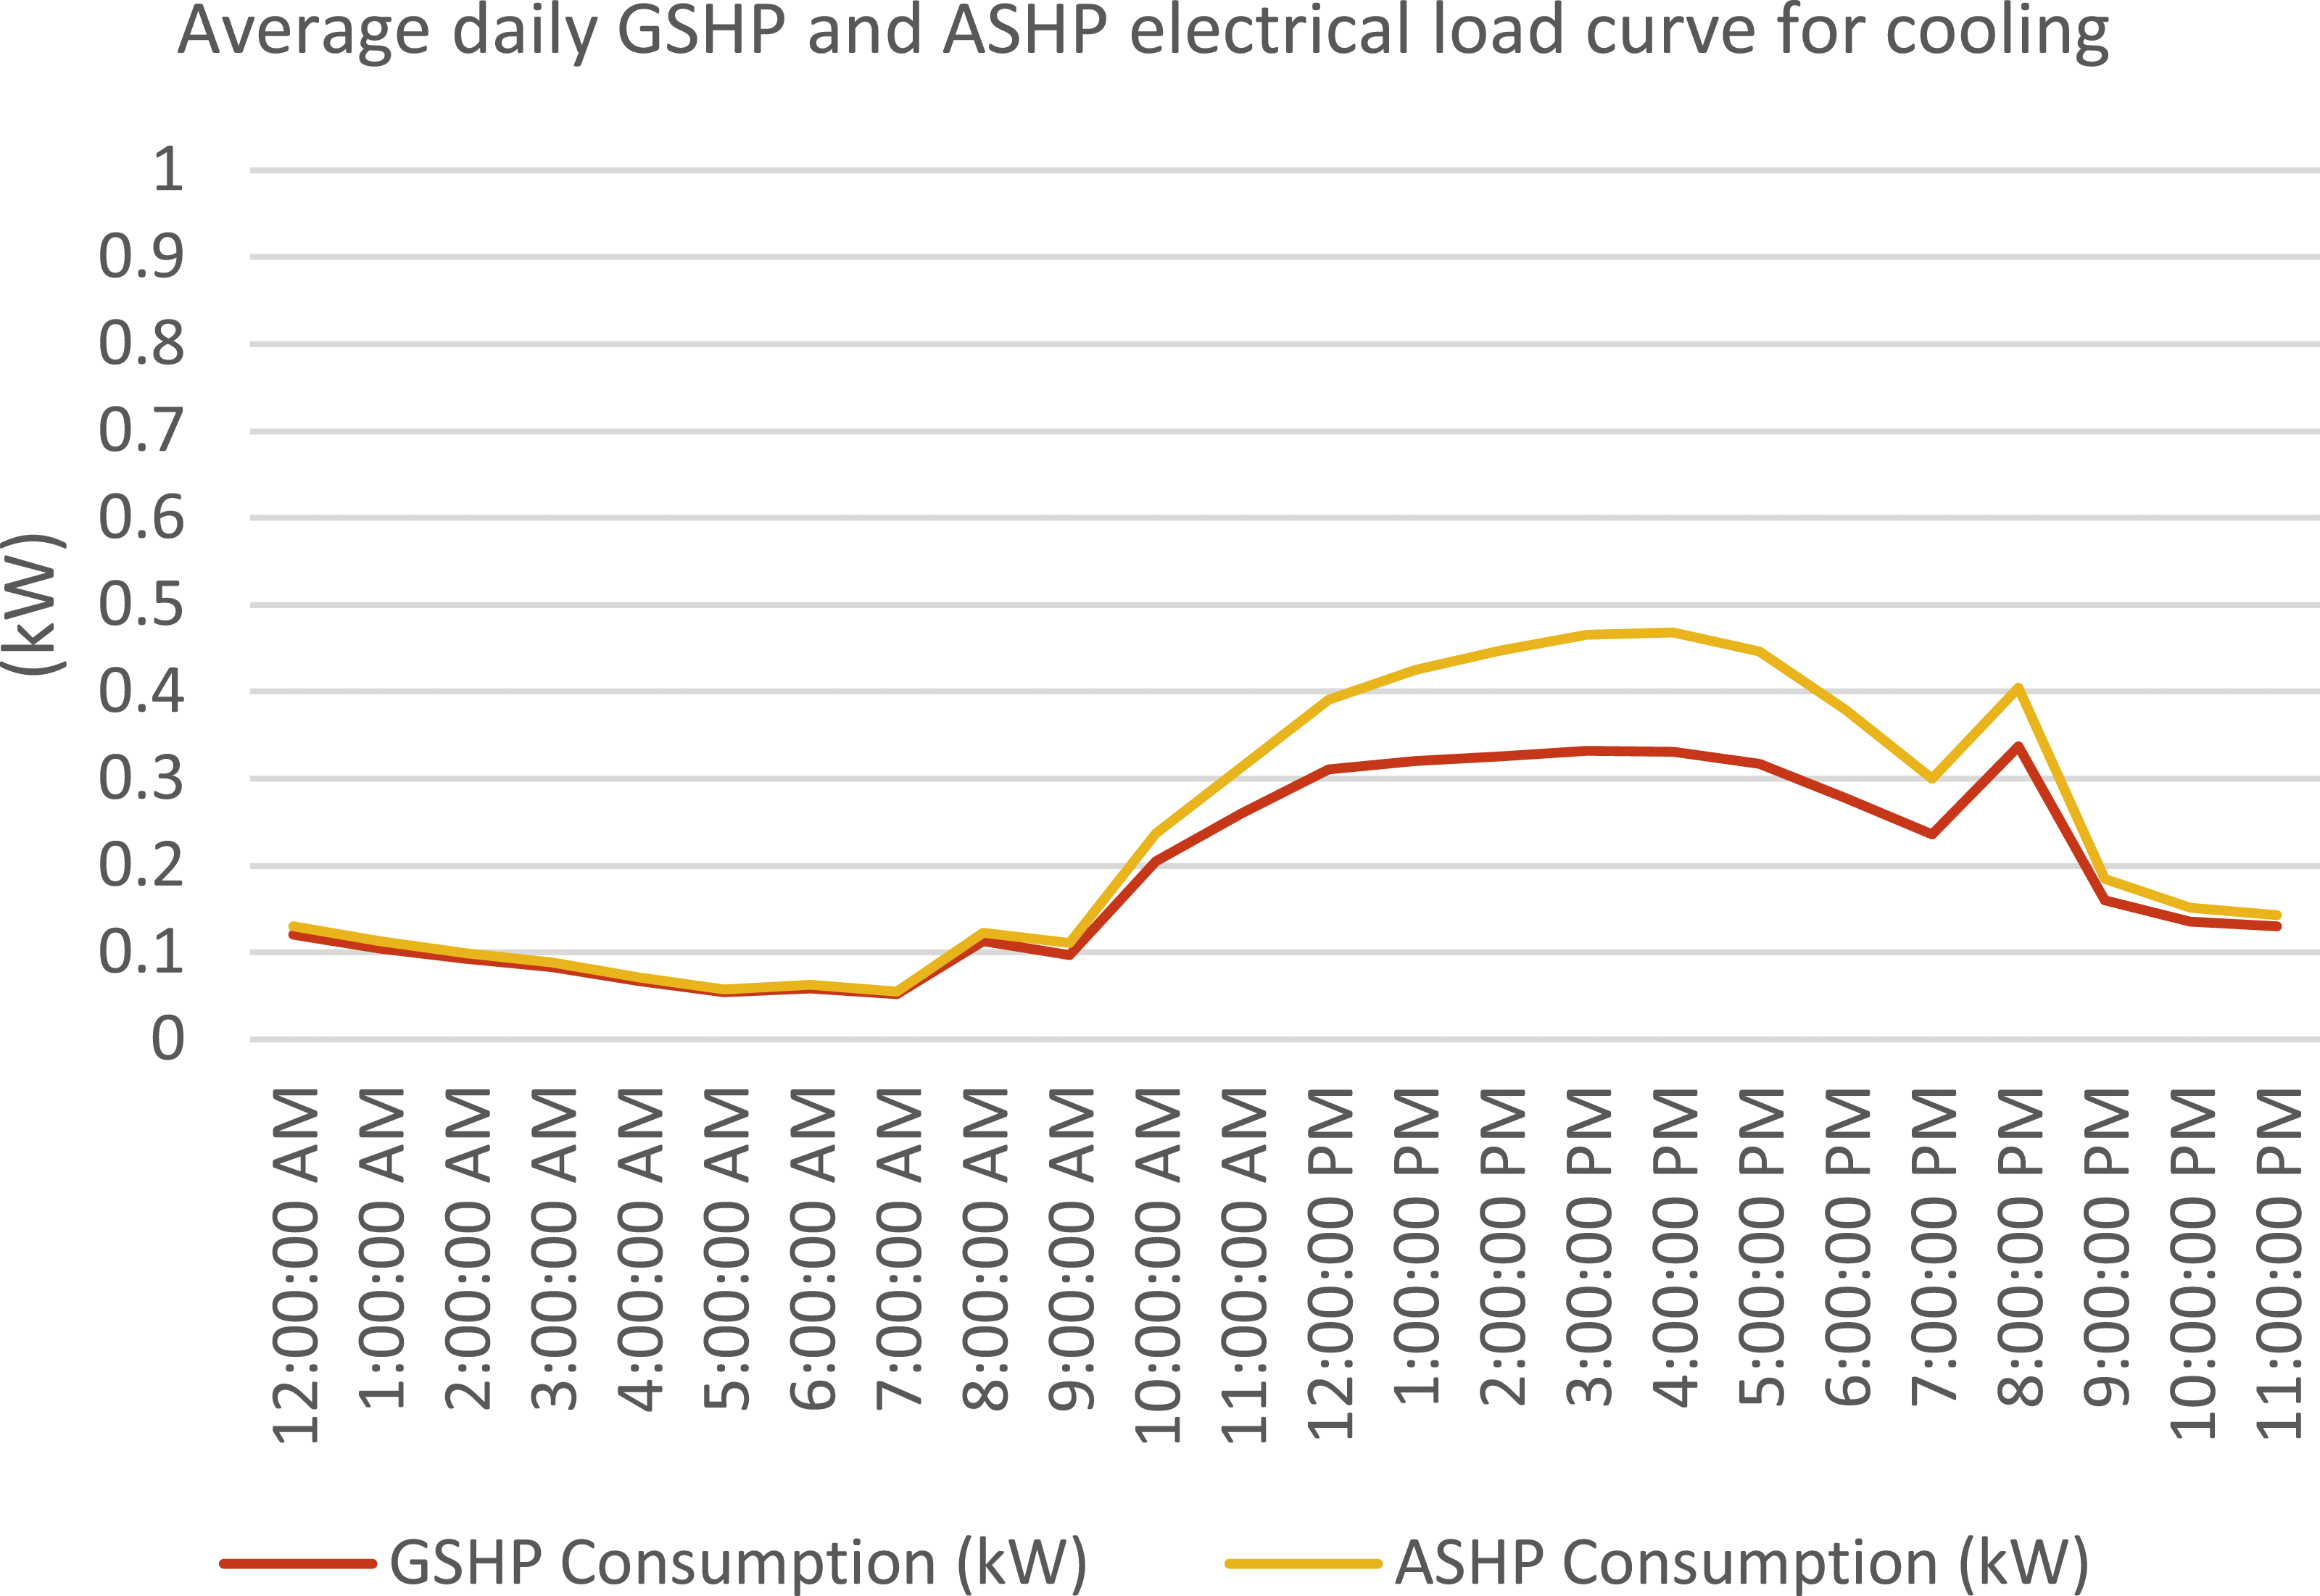
Hence, the selection of GSHP system would represent a lower impact on the electrical grids than a conventional ASHP system because it would achieve a lower peaks power and less daily energy consumption. So, by reducing power and energy, it would also be beneficial on the generation and transportation segments.
Discussion
Based on the results obtained for La Plata and Brandsen (Buenos Aires), Table 7 reveals that the spaces experienced ‘Caution’ and ‘Extreme Caution’ conditions for over 80% of the heat wave duration. These findings surpass those reported in the simulations by Flores Larsen and Filippín37 for Santa Rosa (La Pampa) during a 2018 heat wave event, where houses fell within this range for over 70% of the duration. This underscores the necessity for further empirical studies to assess the impact of heat waves on the population. Additionally, the daily electricity consumption measured for AC during the heat wave in La Plata was 0.15 kWh/m2-day. For the simulated house in Brandsen, the results were 0.09 kWh/m2-day for a conventional air conditioner (ASHP) and 0.074 kWh/m2-day for the GSHP. Meanwhile, the measured AC consumption for houses in Santa Rosa fell within this range, with a value of 0.13 kWh/m2-day.
Considering the outcomes, the house in La Plata, built with a low-quality envelope and two air conditioners, predominantly experienced conditions falling within the ‘Caution’ range. The Heat Index (HI) of the two living spaces never dropped below 26.7°C. Consequently, as a logical extension of this study, future research could explore alternative measures aimed at improving the HI to fall within the ‘No risk’ range. For instance, conducting an energy retrofit of the envelope.
While air conditioning systems are effective in alleviating the stress caused by heat waves, additional measures are necessary to create more resilient systems for such events. Therefore, the implementation of a PV system on one house was essayed to evaluate the improvement of its ability to withstand heat waves and reduce the stress on the power grid. However, considering the current market costs, the provision and installation of a 1.2 kWp PV system would entail a significant investment of approximately $2000USD (at a rate of $1.65USD/W). This cost may pose a barrier to widespread adoption by the population, necessitating incentives and programs to make it more accessible. This is particularly challenging in the context of economic crisis experienced in Argentina. Thus, decision-makers must prioritize measures and incentives to promote the widespread adoption of PV systems, since concrete results of its efficiency in mitigating heat wave stress have been observed.
In the case of the Brandsen house, it spent most of the time in the ‘Caution’ range and about one-sixth of the time in the ‘Extreme Caution’ range. Therefore, the house requires the integration of a system to ensure comfort conditions. Given that the house already has an envelope of intermediate quality, achieving an HI below 26°C in the living spaces throughout the period is feasible by installing a cooling system. However, it is essential to select a cooling solution that minimizes the impact on the power grid. Consequently, compared to traditional AC (ASHP) systems, GSHPs have a lower peak demand, consume 20.3% less electricity per day in our study case and generate less strain on the network during critical periods such as heat waves. Nevertheless, cost considerations reveal that installing an 8.99 kW GSHP system with all its components costs around $9000USD, whereas two individual ASHP of 5.5 kW and 2.6 kW cost approximately $1100 and $800USD, respectively. Although the capacities of the equipment are not identical and the full benefits of the geothermal pump, such as water heating, are not fully utilized, it is evident that using high-efficiency GSHP equipment with minimal impact on electrical grids could incur considerable costs compared to traditional ASHP. Therefore, to foster the widespread adoption of these technologies over conventional air conditioning systems and build a more resilient electricity grid, significant incentives and programs are necessary. However, the dissemination of GSHPs will depend on a reduction in their installation costs, as traditional ACs will continue to dominate the market until this occurs.
Recapping the energy consumption of the GSHP compared to the ASHP, which in the simulations conducted here was 20.3% lower, similar savings have been reported in other studies, ranging from 11% to 37%. For instance, during summer periods, GSHPs achieved energy savings of 37% in Saudi Arabia 61 and 37% in Spain. 62 When considering the entire season, energy savings of 11% were observed in Wales, 57 along with a range of 16.8% to 33.12% in various regions of Morocco. 63
For its part, regarding the applicability of this work, its contribution lies in shaping arguments and supported values aimed at managing the effects of heat waves on dwellings and electrical networks, drawing from both in situ measurements and computational simulations.
On the one hand, the in situ measurements provide concrete data on the impact of heat waves on real houses in the province of Buenos Aires. This includes scenarios with air conditioning but poor envelope quality, as well as cases without air conditioning but with better construction conditions. These empirical findings, unprecedented for dwellings in the region, offer valuable insights for decision-making on health and infrastructure matters. They can inform strategies to either prevent the effects or to improve the resilience of the population facing heat waves.
On the other hand, the reconstruction of the electric demand load curves for cooling can be applied to evaluate resilience strategies in the electric grid. The real curve of the La Plata house can be utilized by researchers and decision-makers to evaluate the possible insertion of electricity storage systems and the implementation of peak shaving strategies. Additionally, it provides data to evaluate the potential resizing and/or strengthening of electrical grids. As for the simulated curve of the Brandsen house, it serves as a useful input to assess the impact of alternative cooling systems on the grids, such as district systems and cold thermal energy storage systems, amongst others. In both cases, these analyses aimed to reduce the pressure of cooling demand on the networks, assisting decision-makers in evaluating appropriate promotion policies to enhance household resilience to heat waves while minimizing the impact on infrastructure.
Conclusion
In this study, the impacts of the March 2023 heat wave on the northeastern region of Buenos Aires province were assessed through empirical measurements conducted in two single-family dwellings. The first dwelling, situated in an urban environment in La Plata, exhibited low thermo-energetic performance and was equipped with two air conditioning units. The second dwelling, located in a rural area in Brandsen, demonstrated intermediate thermo-energetic performance and relied solely on a fan for cooling. The analysis encompasses the evaluation of habitability conditions, energy consumption, cooling costs and the assessment of adaptation strategies to heat waves for each case, considering their effects on electrical networks.
Regarding external conditions, average outdoor temperatures were comparable in both locations (28.00°C in La Plata and 27.81°C in Brandsen), yet thermal fluctuations (standard deviations) were less pronounced in La Plata due to heat retention in substantial built structures.
In terms of indoor temperatures, both dwellings exhibited similar readings (approximately 29°C in the living-dining room and 27°C in the master bedroom). However, thermal variability (standard deviations) was lower in La Plata, attributable to its air conditioning system, outdoor temperatures and surrounding environment.
Heat index calculations for the living-dining rooms were 30.11°C ± 1.31°C and 30.18°C ± 1.59°C, and HI of the master bedrooms were 28.52°C ± 1.11°C and 29.95°C ± 1.76°C for La Plata and Brandsen, respectively. Hence, the average value of each sector was similar between houses, even though the house in La Plata has an air conditioning system and the house in Brandsen has just a fan. This can be explained because of the better envelope conditions and the night passive cooling of the Brandsen’s dwelling facilitated by the rural surroundings.
In terms of frequency, the outdoor heat index was in the majority of the time in the ‘Caution’ range (55%), followed by ‘Extreme caution’ (33.3%), with occasional spikes into the ‘Danger’ condition (7.9%). Indoors, both houses primarily experienced ‘Caution’ conditions, with intermittent periods of ‘Extreme caution’ (more prevalent in the Brandsen house), and no instances of ‘Danger’ were recorded.
The energy consumption for heat wave adaptation in the La Plata house totaled 168.19 kWh, with associated costs of $13.73USD, representing 9.03% of the total annual electricity consumption. For the Brandsen house, the energy consumption for heat wave adaptation was 23.4 kWh, costing 1.90 USD, accounting for 1.03% of the total annual electricity consumption.
Regarding the test of adaptation strategies, in the La Plata dwelling, we integrated a 1.2 kWp solar PV system to reduce the peak power demand. The PV system was able to generate 85.43 kWh during the heat wave and 41.5% of that energy would directly cover the cooling demand, especially in the evenings. The remaining energy surplus could be utilized elsewhere or injected into the grid, especially during mornings and early afternoon hours. In the Brandsen dwelling, we implemented a GSHP system to guarantee 26°C in living spaces. The GSHP cooling system would require an electricity consumption of 58.8 kWh during the heat wave. Compared to a traditional ASHP air conditioner, the GSHP system exhibited an average daily peak power 28.2% lower and a daily energy consumption 20.3% lower.
The proposed adaptation strategies, focused on the integration of renewable energy and efficient cooling technologies, offer significant advantages for both the power grid and the generation and transmission systems.
With the incorporation of photovoltaic (PV) systems, the power grid will benefit from the reduction of peak demand in the afternoon during heat waves, which is one of the periods of greatest need for cooling (the other is during the night). On the other hand, the mismatch between supply and demand generates surpluses and injection, which contribute to voltage and frequency stability and mitigates grid congestion in trunk sectors. This transition to distributed generation fosters a more resilient and efficient grid that is less dependent on centralized fossil fuel-based energy sources. In addition, generation and transmission systems benefit from reduced fossil fuel consumption that enhances environmental sustainability and energy security.
Simultaneously, the deployment of GSHP systems concurrently aids in adapting to heat waves by achieving indoor comfort levels with reduced peak demand, given their lower energy consumption relative to traditional air conditioning units. This decreased energy usage alleviates strain on the grid during periods of heightened cooling needs. Additionally, the adoption of GSHP systems contributes to a reduction in reliance on fossil fuels within the generation and transportation systems, thereby mitigating greenhouse gas emissions and bolstering energy security.
Collectively, the proposed adaptation strategies herald a transformative transition towards more robust, sustainable and efficient energy systems. However, as mentioned, to achieve optimal results in adapting to heat waves, very important investments are needed for each of the families. This is a problem in the context of an economy in crisis such as the one Argentina is currently going through.
Footnotes
Author contributions
All authors contributed equally in the preparation of this manuscript.
Declaration of conflicting interests
The author(s) declared no potential conflicts of interest with respect to the research, authorship, and/or publication of this article.
Funding
The author(s) disclosed receipt of the following financial support for the research, authorship, and/or publication of this article: This work was supported by the Consejo Nacional de Investigaciones Científicas y Técnicas -CONICET- (PIBAA 2872021010 0844CO) and the Agencia Nacional de Promoción Científica y Tecnológica -Agencia I+D+i- (PICT 2019-04135).