
Abstract
The energy consumption of buildings in China is equivalent to 947 million tons of standard coal, and heating, ventilation and air conditioning (HVAC) systems constitute approximately 65% of the total consumption. Swirl diffusers rely on components such as vortex generators or swirl blades to generate a rotational jet that increases the axial airflow to induce swirling. In this study, the performance of swirl diffusers in HVAC systems was examined. A new comprehensive evaluation index is provided to evaluate the performance of a swirl diffuser during winter. An optimization-based design process including structural parameterization, flow field simulation, establishment of kriging surrogate models and intelligent optimization was developed. The optimized structural parameters of a swirl diffuser were thus obtained. Finally, three-dimensional printing technology was employed to print the swirl diffuser, and experiments were conducted to validate the findings. Based on the Kriging surrogate model and multi-island genetic algorithm results, the positions and shapes of the guide vanes of traditional swirl diffusers used in HVAC systems can be optimized. Moreover, the air diffuser effective index and swirl diffuser effective index calculated using the optimal parameters were reduced by 55.93% and 74.7%, respectively, compared with those of traditional swirl diffusers.
Introduction
China is amongst the largest energy consumers in the world, and the building sector is one of the major sources of energy consumption. Heating, ventilation and air conditioning (HVAC) systems account for a significant portion of building energy consumption. Thus, improving the energy efficiency of these systems is critical for reducing the overall energy consumption of the country. The energy consumption of buildings in China is equivalent to 947 million tons of standard coal, with ventilation and air conditioning systems representing approximately 65% of the overall energy consumption. Therefore, reducing the resistance of ventilation systems to ultimately lower the fan energy consumption is currently a pressing technological challenge that needs to be addressed.1–5 Energy-inefficient HVAC systems typically require more energy to be supplied, which can lead to high energy bills. Improvements in energy efficiency can reduce operating costs and lower energy bills for businesses and residents. Swirl diffusers rely on components such as vortex generators or swirl blades to generate a rotational jet that increases axial airflow to induce swirling. Because the centre of the rotational jet is in a negative pressure zone, a large amount of the surrounding air is drawn into the jet and then delivered to the working area.6–9 Swirl diffusers are advantageous for improving air mixing and enhancing ventilation. Thus, they are suitable for large spaces in which personnel activities span long distances, including theatres, sports arenas, test buildings and various industrial plants. 10 In HVAC systems, the performance of air diffusers is a primary factor influencing the indoor heat and moisture exchange efficiency and is therefore as important as the performance of pumps or fans.11–13
The indoor temperature gradients in winter differ from those in summer, posing challenges for traditional air diffusers such as swirl diffusers to effectively meet the needs under the conditions of both seasons. Typically, air diffusers are utilized primarily during summer. Numerous scholars have extensively researched indoor environments in terms of winter and summer conditions. For example, Abdolzadeh et al. 14 conducted a numerical simulation of an underfloor air distribution (UFAD) system with a swirl diffuser in a summer office environment with a heat source via a three-dimensional (3D) model. Compared with a circular diffuser, the swirl diffuser demonstrated better airflow under thermal conditions. Borowski et al. 15 noted that swirl diffusers were popular in horizontal ceiling air supply systems operating under summer conditions, especially in spaces with high ceilings. The fluid flow in a swirl diffuser is usually significantly influenced by the characteristics of the diffuser design. Li et al. 16 used particle image velocimetry experiments to validate simulation models and analysed the winter and summer airflow patterns of a new system in a printing factory. The results showed that for summer conditions, the use of a swirl diffuser with swirl angles of 45° to 60° had a good effect on the airflow pattern in the space while maintaining consistent air supply velocity and temperature. For winter conditions, the use of swirl diffusers with a swirl angle of 45° and louver diffusers for lateral air supply could maintain a uniform temperature in the work area. Yi 17 conducted a study on swirl diffusers in spaces with high ceilings and reported that by utilizing the characteristics of swirl diffusers, such as delivering cold air in a helical pattern during summer and hot air in a jet pattern during winter, and placing the diffusers in appropriate locations, an uniform indoor airflow pattern could be achieved in warehouses with high levels and certain temperature and humidity requirements. Currently, research on dual-purpose swirl diffusers for both winter and summer use is lacking. Therefore, in most existing engineering projects, two different sets of terminal equipment are used for winter and summer air conditioning, including floor radiant heating in winter and air conditioning in summer, which leads to a higher initial equipment investment.
Many scholars have studied the optimization of swirl diffusers. Ahmadvand et al. 18 compared swirl diffusers with different blade angles and reported that a larger blade angle could provide a better fluid heat transfer performance. Braikia et al. 19 conducted experimental studies on the effects of factors such as inclined blades, single or multiple rotating directions of swirl jets, and their quantity and arrangement on the dynamics and thermal flow. Their results showed that under the influence of swirling, a jet became significantly more uniform. Zhao 20 studied the feasibility of using swirl diffusers in large-space buildings and optimized the characteristics of swirl diffusers at different angles. Their results revealed that a larger rotation angle was correlated with a greater suction of the swirl diffuser. Although the geometric shape and parameters of swirl diffusers could critically affect their performance, most studies used traditional orthogonal experimental methods. However, this approach may not be ideal for achieving the optimal design of swirl diffusers. The design optimization process usually involves numerous design variables, and the outcomes are influenced by multiple parameters, increasing the risk of becoming trapped in local extrema. Therefore, we aimed to determine a suitable method for optimizing swirl diffusers. Since simulating the flow field is time-consuming, surrogate models can be used to approximate calculations and greatly reduce the computational time of the optimization process. Common surrogate models include response surface models, back propagation neural network models, support vector machine regression models and Kriging models.21–24 Response surface models and radial basis function neural network models have poor fitting accuracy for high-dimensional and strongly nonlinear functions. Support vector regression machine models are only suitable for single-objective problems, and they have many free parameters. Kriging models have excellent performance in terms of the best approximation, fast convergence and overcoming local extrema, and they have fewer free parameters. Thus, in this study, the Kriging method was used to create a surrogate model.25–27
The traditional evaluation indicators for supply air diffusers include the resistance coefficient, jet length and cross-sectional area. The resistance coefficient refers to the energy loss caused by boundary layer separation and vortex formation due to local obstacles when the fluid passes through the diffuser. Typically, the jet length of the diffuser is not constant. It represents the distance from the diffuser centre to the point at which the fluid velocity reaches 0.5 m/s. The cross-sectional area refers to the area at the jet length covered by air with a velocity greater than 5% of the throat velocity.28,29 Previous studies have shown that balancing these three indicators is difficult. Diffusers with longer jet lengths and larger cross-sectional areas typically have higher resistance coefficients. Yau et al. 6 studied the jet characteristics of swirl diffusers in UFAD systems, whereas Gao et al. 29 investigated the resistance characteristics of diffusers by changing their structural design. In this study, we propose an integrated indicator that combines the advantages and disadvantages of the resistance, jet length and cross-sectional area to evaluate the diffuser performance. Based on this indicator, we optimized the performance of swirl diffusers.
In this study, the performance of swirl diffusers in HVAC systems was examined. A new comprehensive evaluation index was provided to evaluate the performance of a swirl diffuser during winter. An optimization-based design process was developed that includes structural parameterization, flow field simulation calculations, establishment of surrogate models and intelligent optimization (multi-island genetic algorithm [MIGA]). The optimized structural parameters of swirl diffusers were obtained. Finally, 3D printing technology was utilized to fabricate swirl diffusers and subsequent experiments were conducted to validate the findings.
Normalized evaluation index for swirl diffusers
The jet length of an air diffuser is defined as the distance from the centre of the diffuser to the location at which the air velocity was decreased to 0.5 m/s. The cross-sectional area is the area at the jet length of the swirl diffuser covered by air with a velocity greater than 5% of the air velocity of the throat. The resistance of a diffuser is the energy loss caused by boundary layer separation due to the local obstructions of the diffuser when fluid flows through it.
28
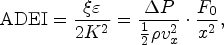
Swirl diffusers operate under two distinct conditions: winter and summer. In summer, a horizontal supply air distribution is used for cooling, and the comprehensive evaluation index (air diffuser effective index [ADEI]) previously proposed by our research team was utilized to evaluate the swirl diffuser performance.
29
The ADEI is shown in equation (1). In the context of the downward-flow operating conditions for swirl diffusers in winter, the salient parameters include not only the jet length and resistance but also the cross-sectional area. These three factors, as shown in Figure 1, are essential. The jet length represents the radiation length of the swirl diffuser along the z-axis direction, the cross-sectional area represents the coverage range of the swirl diffuser at the jet length, and the resistance represents the energy consumed during the passage of the airflow through the diffuser.
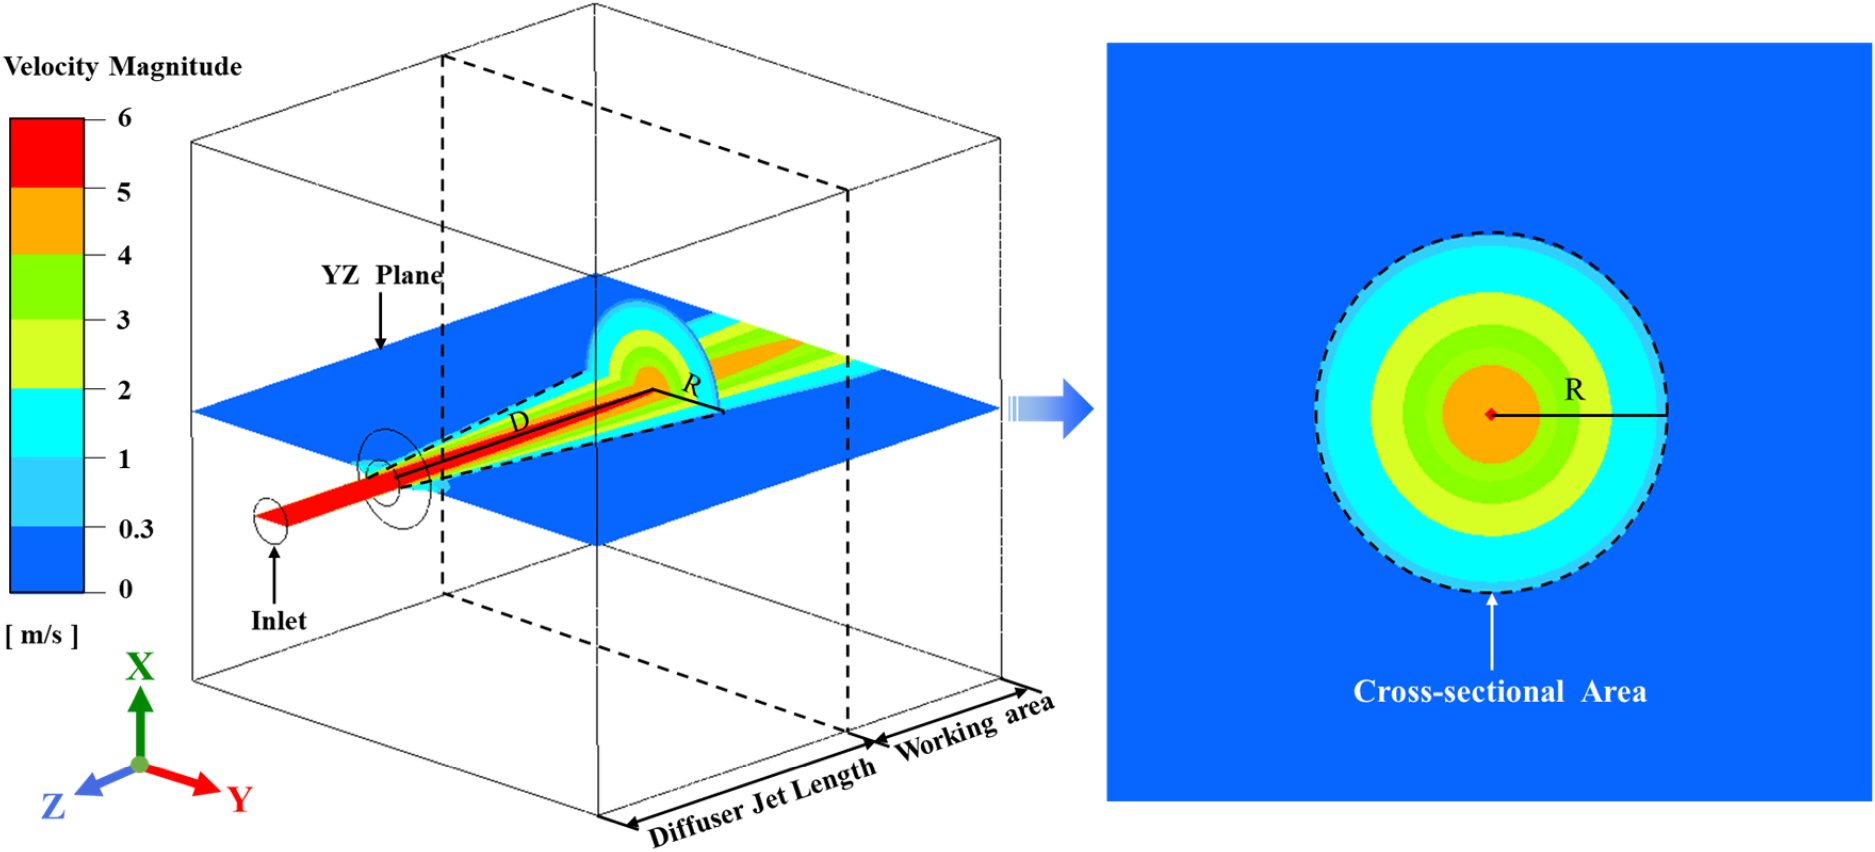
Schematic diagram of the jet length and cross-sectional area of a downward supply air diffuser.
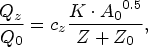
ASHRAE has proposed an empirical formula to evaluate the air entrainment ratio of a swirl diffuser in an air distribution system as shown in equation (2)
28
:
Since
Squaring both sides simultaneously:
The above equation can be rearranged to produce the following:
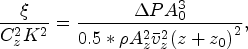
Both sides of the above equation can be simultaneously multiplied by the local resistance factor ξ to produce the following:
Since
Methodology
In this study, an integrated approach including experiments, computational fluid dynamics (CFD) simulations and machine learning techniques was adopted. The velocity and air resistance at indoor measurement points can be accurately measured via experimental methods, and these results can be used to verify the accuracy of the parameter settings in the numerical simulations. For the numerical simulations, computers were used to perform the calculations. The method is particularly suitable for situations requiring many samples and can greatly reduce the amount of work. Moreover, this approach facilitates visual comprehension of the flow and resistance characteristics of the swirl diffuser, providing valuable insights for analysing and optimizing the diffuser parameters.
CFD numerical simulations
Verification of the adaptability of the turbulence model.
Currently, indirect numerical simulation methods, in which the turbulence fluctuation terms were not directly calculated, are used for the simulation of turbulent flows. Instead of directly calculating the turbulence fluctuations, several simplifications were adopted, which can be divided into large eddy simulation, statistical averaging and Reynolds averaging methods. Common turbulent flow models used for room ventilation and air conditioning simulations include the SST variant of the k–omega model, the standard model, the RNG model, the realizable model and the Reynolds stress model variant of the k–epsilon model. 30 In previous research, the k–epsilon model was widely used in predicting the airflow for circular diffusers, square diffusers and swirl diffusers, amongst others.31–33 Previous research by our research group also demonstrated that standard CFD simulations using the k–epsilon model can effectively predict the flow characteristics of diffusers. 34
Verification of the grid independence and grid division.
Currently, computational meshes were employed in conventional fluid computation software, which involves dividing the continuous calculation area in space into sufficiently small computation regions. The fluid control equations were then applied to each of these regions to solve the fluid control equations of all the areas. In this study, the physical model of the room has dimensions of 3 × 3 × 3 m, as shown in Figure 2(a). Owing to the complex structure of the swirl diffuser, a poly-hexcore mesh was used throughout the model. A hexahedral structured mesh was adopted for the core area of the room, whereas a polyhedral mesh was employed near the duct walls and the swirl diffuser.
(a) Grid division and (b) grid independence verification.
The mesh was a geometric division of the CFD calculation model and was the main object in the CFD numerical simulation process. The quality of the mesh could directly affect the CFD computational quality and efficiency and could significantly affect the simulation results of ventilation ducts and the indoor airflow pattern. 35 In this study, ANSYS Fluent Meshing software was used for meshing. The flow regions with high-velocity gradients were refined. Figure 2(b) shows the mesh independence verification. The number of mesh elements could directly affect the calculation accuracy and cost, and these two factors can be balanced by appropriately selecting the number. Therefore, mesh independence verification was conducted, and the total pressure was gradually stabilized when the number of mesh elements was increased to 1.64 million. Therefore, the mesh number was set to 1.64 million for the calculations. For this mesh, the maximum mesh size was 3.2 × 10⁻² cm3, and the minimum mesh size was 4 × 10⁻³ cm3.
ANSYS Fluent 2021 R2 is a CFD software specialized for simulation and analysis of fluid flow problems in complex geometric domains. 36 The simulation was conducted in three dimensions via the SIMPLE algorithm to solve the fluid control equations. The pressure equation was discretized via a second-order scheme, and the momentum, turbulence kinetic energy and turbulence dissipation rate equations were discretized via a second-order upwind scheme. The simulation was a steady-state and viscous simulation and has velocity inlet and pressure outlet boundary conditions. The convergence criteria for the simulation were a stable residual of the energy equation below 10−6 and stable residuals of the other equations below 10−4. The simulation was considered to have converged when the pressure area-averaged values at the monitoring duct measurement surface are stable and satisfy the continuity equation.
Full-scale experiments
Arrangement of the test bed.
A full-scale experimental platform can provide verification data for the numerical simulation of the air outlet flow field under different simulation conditions. The materials used in this experiment include a centrifugal fan, soft connections, a static pressure box, a circular air duct, flanges and a swirl diffuser, as shown in Figure 3. The experimental test strictly follows the requirements of ANSI/ASHRAE Standard 120-2017. 28 A soft connection was used to connect the fan outlet and the air duct, and the static pressure box was connected upstream to ensure that the airflow was fully developed when it reached the swirl diffuser.
Full-scale test bed.
Experimental content and measurement point arrangement.
The aim of the experiment was to analyse and determine the effects of the airflow pattern on the air distribution characteristics and resistance of the swirl diffuser under different flow conditions by experimentally testing the velocity and pressure fields of the duct connected to the diffuser. The swirl diffusers were tested to calculate their jet length and total pressure loss. The resistance measurement section was selected according to the ASHRAE Handbook. 28 Here, the resistance measurement section was 225 mm (1.5D) before the air supply outlet plane, and a duct with a length of ≥6D was maintained after the measurement point, where D represents the equivalent diameter of the air duct. Equal-length pressure-measuring holes were installed at the centre of each edge of the measurement section (four edges, including the upper, lower, left and right sides of the duct), and fixed static pressure rings were also installed to balance the average pressure of the section. Finally, micropressure gauges were inserted into the four identical measuring holes to obtain the average pressure at this plane. The throw measurement points were equally arranged along the diameter of the circular diffuser edge from the truncation section 0.25 m below the diffuser. Fourteen measurement points were set at intervals of 0.2 m until the throw edge, and the average value at each measurement point was recorded for 5 min. The measurement point layout is shown in Figure 3. Swema anemometers were used to measure the velocity, and the measurement range and accuracy are listed in Table 1. The distance from the diffuser centre to the location where the air velocity was decreased to 0.5 m/s was measured via a steel tape measure. 28 The diffuser jet length was determined by averaging the results obtained from multiple measurements at the measurement points with velocities of approximately 0.5 m/s.
Measurement ranges and measurement accuracies of the test instruments.
Jet length and cross-sectional area test and experimental error under winter conditions.
In this experiment, a 3D Cartesian coordinate system with the centre of the diffuser as the origin was established. As shown in Figure 3, 10 measurement points were selected along the z-axis, with a distance interval of 0.25 m between each point. The first measurement point was 0.5 m from the diffuser centre. To compare the simulated and experimental values, simulations were conducted to determine the jet length of the swirl diffuser under the same operating conditions. The measured values were then compared with the simulated values, and their errors were calculated. If the values matched, the simulated jet length was considered the actual jet length. Similarly, eight measurement points 1.5 m from the diffuser centre were selected for the cross-sectional area measurements. The simulated and experimental values were compared, and if they matched, the simulated cross-sectional area was considered the experimental cross-sectional area.
Experimental equipment and experimental error.
After the fan had been stably running for a period, the SWA 03 (velocity probe) was selected and combined with a Swema3000 (multipurpose) to record data of the main unit for real-time monitoring. This enabled 3D testing of the velocity field in the micro-wind speed zone. An intelligent digital micropressure gauge was used to measure the pressure on the surface of the pipeline. The measurement ranges and accuracies of the velocity metre and micropressure gauge used in this experiment are shown in Table 1.
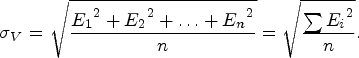
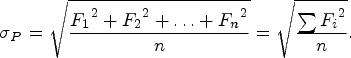
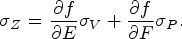
The experimental standard errors of the velocity and pressure were calculated using equations (5) and (6). Since the ADEI and SWDEI cannot be directly obtained from the test and must be derived through calculations, error synthesis would need to be performed using the error propagation formula as shown in equation (7).
The standard error of the velocity was calculated by equation (5) as follows:
Machine learning
Processes based on Kriging surrogate model prediction and MIGA optimization.
In structural optimization studies of swirl diffusers, the effects of different combinations of design parameters on the flow performance need to be evaluated. However, performing flow field calculations through CFD simulations is a time-consuming and resource-intensive task. Therefore, we employed surrogate models to approximate the flow field simulation results. In this study, we chose the Kriging model, which is a powerful approximation surrogate model capable of approximating arbitrary continuous nonlinear functions with a high degree of accuracy. The use of the Kriging model would enable the construction of a model that can efficiently approximate the complex flow field behaviour with a limited number of simulation data points. The Kriging surrogate model has a key role in our study, helping to reduce the computational cost, improve the efficiency of the optimization process and enable a more precise understanding of the relationship between the performance and design parameters of the swirl diffuser structure.
MIGA is a parallel genetic algorithm based on grouping of populations via traditional genetic algorithms. In MIGA, the individuals of each population are divided into subpopulations, which are referred to as islands. All operations of the algorithm are separately carried out on each island, the selected individuals on each island periodically migrate to the other islands, and traditional genetic operations continue to be performed. Compared with the traditional genetic algorithm, MIGA considers the crossover and mutation effects amongst the populations and thus has better global solving ability and computational efficiency. However, potential limitations or uncertainties need to be considered when fully assessing the reliability of MIGA. Different problems may require different parameter configurations, and finding appropriate initial parameter settings may be challenging. The exchange of information between multiple populations in MIGA may affect the speed of convergence and the final results.
With minimization of the ADEI and SWDEI as the optimization objective, the optimization parameters Y were calculated based on the Kriging model established for optimization. The corresponding mathematical model is given as equation (8):


The flowchart in Figure 4 shows the process of optimizing the structure of a swirl diffuser. First, a sensitivity analysis was conducted to determine the optimization parameters, and an optimal Latin hypercube design was used to generate initial samples evenly distributed in high-dimensional space. Numerical simulations were then performed on these sample points to obtain the response value
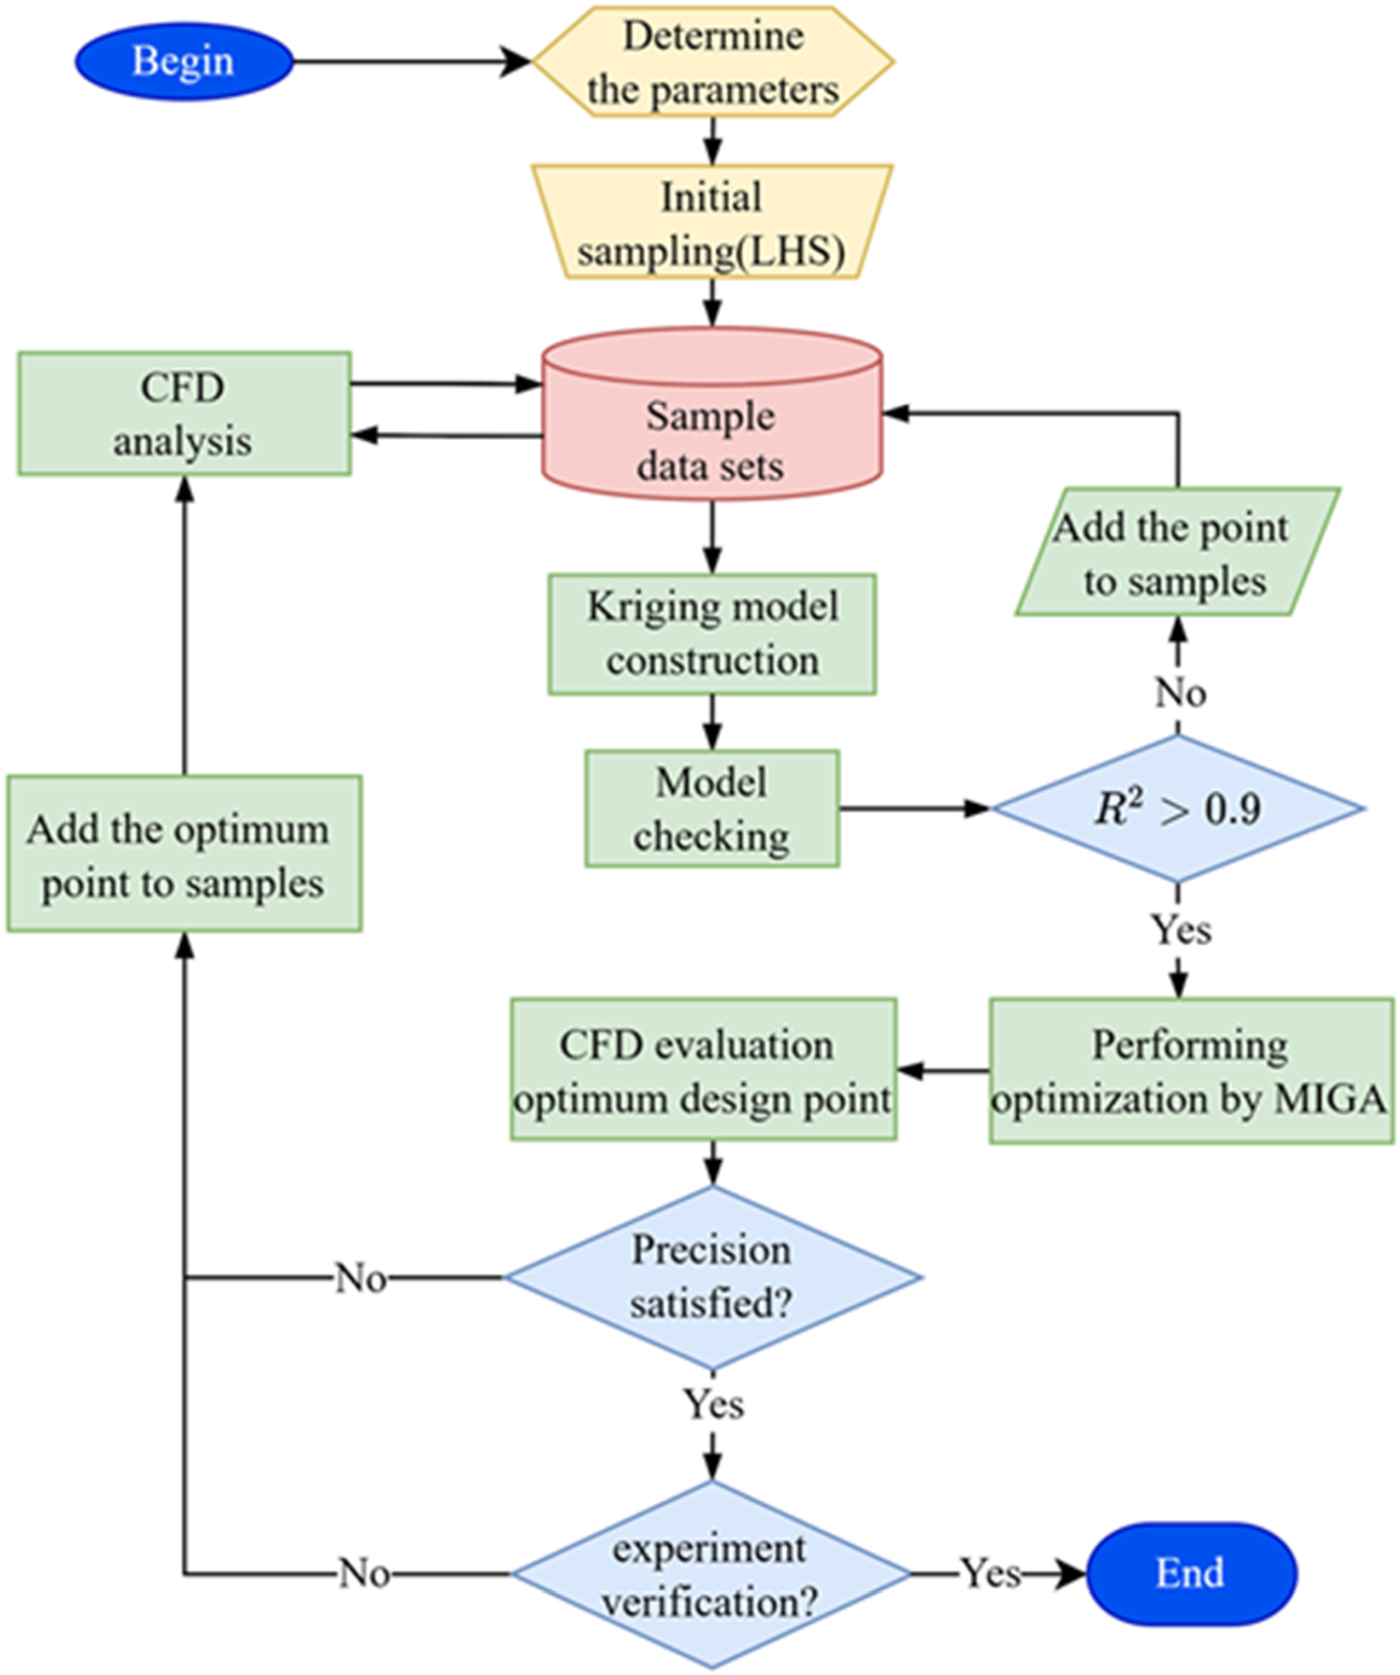
Optimization flow chart.
Results and discussion
SWDEI verification analysis
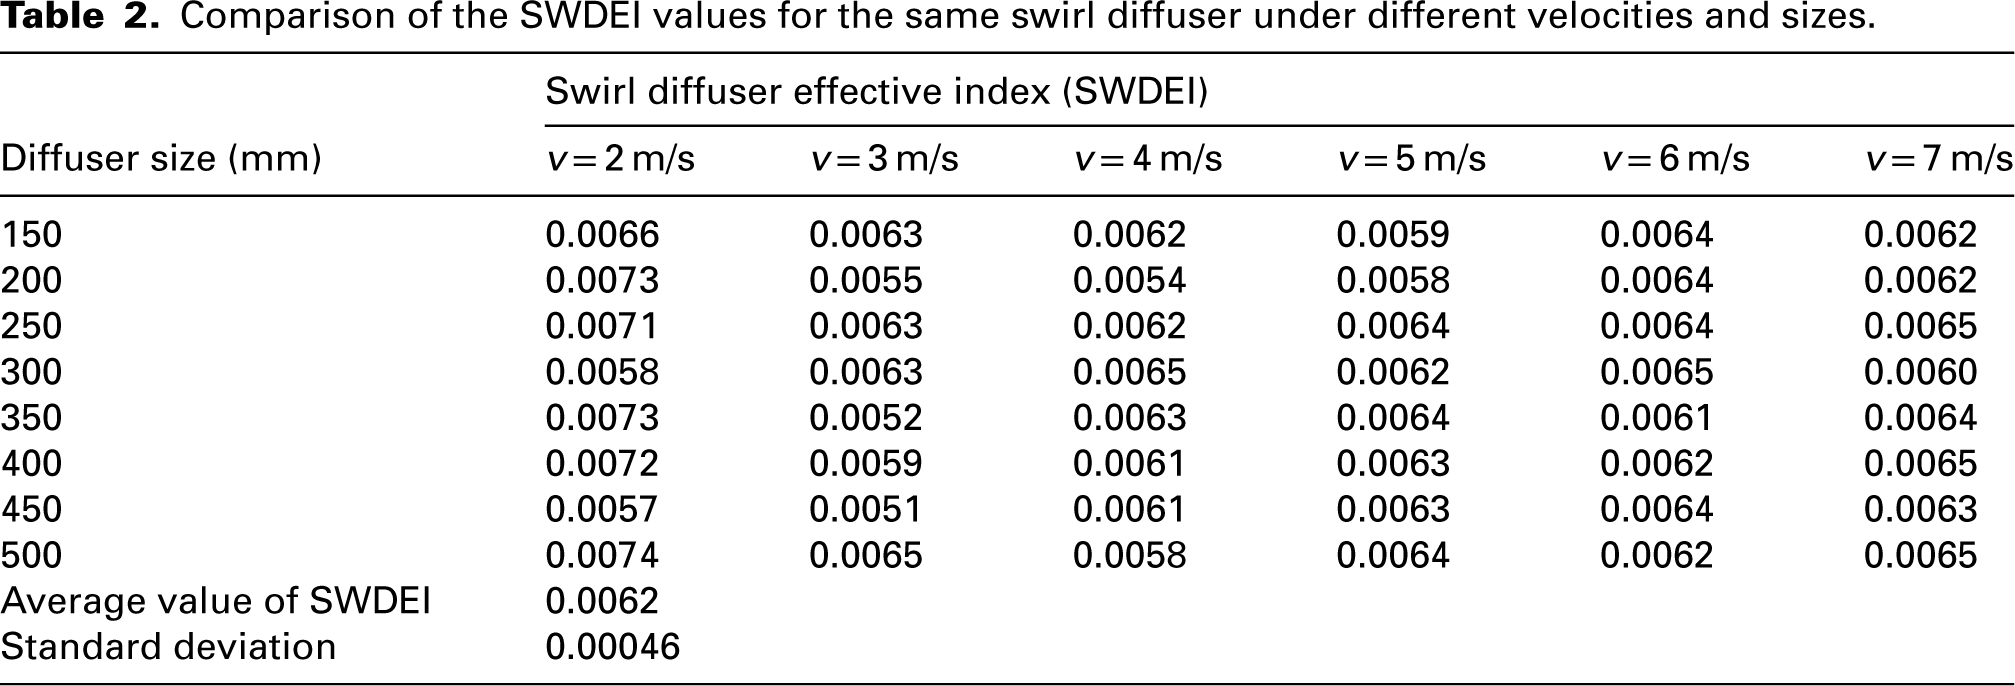
When comparing the performance of swirl diffusers, many factors need to be considered, such as the throat diameter and air velocity, as these could directly affect the performance. By nondimensionalizing these factors, the air supply performance of different types of diffusers of various sizes and velocities can be compared. In this study, to validate the dimensionless nature of the SWDEI, numerical simulations and comparative analyses of the SWDEI values for traditional diffusers of different sizes and operating conditions were conducted. As shown in Table 2, all the values under the different sizes and velocities fall within the mean ±3σ (standard deviation), indicating that the SWDEI reliably captures the dimensionless effects of size and velocity. The SWDEI incorporates the local resistance, jet length and cross-sectional area, and a larger denominator correlates with a lower resistance per unit jet length and per unit cross-sectional area.
Comparison of the SWDEI values for the same swirl diffuser under different velocities and sizes.
Sensitivity analysis
A sensitivity analysis was mainly performed to investigate how the output uncertainty of a model was distributed amongst its input uncertainties. The results of a sensitivity analysis can be expressed in terms of sensitivity coefficients, where a larger sensitivity coefficient indicates a greater impact of that factor on the output. Amongst the seven parameters of the swirl diffuser, those that had relatively large impacts on the resistance and jet length of the supply air were selected for further design optimization. The sample points selected via orthogonal experiments had the characteristics of ‘uniform dispersion, comparability and regularity’, effectively reducing the number of experiments and saving energy.
44
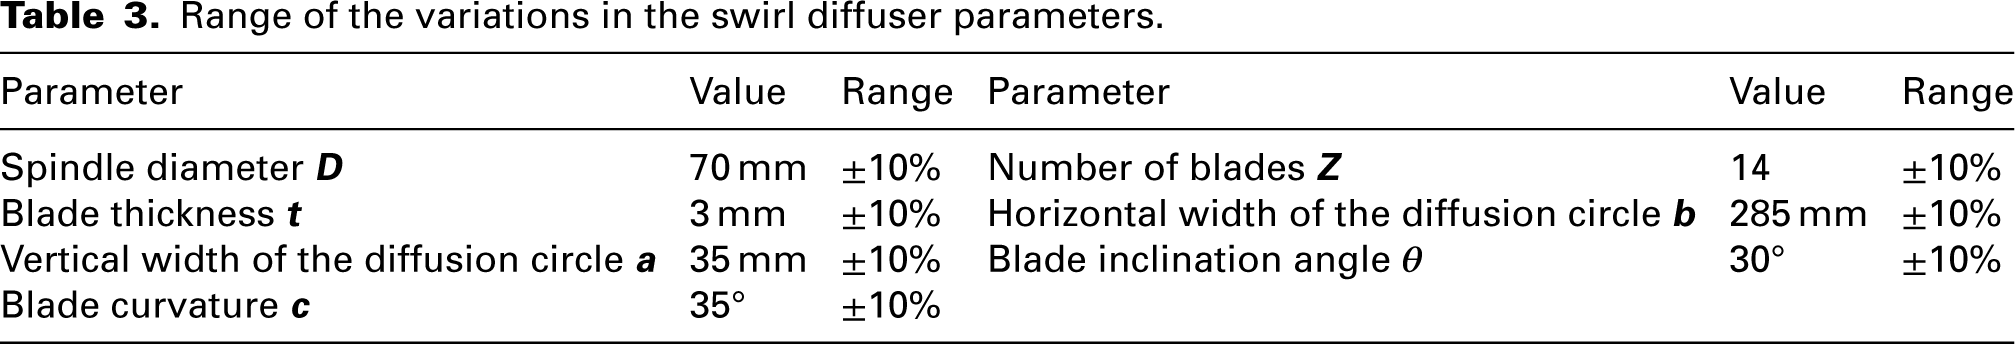
Table 3 lists the specific factors and corresponding levels used in this study. The selection of the seven factors uniquely determines the structure of the cyclone outlet, ensuring neither too many nor too few parameters. In this study, the
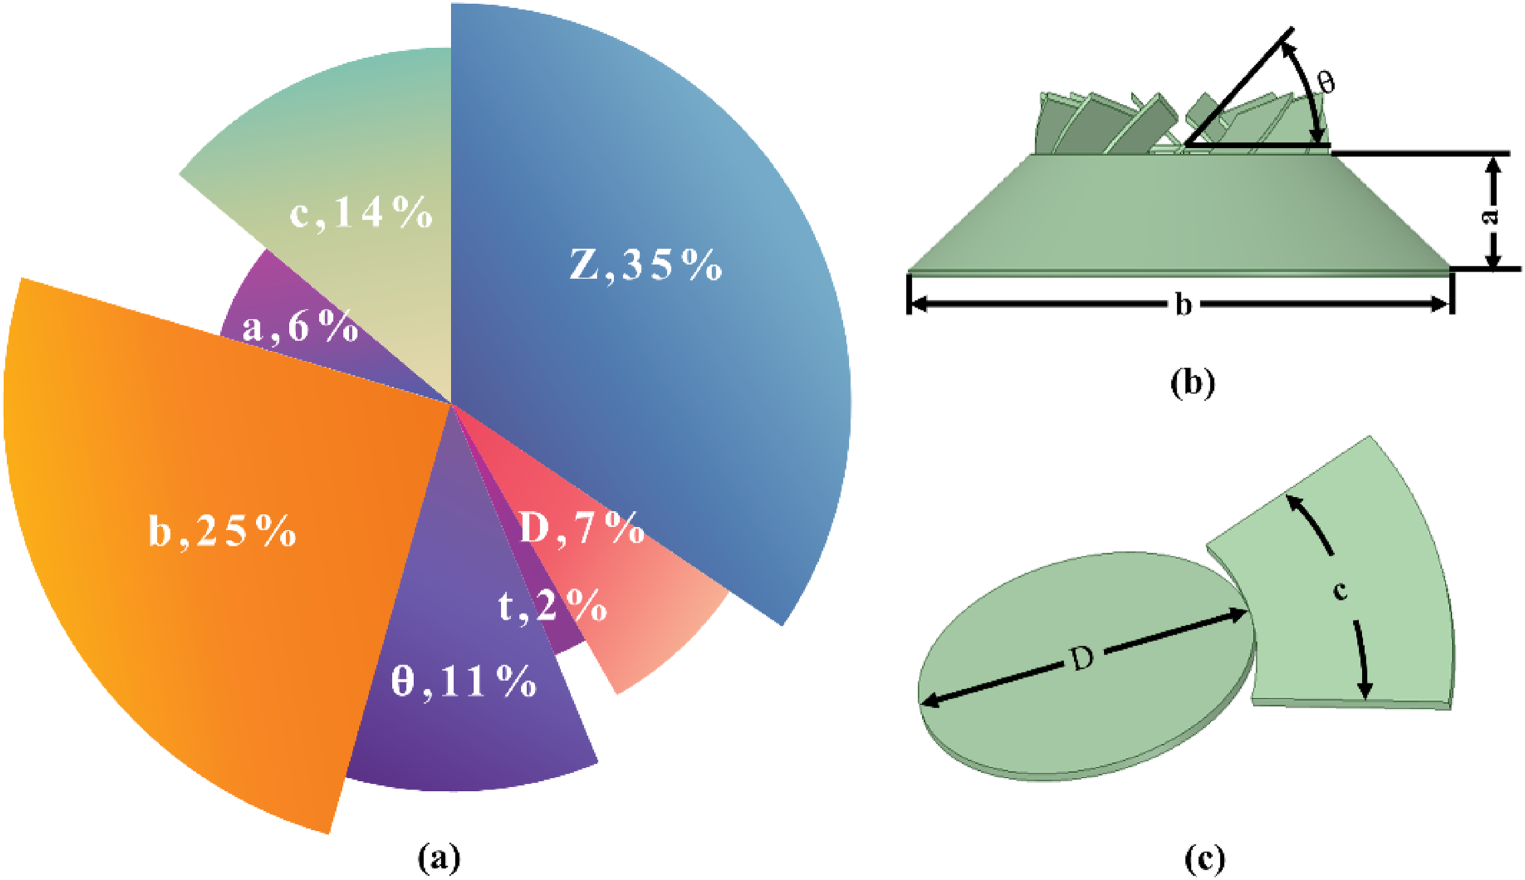
(a) Sensitivity analysis results and (b) and (c) diagrams of the air outlet parameters.
Range of the variations in the swirl diffuser parameters.
CFD-based kriging model prediction and MIGA optimization
For experimental design problems with many design variables and many value levels, orthogonal experimental design methods cannot obtain relatively uniform design samples, whereas Latin hypercube sampling methods can better solve such sampling problems. Latin hypercube sampling ensures a uniform distribution in the parameter space, which means that combinations of different parameter values can be adequately covered, thus reducing possible biases. Latin hypercube sampling can usually provide more information for the same sample size than traditional random sampling. Thus, it can aid in the attainment of more comprehensive results with fewer experiments or simulation runs. A total of 36 initial sampling points were selected (via cross-validation) to construct Kriging surrogate models for the resistance and jet length of the swirl diffuser. As shown in Figure 6(b), the R2 values of the surrogate models for the resistance and jet length were 0.97 and 0.91, respectively, indicating that the Kriging model can closely approximate the experimental data.
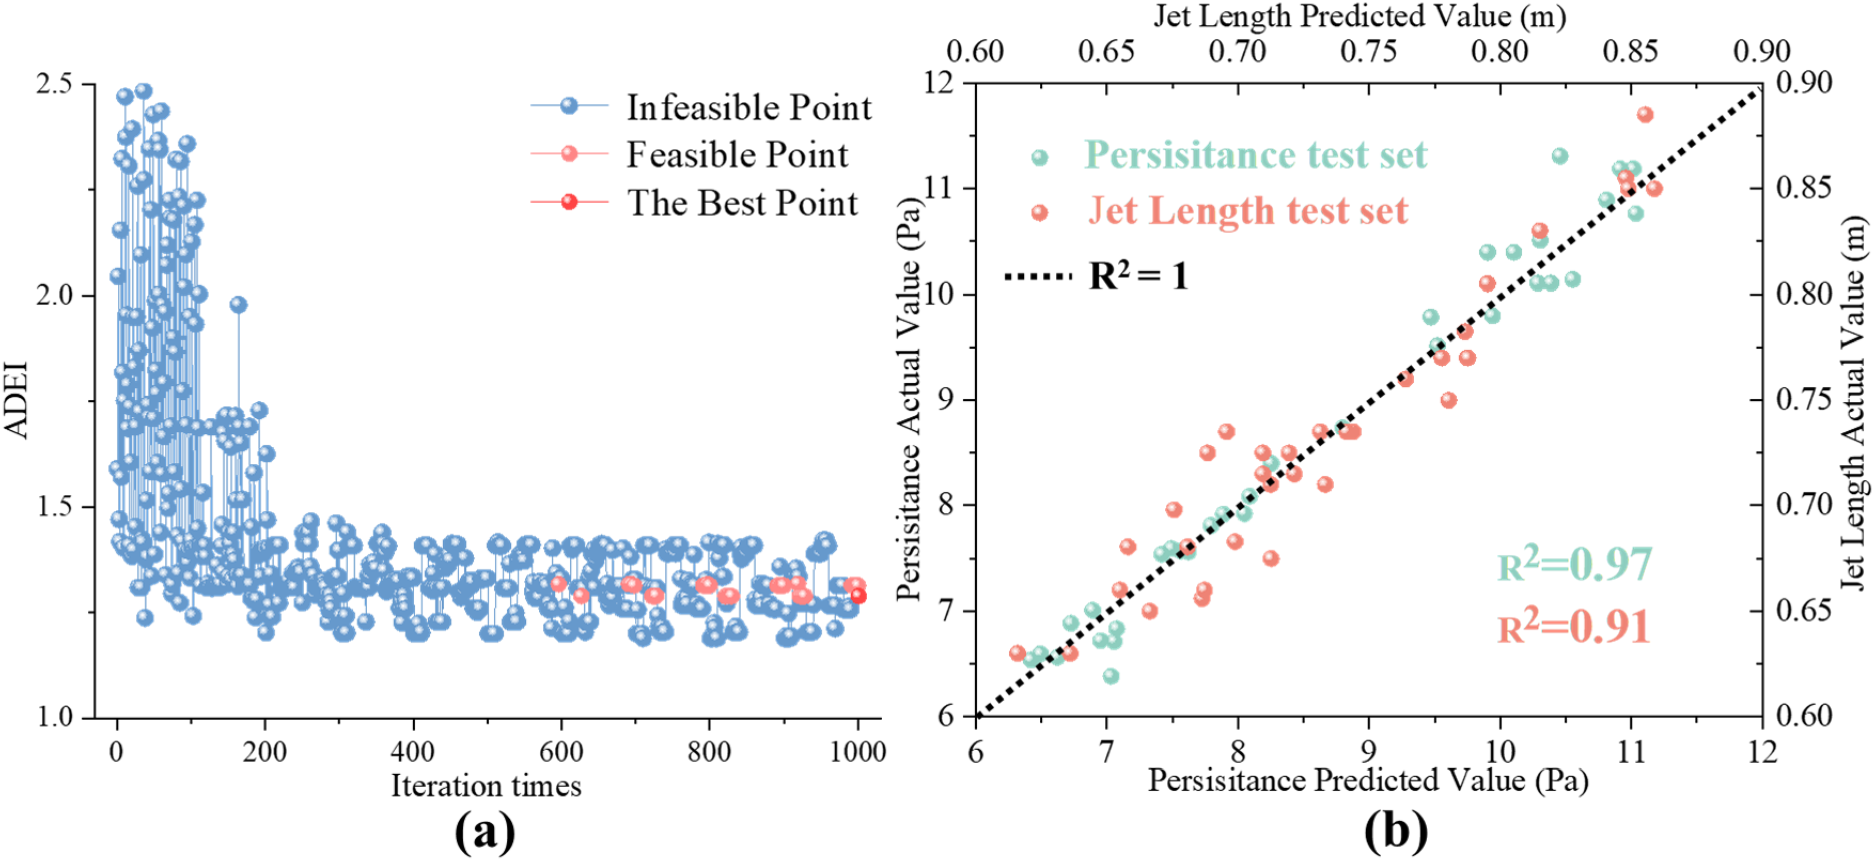
(a) Optimization iteration and (b) kriging model prediction.
In this study, since the gradient information of the kriging model could not be obtained, MIGA was used to optimize the Kriging model. MIGA can search for the global optimal solution of the Kriging model. During the survival-of-the-fittest optimization process of MIGA, the smallest design variable parameter combination continues to evolve and iterate, and the optimal parameter combination was ultimately obtained. 45 In this study, the proposed ADEI indicator was used to convert the multiobjective resistance and jet length optimization problem into a single-objective optimization problem, as shown in Figure 6(a). The results before and after the optimization of each 4 design variable and the objective function (ADEI) are shown in Table 4. The optimization results indicated that the novel swirl diffuser resulted in a 55.93% reduction in the ADEI compared with that of the traditional swirl diffuser. Moreover, the resistance was reduced by 47.19%, whereas the jet length was increased by 9.46%.
Comparison of the parameters pre- and post-optimization.
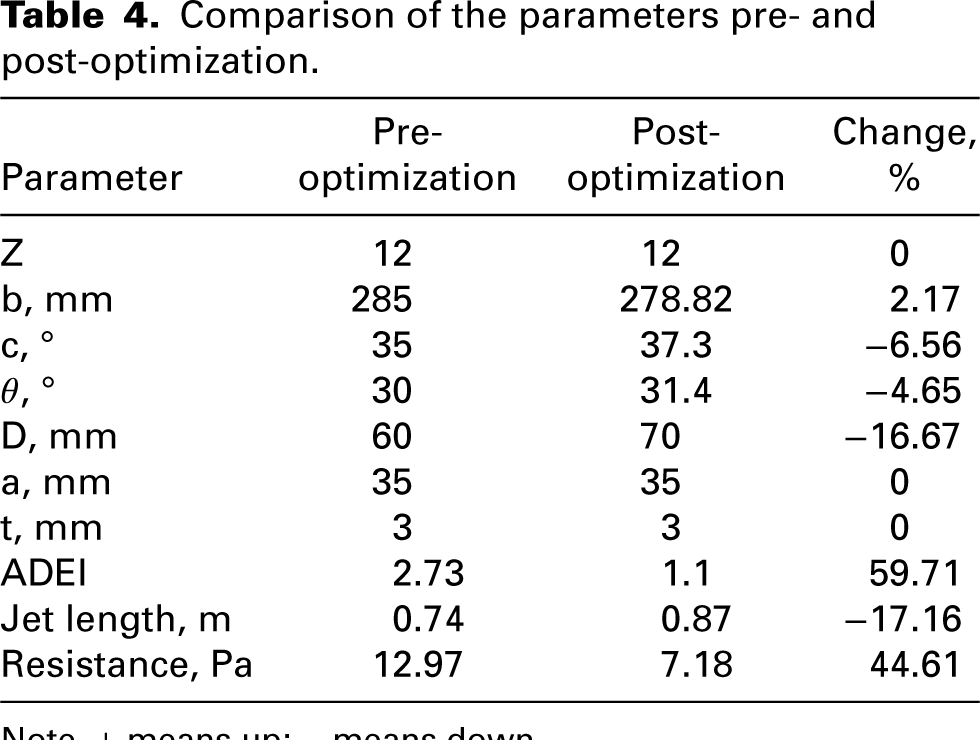
Note. + means up; − means down.
One-factor experimental analysis of the blade inclination angle under winter conditions
As described, for the swirl diffuser, the air supply mode was different in summer and winter. In winter, air was supplied in a downward manner. We used the SWDEI to evaluate its performance under winter working conditions. Based on the optimization for the summer working conditions, we conducted a one-factor experimental analysis of the blade inclination angle under winter conditions. As shown in Figure 7, by analysing the resistance, jet length, cross-sectional area and SWDEI of swirl diffusers at different blade angles, an adjustment of the blade angle was clearly directly affecting the cross-sectional area and jet length of the diffuser, which in turn influenced the indoor velocity and temperature distribution. Specifically, an increase in the blade angle can extend the jet length of the swirl diffuser, but it may also result in reduced resistance and cross-sectional area. Therefore, a comprehensive SWDEI needs to be proposed and analysed to balance these different performance metrics. This is achieved through analysis of the collected data. The SWDEI reached the optimum value for meeting the requirements of the swirl diffuser when the blade inclination angle was 65°, and the resistance was maintained at a low level while the jet length and cross-sectional area were ensured to be greater than those of the traditional swirl diffuser. As shown in Figure 8, compared with those of the traditional swirl diffuser, when the number of blades was varied, the resistance and SWDEI were reduced by 62.2% and 74.7%, respectively, and the jet length and cross-sectional area were increased by 7.14% and 12.03%, respectively.
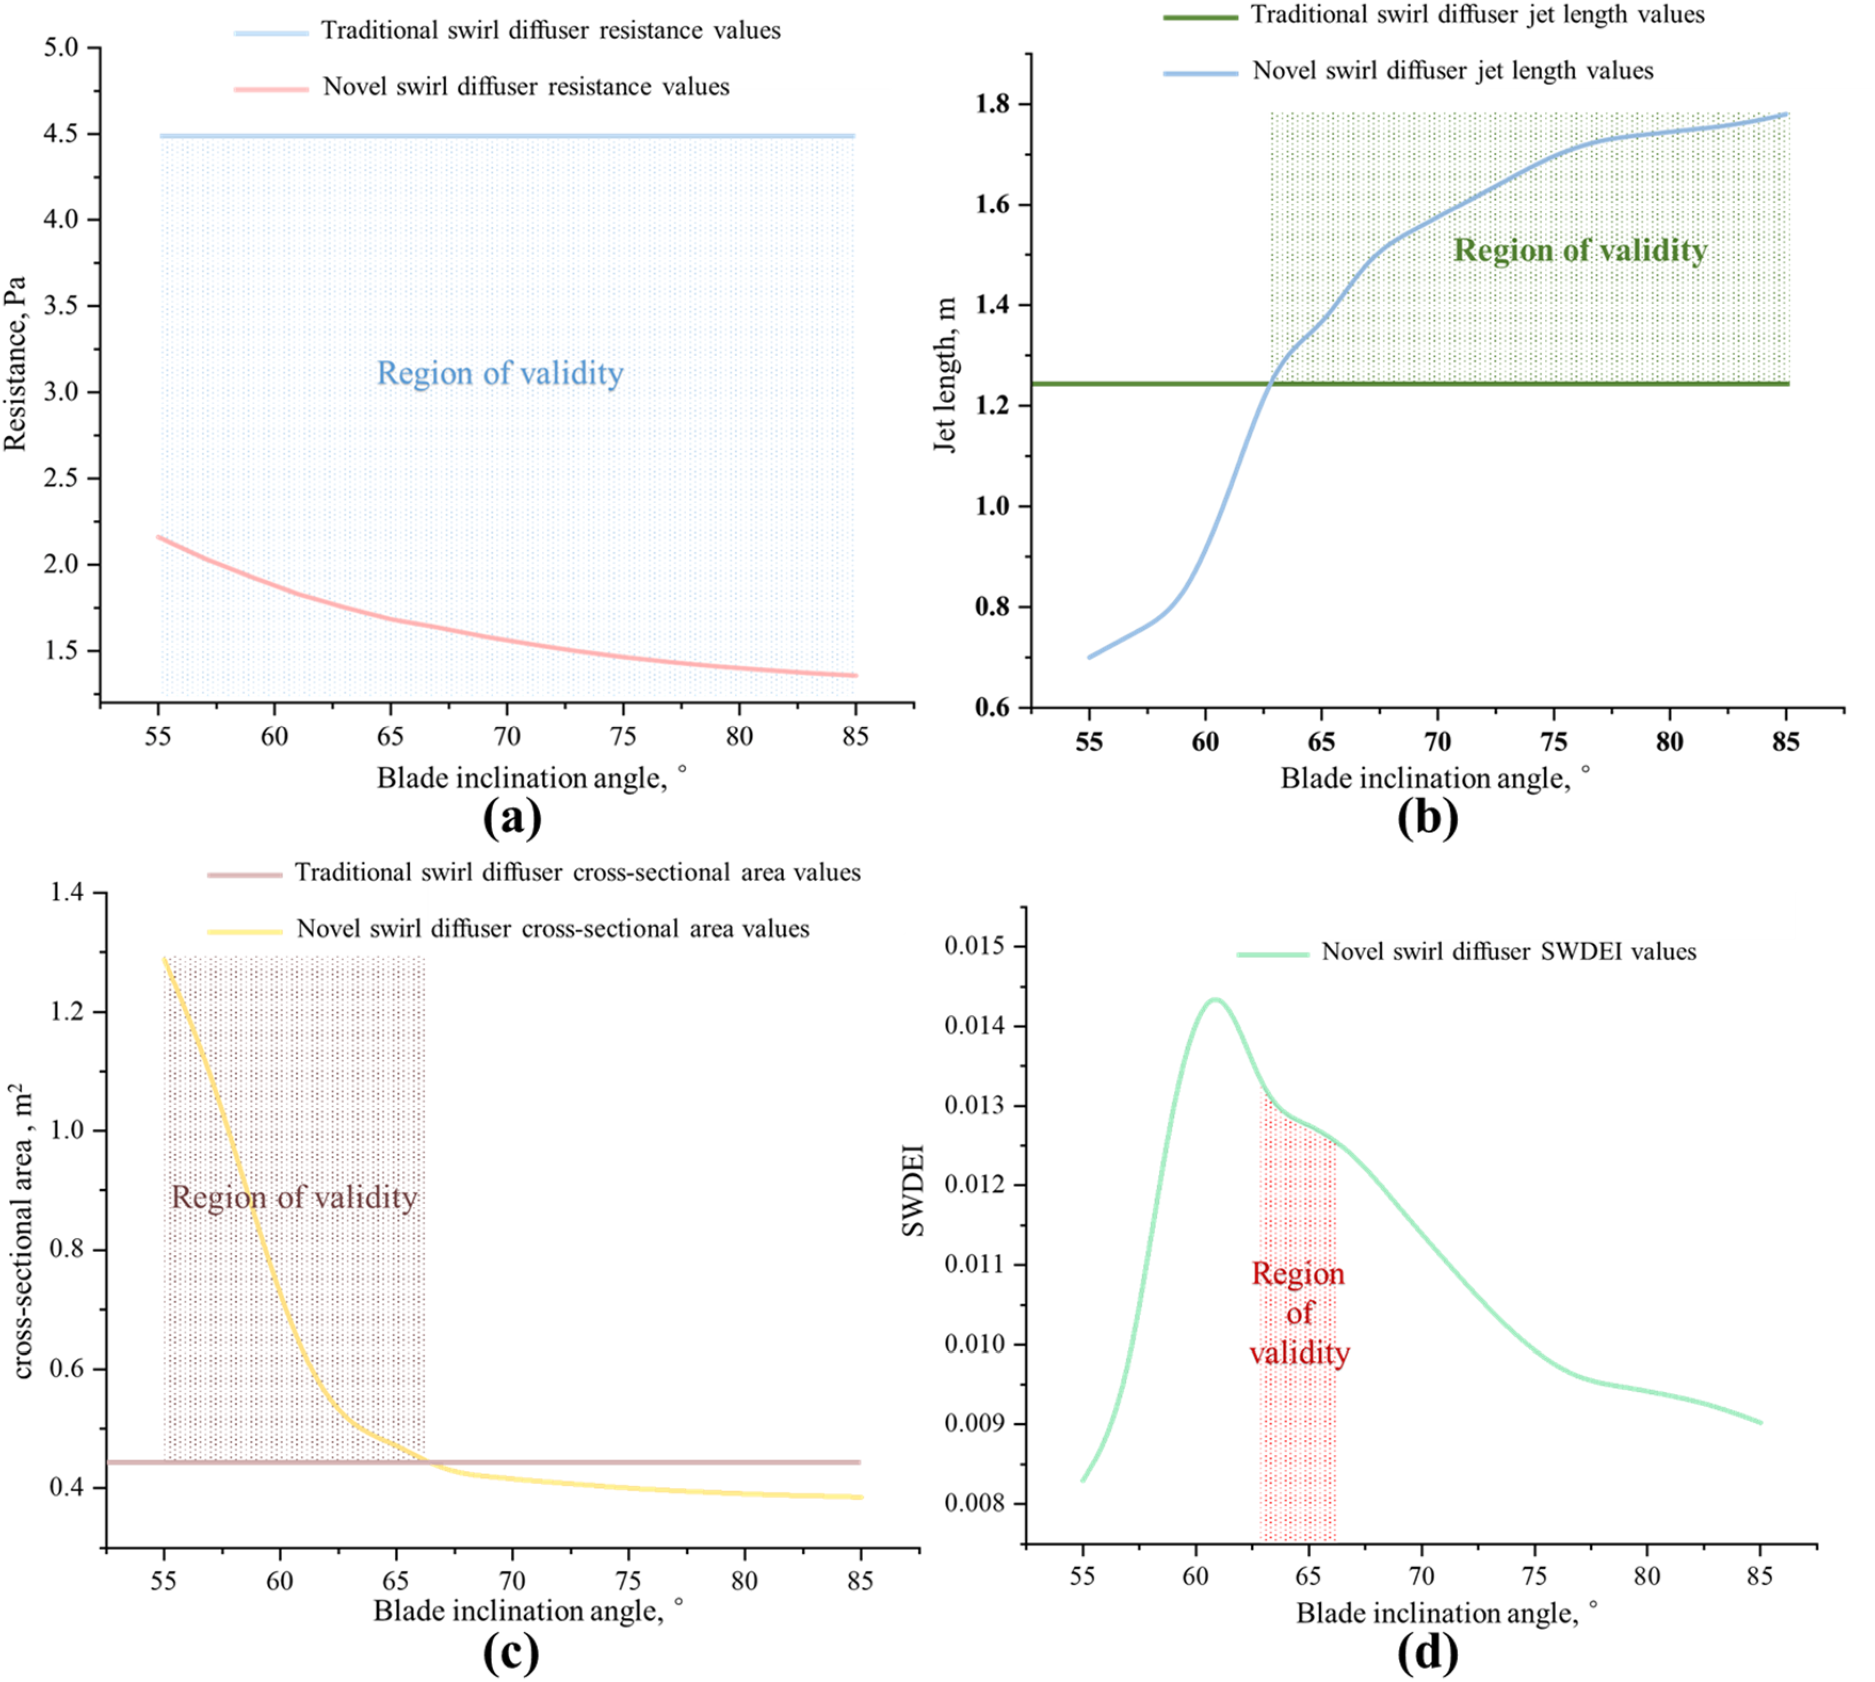
One-factor experimental analysis of the blade inclination angle: (a) resistance, (b) jet length, (c) cross-sectional area and (d) SWDEI.
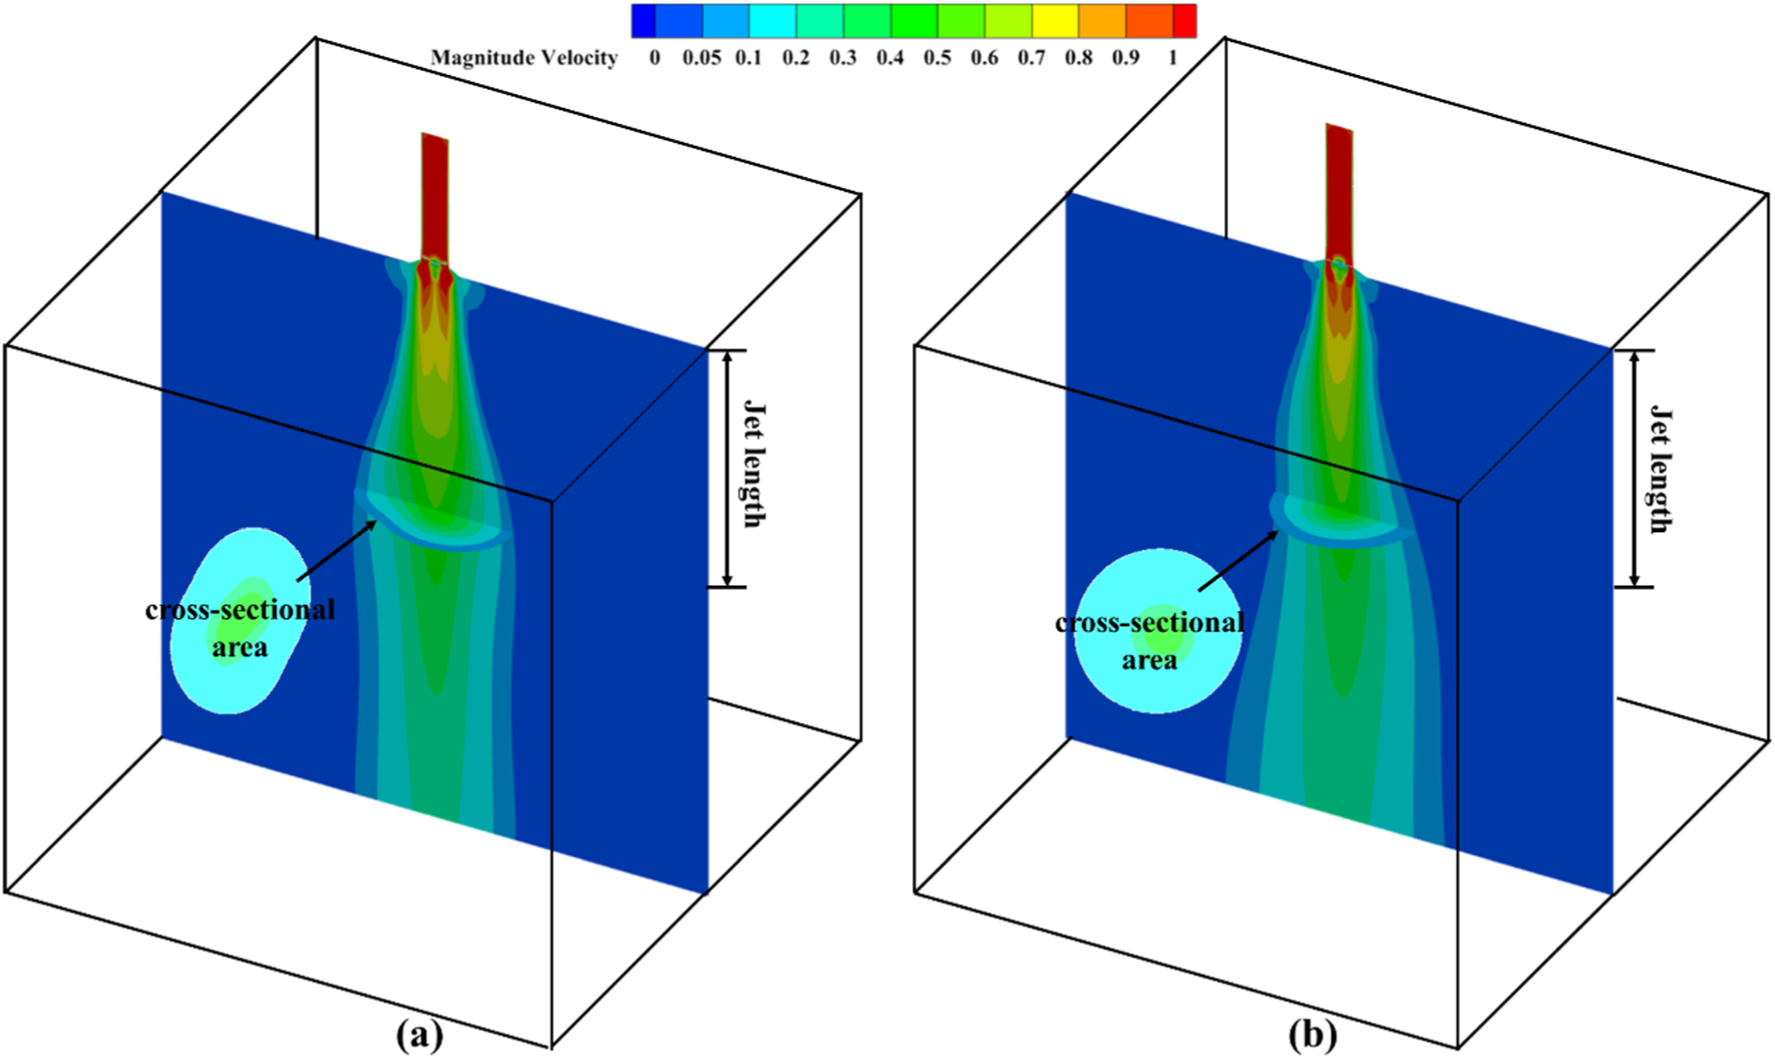
Velocity cloud on the symmetry plane of the swirl diffuser: (a) traditional and (b) novel.
Experimental validation analysis
To ensure the reliability of the study, the velocity and pressure fields of the swirl diffuser were experimentally measured. To realistically reproduce the situation in an actual ventilation duct, we conducted a full-scale experimental study at a 1:1 scale. In this study, we focused on the performance of traditional and optimized swirl diffusers at different velocities, and the results are shown in Figure 9. The x-axis displays the change in velocity, and the y-axis presents the ADEI and SWDEI of the swirl diffusers. In the velocity range of 1–3.5 m/s, the ADEI of the novel swirl diffuser under summer conditions was reduced by 58.08–66.19% compared with that of the traditional swirl diffuser, whereas the SWDEI, under winter conditions, was reduced by 73.19%–74.78%. The experimental error was calculated by equation (7), and the experimental ADEI and SWDEI obtained for both the novel and traditional swirl diffusers were found to be in good agreement with the ADEI and SWDEI values calculated via numerical simulation, providing further evidence of the superior performance of the novel swirl diffuser. Our results provide solid experimental support for our research and a strong basis for future ventilation system design and improvement. These experimental data can provide engineers and designers with important information on how to select and apply swirl diffusers to improve the indoor air quality and energy efficiency, thus driving technological advances in the building sector.
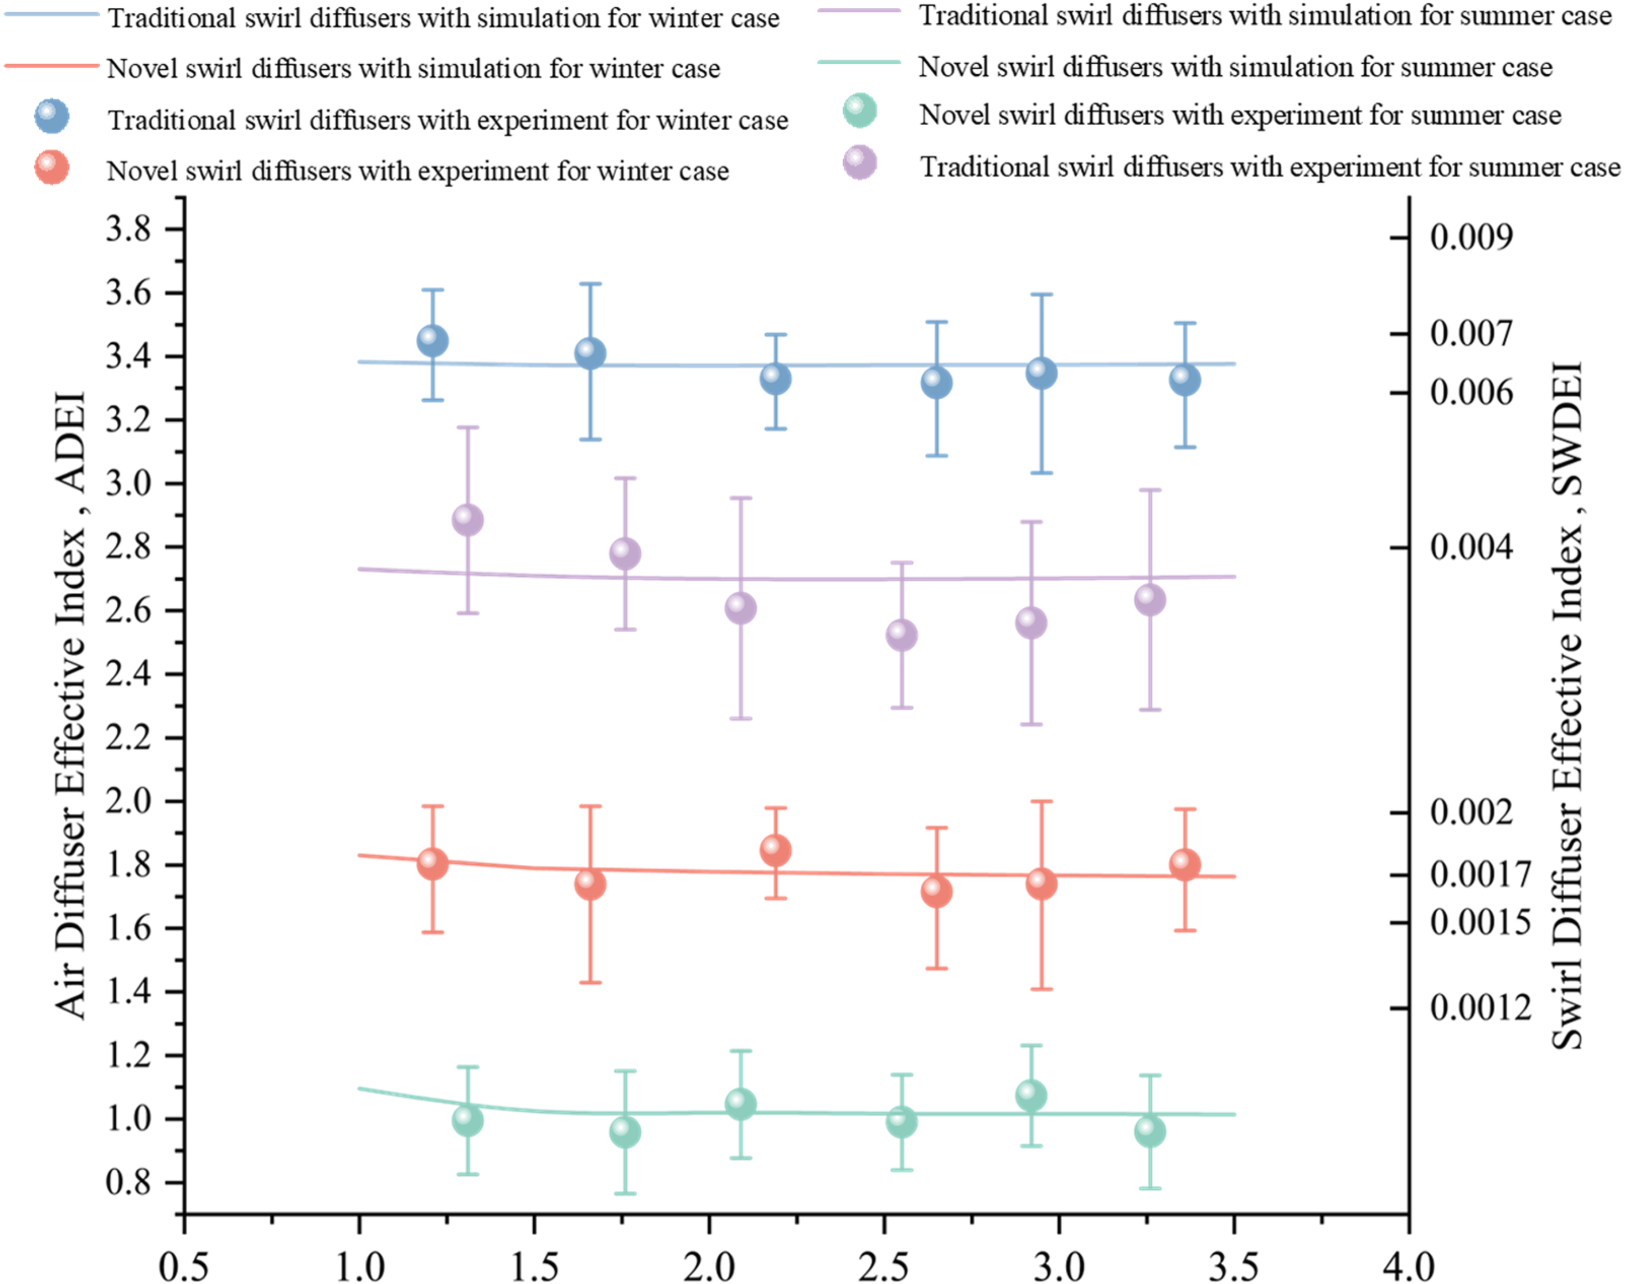
ADEI and SWDEI of the swirl diffuser under different flow velocities.
Conclusion
The focus of this study was on optimization of swirl diffusers within the HVAC domain. The research involved the application of Kriging surrogate models along with standard k–epsilon flow analysis and MIGA to perform structural optimization of swirl diffusers. The ADEI and SWDEI of swirl diffusers at various velocities were analysed. The research conclusions are as follows:
The concept of the SWDEI was introduced, and SWDEI values were used to characterize the winter energy efficiency of the swirl diffuser. A lower SWDEI is correlated with lower energy consumption of the swirl diffuser. Thus, a swirl diffuser with a lower SWDEI is a more suitable option and is recommended for use.
The optimization strategy involved Latin hypercube sampling for sampling, Kriging surrogate models for approximation and genetic algorithms for optimization. This strategy had significant advantages and led to significant optimization results. The ADEI of the swirl diffusers was ultimately reduced to 1.1, and the SWDEI of the swirl diffusers was ultimately reduced to 0.00147.
Numerical simulations and experimental verifications were carried out using the optimized structural parameters of swirl diffusers. The results of both the simulations and the experiments demonstrated that the performance of the optimized swirl diffusers was effectively improved.
Regarding engineering applications, the numerical model used in this study was based on certain ideal assumptions (such as boundary conditions) to ensure computational feasibility. When the model was extended to large and complex engineering systems, these assumptions may no longer hold, potentially affecting the accuracy and reliability of the predictions. In the future, we aim to extend the model to more complex engineering scenarios and improve the accuracy of the input parameters.
Footnotes
Authors’ contributions
Mengchao Liu: conceptualization, methodology, software and writing – original draft. Ran Gao: data curation and writing – original draft. Yujiao Zhao: visualization and investigation. Angui Li: resources and supervision.
Declaration of conflicting interests
The authors declared no potential conflicts of interest with respect to the research, authorship, and/or publication of this article.
Funding
This research received no specific grant from any funding agency in the public, commercial or not-for-profit sectors.