
Abstract
At critical transportation hubs in modern cities, the impact of volatile organic compound (VOC) pollution on public health in underground train stations is of great concern to society. However, the prevention and control of VOC pollution at underground train stations remain insufficiently explored owing to complex compositions and unclear sources. In this study, VOC samples were collected from 12 underground train stations in Chengdu to investigate their composition, pollution characteristics and influence on public health. The study detected 93 VOCs with a total VOC concentration of 80.64 ± 17.94 μg/m3. The primary sources of VOCs were organic solvent (23.31%), station emanation (13.33%), traffic emissions (10.96%), industrial emissions (21.49%) and human emanations (30.93%). Although underground train station VOCs were not found to pose non-cancer risks to the population, they contribute to low levels of cancer risks. This poses a significantly higher health risk to underground train station workers than to passengers. The findings offer a scientific foundation for developing effective pollution control strategies for VOCs at underground train stations and support the advancement of a healthy and sustainable environment for passengers.
Keywords
Introduction
According to the latest data from the International Association of Public Transportation, there are 193 cities worldwide with operational underground train systems spanning over 17,000 km, facilitating approximately 35,084 million passenger trips annually. 1 Underground train transit systems have emerged as the preferred mode of transportation for individuals owing to their significant contribution in alleviating road congestion, curbing vehicle emissions and offering commuters a swift and convenient travel alternative.2–4 However, escalating passenger volume coupled with the ventilation constraints has brought widespread public concern regarding air pollution within underground train stations.5–8
Studies on air pollution in underground train microenvironments have revolved around particulate matters,9–11 metal elements,12–14 microorganisms,15–17 polycyclic aromatic hydrocarbons (PAHs)18–20 and volatile organic compounds (VOCs).21–23 VOCs, representative of gaseous pollutants, are a key factor impacting air quality in underground train stations, originating from various sources and possessing a complex composition. An extensive assessment has categorised VOCs into carcinogens, teratogens and mutagens.24,25 In addition, studies have indicated that prolonged exposure of commuters to VOCs could heighten the likelihood of suffering from cardiovascular and respiratory diseases and endocrine and central nervous system disorders.26–30 These findings have raised considerable concerns regarding the health risks of VOCs on passengers and workers in microenvironments of underground train stations.
Most studies on VOCs in microenvironments of underground train stations have focused on specific substances. For example, BTEX (benzene, toluene, ethylbenzene, xylene) has been classified by the International Agency for Research on Cancer (IARC) as a group 1 and group 2B carcinogen.31,32 BTEX is not only neurotoxic and genotoxic, 33 its long-term exposure may also cause damage to multiple systems, including the blood, central nervous, respiratory, reproductive and immune systems.34–40 However, focusing solely on these specific substances does not fully capture the overall pollution characteristics of VOCs in microenvironments of underground train stations, therefore, a comprehensive compositional profile of VOCs is needed.
The underground train system composes of stations, carriages and tunnels. The train carriages are relatively small and rely mainly on ventilation and air-conditioning systems and air exchange with platforms at arrival stops to reduce air pollution. Extensive studies have been conducted on VOCs in carriages.21,28,41,42 There are very few people other than maintenance workers in tunnels, and the piston winds generated by trains would help dilute pollutant concentrations. In contrast, underground train stations, which are mostly underground and enclosed, require mechanical ventilation to optimise air quality. 43 In addition, underground train station entrances are exposed to the external atmospheric environment, leading to more complex types and sources of VOCs. In underground train stations, VOC sources are categorised as indoor or outdoor. Indoor sources include organic solvent emissions, 44 and station 45 and human emanations. 46 The use of volatile materials in station decoration and renovation, such as paints, varnishes and wallpapers, as well as the respiration and clothing emissions from passengers, all contribute to the VOC levels. Outdoor sources are influenced by the ambient atmosphere and urban background, including traffic 47 and industrial emissions21,48 and natural sources. 49 Vehicle exhaust, industrial waste gases, plant emissions and atmospheric background concentrations are amongst the contributors. These VOCs infiltrate the air of a station when a heating, ventilation and air conditioning (HVAC) system exchanges air with the outside environment, thereby polluting the air within the underground train station.50,51 Therefore, investigating the composition and pollution characteristics of VOCs in underground train stations is of great practical importance.
Chengdu is a populous city in southwest China with a population of 21.192 million. The Chengdu underground train station, with 12 operational lines, 518 km of mileage and 373 stations, has been a pivotal transportation network since its inception in 2010. By 2022, it has served 1.56 billion passengers. Therefore, this study selected the Chengdu underground train station as an example and collected VOC samples using TENAX-TA sampling tubes. VOC composition spectra and concentration levels were analysed using gas chromatography-mass spectrometry (GC-MS). Furthermore, the primary sources and contributions of VOCs were resolved using positive matrix factorisation (PMF) modelling. Health risks to passengers (adults and children) and workers (station attendants and security checkers) were evaluated using the health risk modelling recommended by the US Environmental Protection Agency (US EPA). 52
Methodology
Sampling site
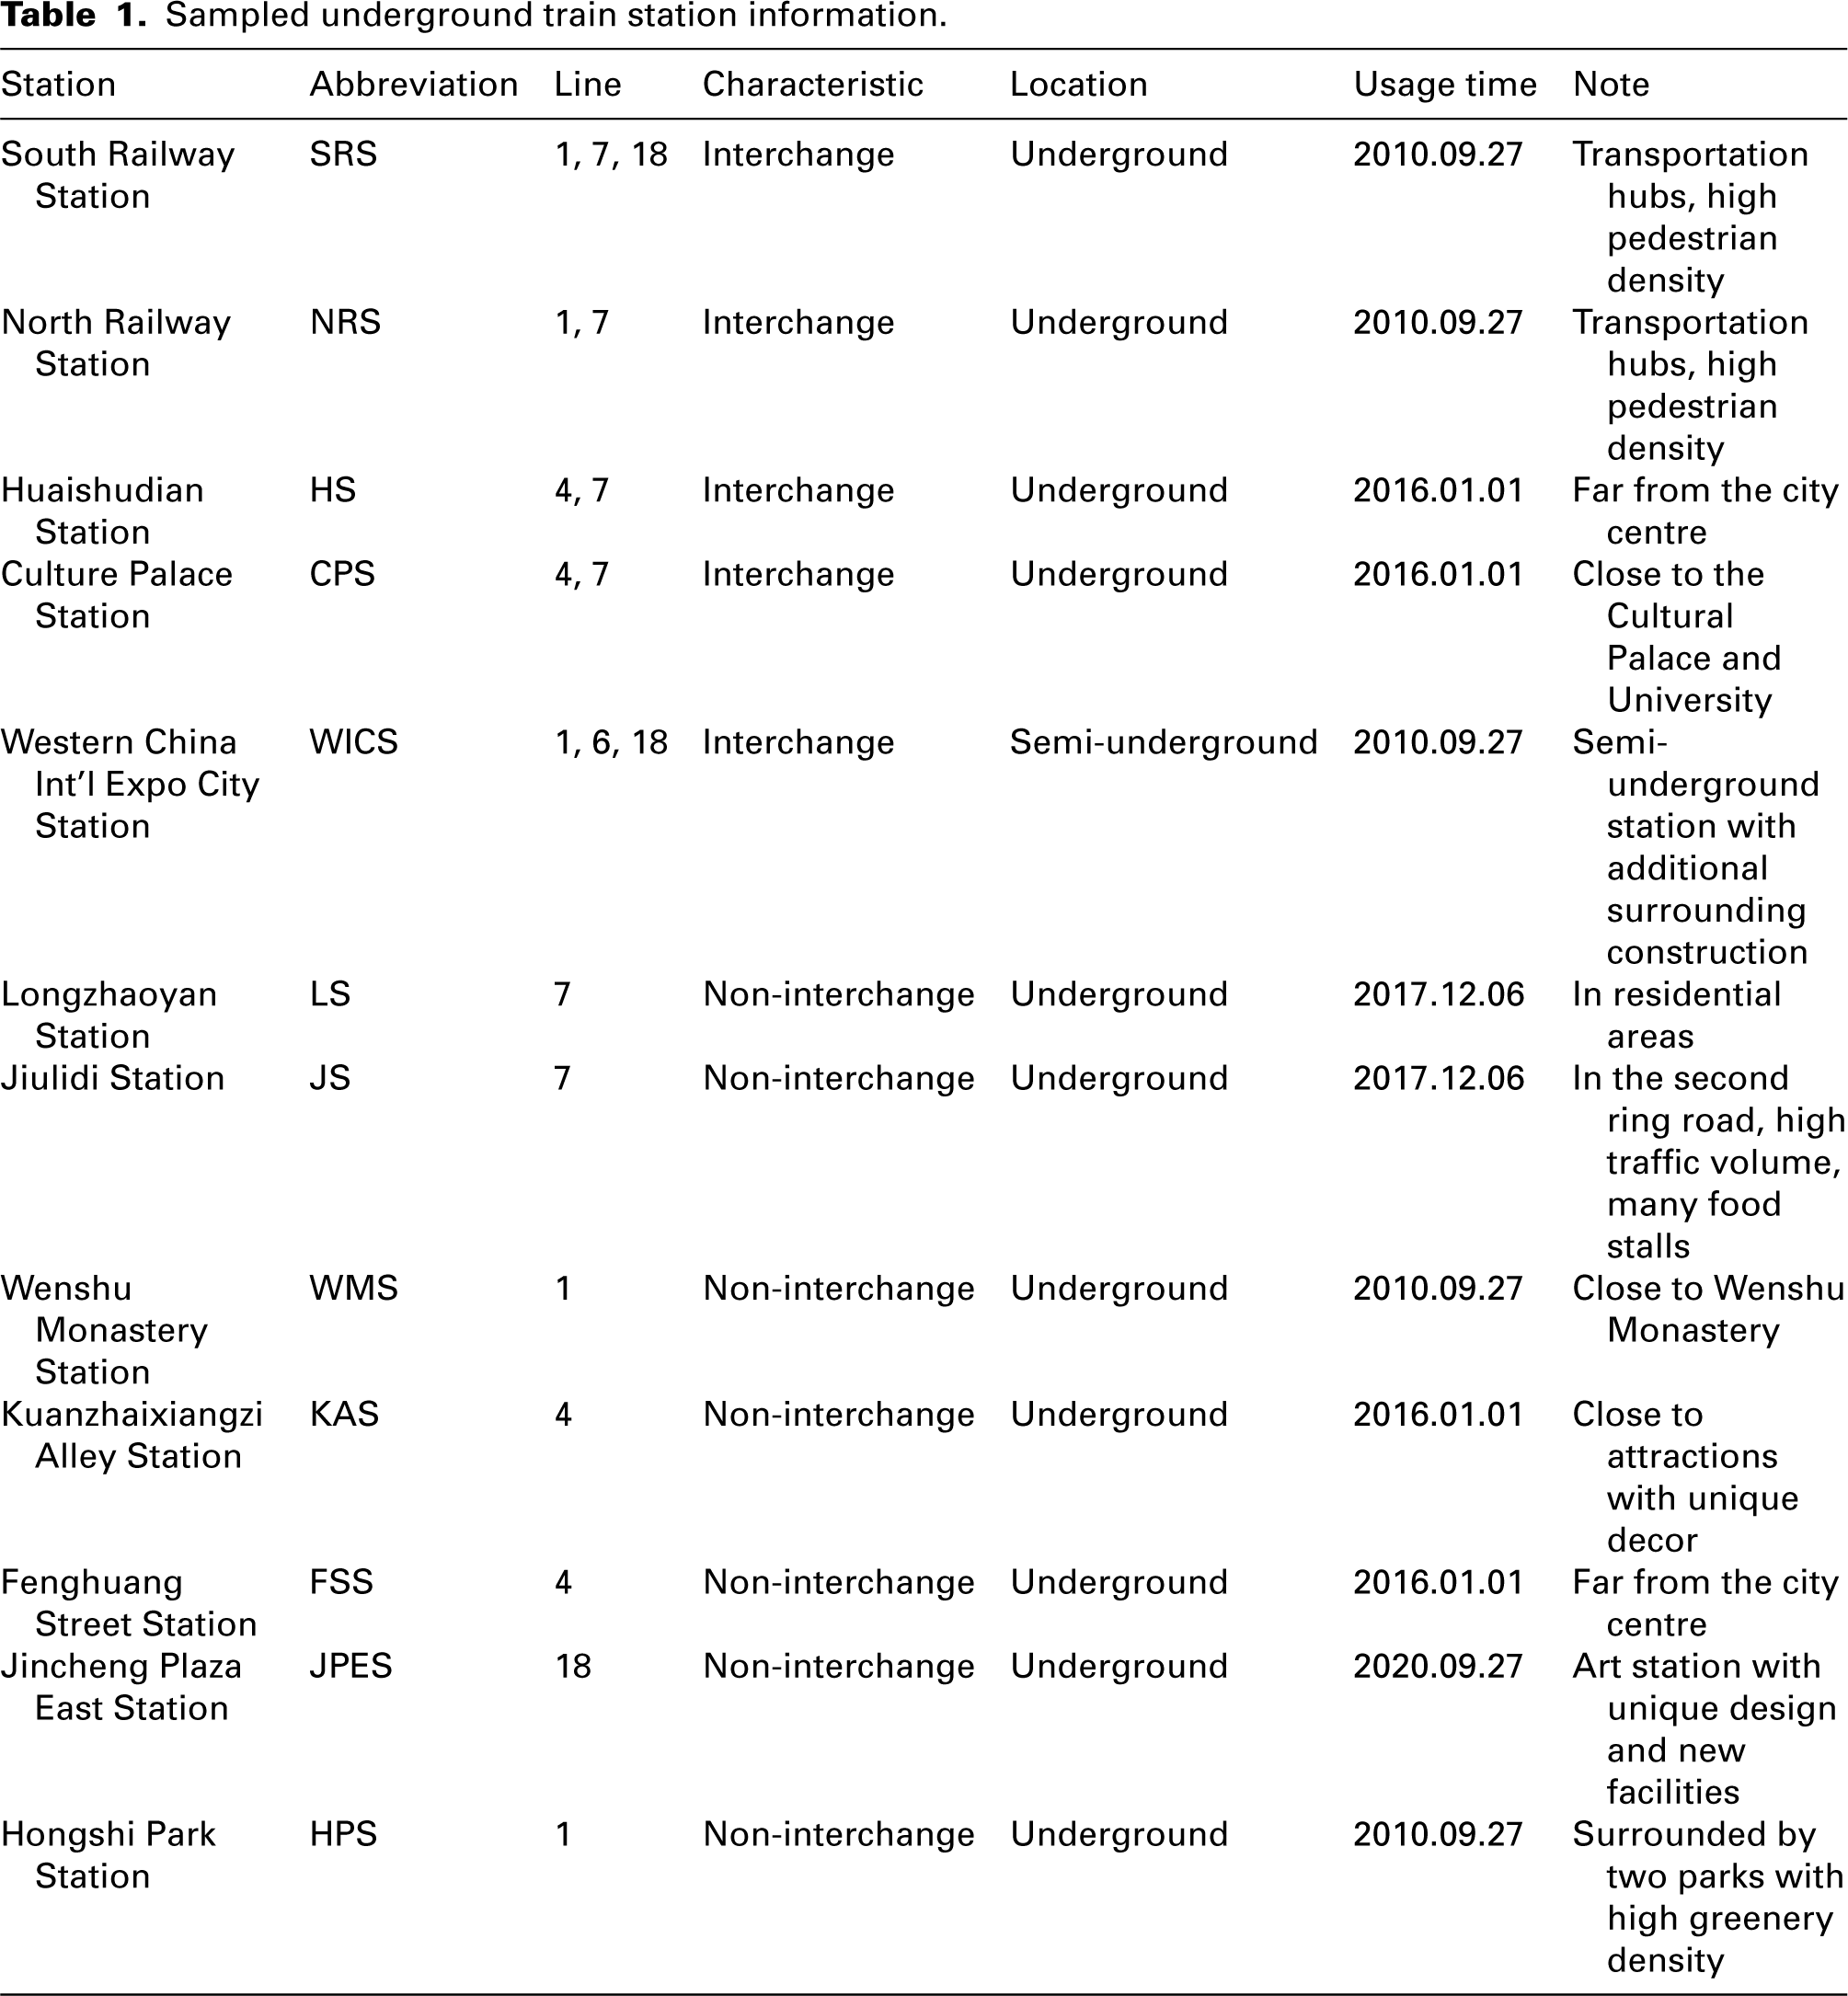
This study examined 12 representative underground train stations in Chengdu, including five interchanges and seven non-interchanges. The interchange stations included the South Railway (SRS), North Railway (NRS), Huaishudian (HS), Culture Palace (CPS) and Western China International Expo City Stations (WICS), whereas the remainder were non-interchange stations. The 12 selected underground train stations are located on five major lines in Chengdu: Lines 1, 4, 6, 7 and 18. Detailed information for each station is presented in Table 1. The sampling sites are shown in Figure 1.
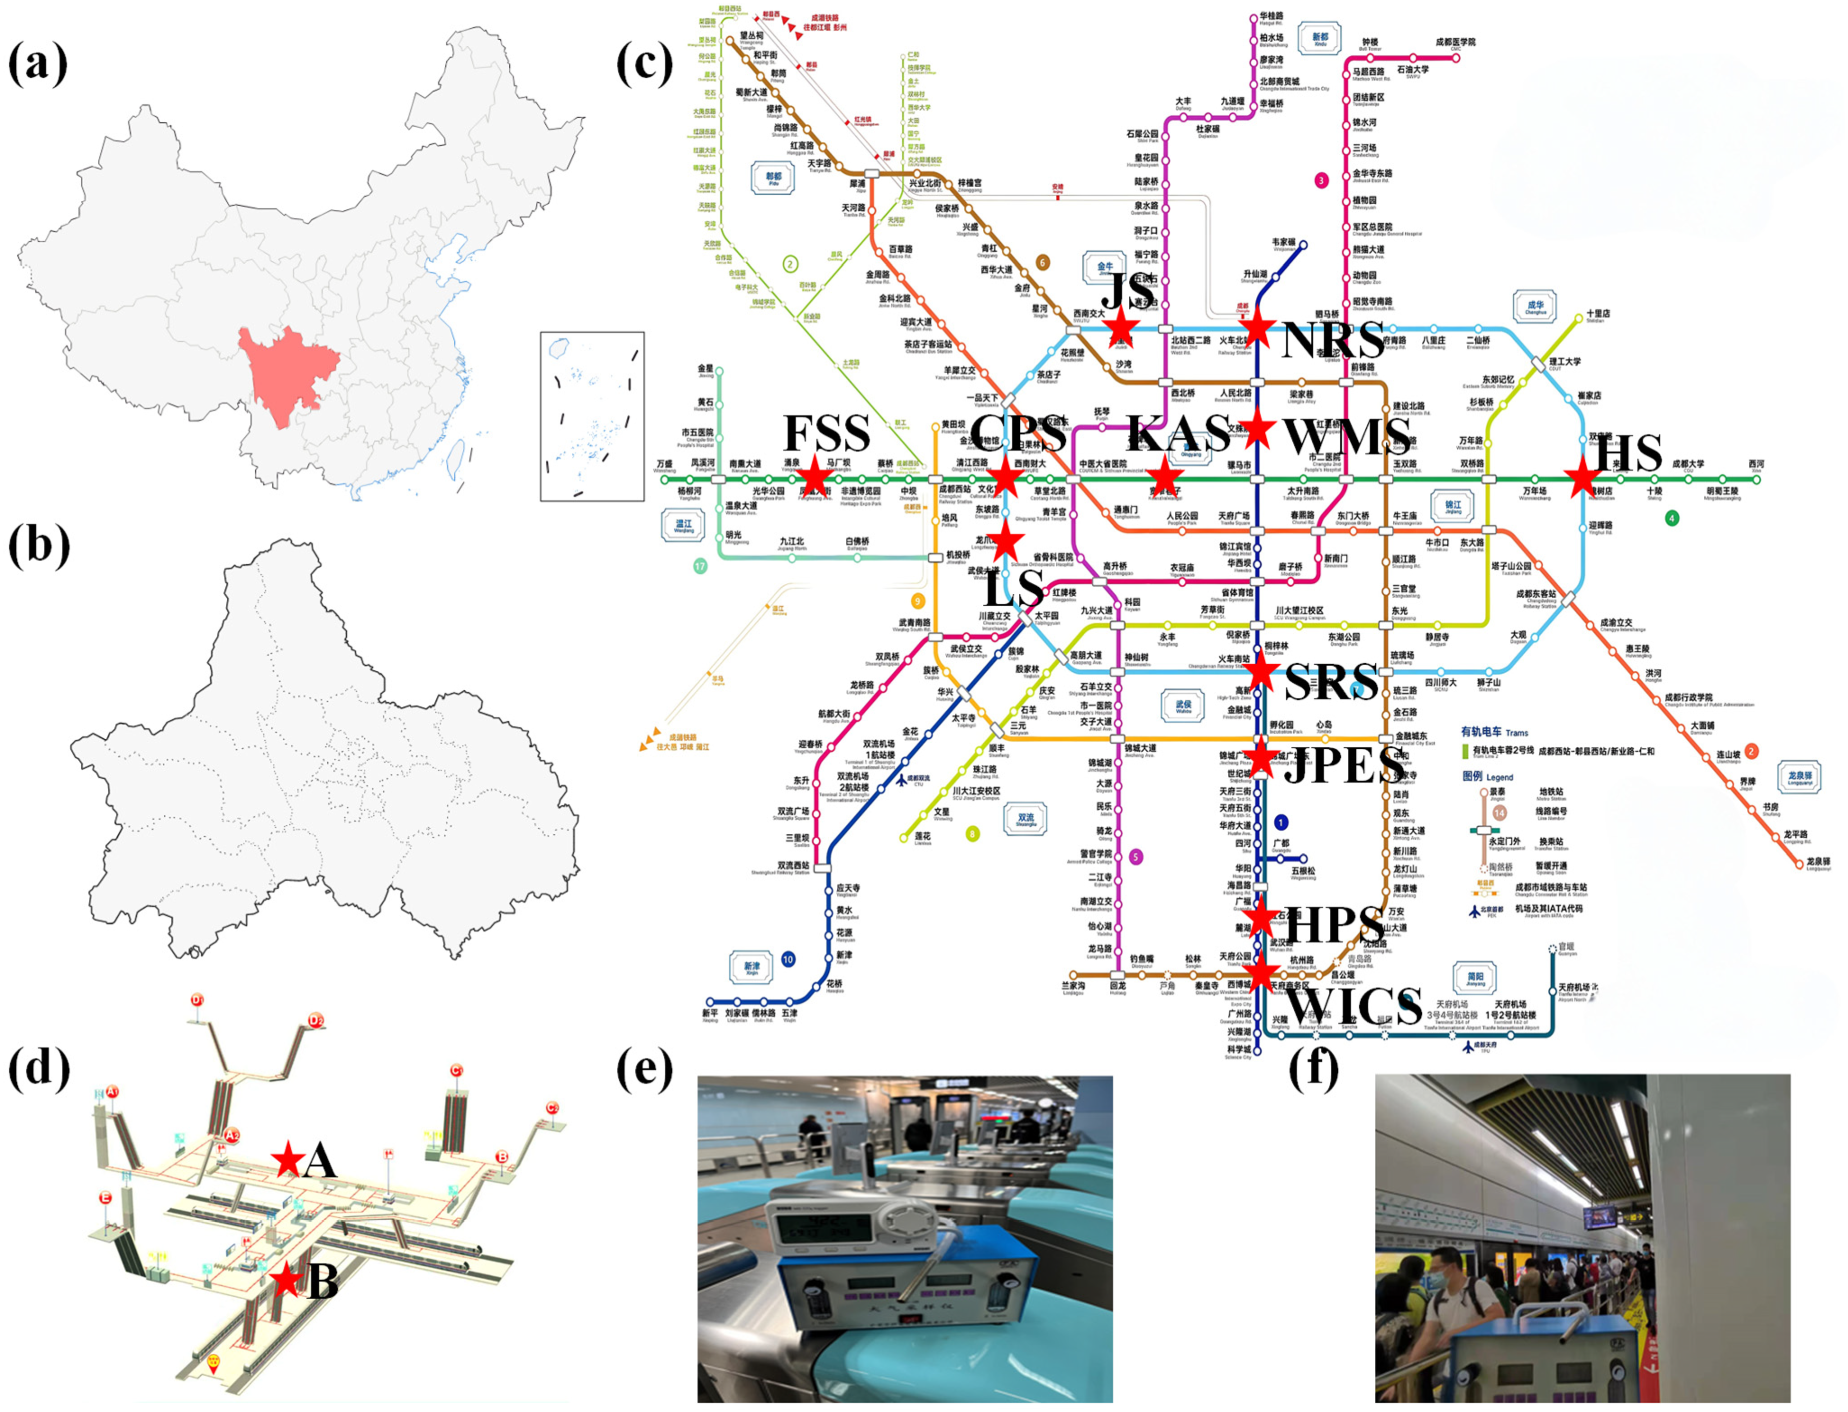
Schematic diagram of sampling locations: (a) Sichuan province, (b) Chengdu city, (c) 12 underground train stations and (d) schematic location of sampling in underground train stations (e.g. Culture Palace Station). Point A is a schematic of the sampling location in the underground train station halls. Point B is a schematic of the sampling location on the underground train station platforms. (d) Actual sampling in the underground train station halls and (e) actual sampling on the underground train station platforms.
Sampled underground train station information.
Sample collection
Sampling for this study was conducted from July to August 2022 during the peak outdoor temperature period in Chengdu, which is beneficial for VOC volatilisation. The sampling dates and outdoor temperatures are listed in Table 2. Sampling across 12 underground train stations was conducted over three distinct periods. The first period spanned 4–15 July 2022, the second 25 July–5 August 2022 and the third 15–26 August 2022. Within each period, samples were collected at three different times: during the morning (08:00–09:00), evening (18:00–19:00) and the off-peak periods (14:00–15:00). Samples were collected simultaneously from both the station hall and platform levels. A total of 216 samples were collected.
Sampling date and outdoor temperature.

NRS: North Railway Station; JS: Jiulidi Station; SRS: South Railway Station; JPES: Jincheng Plaza East Station; HPS: Hongshi Park Station; WICS: Western China Int'l Expo City Station; WMS: Wenshu Monastery Station: ; KAS: Kuanzhaixiangzi Alley Station; CPS: Culture Palace Station; LS: Longzhaoyan Station; HS: Huaishudian Station; FSS: Fenghuang Street Station.
The sampling equipment included sampling catheters, a constant-flow gas sampler (Model QC-2B, Beijing Institute of Labour Protection) and sorbent tubes (TENAX-TA sampling tubes, Markes, UK). The sampling line was made of low-adsorption polytetrafluoroethylene (PTFE) and the outlet was connected to the sampling tube and constant-flow gas sampler. The calibration parameters of the constant-flow gas sampler were as follows: operating temperature 0–40°C, flow-rate range 0–0.12 m3/h, error ≤ ±5% and timing range 1–99 min. Before collecting the samples, the sampling pump was activated and operated for approximately 30 s, with the flow rate was set to 0.018 m3/h, to ensure that non-compartmentalised gases were discharged from the sampling conduit and the gas was discharged to begin formal sampling. The VOC samples were collected continuously at a flow rate of 0.018 m3/h for 30 min with a sampling volume of 0.009 m3. The sampling point refers to the relevant requirements in the ‘Indoor Air Quality Standard’ (GB/T 18883-2022). 53 During sampling at the station hall, the sampling point was positioned at the ticket gate at a height of approximately 1.5 m. When sampling at the platform, the sampling point was situated at the centre of the screen doors on both sides of the platform, also at a height of approximately 1.5 m. The sampling conditions are illustrated in Figure 1.
Sample processing and analysis
The adsorbed VOCs were detached from the TENAX-TA sampling tubes using a thermal desorption (TD) (TD-100, Markes, Inc., UK) separated, and identified using a GC-MS (Agilent 7890B/5975B, USA). The TD process involved two stages: in stage 1, the initial temperature was set at 40°C for 3 min, followed by a gradual increase to 160°C over 8 min and then was maintained for 2 min. In stage 2, the temperature was further increased to 240°C and was maintained for 4 min. Nitrogen was used as the carrier gas during TD at a flow rate of 0.0033 m3/h. The substances were separated by chromatograph and identified using a mass spectrometer that scanned the full range at a frequency of 2.5 Hz, and the resulting spectra were compared with the atomic emission spectra to confirm the type of compounds being measured.
Quality assurance/quality control
Each collected sample was sealed and wrapped with aluminium foil. To mitigate the influence of the sampling tubes and potential contamination during the analysis process, two unused sampling tubes were employed as blanks for each distinct period, totalling six blank samples.
Prior to each sampling period, the TENAX-TA sampling tubes underwent standardised pre-treatment to ensure consistency. Firstly, the tubes were cleaned with methanol to remove any residual contaminants. Subsequently, they were placed in a TD and subjected to high-temperature treatment at 250–300°C, with high-purity nitrogen or helium flow to thoroughly eliminate VOCs. Finally, the treated sampling tubes were rapidly cooled in a clean environment and immediately sealed at both ends with clean silicone or PTFE caps to prevent contamination.
An external standard was used in combination with unknown samples to calculate target VOC concentrations in the samples. Mixed standard VOC solutions containing eight compounds (benzene, ethylbenzene, toluene, P/M-xylene, ethyl acetate, styrene, O-xylene and undecane) were quantified separately. A calibration curve including 0.02, 0.05, 0.08, 0.1, 0.2, 0.5 and 0.8 μg standards was obtained, and R2 was >0.99. Other semi-quantitative analyses of VOCs were based on their response of toluene. 54 The detection limit was approximately 1 ng for each chemical compound (signal-to-noise ratio S/N = 3/1), which indicates the limit of detection was 0.2 μg/m3 with 0.005 m3 sample volume. Two underground train stations were randomly selected for parallel sampling to ensure reproducibility of the experimental results. At each station, three samples were simultaneously collected from the same location, resulting in 36 parallel samples. The sampling results indicated that the average relative standard deviation was <15%, confirming that the experiment exhibited satisfactory repeatability.
Detection rate
To ensure data validity, substances with peak times of <7 min were deleted from the data, and those with a match of >75% were selected for quantitative analysis. Equation (1) is the method for calculating the detection rate (DR) as shown below:

Positive matrix factorisation
PMF, a widely utilised source-resolution receptor model, was introduced by Paatero and Tapper in 1993 as a source-resolution method that does not rely on a source spectrum. 55 It is a source-resolution model recommended by the US EPA. 56 The source resolution of VOCs was determined using the PMF 5.0 receptor model with equations (2) and (3). 57 The source resolution was modelled by factor analysis through the uncertainty of each data point, and the least-squares method was used to quantitatively determine pollution sources and contributions. By imposing non-negative constraints on loadings and scores of each factor, this model ensures more accurate results than other methods, which may yield negative contribution rates.
PMF is a multivariate statistical analysis model, the core of which is to distinguish the different pollution sources and contributions in the mixing model, considering that the concentration of a sample can be composed of factor contributions, distributions and residuals, which can be expressed as equation (2). When the observed concentration was lower than the method detection limit, the uncertainty was calculated using equation (3). If the observed concentration exceeds the method detection limit, equation (4) is used:


The concentration of each VOC substance along with its corresponding uncertainty data was inputted into US EPA PMF 5.0 for analysis. The number of different factors (3–8) was set, and the robust mode was used with 20 runs to minimise the Q value. This ensured that the interval of the residual matrix E value fell between −3 and 3, indicative of a normal distribution, to guarantee a good correlation between the simulation results and observations.
Value of the exposure parameter.
aThe ED was estimated according to the actual situation. The ED for children was taken from birth to adulthood. The ED for adults was taken from adulthood to retirement.
Health risk assessment
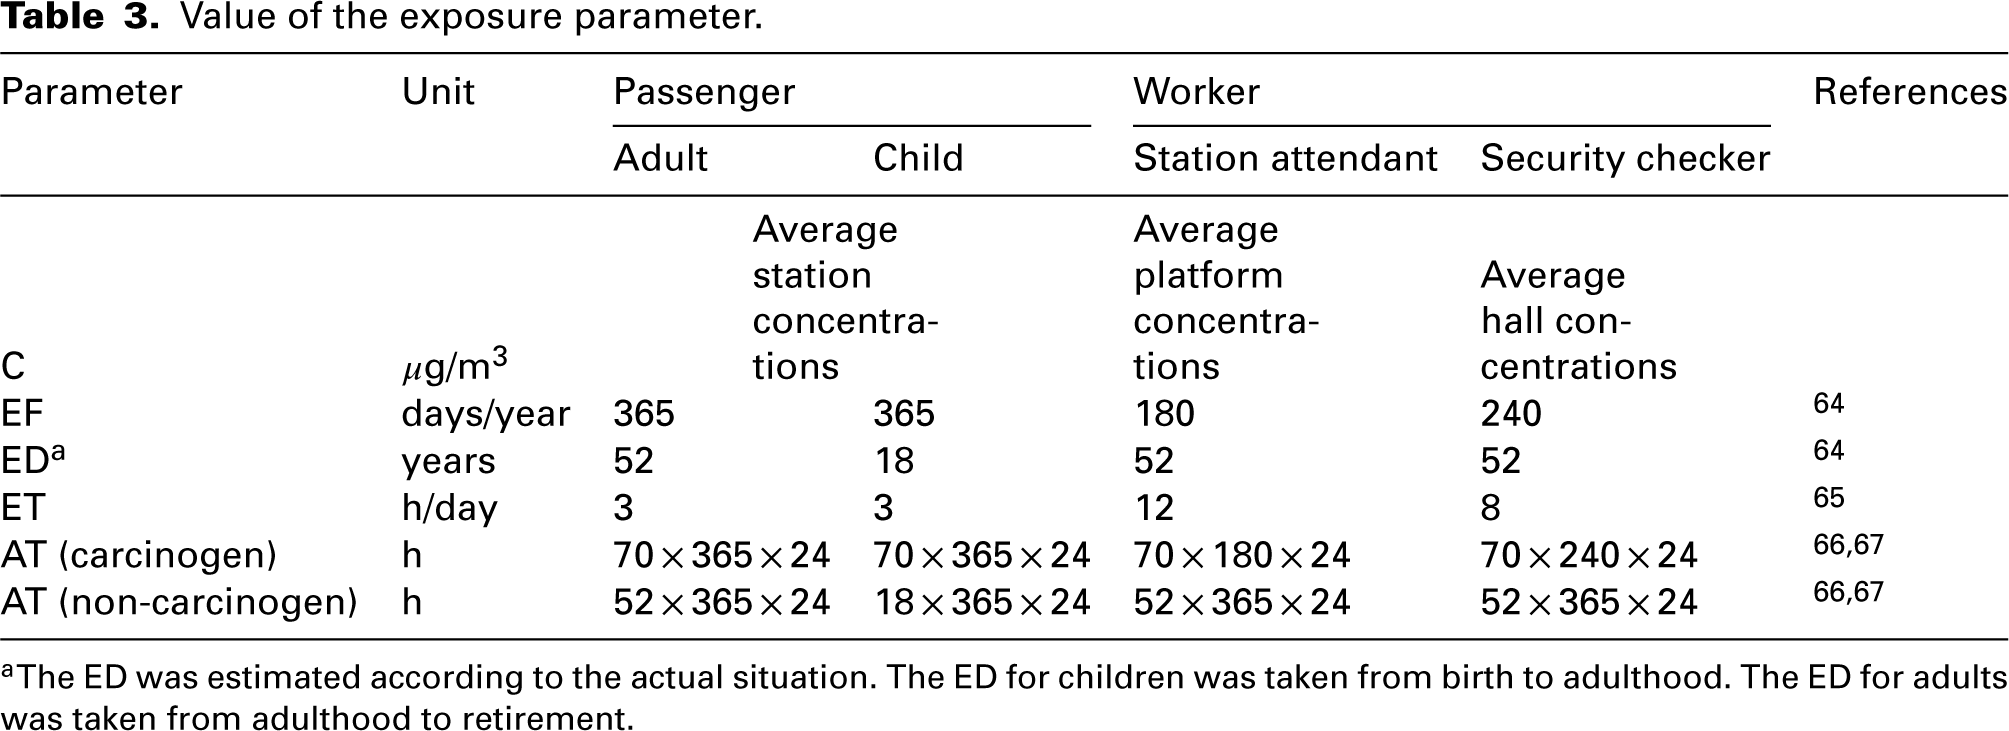
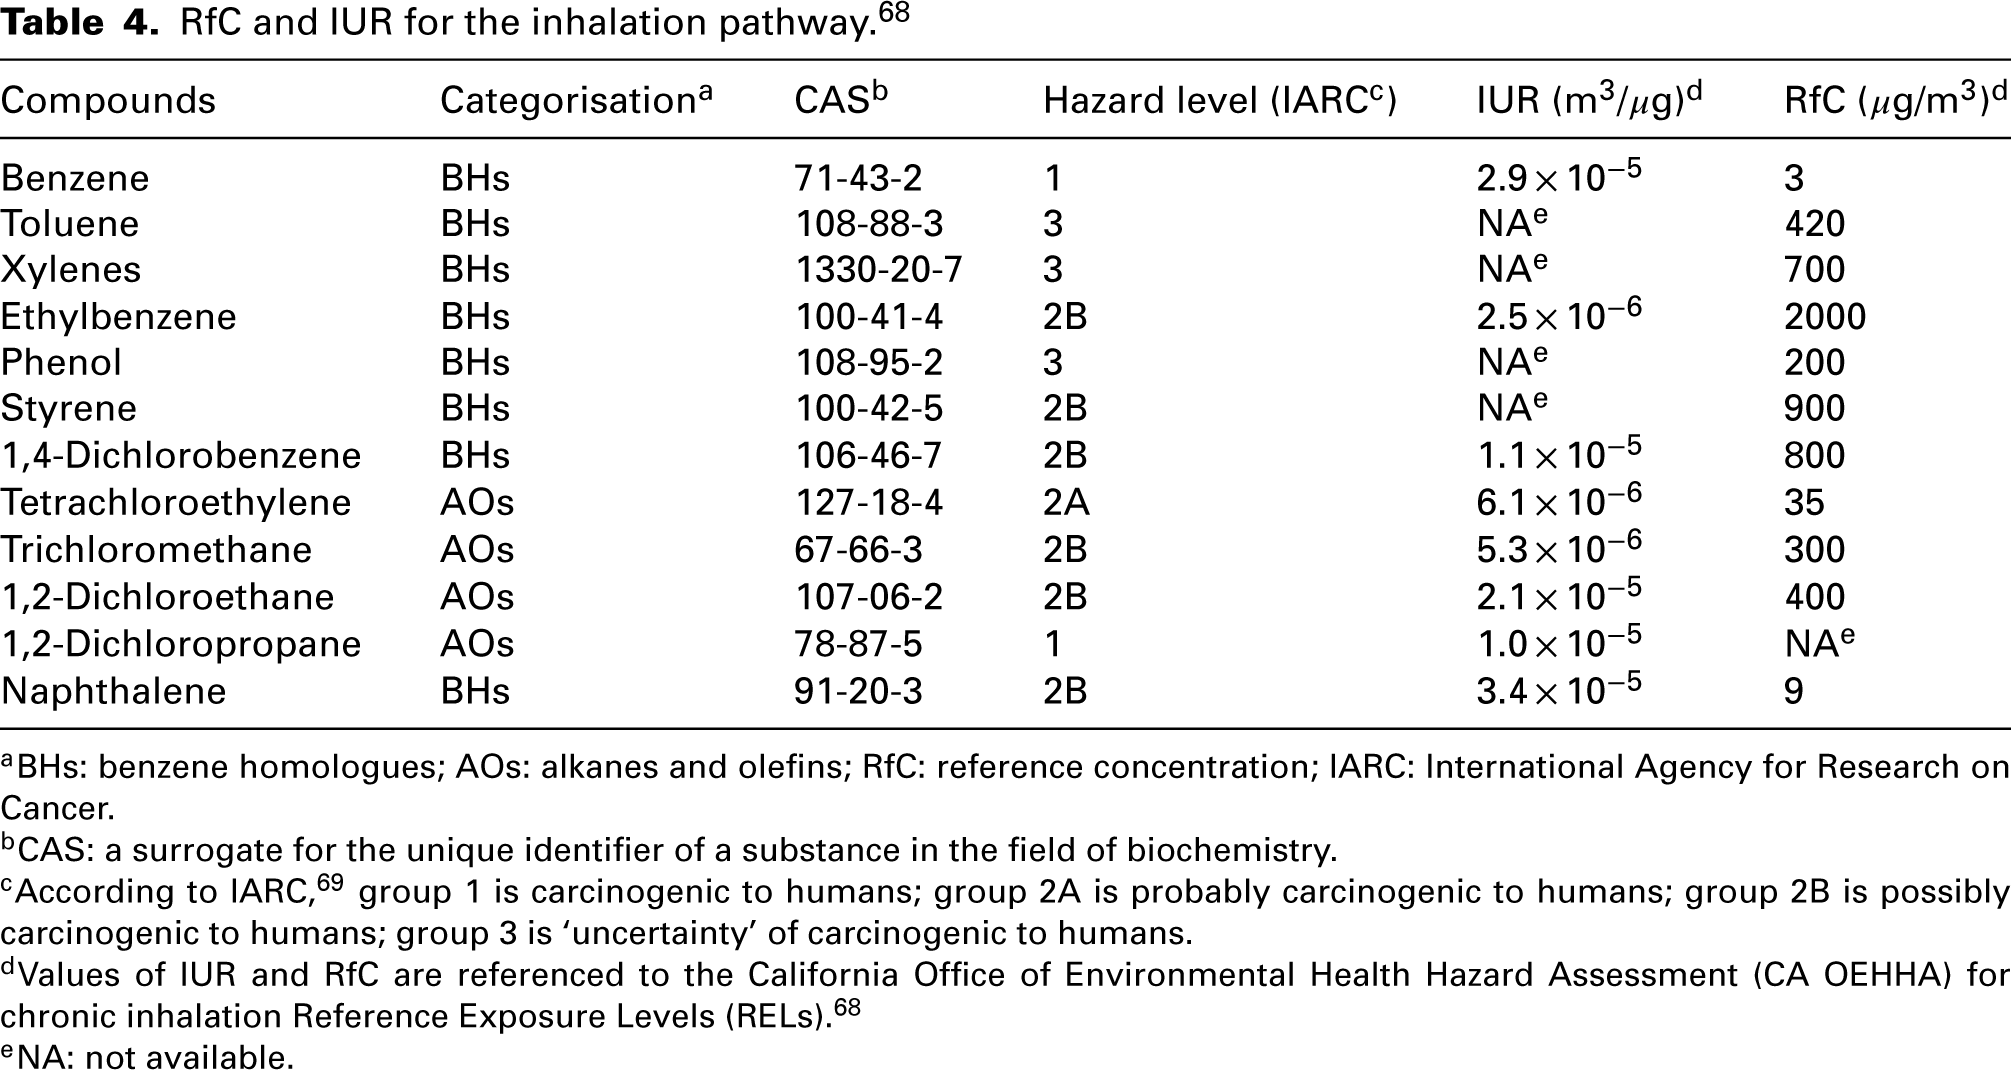
The non-cancer and cancer risks due to VOCs in underground train stations were assessed by making the following assumptions: (1) the potentially exposed populations are passengers and underground train workers, and (2) the route of exposure is direct inhalation of VOCs through the mouth and nose. Calculation of the exposure concentration is the first step in health risk assessment as shown in equation (5). The non-cancer risk for each VOC was calculated as the hazard entropy (HQ) as shown in equation (6). The hazard index (HI) is the sum of all HQ values used to determine the total non-cancer risk (equation (7)). Cancer risk (CR), defined as the incremental lifetime probability of developing cancer owing to exposure to a potential carcinogen, was calculated using equation (8). The total cancer risk (TCR) was the sum of potential cancer risks consisting of more than one factor (equation (9)).52,58,59 When HQ ≤ 1 and HI ≤ 1, the level of non-cancer risk was relatively low and can be ignored. When HQ > 1 or HI > 1, there is non-cancer risk.60,61 When CR or TCR ≤ 10−6, the VOC is considered to have no cancer risk or the risk is negligible. When 10−6 < CR or TCR ≤ 10−4, the VOC has a potential cancer risk. When CR or TCR > 10−4, it indicates a high cancer risk.62,63 Exposure parameter values are shown in Table 3. Inhalation unit risk (IUR) and reference concentration (RfC) values are listed in Table 4.


RfC and IUR for the inhalation pathway. 68
aBHs: benzene homologues; AOs: alkanes and olefins; RfC: reference concentration; IARC: International Agency for Research on Cancer.
bCAS: a surrogate for the unique identifier of a substance in the field of biochemistry.
cAccording to IARC, 69 group 1 is carcinogenic to humans; group 2A is probably carcinogenic to humans; group 2B is possibly carcinogenic to humans; group 3 is ‘uncertainty’ of carcinogenic to humans.
dValues of IUR and RfC are referenced to the California Office of Environmental Health Hazard Assessment (CA OEHHA) for chronic inhalation Reference Exposure Levels (RELs). 68
eNA: not available.
Results
VOC compositional profiles and DRs
Overall VOC composition profiles and DRs in underground train stations.
VOC samples were collected from 12 underground train stations in Chengdu and were analysed using GC-MS to establish a VOC composition profile, as illustrated in Figure 2. A total of 93 individual VOCs were detected. Based on their functional groups, these compounds were categorised into four groups: benzene homologues (BHs); alkanes and olefins (AOs); aldehydes, ketones, alcohol and esters (AKAEs), and others. AOs were the most abundant, comprising 34 individual VOCs, followed by 33 BHs; and the least were others, totalling only 10.
VOC compositional profiles and DRs in underground train stations.
According to equation (1), the DR of each VOC in the underground train stations was calculated. Based on DR, the VOC was categorised into six groups of <50%, 50–60%, 60–70%, 70–80%, 80–90% and >90%. Each group contained 58, 5, 3, 4, 3 and 20 VOCs, respectively. Amongst the VOCs with high DR (≥80%), a total of 23 VOCs were included. The proportions of BHs, AOs, AKAEs and others were 60.87%, 26.08%, 4.35% and 8.70%, respectively.
VOC compositional profiles and DRs in the halls and on the platforms.
Eighty and eighty-two individual VOCs were detected in the halls and platforms, respectively (Figure 3(a) and (b)). The VOC compositional profiles and DRs are shown in Figure 3(c) to (n). In the halls, the number of VOCs for BHs, AOs, AKAEs and others were 26, 30, 17 and 7, respectively. In the different DR intervals, there were 42 VOCs with <50%, nine with 50–60%, two with 60–70%, three with 70–80%, five with 80–90% and 19 with >90% (Figure 3(a)). Twenty-four individual VOCs had DRs ≥ 80%, amongst which the proportions of BHs, AOs, AKAEs and others were 54.17%, 29.17%, 8.33% and 8.33%. On the platforms, the number of VOCs for BHs, AOs, AKAEs and others were 28, 31, 13 and 10, respectively. The DR of VOCs were concentrated in <50% (49 VOCs) and >90% (21 VOCs). There were 25 VOCs with a DR ≥ 80%, amongst which the proportions of BHs, AOs, AKAEs and others were 64.00%, 24.00%, 4.00% and 8.00%, respectively (Figure 3(b)).
VOC compositional profiles and DRs in the halls and on the platforms: (a) and (b) VOC DR distributions and percentages of high DR substances classified, (c)–(h) hall and (i)–(n) platform.
VOC compositional profiles and DRs in interchanges and non-interchanges.
By analysing the VOCs in interchanges and non-interchanges, 76 and 87 individual VOCs were detected, respectively (Figure 4(a) and (b)). The compositional profiles and DRs are shown in Figure 4(c) to (n). The number of VOCs detected in the interchanges were, BHs (28), AOs (27), AKAEs (14) and others (7). The different DRs and the number of VOCs detected were <50% (43), 50–60% (0), 60–70% (2), 70–80% (4), 80–90% (6) and >90% (21), as shown in Figure 4(a). Twenty-seven individual VOCs were detected at DRs ≥ 80%, and the percentage showed that BHs (59.26%) > AOs (29.63%) > others (11.11%); AKAEs had no compounds with high DRs. In non-interchanges, BHs, AO, AKAEs and others included 27, 34, 16 and 10 individual VOCs, respectively. There were 53, 7, 0, 4, 6 and 17 individual VOCs with DRs < 50%, 50–60%, 60–70%, 70–80%, 80–90% and >90%, respectively. The VOCs with DRs ≥ 80% comprised of a total of 23, and the proportions of BHs, AO, AKAEs and others were 56.52%, 26.09%, 8.70% and 8.70% (Figure 4(b)).
VOC compositional profiles and DRs of in interchanges and non-interchanges: (a) and (b) VOC DR distribution and percentage of high DR substances classified, (c)–(h) interchange and (i)–(n) non-interchange.
VOC concentrations
Overall VOC concentrations in underground train stations.
The average total VOCs (TVOC) concentration in the underground train station was 79.59 ± 19.05 μg/m3. The average concentrations of BHs, AOs, AKAEs and others were 45.68 ± 13.89, 22.84 ± 6.76, 5.07 ± 3.31 and 5.99 ± 3.08 μg/m3, respectively (Figure 5(a)). The TVOC concentrations at the 12 underground train stations are shown in Figure 5(b). The SRS, WICS, JS and JPES exceeded the average concentration by 1.21, 1.41, 1.05 and 1.08 times, respectively. The NRS, HS, CPS, LS, WMS, KAS, FSS and HPS concentrations were lower than the average at 64.87, 78.96, 76.11, 77.89, 70.96, 69.90, 64.60 and 74.32 μg/m3, respectively.
VOC concentrations in underground train stations: (a) various substance concentrations, (b) 12 underground train stations concentrations and (c) and (d) individual VOC concentrations.
The individual VOC concentrations in underground train stations are shown in Figure 5(c) and (d). The highest concentration recorded was 15.02 ± 3.89 μg/m3 for benzoic acid. Amongst the detected BHs, acetophenone (7.12± 2.67 μg/m3), phenol (4.47 ± 3.80 μg/m3), benzophenone (3.87 ± 1.73 μg/m3), toluene (2.91 ± 1.60 μg/m3), styrene (2.91 ± 2.00 μg/m3), benzaldehyde (2.20 ± 0.48 μg/m3) and benzene (1.87 ± 0.73 μg/m3) also had relatively high concentrations. Notably, benzene, styrene and toluene are classified as group 1, group 2B and group 3 carcinogens, respectively, by the IARC. 69 Prolonged exposure to benzene can have detrimental effects on human organs 70 and may increase the risk of cancer. 71 Amongst the AOs, hexamethylcyclotrisiloxane (7.24 ± 2.33 μg/m3), octamethylcyclotetrasiloxane (3.22 ± 1.46 μg/m3) and decamethylcyclopentasiloxane (2.97 ± 2.08 μg/m3) exhibited the highest concentrations. In the AKAEs, menthol, decanal and nonanal were the most concentrated, with levels of 3.97 ± 0.40, 3.89 ± 0.01 and 2.33 ± 0.85 μg/m3, respectively.
VOC concentrations in the halls and on the platforms.
Average TVOC concentrations in the halls and on the platforms were 78.69 ± 22.29 and 80.48 ± 15.08 μg/m3, respectively (Figure 6). The distribution pattern of four classes of substances in both the halls and platforms was consistent: BHs > AOs > others > AKAEs. The CPS (87.84 μg/m3), WICS (102.61 μg/m3), JS (124.85 μg/m3) and JPES (107.69 μg/m3) halls exceeded the average level (Figure 6(a)). However, on the platforms, SRS (92.57 μg/m3), HS (82.97 μg/m3), WICS (92.30 μg/m3), JS (102.14 μg/m3), WMS (83.25 μg/m3) and HPS (107.00 μg/m3) surpassed the average concentrations (Figure 6(b)). The individual VOC concentrations are shown in Figure 6(c) to (f). In the halls, the three individual VOCs with the highest concentrations were benzoic acid (15.01 ± 3.44 μg/m3), acetophenone (7.49 ± 2.85 μg/m3) and hexamethylcyclotrisiloxane (6.92 ± 2.48 μg/m3). On the platforms, the same three individual VOCs were predominant, with benzoic acid (15.03 ± 1.11 μg/m3) > hexamethylcyclotrisiloxane (7.53 ± 2.14 μg/m3) > acetophenone (6.92 ± 2.48 μg/m3).
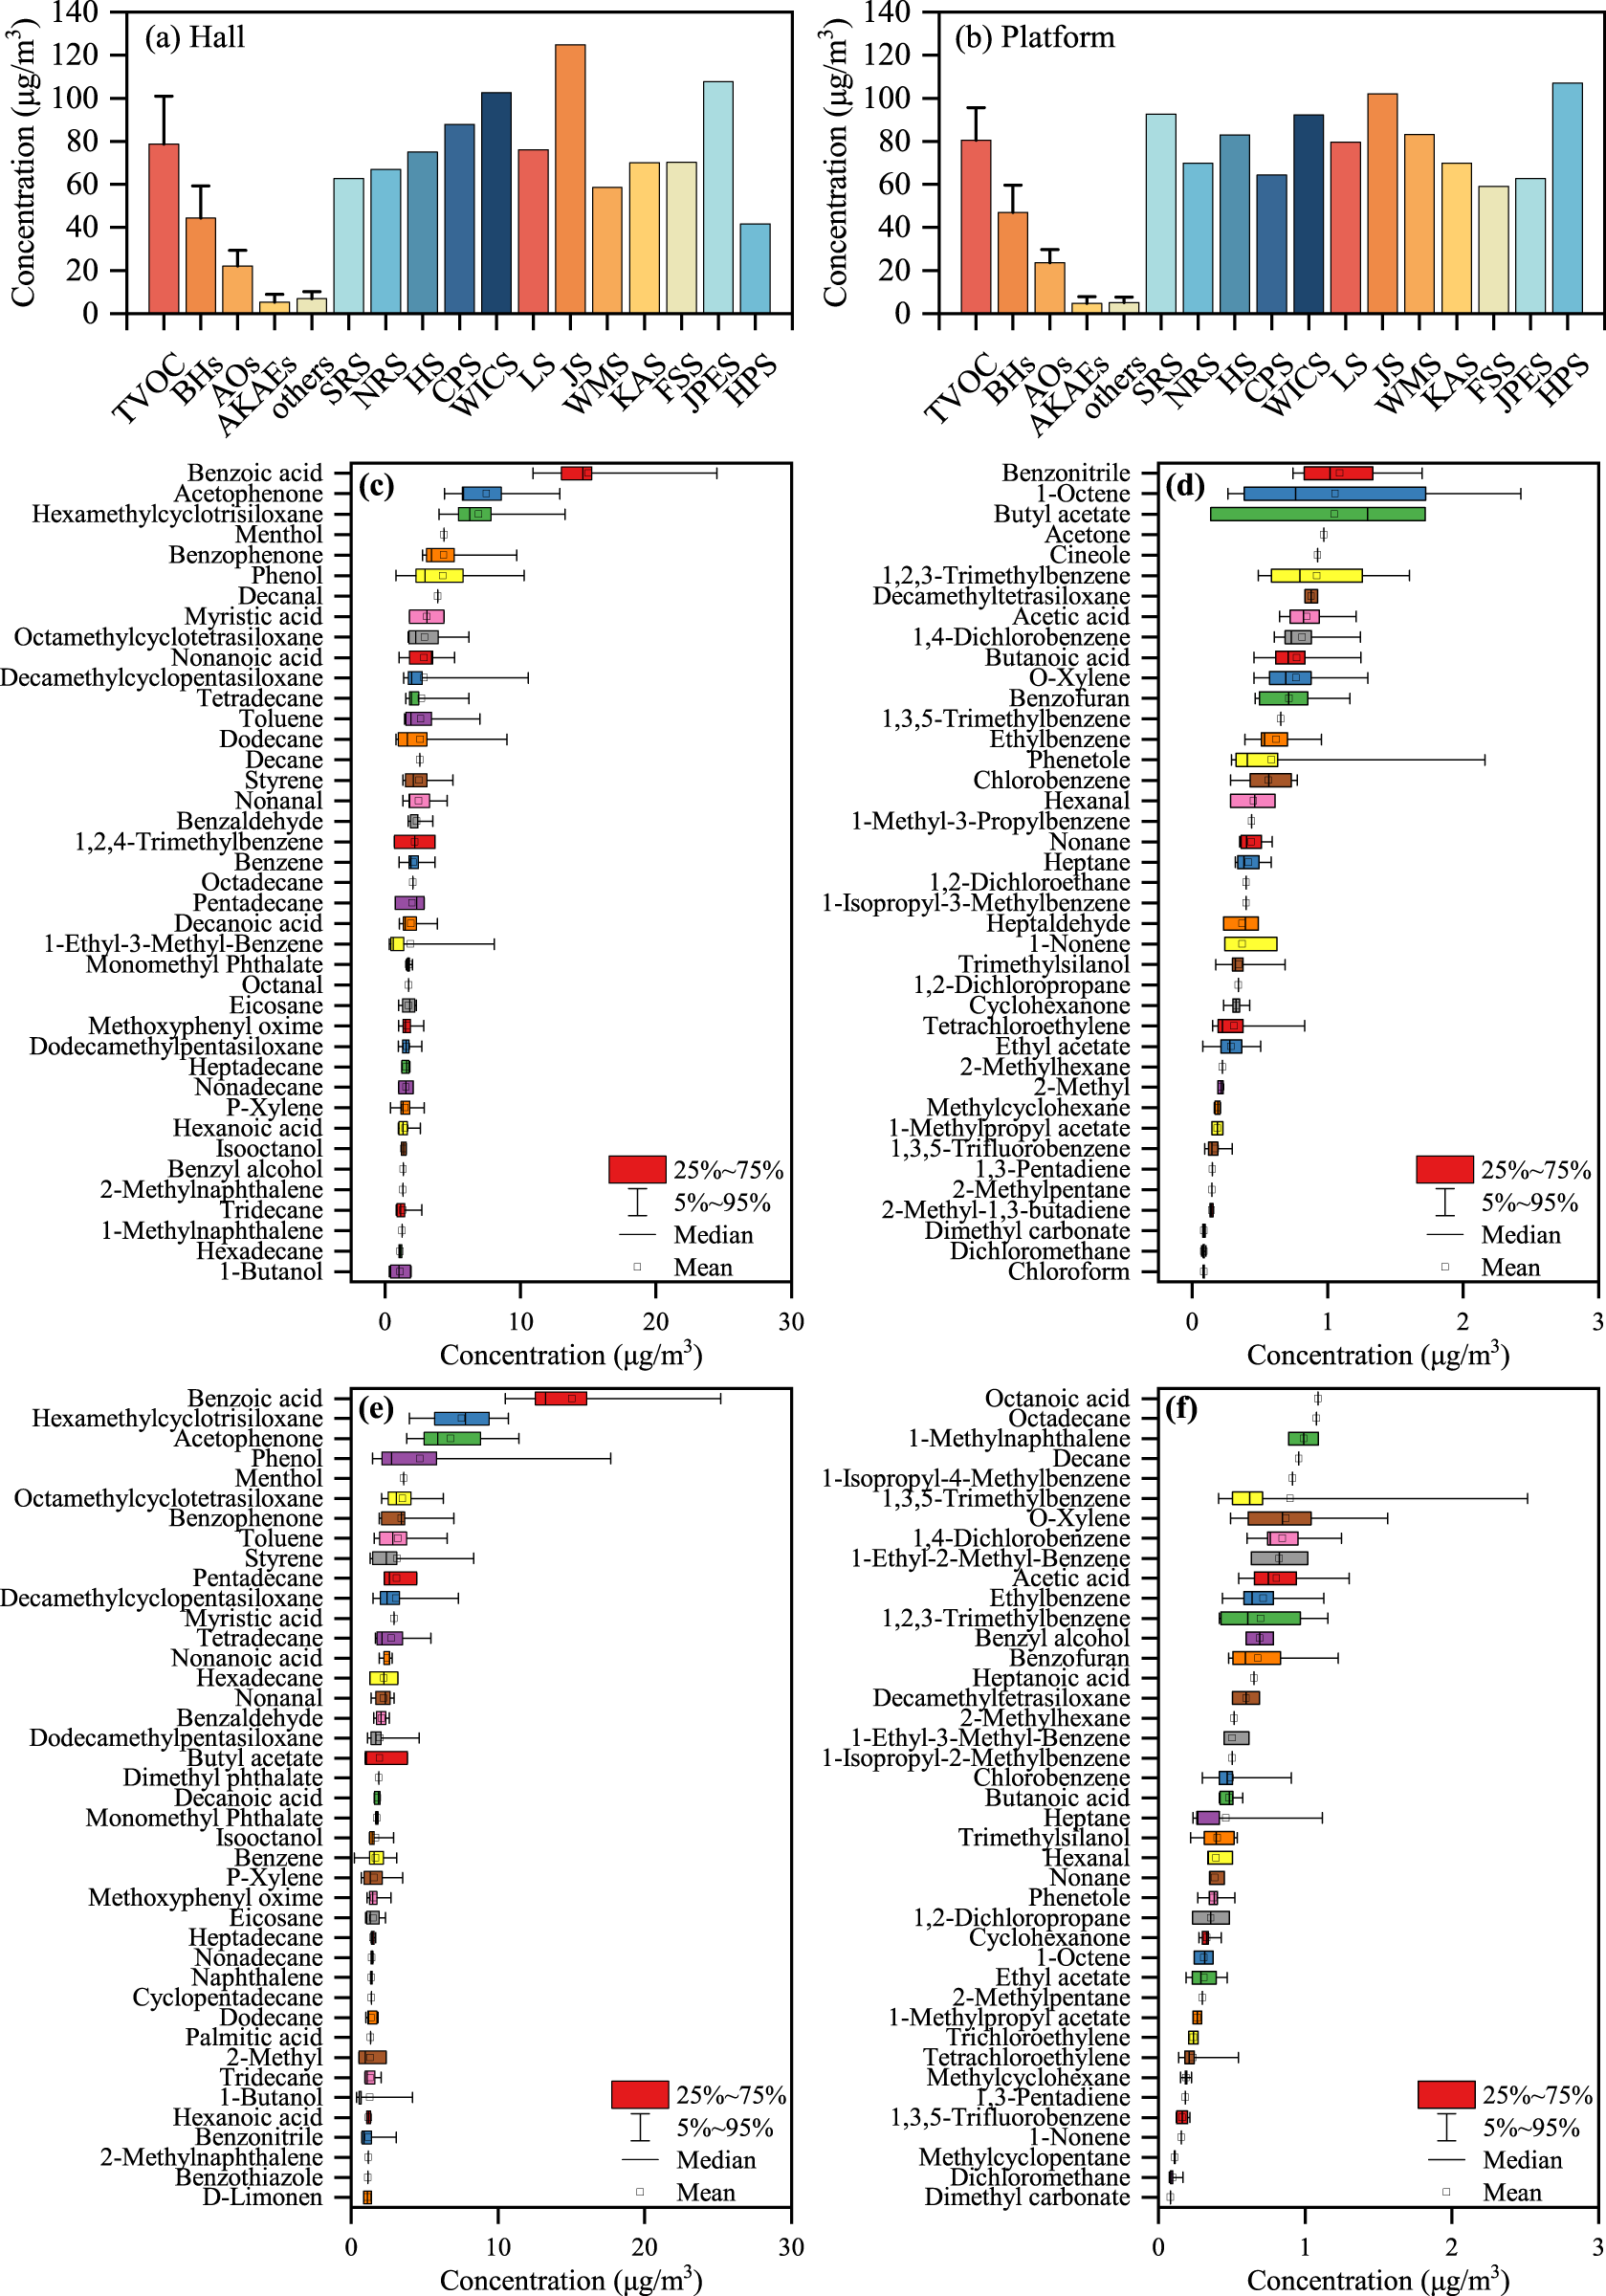
VOC concentrations in the halls and on the platforms: (a) and (b) TVOC, four types of substances and underground train stations hall and platform concentrations, (c) and (d) individual VOC concentrations in the halls and (e) and (f) individual VOC concentrations on the platforms.
VOC concentrations in the interchanges and non-interchanges.
Average TVOC concentrations in the interchanges (79.72 ± 13.15 μg/m3) and the non-interchanges (79.49 ± 22.33 μg/m3) were equal to the overall level of underground train stations (79.59 ± 19.05 μg/m3) as shown in Figure 7. In the interchanges, the average concentration levels of BHs, AOs, AKAEs and others were 46.16 ± 8.53, 22.13 ± 5.44, 4.44 ± 3.19 and 7.00 ± 3.19 μg/m3, respectively. TVOC levels in the five interchanges were WICS > SRS > HS > CPS > NRS (Figure 7(a)). For the non-interchanges, the average concentrations of BHs, AOs, AKAEs and others were 45.35 ± 16.68, 23.35 ± 7.52, 5.52 ± 3.32 and 5.27 ± 2.78 μg/m3, respectively. Amongst the seven non-interchanges, the TVOC levels were JS > JPES > LS > HPS > WMS > KAS > FSS (Figure 7(b)). Individual VOC concentrations are shown in Figure 7(c) to (f). The top three substances in both the interchanges and non-interchanges were benzoic acid, acetophenone and hexamethylcyclotrisiloxane.
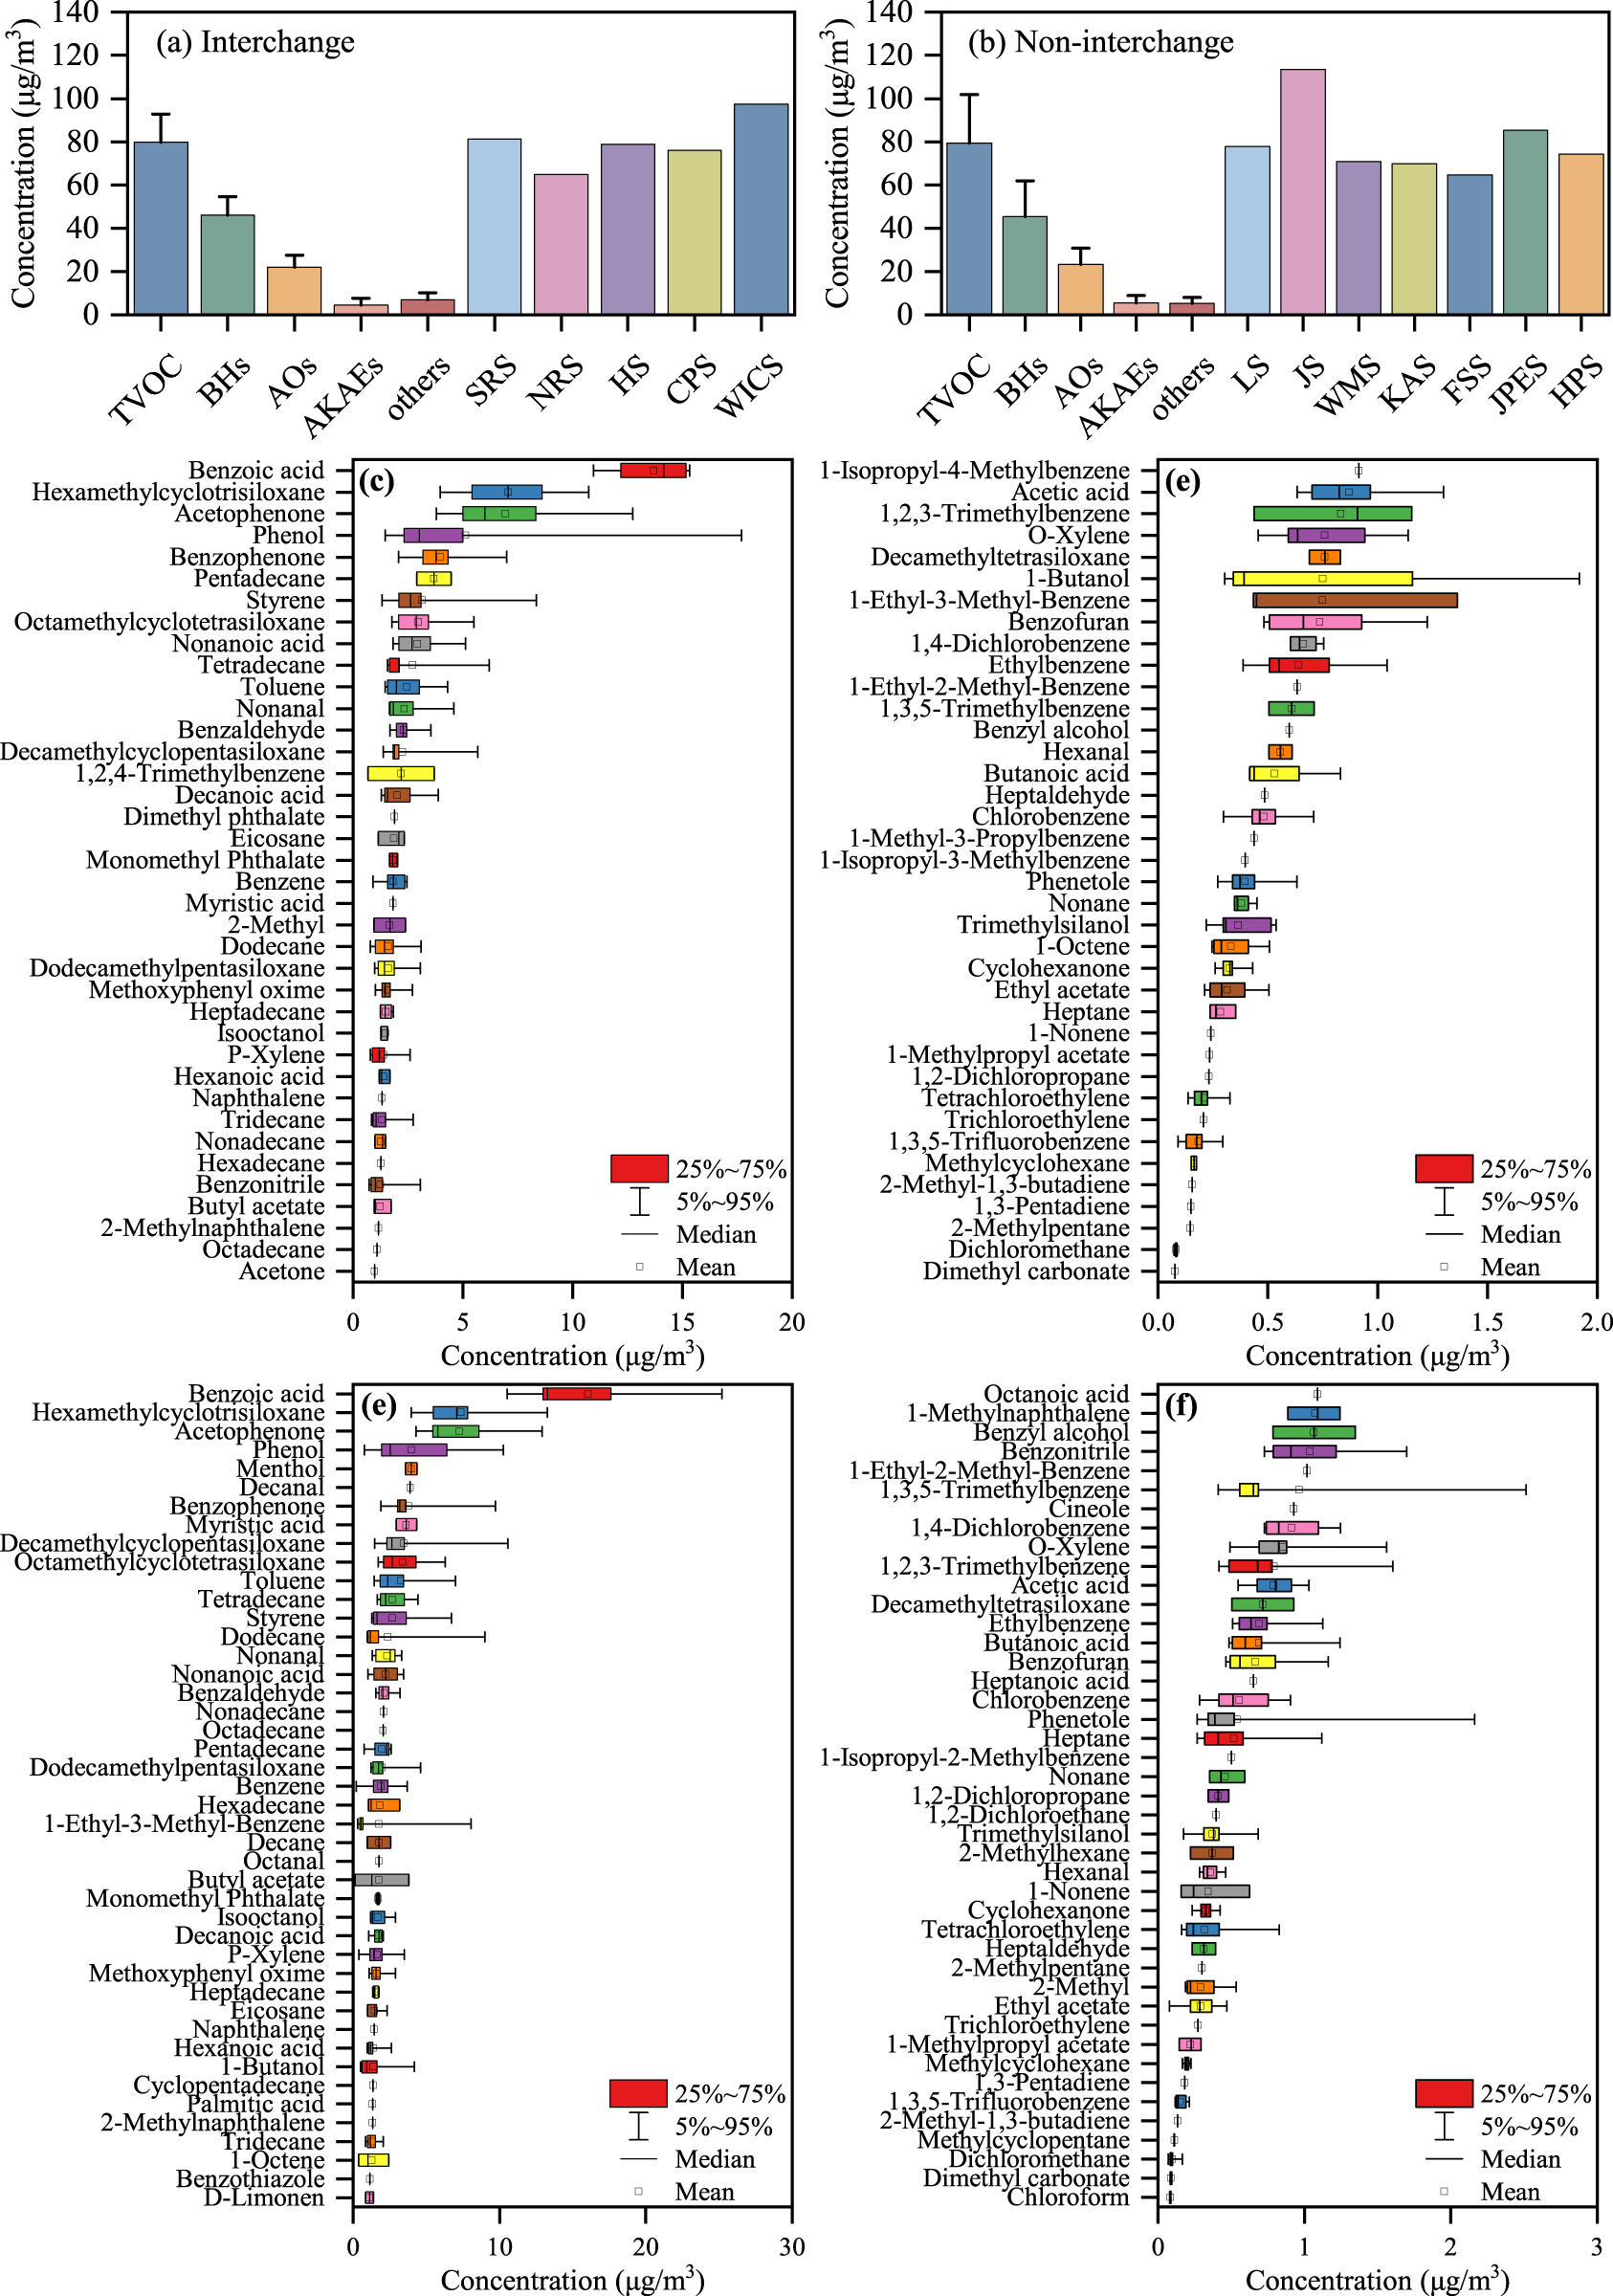
VOC concentrations in the interchanges and non-interchanges: (a) and (b) TVOC, four types of substances and underground train station interchange and non-interchange concentrations, (c) and (d) individual VOC concentrations in the interchanges and (e) and (f) individual VOC concentrations in the non-interchanges.
VOC sources in underground train stations
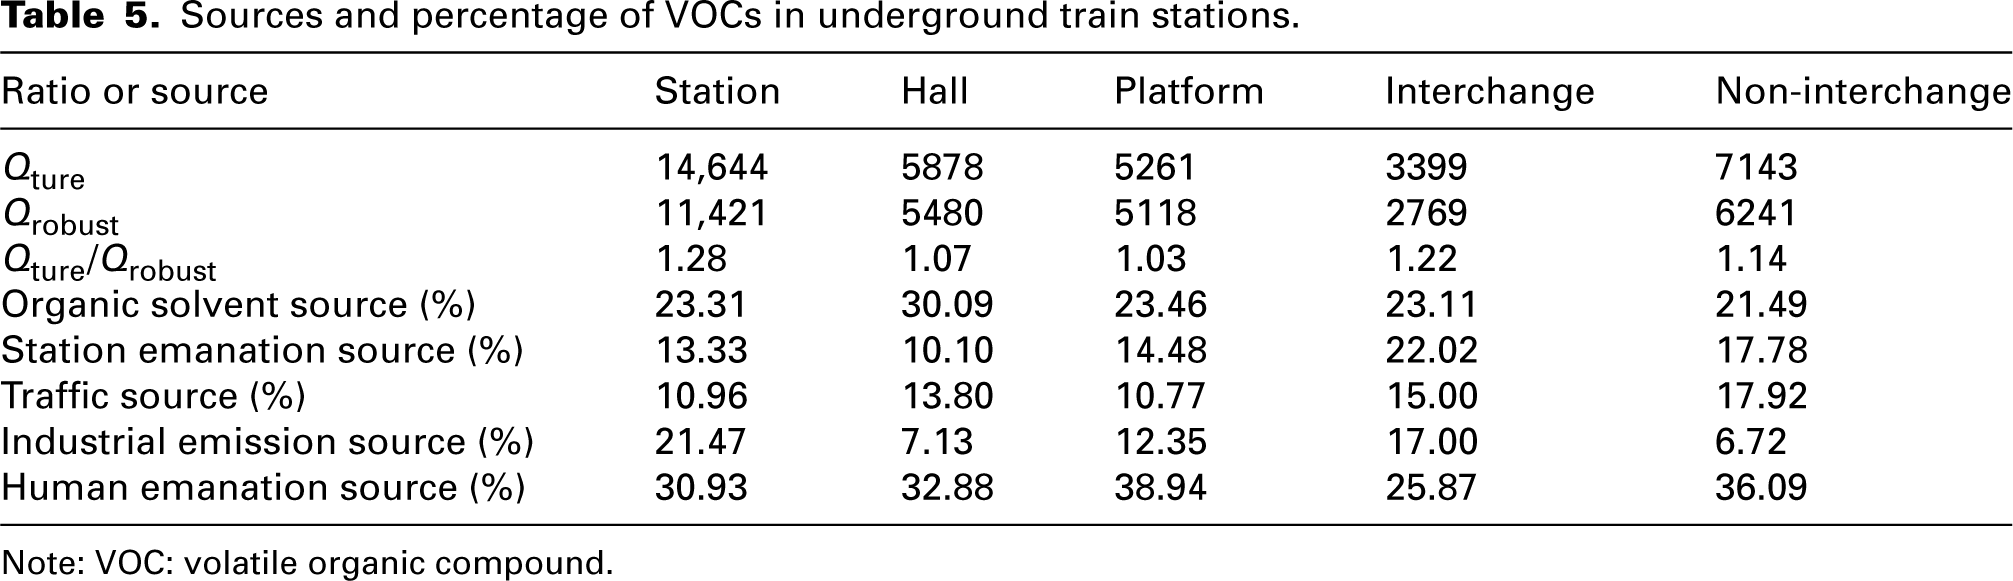
PMF 5.0 was used to analyse VOC sources in underground train stations. Three to eight factors were set for analysis, with the results showing that the factor characteristic values and source profile can better explain the source types when the number of factors is five. The PMF obtained 14,644 input data (Qture) and 11,421 valid data (Qrobust), that is, Qture/Qrobust = 1.28 < 1.50, the results converged, and the results of this model were reliable (Table 5).
Sources and percentage of VOCs in underground train stations.
Note: VOC: volatile organic compound.
Figure 8 shows the source analysis results of 93 VOCs using PMF 5.0. The greatest contributors to factor 1 were acetone (100%) and pentadecane (77.91%). Acetone is generally used as an intermediate in the production of conventional solvents.
72
Pentadecane is a high carbon alkane and is mostly used in organic solvents.
73
Therefore, factor 1 is the organic solvent source. The primary substances included in factor 2 were 1,3,5-trimethylbenzene (92.81%) and
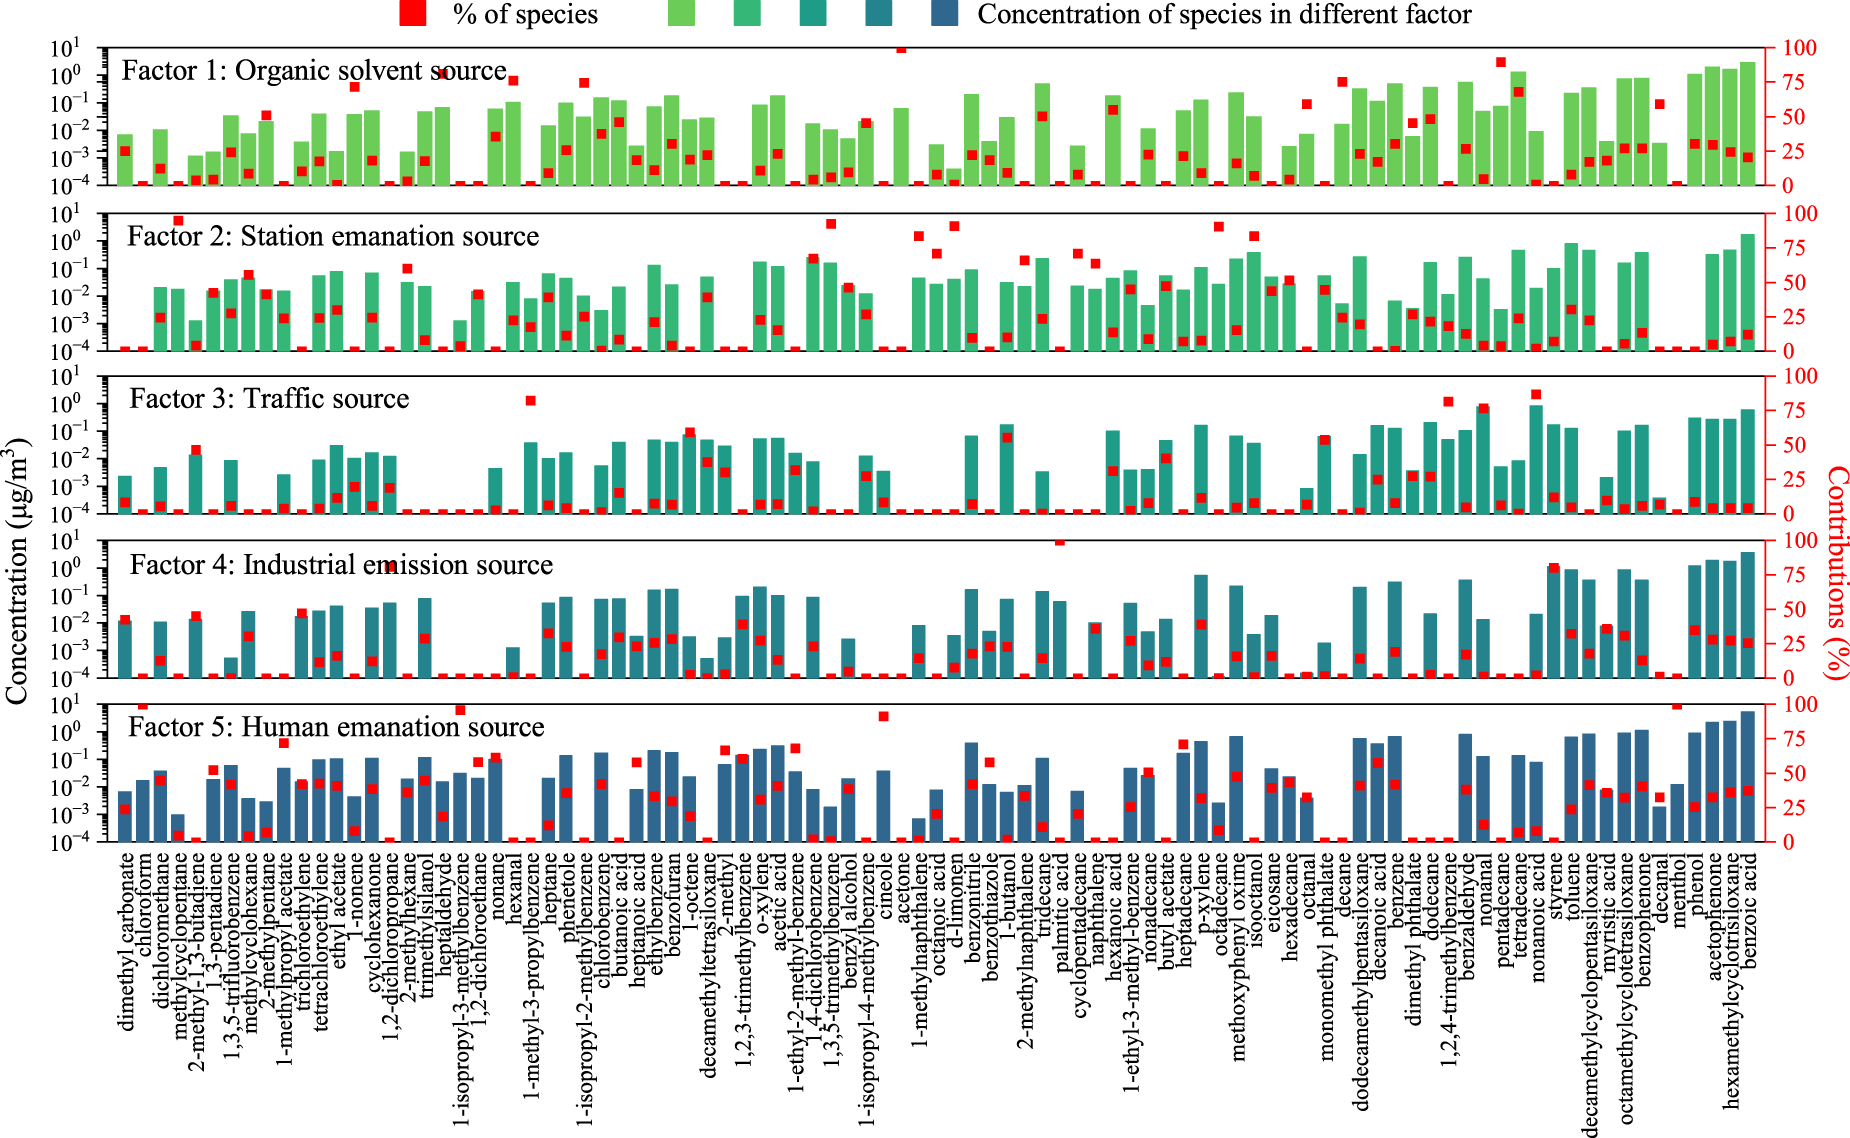
Source analysis results of VOCs in underground train stations.
In summary, the primary VOC sources in underground train stations were organic solvents, station emanations, traffic, industrial emissions and human emanations, with contribution rates of 23.31%, 13.33%, 10.96%, 21.47% and 30.93%, respectively (Table 5).
Source apportionment was conducted in the halls, platforms, interchanges and non-interchanges, with Qture/Qrobust < 1.50, indicating reliable results. Table 5 presents the results for the five sources and their respective contributions. It is evident that the human emanation source was the primary contributor to pollution, with a proportion ranging from 25.87% to 38.94%. Following this, the organic solvent source was the second most significant, contributing between 21.49% and 30.09%. The contributions of the remaining three sources were determined based on their inherent characteristics.
Health risks of VOCs on populations in underground train stations
To evaluate the health risks of VOCs for the population in underground train stations, this study was conducted to quantify and analyse 12 selected VOCs for non-cancer risks and cancer risks by referencing the list of carcinogens developed by IARC (Table 4). The study categorised the potentially exposed population into passengers (adults and children) and underground train station workers (station attendants and security checkers). Health risks from inhalation exposure were assessed using the US EPA health risk assessment model 52 in conjunction with chronic inhalation exposure reference concentrations and inhalation unit risks (Table 4) provided by the CA OEHHA. 68
Based on the results shown in Figure 9(a), the HI for passengers and workers in the CA OEHHA assessment system ranged from 0.10 to 0.19, both of which were much lower than the assessment standard of the US EPA (HI = 1), 81 indicating that VOCs in the underground train stations cannot pose non-cancer risks to the population. The HI for workers (mean: 0.18) was approximately 1.7 times higher than for passengers (mean: 0.10). The TCR were similarly higher than the assessed standard (1 × 10⁻⁶) Figure 9(b), however, none exceeded 1 × 10⁻⁴, which suggested that VOCs could pose certain cancer risks to the population.
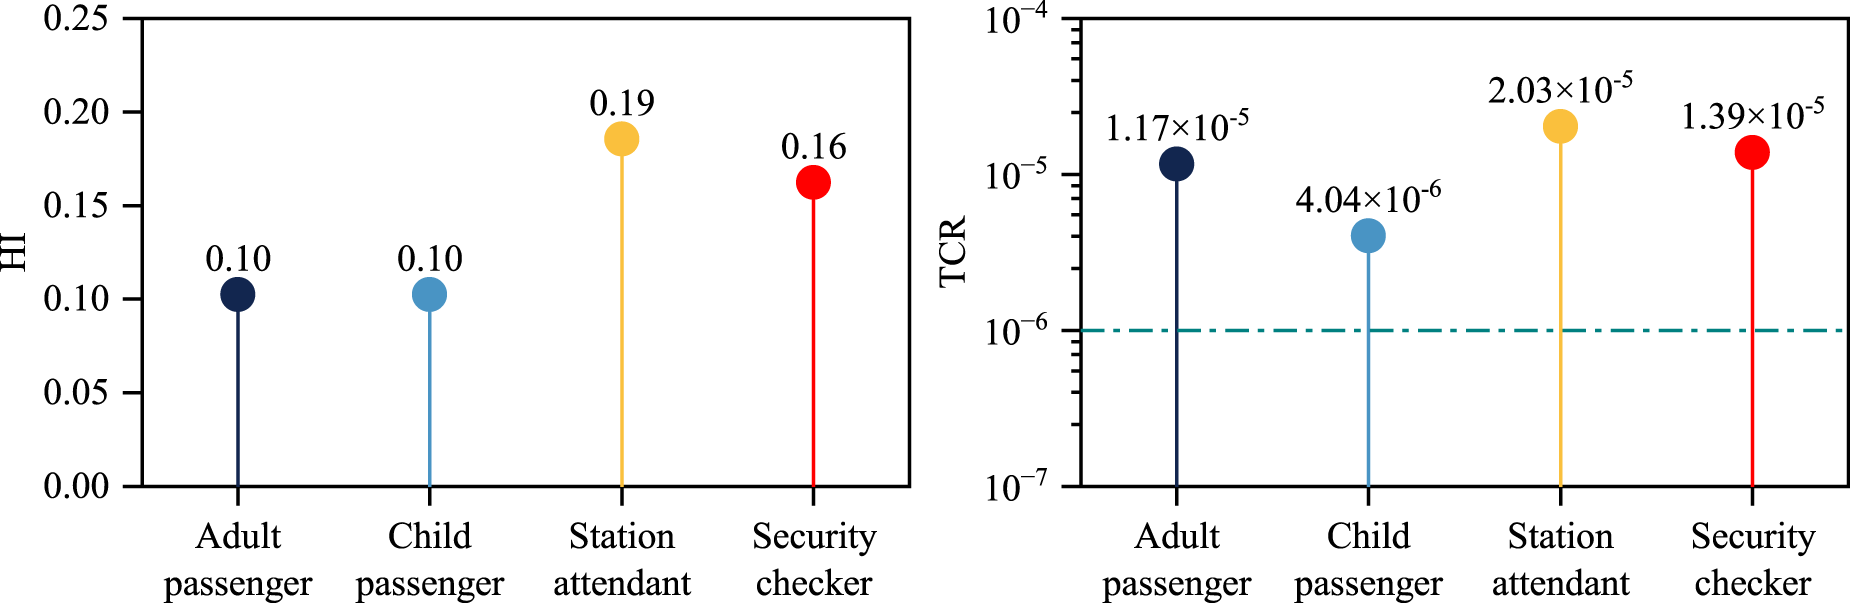
Health risks of passengers and underground train workers in underground train stations: (a) HI of VOCs on populations and (b) TCR of VOCs on populations.
Figure 10 illustrates the HQ and CR associated with each VOC on passengers and underground train workers. These findings indicate that none of the individual VOCs present non-cancer risks on the population and are considered to pose negligible risks. Observing the CR results, benzene and naphthalene both had CRs > 1 × 10⁻⁶ (benzene: 1.74 × 10⁻⁶–9.85 × 10⁻⁶, naphthalene: 1.50 × 10⁻⁶–8.57 × 10⁻⁵), with contributions of 50.1% and 38.8%, respectively. Of the remaining substances, 1,4-dichlorobenzene carries CRs of 1.45 × 10⁻⁶ for security checkers and 1.70 × 10⁻⁶ for station attendants. 1,2-Dichloroethane poses CRs of 1.36 × 10⁻⁶ only for security checkers in the halls. 1,4-Dichlorobenzene and 1,2-dichloroethane are also classified as group 2B carcinogens.82,83
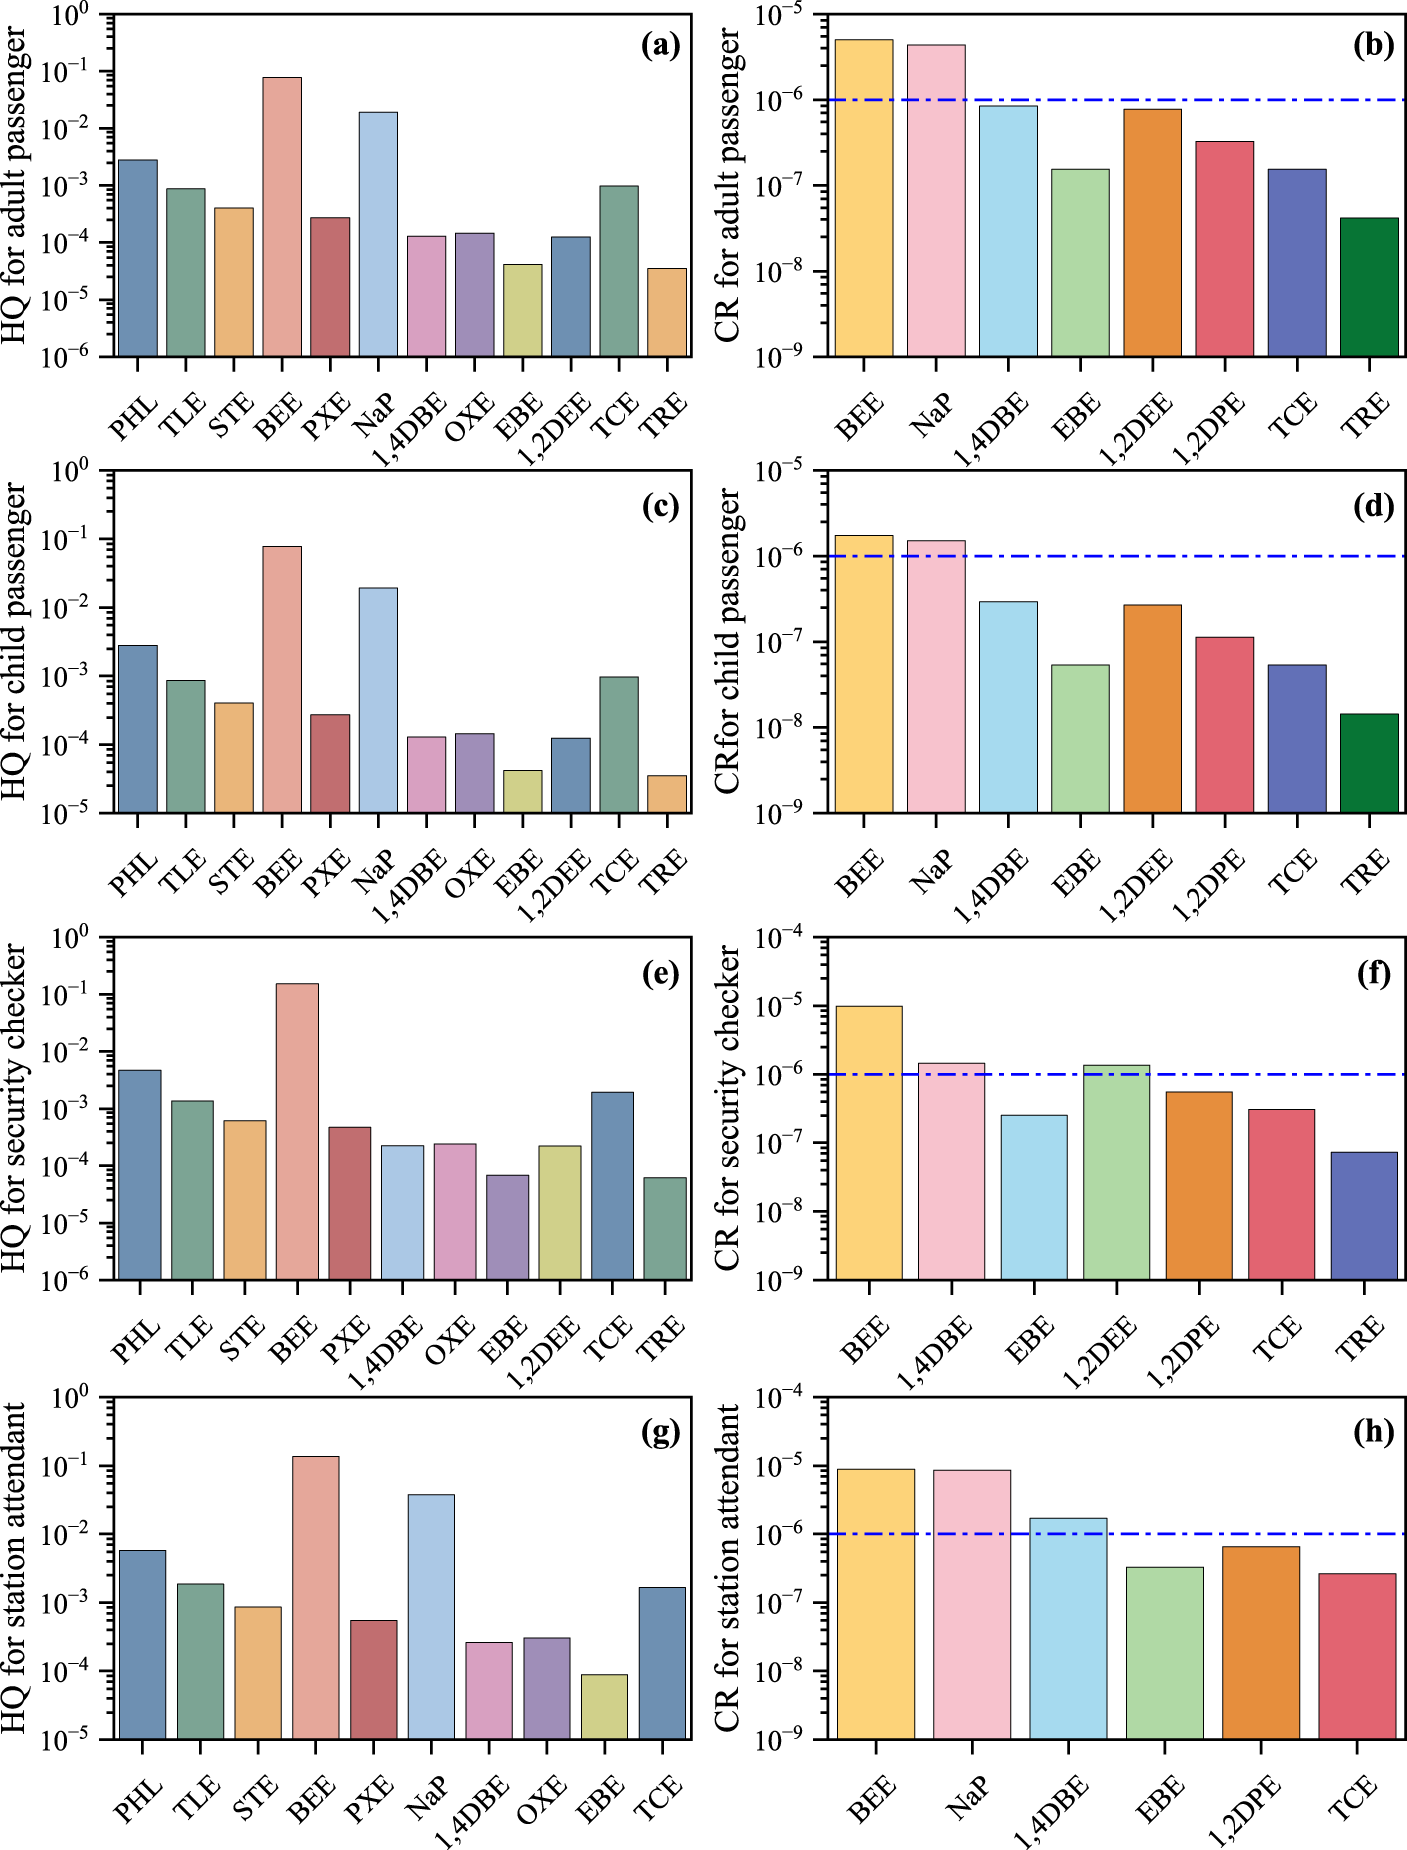
Individual VOC health risks to passengers and underground train station workers.
Discussion
VOC compositional profiles and DRs in underground train stations
In this study, 93 individual VOCs were detected at 12 underground train stations in Chengdu city (Figure 2). These were categorised as BHs, AOs, AKAEs and others, with 33, 34, 16 and 10 VOCs, respectively. Amongst the substances with a high DR (≥80%), BHs accounted for the greatest proportion (60.87%). Building decoration materials, paints and panels in underground train stations were the primary BHs sources. 84 Amongst the BHs, phenol and p-xylene were detected in 100% of the cases. Phenol is commonly used as a fungicide, antiseptic and disinfectant. 85 p-Xylene serves as a raw material for paints, fuels and polyester fibres. 86 For AOs, tetrachloroethylene and decamethylcyclopentasiloxane were also 100% detected. Tetrachloroethylene is primarily used in the production of organic solvents, adhesives and desiccants. 87 Decamethylcyclopentasiloxane is a key ingredient in cosmetics and body care products. 88 Acetic acid was the only other compound that was 100% detected. Acetic acid, known for its ability to dissolve organic substances, is used extensively in the paint industry. No AKAE VOCs showed a 100% DR.
VOC concentrations in underground train stations
The average TVOC concentration in underground train stations was 79.59 ± 19.05 μg/m3 (Figure 5(a)). The SRS, WICS, JS and JPES concentrations exceeded the average (Figure 5(b)). Combined with the description of the underground train stations in Table 1, the SRS is an important transportation hub in Chengdu, and the station has a high population flow. Related studies have shown that the TVOC concentration in the underground train station is positively correlated with population density.28,89 In addition, a large number of taxis and private cars stay in underground car parks to pick up and drop off people while idling. The VOCs produced by transmitters would be higher when vehicles are idling than when they are travelling. 90 JS is located at the centre of the Second Ring Road, which is convenient for traffic, and the high traffic flow would lead to an increase in VOC emissions in the underground train station. Moreover, the JS neighbourhood is mostly occupied by food stalls, and the cooking processes also generate VOCs, 91 affecting the pollution level. The WICS is a semi-subterranean station with a station hall at the ground level and is directly connected to the outside world, whereas the platforms are situated underground. This structure causes the outdoor air to directly affect the air quality of the station. The presence of numerous buildings in the vicinity has resulted in the continuous release of substances, such as decorative materials and paints, into the air, leading to high VOC concentrations. Since its operation in September 2020, JPES, a prominent art station, boasts a distinctive interior design and modern facilities that use a greater number of decorative building materials than ordinary underground train stations. This resulted in higher VOC pollution levels at the station.
According to Figure 5(c) to (d), the highest concentration of benzoic acid in the underground train station was 15.02 ± 3.89 μg/m3. Benzoic acid is commonly used as a compound in coatings, adhesives, plasticisers and lubricants. 92 Given that the study was conducted during summer, the volatility of benzoic acid was influenced by temperature, resulting in the observed high concentration. Except for BHs, the highest concentrations of hexamethylcyclotrisiloxane, octamethylcyclotetrasiloxane and decamethylcyclopentasiloxane were found in the AOs. These substances are widely found in body care, 93 leather and textile products. 94 Thus, the high flow of people in underground train stations could lead to their high concentrations. Amongst the AKAEs, menthol, decanal and nonanal exhibited the highest contamination levels. Short-term exposure to elevated aldehyde levels can result in dizziness, vertigo and nausea. 95
Table 6 summarises studies on the concentration levels of individual VOCs and the TVOC in underground train stations. Lee et al. 96 recorded TVOC concentrations in Korean underground train stations (1073.6 ± 253.9 μg/m3) approximately 13.3 times higher than in this study. Considering this study was conducted from 2005 to 2006, the results may be related to the oil-based paints used in underground train stations during that time. Currently, water-based paints, known for lower VOC emissions, are more commonly used in underground train stations. 97 Hwang et al. 98 investigated the TVOC pollution levels in underground train stations before and after COVID-19 outbreak and found that TVOC concentrations after the outbreak (99.9 ± 68.5 μg/m3) were approximately twice those before the outbreak (43.8 ± 69.8 μg/m3). These findings align with results of the current study, possibly because of the increased disinfectant and cleaning product usage during the outbreak. Another TVOC study (2013–2015) in Seoul 99 underground train stations (n = 100) showed results that were approximately twice that of this study. Twenty-three Seoul underground train stations installed a highly efficient air purification system since 2007, 99 however, the air filters used in ventilation systems in the underground train stations were coarse stainless steel wire or aluminium mesh, which could only filter coarse particulate matter and were not effective in preventing TVOC entry. In the two studies in Nanjing,100,101 the concentrations in the hall (100 ± 10 μg/m3) and on the platform (100 ± 10 μg/m3) were slightly higher than those in this study, 100 whereas the concentration in the offices in the hall (1216.8 μg/m3) was much higher than that was recorded in this study. 101 The HVAC systems in the offices did not allow direct ventilation to the outdoors, compared to the platforms, which would be more likely to have fresh air. The VOC sources in offices were typically indoors (furniture, building materials and personnel activities).
Individual VOC or TVOC concentrations in underground train stations reported in different studies (μg/m3).
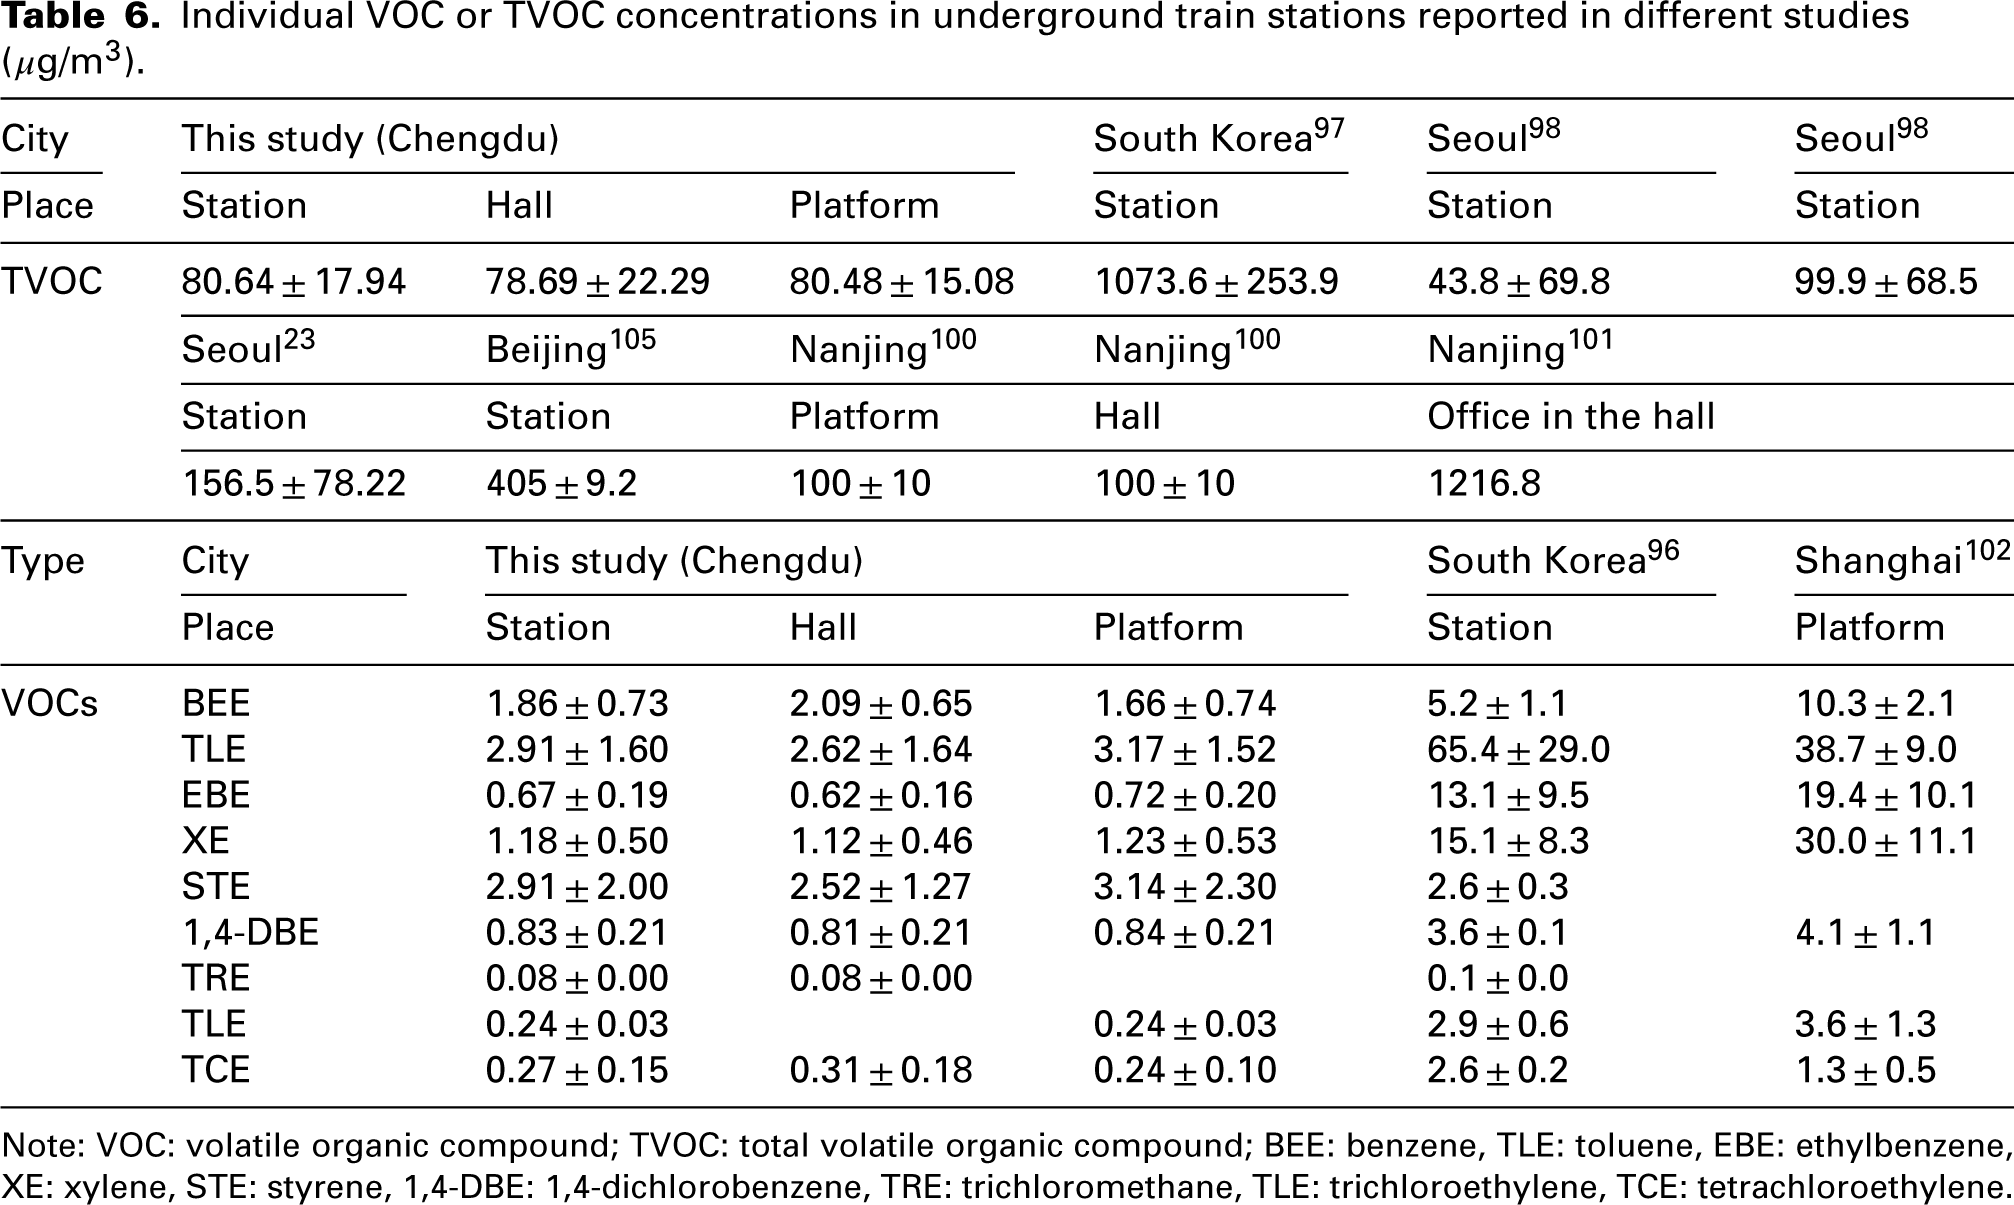
Note: VOC: volatile organic compound; TVOC: total volatile organic compound; BEE: benzene, TLE: toluene, EBE: ethylbenzene, XE: xylene, STE: styrene, 1,4-DBE: 1,4-dichlorobenzene, TRE: trichloromethane, TLE: trichloroethylene, TCE: tetrachloroethylene.
Two studies reported individual VOC concentrations, both of which were higher than the concentration levels reported in this study. Toluene concentrations of 65.4 ± 29.0 μg/m3 were the highest in the Korean underground train station. 96 Besides the highest concentration of toluene (38.7 ± 9.0 μg/m3), the xylene concentration of 30.0 ± 11.1 μg/m3 was recorded in the Shanghai study. 102 The primary toluene and xylene sources are from respiratory emissions from passengers, 103 in addition to the building facilities and organic solvents in the underground train stations. 104
VOC sources in underground train stations
The primary VOC sources in underground train stations were organic solvents (23.3%), station emanations (13.3%), traffic (11.0%), industrial emissions (21.5%) and human emanations (30.9%) (Figure 8). Sources of organic solvents typically include paints, disinfectants and adhesives. This study was conducted during the non-closed period of COVID-19, and to prevent the spread of the virus, the Chengdu Underground Train Station increased the disinfection application frequency on the security machines, gates, escalator handrails, underground train station entrances and exits, platforms and public toilets that are frequently touched by passengers. During COVID-19, the frequent use of disinfectants and cleaning products led to an increase in TVOC concentrations. 106 These cleaning products and disinfectants often contain a variety of chemicals that can irritate the respiratory tract and cause allergic reactions. 107 VOCs are emitted from station renovations, decorative items and facilities, such as KAS and JPES. VOCs from outdoor traffic and industrial emissions can enter the station through the HVAC system of the underground train station with outside air exchange and cause pollution. VOCs are also emitted during peak periods when there is a heavy flow of people in underground train stations. Cigarette smoke, skin care products, sunscreen, nail polish and clothing detergents can also contribute to the VOC emission.
Comparing the sources between the halls and platforms (Table 5), the human emanation source contribution on the platforms (38.94%) was higher than that in the halls (32.88%). This is attributed to the absence of individuals lingering in the hall, whereas individuals on the platform tend to wait for trains for periods ranging from 3 to 10 min. Particularly during peak periods, this enhances the intensity of human emanations. The industrial emission source contributions to the halls and platforms were 7.13% and 12.35%, respectively. Industrial VOCs enter platforms through tunnel ventilation shafts, leveraging the piston wind generated by train operations. In contrast, halls rely on HVAC system, and the VOC concentration is reduced through internal air purification devices, leading to platform concentrations being higher than those in the halls. The differences in sources between interchanges and non-interchanges (Table 5) show that non-interchanges have a higher contribution (36.09%) from human emanation sources compared to that of the interchanges (25.87%). Interchanges have larger spaces and multiple entrances and exits, which also increases ventilation, whereas non-interchanges have limited space. In addition, non-interchanges often include attractions that can lead to crowding and hinder air circulation, consequently promoting VOC accumulation during peak periods
Health risks of VOCs on populations in underground train stations
Through the US EPA health risk assessment model 52 combined with the parameters provided by the CA OEHHA, 68 health risks to passengers and underground train station workers via the inhalation pathway were obtained. VOCs in underground train stations do not pose non-cancerous risks to passengers and staff; however, they pose certain cancerous risks. The TCR for underground train station workers was found to be consistently higher than those for passengers, exceeding 1 × 10⁻⁵ (Figure 9). Underground train station workers (station attendants (112,320 h) and security guards (99,840 h)) are exposed far more, annually, than passengers (adults (56,940 h) and children (19,710 h)) at underground train stations (Table 3). The longer the exposure time, the greater the potential health hazards. Therefore, the health risks to workers cannot be ignored. Related studies also indicate this view.11,108 The authorities should consider providing masks or implementing localised ventilation systems regularly to mitigate the health risks faced by workers.
For health risks caused by individual VOCs, the CRs for both benzene and naphthalene were >1 × 10⁻⁶ (Figure 10). Benzene, classified as a group 1 carcinogen, can lead to respiratory issues, 109 impaired kidney and liver function, 110 acute toxicity 111 and carcinogenic effects,112,113 with long-term or high-level exposure. Naphthalene, a two-ring PAH, can result in health problems such as vomiting, eye and skin irritation, reduced immune function, respiratory disorders, cataracts, abnormal lung function and even death.114–116 1,4-Dichlorobenzene poses a CR only to security checkers and station attendants. 1,2-Dichloroethane poses a CR only to security checkers (Figure 10). 1,4-Dichlorobenzene is commonly used as a pesticide, mould inhibitor and deodoriser. 117 Chengdu underground train stations often face issues with flying insects during summer, leading to frequent insecticide spraying by workers and, consequently high exposure levels. Inhaling 1,4-dichlorobenzene can result in symptoms such as coughing, wheezing, neurological damage and anaemia. 118 Du et al. 119 highlighted 1,4-dichlorobenzene and benzene as the primary contributors to cancer risk, with the highest median estimates in urban China. 119 1,2-Dichloroethane is a chlorinated VOC known for its persistence, toxicity and potential carcinogenicity.
VOC evaluation in underground train stations
As there are no air quality standards for underground train stations, the Chinese ‘Indoor Air Quality Standard’ 52 and WHO 120 guidelines and Japanese 121 regulations were used as standards. Table 7 lists the regulations on indoor individual VOC and TVOC concentration. The ‘Indoor Air Quality Standards’ 52 was revised in 2022 with higher standards for benzene concentration requirements (110 μg/m3 in the 2002 version), and new additions of trichloroethylene and tetrachloroethylene. Trichloroethylene is a known human carcinogen and tetrachloroethylene is a probable human carcinogen.122,123
Relevant standards for indoor individual VOC and TVOC (μg/m3).
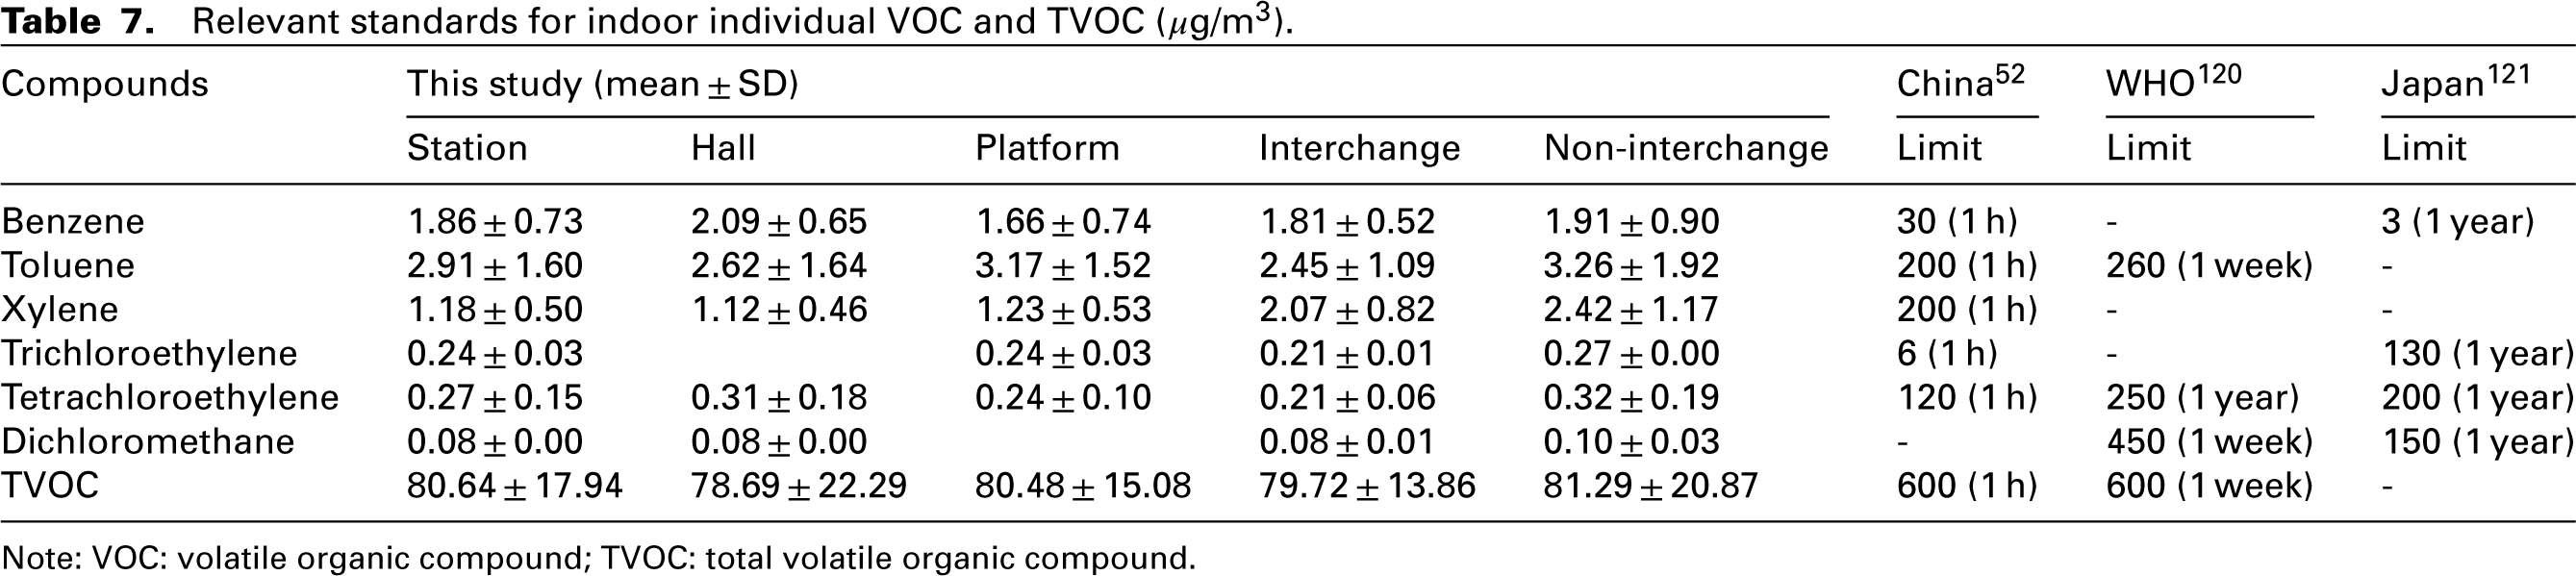
Note: VOC: volatile organic compound; TVOC: total volatile organic compound.
Based on a comparison with the concentration regulations listed in Table 7, the individual VOC and TVOC concentrations in this study did not exceed the prescribed standards. However, this does not indicate that there is no potential risk to public health from the current VOC pollution in underground train stations. According to the risk assessment results, there were certain cancer risks. The contribution of benzene to human health risk is approximately 50% or greater. Therefore, VOC pollution in underground train stations should not be ignored.
Considering underground train station systems are quite different from the general built environment in terms of airtightness, ventilation and surrounding environmental characteristics, VOC pollution characteristics in the underground train system may differ from those in building interiors. This implies that the building indoor air standards may not be fully applicable to underground train stations. Therefore, it is necessary to conduct a detailed study on the types and concentrations of VOCs and establish relevant standards for air quality control in underground train station systems.
Conclusion
In this study, the Chengdu underground train station was selected as a case study, revealing the presence of 93 individual VOCs with a TVOC concentration of 79.59 ± 19.05 μg/m3. Amongst the individual VOCs, benzoic acid, acetophenone and hexamethylcyclotrisiloxane exhibited the highest concentrations. Categorised by functional groups, the order of concentration was BHs > AOs > others > AKAEs. Of the 12 underground train stations, four exhibited above-average TVOC concentrations. The primary sources of VOCs in underground train stations were identified as organic solvents, station emanations, traffic, industrial emissions and human emanations, contributing 23.31%, 13.33%, 10.96%, 21.49% and 30.93%, respectively. According to the risk assessment models, VOCs cannot pose non-cancer risks on the population but can cause certain cancer risks. Benzene and naphthalene both exhibited CRs > 1 × 10⁻⁶ with contributions of 51.8% and 39.5%, respectively. In addition, 1,4-dichlorobenzene and 1,2-dichloroethane present CRs on station workers. The TVOC pollution level in this study did not exceed the relevant standards set by China, the WHO and Japan, and was comparatively lower than that in other cities.
Suggestions for reducing VOC pollution and population exposure
To mitigate VOC pollution in the underground train station system and reduce health risks to the population, the following recommendations are proposed: (1) enhance ventilation and install purification devices to decrease VOC infiltration from outdoor sources.124,125 (2) Minimise excessive decoration in underground train stations with cultural features or use green materials to decorate underground train stations to reduce VOC volatilisation. 126 (3) Disinfection before and after underground train station operations during non-epidemic periods followed by rapid ventilation. (4) Prioritise the health of underground train station workers by adjusting their work sequences to minimise VOC exposure. 64 (5) Partially block VOC intake through inhalation by wearing masks.127,128
Limitations
There are a few limitations to this study. Firstly, the experiment was limited to the summer season. Future studies will include the detection of VOCs in the other three seasons. Secondly, the study focused on Chengdu city as the study site, and it is important to note that different cities have varying atmospheric characteristics which may lead to differences in source analysis. To improve the generalisability of results, future experiments will expand the scope of the study. Finally, this study only assessed the health risks to the population from the 12 priority hazard VOCs and did not explore the hazards of TVOC. This limitation means that the assessment may not accurately represent the true extent of the health risks involved. Despite these limitations, this study has established VOC compositional profiles of underground train stations, providing a solid scientific foundation and reference for the prevention and control of VOC pollution in future underground train station systems.
Footnotes
Acknowledgements
The authors would like to thank Mr Sheng-Hao Huang and Mrs. Zong-Yan Li for their help in testing for this study. We are very grateful to the underground train station workers for their strong support and understanding of this study. We would also like to thank Elsevier Language Editing Services for its linguistic assistance during the preparation of this manuscript.
Authors’ contribution
Han Wang: conceptualisation, methodology, formal analysis, investigation, data curation, writing – original draft and visualisation. Zixuan Cui: formal analysis and data curation. Mingyuan Wang: investigation, methodology and formal analysis. Chunhui Li: methodology, investigation, formal analysis, data curation, writing – original draft and writing – review editing.
Declaration of conflicting interests
The authors declared no potential conflicts of interest with respect to the research, authorship, and/or publication of this article.
Funding
This research did not receive any specific grant from funding agencies in the public, commercial or not-for-profit sectors.