
Abstract
Indoor air quality (IAQ) has significant impacts on human health. High variabilities in indoor pollution levels are often expected due to co-impacts of complex outdoor and indoor sources and air exchange conditions. By using low-cost sensors, this study aimed to examine the differences in air pollutant concentrations between different indoor and outdoor environments including a dormitory, an office, a laboratory, a classroom, a dining hall and a library in a university campus. Generally, indoor particulate matter (PM) concentrations were lower than outdoor levels, with an overall indoor/outdoor (I/O) ratio predominantly <1. Indoor human activities (e.g. breathing, exercise, the use of air conditioning or electronic equipment), along with environmental factors such as temperature and relative humidity, co-affected the variation of indoor PM significantly. The results showed that the low PM concentration and exposure of students in the dinning hall could benefit from its good ventilation and frequent cleaning measures. Indoor air pollution from outdoor air pollution sources in the office contributed more to IAQ than in other locations. Enhanced ventilation and regular cleaning emerged as effective strategies for improving IAQ. These findings held important implications for comprehending the indoor–outdoor dynamics of diverse building air pollutants on campuses and their potential impacts on its population, offering valuable insights for enhancing IAQ.
Highlights
Indoor and outdoor PM concentrations are detected using low-cost sensors. Exposure varies depending on residence time and indoor PM concentration. There is a significant positive correlation between indoor and outdoor PM. Ventilation and cleaning are effective in improving indoor pollution, with the lowest PM levels in the dining hall.
Introduction
Air pollution is considered one of the most serious environmental threats to human health. 1 The World Health Organization (WHO) has reported that nearly all individuals worldwide (99%) are exposed to air quality levels above the WHO guideline limits. 2 Traditionally, particulate matter (PM) has become an important indicator for human assessment of both indoor and outdoor air quality. 3 PM10 (particles <10 microns) can penetrate the respiratory system, reaching the lungs, while PM2.5 (particles <2.5 microns) can even enter the bloodstream. 4 Elevated PM concentrations have been associated with increased mortality and morbidity related to respiratory and cardiovascular diseases. 5 In summary, depending on the degree of exposure and the susceptibility of the exposed individual, air pollution can lead to a range of acute and chronic health issues, including but not limited to eye irritation, headaches, cancer, and, in severe cases, even death.6,7 With people spending approximately 90% of their time indoors, indoor air pollution may have more health effects than outdoor pollution.8–11
Generally, there are both indoor and outdoor sources of indoor PM concentrations, such as human activities (e.g. breathing, exercise, smoking, cooking), building materials (e.g. releases from carpets, paints, furniture) and equipment (e.g. the use of air conditioners, humidifiers, computers and printers),12,13 as well as influences from the outdoor environment.14–17 Therefore, a comprehensive understanding of the interactions between indoor and outdoor pollutants and their effects on indoor air quality (IAQ) is essential. A variety of factors, such as building layout, air exchange rate, outdoor air pollution levels, intensity and type of indoor activities, have been found to have an impact on influencing changes in indoor PM concentrations, with large differences in observed concentrations in different microenvironments.18–22 Some regression models have enabled researchers to predict the spatial and temporal variations of indoor PM2.5 more accurately and analyse the key factors affecting indoor PM2.5 concentrations.23–25 These findings offer valuable references for studying the impacts of various emission sources on indoor environments.
Buildings on university campuses have significant differences in the types and levels of air pollutants due to their corresponding administrative functions. For instance, in laboratories, which are usually equipped with a large amount of instrumentation and experimental raw materials, the types and concentrations of pollutants may be more complex and significant than in offices or classrooms. Additionally, differences in pedestrian densities and foot traffic in different buildings can lead to large differences in air pollutant exposure.13,26 Recently, there has been some progress in research addressing IAQ on university campuses.27–29 For example, Bai et al. 30 found that on campus, the contribution of outdoor sources to IAQ is significantly lower in autumn and winter than in spring and summer due to indoor window opening behaviour. Aldekheel et al. 31 found that air purifiers have capture efficiencies of more than 95% for ultrafine and coarse particles. Current IAQ research increasingly emphasises the necessity of assessing contributions from pollution sources and inhalation exposures, especially in buildings with varying levels of activity.32–34 Lyu et al. 35 used real-time field measurements to find that different cooking treatment methods had a significant impact on the variations in indoor PM concentrations and emission rates in the kitchen. Özlü et al. 36 evaluated exposure risk according to the inhalation dose in different microenvironments. However, most of the current research focuses on the impact of different emission sources on PM concentration in specific environments while ignoring the indoor–outdoor variability of different microenvironments, failing to provide high-resolution studies of indoor–outdoor relationships. Meanwhile, there is limited research quantifying PM exposure in different microenvironments within campuses.
Therefore, this study explores the variations in air pollutant concentrations across different indoor and outdoor environments within a university campus, utilising the Fucheng Road Campus of Beijing Technology and Business University (BTBU) as a case study. Six distinct sampling sites (a dormitory, an office, a laboratory, a classroom, a dining hall and a library) were selected for analysis. Employing low-cost sensors, indoor and outdoor PM concentrations at these locations were collected to examine the correlation between their indoor and outdoor levels, with due consideration on the influence of temperature and relative humidity. Additionally, the inhalation exposures in different microenvironments were also compared. Thus, this study aimed to provide a comprehensive understanding of the indoor–outdoor relationships and exposures of air pollutants in different buildings on campus, and to provide useful insights for the development of more effective control strategies for IAQ and the improvement of the indoor environment.
Materials and methods
Research area
The air samples were collected on the Fucheng Road Campus of BTBU from 1 to 31 March 2023, which is located at No. 11 and No. 33, Fucheng Road, Haidian District, Beijing, China (116.32°E, 39.93°N). The campus is surrounded by major traffic routes, including Fucheng Road, Xisanhuan North Road, Zengguang Road, Fucheng Road and North Third Street, with no prominent pollutant sources nearby. This campus covers a total area of 210,000 m2, with a construction area of 202,500 m2 and a green area of about 44,200 m2. There are more than 6000 teachers, students and staff on Fucheng Road campus. As shown in Figure 1, considering the variations in different uses, foot traffic and peaks of foot traffic, six locations were chosen: a dormitory, an office, a laboratory, a classroom, a dining hall and a library.
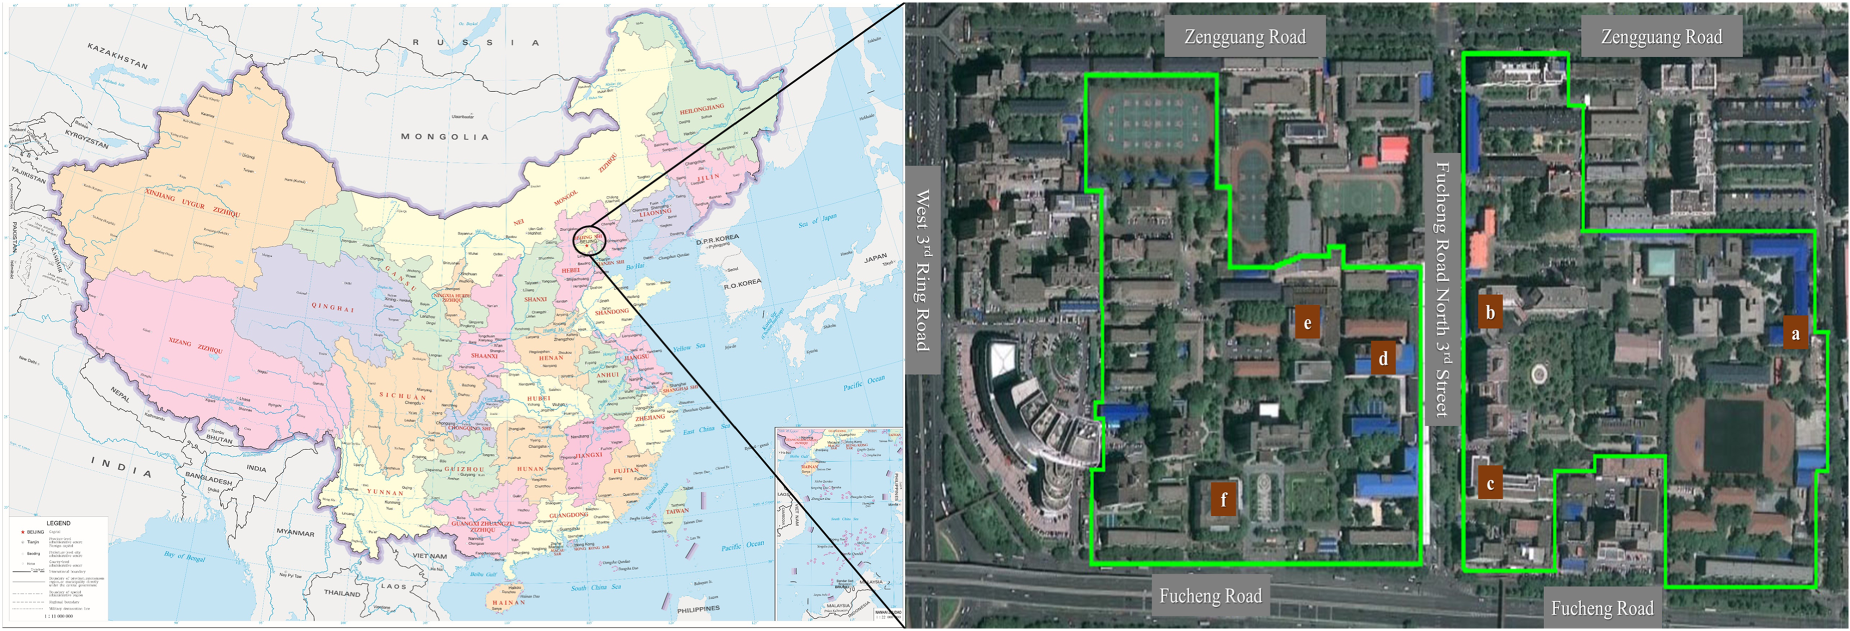
Locations of six sampling sites (a: dormitory, b: office, c: laboratory, d: classroom, e: dining Hall, and f: library) at campus of Beijing Technology and Business University, Beijing, China.
The driving time of motor vehicles on campus is concentrated in the morning and evening, but the most important mode of transportation is still walking. On 15 March 2023, central heating in Beijing was discontinued at 24:00 h (local time). The Library and the classroom were heated by the central system, but the other four locations were heated by radiators, indoors equipped with hanging air conditioning. The behaviour of opening and closing doors and windows was more intricate, with the state determined by the habits of indoor occupants. Smoking was prohibited in all the selected indoor monitoring locations. Building characteristics, frequency of indoor cleaning activities, types and characteristics of ventilation, use of air conditioning, and personnel activities were counted by researchers at the six locations. The basic information is documented in Table 1.
Basic information of each location (dormitory, office, laboratory, classroom, dining hall and library).
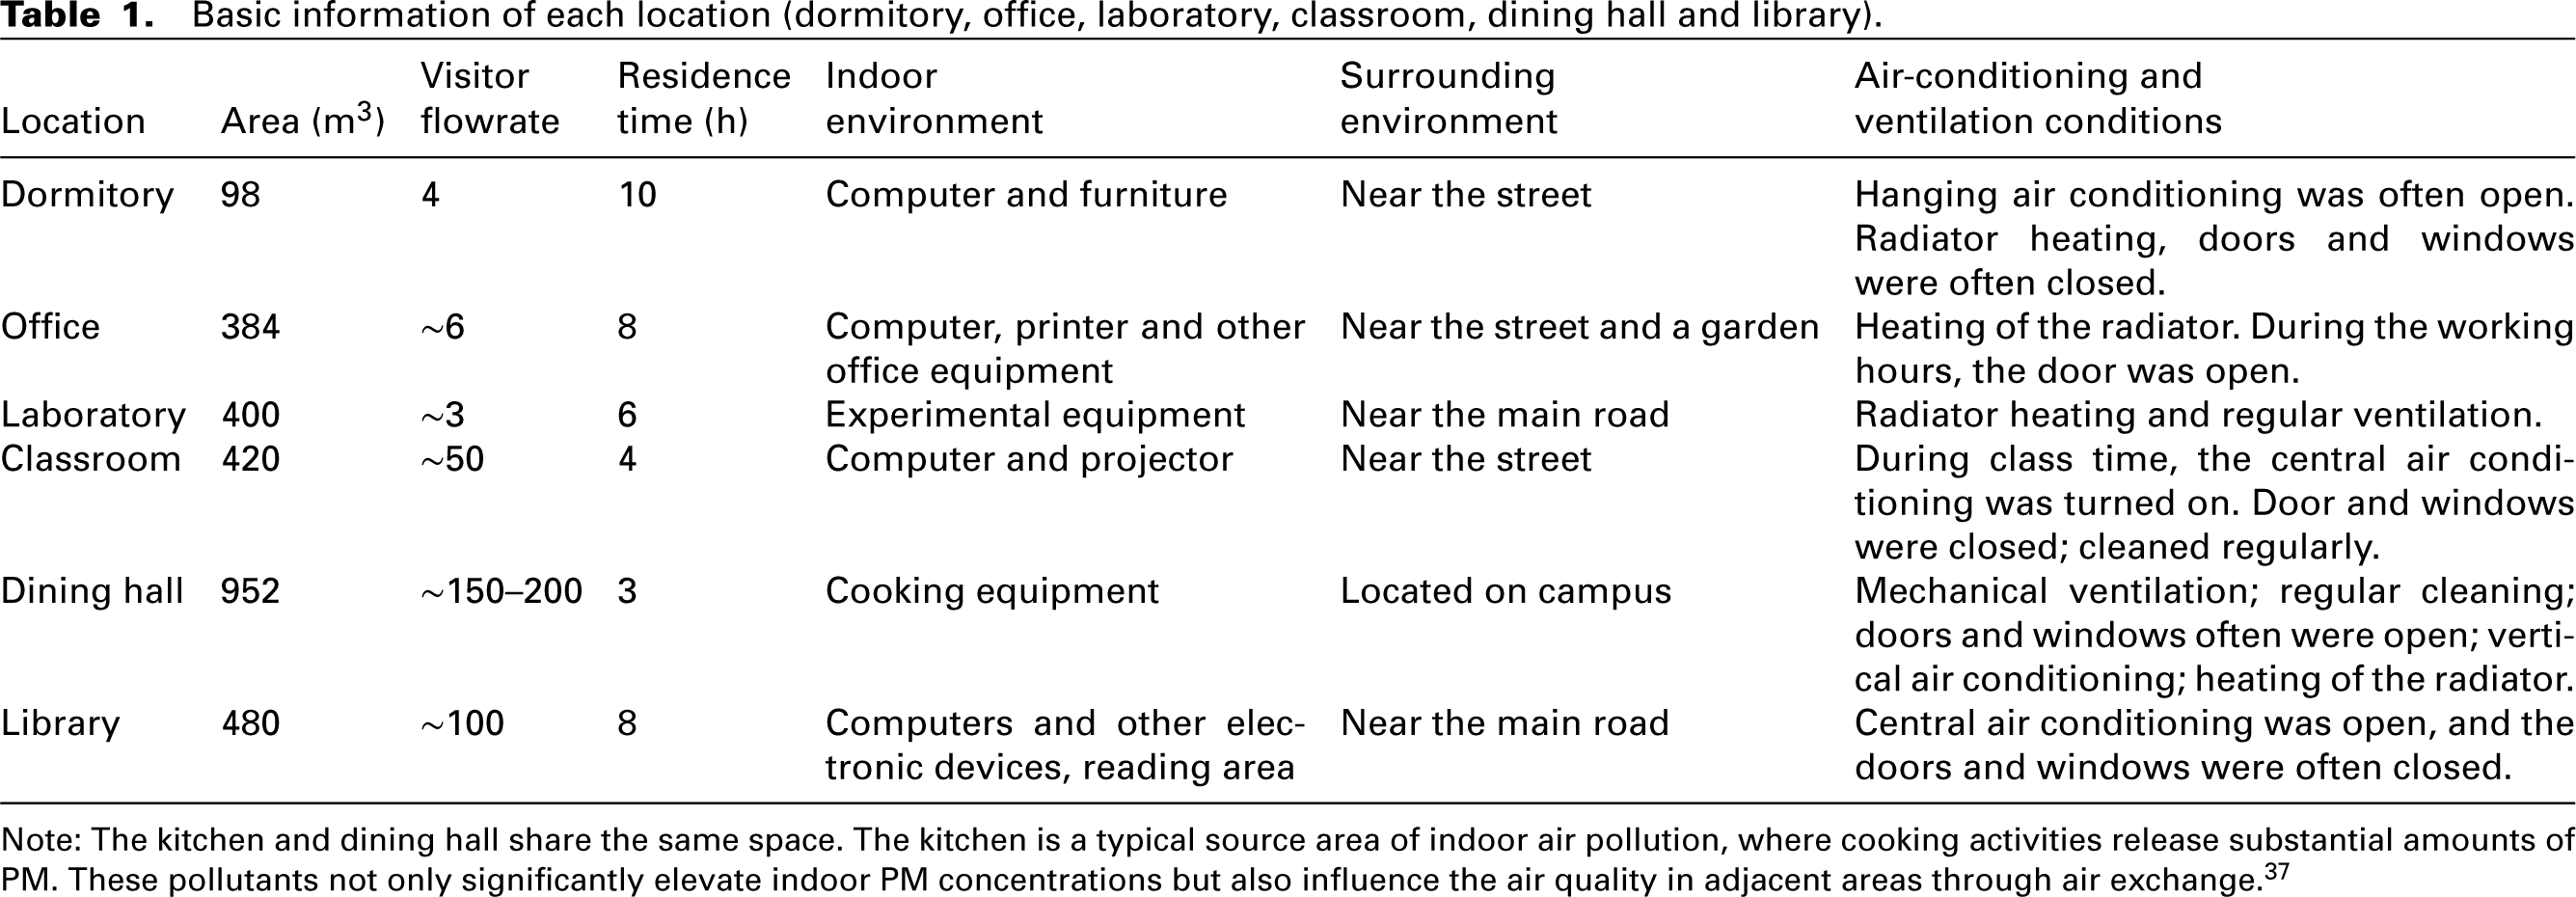
Note: The kitchen and dining hall share the same space. The kitchen is a typical source area of indoor air pollution, where cooking activities release substantial amounts of PM. These pollutants not only significantly elevate indoor PM concentrations but also influence the air quality in adjacent areas through air exchange. 37
Sensors and sample collection
The PM low-cost sensors used in this study measured microenvironment air pollution. Each device was equipped with a laser scattering sensor (Plantower PMS3003), a steady-speed fan and a measuring module for both temperature and relative humidity with a monitoring resolution of 2 min and data recorded in a built-in storage card. These sensors were utilised in several previous studies. Their operational details can be found in Li et al. 38 and Shen et al., 24 having the advantages of being cheap and providing continuous measurements in real time. Operating on the principle of light scattering, these types of sensors provide real-time monitoring of ambient PM concentration. Before the field activity, the PM sensor had been calibrated against a PM monitor (model 5030 synchronised hybrid ambient real-time particulate monitor, SHARP). The instrument was placed together with the sensor in open-air conditions for long-term calibration experiments in air conditions with different levels of pollution.
In March 2023, PM sensors were deployed in a dormitory, an office, a laboratory, a classroom, a dining hall and a library, measuring indoor (labelled Ina to Inf) and outdoor (labelled Outa to Outf) concentrations of PM1, PM2.5 and PM10 for 24 h. To ensure representative measurements, the indoor sampling points were positioned more than 1 m away from doors, windows and walls, approximately 1.5 m from the ground, which was similar to the breathing height of people, and avoided the vents. The outdoor sampling points were primarily situated on rooftops, balconies or outdoor open areas near indoor sampling points, ensuring no evident pollutant emission sources in the vicinity. Fixed monitoring at various sites allowed for characterising spatial differences in PM concentrations over time in adjacent areas.
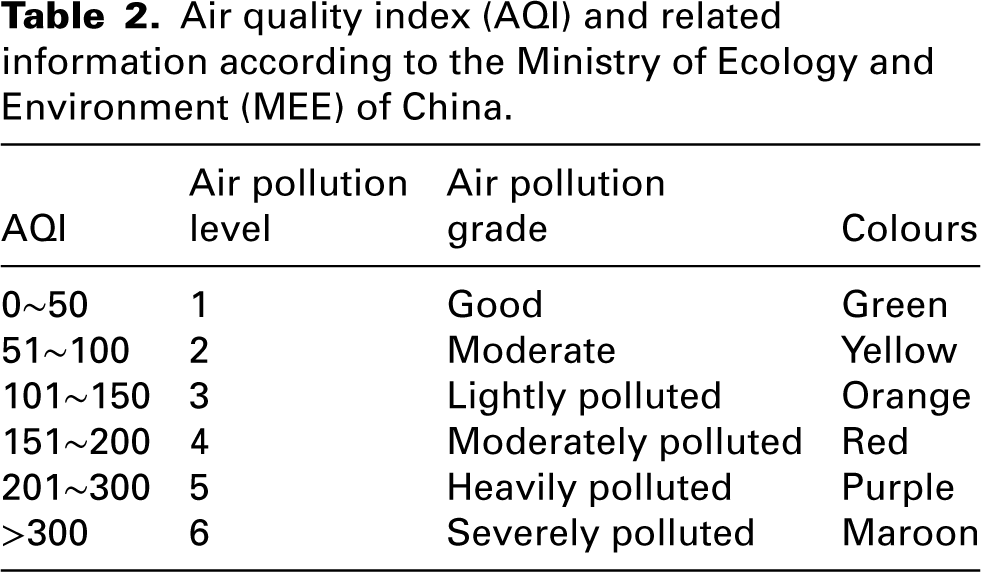
Ambient PM2.5 and PM10 were collected by the local meteorological department (the Ministry of Ecology and Environment of the People's Republic of China, MEE, https://air.cnemc.cn:18007/). Wind speed, outdoor temperature and outdoor humidity parameters were obtained from the National Aeronautics and Space Administration (NASA) as a 24-hour average. Beijing was still in winter from 1 to 26 March, and spring has begun since 27 March. According to the air quality data from MEE, during the monitoring period, Beijing experienced 19 days with good or moderate air quality, accounting for 61.3% of the period. The best air quality day was on 1 March, with an air quality index (AQI) of 40 (Table 2, China. MEE HJ 633-2012). A total of 3 days in which the air quality was poor or above: on 5 and 10 March with heavy pollution and on 22 March with severe pollution, and identifying PM2.5 as the main pollutant. The worst air quality was recorded on 22 March, achieving an AQI of 500.
Air quality index (AQI) and related information according to the Ministry of Ecology and Environment (MEE) of China.
Statistical analysis
To describe the variations in PM concentrations across different microenvironments, we computed descriptive statistics of air pollutant concentrations in the study area, including the mean, standard deviation (SD) and indoor/outdoor (I/O) ratio, during the monitoring period. The relationship between indoor and outdoor PM concentrations was expressed through the I/O ratio as equation (1).
39

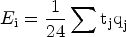
PM2.5 exposure in different microenvironments was estimated using equation (2).
40
The datasets underwent normality testing using the Shapiro–Wilk test. One-way analysis of variance (ANOVA), Non-parametric tests and Spearman correlation analysis were used to evaluate the relationship between PM concentration as a response variable and other parameters (e.g. temperature, relative humidity). All statistical analyses were conducted using SPSS Statistics 26. An alpha level of 95% confidence interval was used to determine the statistical significance of the analyses.
Results and discussion
PM pollution levels and variations
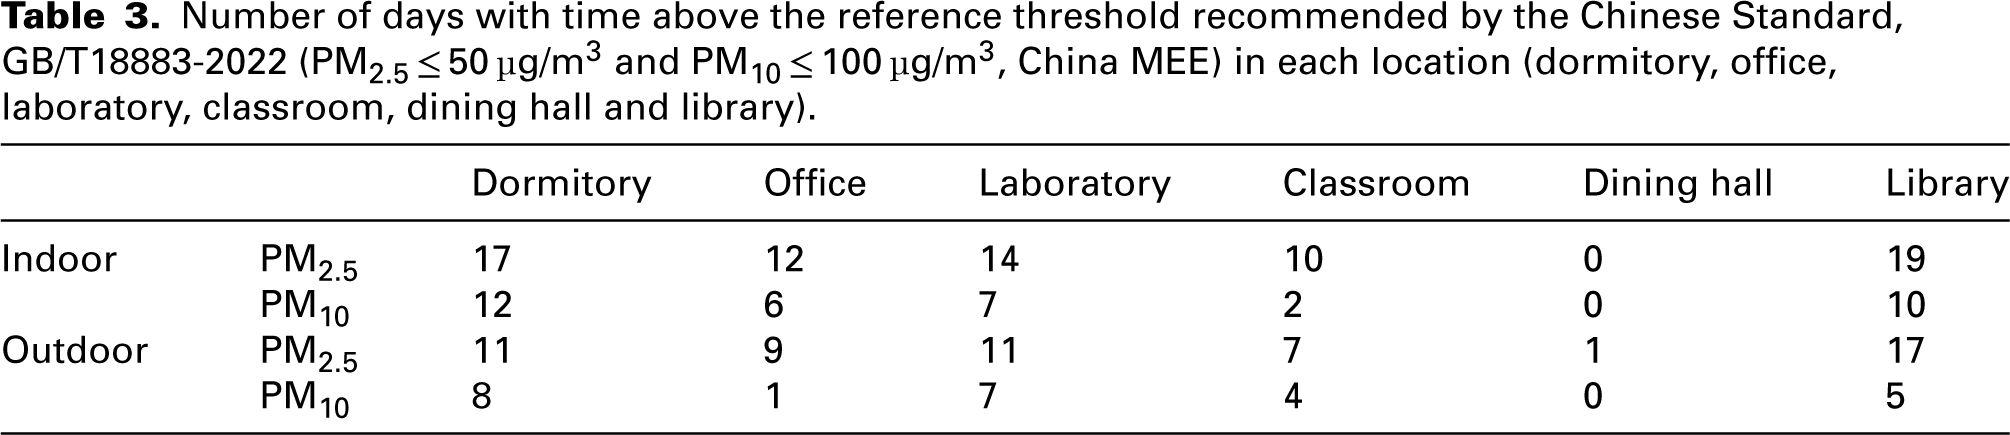
As depicted in Tables 3 and 4, during the monitoring period, only the average daily concentrations of PM2.5 and PM10 in the dining hall complied with the limited concentrations of the IAQ standard specified by the Chinese Government (PM2.5 ≤ 50 µg/m3 and PM10 ≤ 100 µg/m3, China, MEE GB/T18883-2022). 41 Conversely, the rest of the locations had some days that exceeded the standard thresholds. At present, there are currently no standard concentration limits for PM1. The average daily concentration values of indoor PM1 were mainly distributed below 40 µg/m3. Notably, the excessive concentrations of PM2.5 in the library were the most serious. Indoor PM2.5 concentrations exceeded the standard limit for 19 days (61.3%), while outdoor PM2.5 concentrations exceeded the standard value for 17 days (54.8%). Regarding PM10 concentrations, the dormitory had the worst exceedances, with 12 days (38.7%) indoors and 8 days (25.8%) outdoors. According to WHO Guidelines 42 (the 24-hour average concentration limit is less than or equal to 15 µg/m³), the IAQ on all days was classified as poor when the library outdoor PM2.5 concentrations exceeded 75 µg/m3, while when outdoor PM2.5 concentration was in the range of 15−75 µg/m3, only 10% of the time indoor PM2.5 concentrations met the WHO Guideline value (Figure 2). On the whole, during periods of heightened outdoor pollution, IAQ correspondingly deteriorated, meaning that indoor air was affected by outdoor air pollution, 43 consequently can pose detrimental effects on human health.
Number of days with time above the reference threshold recommended by the Chinese Standard, GB/T18883-2022 (PM2.5 ≤ 50 µg/m3 and PM10 ≤ 100 µg/m3, China MEE) in each location (dormitory, office, laboratory, classroom, dining hall and library).
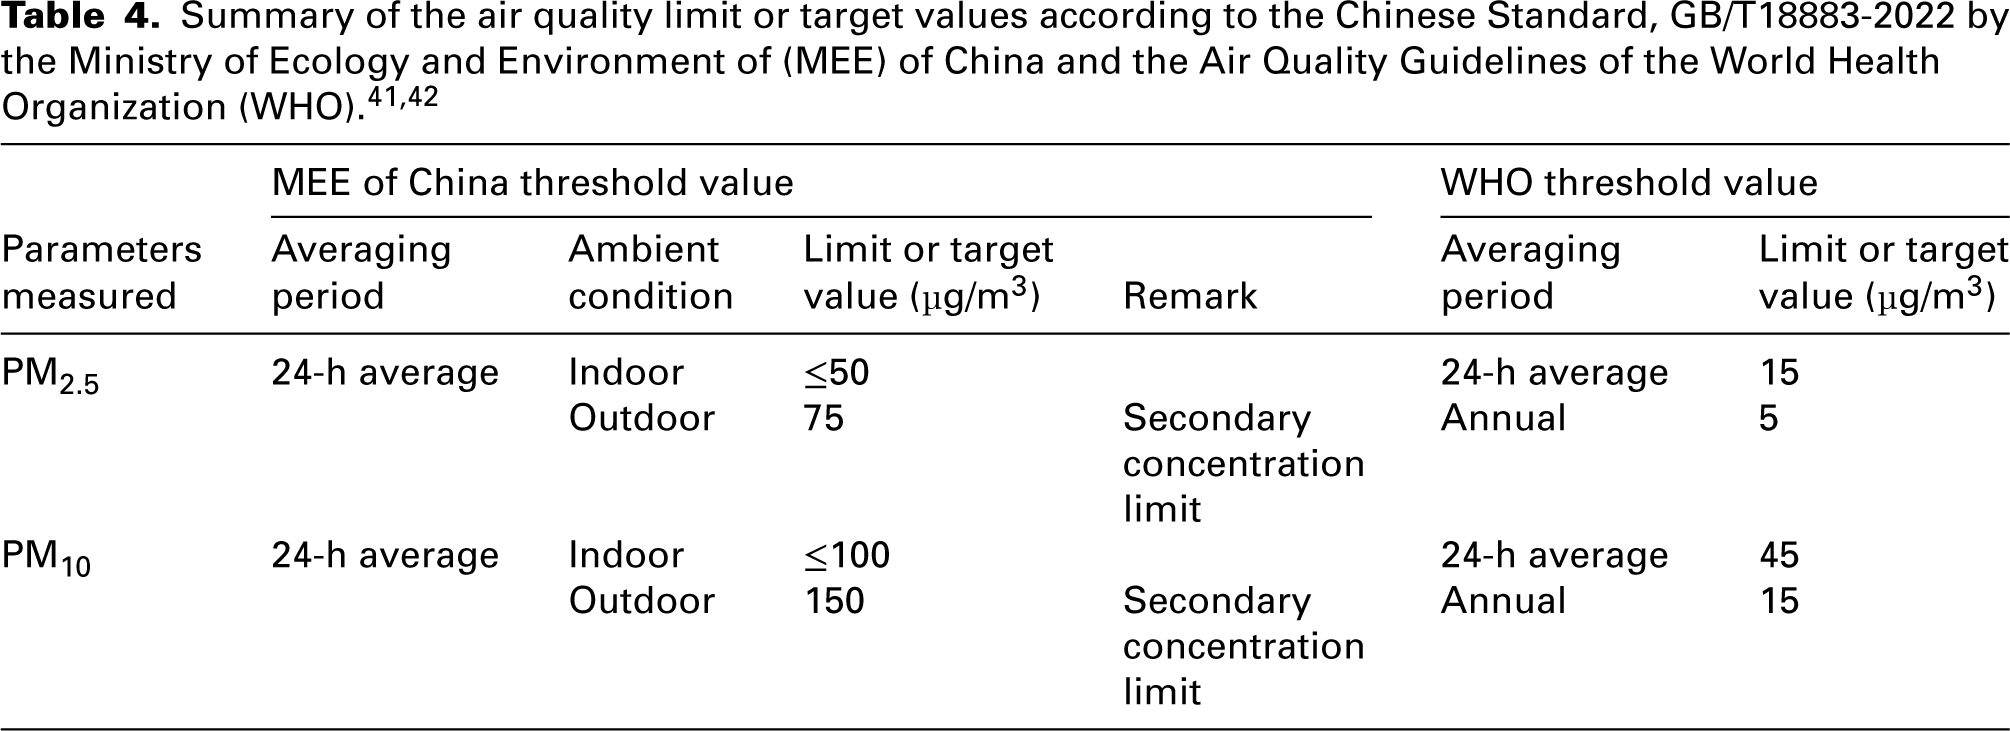
Distributions of daily indoor PM2.5 concentrations in colour with different outdoor air pollution levels (<15, 15−75, and >75 µg/m3 from inner to outer circles) in the library.
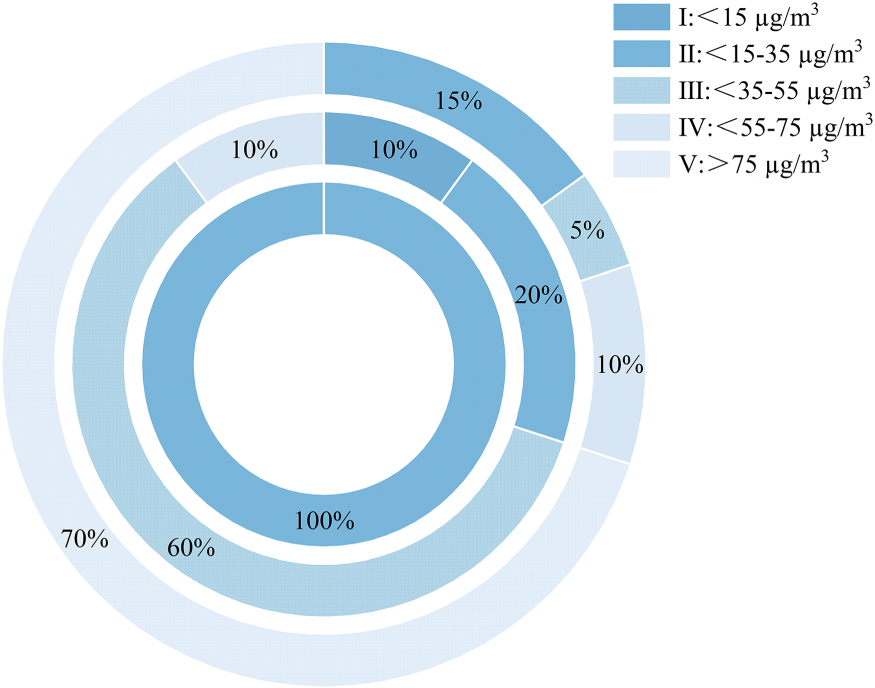
Descriptive statistics (mean, standard deviation, standard error, median, mode, minimum, maximum and range) and I/O ratios of air pollutants in each location (dormitory, office, laboratory, classroom, dining hall and library).
Note: SD: standard deviation; SE: standard error of means; I/O: indoor/outdoor ratio; “_” was used to indicate that the mode could not be determined for the corresponding dataset.
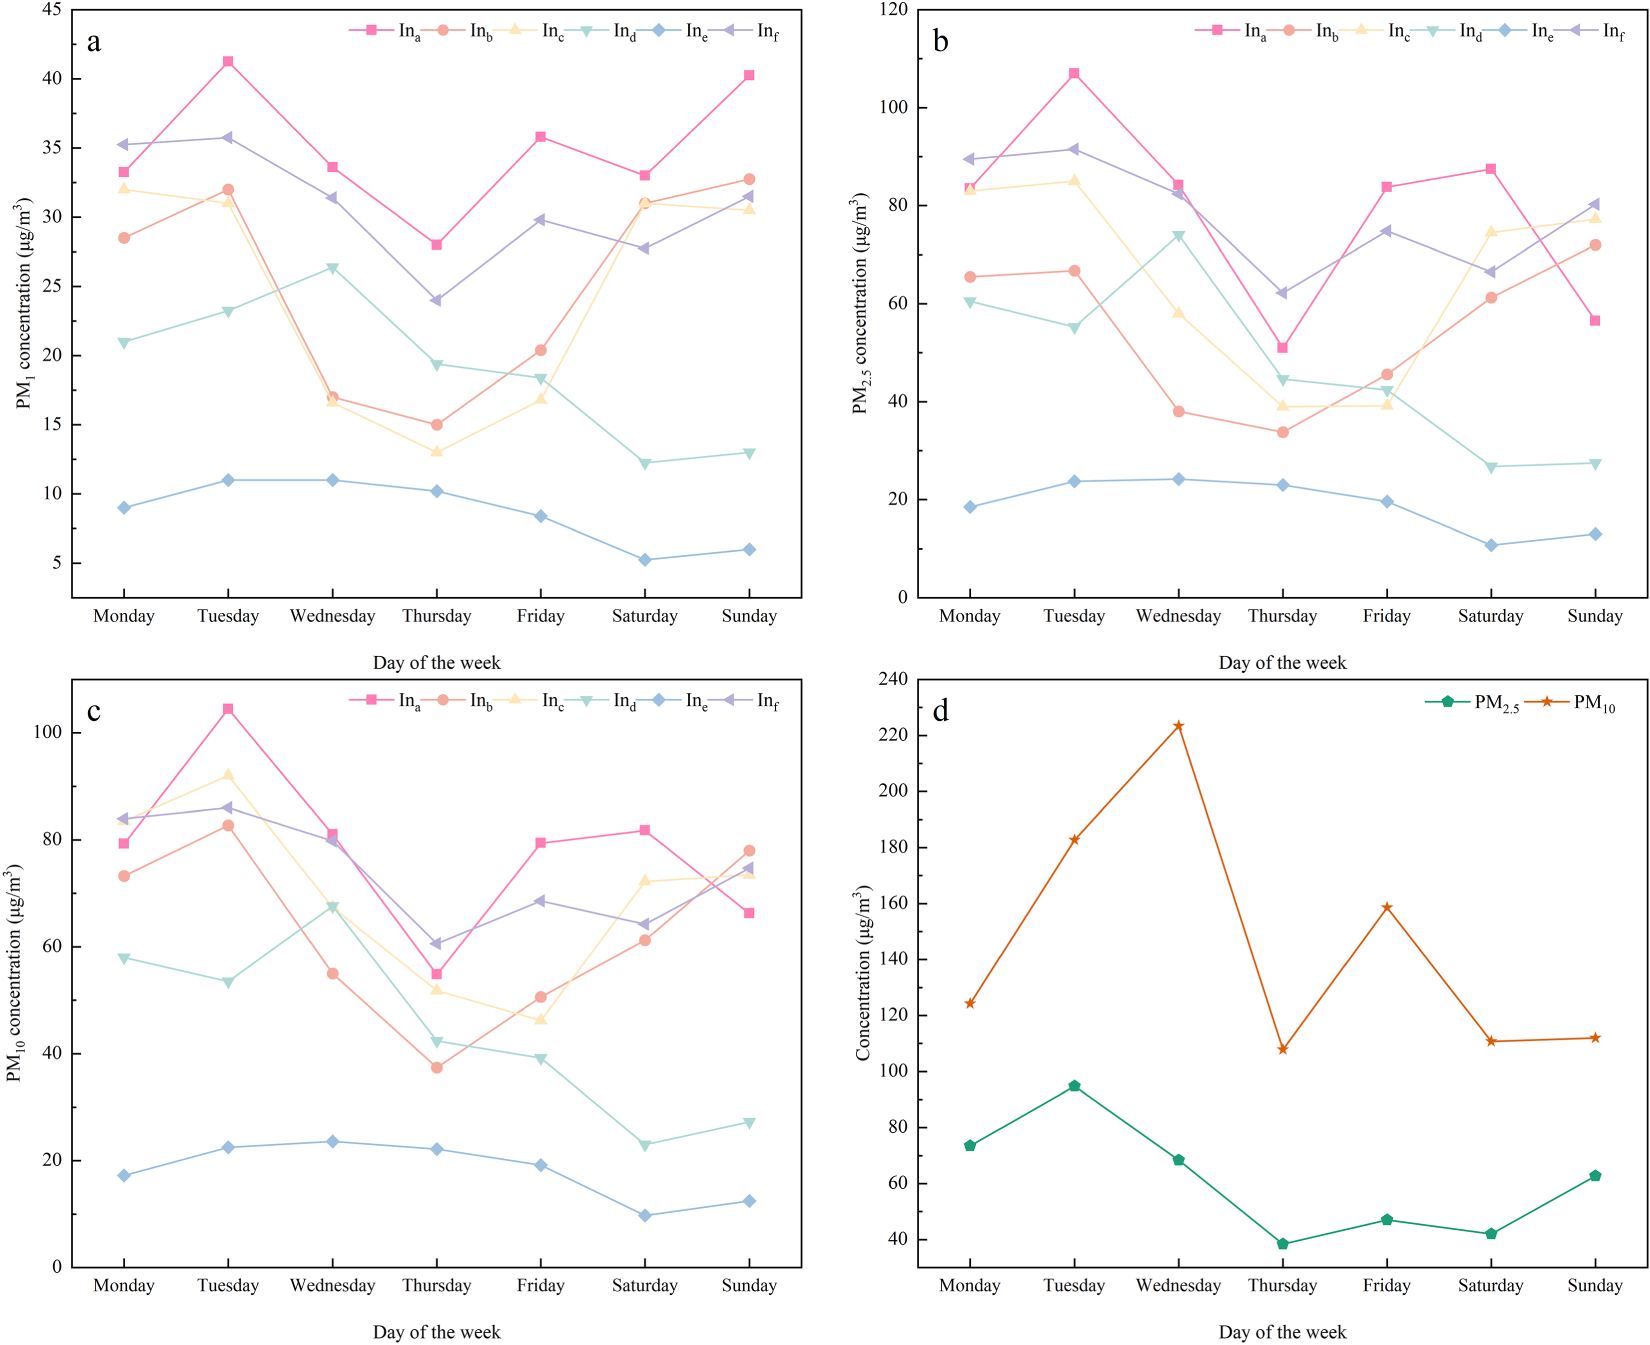
The average PM concentration on various days of the week in each location (a: dormitory, b: office, c: laboratory, d: classroom, e: dining hall and f: library). (a) indoor PM1, (b) indoor PM2.5, and (c) indoor PM10 and (d) atmosphere PM.
Descriptive statistics of air pollutant concentrations and I/O ratios are presented in Table 5. During the sampling period, the coefficients of variation (COVs, defined as SD divided by the mean) of indoor PM10 concentrations were highest in the dining hall (72%), while the highest COVs of PM2.5 (84%) and PM1 (86%) were observed in the laboratory. The variations in indoor PM fractions and their concentrations were primarily related to the differences in PM sources across different microenvironments. The laboratory typically performs a wide variety of experimental activities involving the use of different equipment and the manipulation of chemicals, which can lead to drastic fluctuations in the concentrations of PM size fractions. In the case of the dining hall, which has a high level of personnel activity during peak meal times and the largest flow of people relative to other locations (about 150–200 people with a daily stay of about 3 hours), increasing human activities would enhance the production of PM and the resuspension of coarse particles. 44 In addition, indoor-outdoor air exchange also affects concentration fluctuations. Compared with other places, the dormitory and library have poor ventilation and higher sealing, which makes the concentration fluctuation of PM less, and less affected by outdoor air quality.
The study also observed (Figure 3) a general decreasing trend of pollutant concentrations from Tuesday to Thursday, with a slight increase from Saturday to Sunday, which might be partly related to variations in human activities and atmospheric pollutant concentrations. In general, the dining halls have a high level of cooking activities, cleaning agents and air fresheners, and there was a high flow of people at a given time, all of which can generate a large amount of PM. However, the data indicated that the dining hall had the lowest average daily concentrations of PM and the best air quality, which was closely connected with ventilation, cleaning and the use of cooker hoods every day. Due to the decrease in the number of people eating in dining hall during weekends and the decrease in cooking frequency, the PM2.5 concentration in the dinning hall was decreased by up to 55.58% during the weekend compared with that during weekdays. Similarly, decreased occupancy in classrooms during weekends resulted in PM2.5 concentration falling by up to 63.85% relative to weekdays. These phenomena all indicate that the type and frequency of indoor activities can have a significant impact on PM concentration.
Summary of Spearman correlation coefficients (ρ) between outdoor PM and ambient PM for each location (dormitory, office, laboratory, classroom, dining Hall and library). The ρ values were calculated for the whole campaign period.
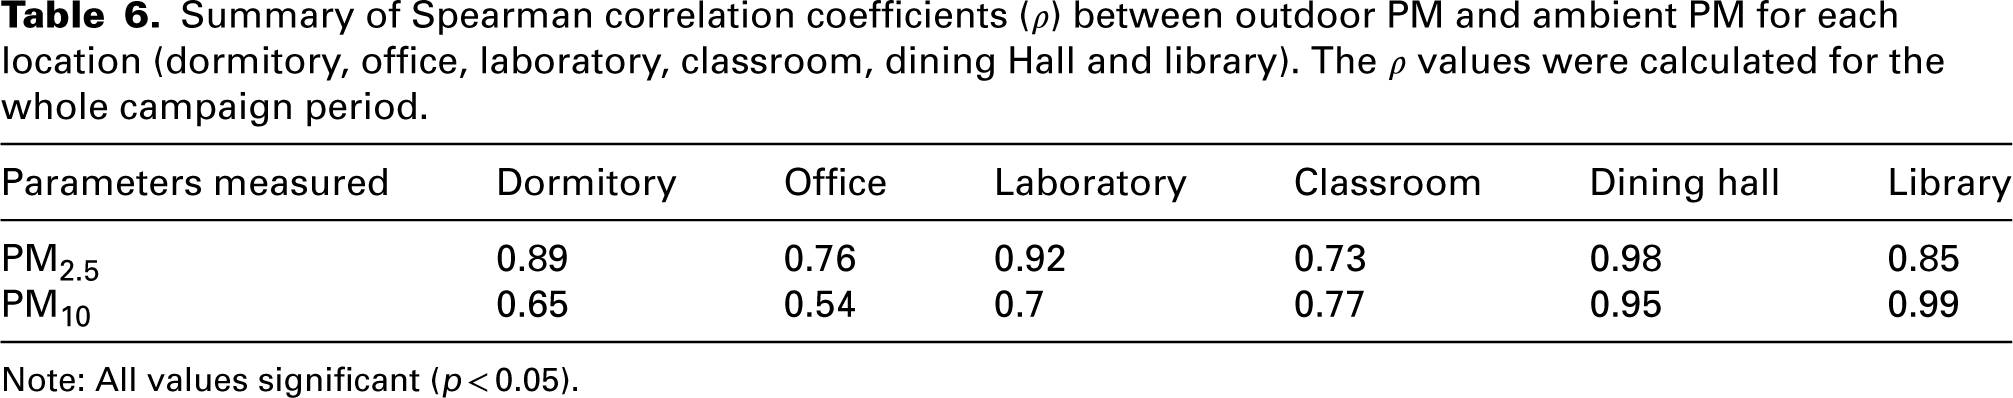
Note: All values significant (p < 0.05).
Spearman correlation coefficients (ρ) between the indoor and outdoor PM size fractions (PM1, PM2.5 and PM10) in each location (dormitory, office, laboratory, classroom, dining Hall and library) during the monitoring period.
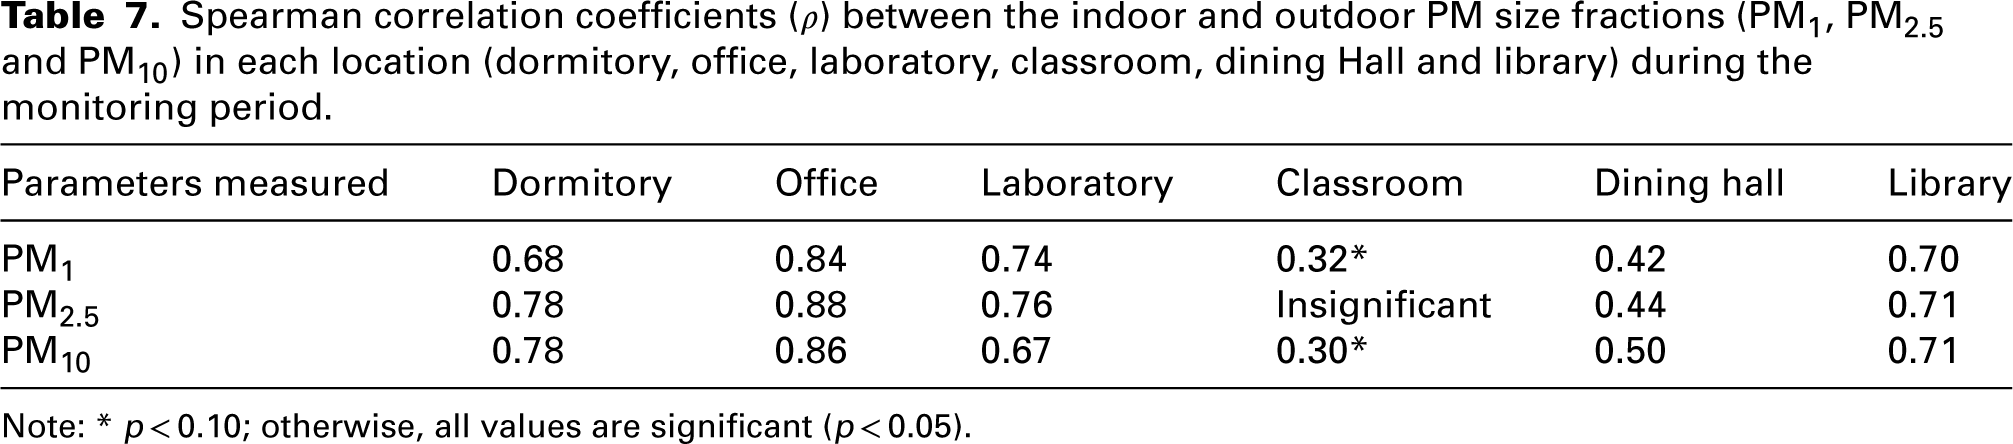
Note: * p < 0.10; otherwise, all values are significant (p < 0.05).
Relationship between indoor and outdoor PM
The I/O ratio depends on a variety of factors, 45 including location, architectural design, activity and time, which can indicate the relationship between the indoor pollutant concentrations and their corresponding outdoor level. As shown in Table 5, the I/O ratios for most PMs were approximately equal to or less than 1.0 (range 0.46−0.92) in all locations, which was similar to the findings of Madureira et al. 44 and Qiu et al. 46 Low I/O ratios are closely related to the low number of indoor sources, the use of filtration or the air tightness of the building. 39 Amongst the microenvironments studied, I/O ratios were higher for PM2.5 than PM10, which may be due to the higher permeability and lower settling rate of PM2.5 compared to PM10.39,47 Besides, greater I/O values was found in the dormitory compared to other locations, which can be attributed to the resuspension of PM due to the internal activities of their occupants. 48 A certain amount of PM may settle on indoor surfaces, such as floors, walls and furniture. If not cleaned for a long time, these particles would also be resuspended in the air. Activities such as enhancing indoor ventilation, cleaning the indoor environment regularly, and using air purifiers are effective measures for reducing indoor PM concentrations.49,50
The average daily concentration of outdoor PM2.5 at the six locations was positively correlated with ambient PM2.5 concentration (ρ ≥ 0.73), as was PM10 concentration (ρ ≥ 0.54) (Table 6). This correlation suggests that the variations in outdoor PM2.5 and PM10 concentrations at the six locations mirrored the environmental variations, influenced by meteorology and specifically atmospheric pollutants. No discernible additional PM pollution sources were identified. The data presented in Table 7 demonstrated a significant and positive correlation between outdoor and indoor PM levels, suggesting some interactions between both environments. This finding confirmed the results obtained by Chen and Zhao 39 showing the transfer of air pollutants from outdoor to indoor environments through natural ventilation, mechanical ventilation and infiltration. Moreover, this phenomenon was particularly pronounced when internal emissions were low and ambient air pollution was high. 24 Generally, frequent ventilation causes higher correlation between indoor and outdoor PM levels, but the opposite was measured in the dining hall. This can be attributed to the sources of PM in the dining hall were mainly cooking and personnel activities. This variability of sources may attenuate the PM correlation between the indoor and outdoor environment. In addition, the dining hall area is large, the ventilation mode would lead to a complex air flow path, and the air exchange efficiency is different in different regions and time periods. There are large differences in indoor PM concentrations, so the correlation between indoor and outdoor PM concentrations was not inferior to that of other locations.
F-test values for the linear regression analysis of indoor and outdoor PM in each location (dormitory, office, laboratory, classroom, dining Hall and library).
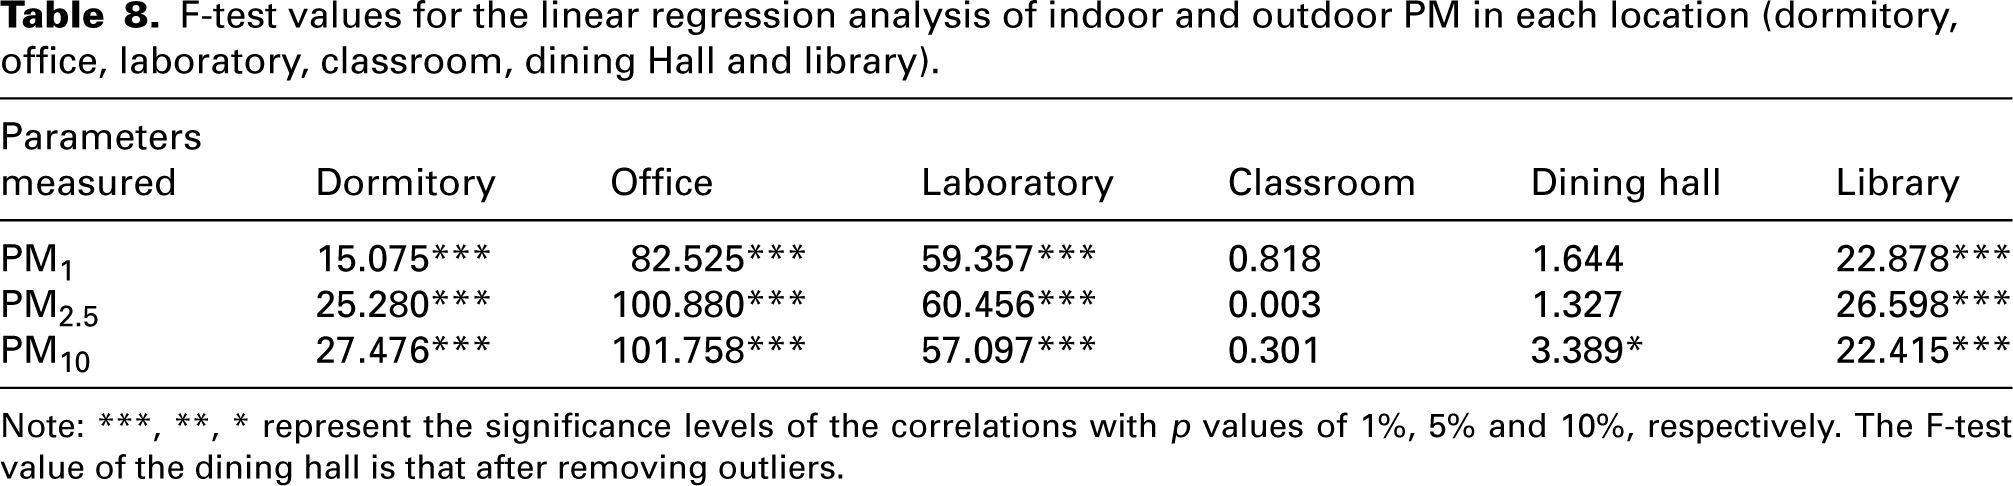
Note: ***, **, * represent the significance levels of the correlations with p values of 1%, 5% and 10%, respectively. The F-test value of the dining hall is that after removing outliers.
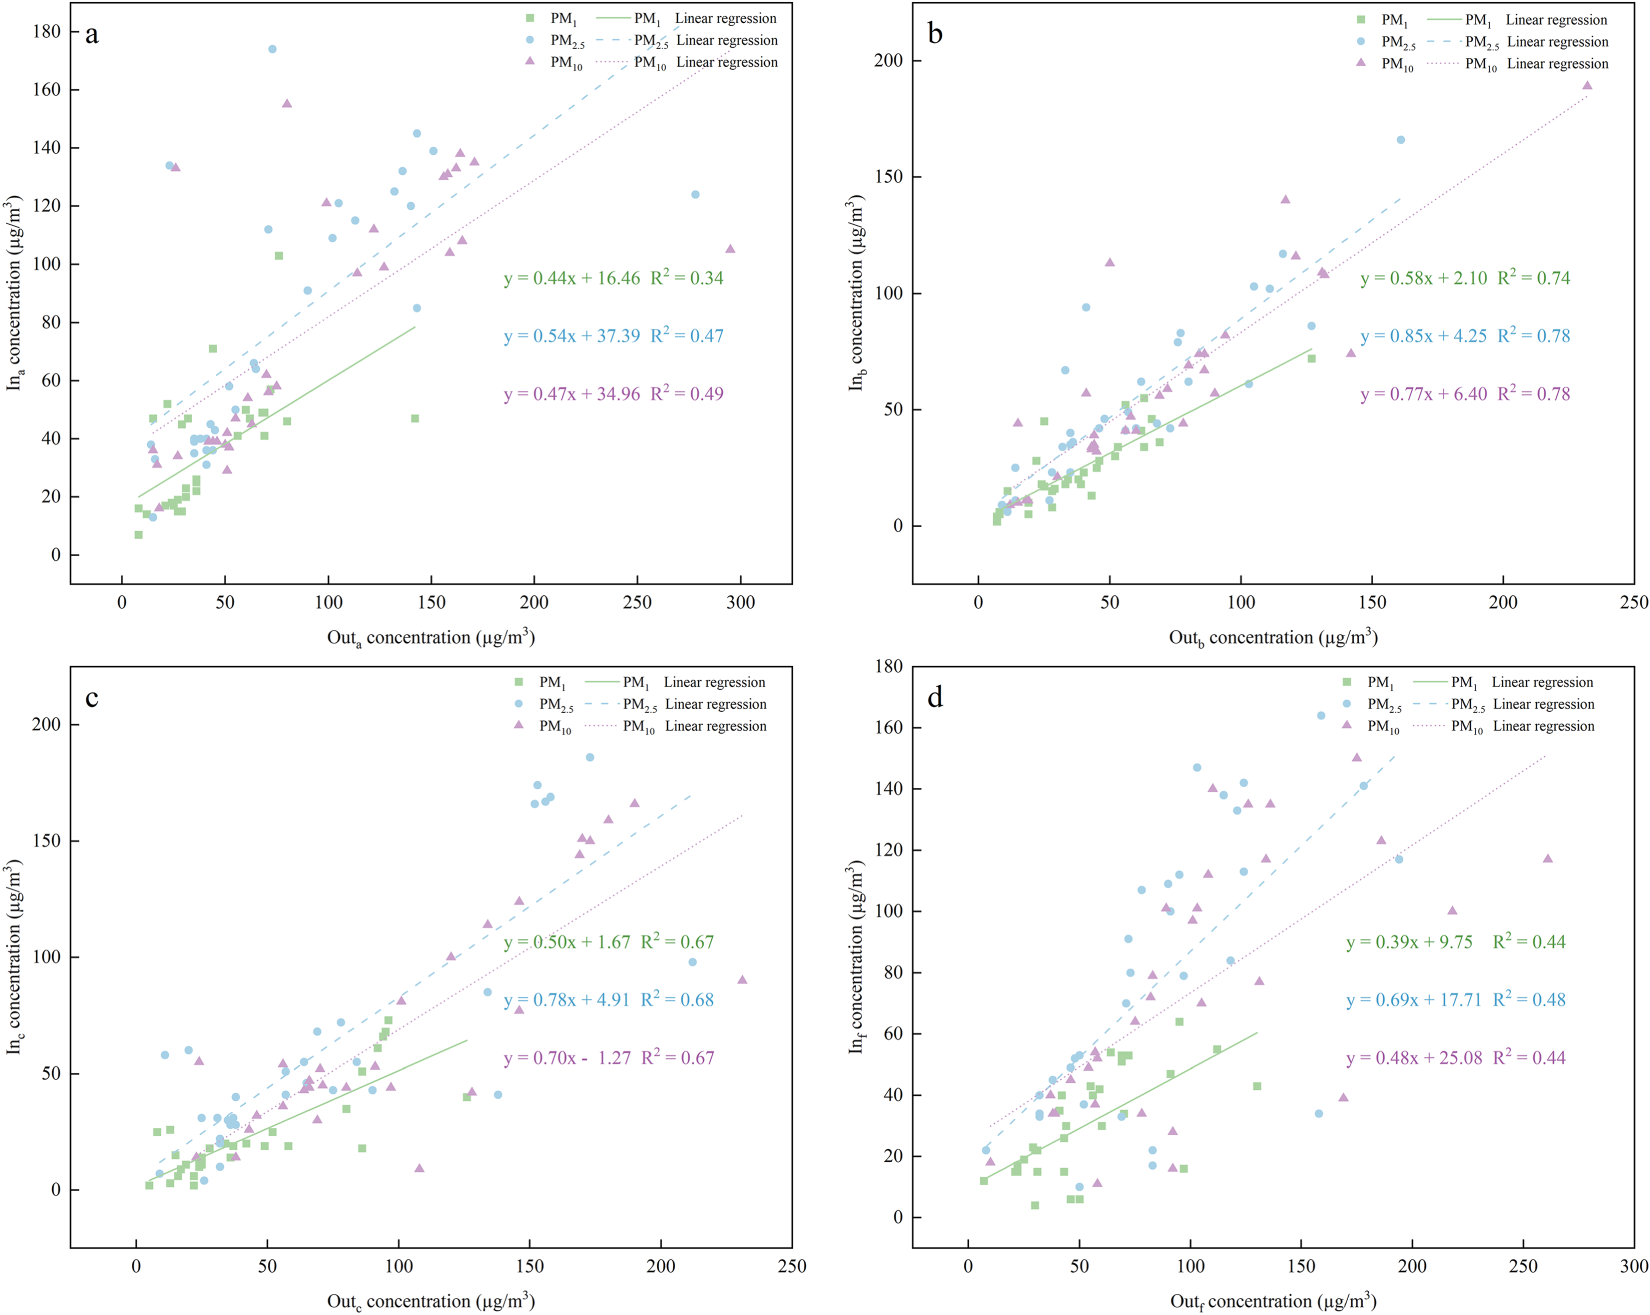
Relationship between indoor and the corresponding outdoor concentrations of PM size fractions (a: dormitory, b: office, c: laboratory, d: library). The line shown is linear fit values.
The coefficient of determination (R2) between indoor and outdoor PM concentrations can serve as an indicator to quantify the influence of outdoor infiltration on indoor PM levels. 32 However, the linear regression model between the indoor and outdoor concentrations at two sampling locations, the dining hall and the classroom, did not reach the level of statistical significance (p < 0.05, Table 8), thus precluding further analyses. Activity intensity, air tightness and equipment usage are different in different microenvironments. Taking PM1 as an example (Figure 4), when there was no obvious indoor pollution source (e.g. the office), outdoor air pollution accounted for 74% of the difference in indoor air pollution, but when there were significant indoor pollution sources (e.g. the dormitory and library), outdoor air pollution explained 34%–44% of the variance in indoor PM concentration pollution. These findings indicated that for offices, outdoor air pollution was a major contributor to indoor air pollution. In this regard, the seasonal influence played an important role. The office personnel density was small, and the door was generally open when there were people. The doors and windows of the dormitory and library were closed for long periods during the cold period. Thus, the low ventilation (air change rate) and good air tightness resulted in limited outdoor infiltration. Conversely, the use of equipment (air conditioners or computers) as well as indoor activities (e.g. cleaning) increased the indoor PM concentrations, resulting in lower outdoor impacts in relation to other locations.9,30 For PM2.5 and PM10, a similar situation was observed. When there was a strong indoor PM emission source, the influence of outdoor PM on indoor PM would be weakened. Notably, a potential outlier in the data was observed in the measurement of PM10 concentration in the laboratory. Upon removing the outliers, the fit of the linear regression model improved to 67%, which was similar to that of the other PM size fractions.
Spearman correlation coefficients (ρ) between the coarse fraction (PM10-PM1) and the fine fraction (PM1) in each indoor location (dormitory, office, laboratory, classroom, dining Hall and library).
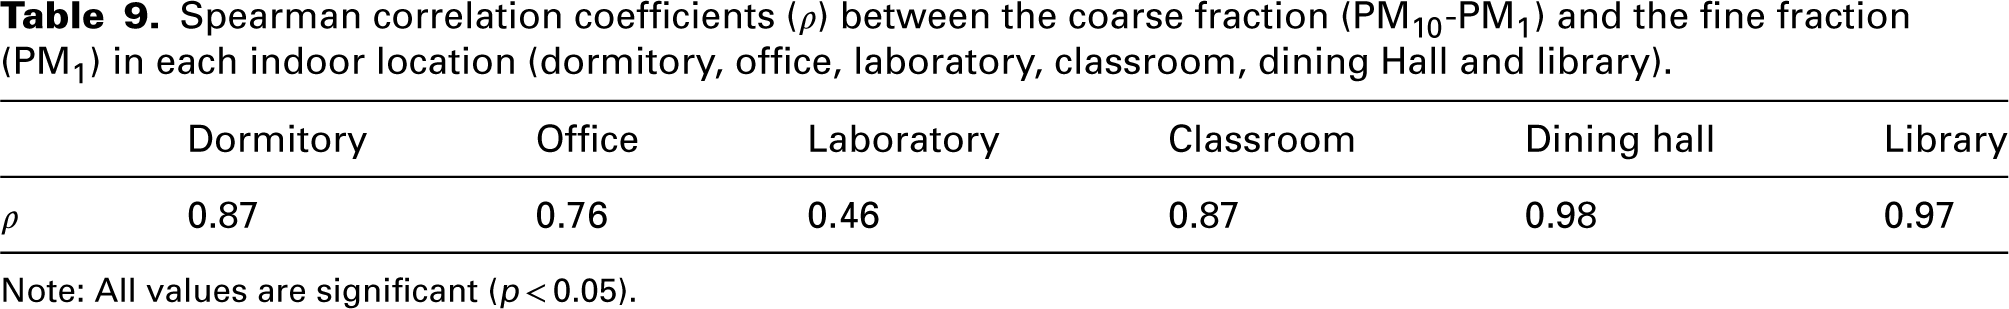
Note: All values are significant (p < 0.05).
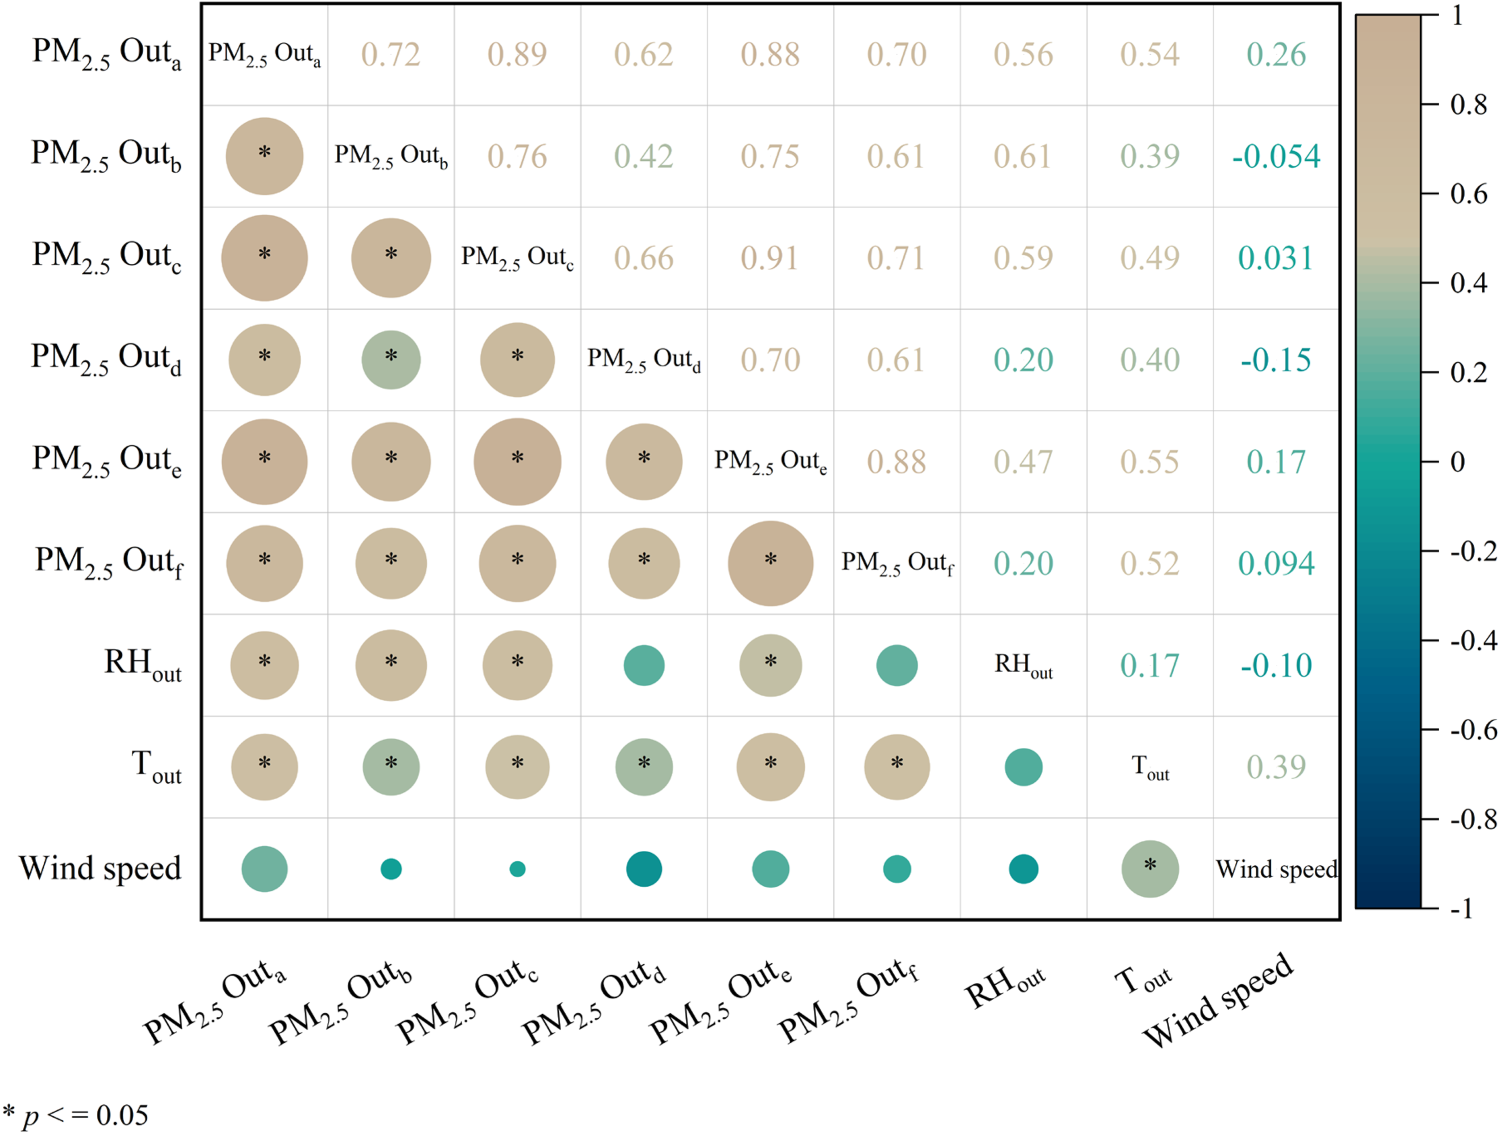
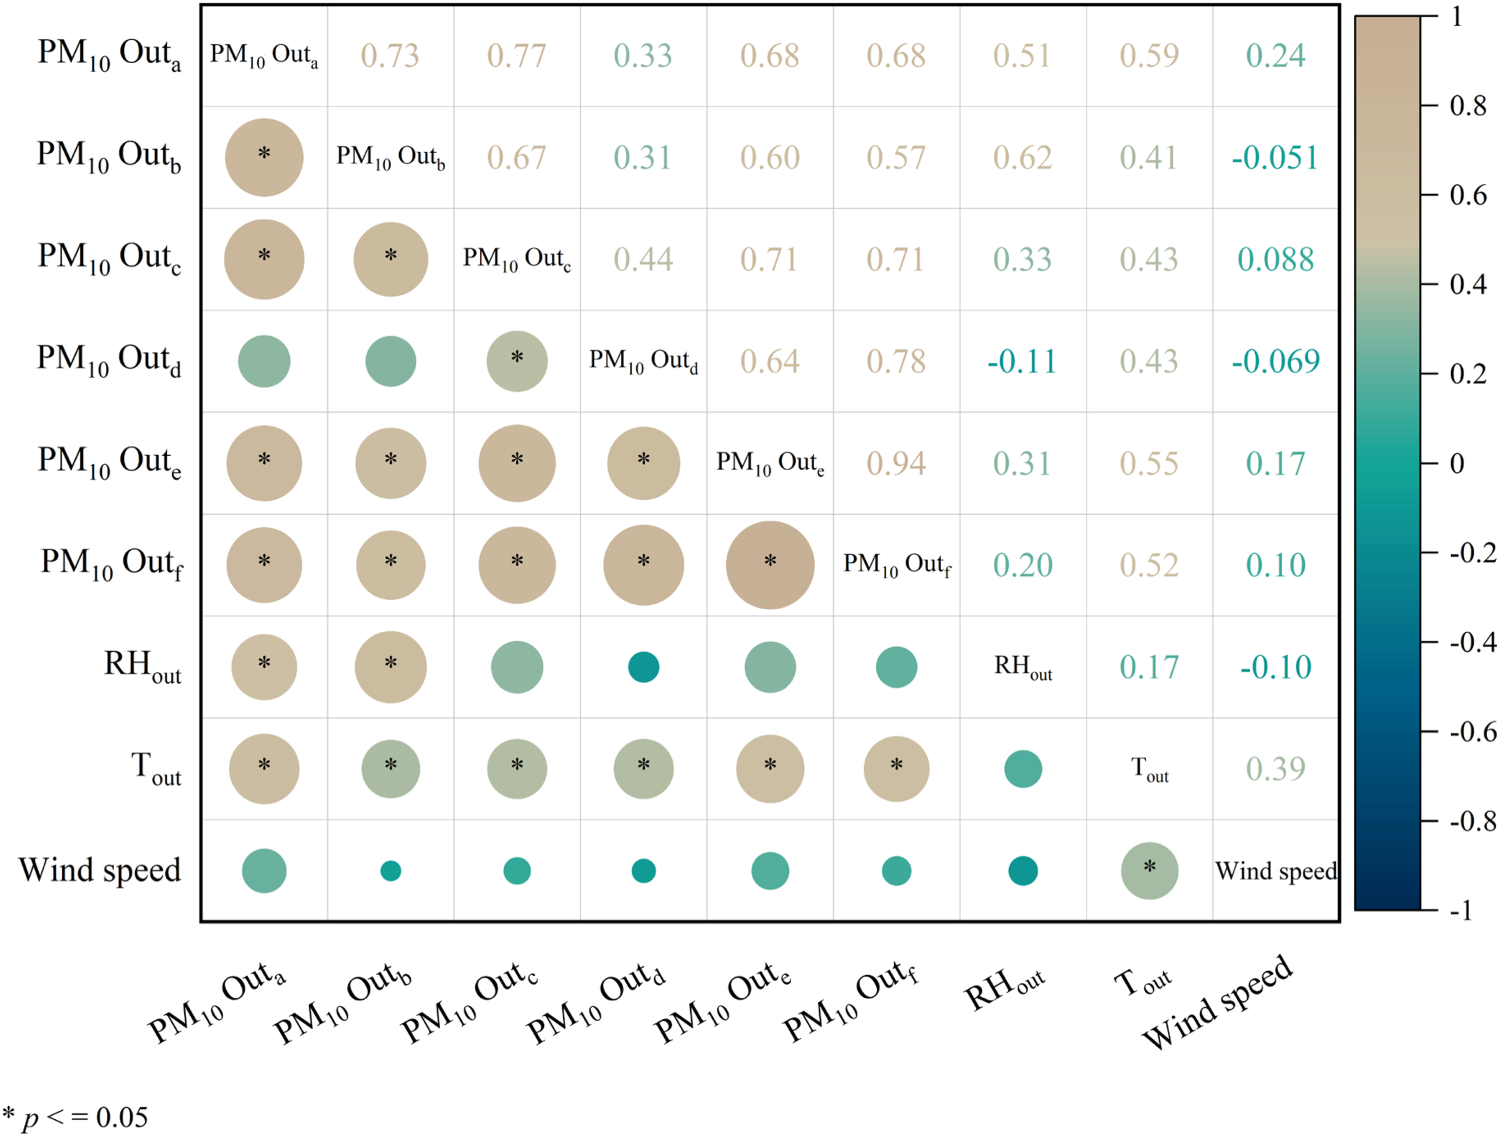
Matrix plots showing the correlation of outdoor PM2.5 concentration with outdoor temperature (Tout), outdoor relative humidity (RHout) and wind speed in the six locations (a: dormitory, b: office, c: laboratory, d: classroom, e: dining hall and f: library).
Moreover, the correlation between the coarse fraction (PM10-PM1) and the fine fraction (PM1) was also considered (Table 9). The correlation was strong, which may be because they had common pollution sources or were affected by similar environmental factors. The Spearman correlation coefficients for the library and dining hall were 0.97 and 0.98, respectively, significantly higher than the other sites, indicating a strong correlation between the coarse and fine fractions of these two sites. Conversely, the laboratory had a lower Spearman correlation coefficient of 0.46. This can be attributed to the large and highly variable sources of PM in the laboratory. The main sources of pollution were the use of experimental equipment and outdoor pollution. Timely ventilation and cleaning reduce the concentration of the coarse fraction and reduce the correlation between the coarse and fine fractions. In the dining hall, cooking activities were the main source of PM, producing large amounts of PMs. Despite frequent ventilation, the proportion of coarse and fine particles produced during cooking was relatively stable, the outdoor PM concentration in the dining hall was relatively low, and the external interference was small. The library was densely populated and had frequent activities, making the indoor particles resuspended. Additionally, the ventilation of the library was poor. After the outdoor pollution penetrated the room, it was difficult to discharge quickly, leading to the accumulation of PM. Therefore, the concentration variations in coarse and fine fractions in these two locations showed a high correlation. These findings were important for understanding the mechanisms of generation and dissemination of PM in different microenvironments and contributing to the development of targeted air quality management strategies. In environments with poor ventilation and a high concentration of PM (e.g., the library), ventilation and air purification measures should be strengthened. Besides, in environments with complex particulate sources (e.g. the laboratory), effective control measures were needed for specific sources of pollution.
Correlations between PM levels, temperature and relative humidity
Meteorological conditions could affect the variation in PM concentration in terms of accumulation, dilution, gas particle distribution and secondary formation. A Spearman correlation analysis was used to evaluate the relationship between different indoor PM size fractions and indoor and outdoor temperature, relative humidity and wind speed. A correlation coefficient matrix diagram depicting the relationship between outdoor PM2.5 concentration and wind speed, relative humidity and temperature was generated (Figure 5). In this study, the effect of wind speed was found to be insignificant, with relative humidity and temperature identified as the dominant factors. 51 As shown in Table 10, outdoor temperature was significantly and positively correlated with both indoor and outdoor PM levels. Most of the monitoring period was in winter, when the temperature was relatively low, the atmosphere was stable and PM was easier to accumulate, leading to an increase in concentration. Furthermore, when the wind speed was low, the diffusion capacity of PM was also limited accordingly.52,53 Indoor PM was positively associated with outdoor relative humidity. This relationship might be linked to the role of humidity in particle nucleation, condensation and volatilisation, where higher humidities could enhance the production of fine PM and contribute to pollutant accumulation and chemical reactions.1,54 As illustrated in Figures 6 and 7, the concentrations of PM1 and PM10 exhibited a similar relationship. Nevertheless, the impact of these comfort parameters on PM concentrations is dynamic, and the combined effects of multiple factors should be considered when assessing and controlling airborne PM concentrations.
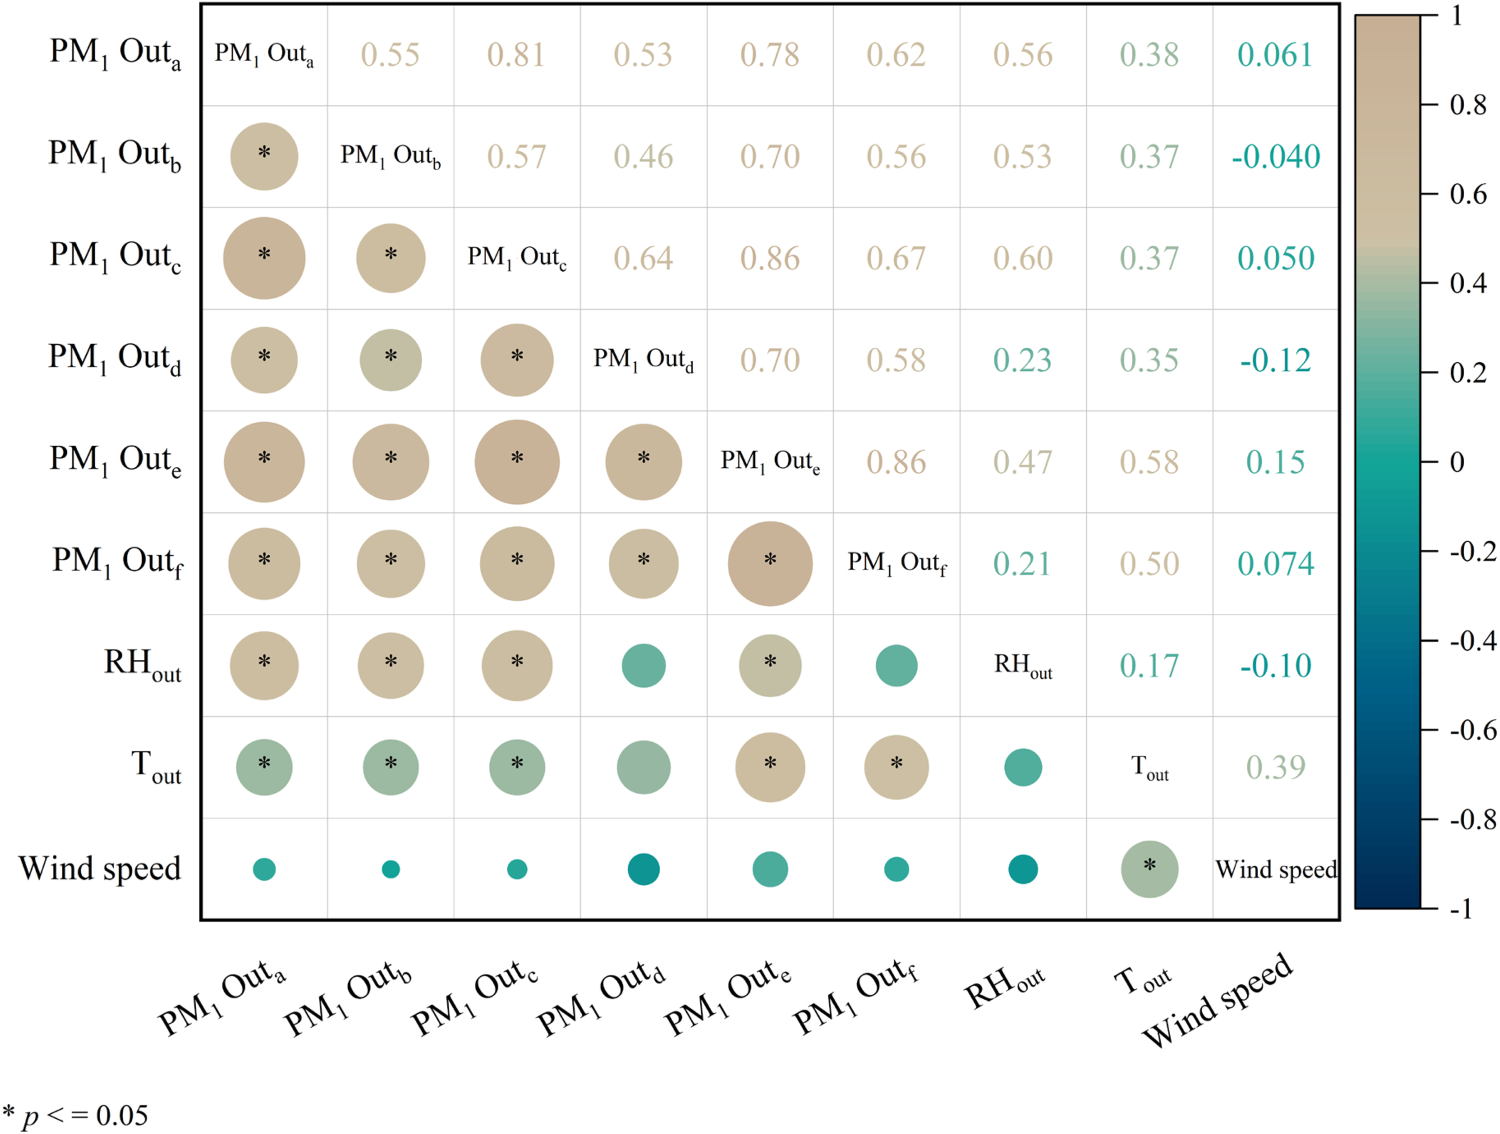
Matrix plots showing the correlation of outdoor PM1 with outdoor temperature (Tout), outdoor relative humidity (RHout) and wind speed in the six locations (a: dormitory, b: office, c: laboratory, d: classroom, e: dining hall and f: library).
Matrix plots showing the correlation of outdoor PM10 with outdoor temperature (Tout), outdoor relative humidity (RHout) and wind speed in the six locations (a: dormitory, b: office, c: laboratory, d: classroom, e: dining hall and f: library).
Spearman correlation (ρ) between temperature (T), relative humidity (RH) both indoor (in) and outdoor (out) and wind speed with all indoor size fractions (PM1, PM2.5 and PM10) in each location (dormitory, office, laboratory, classroom, dining hall and library).
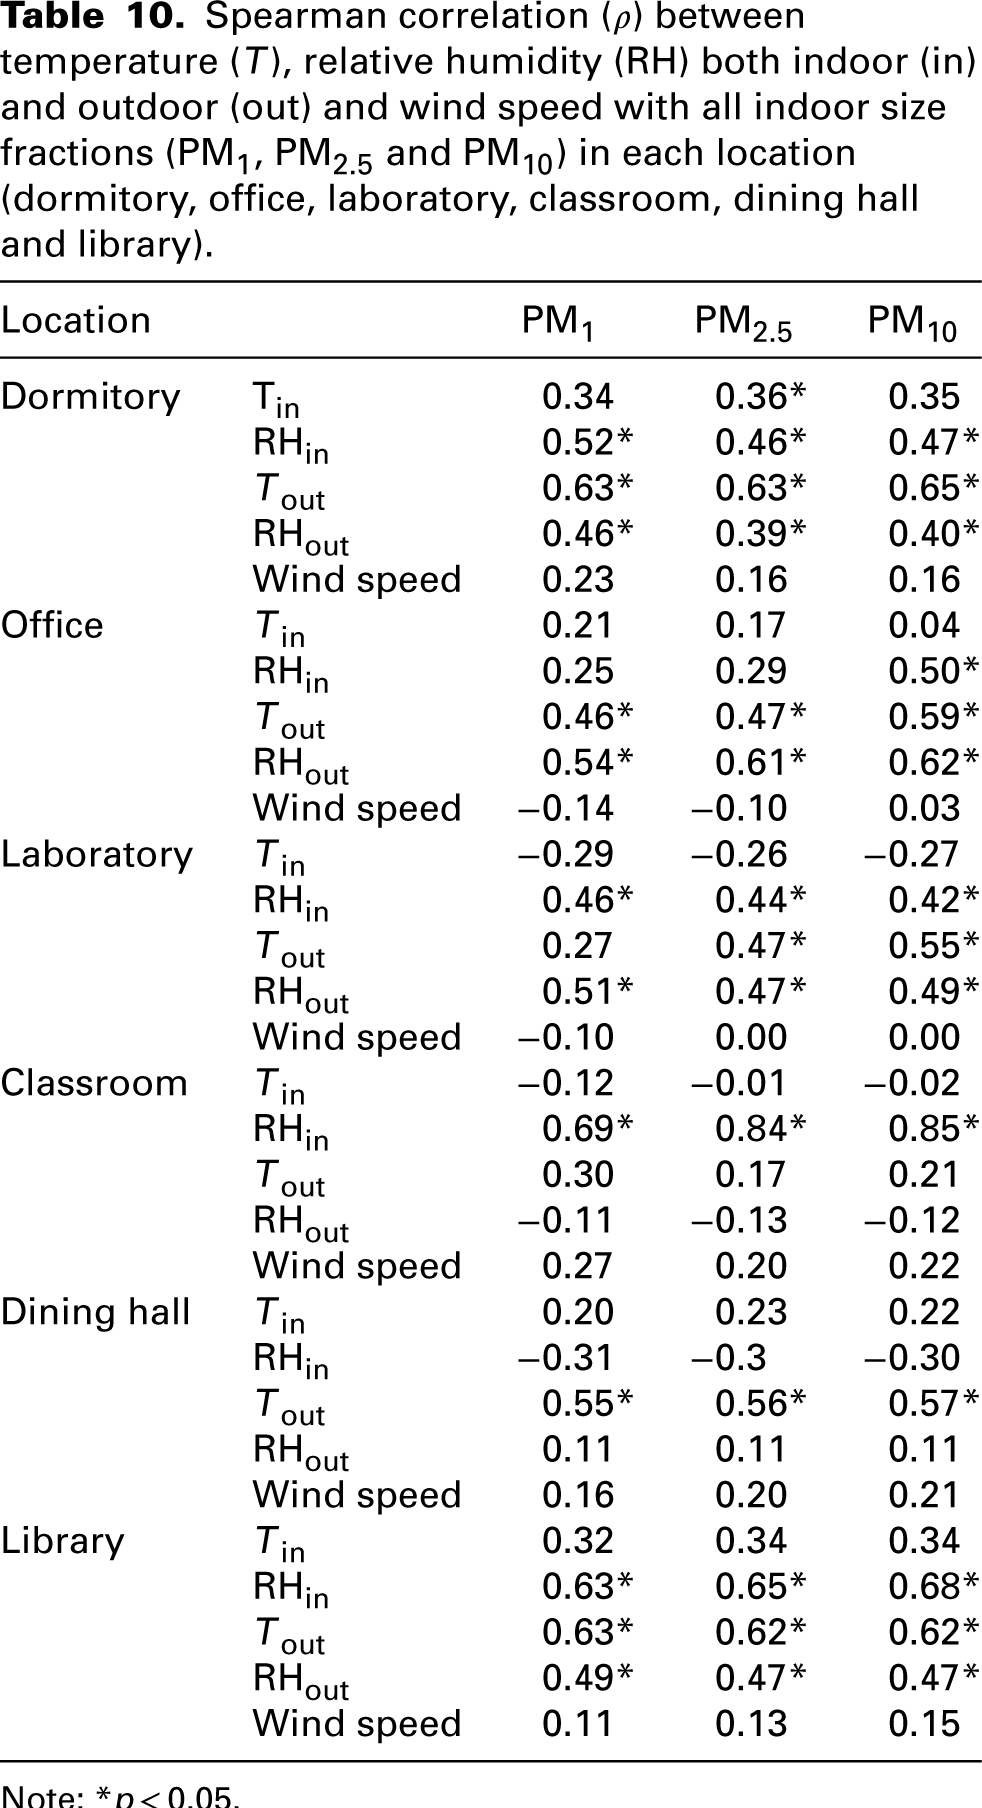
Note: *p < 0.05.
Average inhalation exposure
Differences in residence time and measured PM2.5 concentrations were observed in the different locations. The six selected sampling locations represent various types of campus places, covering the major activity areas where people study, work and reside. Dormitories are the primary residences for students, while dining halls and classrooms are venues for intensive, short-term activities for both students and teachers. Laboratories typically involve diverse experimental activities. Libraries and offices are places where students and teachers concentrate their studies and activities.
Exposure levels of the population in different environments were estimated by considering the measured concentrations and the residence in each microenvironment. The results illustrated in Figure 8 revealed differences in PM2.5 inhalation exposure concentration at various sampling locations. The highest mean population inhalation exposure was found in the dormitory (32.70 ± 18.67 µg/m3) and the lowest mean population inhalation exposure was found in the dining hall (2.41 ± 1.67 µg/m3), a 90% (p < 0.05) lower than the dormitory. This variation can be attributed to the fact that the highest and lowest values of indoor PM2.5 concentrations and residence time occurred in these two locations, respectively, indicating that a higher indoor PM2.5 concentrations and longer stays indoors lead to greater potential inhalation exposures. In this regard, interestingly, although PM2.5 concentrations were higher in the laboratory than in the office, the daily inhalation exposure in the laboratory (15.80 ± 13.25 µg/m3) was less than that in the office (17.73 ± 12.26 µg/m3). This is because people stay longer in the office compared to the laboratory. This highlights the need to consider the effects of both concentration and residence time in assessing indoor PM2.5 inhalation exposure.
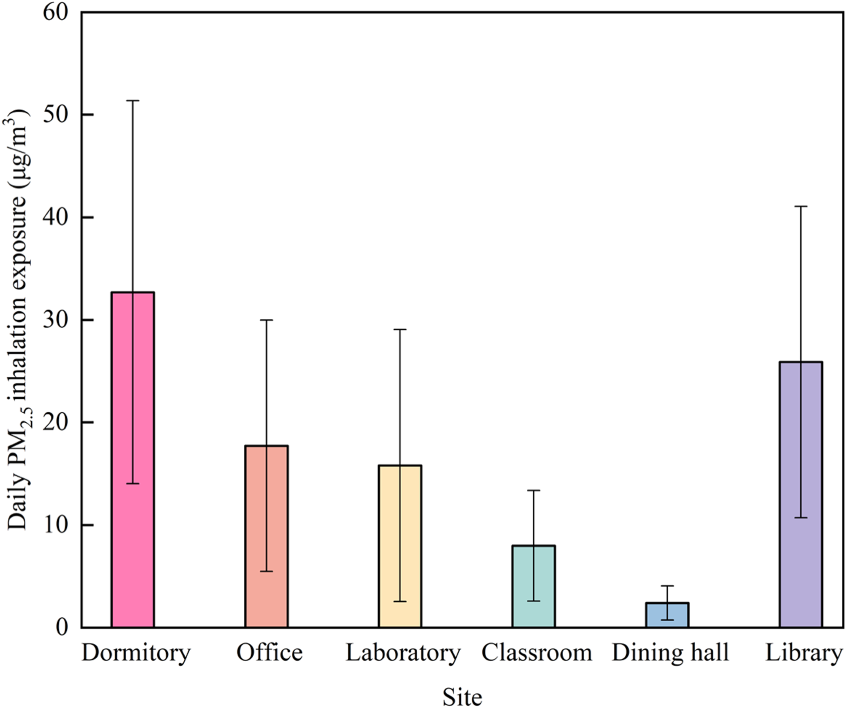
Daily estimation of PM2.5 inhalation exposure in the six measurement locations (dormitory, office, laboratory, classroom, dining Hall and library).
In previous studies, significant variations in indoor PM2.5 levels across different microenvironments have been reported. The mean exposure concentration of PM2.5 in residential homes was 57.2 µg/m3, while in mahjong parlours the average exposure concentration was 32.1 µg/m3.8,55 Sustained exposure to PM2.5 concentrations above recommended limits poses significant health risks, including an increased incidence of diseases and premature mortality.56,57 For example, headaches, fatigue, allergies and asthma can lead to respiratory and cardiovascular diseases in severe cases.27,58 Madureira et al. 59 found that PM10 mainly deposited in the head region, PM2.5 depositions occurred in pulmonary area, and the inhalation dose of newborns (3 months) was four-fold higher than their mothers. Due to the long-term exposure of underground train commuters and the high frequency of trains operations and passenger numbers, the Asian underground train system recognised as highly cancer risk zone for PMs. 60 In 2019, approximately a fifth of the global burden of type 2 diabetes could be attributed to PM2.5 exposure. 61 These results further underscore the need to reduce inhalation exposure.
In the analysis, there were uncertainties regarding the indoor residence times of the populations in the different locations studied. Inhalation exposures were estimated based on concentrations measured by stationary sensors, which may not be fully representative of the concrete situations in the different microenvironments. Besides, smoking was prohibited at indoor locations, and the impact of indoor sources such as smoking on human health was not considered. There may be violations of the requirements. Fazlzadeh et al. 62 found that after installing an air purifier, smoking still reduced the removal efficiency of PM by 43%–47%. After purification, the concentrations of PM10 and PM2.5 still failed to meet the WHO Guidelines, 42 which had a high impact on human health. Therefore, portable samplers could be employed in further studies to specifically assess human exposure.
Conclusion
In this study, we assessed the relationship between PM concentrations in indoor and outdoor environments at six locations (a dormitory, an office, a laboratory, a classroom, a dining hall and a library) within campus of BTBU, accounting for the influence of temperature, relative humidity and other factors such as indoor activities. The daily average concentrations of PM2.5 and PM10 at all indoor locations except the dining hall, exceeded the national air quality standards on certain days. The results demonstrated a significant impact of building activities and their features on the variations in PM concentrations. Generally, the indoor PM concentrations were lower than the outdoor PM levels (I/O < 1). There was a significant positive correlation between the indoor and outdoor PM concentrations, emphasising the importance of mitigating outdoor pollution to reduce personal exposure. Moreover, the study revealed that indoor human activities (e.g. breathing, exercise and use of air conditioning and electronic devices), ventilation, cleaning practices, as well as relative humidity and temperature could influence the variation in PM concentrations. Improvements in outdoor air quality may not lead to a corresponding improvement in indoor one if indoor emission sources are not adequately controlled. Additionally, our study revealed significant discrepancies in inhalation exposure amongst the different microenvironments. For instance, although the PM2.5 concentration in the laboratory was higher than that in the office, the longer residence time in the office resulted in a greater overall time-weighted daily average inhalation exposure compared to that of the laboratory. This implies the necessity of implementing tailored management strategies based on the specific characteristics of each type of environment to enhance the overall health of the campus.
Proper ventilation and regular cleaning are effective strategies for removing settled particles, dilute PM and improve IAQ. Therefore, to safeguard the health of teachers, students and staff, it is crucial to utilise low-emission building and furniture materials, regularly use doors and windows for ventilation, or, with the help of air purification equipment, clean rooms on time and regularly to reduce the pollutants levels. The findings of the current study will help to raise public awareness about indoor and outdoor air quality and provide references for the implementation of targeted measures to improve the IAQ. In future research, priority should be given to analysing components of PMs in various microenvironments, with a focus on identifying and quantifying their specific sources. Such findings would facilitate distinguishing contributions from activities such as cooking, cleaning, smoking or other emissions, enabling targeted interventions to mitigate PM emissions. Additionally, further investigations into strategies for reducing PM emissions could provide effective solutions for minimising human inhalation exposure to PM in high-risk environments.
Footnotes
Authors’ contributions
Gang Li performed validation, writing-review and editing. Wenbo Xiao did conceptualisation, formal analysis and writing the original draft. Yuhang Hao did investigation, methodology. Nan Zhao did validation, writing-review and editing.
Data availability statement
The datasets generated and/or analysed during the current study are available from the corresponding author on reasonable request.
Declaration of conflicting interests
The authors declared no potential conflicts of interest with respect to the research, authorship and/or publication of this article.
Funding
The authors disclosed receipt of the following financial support for the research, authorship and/or publication of this article: This work was supported by the National Natural Science Foundation of China [grant numbers 52200177, 52470164 and 52306219]; the Young Elite Scientist Sponsorship Program by CAST (YESS20230603); the National Key Research and Development Program of China [grant number 2023YFE0104900-1]; the Open Research Fund Program of the State Key Laboratory of Clean and Efficient Coal Utilization of Taiyuan University of Technology [grant number SKL2022004]; and the Open Research Fund Program of the State Key Laboratory of Efficient Utilization for Low Grade Phosphate Rock and Its Associated Resources (WFKF(2023)007).