
Abstract
Compared to other indoor environments, indoor environments of fitness centre exhibit notable variations in heat, humidity and air quality. In this study, a 2-month field study was conducted on two fitness centres in a cold region of China. The results of this study revealed that fitness centres have high levels of indoor air pollutants, with significant variations in temperature and humidity. Moreover, the majority of individuals expressed dissatisfaction with the indoor environmental quality of fitness centres. The thermal comfort in fitness centres was closely associated with the ambient temperature and humidity. Amongst the pollutants affecting indoor air quality in fitness centres, carbon dioxide (CO2) was shown to produce the most significant impact, followed by formaldehyde (CH2O), total volatile organic compounds (TVOC) and particulate matter (PM2.5). In this study, a comprehensive evaluation model was developed to provide a reference for assessing the indoor environmental quality of fitness centres. The findings of this study can serve as a scientific foundation for the design and decoration of fitness centres, aiming to enhance the comfort and healthiness of the exercise environment.
Introduction
Long-term physical activity is essential to human health. More and more people are now prioritizing physical activity to improve their health, especially in the post-COVID-19 era. The World Health Organization (WHO) recommends that adults should aim for at least 150 min of moderate-intensity aerobic physical activity every week. Physical inactivity has been identified as the fourth leading cause of death. 1 As a result, fitness centres have become a regular place for people to exercise in order to ensure good health. Relevant studies have proposed that health should be prioritized as a strategic position for development and advocates the widespread development of national fitness campaigns. 2 Existing studies clearly indicate that fitness for all has been elevated to a national strategy and that the area of sports venues per capita will reach 2.5 m2 by 2035. 3 Indoor air quality in fitness centres is also influenced by building maintenance, construction materials and type of ventilation compared to other indoor spaces. 4 The risk of human exposure in fitness centres may be higher due to the increased frequency of inhalation resulting from performing high levels of physical activity. 5 The limited space in fitness venues leads to a high concentration of people in a small area, which results in the accumulation of harmful gases. This pollution seriously affects the indoor environment of the fitness centres. Therefore, maintaining a healthy exercise environment can increase the comfort level of fitness personnel during physical activity.
The health impacts of environmental quality in fitness centres, where people engage in healthy exercise, have attracted extensive interest from researchers. 6 However, as the demand for fitness increases, some potential pollutants may negatively affect air quality, hygiene and environmental health in fitness centres. 7 In fitness centres, people engage in high-intensity exercise, breathing rapidly and releasing large amounts of carbon dioxide (CO2). If air circulation is poor, CO2 concentration may increase, leading to symptoms such as dizziness and fatigue. Gurrieri et al. 8 noted that CO2 can induce headaches, with a more serious outcome of asphyxiation in extreme cases, depending on the absolute concentration and duration of exposure. Carapezza et al. 9 noted that inhalation of natural CO2 or H2S has caused many casualties and serious health problems worldwide, including the deaths of children and many wild critters. Fitness centres often use a variety of decorative materials, exercise equipment and cleaning agents, which may release total volatile organic compounds (TVOC) and formaldehyde (CH2O). High concentrations of TVOC and CH2O may trigger headaches, eye irritation and other discomforts. 10 Hao et al. 11 stated that long-term exposure to TVOC can cause skin, eye, respiratory irritation, headaches and neurological problems. Mai et al. 12 stated that short-term exposure to high indoor concentrations of TVOC can cause health effects such as headaches, nausea, respiratory infections, allergies and asthma. Aerosolized particulate matter produced during exercise may be suspended in the air for longer periods of time, increasing the risk of respiratory infections. Cho et al. 13 stated that PM2.5 increases the risk of morbidity, cancer, respiratory diseases, cardiovascular diseases and diabetes. Fitness centres are dynamic environments where individuals interact closely, increasing the chances of infectious disease transmission. 14 Therefore, when considering our health, we must prioritize the potential impact of our surroundings on our health. Given that fitness centres are popular venues for exercise, it is crucial to address the issue of pollutants and their potential hazards.
Thermal comfort in a fitness centre pertains to the subjective perception of temperature by individuals in this environment. It directly influences the overall workout experience and the effectiveness of fitness personnel. 15 The indoor temperature of a fitness centre is a crucial factor that affects thermal comfort. Extreme temperatures, either too high or too low, could result in discomfort and hinder motivation to exercise. 16 Additionally, air humidity has a significant role in thermal comfort. High humidity could make individuals feel more confined, whereas low humidity can lead to dry skin. Maintaining appropriate humidity levels, usually between 40% and 60%, contributes to thermal comfort. 17 Xu et al. 18 noted that prolonged exposure to non-thermal comfort zones could lead to serious health problems, decreased human motor function and increased the risk of sports injuries. The comfort of fitness personnel during exercise has a direct impact on their exercise experience and effectiveness. Improved thermal comfort could enhance the motivation of fitness personnel, increase the continuity of exercise and help them achieve their fitness goals. 19 Therefore, the provision of a more comfortable and healthier exercise environment in fitness centres can promote active participation in fitness activities, and ultimately contributing to a healthier lifestyle is a pressing issue for current scholars.
Currently, there are subjective evaluation methods, objective evaluation methods and a combination of both for evaluating indoor environments. However, subjective evaluation methods have drawbacks including high workload, low efficiency and strong interference of personal opinions. On the other hand, objective evaluation methods have limitations such as being one-sided, directional, static and not considering individual differences or subjective feelings. Recognizing these limitations, an increasing number of scholars have proposed an indoor environment analysis method that combines both subjective and objective evaluation methods. Guo et al. 20 comprehensively calculated the thermal, luminous and acoustic evaluation indexes in the indoor environment using an effective function to establish an overall indoor environment evaluation model. They concluded that noise intensity and working temperature have a greater impact on the overall comfort of the indoor environment and illuminance has a smaller impact. Assimakopoulos et al. 21 proposed an air quality assessment method based on a fuzzy inference system and verified the applicability and effectiveness of the fuzzy inference system. Li et al. 22 evaluated the indoor thermal, acoustic and light environments and air quality of offices in severe cold regions to establish a comprehensive comfort evaluation method for office environments. Tang et al. 23 conducted an experimental study with subjects and proposed a comprehensive comfort assessment system and the results presented an effect with comprehensiveness. However, a methodology for evaluating fitness centre environments based on a combination of subjectivity and objectivity has not yet been developed.
Fitness centres, as key venues meeting the growing national fitness demand, have become a popular choice for daily exercise and health management. High-intensity exercise significantly elevates respiratory and metabolic rates, leading to increased emissions of pollutants such as CO2, TVOC and PM2.5. Additionally, space constraints and high occupancy rates cause pollutants to accumulate indoors, significantly impacting air quality. Systematic studies on these issues remain scarce in the existing literature. Moreover, the relationship between subjective evaluations and objective parameters in fitness centre environments has been largely unexplored. While subjective evaluation is gaining recognition in built environment research, most studies remain focused on single environmental parameters. Finally, research on indoor environmental assessment combining subjective and objective methods has primarily focused on residential, office or school settings, with limited exploration of dynamic environments like fitness centres. This study examined the indoor environment of two fitness centres in a typical cold-region city in China over two months, quantitatively analysed the relationship between subjective and objective parameters and proposed a comprehensive evaluation method for fitness centres environments. Specifically, this study explores the interplay between users’ subjective perceptions and objective environmental parameters by integrating on-site measurement data with questionnaire responses, further developing a comprehensive evaluation model for fitness centre environments. This method offers a comprehensive assessment of how fitness centre environments affect health and exercise outcomes while providing a scientific foundation for environmental improvements and health management in fitness centres.
The main objective of this study is to explore the dynamic characteristics of indoor environmental parameters in fitness centres and to analyse the impact of indoor air environmental parameters on the health of fitness personnel. This was achieved through a combination of subjective and objective methods. The main innovations of this paper (1) systematically and quantitatively investigated the relationship between objective indoor environmental parameters and subjective evaluation and (2) proposed a comprehensive evaluation method for the indoor environmental quality of fitness centres based on subjective and objective parameters. This study provided a data and methodological framework for the development of specifications related to the design, operation and management of environmental controls in fitness centres. The flow chart of this work is shown in Figure 1.
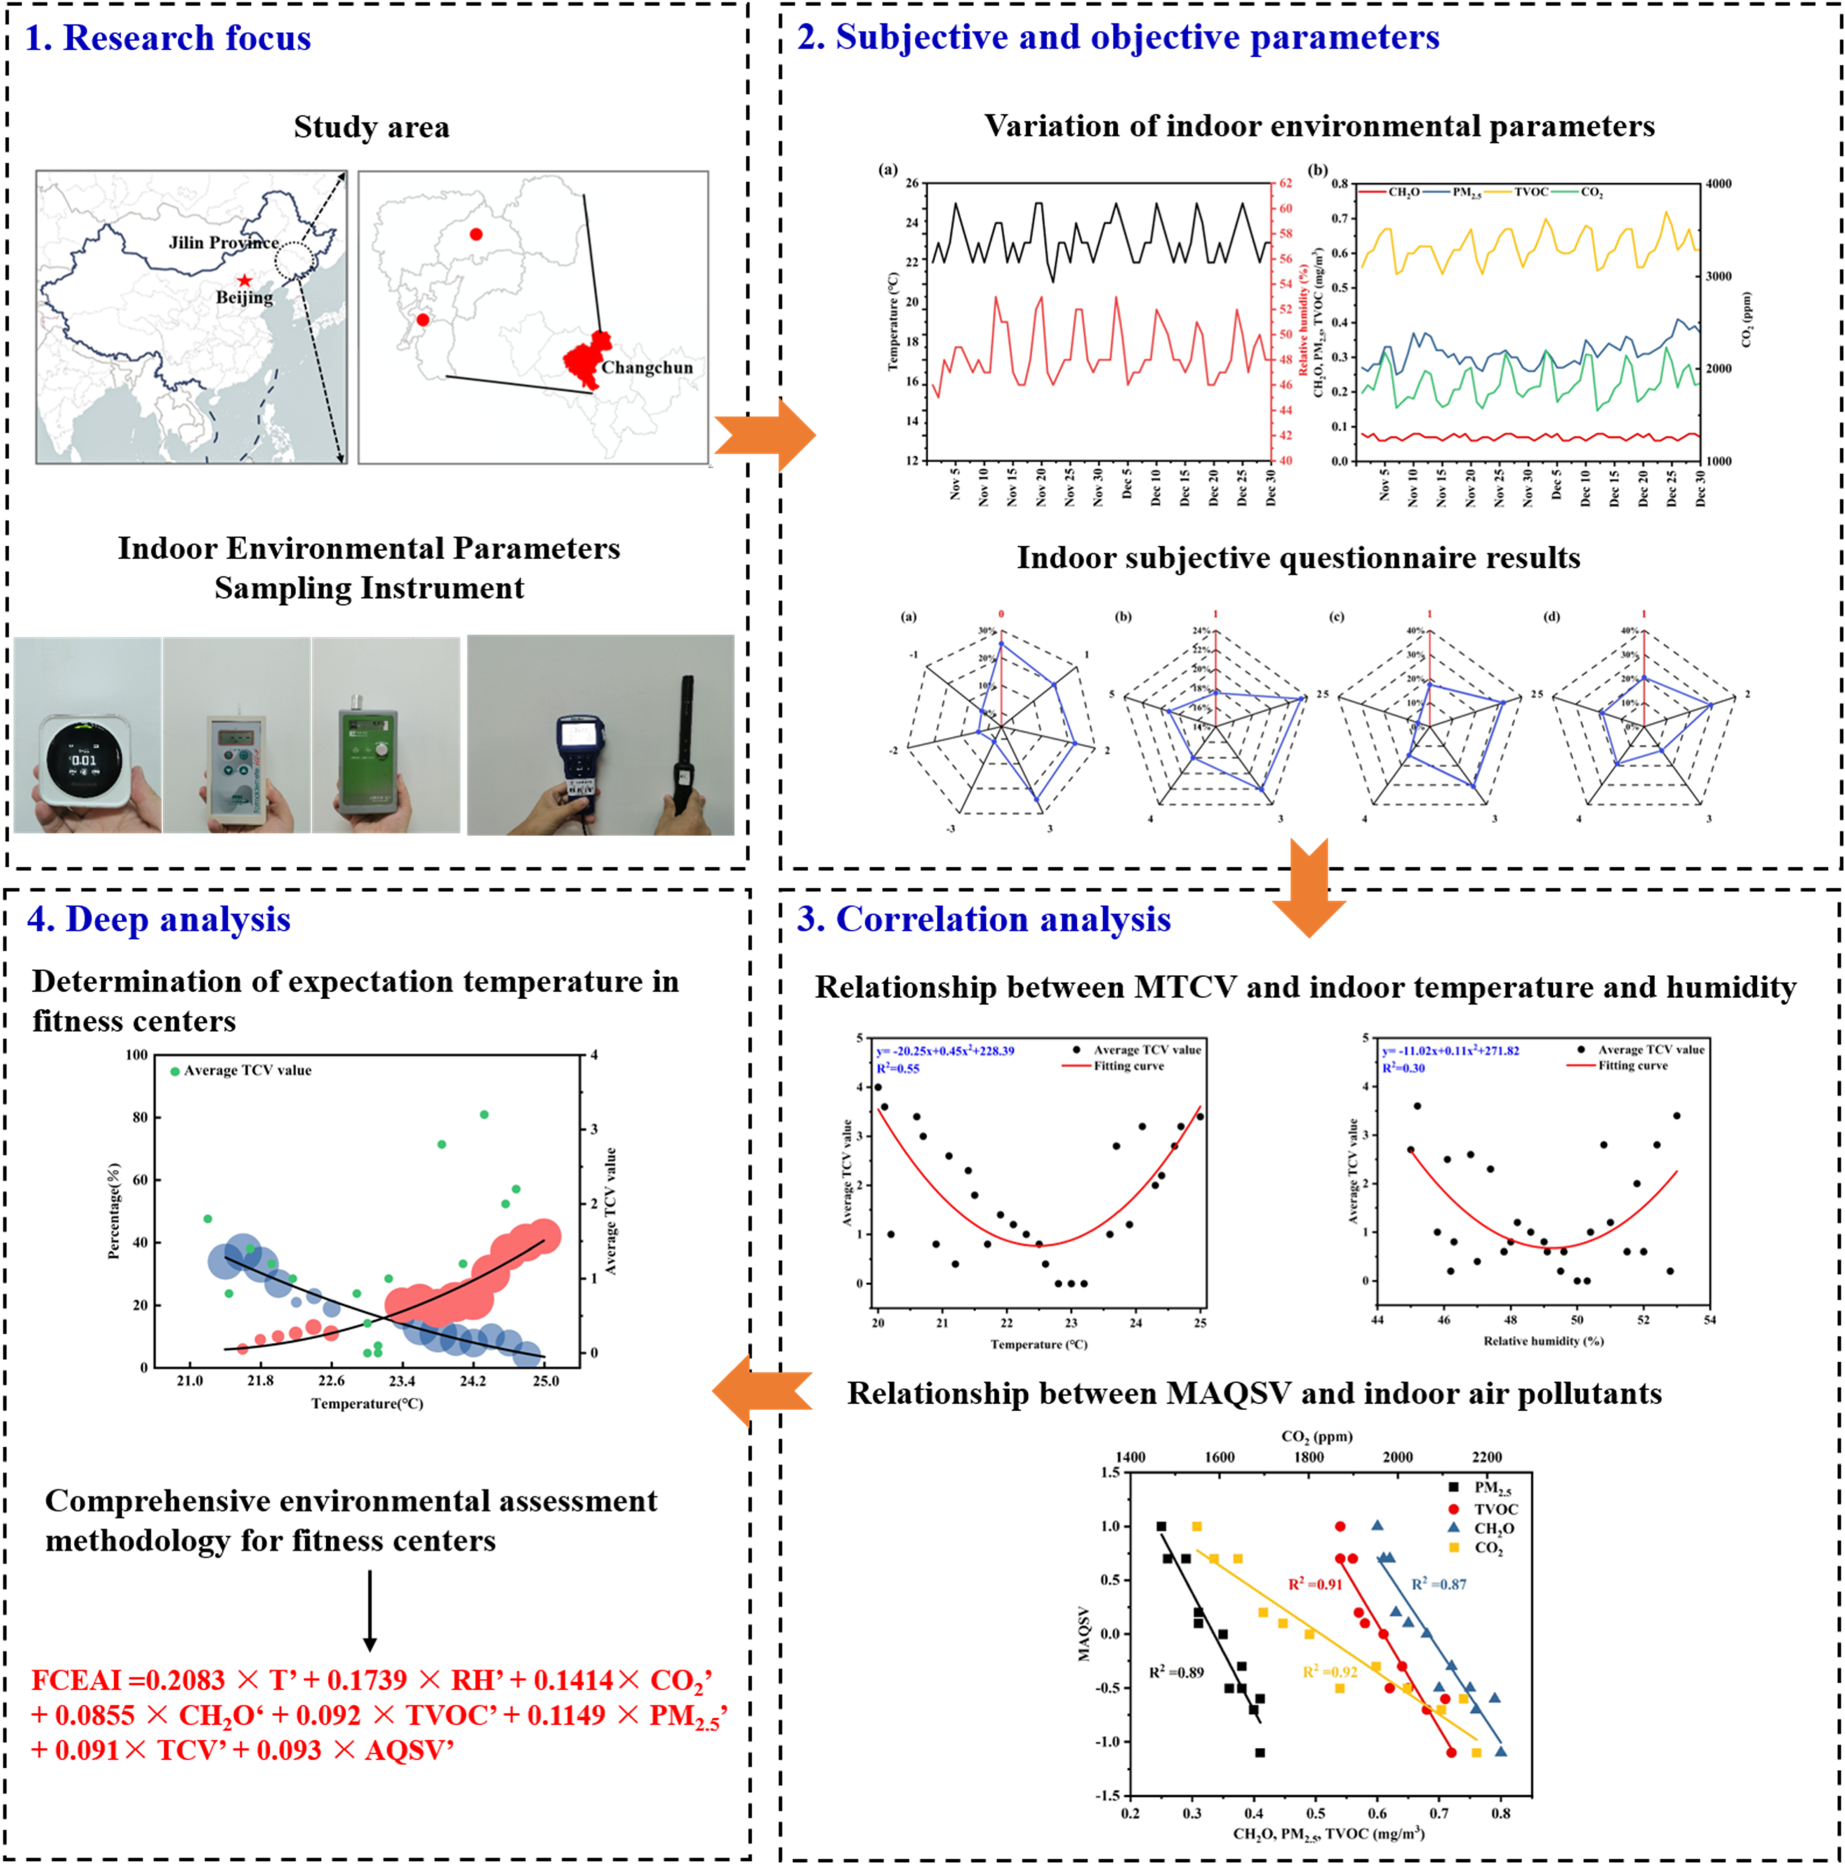
Research framework.
Method
Research area
The sample collection site for this study was located in Changchun City, Jilin Province, China (longitude: 121°38′–131°19′; latitude: 40°52′–46°18′). Changchun City is known for its serious environmental pollution, including industrial production, automobile exhaust emissions, centralized heating emission and straw burning. In 2020, Jilin Province achieved a total grain production of 609,040 tonnes, with corn production accounting for approximately 81.18% (494,394 tonnes) and rice production accounting for approximately 17.73% (107,953 tonnes). 24 As of 2021, the number of automobiles in Jilin Province has reached 4 million units. 25 In order to ensure the representativeness of the study, two fitness centres in Changchun City were selected as the sampling sites (Figure 2).
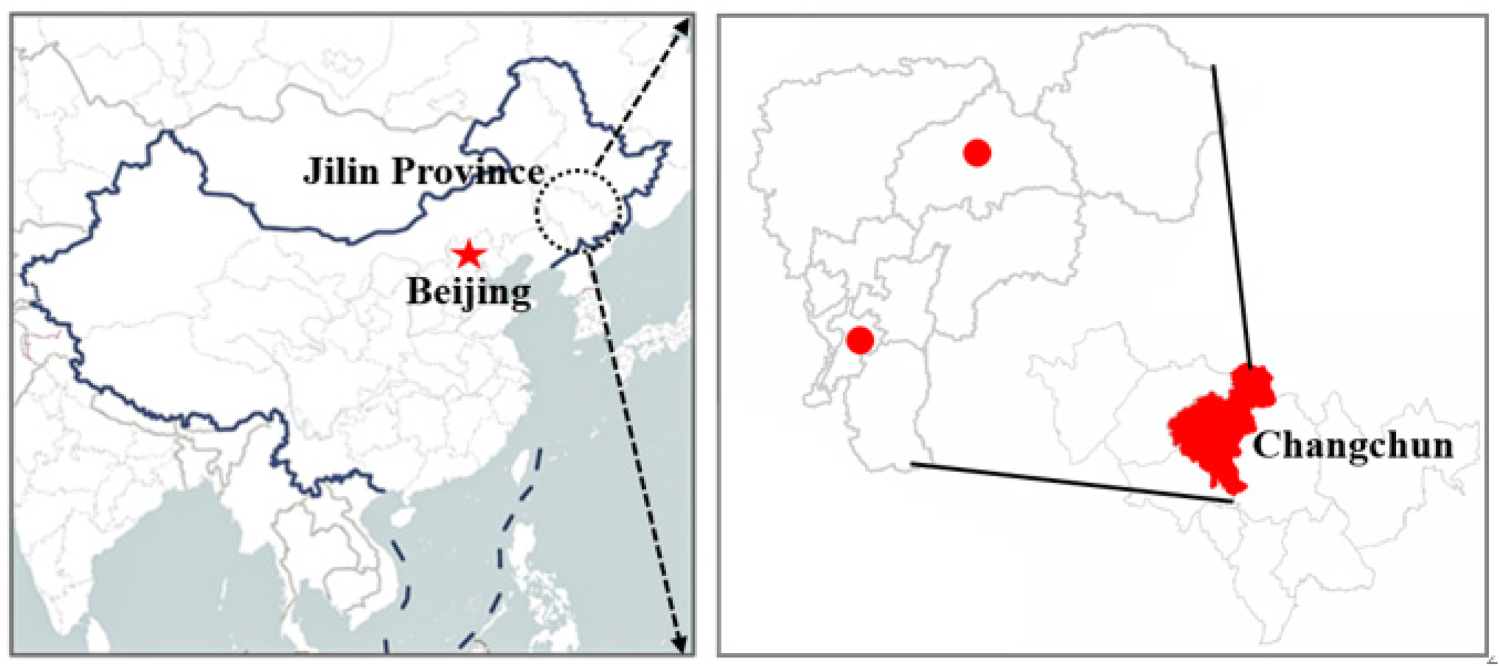
Research location.
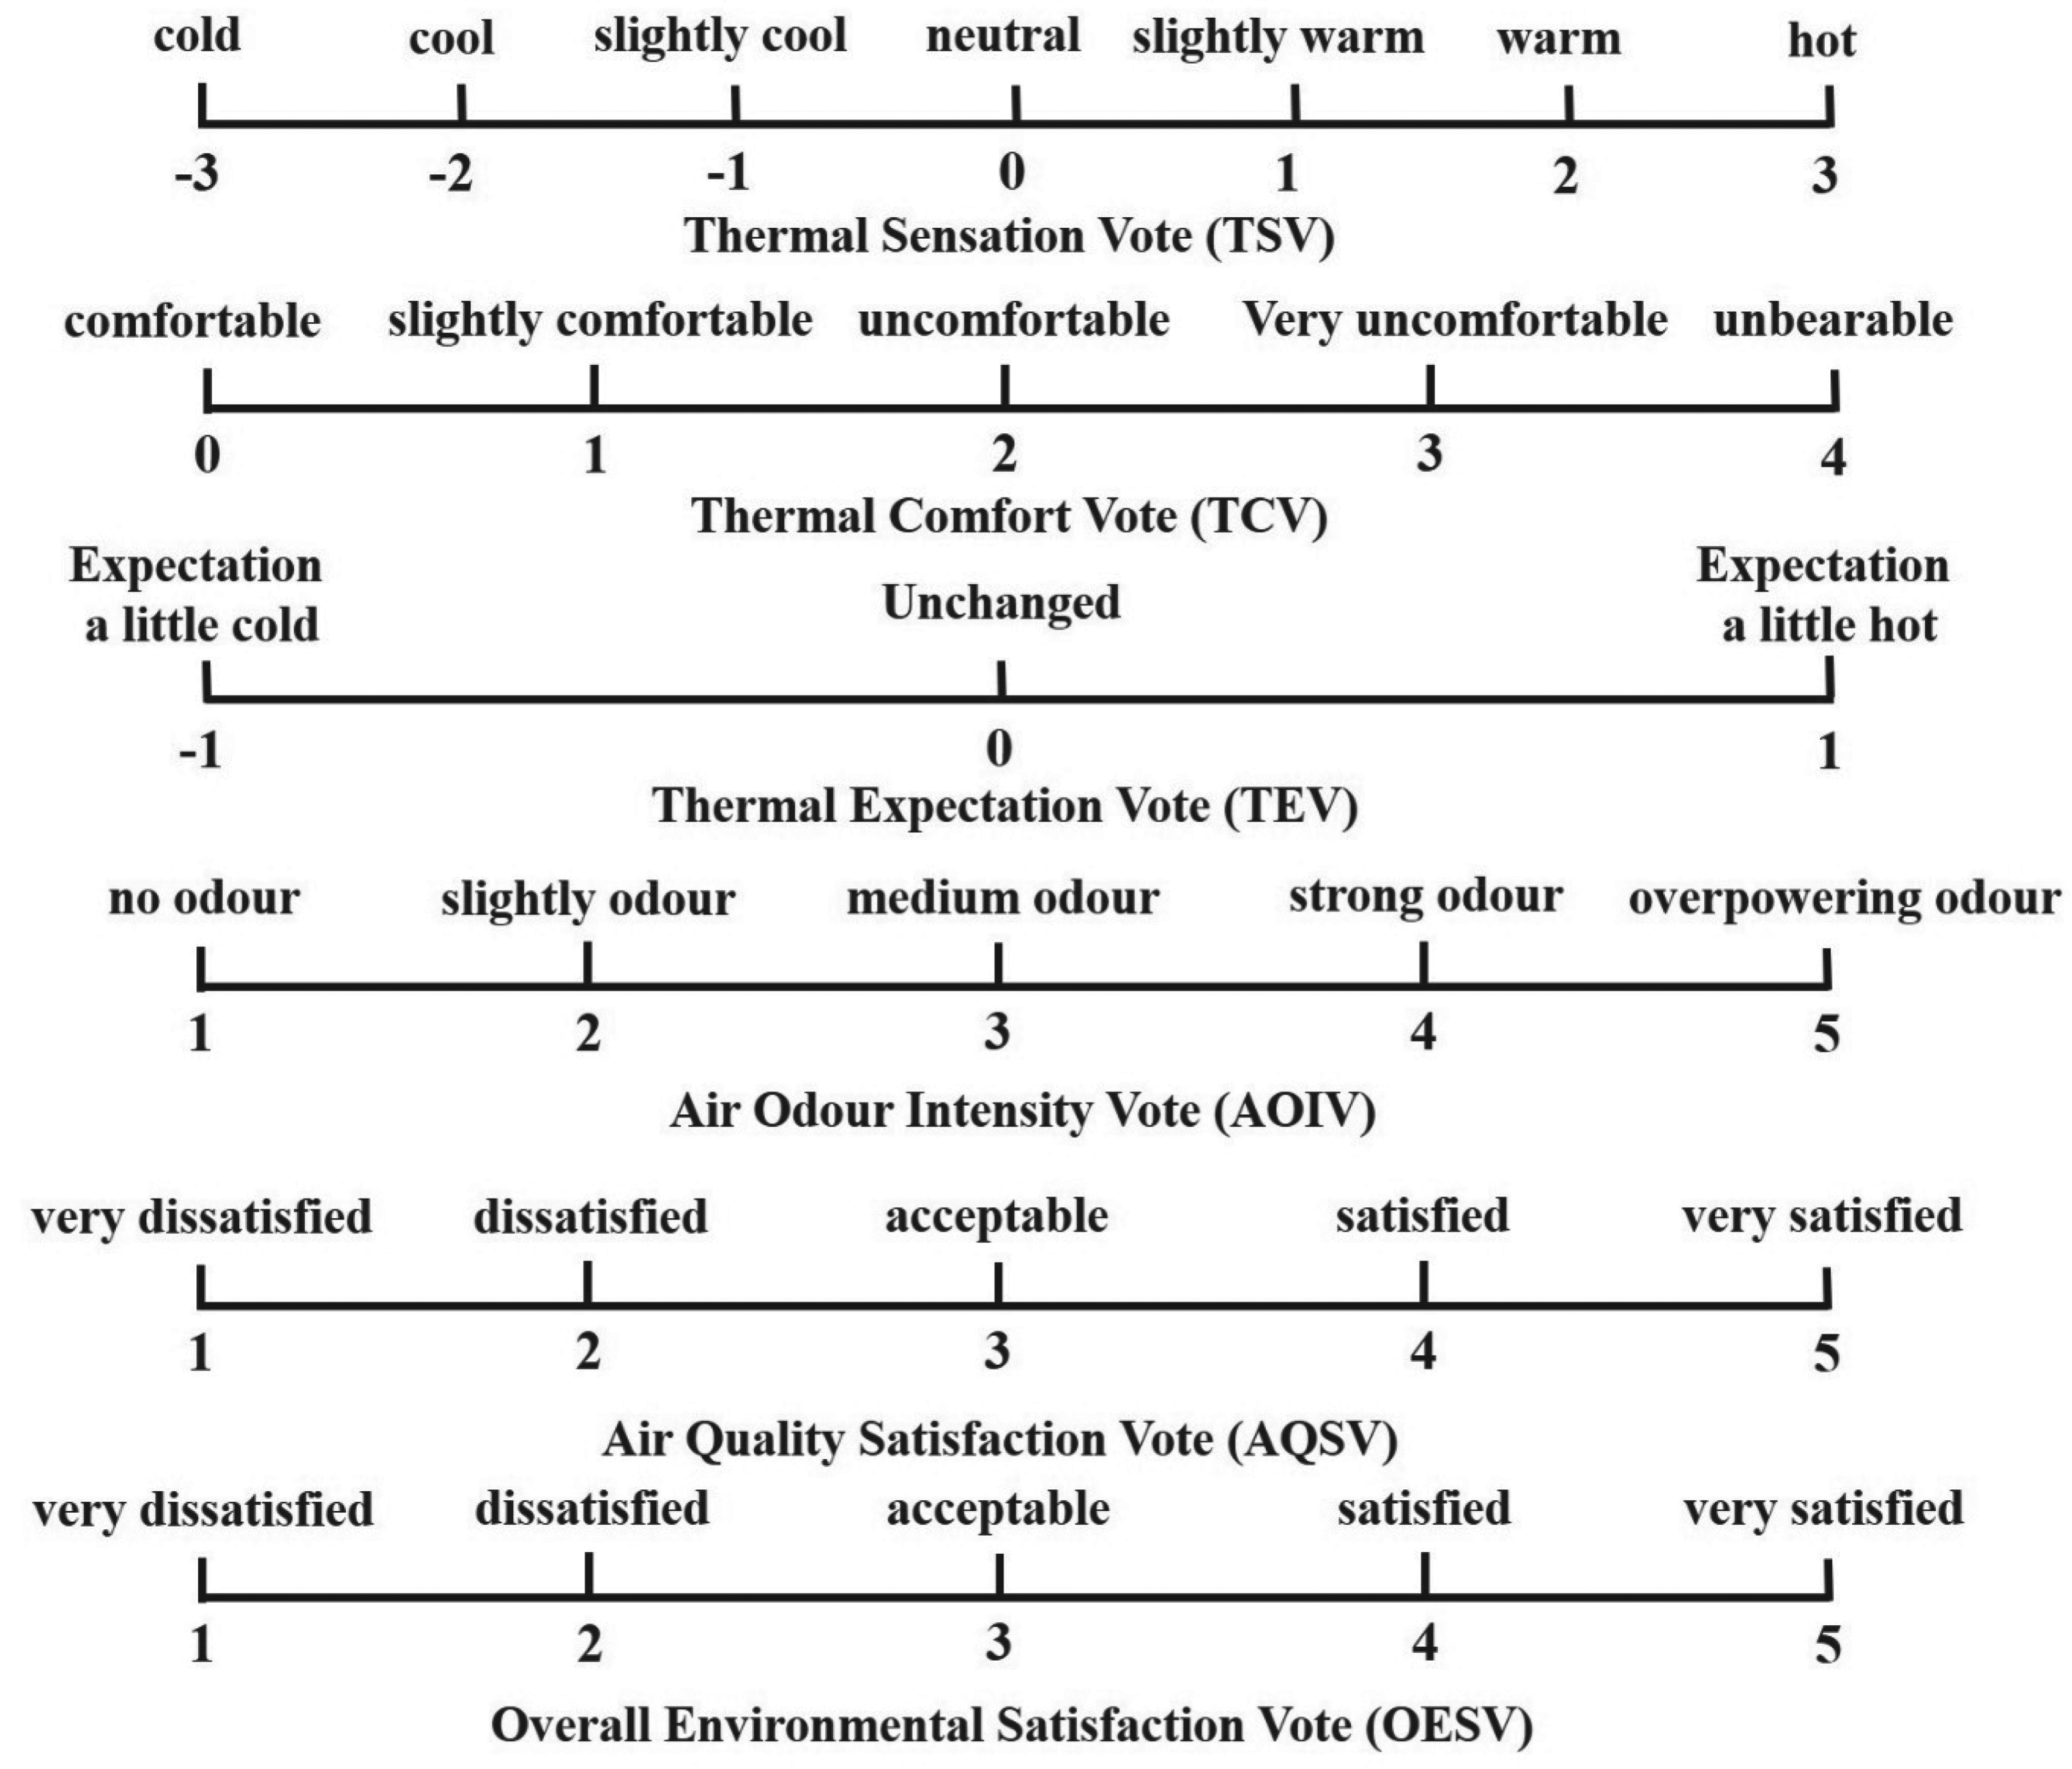
Subjective vote scale.
Fitness centre information
In this study, two fitness centres in Changchun City were selected. Year of constructions, building main construction materials, average daily flow of people, heating systems, ventilation and working hours information of fitness centres were collected. The details are shown below: Year of constructions for the two fitness centres are 2015 (fitness centres 1) and 2018 (fitness centres 2). Fitness centre 1 with three aerobic areas; two anaerobic areas; two exercise classrooms; two personal training areas; one indoor pool; one hot tub; one physical therapy room; three changing rooms; one front desk; and one storage room. Fitness centre 2 with one aerobic area; one anaerobic area; one exercise studio room; one personal training area; one bath area; one changing room; one front desk; and one storage room. Building main construction materials were brick, concrete, ceramic tiles and wood. Fitness centre 1 has an average daily flow of 191–238 people. The peak times are at 4–6 p.m. and 8–9 p.m. The off-peak times is at 9–10 a.m. Fitness centre 2 has an average daily flow of 153–258 people. The peak times are at 2 to 4 p.m. and 8 to 9 p.m. The off-peak time is 9 to 12 a.m. The heating systems are floor heating. The ventilation is mainly natural ventilation. The hours of operation of fitness centre 1 are Monday through Friday, 8 a.m. to 10 p.m., and Saturday through Sunday, 9 a.m. to 8 p.m. The hours of operation for fitness centre 2 are Monday through Sunday: 8 a.m. to 10 p.m.
Research protocol
A cross-sectional sampling method was used in this study to minimize bias and ensure that the findings are more representative. Longitudinal sampling was not employed in this study due to the potential influence of additional variables over a longer duration and the likelihood of participants losing interest in participating in frequent surveys. 26 Therefore, data were collected and observed over a 60-day period at two different fitness centres.
The questionnaire in the experiment in this study was divided into two part; the first part was a survey of basic information including gender, age, weight, height, length of exercise and type of exercise. The second part included a subjective questionnaire poll. The questionnaire was explained in detail before the start of the questionnaire, such as the content of the questionnaire and the meaning of the scales, to ensure that the subjects fully understood the questionnaire. One researcher filled out the questionnaire in real time as required. Meanwhile, another researcher recorded the environmental variables at each measurement point for assessment and documentation. Through negotiation, the entire experimental equipment was placed to take measurements without interfering with the normal operation of the fitness centres and the normal fitness activities of its personnel.
Data acquisition
Subjective vote.
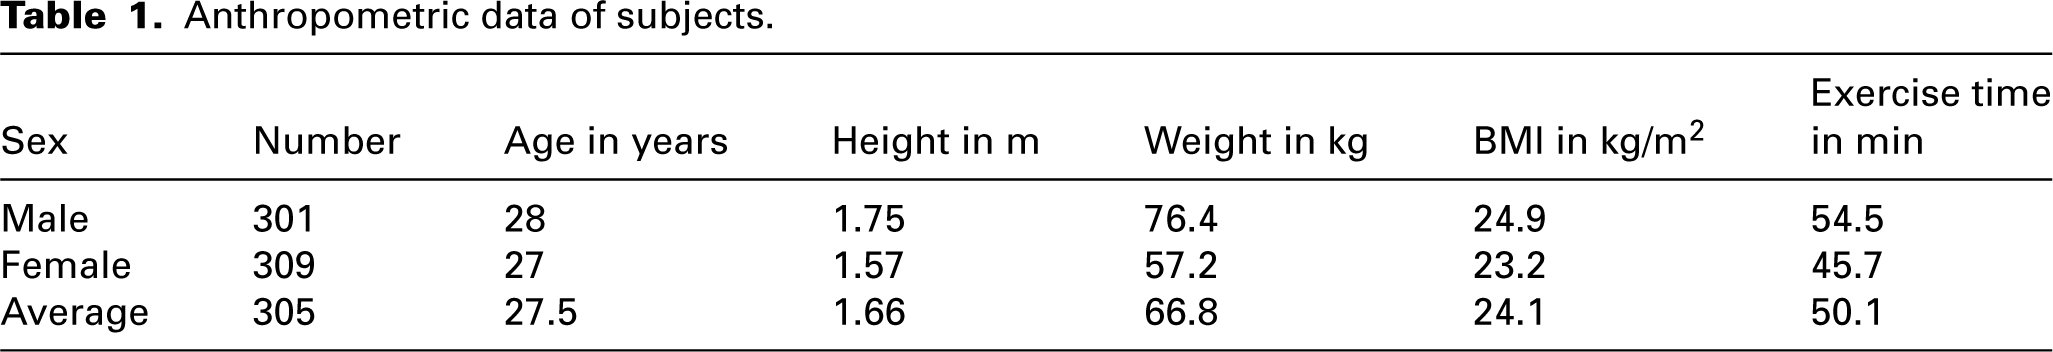
In order to obtain the perceived votes of fitness personnel on thermal sensation vote (TSV), thermal comfort vote (TCV), thermal expectation vote (TEV), air odour intensity vote (AOIV), air quality satisfaction vote (AQSV) and overall environmental satisfaction vote (OESV), the questionnaire content was designed in this study according to ASHRAE Standard 55 27 and ISO 7726. 28 Figure 3 shows sensory issues and their scaling and coding. In this study, a random on-site questionnaire survey was conducted from 1 November 2022 to 31 December 2022, with a total of 610 questionnaires obtained from people within 2 fitness centres in Changchun City. Subjects volunteered to participate in the study and confirmed their health level before testing. Participants in the fitness workouts were confirmed to be free of physical, cardiovascular and other diseases. The mean age of the participants was 27.5 years old, the mean height was 1.66 m, the mean weight was 66.8 kg, the mean BMI was 24.1 kg/m2, and the mean exercise time was 50.1 min, as shown in Table 1.
Anthropometric data of subjects.
Environmental factor.
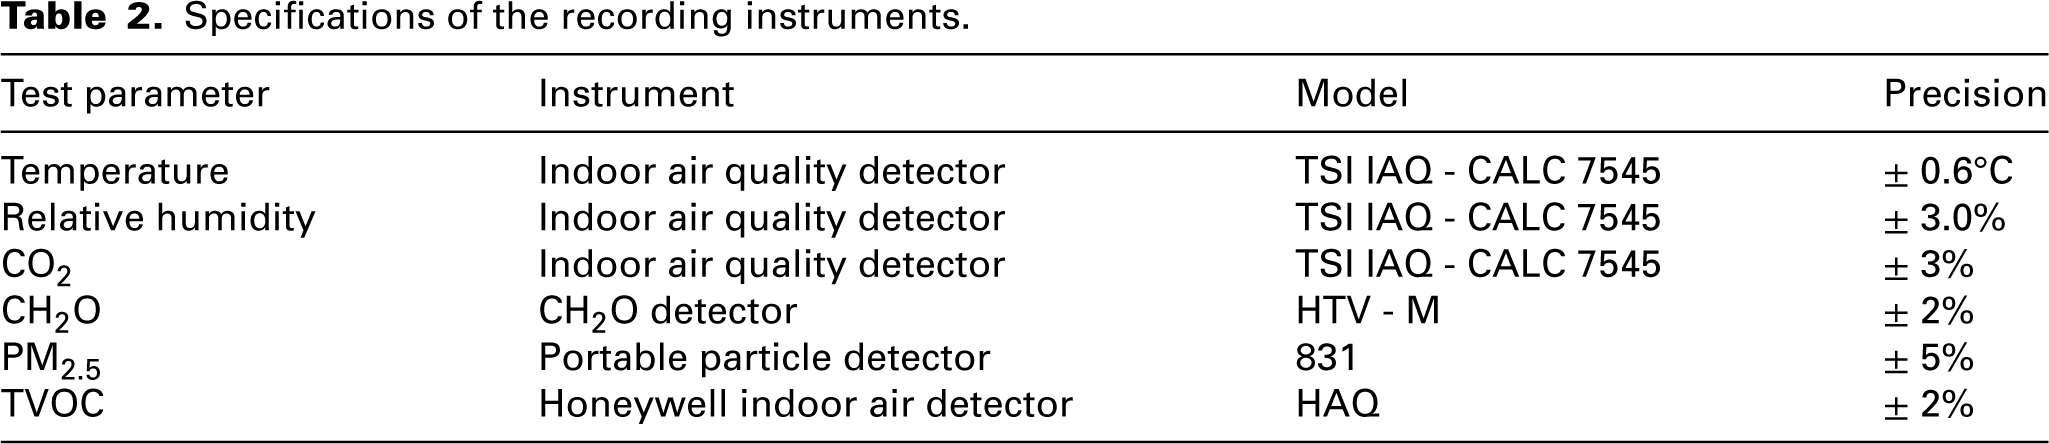
Environmental variables affecting comfort were recorded every 3 min in this study. Air temperature, relative humidity and CO2 were recorded by an indoor air quality detector, CH2O was by a formaldehyde detector, PM2.5 was by a portable particle detector, and TVOC was by a Honeywell indoor air detector. Detailed information on the model and accuracy of the equipment is given in Table 2. According to the related literatures, that indoor environmental parameter studies usually use temperature sensors with an accuracy range between ± 0.5°C and ±1.0°C, which can effectively reflect the trend and variability of indoor temperatures.29,30 Tai et al. 29 used a temperature instrument with an accuracy of ±0.5°C to obtain the variation of indoor environmental parameters and condensation phenomenon in an urban integrated tube corridor. Xia et al. 30 used a temperature instrument with an accuracy of ±0.6°C to study the indoor thermal comfort of traditional dwellings in Northeast China. Therefore, the accuracy of the instrumentation of this study ensures the reliability and scientific validity of the conclusions of this study. Continuous sampling method was used in this study. Sampling was carried out in strict accordance with the relevant provisions of indoor air quality standard GB/T18883-2002. 31 In this study, five monitoring points were set up to reflect the pollutant concentration levels in the fitness centres, and the monitoring points were evenly distributed in a diagonal pattern and the monitoring points avoided the ventilation openings. The monitoring points were located near the fitness area without interfering with their fitness activities. The height of the sampling equipment was 1.5 m above ground, which is basically the same as the height of the human respiratory zone. 31
Specifications of the recording instruments.
Statistical analysis
Multiple linear regression.
Multiple linear regression is a sophisticated statistical approach used to explore the relationship between one dependent variable and several independent variables. This method identifies the best-fitting line by minimizing the residual sum of squares, which measures the difference between the observed values of the dependent variable and those predicted by the model. Multiple regression models explain how the dependent variable is influenced by multiple predictors in a linear fashion. In this study, multiple linear regression was used to determine the relationship between subjective and objective parameters. The slope coefficients in a multiple regression model depend on the units of the dependent variable. To compare these coefficients, particularly when the dependent variables have different units, it is essential to standardize them, resulting in dimensionless standardized regression coefficients. To identify which variables to include in the multiple regression model, a Spearman correlation test was conducted. Spearman's correlation is a non-parametric measure that assesses the strength of association between paired data, suitable for ordinal, interval and skewed data. This comprehensive analysis ensures that the most relevant variables are included, enhancing the model's accuracy and interpretability.
Criteria importance through intercriteria correlation weighting method.
Criteria importance through intercriteria correlation (CRITIC) weighting method is an objective weighting method that utilizes two indicators: contrast intensity and conflict indicator. Comparative intensity is expressed using standard deviation, while conflict indicators are expressed using correlation coefficient. 32 The CRITIC weighting method can effectively eliminate the influence of indicators with strong correlation, minimize information overlap between indicators and ensure reliable evaluation results. 33 The process of determining objective weights using the CRITIC weighting method is summarized below.
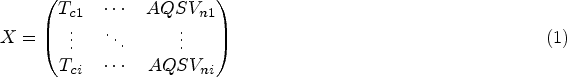
Step 1. A data matrix was created to assess the degree of correlation between each of the characterized parameters and the degree of influence on the results as shown in equation (1).
Step 2. Dimensionless of each column of X (xi). The positive and negative indicators are dimensionless in equations (2) and (3), respectively.


Step 3. The conflicting nature of evaluation indicators (Rj) was calculated by equation (4):

Step 4: The amount of information (Cj) was calculated by equation (5):

Step 5: The weights for eight evaluation indicators (Wj) was calculated by equation (6)

Results and discussion
Analysis of objective indoor environmental parameters in fitness centres
The experiment was carried out from 1 November 2022 to 31 December 2022, which is during the heating season in Jilin. According to the testing data, indoor environmental parameters of the fitness centre are shown in Figure 4. As shown in Figure 4(b), the average daily temperature of the fitness centre was 21°C to 25°C. The relative humidity was 44% to 53%. From Figure 4(b), the concentration of CO2 ranged from 1549 to 2176 ppm, with the average concentration of 1840 ppm exceeding the national limit standard (1000 ppm).1,31 The concentration of CH2O ranged from 0.06 to 0.08 mg/m3, with the average concentration of 0.07 mg/m3 not exceeding the national limit standard (0.1 mg/m3).1,31 The concentration of PM2.5 ranged from 0.25 to 0.41 mg/m3, with the average concentration of 0.35 mg/m3 exceeding the national limit standard (0.075 mg/m3).1,31 The concentration of TVOC ranged from 0.54 to 0.72 mg/m3, with the average concentration of 0.62 mg/m3 exceeding the national limit standard (0.6 mg/m3).1,31 Studies have demonstrated that prolonged exposure to indoor environments above national standards could pose health risks to most exercising populations.34,35
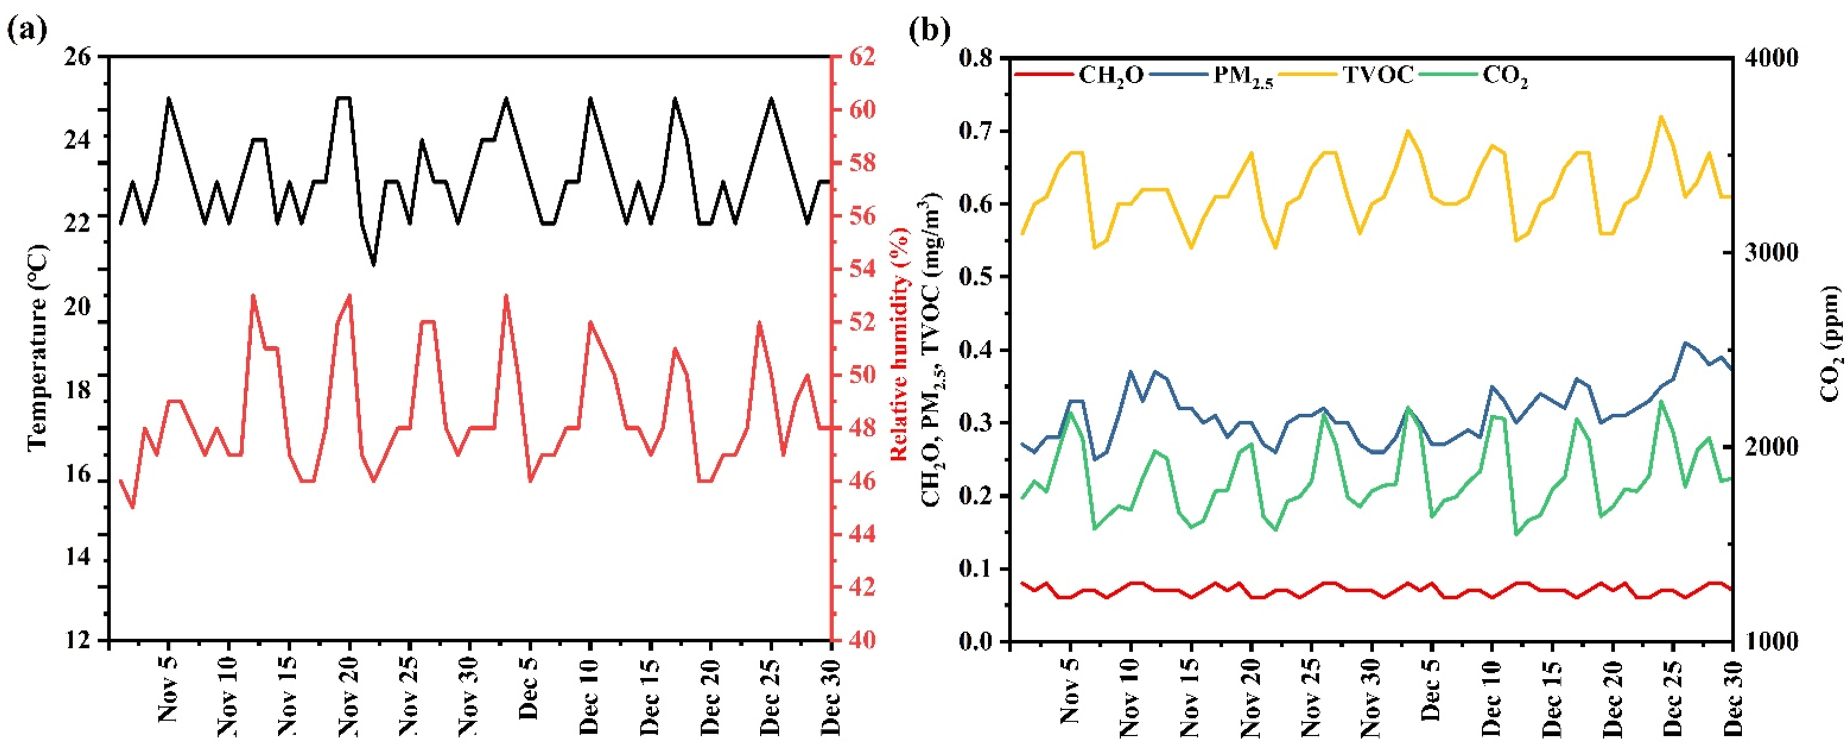
Variation of indoor environmental parameters in fitness centres.
In this study, the indoor temperature of the fitness centre was maintained at about 23°C, which was due to the increase in indoor temperature caused by the beginning of the heating season in Jilin Province on 20 October, which is consistent with the results of other studies. 36 The indoor humidity level was stabilized and remained around 50%, which is a direct correlation between indoor humidity and foot traffic. A large number of people entered the fitness centre and begin working out during the time of measurement, causing the indoor humidity to continue to rise. 37
CH2O, a volatile organic compound, is typically evaluated on a case-by-case basis due to its significant health impacts. The primary source of CH2O contamination is indoor decoration materials, and variations in levels are primarily influenced by the construction year and window opening. 38 However, the monitored fitness centres have been operating for several years and the indoor decoration materials used do not emit excessive amounts of formaldehyde. As a result, the concentrations of CH2O remained within the national standards.1,31 In this study, the PM2.5 concentration in the fitness centres was found to be more than three times higher than the national standard.1,31 This could attribute to the fact that the sampling time of this study was during the heating season, when large-scale coal-fired heating was the main contributors to the elevated PM2.5 concentration. 39 Furthermore, as outdoor temperatures decreased and atmospheric convection became inactive, there was a significant accumulation of PM2.5 in the air, leading to the production of a large number of aerogels and further increasing the PM2.5 concentrations. 40 These aerogels were transmitted indoors through airborne particles, resulting in higher levels of indoor and outdoor PM2.5 pollution during the winter season. The TVOC concentration in this study is slightly higher than the national standard.1,31 This can be attributed to the fact that the study was conducted in a fitness centre, which contains a significant amount of rubber fitness equipment, paint, coatings, carpets, cleaning and polishing materials. These materials release TVOC over an extended period of time, resulting in an elevated indoor TVOC concentration. 41 Similarly, the CO2 concentration in this study exceeded the national standard.1,31 The human body exhales carbon dioxide during breathing, and as the level of physical activity increases, more CO2 is produced. Additionally, the smaller space and higher number of people in the fitness centres contribute to a rapid increase in CO2 concentration.
Fitness centres subjective questionnaire poll results
In this study, a questionnaire method was used, focusing on thermal sensation and thermal comfort of the subjects. The feedback received was screened to identify and exclude invalid questionnaire responses. The results of subjective questionnaire voting are shown in Figure 5. According to Figure 5(a), the fitness personnel reported the following percentages for heat sensation: 1.1% cold, 3.5% cool, 4.1% slightly cool, 25.1% neutral, 19.4% slightly warm, 22.4% warm and 24.4% hot. The low percentages of feeling cold and cool in this study can be attributed to two factors. Firstly, the indoor temperature range of 21–25°C in this study aligns with the ASHRAE Standard 55, 27 which suggests a comfort temperature range of 20–24°C during the cold season. Secondly, the physical activity performed by the personnel increases blood flow and heat production in the body, leading to a warmer sensation. Therefore, individuals are more likely to feel warm or hot during exercise. According to the findings presented in Figure 5(b), the thermal comfort votes for fitness personnel were distributed as follows: 17.5% comfortable, 23.3% slightly comfortable, 22.1% uncomfortable, 18% very uncomfortable and 19.1% unbearable. The comfort level of the fitness centres did not reach 50% in this particular study. This can be attributed to the fact that the fitness personnel questioned had an average exercise duration of 50.1 min. Prolonged exercise would lead to increased blood circulation, body metabolism and heat production, which significantly affects the thermal comfort level of individuals. 42 From Figure 5(c), the percentage of votes for odour of the fitness personnel was 17.4% no odour, 32% slightly odour, 30.7% medium odour, 14.7% strong odour and 5.2% overpowering odour. From Figure 5(d), the percentage of air quality satisfaction vote of the fitness personnel was 20.4% very dissatisfied, 29.1% dissatisfied, 12.3% acceptable, 19% satisfied and 18.2% very satisfied. The frequency of votes for odour perception was found to be similar to the frequency of votes for air quality satisfaction in this study. Specifically, 17.4% of votes were for no indoor odour, while 18.2% were for high indoor air quality. This can be attributed to several factors. Firstly, most indoor fitness activities involved easy exercises, resulting in less use of doors and windows during the winter. As a result, indoor pollutants gradually accumulated. Additionally, when fitness personnel exercised in the fitness centres, their lung breathing was increased, leading to a rise in oxygen demand, respiratory rate and respiratory frequency. 43 Consequently, fitness personnel become more sensitive to air quality.
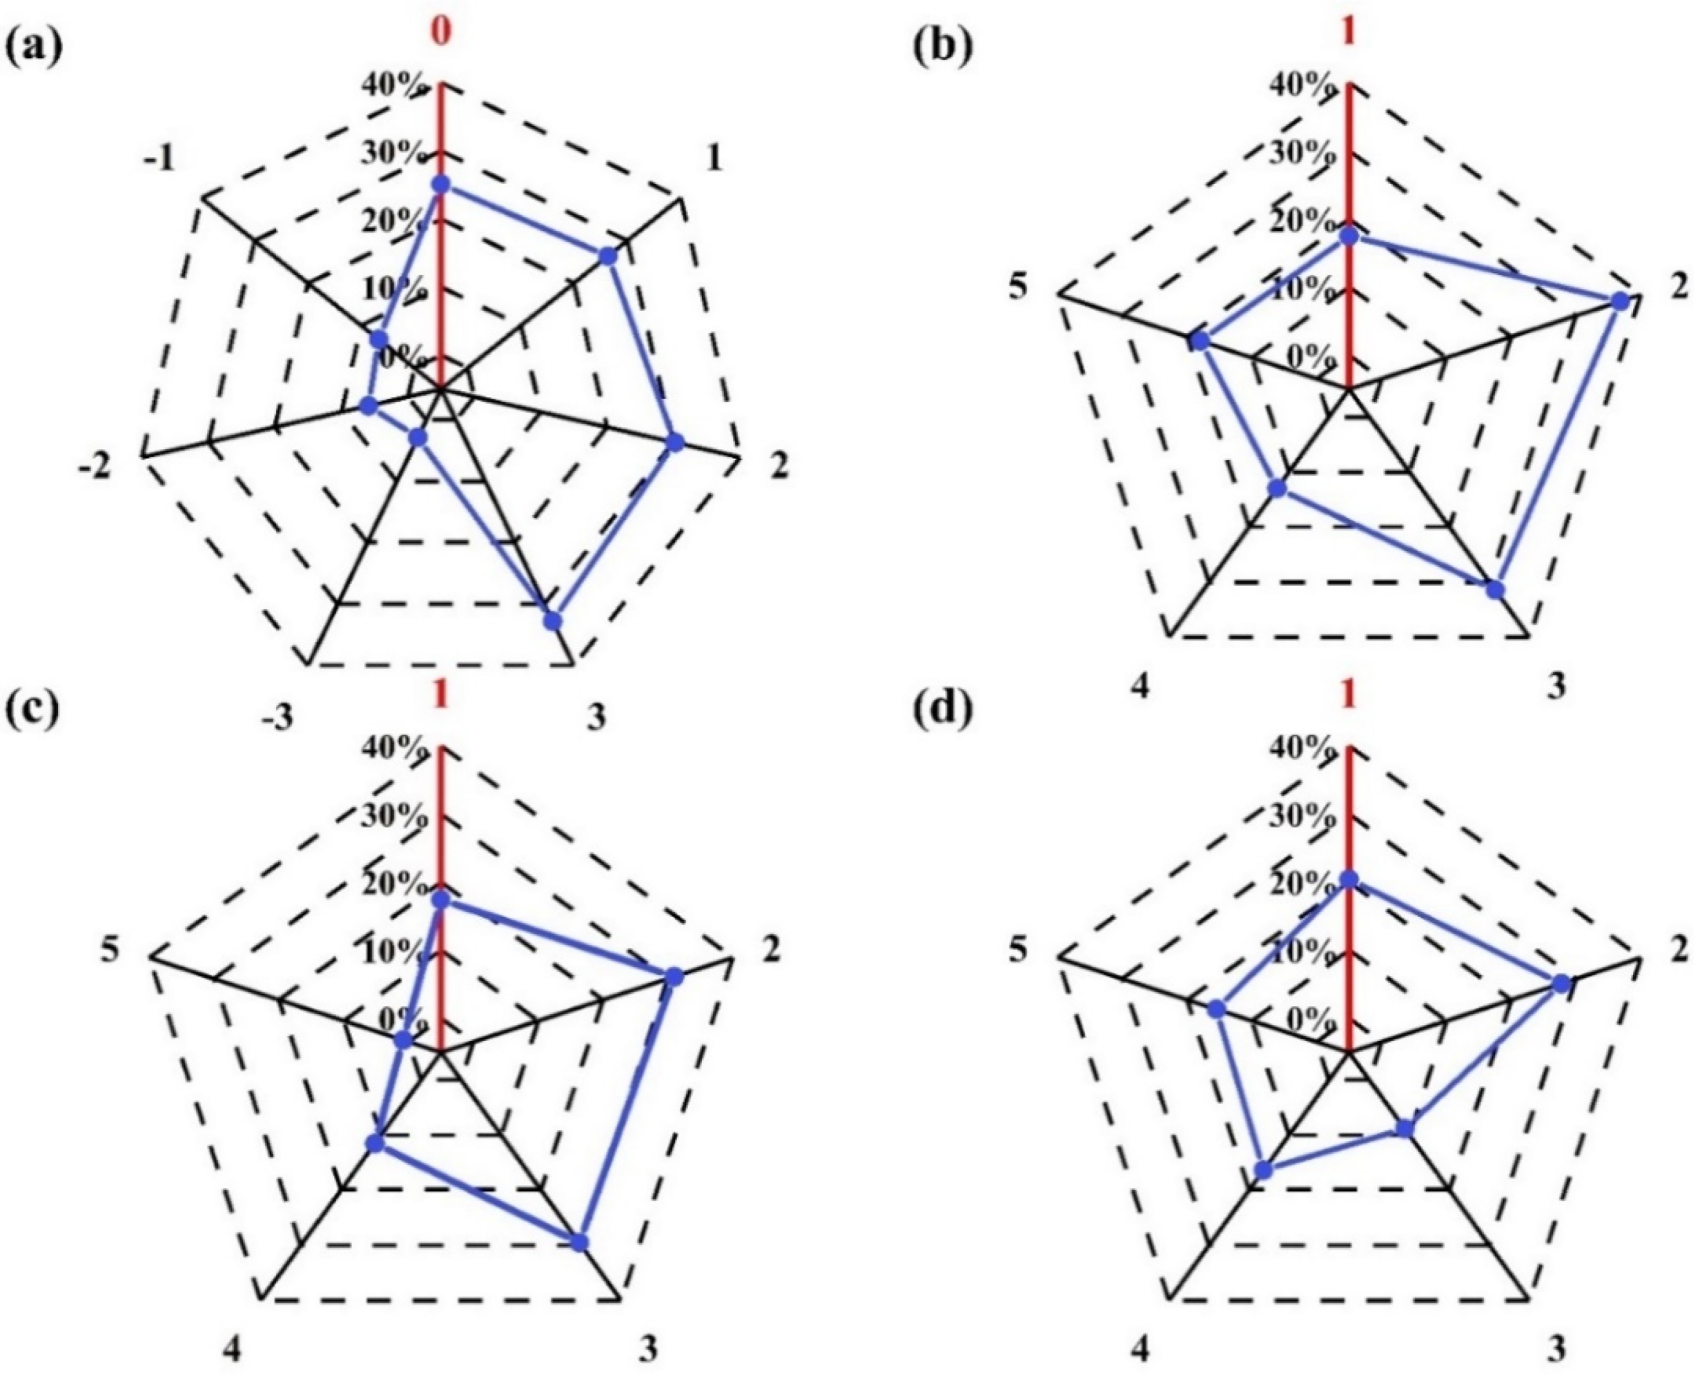
Fitness centres subjective questionnaire voting results percentage chart of (a) thermal sensation vote, (b) thermal comfort vote, (c) air odour intensity vote and (d) air quality satisfaction vote.
Relationship between objective indoor environmental parameters and subjective evaluations in fitness centres
Relationship between indoor temperature and humidity and TCV in fitness centres.
In order to show more clearly the effect of temperature and humidity variations on comfort, this study used temperature as the horizontal coordinate and the mean TCV of participants in the range of 0.1°C as the vertical coordinate, as shown in Figure 6. The same approach was used to investigate how variations in air pollutant concentrations could cause a variation in thermal comfort for fitness personnel. Quadratic regression was used to fit the data points in the graph to obtain the relationship between TCV and temperature and humidity in the fitness centres. From the above fitted curve equation, R2 was low, indicating a weak correlation between individual environmental factors and thermal comfort. It indicated that the correlation between individual environmental factors and thermal comfort in fitness centres was weak and that a single environmental factor in a fitness centres was not sufficient to explain the variation in thermal comfort. Both high and low indoor temperature and humidity can have adverse effects on the physiological and psychological health of fitness personnel, as well as their exercise performance. 44 Research has indicated that in hot and humid environments, individuals are more prone to excessive sweating, leading to increased water loss. 45 This can raise the risk of dehydration, resulting in symptoms like dizziness, fatigue and even negative impacts on the cardiovascular system. Moreover, while the body regulates heat by sweating in hot conditions, high humidity hampers the evaporation of sweat, making it harder for the body to effectively dissipate heat and placing additional strain on the cardiovascular system. 46 Prolonged workouts in unsuitable temperature and humidity conditions can make fitness personnel feel physically burdened and increase fatigue, thereby affecting their overall exercise experience. Furthermore, unfavourable temperature and humidity environments can heighten the risk of exercise-related injuries due to increased fatigue and elevated muscle temperature. Muscle fatigue, combined with hot environments, could lead to unstable movements and raise the likelihood of sports injuries such as sprains and strains. 47 Therefore, in order to enhance comfort and promote better health during fitness exercise, it is crucial to effectively control indoor temperature and humidity levels, ensuring they consistently remain within the range of human thermal comfort.
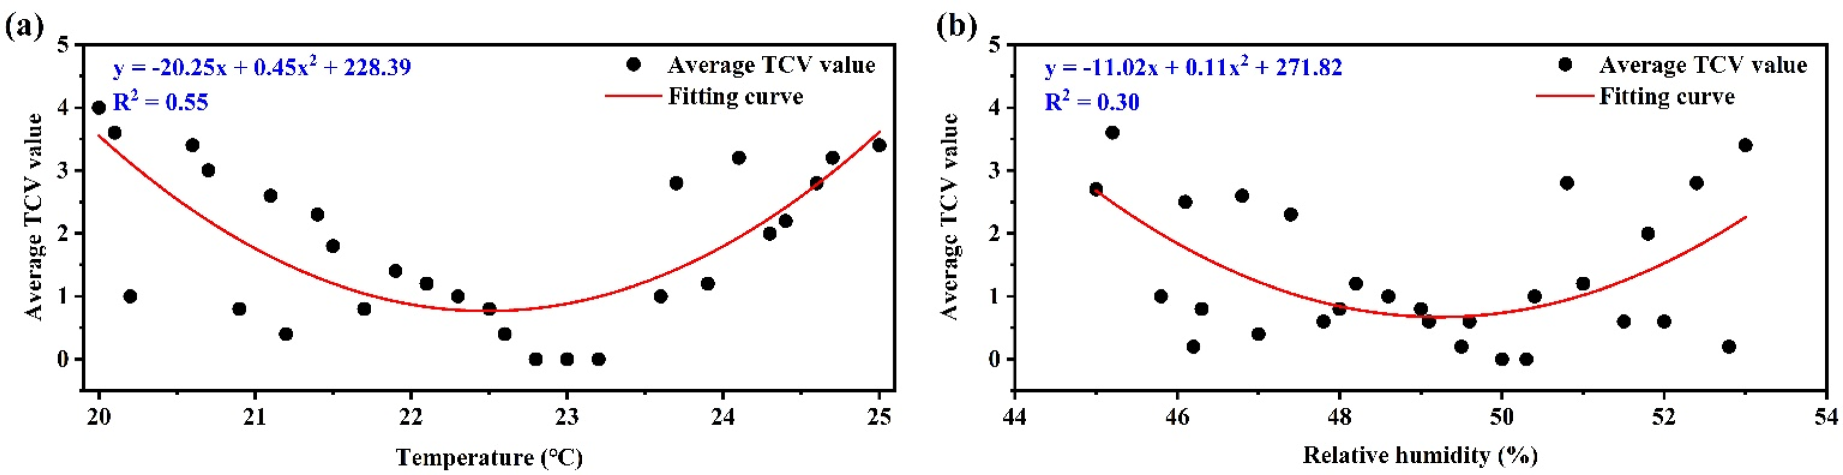
Relationship between TCV and indoor temperature and humidity in fitness centres.
This study shows that the variation in the indoor temperature could cause the health of fitness personnel. Therefore, this study calculated the desired temperature of fitness centres to provide theoretical support for the design of fitness centres. The questionnaire directly asked the respondents about their thermal expectations of the indoor thermal environment and the data obtained were analysed at 0.5°C intervals. The percentages of people who expressed ‘cool’ and ‘hot’ expectations of the ambient temperature were counted for each temperature. The results were then analysed by regression to derive the relationship between the ‘cooling requirement’ and the operating temperature and the relationship between the ‘heat requirement’ and the operating temperature. Finally, the intersection of the two curves is the desired temperature of the respondents. As shown in Figure 7, the desired indoor temperature in the fitness centre was 23.1°C. As shown from the graph, most of the average thermal comfort temperatures in this study were around 23.1°C, further illustrating the accuracy of the desired temperatures in this study.
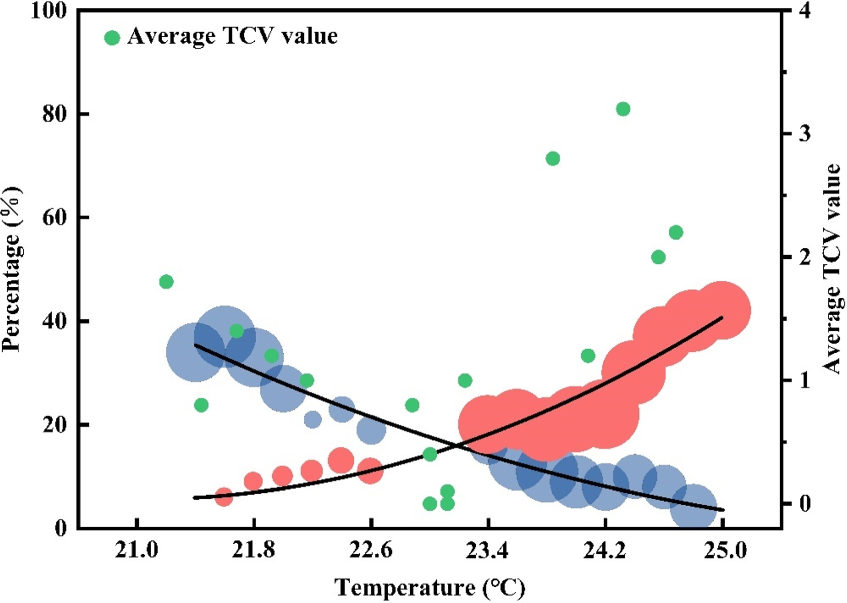
Expectation temperature results.
The International Fitness Association (IFA) 48 suggested that 18°C–20°C can be used as the set temperature for an aerobic exercise area and that relative humidity should be controlled between 40% and 60%. The American College of Sports Medicine (ACSM) 49 recommended 20°C–22°C as the set temperature for indoor sports venues and humidity should not be higher than 60%. Compared to the temperature range determined by the above-mentioned foreign norms, the expected temperature in this study was 23.1°C, which was 3.1°C higher than that was specified by the IFA and 1.1°C higher than that was specified by the ACSM. Lu and Shen 50 showed that controlling the indoor temperature between 16°C and 24°C and humidity between 40% and 80% can maintain a high level of comfort for users. Yang and Liu 51 analysed that around 23°C can be used as a suitable temperature setting in the gym and the suitable humidity should be controlled between 45% and 55%. The reasons why the expected temperature of 23.1°C in this study differed from international studies are mainly in four aspects. First, Jilin Province is located in northeastern China and has a typical temperate continental monsoon climate with cold and long winters. The prolonged cold outside environment makes local residents requiring higher indoor temperatures. 52 Secondly, there are differences in body mass and metabolic levels between Western and Chinese populations, which in turn affected the subjective perception of ambient temperature. 53 For example, Eastern populations typically have a lower basal metabolic rate (BMR) and are more sensitive to external cold at the same ambient temperature. Thirdly, Chinese fitness personnel's preference for exercise environmental temperature is also influenced by socio-cultural and behavioural habits. 54 The fitness culture in Europe and America started earlier and people are more inclined to train with high intensity in a cooler environment. The development of fitness culture in China is relatively late and many fitness practitioners have not yet fully adapted their knowledge and habits of exercise to European and American standards. Finally, combining the results of this study with other domestic literature, we found that the thermal comfort temperature range for Chinese residents is usually between 22°C and 25°C, which is significantly different from international standards.1,31 To summarize, the desired temperature of 23.1°C for fitness workers in this study is mainly influenced by the climatic conditions, national physiological characteristics, intensity of fitness activities and socio-cultural habits in Jilin Province.
Relationship between indoor air pollutants and air quality satisfaction in fitness centres.
In order to show more clearly the effect of variations in indoor air pollutants on perceived air quality, this study used pollutant concentration as the horizontal coordinate and mean air quality satisfaction vote (MAQSV) as the vertical coordinate, as shown in Figure 8. The linear relationship between indoor pollutants and MAQSV is as follows: CO2: R2 = 0.92; TVOC: R2 = 0.91; CH2O: R2 = 0.89; PM2.5: R2 = 0.87. The results indicated that there is a strong correlation between indoor pollutants and MAQSV. The effects of indoor air pollutants on perceived air quality are mainly in terms of sensory perception (e.g. odour intensity) and sensory irritation (e.g. eye, airway and skin irritation). 55 People can detect poor smell when the concentration is above the odour threshold. Characteristics of odours exhibit a wide variety of sensations ranging from pleasant to unpleasant, with varying effects on perceived air quality. 56 Indoor air pollutants have a negative impact on the respiratory system. High levels of PM2.5 can cause respiratory irritation, resulting in coughing and shortness of breath. 57 The release of CH2O could lead to unpleasant odours and affect respiratory comfort. 58 Additionally, elevated concentrations of CO2 can cause discomfort such as dizziness and fatigue. Fine PM2.5, which can enter the body through the circulatory system, has a detrimental effect on the cardiovascular system. 59 This can increase the burden on the heart, impacting exercise endurance and cardiovascular health. Furthermore, TVOC could affect the central nervous system, reducing the attention and concentration of individuals engaging in exercise. 60 Therefore, indoor air pollutants delay the physical recovery process after exercise. Prolonged exercise in polluted environments can also diminish the body's ability to adapt to exercise and hinder the effectiveness of the exercise.
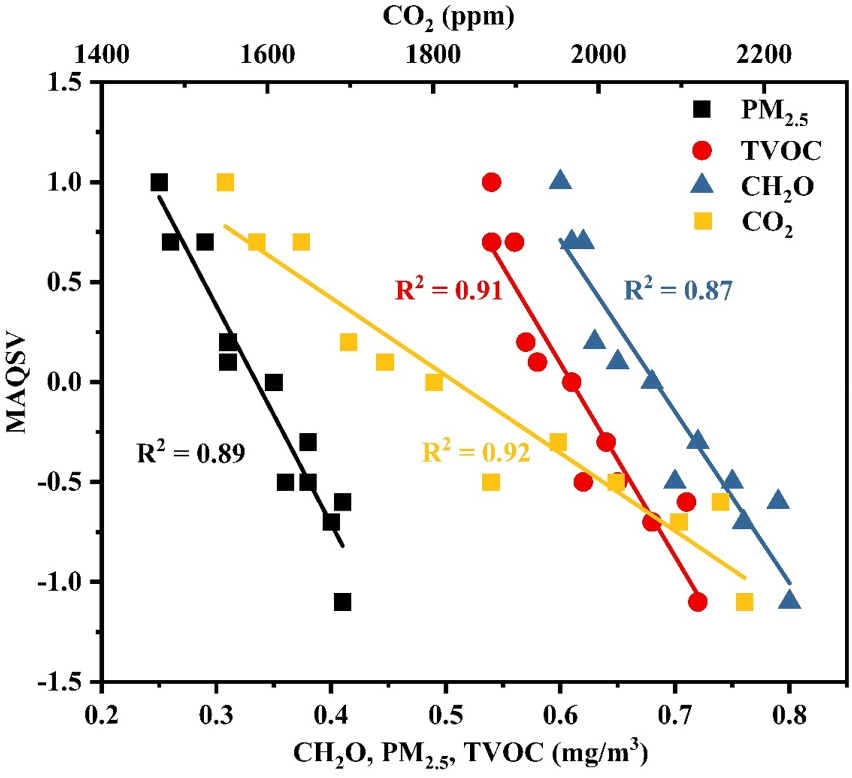
The relationship between mean air quality satisfaction vote and indoor pollutants in fitness centres.
A comprehensive subjective- and objective-based approach to fitness centre environment evaluation
Establishment of a comprehensive evaluation methodology for fitness centres environments.
Actual measurements were conducted to evaluate the characteristics of typical fitness centres environments, revealing differences between indicators and acceptable limits. The assessment of fitness centres environments encompassed both objective and subjective evaluations. Various metrics such as objective and subjective parameters were utilized to gauge the quality of these environments. The selection of these metrics was based on their operationalization and practicality. Eight key parameters, namely, temperature, relative humidity, CO2 concentration, CH2O concentration, TVOC concentration, PM2.5 concentration, TCV and AQSV, were identified as characteristic parameters for the evaluation of fitness centre environments. These parameters were chosen based on their consistency with objective experimental data.
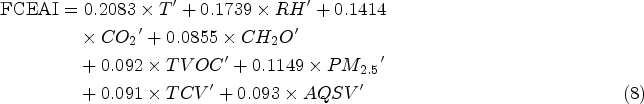
In order to fully consider these characteristic parameters, we define the fitness centre environmental assessment indicator (FCEAI) as a multivariate linear function affected by the above parameters. Its functional form can be expressed as equation (7).

Calculating the weights of fitness centre environmental evaluation indicators.
The ability of the CRITIC method to consider both the strength of contrast and conflict between indicators has been described previously, 1 which is essential for the integrated assessment of subjective perceptions and objective environmental data. In fitness centre environmental assessment, subjective perceptions and objective data often have a nonlinear relationship or even conflict. By analysing the standard deviation and correlation of each indicator, the CRITIC method is able to dynamically assign weights and avoid the excessive influence of a single subjective or objective indicator on the results. In addition, the method does not need to rely on subjective empowerment, which reduces the bias of human intervention and makes the assessment process more objective and fairer. Therefore, this study selected the CRITIC method to calculate the coefficients of the environmental evaluation indicators of fitness centres.
Based on the measured values of six environmental parameters and two subjective questionnaire voting values obtained in the experiment, the weight value of each environmental parameter was calculated using equations (1)–(6). The environmental evaluation index of the fitness centre calculated by equation (8) was obtained.
Validation of fitness centre environmental evaluation indicators.
In this study, the voting of overall environmental satisfaction was conducted in the questionnaire research method, and the accuracy and validity of FCEAI were verified through the data of overall environmental satisfaction. To ensure the validity and reliability of the survey, a new questionnaire was developed based on eight typical parameters of fitness centre environmental assessment indicators. Therefore, the newly designed questionnaire was additionally distributed in this study with a total of 200 copies and finally 181 were validly returned. The questionnaire covered exercise activities of different intensities, including low activity intensity (20–30 min), medium activity intensity (30–40 min) and high activity intensity (40–50 min). The participants were regular users of the fitness centres with an age range of 20 to 30 years old and a gender ratio of 7 (male):3 (female). In this study, six different working conditions were classified based on activity intensity and exercise time. The first set of conditions included low activity intensity, medium activity intensity and high activity intensity for 20–30 min of exercise time (No. 1–3). The second set included medium activity intensity and high activity intensity for 30–40 min of exercise time (No. 4–5). The third set included high activity intensity for 40–50 min of exercise time (No. 6). After normalizing the test results for the different conditions, the FCEAI values were calculated by substituting into equation (8). The comparative analysis of FCEAI for the indoor environment of the fitness centres under six operating conditions is given in Table 3.
Results of the validation of the environmental evaluation indicators for fitness centres.
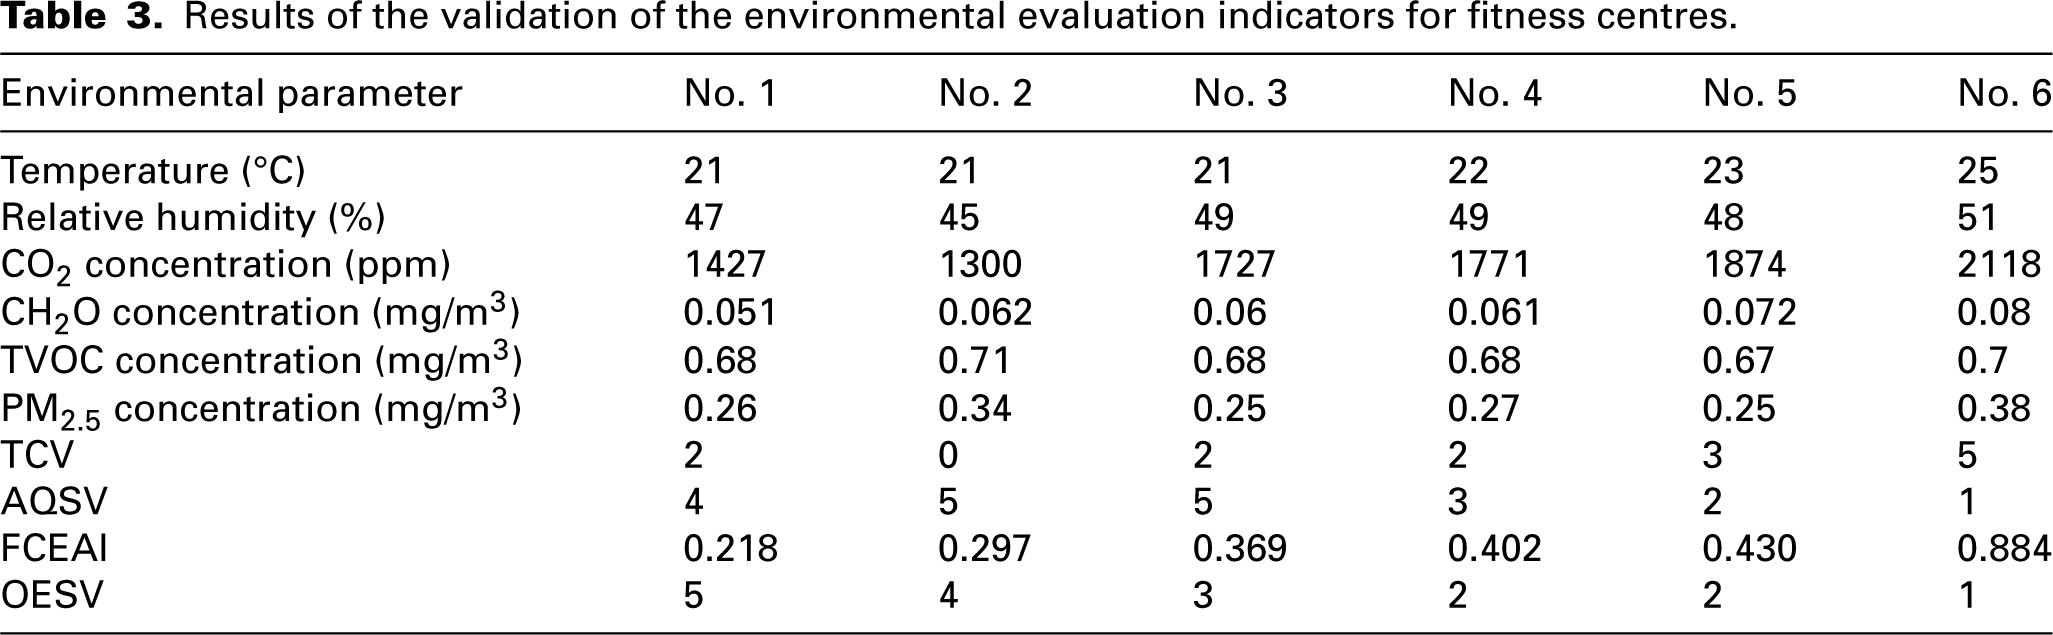
The measurements of the characterization data under different working conditions were generally within the standard range. However, under working conditions 5 and 6, the measured values of temperature, relative humidity, average CO2 concentration and average PM2.5 concentration exceeded the standard, indicating a poor subjective evaluation of environmental quality. The FCEAI is sensitive to variations in indoor environmental parameters that affect fitness. The selected environmental characterization parameters had a significant impact on the FCEAI. Additionally, the FCEAI value aligned with the staff's subjective evaluation of the indoor environment during physical exercise. It was positively correlated with both the objective environmental parameters and the staff's subjective evaluation. A higher FCEAI value would indicate a better indoor environmental quality in the fitness centres, resulting in higher satisfaction amongst people using the facility. These results demonstrated the validity of FCEAI for assessing the indoor environment in fitness centres. Compared to subjective and objective evaluation methods, FCEAI reflects employees’ subjective perception of the environment and also their response to variations in objective parameters. This method provides valuable insights for improving the quality of the indoor environment in fitness centres.
Limitations
This study was based on two fitness centres in Jilin Province. However, the number of samples and test scenarios was insufficient. Future studies should consider using different regions and types of fitness centres for experiments. The variation in the parameter characteristics of indoor spaces in other buildings may differ from those of fitness centres. Therefore, the comprehensive evaluation method proposed in this study is limited to fitness centres. Future studies should focus on modifying the feature parameters and weight calculation models. Additionally, the sample participants in this study were predominantly young people, with fewer elderly individuals. To better reflect the real situation of indoor environmental parameters in fitness centres in China, future studies should aim to expand the sample diversity. Finally, the design of the questionnaire in this study did not strictly differentiate between respondents’ exercise status at the time they participated in the survey, including not clearly documenting whether respondents completed the questionnaire during, after or before they had begun exercising. While this comprehensive coverage survey design reflects the overall perception of the fitness centre's overall environment on users, it lacks a detailed analysis of the differences in environmental perceptions in specific states. In future studies, we will attempt to include records of exercise status and exercise intensity in the survey design and use this as a basis for stratified analyses.
Conclusion
This study investigated the indoor environmental quality of fitness centres using the subjective evaluation method and on-site air environment measurements and introduced a comprehensive evaluation model for the indoor environment of fitness centres. Based on the statistical analysis and evaluation conducted, the following conclusions were drawn:
The average indoor environmental parameters in the fitness centres were as follows: temperature of 23.18°C, relative humidity of 48.51%, CO2 of 1840 ppm, CH2O of 0.07 mg/m3, TVOC of 0.62 mg/m3 and PM2.5 of 0.35 mg/m3. The levels of CO2 and PM2.5 exceeded the nationally regulated limit values. This study demonstrated potential deficiencies in ventilation and air quality management in fitness centres under high-intensity use conditions. This also reflected the fact that the environmental characteristics of fitness centres need to be dynamically adapted to actual operating conditions to ensure health and comfort. The subjective poll results for the fitness centres are shown below: TSV (1.1% cold, 3.5% cool, 4.1% slightly cool, 25.1% neutral, 19.4% slightly warm, 22.4% warm and 24.4% hot), TCV (17.5% comfortable, 23.3% slightly comfortable, 22.1% uncomfortable, 18% very uncomfortable and 19.1% unbearable), AOIV (17.4% no odour, 32% slightly odour, 30.7% medium odour, 14.7% strong odour and 5.2% overpowering odour, AQSV (20.4% very dissatisfied, 29.1% dissatisfied, 12.3% acceptable, 19% satisfied and 18.2% very satisfied). The results of this study have shown that the factors affecting the quality of indoor environments in fitness centres include not only specific physical parameters but are also closely related to the subjective experience of users. This demonstrated the importance of incorporating subjective evaluations into a comprehensive analytical framework to better guide the environmental design and operational optimization of fitness centres. In this study, a comprehensive evaluation model was developed to provide a reference for assessing the indoor environmental quality of fitness centres. By integrating experimental measurements with subjective human evaluations, the model provides a dynamic equilibrium approach that is able to accommodate differences in environmental characteristics across fitness centres. Therefore, the applicability of the model is only limited to the data collected in this study and has a certain degree of generalizability and can provide reference value for other types of fitness centres.
Footnotes
Acknowledgements
This study was financially supported by the National Key Research and Development Program of China (2017YFC0702700).
Authors’ contribution
All authors contributed equally in the preparation of this manuscript.
Data availability
The datasets used in the current study are available from the corresponding author on reasonable request.
Declaration of conflicting interests
The authors declared no potential conflicts of interest with respect to the research, authorship, and/or publication of this article.
Funding
The authors disclosed receipt of the following financial support for the research, authorship, and/or publication of this article: This work was supported by the National Key Research and Development Program of China (grant number 2017YFC0702700).