
Abstract
Student dormitories often face indoor environmental challenges due to high occupant density, functional demands and spatial constraints. This study explored trade-offs between indoor comfort and energy consumption through a holistic envelope design. A university dormitory with enclosed balconies in China was used as a case study, and a multidimensional optimisation framework for windows, shading devices and balconies was developed by integrating field measurements, simulation and algorithmic analysis. Indoor environmental conditions and energy performance were simulated using Ladybug, Honeybee and Butterfly. The extreme gradient boosting (XGBoost) model was combined with an improved decomposition-based multi-objective evolutionary algorithm (IMOEA/D) to predict and optimise thermal comfort, natural ventilation and energy use, whilst analysing the influence of envelope parameters on indoor environmental quality. Pareto front solutions were screened using the entropy weight-technique for order preference by similarity to ideal solution (EW-TOPSIS) method, yielding optimal ranges: an external window-to-wall ratio (EWWR) of 0.44–0.55, an internal window-to-wall ratio (IWWR) of 0.31–0.36, shading height (SH) of 2.8–3.18 m, shading width (SW) of 0.60–0.71 m, enclosed balcony depth (EBD) of 1.61–1.79 m, and floor height (FH) of 8.06–16.29 m. The study also examined building orientation effects. This research provides an efficient, systematic method for integrated envelope design and retrofit in student dormitories, targeting enhanced indoor health, comfort and energy efficiency.
Keywords
Introduction
University halls of residence serve as vital spaces for students' academic pursuits, rest and social interactions. 1 With the rise of online teaching, independent study and dormitory-based social activities in campus life, students now spend significantly more time in their rooms during the day. Consequently, the importance of indoor lighting, thermal and wind environments has become increasingly apparent in their impact on students' physical and mental well-being, learning efficiency, sleep quality and building energy consumption.2,3 At the same time, issues such as inadequate ventilation, persistent odours and the accumulation of pollutants are prevalent in dormitory buildings, making appropriate natural ventilation essential for improving indoor air quality and health standards. In China's severely cold, cold and hot-summer/cold-winter climate zones, university dormitories predominantly feature enclosed balconies, the geometric form of which could significantly affect lighting and thermal conditions, wind environment satisfaction and building energy consumption.4,5 Therefore, systematically examining the combined effects of the building envelope design of student dormitories with enclosed balconies on indoor environmental quality and energy performance is of considerable value for enhancing building health and comfort whilst promoting energy conservation and emissions reduction.
Literature review
Current research on indoor environmental quality in university accommodation remains relatively limited, with most studies focusing on single aspects and lacking comprehensive analyses of the multi-parameter interactions within the building envelope system. Consequently, when designing envelope components such as window openings, shading devices and balconies, architects must strike a holistic balance between the often-competing requirements of lighting, thermal conditions and wind environment satisfaction to mitigate reduced comfort and avoid unnecessary building energy consumption.
Current status of research on indoor environments in student dormitories
The indoor environmental quality of student accommodation is closely linked to residents' health, learning efficiency and sleep patterns. Existing research has primarily focused on lighting, thermal and wind environments, as well as indoor air quality in dormitory buildings. For example, Cheng et al. 6 examined how the positioning of dormitory units within a building and prevailing wind directions could influence wind environment satisfaction and air quality. Song et al. 7 analysed the role of building orientation, height and floor area ratio in dormitory thermal comfort, emphasising the importance of architectural layout. Razmi et al. 8 introduced machine learning into the architectural design process to investigate the combined effects of parameters such as shading, building form and window-to-floor ratio on lighting, thermal comfort and building energy consumption. Gigante et al. 9 quantified the impact of design decisions on thermal comfort and wind environment satisfaction by comparing indoor temperature, humidity and air quality metrics before and after dormitory renovations. Overall, existing research has predominantly focused on individual environmental factors, lacking systematic evaluation and optimisation of the building envelope as an integrated system.
The impact of the building envelope system on the indoor physical environment of a building
The building envelope system comprises external walls, doors and windows, roofing, balconies and shading elements and plays a pivotal role in ensuring visual comfort, thermal comfort, wind environment satisfaction and building energy efficiency. Amongst these components, window openings, shading devices and balconies exert the most significant influence on visual comfort, thermal comfort, wind environment satisfaction and building energy consumption. Consequently, they are critical in the design and optimisation of green buildings.
Firstly, regarding window-opening design, increasing the window area can improve lighting performance but may also result in heat loss, indoor overheating, poor wind environment satisfaction or pollutant accumulation, thereby increasing building energy loads. Secondly, the primary functions of external shading elements are to reduce solar heat gain, enhance lighting performance and improve façade aesthetics. 10 However, poorly designed shading elements may disrupt façade airflow, restrict wind environment satisfaction or lead to heat accumulation, inadequate lighting and glare, thereby compromising visual comfort. For instance, research by Zhao and Du 11 and Freewan 12 demonstrated that parameters such as the material, angle and depth of sunshades could significantly influence building energy consumption, thermal comfort, lighting performance and occupant performance. Furthermore, research by Izadyar et al. 13 and Li et al. 14 showed that the geometric form of balconies could similarly have a considerable impact on thermal comfort, lighting and wind environment satisfaction. Whilst increasing the depth of enclosed balconies could enhance thermal insulation, it may also result in insufficient daylighting and restricted wind environment satisfaction.
The building envelope serves as the ‘first line of defence’ in ensuring building performance and is also a key means of reducing carbon emissions and enhancing indoor comfort. It could indirectly affect human health, productivity and psychological well-being. 15 Consequently, as expectations for indoor comfort continue to rise, it becomes increasingly important to create appropriate and healthy lighting, thermal and wind environment conditions whilst simultaneously controlling building energy consumption.16,17
Application of multi-objective optimisation in building performance design
Multi-objective optimisation can simultaneously address conflicting performance objectives, such as visual comfort, thermal comfort, wind environment satisfaction and building energy consumption, making it more applicable in building engineering than single-objective optimisation. Si et al. 18 compared the performance of non-dominated sorting genetic algorithm II (NSGA-II), multi-objective particle swarm optimisation (MOPSO), multi-objective simulated annealing (MOSA) and evolution strategy (ES) across different problems, showing that all four algorithms can effectively handle objective conflicts. Despite these advantages, multi-objective optimisation faces challenges, including computational complexity, difficulties in quantifying non-linear conflicts, sensitivity to decision-makers' preferences and limited adaptability to dynamic environments. 19 Machine learning models can construct high-precision surrogate models and improve the system's dynamic adaptability. Consequently, integrating machine learning with multi-objective optimisation allows the prediction of solution quality through surrogate models, guiding search directions and accelerating convergence, whilst balancing feature count, model complexity and prediction accuracy, thereby enhancing machine learning performance. This synergy establishes a collaborative optimisation mechanism that achieves comprehensive improvements in visual comfort, thermal comfort, wind environment satisfaction and building energy performance. 20
Innovations and objectives of the study
Currently, research on optimising indoor environmental performance in buildings tends to either investigate lighting, thermal and wind environment in isolation or focus solely on individual building envelope components, such as window openings, shading devices or balcony configurations (Table 1). This approach overlooks the combined effects of lighting, thermal and wind environment performance within dormitory buildings, which collectively determine occupants' visual comfort, thermal comfort, wind environment satisfaction and learning efficiency. Moreover, the influence of the building envelope on indoor environments involves a multi-factor coupled interaction process. Building on prior research, this paper presents the following innovations.
Classification of key studies on indoor environmental optimisation in residential spaces.
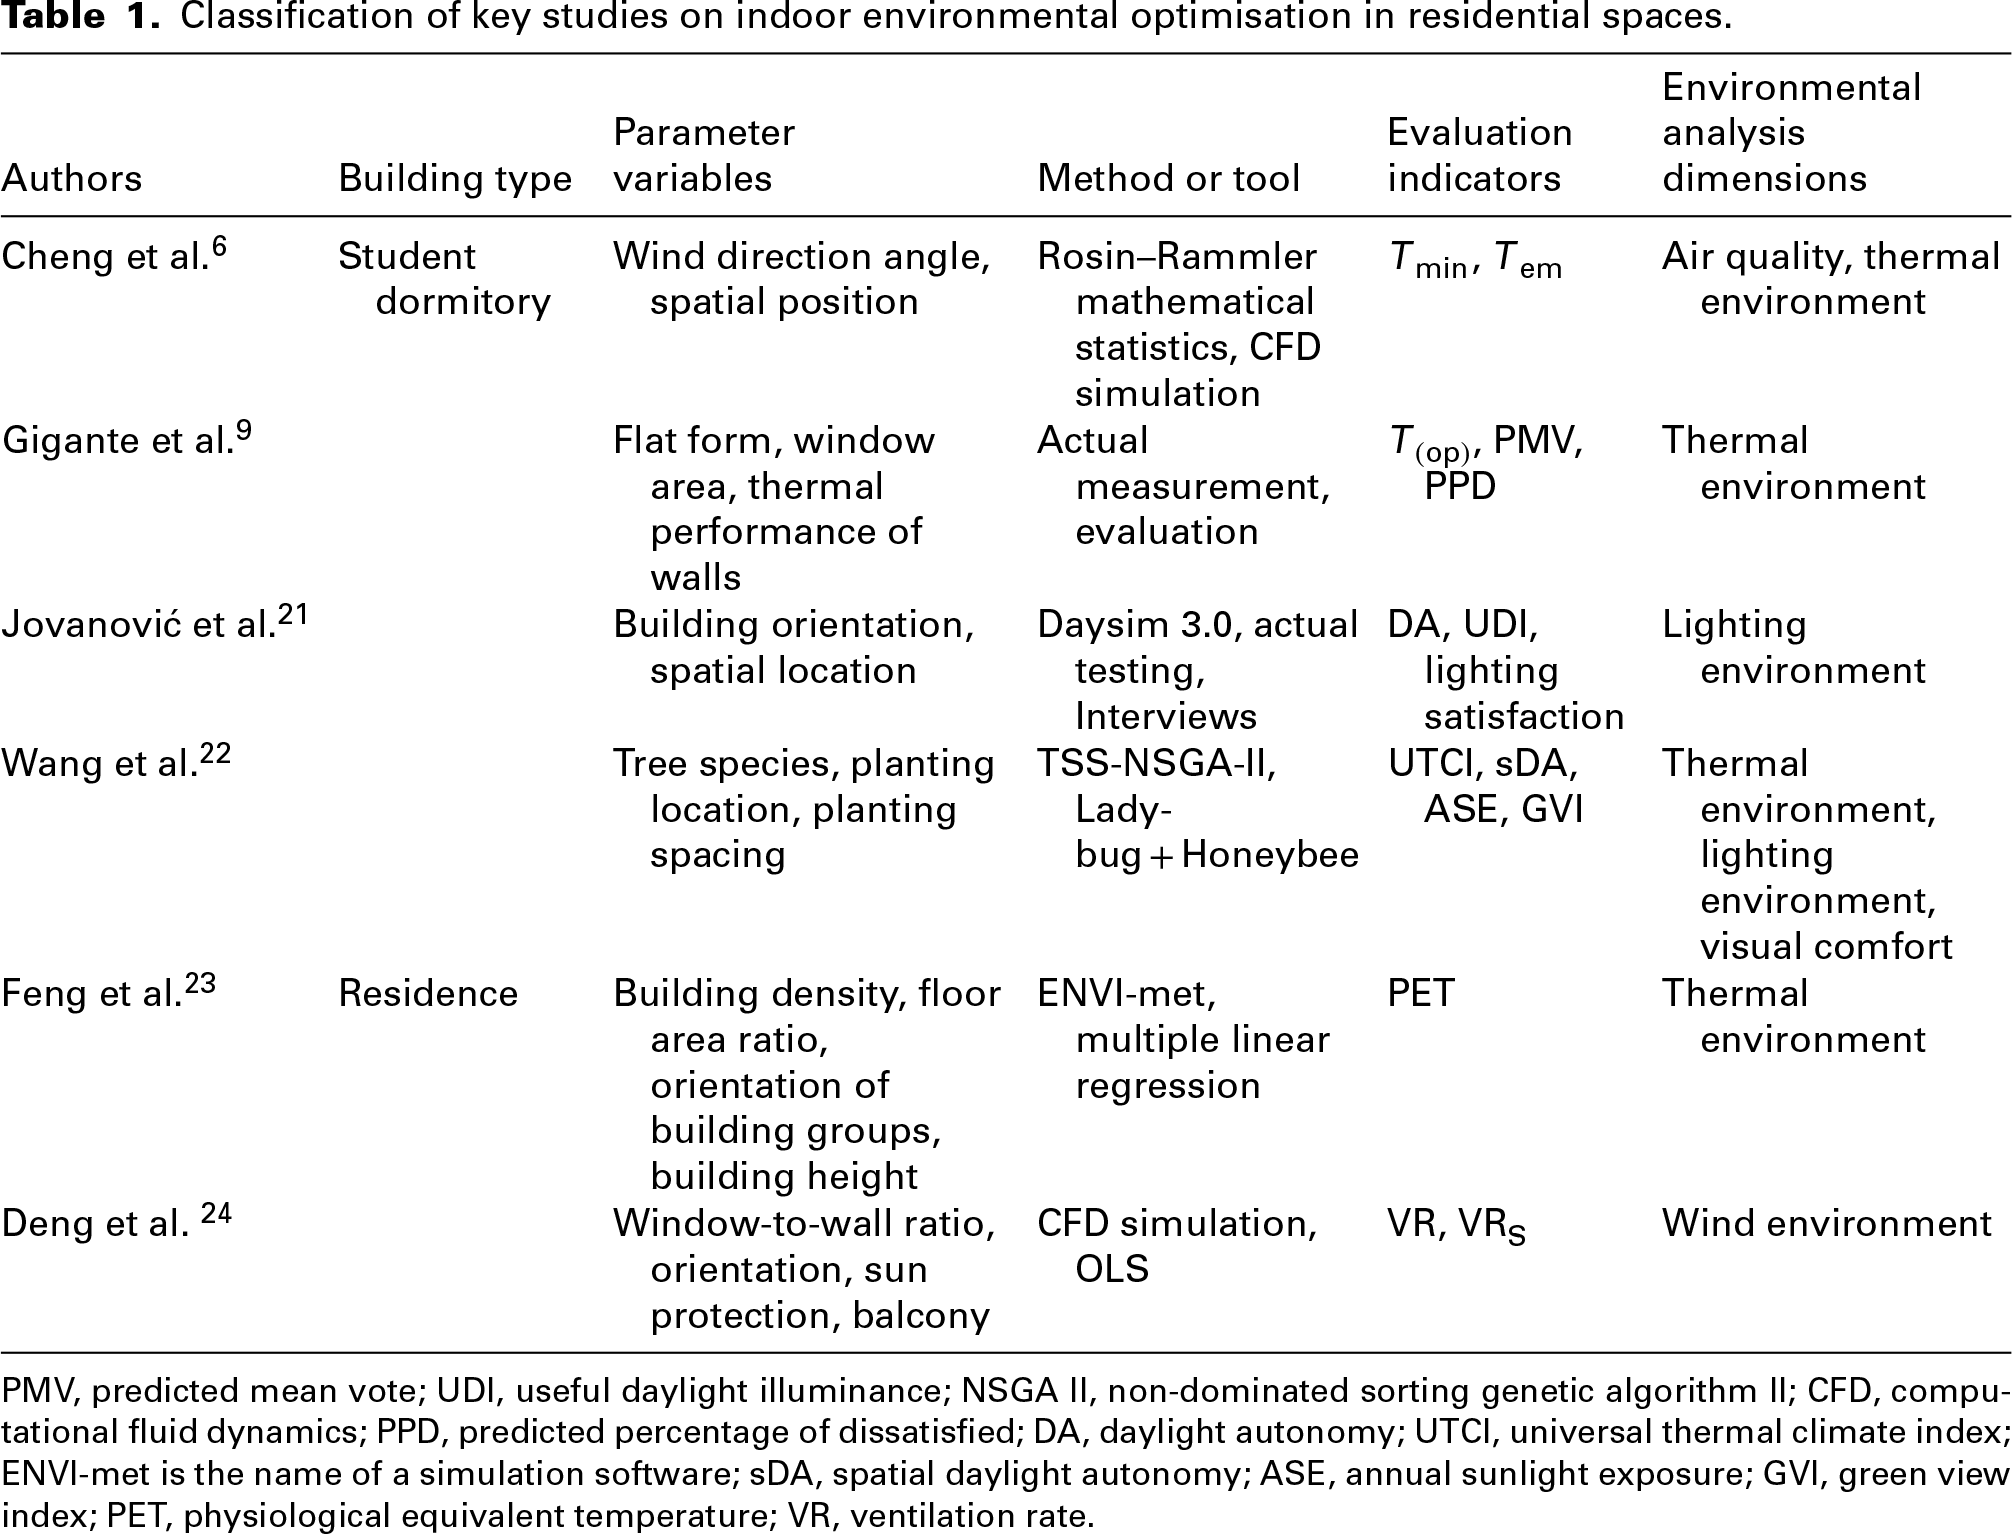
PMV, predicted mean vote; UDI, useful daylight illuminance; NSGA II, non-dominated sorting genetic algorithm II; CFD, computational fluid dynamics; PPD, predicted percentage of dissatisfied; DA, daylight autonomy; UTCI, universal thermal climate index; ENVI-met is the name of a simulation software; sDA, spatial daylight autonomy; ASE, annual sunlight exposure; GVI, green view index; PET, physiological equivalent temperature; VR, ventilation rate.
Firstly, the study comprehensively examined the impact of dormitory buildings with enclosed balconies on occupant experience across lighting, thermal and wind environment conditions (including odour and pollutant dispersion). Four objectives, visual comfort, thermal comfort, wind environment satisfaction and building energy consumption, were coupled to construct a holistic integrated performance evaluation model. Secondly, unlike previous studies that treat window openings, balconies and shading devices as isolated elements, this research considered them as an integrated envelope system. It analysed their roles in visual comfort, thermal comfort, ventilation performance and building energy consumption, offering a more practical theoretical basis for optimising the comprehensive performance of living spaces. Thirdly, for designers lacking programming expertise, this study introduced the novel optimisation methodology extreme gradient boosting (XGBoost)–IMOEA/D + entropy weight-technique for order preference by similarity to ideal solution (EW-TOPSIS). This approach would improve design efficiency and enable visualisation of the optimisation process.
In summary, a good thermal environment inhibits mould growth, reduces visual fatigue and promotes better sleep quality and mental well-being. Proper ventilation helps dilute and expel odours and airborne pollutants, thereby preventing the accumulation of harmful gases that may compromise students' comfort, mood and respiratory health. This study evaluated a student dormitory building with enclosed balconies located at a university in Handan, China, as a case study. Combining on-site surveys with simulation modelling, this study investigated key architectural variables, including the interior window-to-wall ratio (IWWR), the exterior window-to-wall ratio (EWWR), the width and depth of shading elements and the depth of enclosed balconies. The optimisation objectives were visual comfort, thermal comfort, wind environment satisfaction and reduced building energy consumption. To achieve this, a combination of simulation tools, Ladybug, Honeybee and Butterfly, were employed,25,26 along with the XGBoost algorithm. These were integrated within an IMOEA/D, with solution screening guided by the EW-TOPSIS method.
Research methods
This study evaluated a student dormitory building at a university in Hebei Province, China, as the research object. A simulation model was developed based on field measurements and questionnaire survey data. An IMOEA/D was integrated with an XGBoost model to optimise key building envelope design parameters, and the optimal solution was selected using the EW-TOPSIS method. The overall research framework is described as follows.
First, on-site measurements, questionnaires and interviews were conducted to assess indoor lighting, thermal and natural ventilation conditions in university dormitories. Key environmental problems were identified, and a baseline simulation model was developed to evaluate overall building performance. Second, the IMOEA/D was coupled with XGBoost, and the performance of the integrated model was validated. Third, questionnaire results were analysed to determine occupants' environmental requirements. Correlation and sensitivity analyses of the baseline simulations were performed to reveal relationships between optimisation variables and performance indicators, thereby identifying the key objectives. Fourth, multi-objective optimisation of envelope design parameters, including the IWWR, EWWR, balcony depth and shading dimensions, was conducted using the coupled IMOEA/D–XGBoost model. The Pareto front solutions were obtained and analysed for distribution patterns and parameter relationships. Finally, the EW-TOPSIS method was applied to evaluate the Pareto solutions, and the optimal parameter combination was selected based on the closeness coefficient (C-value). The effects of floor height and building orientation on environmental performance and energy consumption were also examined.
Based on the above, this study analysed the relationships between building envelope design parameters and indoor environmental performance indicators and proposed optimisation strategies for student dormitory buildings, providing theoretical guidance for indoor environmental design. The research workflow is illustrated in Figure 1.
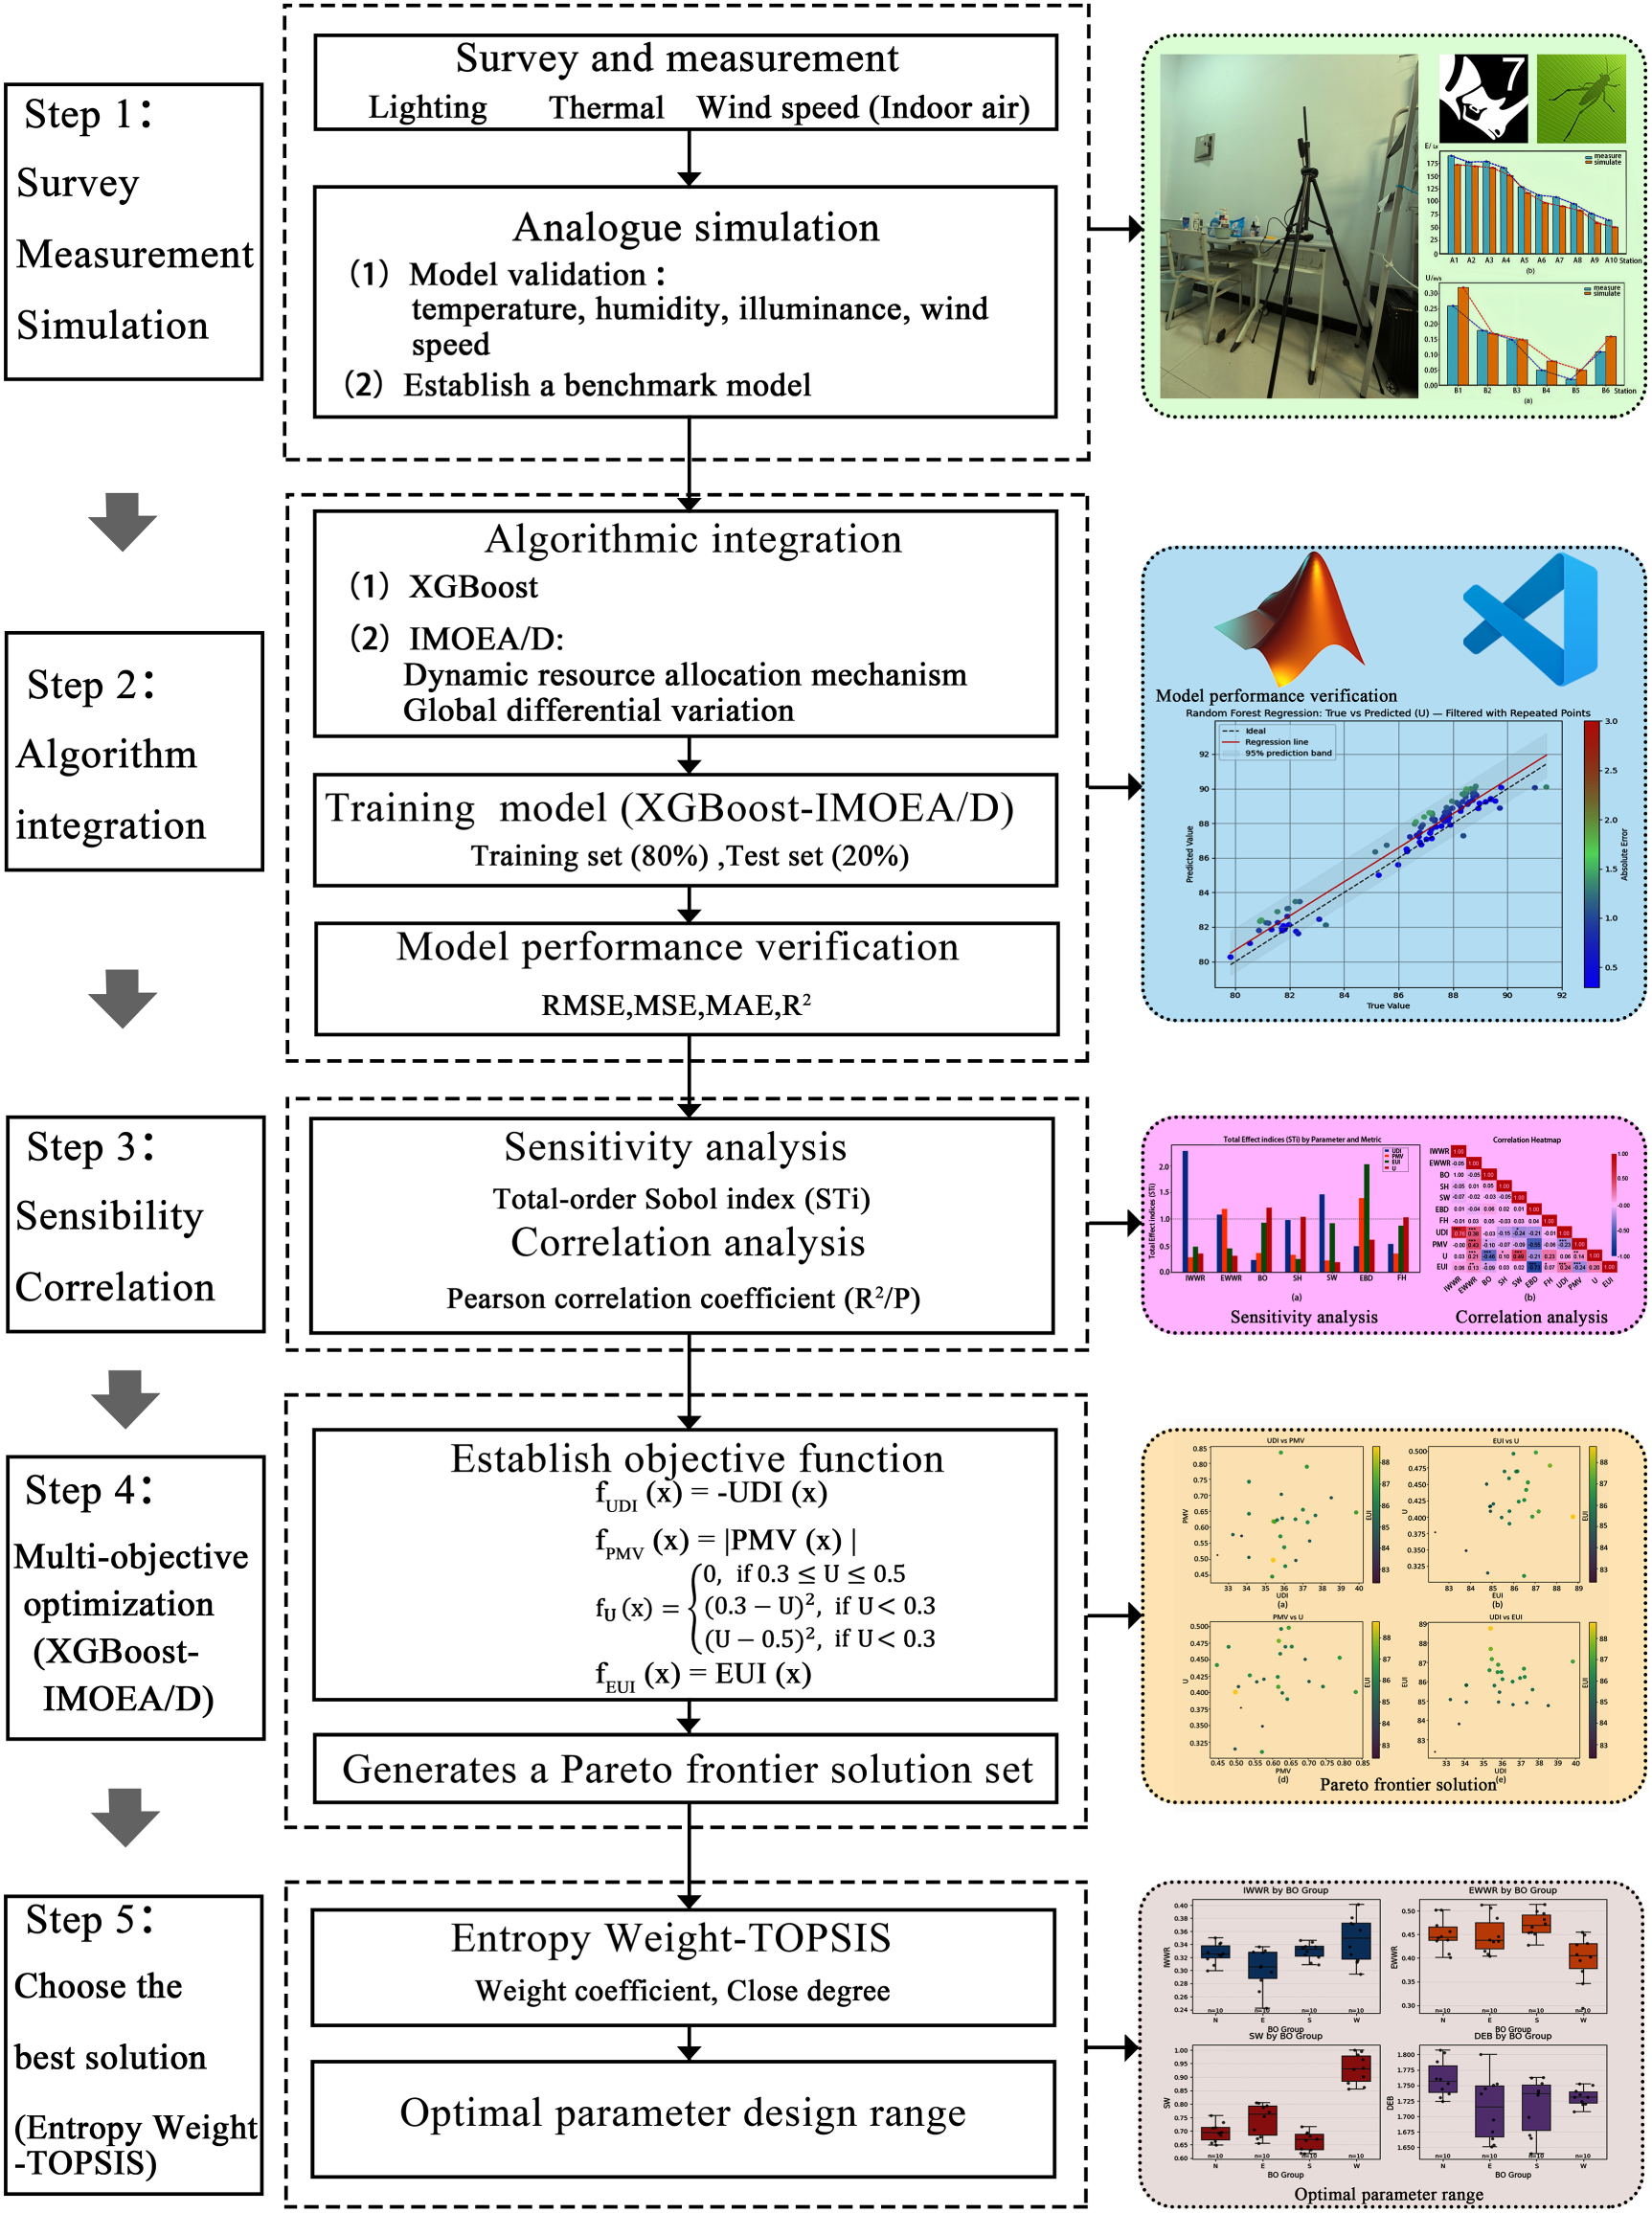
Research process.
Investigation of the existing conditions of student dormitory buildings
Sample selection.
The purpose of this study was to investigate the impact of the building envelope system on the indoor lighting environment, thermal environment, wind environment and building energy consumption in student dormitories to create a comfortable and healthy indoor building environment. According to GB 50178-93, 27 the Standard of climatic regionalization for architecture, and GB 50033-2013, 28 the Standard for daylighting design of buildings, _ENREF_42Handan City is classified as a Type II thermal climate zone and a Type III light climate zone, thereby avoiding extreme urban lighting and climate conditions and ensuring the general applicability of the study. Additionally, a student dormitory building with high occupancy rates and noticeable indoor physical environment issues at a particular university was selected as the research sample for field measurements, surveys and simulation analyses.
Questionnaire survey.
The student dormitory complex is located on the west side of the campus. The southwest sides of the buildings are unobstructed, with other dormitory complexes to the north and a dining hall to the east. Each standard floor of the male dormitory building has a total of 76 student dormitories, including 26 south-facing rooms, 24 north-facing rooms and 13 rooms each on the eastern and western sides. The standard floor of the female dormitory building features a total of 78 student dormitories, divided into 28 south-facing rooms, 24 north-facing rooms, eight west-facing rooms and 18 east-facing rooms. The building's exterior façade and floor plan are shown in Figure 2.
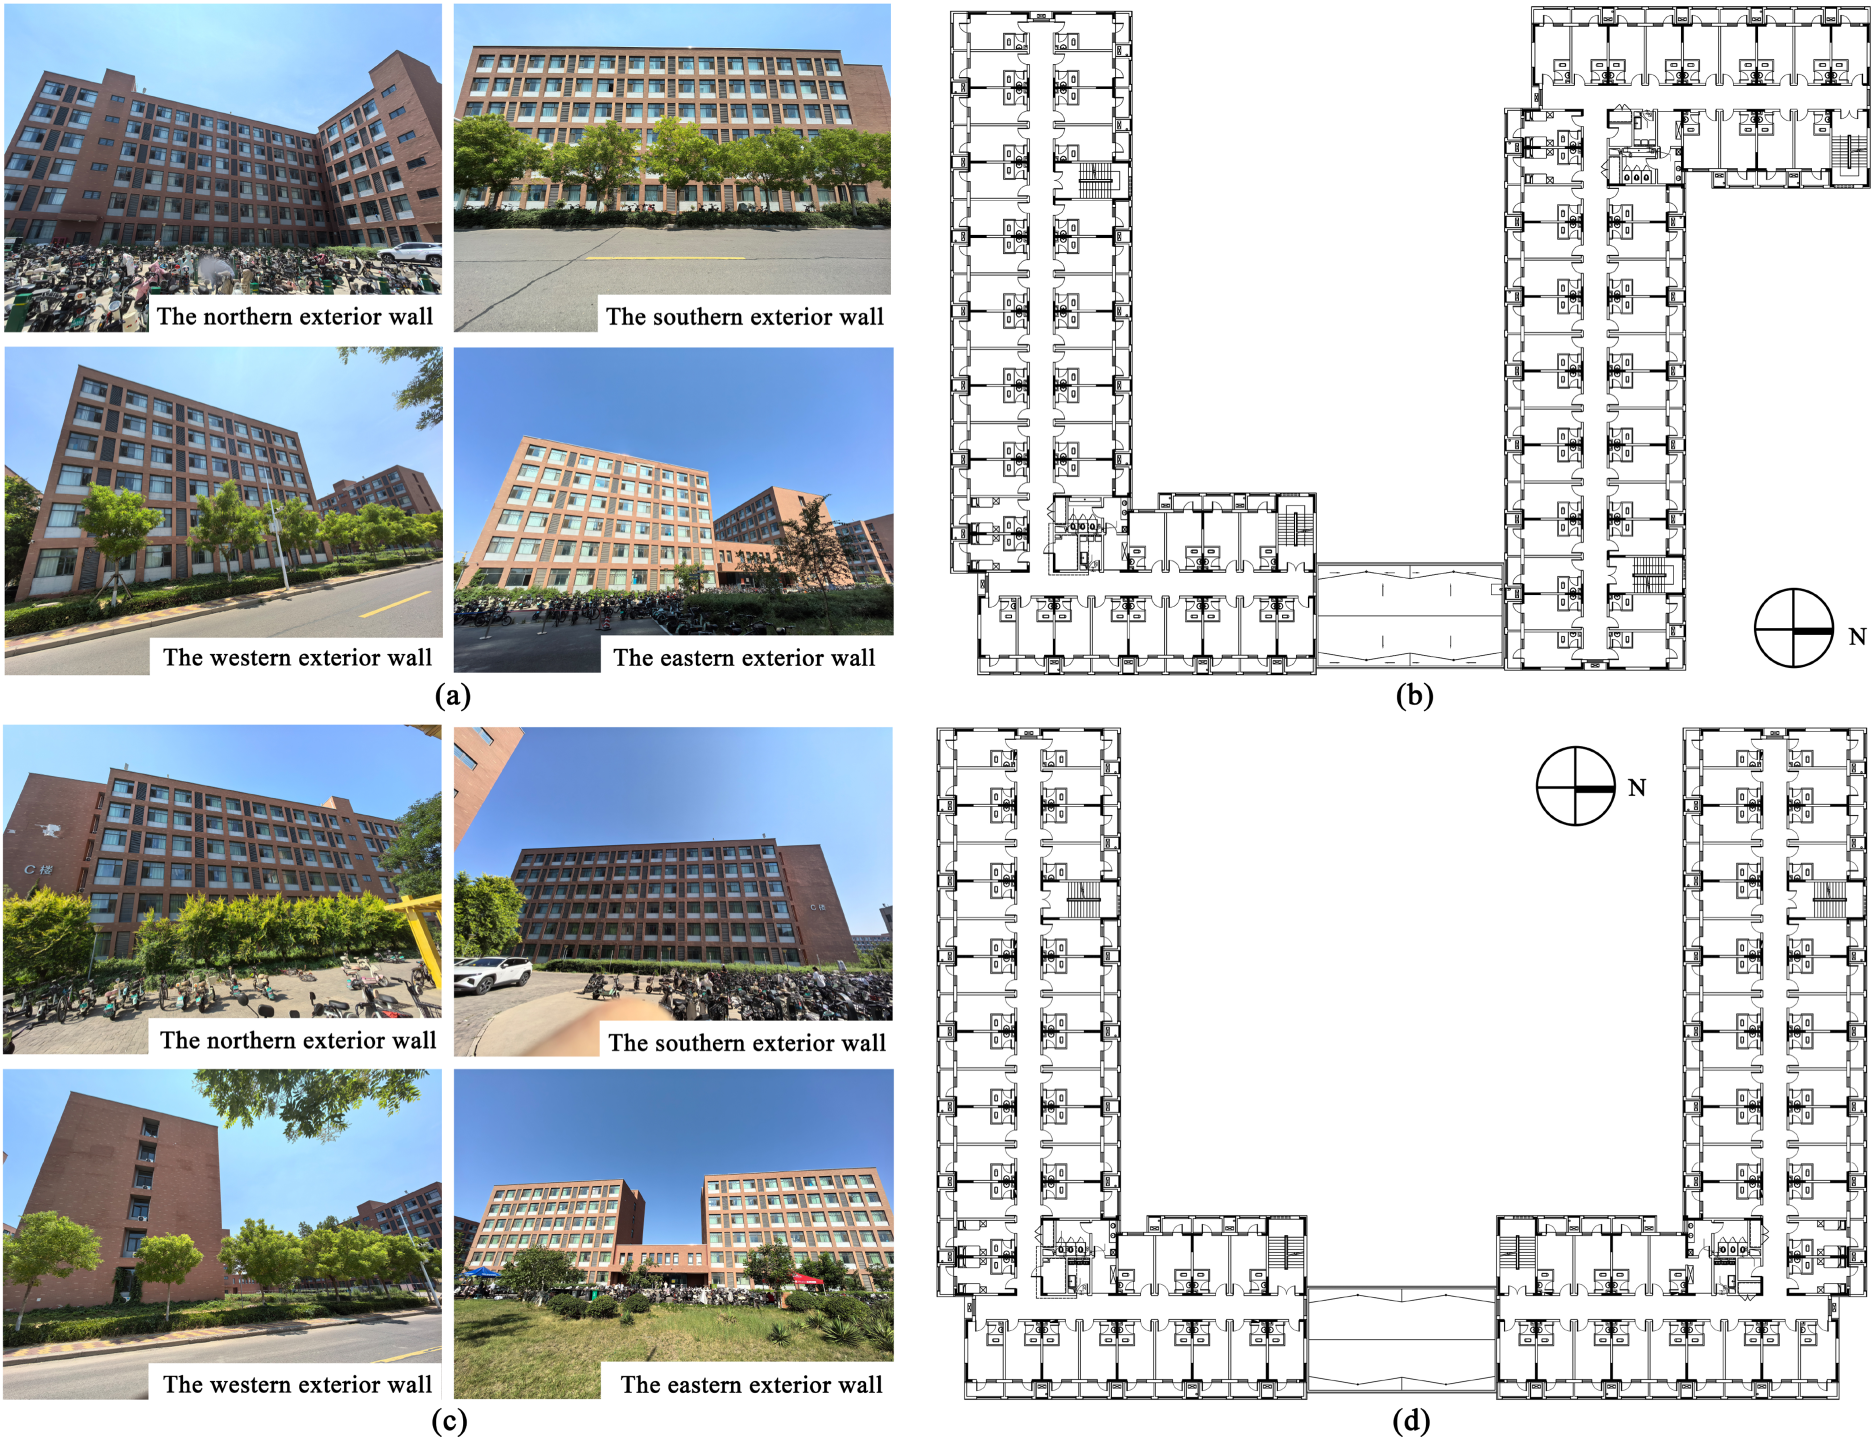
Exterior elevation and floor plan diagrams: (a) Exterior elevation of the men's dormitory. (b) Standard floor plan of the men's dormitory. (c) Exterior elevation of the women's dormitory. (d) Standard floor plan of the women's dormitory.
Each dormitory features an enclosed balcony. The external windowsill height is 0.9 m, with a window width of 2.2 m and height of 2.0 m. The internal door-connected window measures 2.5 m in height and 1.8 m in width. All glazing consists of multi-chamber sealed aluminium alloy frames with thermal break, fitted with a 6-mm high-transmittance low-E glass + 12-mm argon gas-filled cavity + 6-mm transparent double-silver glass.
The external wall structure comprises a 100-mm FS (Formwork System for Composite Insulation) insulated outer formwork, with rock wool board insulation as the core material, combined with either 200-mm reinforced concrete or 300-mm self-insulating concrete composite blocks. The roof consists of 120-mm reinforced concrete topped with 90-mm extruded polystyrene insulation boards. The air-conditioning system is of the ‘fan coil unit plus fresh air’ type, operated mainly seasonally under a leasing arrangement. Ventilation is natural, with no mechanical supply air. Evaluation subjects and participants: The study selected one male and one female dormitory building on campus for the questionnaire survey, covering rooms at varying locations, orientations and floor levels. Prior to the formal distribution of the questionnaire, interviews were conducted with a sample of dormitory residents to identify their primary concerns and existing issues relating to indoor lighting and thermal comfort. These findings informed the refinement of the questionnaire, which is provided in Appendix A. Through convenience sampling, 79 participants were recruited to evaluate the indoor environments of their respective dormitory rooms. The participants, aged 23–30, comprised 45 males and 34 females. The survey covered 37 rooms located on different floors, orientations and positions within the buildings, ensuring a spatially balanced sample distribution. The data were collected between 19 and 20 June 2025. Evaluation indicator scale: The evaluation of the lighting environment primarily focused on whether the indoor space of the dormitory receives sufficient and evenly distributed natural daylight, as well as the occurrence of glare. It reflected occupants' satisfaction with natural lighting and was assessed using a five-point Likert scale,
29
ranging from −2 to + 2, corresponding to ‘very dissatisfied’, ‘dissatisfied’, ‘neutral’, ‘satisfied’ and ‘very satisfied’. The assessment of the thermal environment placed a great emphasis on occupants' perception of temperature and humidity throughout the day, representing the degree of thermal comfort within the dormitory space. This was also measured using a five-point Likert scale from −2 to + 2, corresponding to ‘very low thermal comfort’, ‘low thermal comfort’, ‘neutral’, ‘high thermal comfort’ and ‘very high thermal comfort’. The evaluation of the ventilation environment and wind environment satisfaction focused on the effectiveness of natural ventilation (i.e. air exchange within the room) and the dispersion of air pollutants (such as odours and dust). A five-point Likert scale was employed, with −2 to + 2 representing ‘very low satisfaction with ventilation’, ‘low satisfaction’, ‘neutral’, ‘high satisfaction’ and ‘very high satisfaction’, respectively.
30
Whilst evaluating the light, thermal and wind environment in the indoor spaces of student dormitory buildings, we also collected respondents' suggestions for improving indoor environmental comfort. Additionally, since the indoor environment was divided into different periods for evaluation, we made every effort to ensure that respondents completed the questionnaire during the corresponding time to maintain the validity of the survey results.
Algorithm integration (XGBoost–IMOEA/D).
This study employed XGBoost, coupled with an IMOEA/D, to optimise the building envelope of student accommodation buildings with enclosed balconies. 31 XGBoost is an ensemble learning algorithm that enhances predictive accuracy by iteratively constructing decision trees. It has strong generalisation capability, computational efficiency and flexibility, enabling rapid prediction of indoor thermal and visual comfort, as well as energy consumption, for various design parameter combinations. 32
IMOEA/D decomposes multi-objective optimisation problems into multiple sub-problems and uses neighbourhood collaboration to simultaneously optimise them, thereby generating a solution set that approximates the global Pareto front. To further enhance global search capability and convergence speed, this study introduced a dynamic resource allocation mechanism based on the traditional MOEA/D, combined with a global differential mutation strategy to escape local optima. The algorithm was executed on an Intel Core i7-9750H central processing unit (CPU) with 16 GB of RAM, demonstrating computational efficiency suitable for practical applications in architectural optimisation. It also exhibited robust stability with respect to variations in critical input parameters, with minor perturbations causing no significant change in the Pareto solution ranking.
EW-TOPSIS method.
Since multi-objective optimisation algorithms utilise non-domination sorting and crowding degrees to generate a set of Pareto optimal solutions, these solutions cannot be compared within the objective space, meaning that no solution can be superior to all others across all objectives simultaneously. 33 However, in practical applications, designers or researchers need to select the optimal solution from these solution sets to meet specific requirements. Therefore, the introduction of the EW-TOPSIS method to select the optimal solution from the Pareto solution set can effectively address the balance between multiple objectives. This method avoids the subjectivity of subjective considerations whilst fully considering the relative importance of each objective. The primary process is as follows: construct the decision matrix, standardise the decision matrix, calculate the target entropy values, calculate the target weights, perform weighted processing to obtain the comprehensive decision matrix, determine the positive and negative ideal solutions for the indicators, calculate the Euclidean distance between the solutions and the positive and negative ideal solutions, calculate the proximity of the solutions, and determine the ranking of the solutions. 34
Model development and algorithm validation
Model establishment and simulation modelling.
Based on field measurements, the basic geometric information of the building was obtained to define the baseline model's floor plan layout, floor height, area, window openings, shading and other parameters. Simultaneously, the parameters, equipment power ratings and operating schedules for the building envelope, air conditioning, ventilation, lighting and other systems were established in accordance with GB/T 51350-2019, 35 the Technical standard for nearly zero energy buildings; GB 55015-2021, 36 the General code for energy efficiency and renewable energy application in buildings; and GB 50176-2016, 37 the Code for thermal design of civil building.
The resulting model, which was developed using the Rhino and Grasshopper simulation platforms, represents the solar–thermal environment and energy consumption characteristics of the dormitory building. This approach ensures the model meets the basic requirements for subsequent simulation experiments. To reduce computational workload and minimise the influence of adjacent spaces and their envelopes on the simulation results for the target room, the entire dormitory building was modelled. However, only the data set for lighting, thermal and ventilation performance indicators from the target space was extracted, as shown in Figure 3(a).
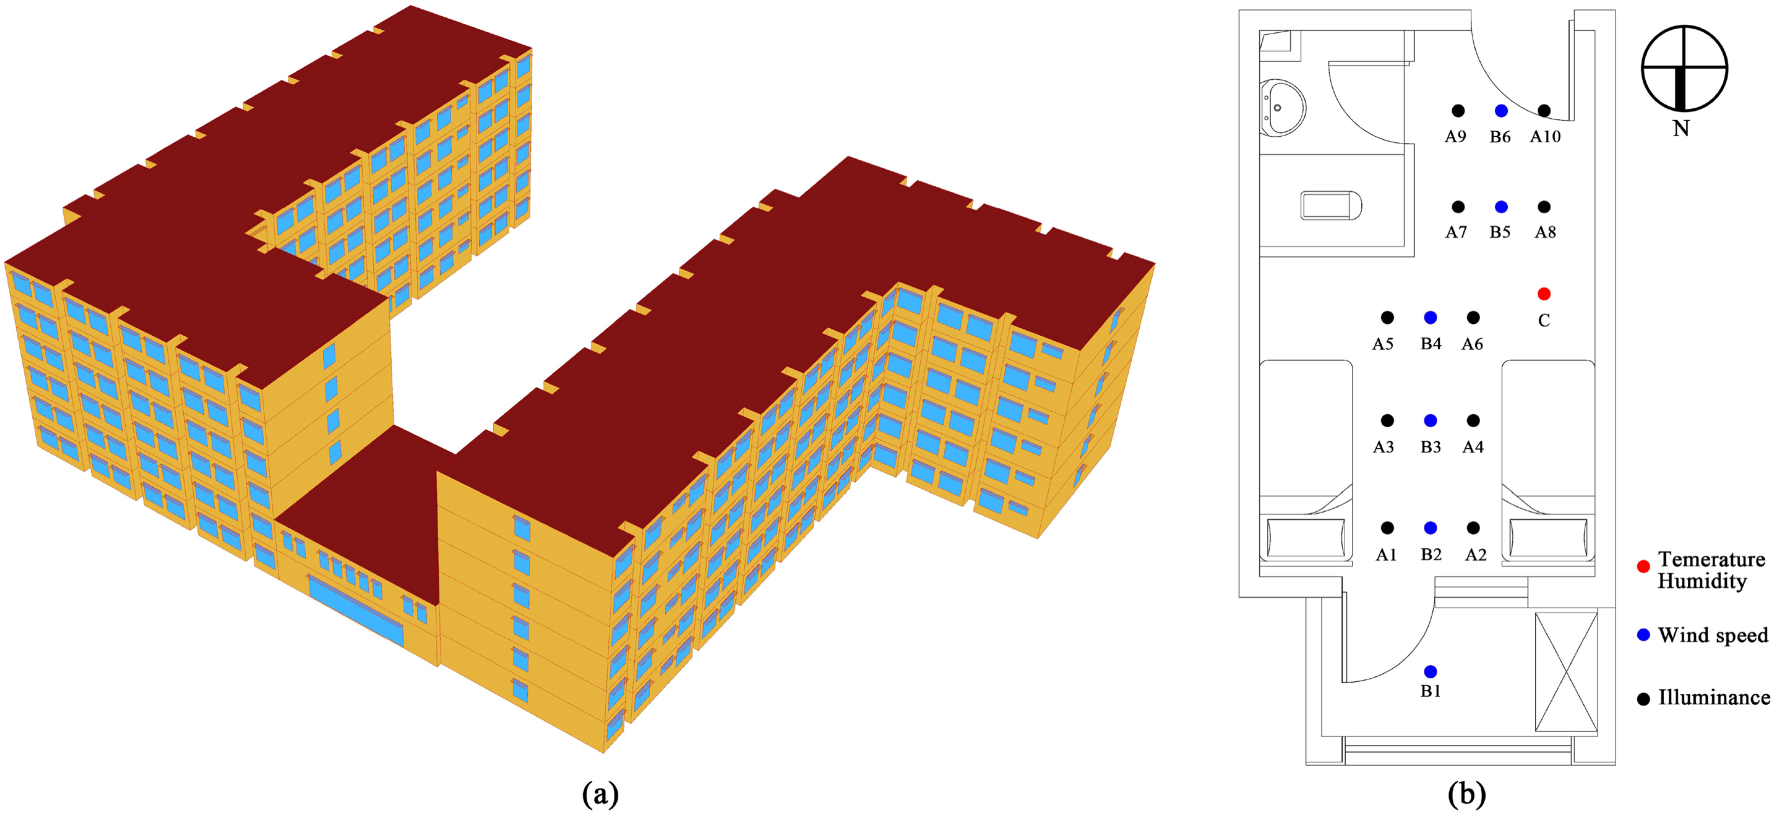
Reference model and measurement point layout: (a) Reference model. (b) Actual measurement point information.
Reliability verification
In order to investigate how building envelope components, such as window openings, shading devices and balconies, could affect indoor physical comfort and occupant satisfaction, it is essential to validate the reliability of the simulation model before simulating indoor environments under different parameter configurations for these elements.
Therefore, in accordance with relevant standards (SAC 5699-2017, 38 GB 50785-2012 39 and GB 309-2013), 40 illuminance, temperature and air velocity were measured in a single unit space within the dormitory building between 19 and 20 June 2025, with measurement points arranged as shown in Figure 3(b). The measured results were compared with simulation outcomes, revealing consistent spatial and temporal variation trends between the two (Figure 4). The mean bias error (MBE) and root mean square error (RMSE) between simulated and measured values for illuminance, temperature, humidity and indoor air velocity were 0.021/0.032, 0.003/0.064, 0.048/0.144 and 0.042/0.131 respectively, each below the thresholds of 0.05 and 0.15, indicating good agreement between simulation and measurement and confirming the model's validity. 41
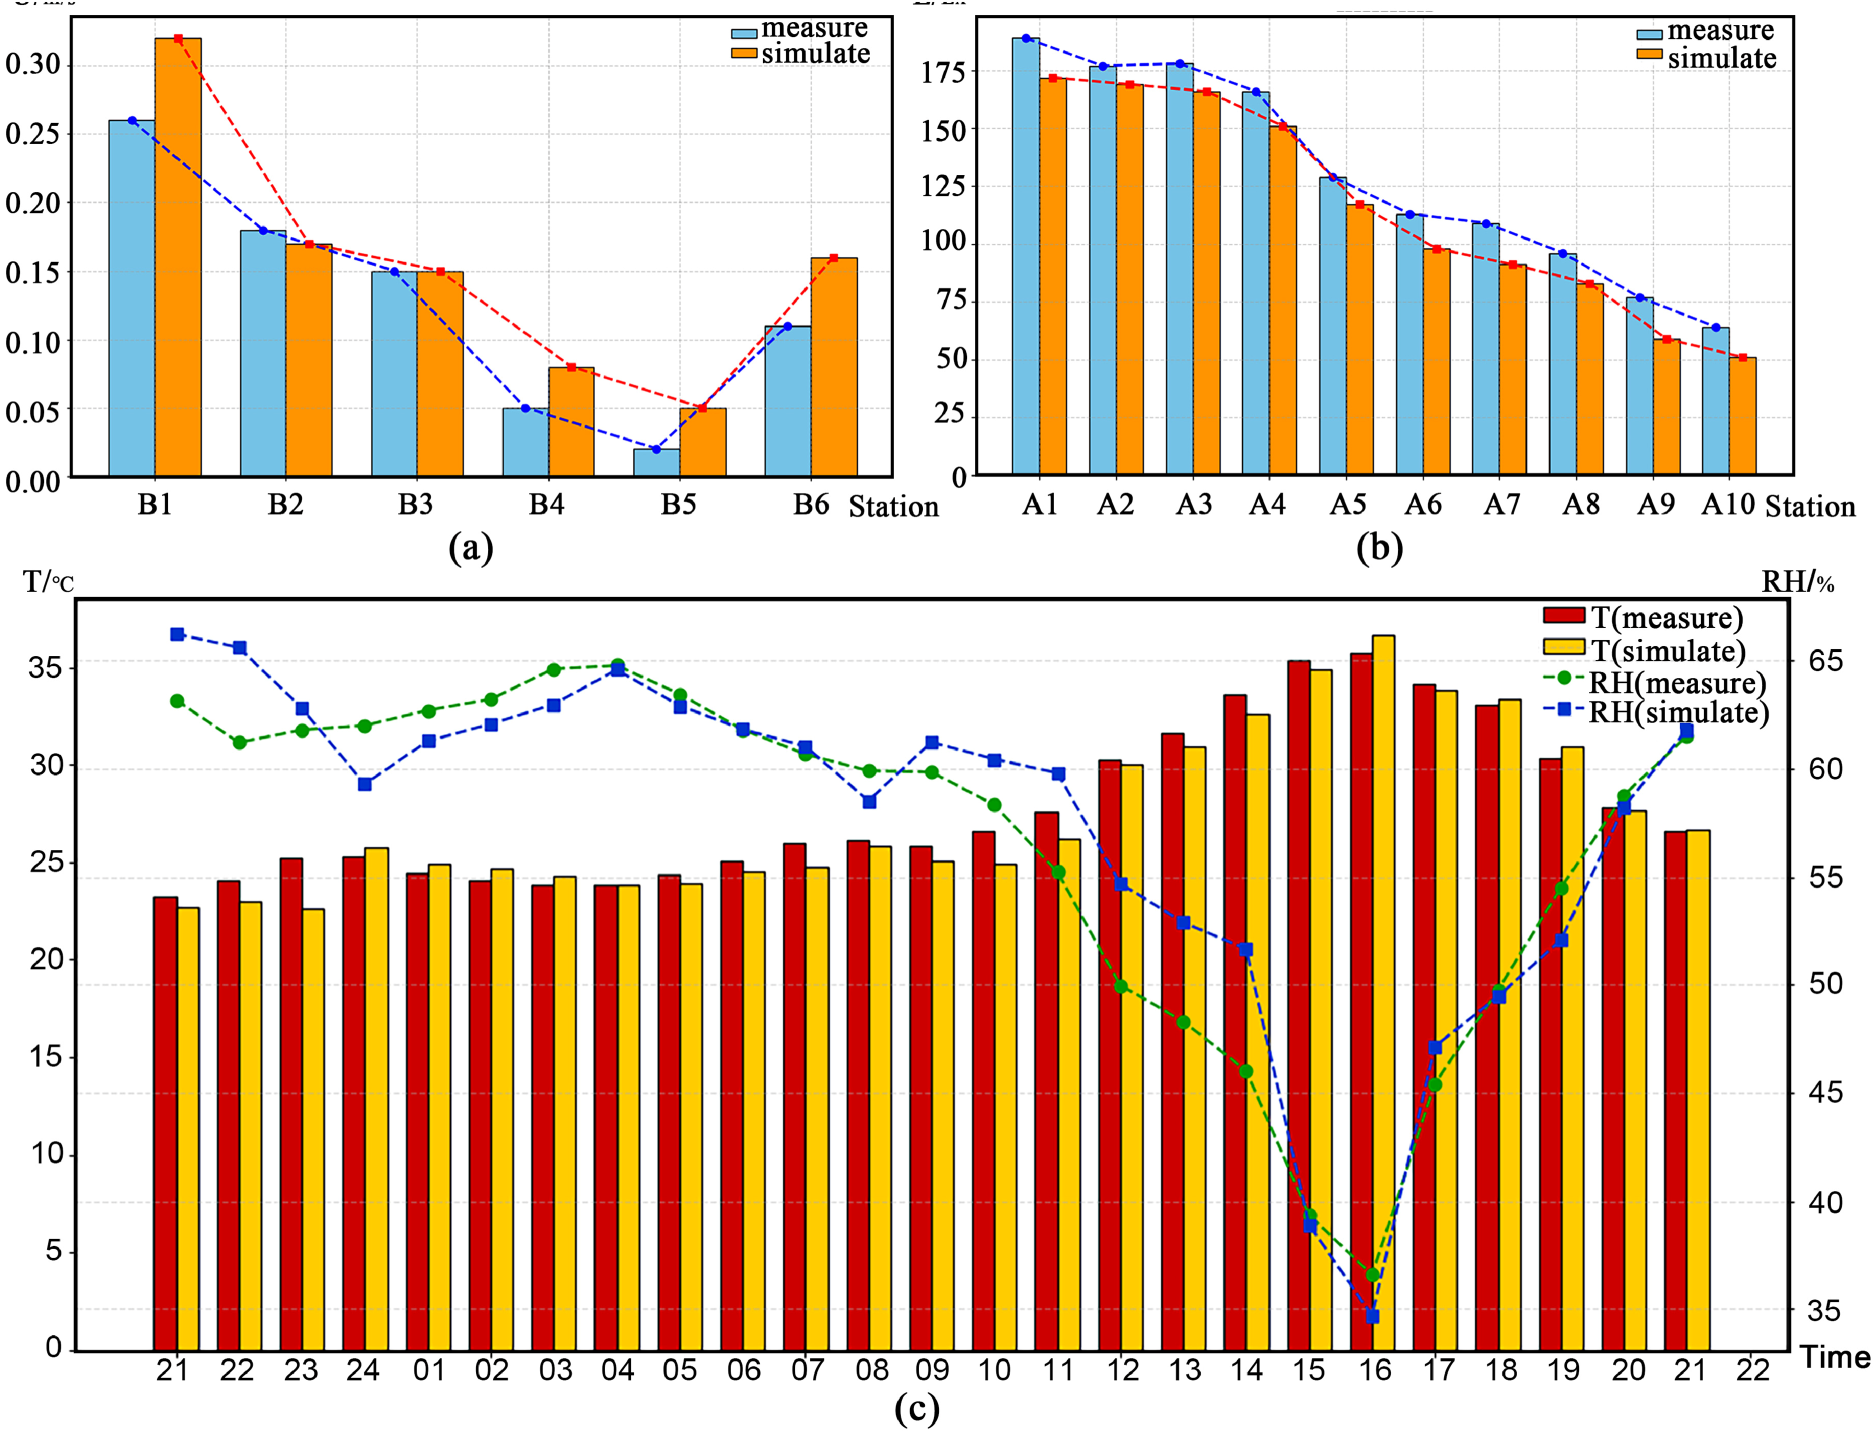
Comparison of actual measurement and simulation results: (a) wind speed, (b) illuminance, and (c) temperature and humidity.
Feature parameter selection
Previous studies42–44 on student dormitory buildings in general universities have primarily focused on parameters such as the overall planning and layout of the building; its form, shading and window-to-wall ratio; and their impact on indoor light, thermal and airflow conditions within the building whilst neglecting the coupled effects of window openings, shading and balcony forms on the indoor physical environment and building energy consumption of dormitories. Therefore, this study selected the window-to-wall area ratio, orientation, balcony depth, floor height, shading panel height and width of interior and exterior windows as variable parameters and simulated the indoor physical environment performance and energy consumption of dormitory buildings by treating them as an integrated envelope system.
A survey of dormitory buildings with enclosed balconies at 11 universities in cold regions of China indicates that the IWWRs are consistently below 0.35. Based on these findings, together with relevant standards,36,45–50 previous literature,51–55 and conventional empirical values, the initial ranges of the variables were determined. These ranges were subsequently refined through meteorological data analysis. The final variable ranges and corresponding increment intervals are presented in Table 2.
Parameter settings for optimisation variables.
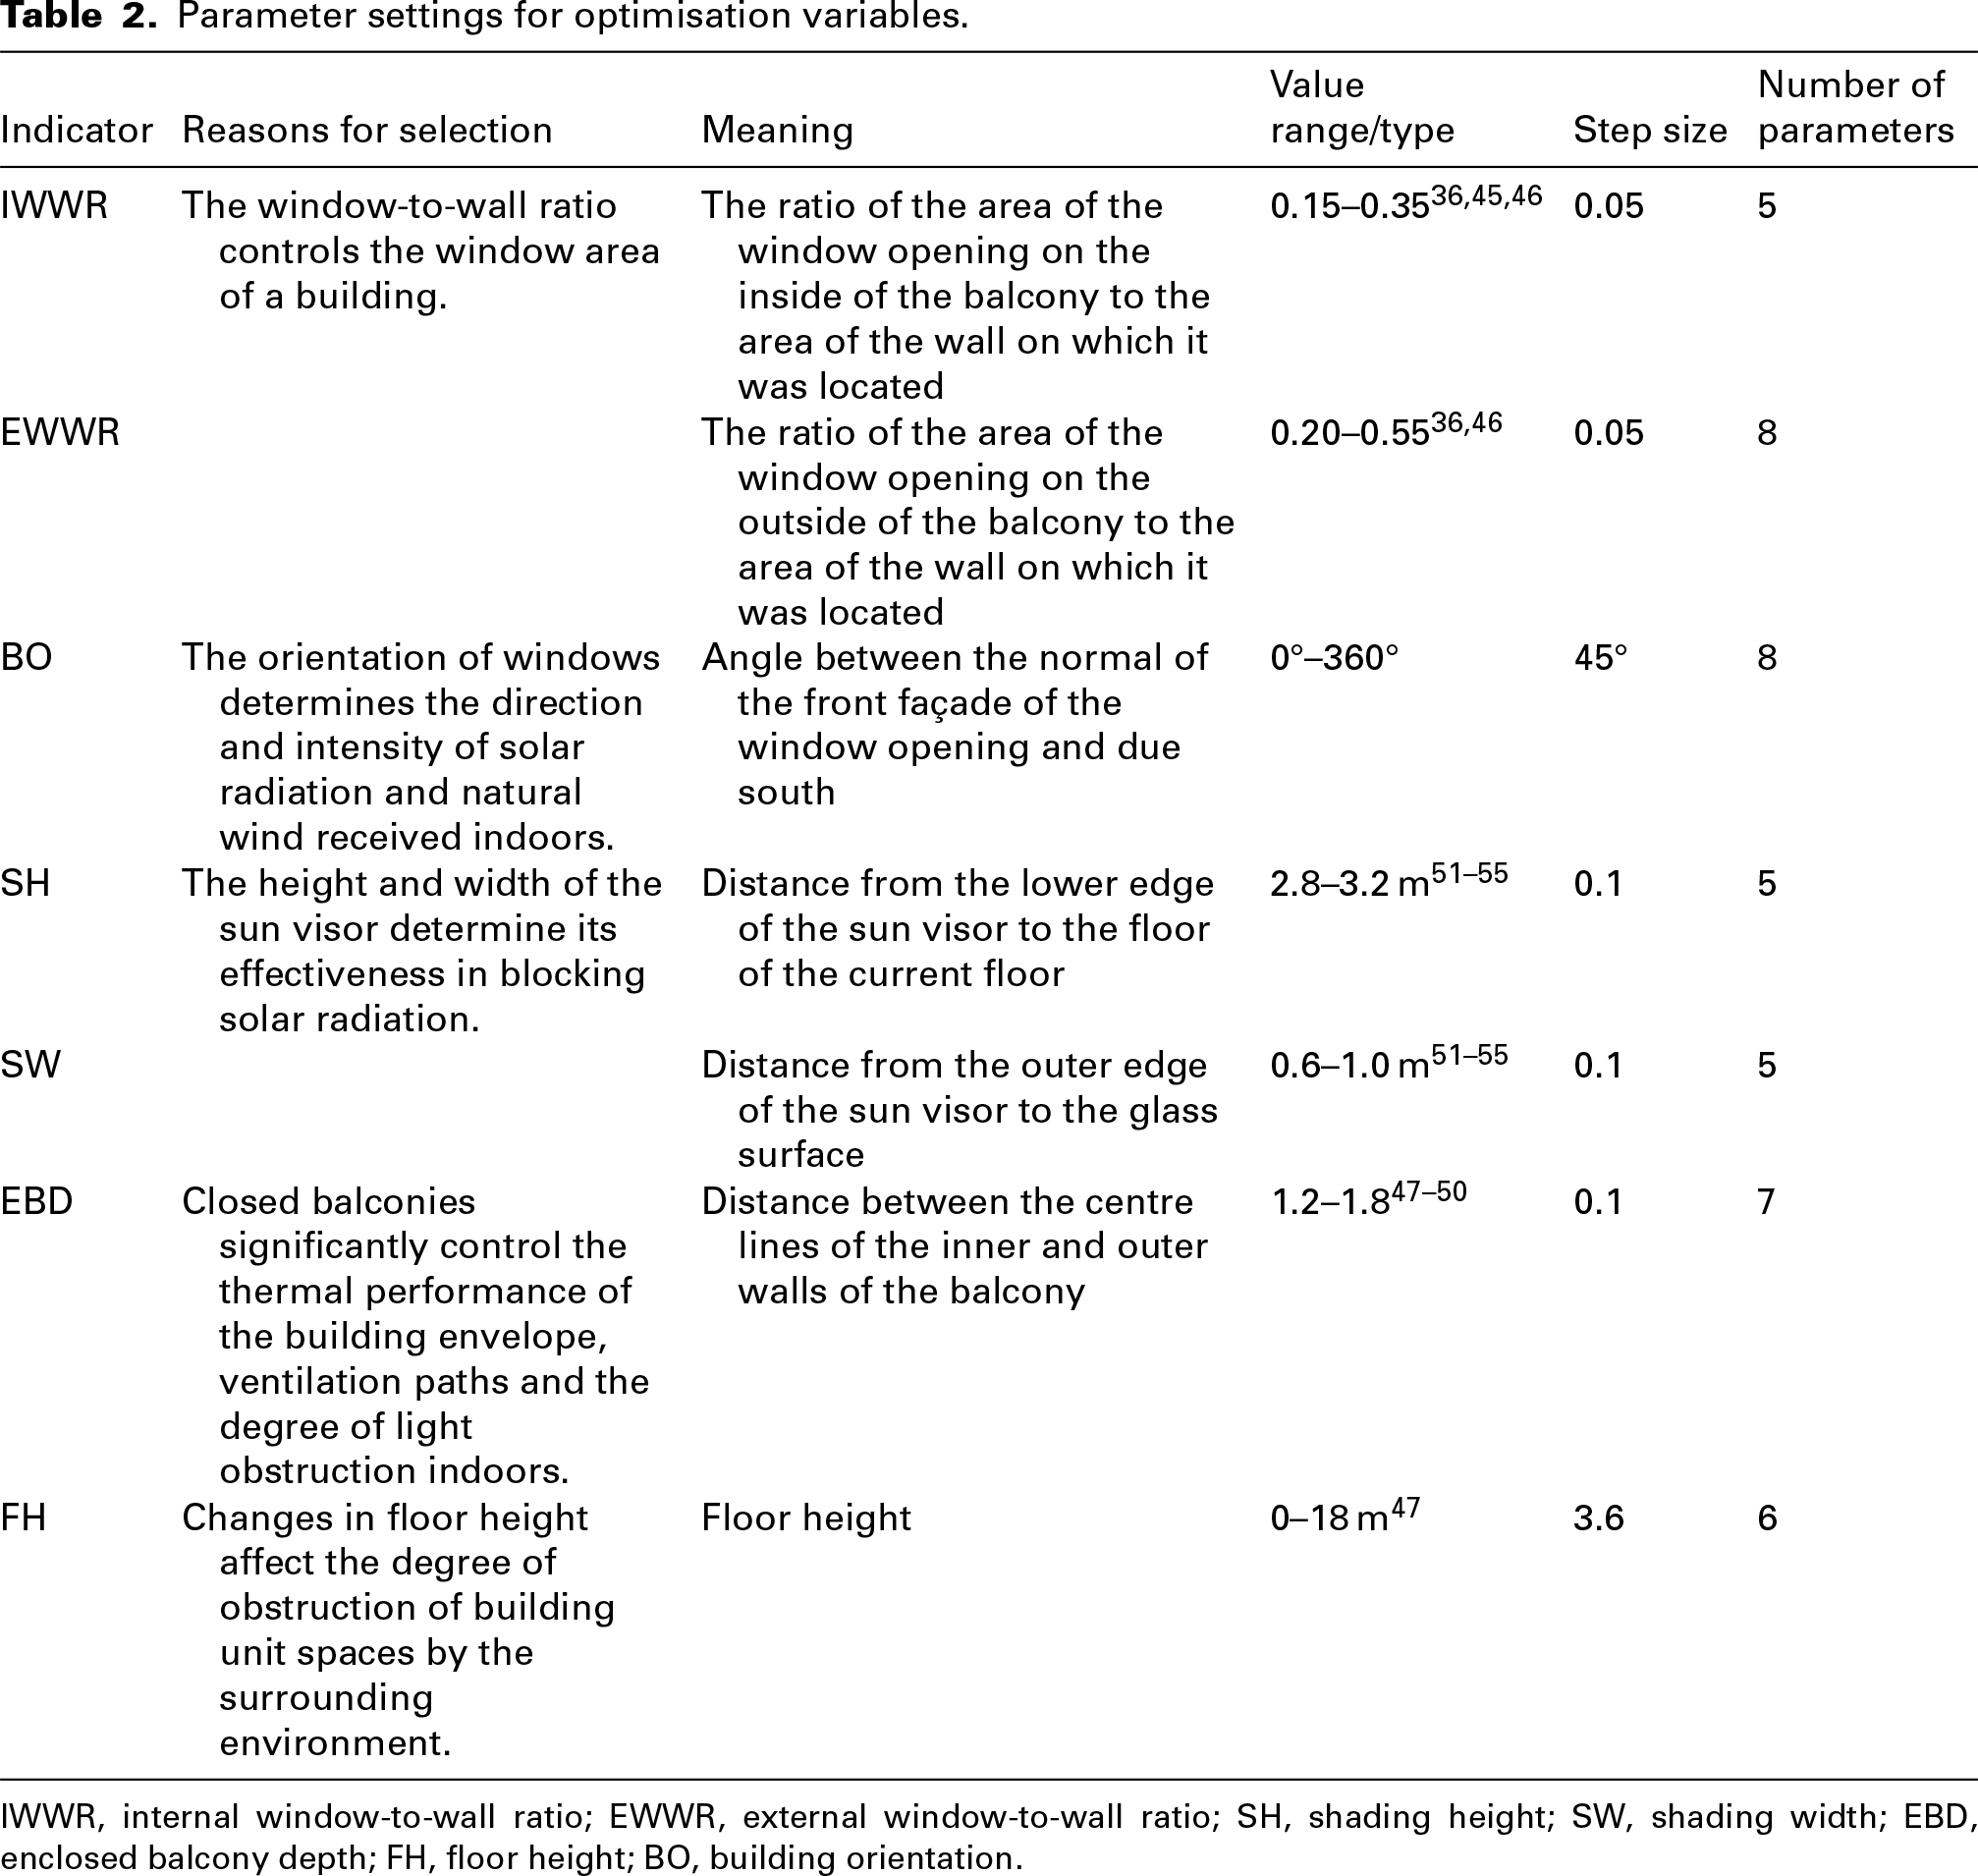
IWWR, internal window-to-wall ratio; EWWR, external window-to-wall ratio; SH, shading height; SW, shading width; EBD, enclosed balcony depth; FH, floor height; BO, building orientation.
Objective function
To comply with relevant standards, enhance indoor thermal and visual comfort, improve indoor ventilation quality and reduce building energy consumption, constraint conditions were applied to the optimisation experiments of the baseline model. For the indoor lighting environment, the primary focus was on the useful daylight illuminance (UDI) of multi-storey dormitory buildings, with higher values indicating better indoor daylight conditions. 56 For thermal comfort, the main consideration was the predicted mean vote (PMV), typically ranging from −3 to +3, with most occupants experiencing a high level of thermal comfort when PMV falls within −0.5 to +0.5. 57 For ventilation performance, the indoor air velocity (U) was selected as the evaluation metric; relevant studies and standards indicate that indoor air velocities between 0.3 and 0.5 m/s can effectively improve thermal comfort and remove indoor pollutants and odours.58–61 Energy consumption was assessed using the energy use intensity (EUI) as the primary evaluation indicator.62,63 The meaning of each constraint parameter and the corresponding evaluation objectives are presented in Table 3.
Objective function settings.
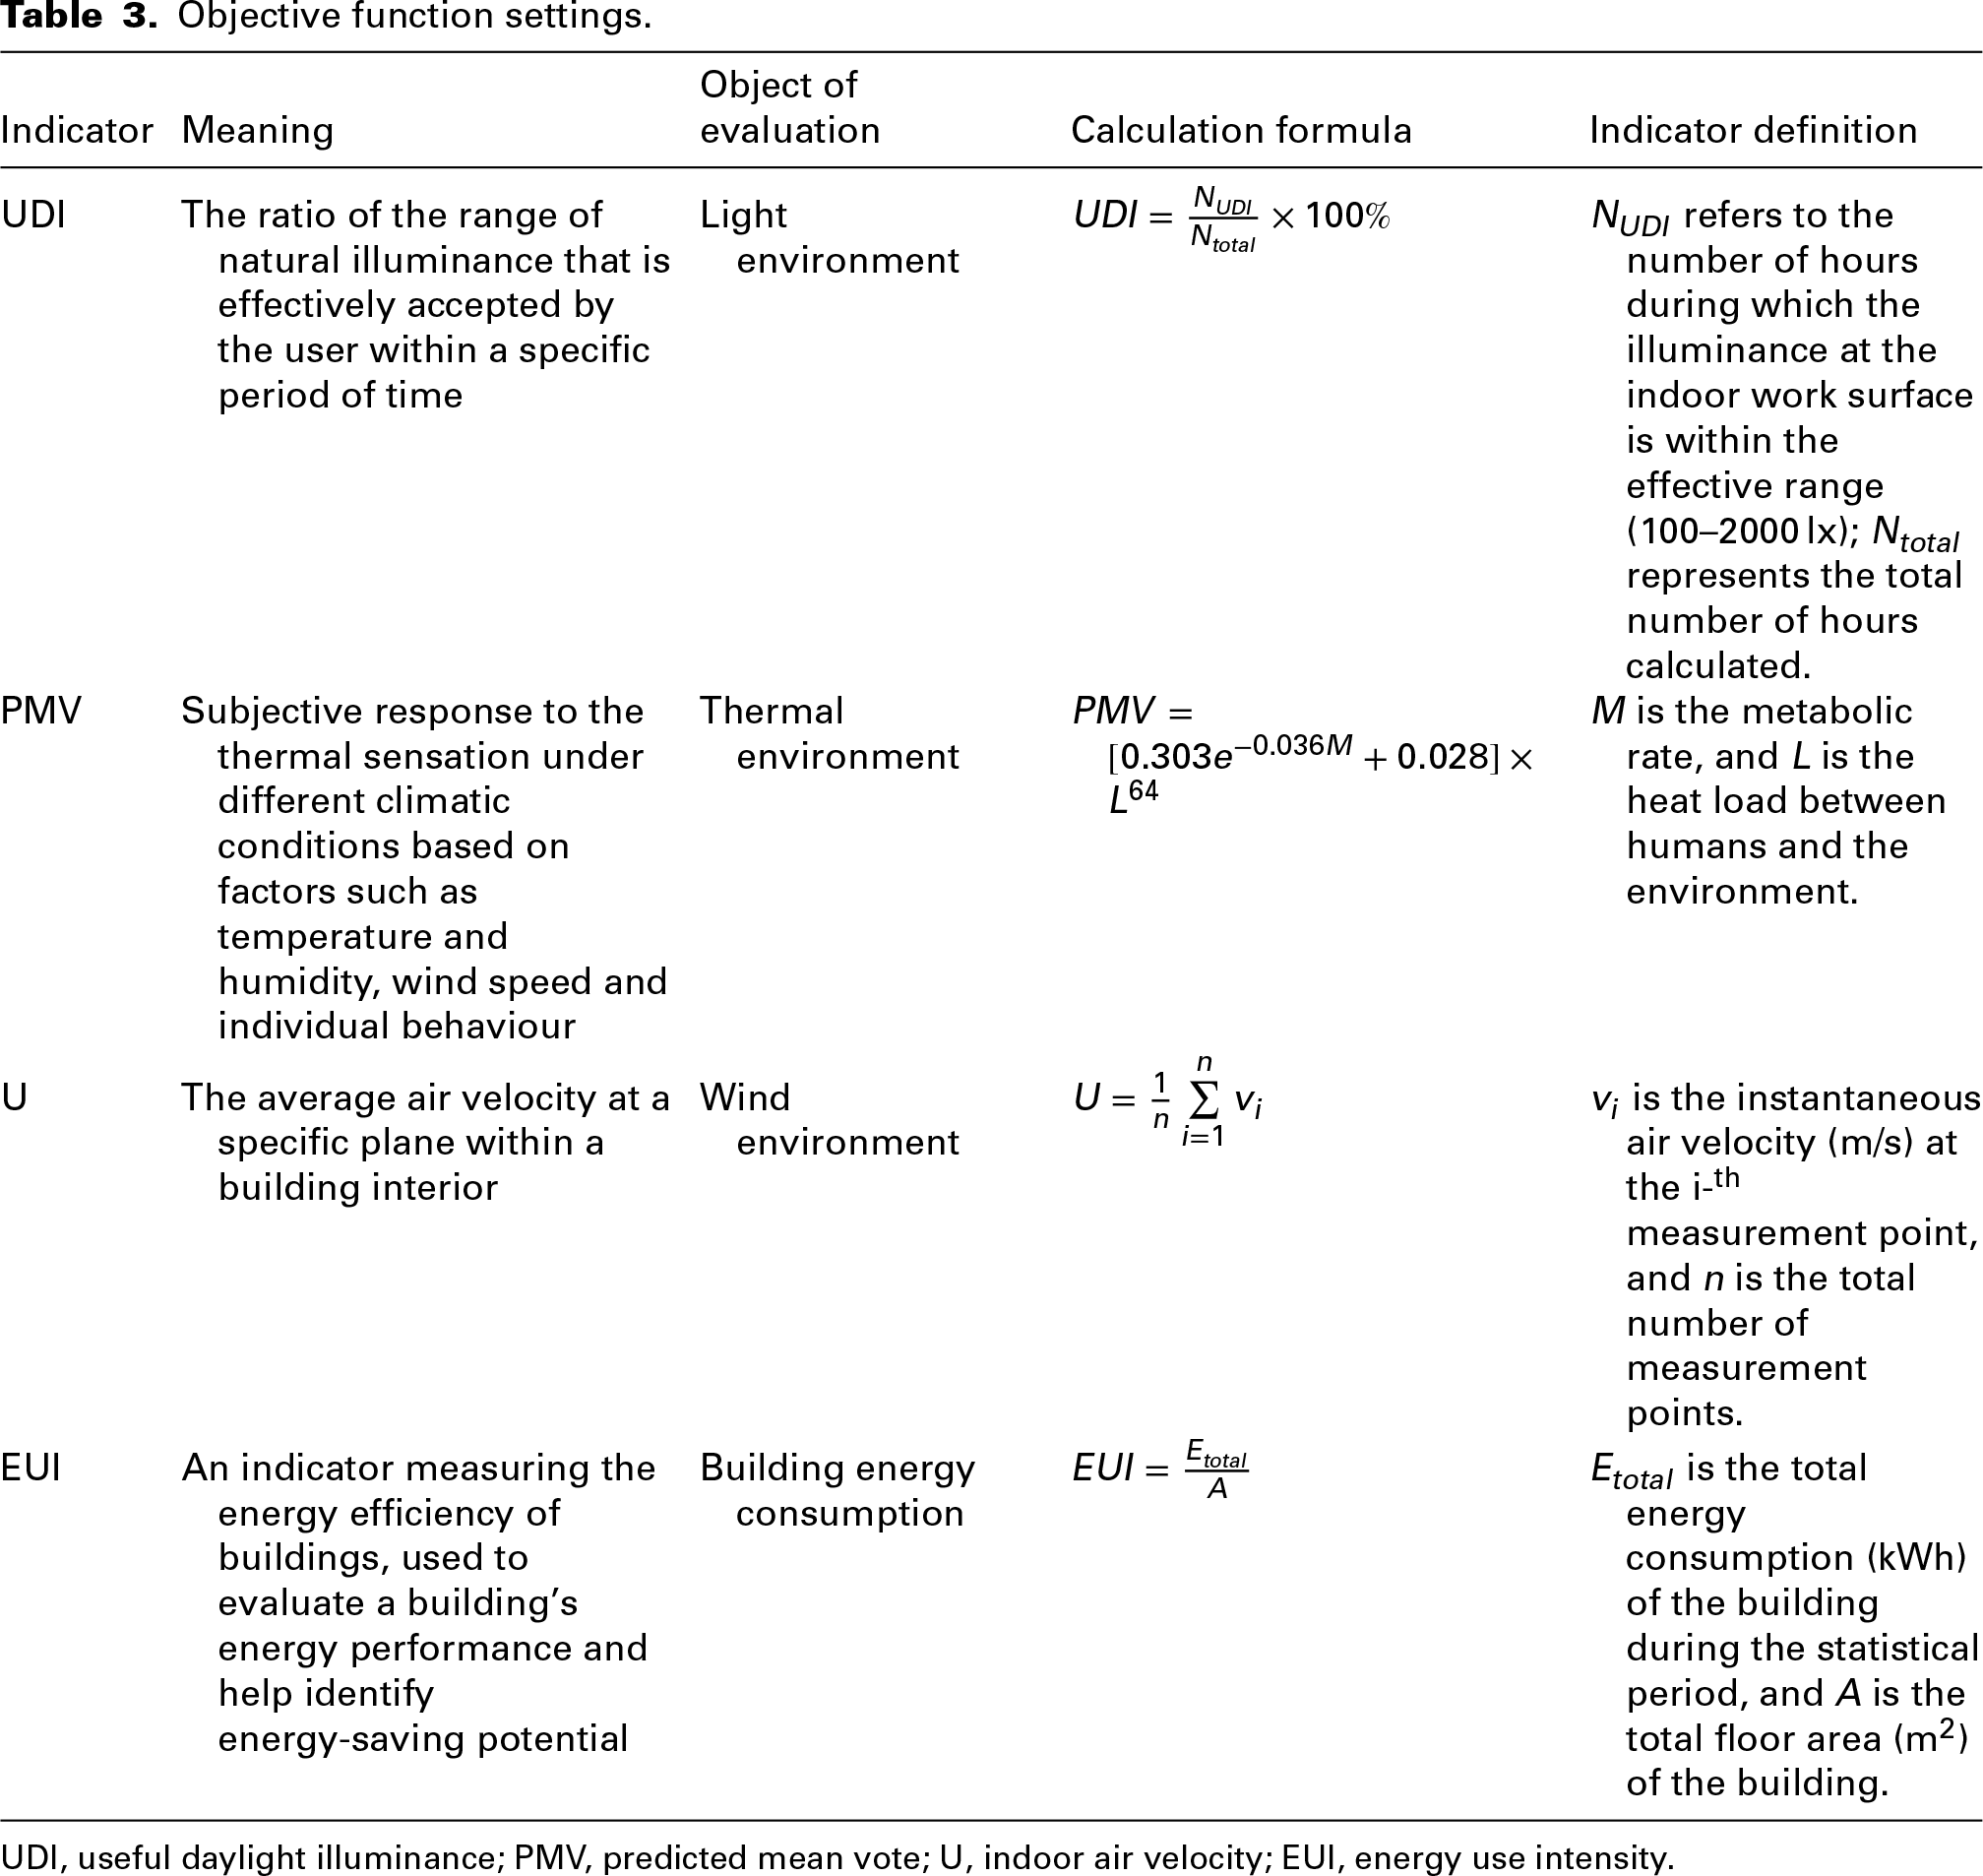
UDI, useful daylight illuminance; PMV, predicted mean vote; U, indoor air velocity; EUI, energy use intensity.
Simulation results
Since both the optimisation variables and the objective function are multidimensional parameters, direct simulation and optimisation could face the problem of excessive calculation in high-dimensional space. To effectively reduce simulation and optimisation time whilst enhancing optimisation efficiency, we employed optimised Latin hypercube sampling (OLHS) by uniformly partitioning each dimension and selecting sample points from these partitions to achieve comprehensive coverage of the input space. 65 The use of OLHS effectively minimises correlations between samples and improves analysis and optimisation efficiency, reducing the number of parameter combination schemes from 336,000 to 1000, thereby significantly enhancing simulation and optimisation efficiency. After sampling, the sampling combination scheme can evenly cover the parameter space, reduce calculation costs and avoid undersampling or oversampling.
Based on the above, a simulation model was developed to generate 1000 data sets. After approximately 8 days of computation, outputs were obtained for indoor lighting, thermal conditions, ventilation performance and energy consumption under various parameter combinations.
Performance verification of the coupling algorithm (XGBoost–IMOEA/D).
To assess whether the coupled algorithm model has strong generalisation capabilities in existing data sets, ensure the reliability of its prediction optimisation results and determine whether it can be applied to case studies, this study predicted simulated data whilst considering the model's data characteristics, structure and multi-objective optimisation process. It then calculated the error between predicted and actual simulated values to determine model fit and overall performance.
Data preprocessing
This study pre-processed the simulation data set before model establishment to investigate the relationship characteristics between variable parameters and the objective function, thereby improving the prediction of simulation results and multi-objective optimisation. The preprocessing steps were as follows 66 : ① converting categorical data into numerical data, such as converting building orientation into rotation angles relative to true south; ② normalising variable parameters and evaluation metrics with different units within the data set to ensure they are on the same numerical scale; and ③ addressing overfitting in the sampled data and reducing the loss of important information due to undersampling. The study combined sampling techniques: random undersampling was applied to the majority of samples. In contrast, SMOTE (Synthetic Minority Over-sampling Technique) oversampling was applied to a minority of samples.
Performance verification of the XGBoost–IMOEA/D algorithm
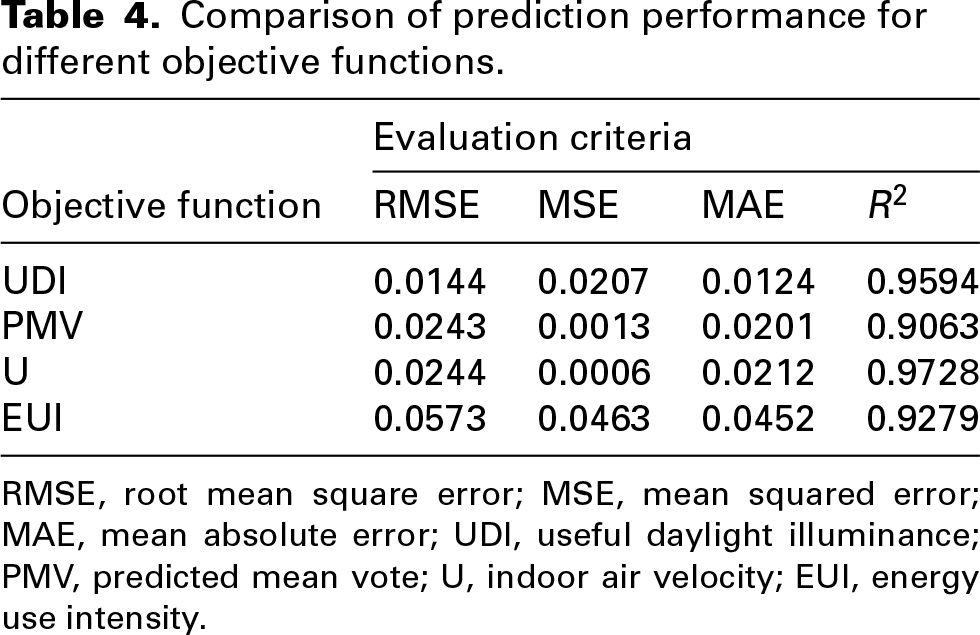
To validate the excellent performance of the multi-algorithm coupled model (XGBoost–IMOEA/D) in data prediction and multi-objective optimisation, the study was based on a simulation data set, with 80% of the data set used as the training set and 20% as the test set. After the coupled model is trained, predictions were made on the test set, and the simulation values and predicted values of the objective function were compared to calculate the R2, RMSE, mean squared error (MSE) and mean absolute error (MAE), 67 as shown in Table 4.
Comparison of prediction performance for different objective functions.
RMSE, root mean square error; MSE, mean squared error; MAE, mean absolute error; UDI, useful daylight illuminance; PMV, predicted mean vote; U, indoor air velocity; EUI, energy use intensity.
Secondly, the predicted values of the four objective functions were compared with their corresponding simulated values. To visualise this comparison, Figure 5 was plotted, highlighting both the distribution patterns and absolute errors. In Figure 5, narrower grey-shaded regions indicate greater model confidence, whilst points nearer to the ideal line and shaded towards blue correspond to smaller absolute errors. These visualisation results demonstrated that the coupled algorithm model (XGBoost–IMOEA/D), which integrated with the enhanced MOEA/D algorithm, exhibited excellent performance in both data prediction and optimisation.
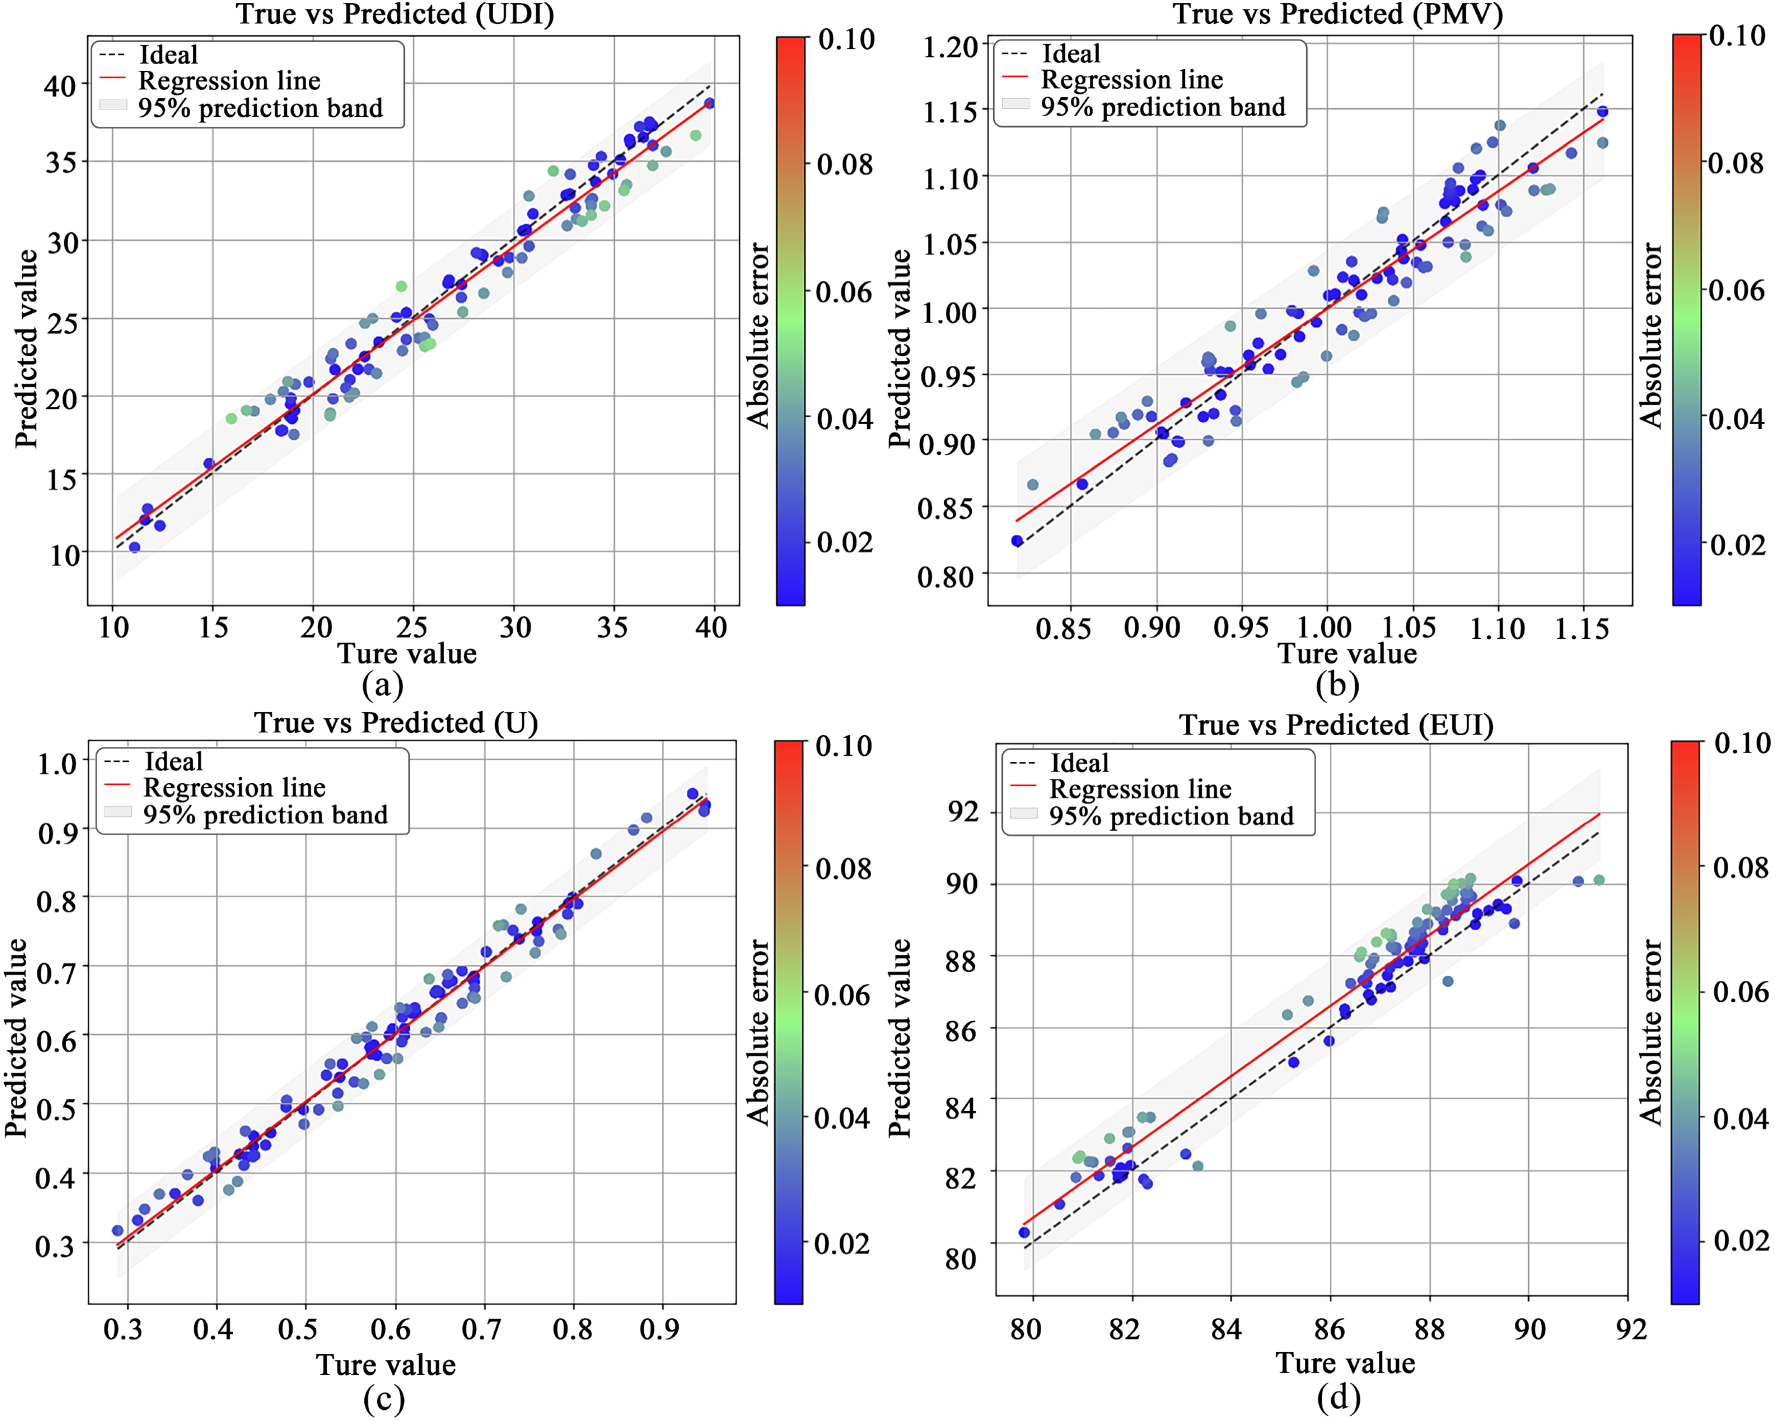
Performance of the XGBoost–IMOEA/D model: (a) UDI, (b) PMV, (c) U and (d) EUI.
Specifically, Figure 5 shows minimal discrepancies between simulated and predicted values, with R2 exceeding 0.90 for all four objective functions. Furthermore, Table 4 presents the RMSE, MSE and MAE between simulated and predicted values. Notably, all MSE values were below 0.05, confirming that the XGBoost–IMOEA/D model could achieve high predictive accuracy across all four performance indicators: UDI, PMV, U and EUI. 68
Concurrently, the performance of the coupled algorithm model XGBoost–IMOEA/D was compared with that of commonly used general-purpose algorithms, including MOEA/D, NSGA-III, MOPSO and Strength Pareto Evolutionary Algorithm 2 (SPEA2), in multi-objective optimisation. Table 5 presents the GD (generational distance), IGD (inverted generational distance), ε-indicator and spacing metrics for the multi-objective optimisation of EUI, PMV, U and UDI by each algorithm. The results demonstrated that XGBoost–IMOEA/D could achieve the best overall performance in multi-objective optimisation across these four indicators compared with the other models.
Multi-objective optimisation performance of different algorithms.
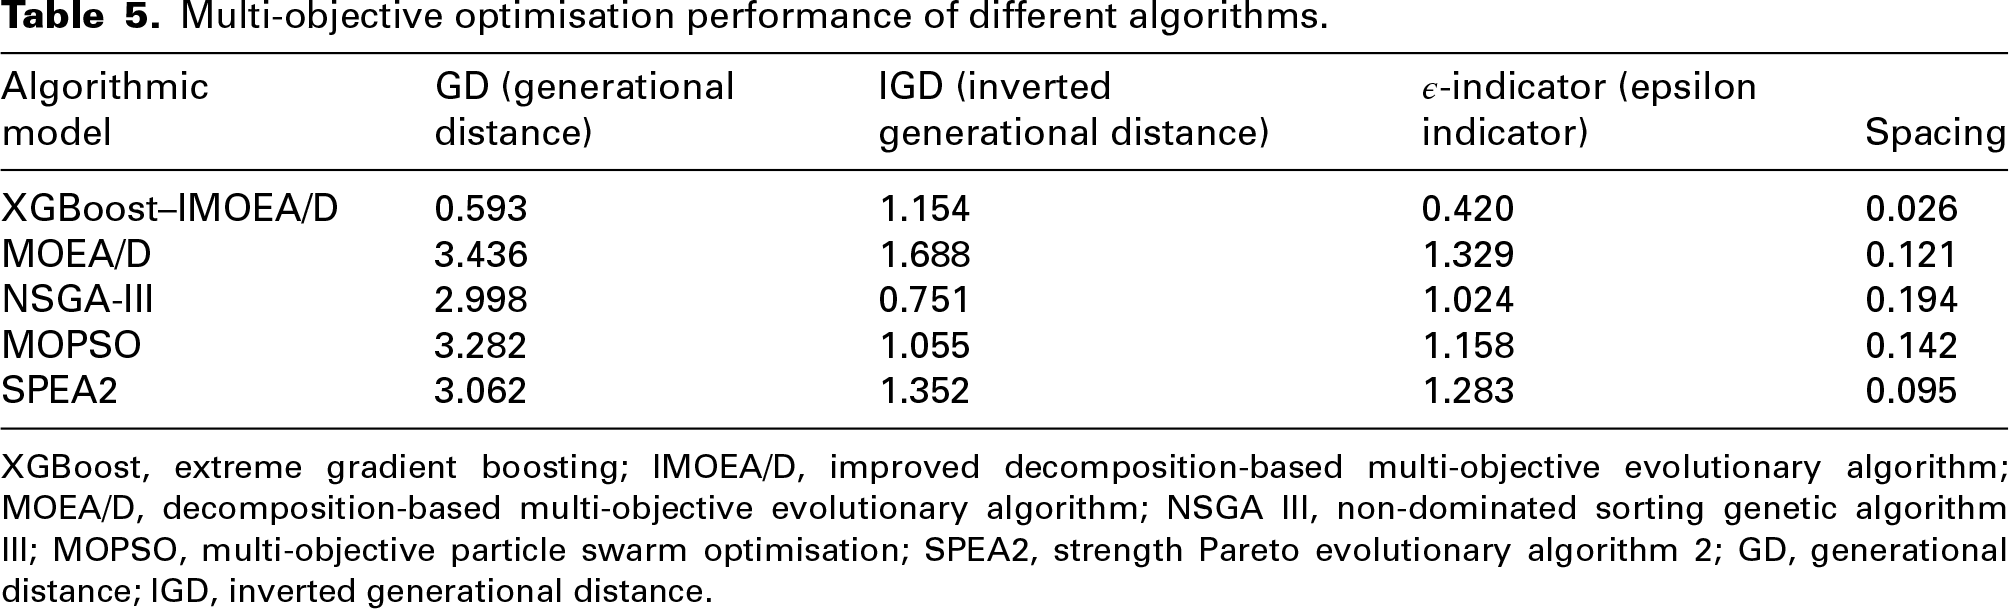
XGBoost, extreme gradient boosting; IMOEA/D, improved decomposition-based multi-objective evolutionary algorithm; MOEA/D, decomposition-based multi-objective evolutionary algorithm; NSGA III, non-dominated sorting genetic algorithm III; MOPSO, multi-objective particle swarm optimisation; SPEA2, strength Pareto evolutionary algorithm 2; GD, generational distance; IGD, inverted generational distance.
The GD metric measured the proximity of the approximate Pareto front obtained by an algorithm to the true Pareto front. The IGD metric was used to evaluate the average shortest distance from each point on the true Pareto front to the approximate front. The ε-indicator was used to quantify the minimum shift required in the objective space to translate the approximate front such that every point on the true Pareto front was dominated or covered by at least one solution from the approximate front. The spacing metric was used to assess the uniformity of the distribution of solutions along the approximate Pareto front.
Optimisation of the physical environment in dormitory rooms based on the XGBoost–IMOEA/D + EW-TOPSIS algorithm
Indoor environmental performance prediction and optimisation based on XGBoost–IMOEA/D.
After preliminary data processing to enhance the reliability, robustness and interpretability of the model, the XGBoost model was invoked within Visual Studio Code software and combined with the IMOEA/D. The results predicted by the XGBoost model were fed back in real time to IMOEA/D for optimisation and iteration. The objective was to seek a balance among four mutually conflicting goals, aiming to achieve optimal performance across all four goals simultaneously. However, the decomposition-based multi-objective evolutionary algorithm could perform only minimisation optimisation on the objective function. Therefore, the objective function UDI was taken as its negative value, whilst the parameter range for PMV was [–3, +3], and the closer its absolute value to 0, the better the thermal comfort of the building space. Therefore, the objective function for the predicted thermal sensation index was taken as its absolute value. However, the optimal range for the wind environment target U was [0.3, 0.5], which cannot be directly optimised through minimisation. Therefore, the degree of deviation of U from its optimal range was used as the objective function for optimisation. The final optimisation objective functions are shown in equations (1) to (4) below:


For the sake of increasing the reliability of the optimisation and prediction results, the data set with the most minor error was selected from each iteration to form the basis for the next iteration. In multi-objective optimisation, the initial population size was set to 200, the maximum number of iterations to 300, the crossover rate to 0.8 and the mutation rate to 0.2. This resulted in an optimised combination plan for the four objectives. Since the objectives were mutually contradictory, the optimal solution was typically not unique but rather a set of non-dominated solutions that formed a Pareto front.
EW-TOPSIS for screening of front solution sets.
After the Pareto front solution set of optimised parameters and evaluation indicators was obtained through XGBoost–IMOEA/D, the entropy values and indicator weights were calculated using the entropy weight method. The TOPSIS method was then used to determine the positive and negative ideal solutions and calculate the distance between the combination scheme and the positive and negative ideal solutions. Finally, the optimal method was selected based on the relative proximity value C.
69
The main process is as follows. The indicator weights were calculated by equation (5):
Amongst them, The component standardisation matrix was developed as equation (6):
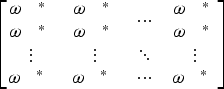
In equation (6), m denotes the number of evaluation subjects, the number of schemes participating in comparison or assessment; in this paper, m = 26. Similarly, n denotes the number of evaluation indicators, the different dimensions or metrics used to evaluate the subjects; in this paper, n = 4. The positive and negative ideal solutions were determined, and the Euclidean distance of the plan was calculated as shown by equations (7) and (8): The relative proximity of combination schemes were calculated by equation (9):
Relative closeness was used to evaluate the degree of closeness between a combination scheme and an ideal solution.
Results and discussion
Analysis of survey results
Following the completion of the survey, the questionnaire responses were compiled and screened. Based on predefined criteria, completeness checks and response-pattern analysis, seven invalid questionnaires were excluded, resulting in a final data set of 72 valid responses. 70 Reliability and validity tests were then conducted on the evaluation results. The findings indicated Cronbach's α of 0.790 and KMO (Kaiser–Meyer–Olkin) of 0.748, demonstrating strong internal consistency and satisfactory reliability and validity of the assessment measures. 71
To obtain deeper insight into students' perceptions of indoor environmental quality and their overall satisfaction with dormitory spaces, a preliminary analysis of the collected data was undertaken.
72
This analysis explored residents' satisfaction and comfort with indoor lighting, thermal conditions and ventilation in the student accommodation, as illustrated in Figure 6. Lighting environment: Orientation, floor height and spatial location can influence residents' perceptions of satisfaction and comfort with the indoor physical environment of dormitories. However, the most significant differences in satisfaction evaluations of indoor lighting environments were observed at different times of the day. Specifically manifested as: morning (6:00–12:00) and afternoon (12:00–18:00) > evening (18:00–0:00) and night (0:00–6:00), with the evening (18:00–0:00) period exhibiting a strong transitional nature (satisfied–unsatisfied); and most respondents' primary needs regarding lighting comfort were ‘reducing window glare and improving the uniformity of light distribution in indoor spaces’. Thermal environment: In evaluating indoor thermal comfort in dormitory buildings across different times of the day, residents expressed notable dissatisfaction with the thermal environment during the afternoon and evening periods. Specifically, 63 and 56 individuals, respectively, rated their thermal comfort as low or very low during these times, with noticeable improvements only occurring in the early morning hours. By contrast, only 22 respondents found the indoor thermal conditions to be generally comfortable. Meanwhile, many residents believed that enhancing ventilation or increasing indoor humidity could help improve overall comfort levels. Wind environment satisfaction: In the 24-h evaluation of indoor wind environment and satisfaction, only a small proportion of occupants considered the current conditions suitable. Satisfaction was not significantly influenced by time of day. During all four time periods, more than 60 respondents rated ventilation effectiveness and wind environment satisfaction as unsatisfactory. They believed that increasing cross- or mechanical ventilation would improve ventilation efficiency, reduce pollutant accumulation, and enhance thermal comfort perception.
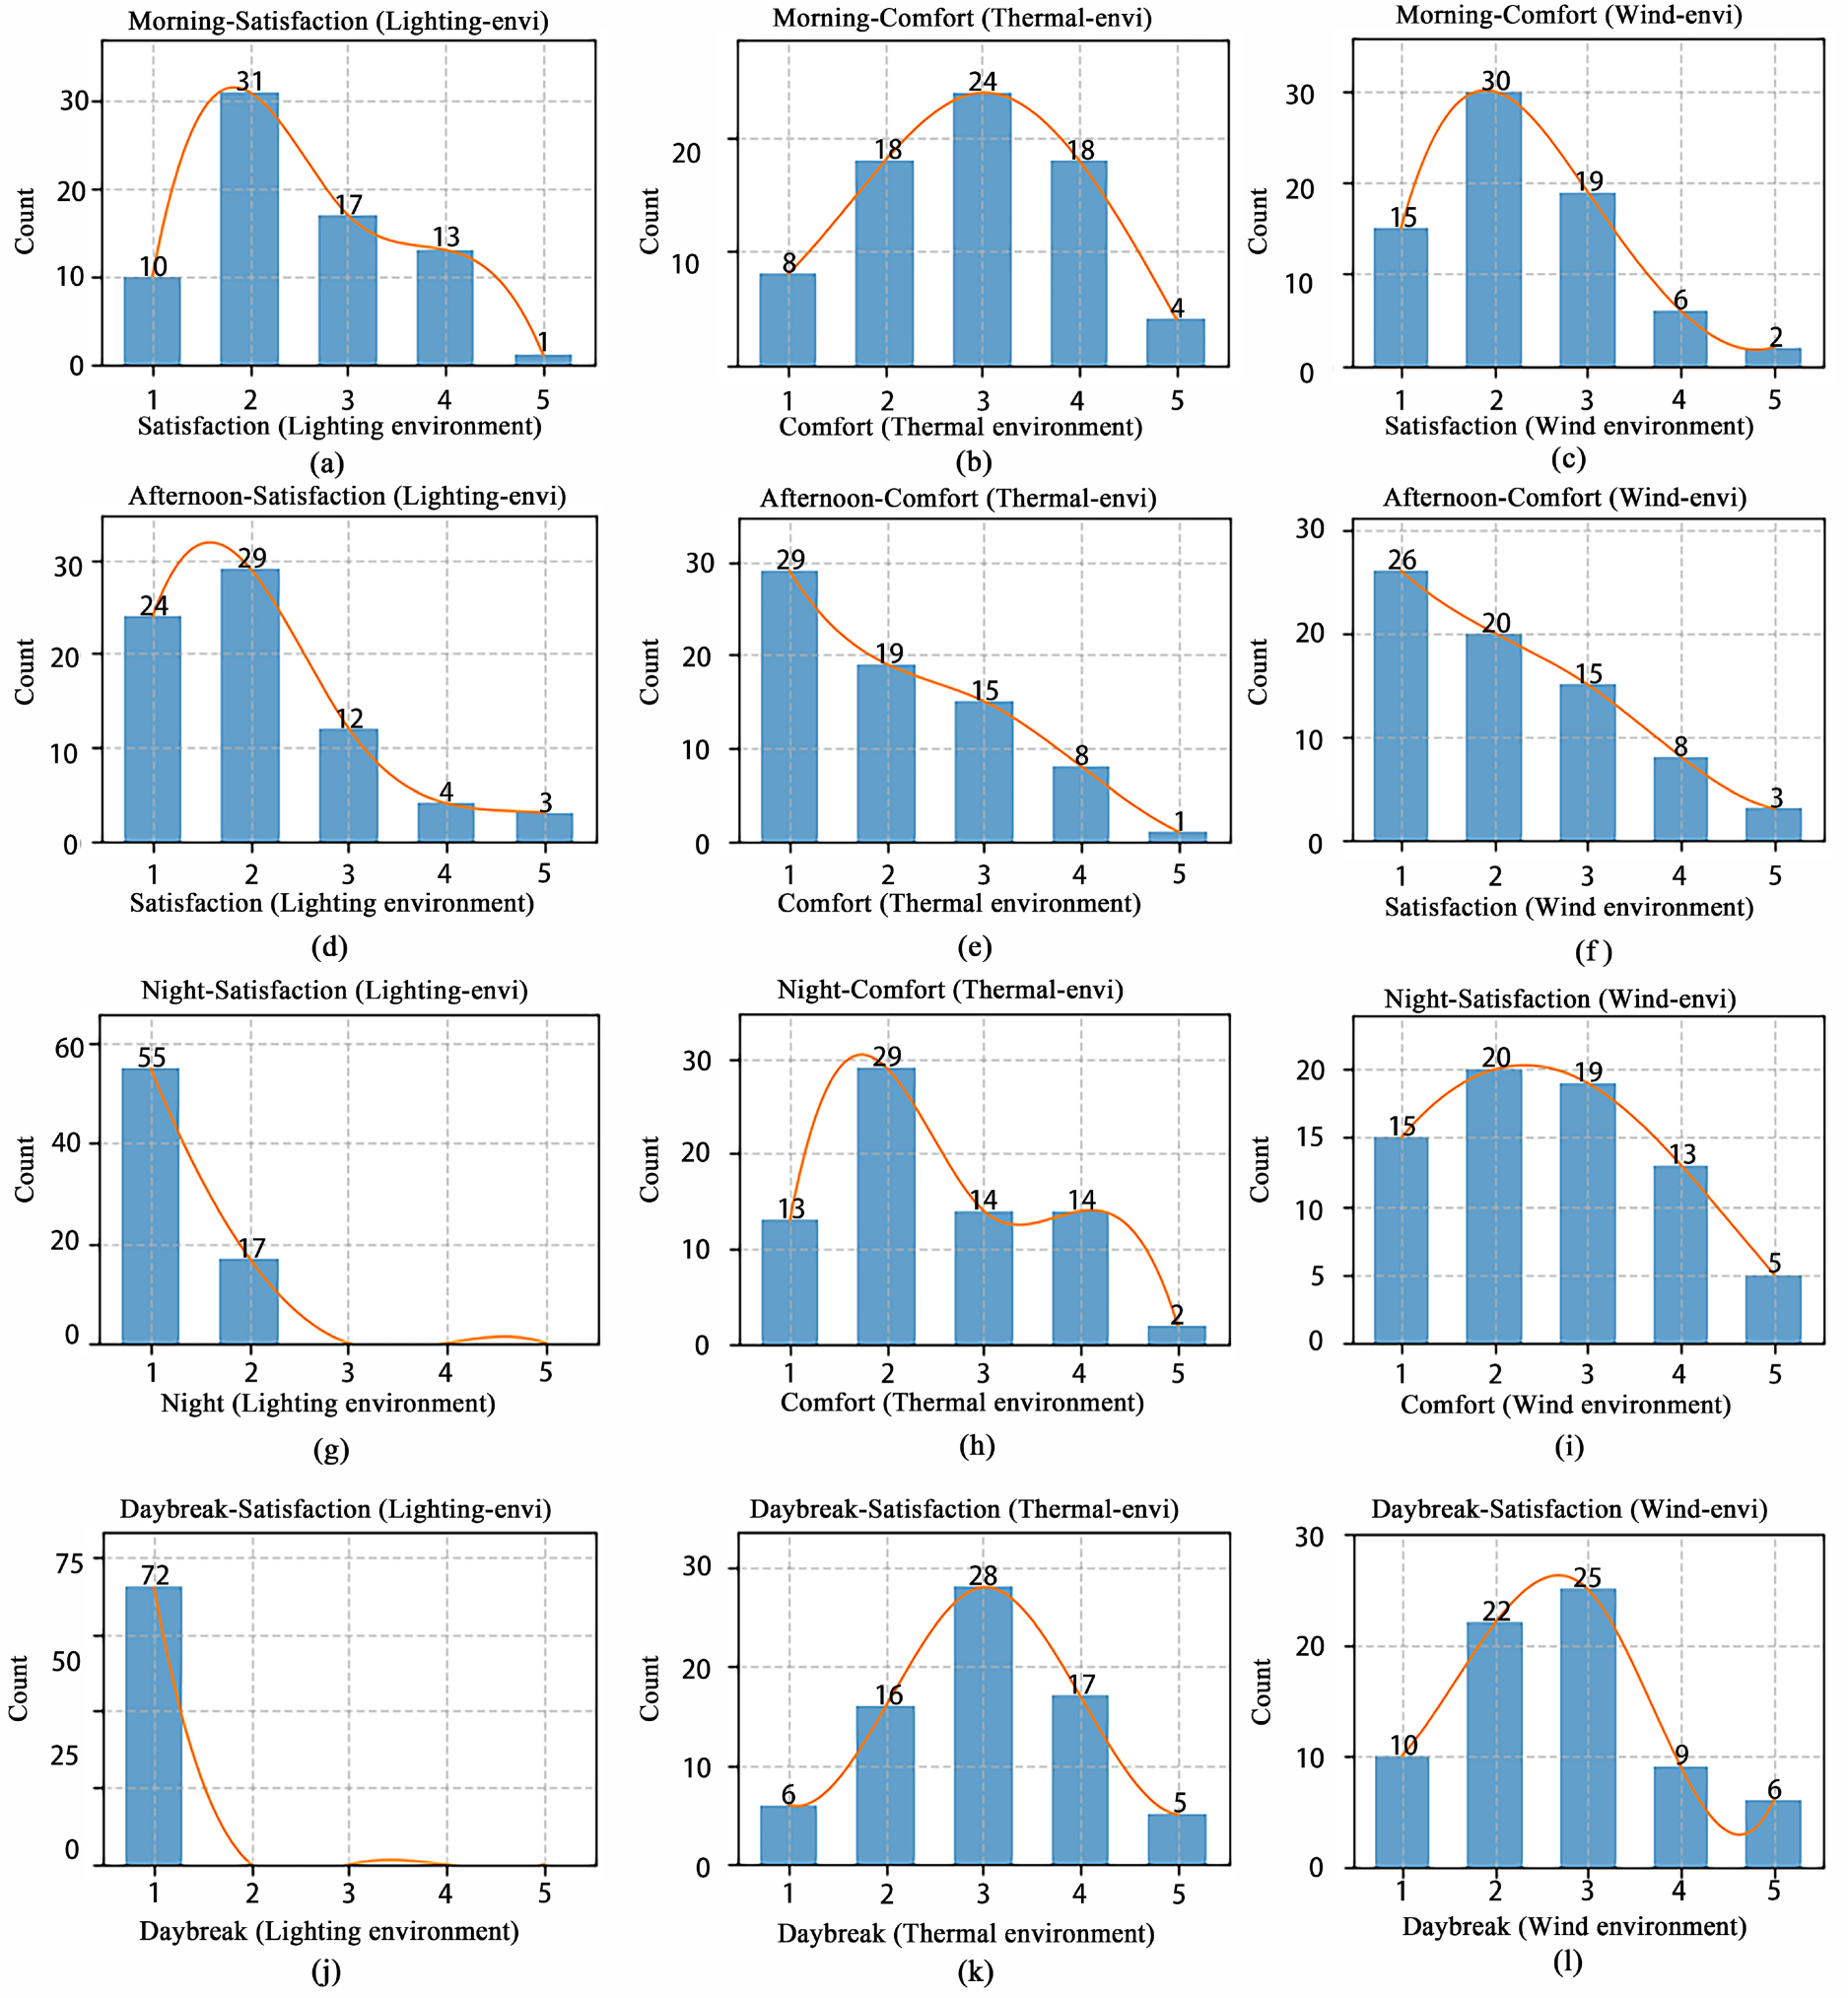
Evaluation results of the indoor environment of dormitories.
Based on the evaluation and analysis results of the indoor lighting, thermal and wind environment satisfaction and comfort levels in student dormitory buildings, residents reported to have relatively low satisfaction and comfort ratings regarding the physical environment of these buildings. In terms of lighting, the main issues included low illuminance levels, poor uniformity and significant glare from windows. In terms of the thermal environment, 83.3% of respondents expressed collective dissatisfaction with the indoor thermal conditions during the afternoon and evening hours, and they hoped that ventilation within the dormitories could be appropriately increased. Regarding the wind environment, respondents felt that the current indoor wind conditions were inadequate, with insufficient air movement leading to a perception of poor freshness and lingering odours. Relevant research indicated that the air age and ventilation efficiency in living spaces can exacerbate or trigger respiratory diseases and affect residents' living experiences. 73
In summary, the research findings revealed notable shortcomings in the indoor lighting, thermal and ventilation conditions of the dormitory accommodation, with occupants expressing a strong need for improvements to the physical environment. Meanwhile, existing studies have consistently highlighted that building envelope systems could play a crucial role in shaping indoor lighting, thermal performance, ventilation and overall energy consumption.11–14,51 Therefore, optimising the design parameters of external envelope components to improve indoor thermal comfort and ventilation efficiency and to enhance wind environment satisfaction whilst reducing indoor pollutant accumulation and building energy consumption is of paramount importance.
Analysis of simulation and prediction results
To better understand the relationships between variables, determine the focus of optimisation, improve optimisation efficiency and stability, and ensure the rationality of optimisation results, sensitivity analyses and correlation analyses were performed on the prediction data set before multi-objective optimisation.
Sensitivity analysis
To determine the input–output relationship between variables and evaluation indicators and validate the rationality of parameter selection in the preceding section, it is necessary to conduct a sensitivity analysis of the variables. This study employed a variance-based global sensitivity analysis method, performed Sobol sensitivity analysis and selected the total effect index (STi) to measure parameter sensitivity. 74 This index considered the interactions amongst design variables and reflects the comprehensive effects of design variables on the objective function. A smaller STi value indicated a lower sensitivity of the variable parameter to the objective function. In contrast, an absolute value of STi greater than 1 indicated that the corresponding factor was sensitive. As shown in Figure 7(a), the results suggested that in student dormitory buildings with enclosed balconies, seven design parameters, including IWWR and EWWR, exhibited significant sensitivity to one or more evaluation indicators related to indoor space lighting, thermal comfort, ventilation and energy consumption.
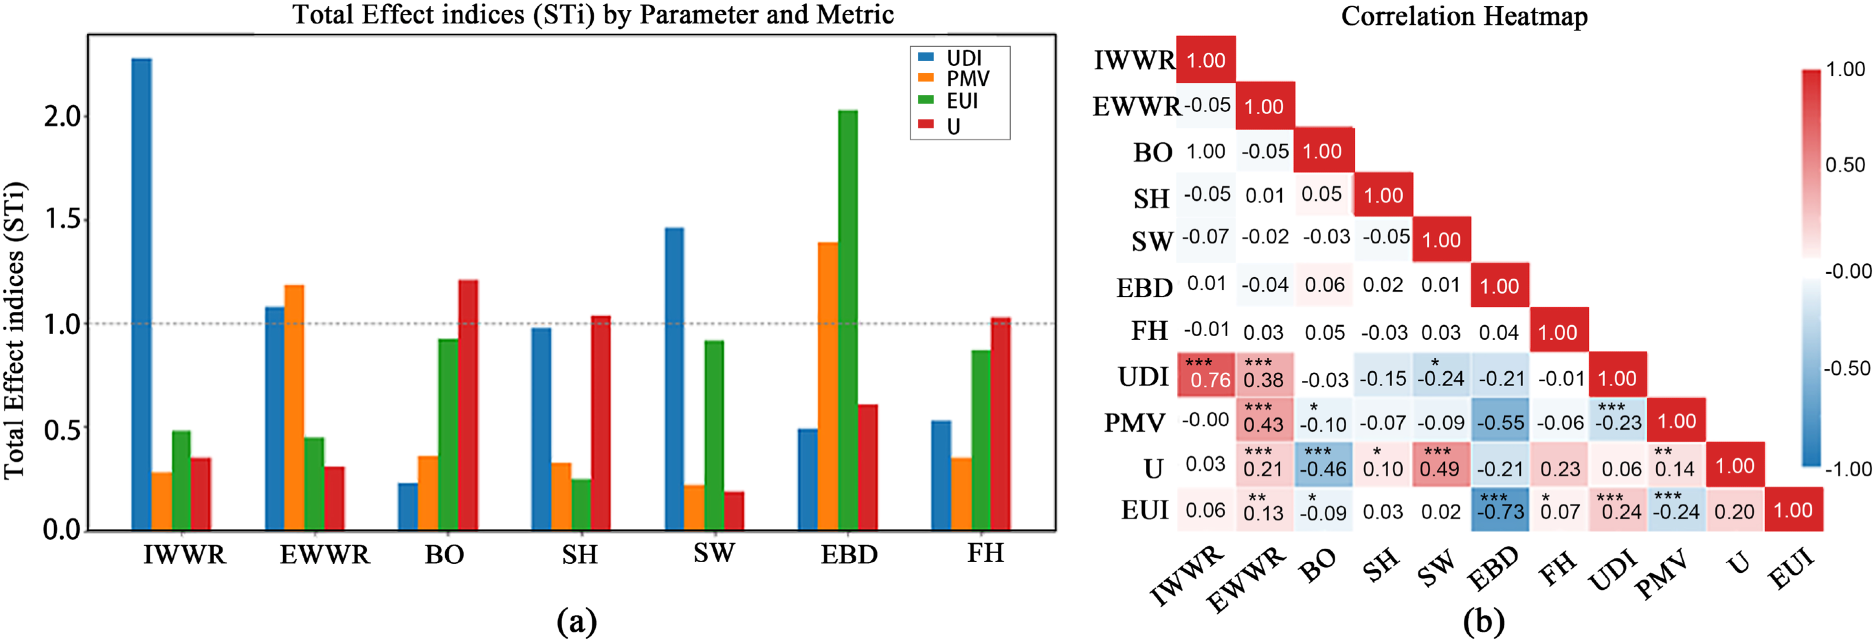
Preliminary analysis: (a) sensitivity analysis and (b) correlation analysis.
Correlation analysis
Correlation analysis can help identify relationships between objective functions, optimise the weight distribution of variables and objectives, improve the efficiency and stability of optimisation algorithms and provide basic data for optimisation models. 75 This would ensure that various objectives are effectively balanced during the optimisation process, thereby enhancing the quality and reliability of optimisation results. Therefore, this study conducted a correlation analysis on the simulated data set, with the results shown in Figure 7(b). As shown in the figure, varying degrees of correlation existed between different parameters and the building's indoor UDI, PMV, U and EUI. Amongst these, IWWR exhibited the strongest correlation with UDI; EWWR and EBD showed a relatively clear correlation with PMV; BO and SW showed a strong correlation with U; EBD demonstrated a more pronounced correlation with EUI than other factors; and FH displayed a weak correlation with all four evaluation indicators.
Multi-objective optimisation and selection of the best solution.
To achieve the multi-objective optimisation of the building envelope system for indoor environmental comfort in dormitories, this study considered the interactions between balconies, shading and window openings whilst identifying the optimal integrated building envelope structure that simultaneously meets the requirements of thermal comfort, high wind environment satisfaction and low building energy consumption. The XGBoost–IMOEA/D model has been proven to exhibit excellent performance in data prediction and optimisation. Therefore, this study selected this algorithm for data prediction and optimisation. After 300 iterations, the results showed no significant fluctuations, indicating that the objective function had converged.
This study addressed a four-objective optimisation problem by integrating an IMOEA/D with an XGBoost for prediction and optimisation using simulated data sets. Following 300 iterations, 26 Pareto-optimal solution sets were obtained. As these represented non-dominated solutions across four objectives, no single solution was globally optimal for all objectives. Instead, they offered decision-makers a diverse solution space from which to select the most appropriate scheme according to their preferences. To better visualise the distribution of objective values across different regions, scatter diagrams illustrating pairwise correlations between objectives were plotted, as shown in Figure 8.
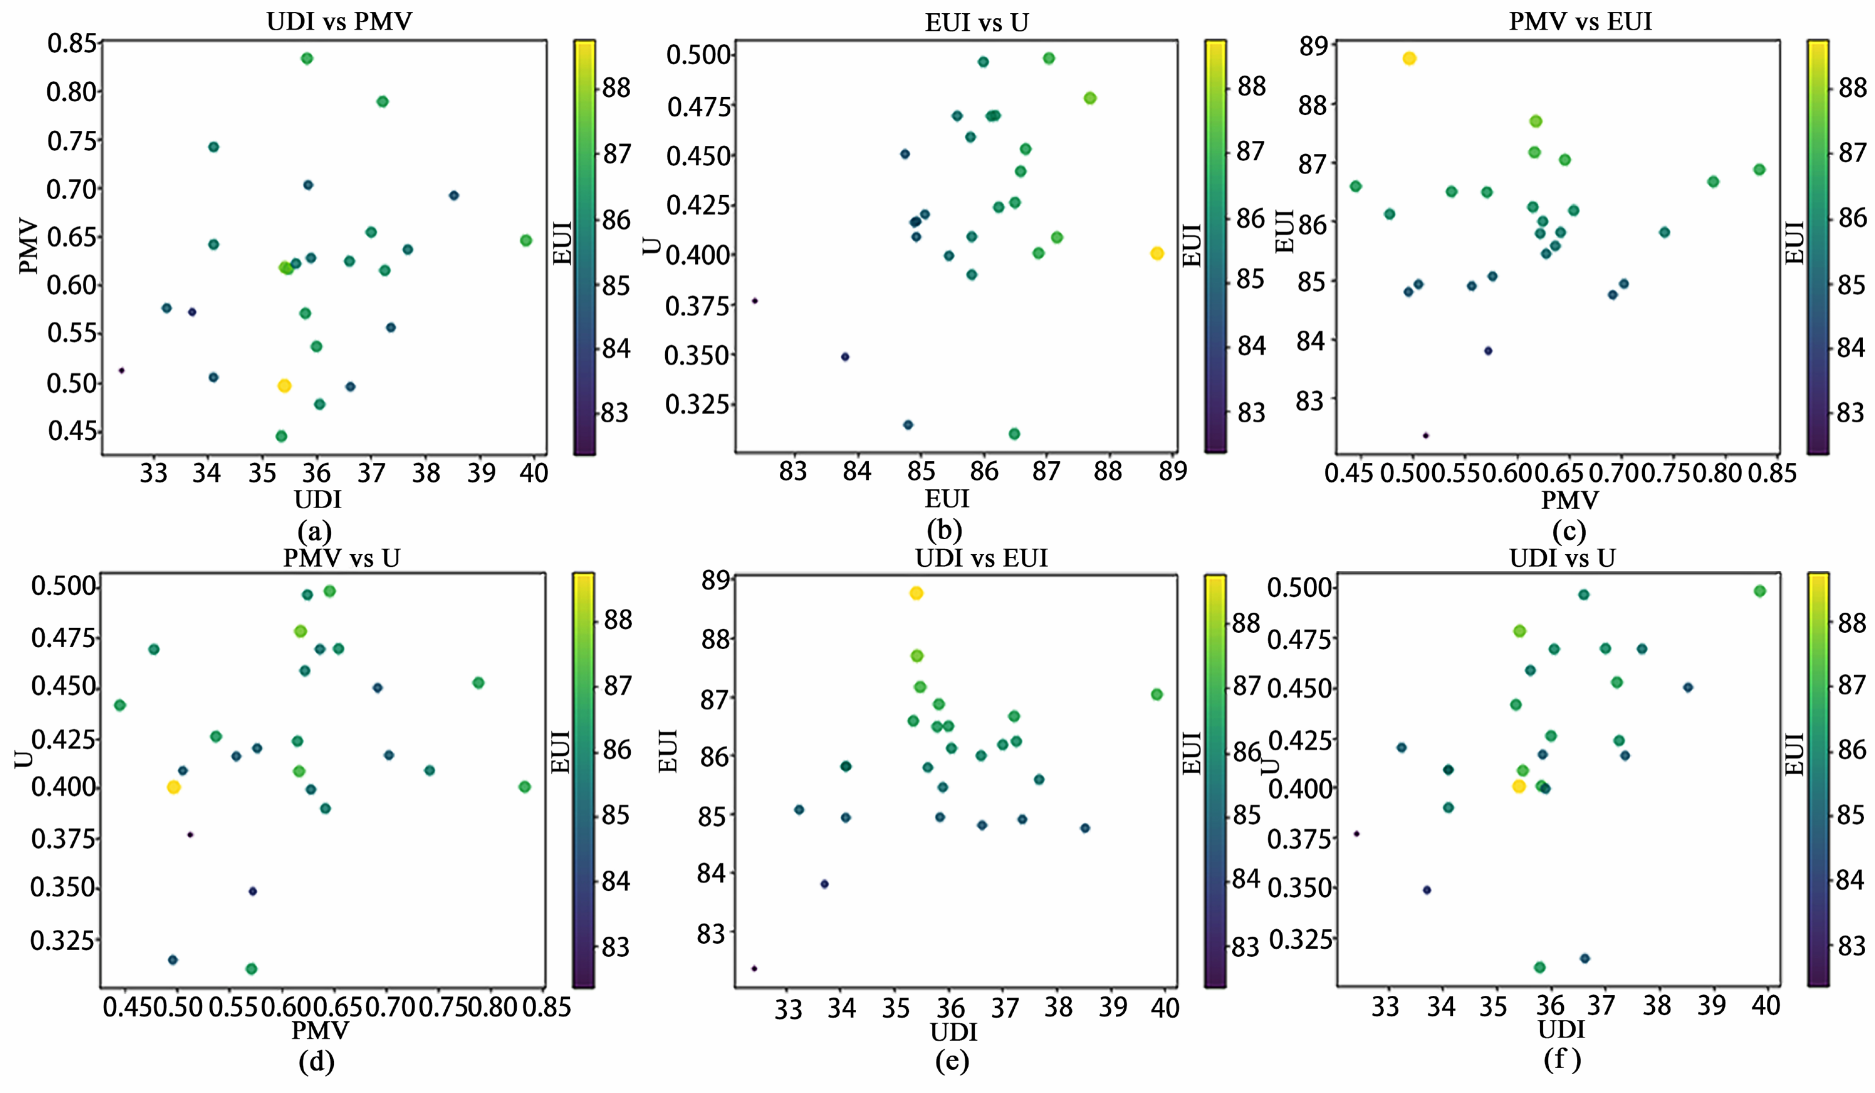
Distribution of multi-objective Pareto front solutions: (a) UDI vs. PMV, (b) EUI vs. U, (c) PMV vs. EUI, (d) PMV vs. U (e) UDI vs. EUI and (f) UDI vs. U.
Figure 8 illustrates the distribution density of each feature across different regions in the set of Pareto front solutions, allowing for the visualisation of the data distribution pattern, identification from concentrated areas, detection of outliers and evaluation of feature relationships. From the figure, there was no apparent correlation between the four objective values, and they were even contradictory during the optimisation process. Furthermore, there was no evident clustering in different objective values. The high-density regions of all Pareto front solutions in the UDI, PMV, U and EUI distributions were, respectively, 32.0–40.0, 0.40–0.80, 0.325–0.500 and 82.0–89.0.
After analysis of the distribution and concentration of Pareto front solutions across the various objectives and for guidance on the optimal integrated renovation and design of student accommodation envelope systems with respect to daylighting, thermal performance, ventilation and energy consumption, Figure 9 was produced based on the optimal, median and mean values of design parameters within the Pareto front solutions. The figure illustrates the distributions of the parameters and the concentration ranges for the 10 optimal solutions.
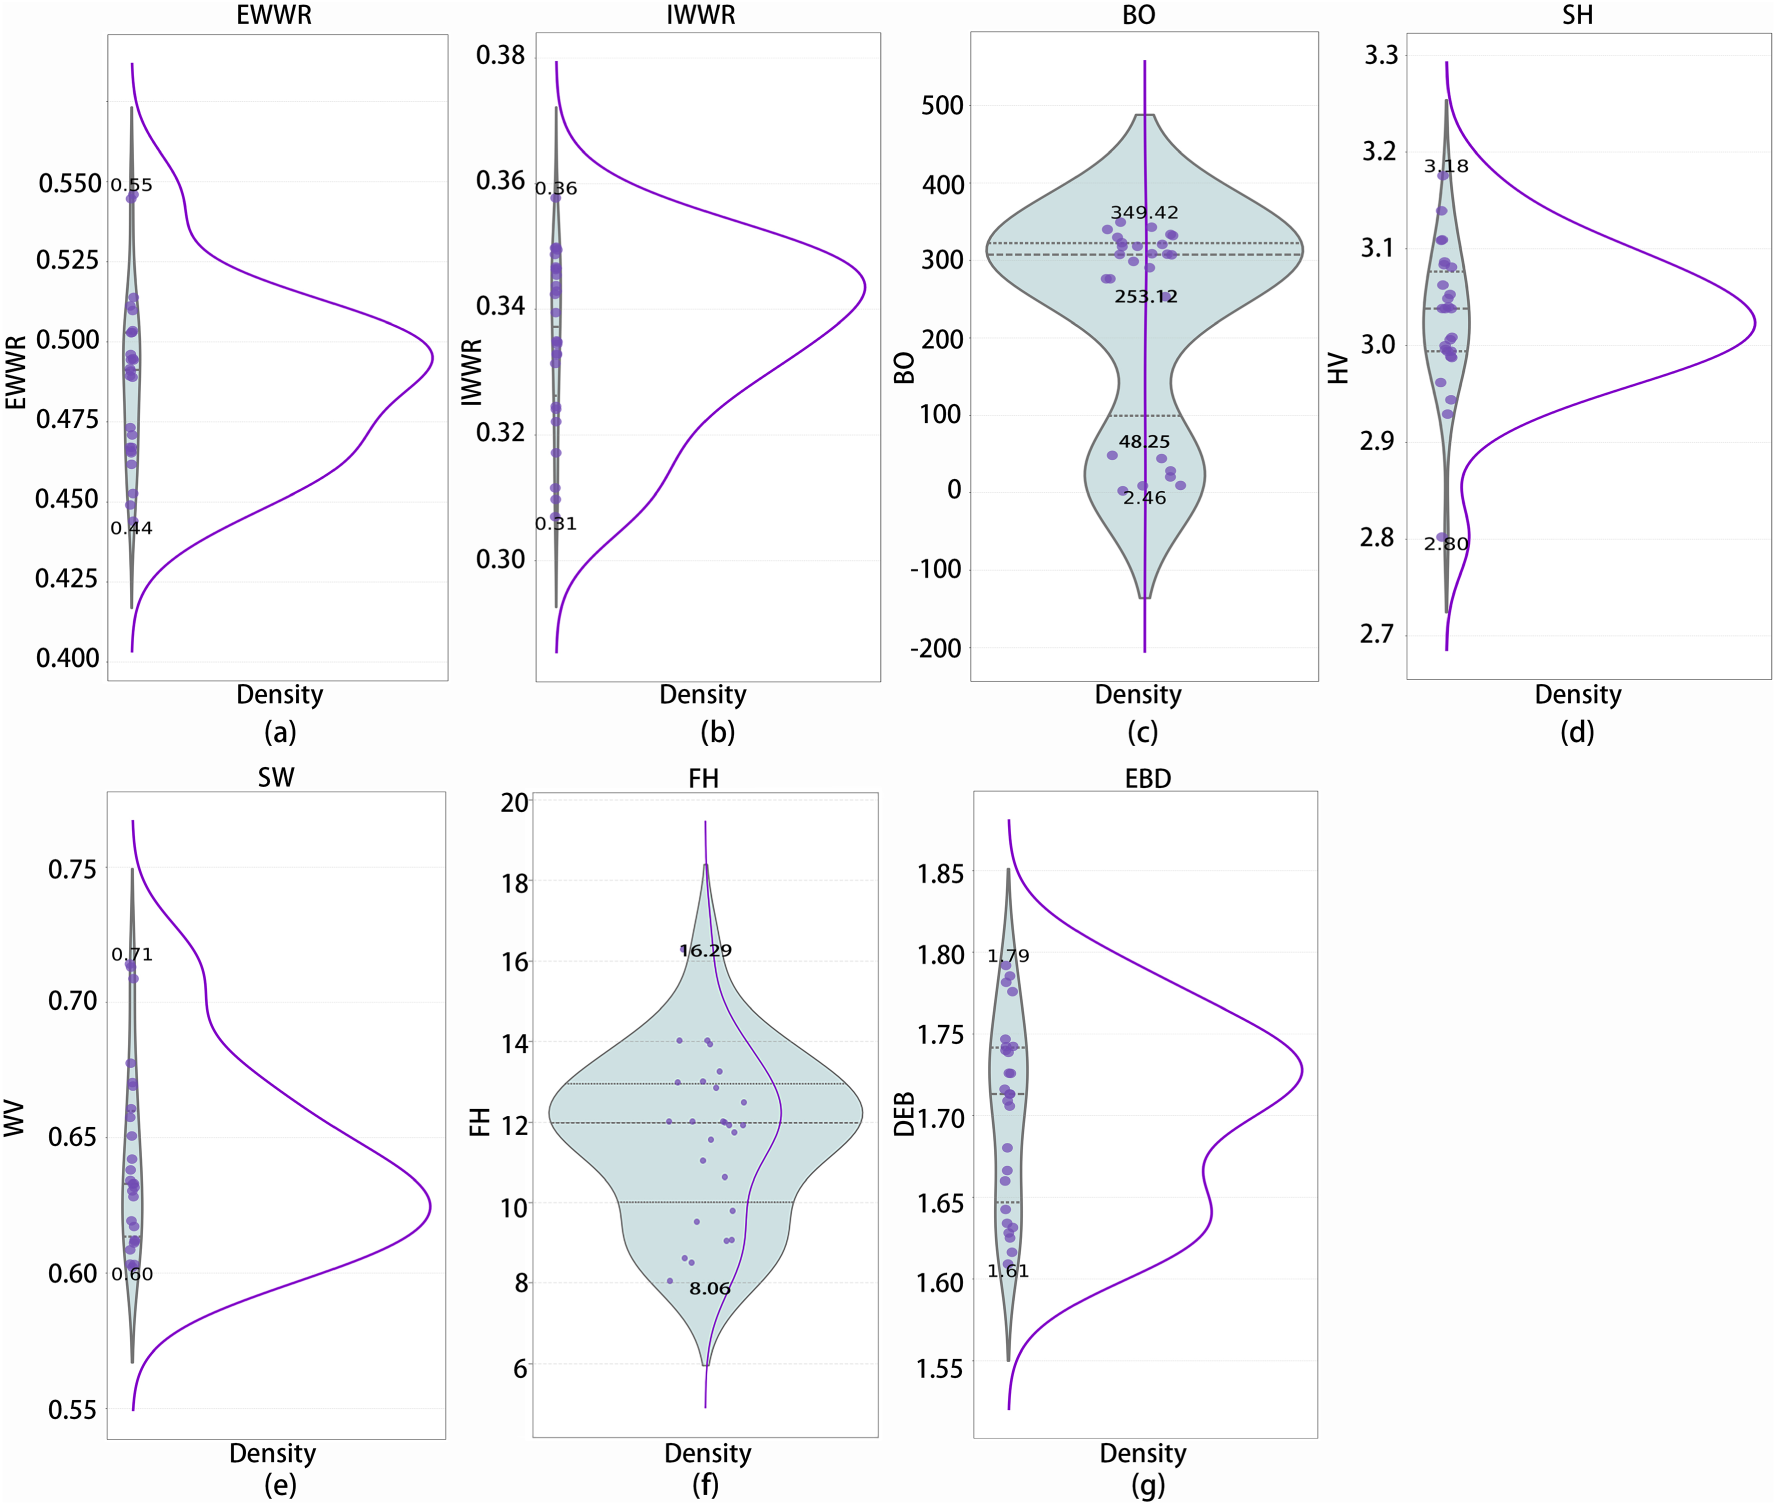
Mean, median and distribution of design parameters in the Pareto front solution.
Based on Figure 9, and with the aim of enhancing the building's lighting, thermal and ventilation performance whilst reducing energy consumption, the optimal design parameter ranges for windows, orientation and balconies in student dormitory buildings are as follows: EWWR 0.44–0.55, IWWR 0.31–0.36, BO 253.12°–349.2° and 2.46°–48.25°, SH 2.8–3.18 m, SW 0.60–0.71 m, EBD 1.61–1.79 m and FH 8.06–16.29 m. Meanwhile, the EW-TOPSIS method was employed to calculate the closeness coefficient (C-value) of all solutions in the Pareto front, as shown in Table 6.
Closeness coefficients (C-values) of all Pareto front solutions.
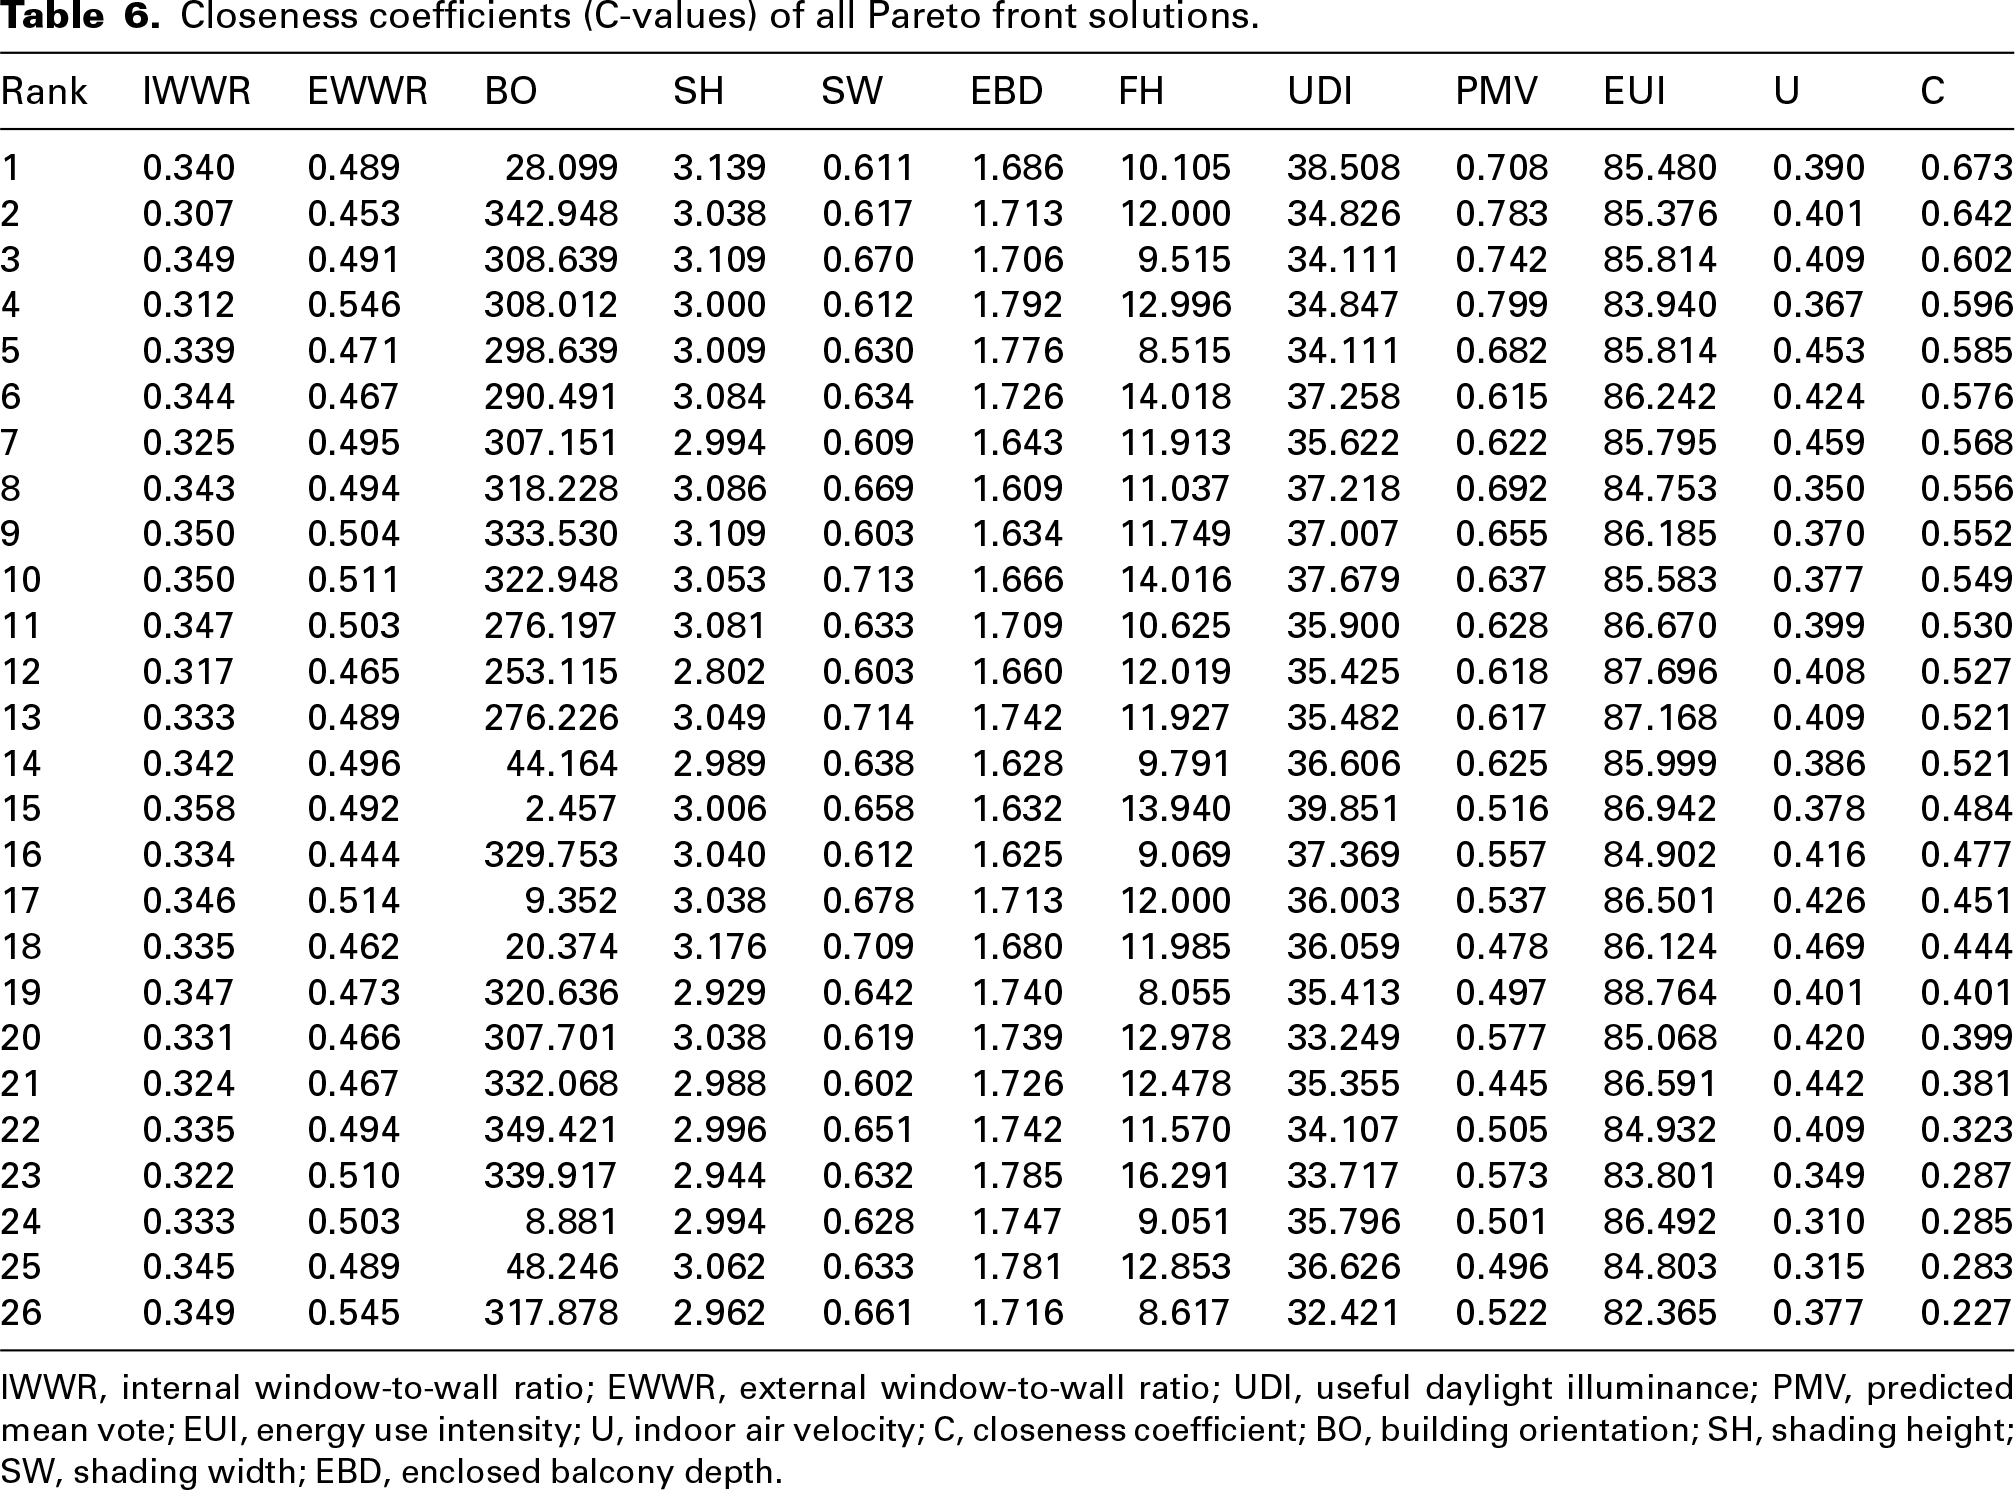
IWWR, internal window-to-wall ratio; EWWR, external window-to-wall ratio; UDI, useful daylight illuminance; PMV, predicted mean vote; EUI, energy use intensity; U, indoor air velocity; C, closeness coefficient; BO, building orientation; SH, shading height; SW, shading width; EBD, enclosed balcony depth.
Based on the C-values, the optimal solution was selected and compared with the baseline model, as presented in Table 7. Compared with the baseline model, the optimised model achieved improvements of 20.96%, 26.04% and 38.09% in UDI, PMV and U, respectively, whilst the EUI was reduced by 5.87%.
Comparison of parameters between baseline and optimised models.
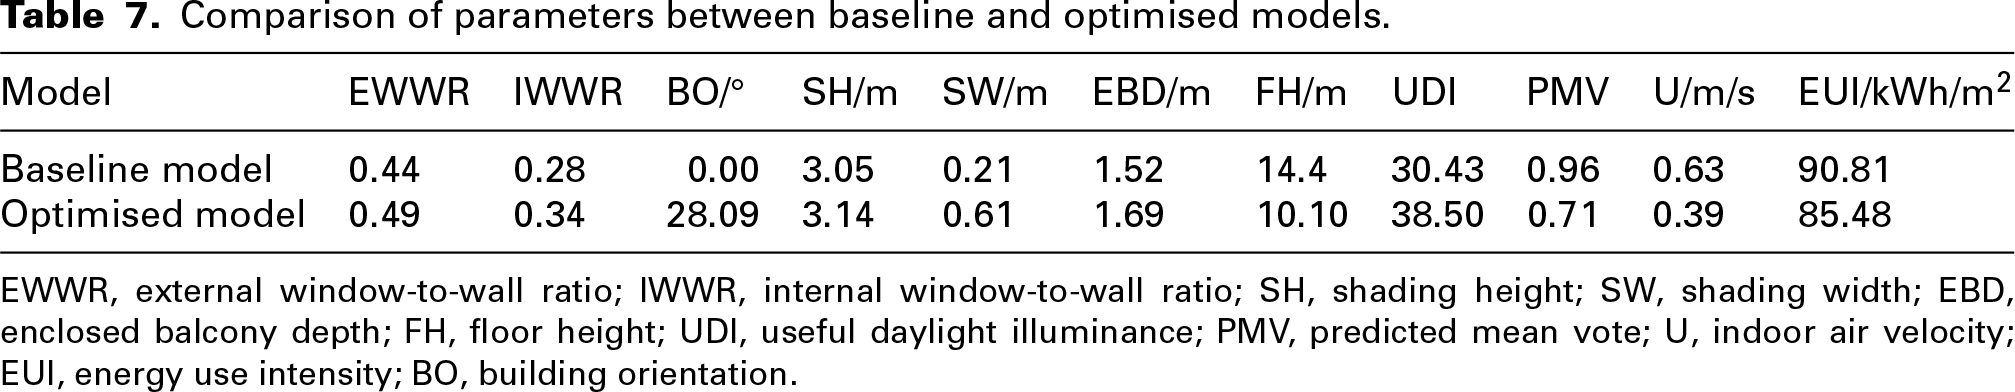
EWWR, external window-to-wall ratio; IWWR, internal window-to-wall ratio; SH, shading height; SW, shading width; EBD, enclosed balcony depth; FH, floor height; UDI, useful daylight illuminance; PMV, predicted mean vote; U, indoor air velocity; EUI, energy use intensity; BO, building orientation.
Optimisation strategies and recommendations.
In current dormitory building design, architects typically prioritise a north–south orientation to maximise solar gain, enhance daylighting and improve thermal performance. Nevertheless, east–west-oriented dormitories also exist due to constraints such as land availability, campus master planning, prevailing regional wind patterns and economic considerations. Consequently, this study integrated photothermal comfort, wind environment and energy consumption predictions for multi-storey student accommodation buildings with varying orientations. Multi-objective optimisation was then employed to derive the corresponding Pareto front solutions. Based on these, the EW-TOPSIS method was used to assign weights to each evaluation indicator to quantify their relative importance. The results indicated that the weights for the four evaluation indicators, UDI, PMV, EUI and U, were 0.25, 0.35, 0.16 and 0.24, respectively. This demonstrated that PMV has the greatest influence on differentiating schemes and is the primary factor in optimising building envelopes for indoor environmental quality. UDI and U are of secondary importance, whereas EUI has the least weight. The proximity C-value for each combined scheme was subsequently calculated based on these weights, ultimately selecting the 10 schemes with the highest C-values, as detailed in Table 8. 76
Ten optimal solutions for different building orientations.
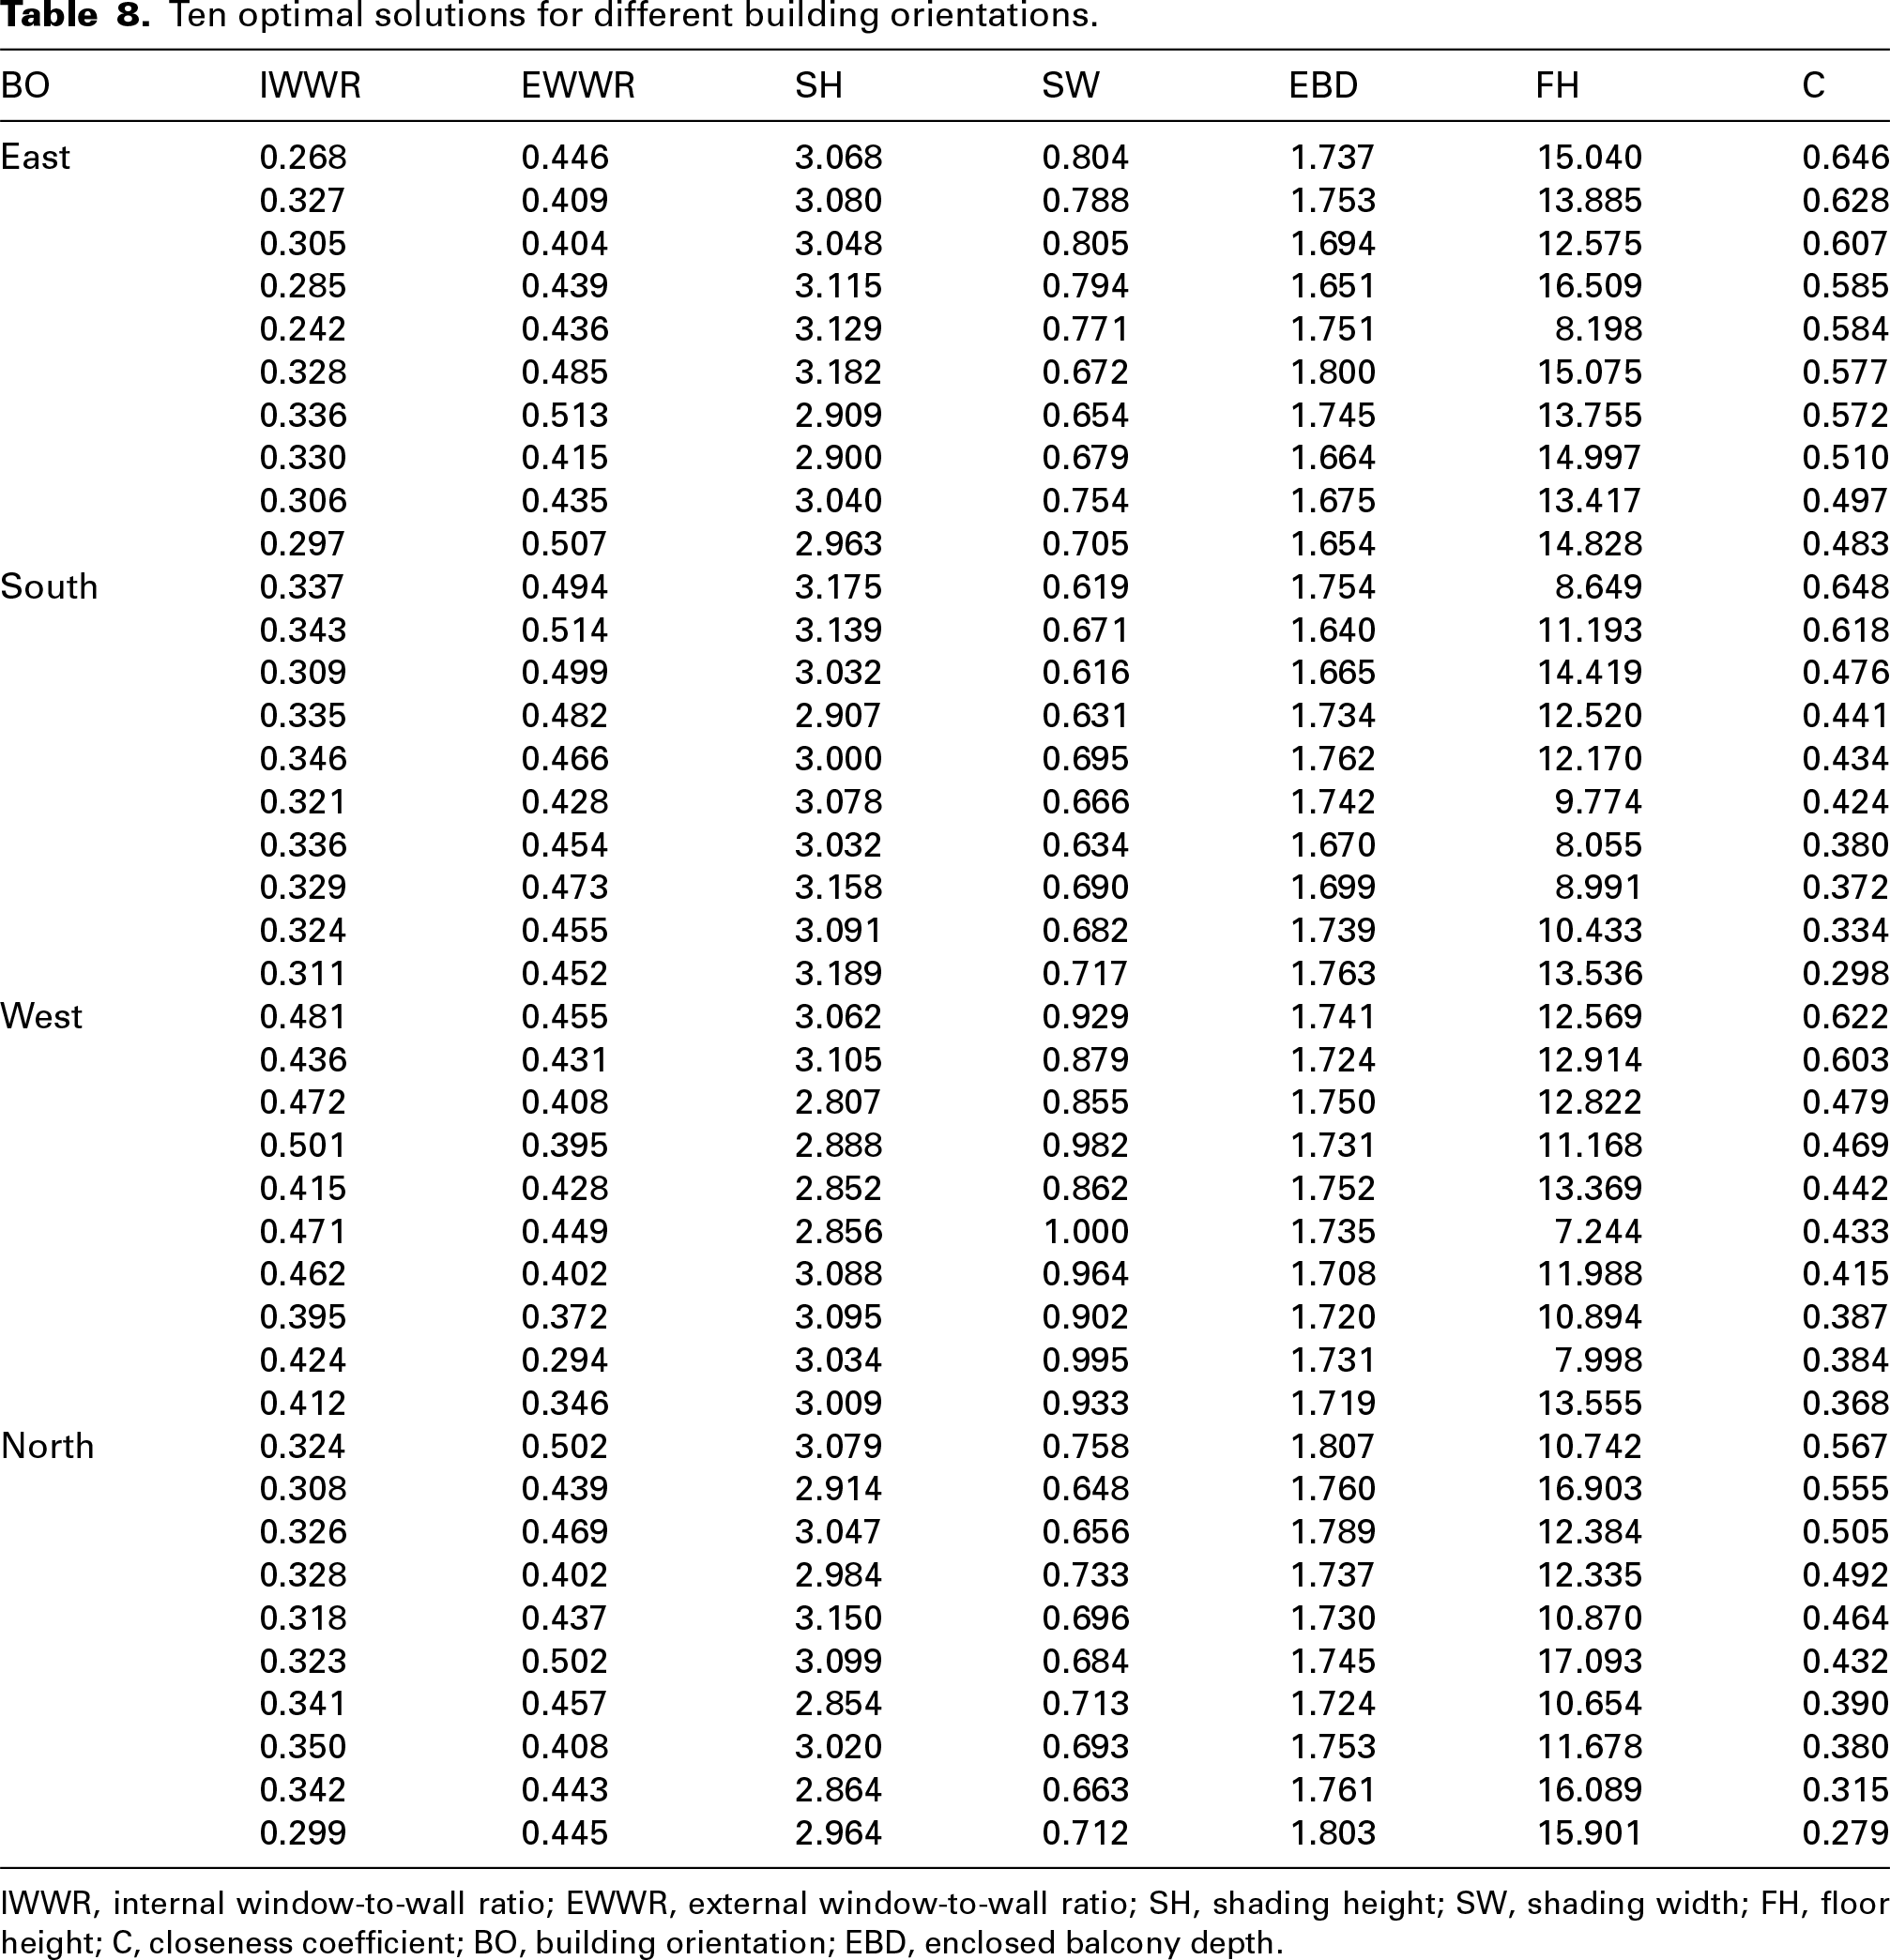
IWWR, internal window-to-wall ratio; EWWR, external window-to-wall ratio; SH, shading height; SW, shading width; FH, floor height; C, closeness coefficient; BO, building orientation; EBD, enclosed balcony depth.
Additionally, to better compare the differences in the design parameters of window openings, shading and balcony configurations amongst dormitory buildings with different orientations, we compared the parameter distribution of the top 10 optimal combinations for each orientation (as listed in Table 8) with the corresponding parameter distribution in their respective Pareto solution sets, resulting in Figure 10.
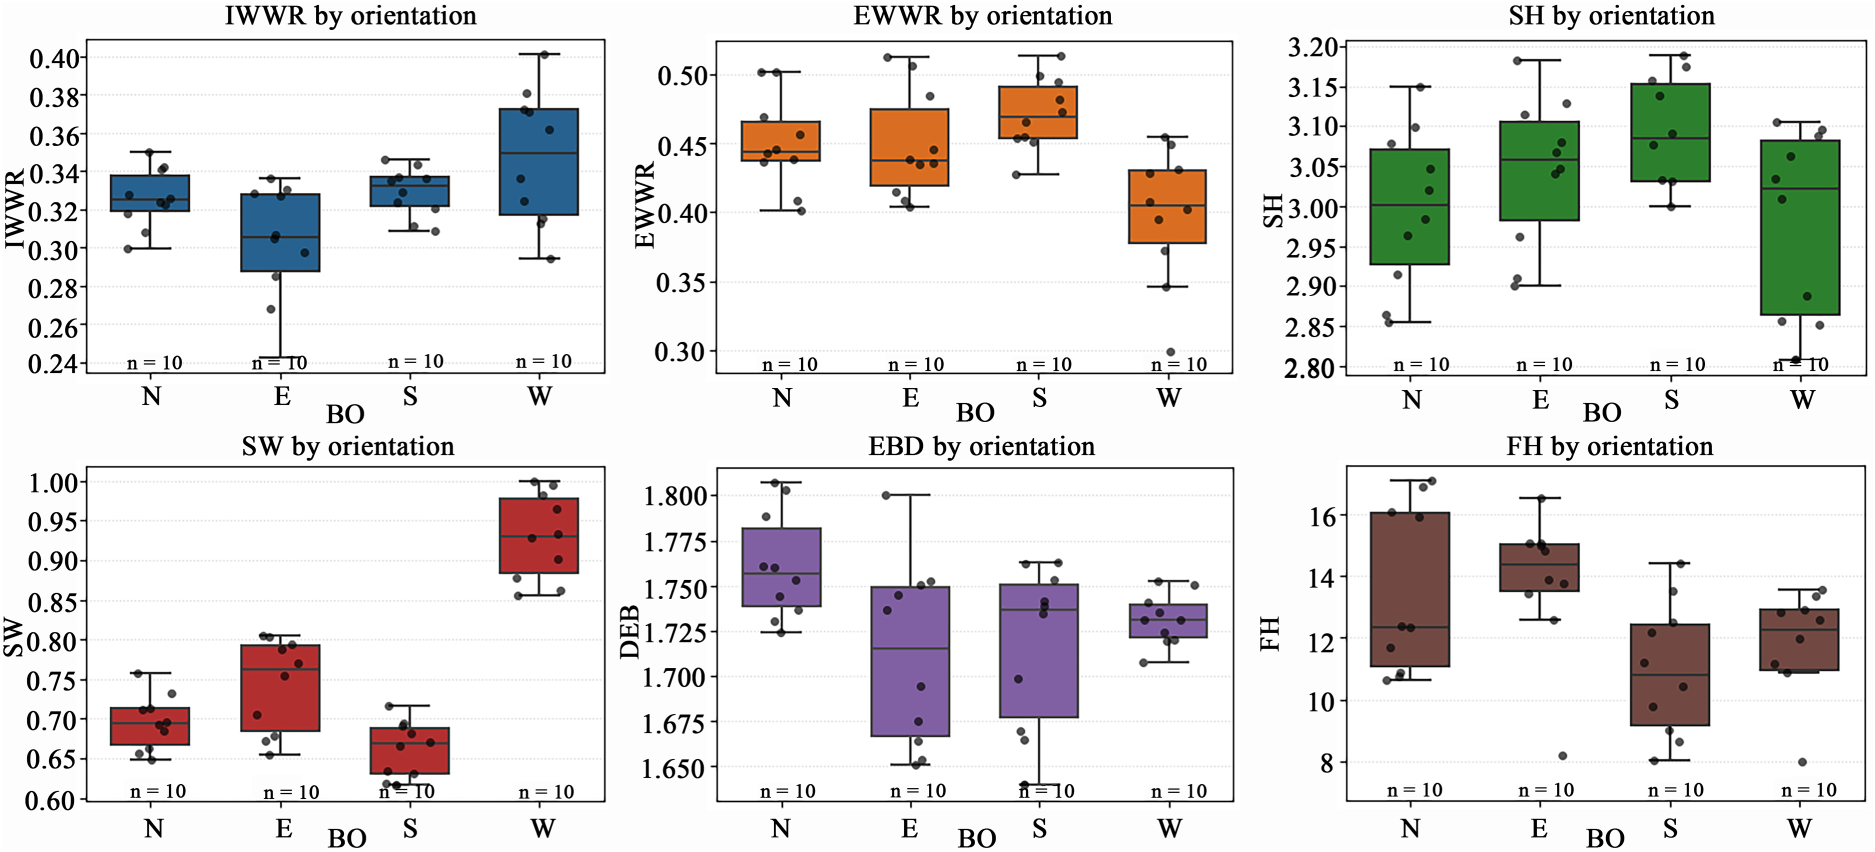
Distribution of optimal design parameters for different orientations.
As shown in Figure 10, in student dormitory buildings with enclosed balconies facing different orientations, when the optimisation of the building envelope system took into complete account indoor environmental comfort and energy consumption, notable differences were observed in parameters such as the IWWR and EWWR, the configuration of sunshades and the depth of enclosed balconies. In summary, with the aims of enhancing indoor thermal comfort, improving ventilation and reducing building energy consumption, corresponding optimisation design strategies for the exterior envelope systems of dormitory units, according to their orientations and floor levels, are recommended as follows: In the design of window openings for both interior and exterior windows in dormitories, the optimal EWWR for south-facing dormitories is larger than that of other orientations, ranging from 0.450 to 0.525. This may be related to the geographical location of the building. In the Northern Hemisphere, south-facing dormitories receive the most sunlight, and increasing the window-to-wall area ratio can improve the indoor thermal comfort performance of the building to some extent. Meanwhile, the optimal IWWR for all four orientations is similar, ranging from approximately 0.30 to 0.35. In the design of sunshade panels for dormitory buildings, the optimal height (SH) range for west-facing panels should be slightly lower than that of panels facing east, south and north, at approximately 2.80 to 3.10 metres. In contrast, the optimal width (SW) should be greater, at around 0.85 to 1.00 metres. By moderately increasing the width and reducing the height of west-facing sunshade panels, the amount of solar radiation entering indoor spaces during the late afternoon and early evening can be effectively reduced, thereby helping to mitigate excessive heat accumulation from west-facing sunlight. For the enclosed balcony depth (EBD), the optimal design range is 1.710 to 1.750 metres for west-facing balconies and 1.725 to 1.800 metres for north-facing balconies. These values are generally greater than those for east- and south-facing balconies. However, they may also be influenced by the prevailing wind direction in the region. Intending to improve indoor thermal comfort, enhancing air quality and reducing energy consumption, dormitory buildings with enclosed balconies exhibit different optimal floor levels depending on their orientation. Specifically, the optimal floor levels are 3 to 5 for east-facing buildings, 3 to 4 for west- and south-facing buildings, and 4 to 5 for north-facing buildings.
Of course, the optimised design of indoor thermal and lighting conditions, ventilation performance, and building energy consumption in student dormitory buildings with different orientations and floor levels is not only influenced by the aforementioned design parameters but also related to factors such as geographical location, seasonal prevailing wind directions, building obstructions, and airflow characteristics. Therefore, during architectural design, these factors must be considered and further optimised based on actual conditions.
Conclusion
This study has developed a multi-algorithm hybrid optimisation framework (XGBoost–IMOEA/D + EW-TOPSIS) to support the integrated design of student dormitories with enclosed balconies. Based on simulations conducted on the Ladybug–Honeybee–Butterfly platform, daylighting, thermal environment, airflow and energy performance under different window-opening configurations have been systematically analysed. The XGBoost–IMOEA/D algorithm has been employed to obtain the Pareto-optimal solution set, and the EW-TOPSIS method has been applied to identify the optimal scheme for each building orientation.
The results have indicated that the optimised ranges of envelope design parameters have shown high practical applicability and can be readily implemented in both new construction and renovation projects. By adjusting window-opening ratios, partition layouts, and shading parameters, indoor daylighting, thermal comfort, and energy performance have been effectively improved without altering the main structural system. The main conclusions are as follows: The sensitivity of various parameters in the design of window openings in student dormitory buildings with enclosed balconies to the indoor light, thermal, and air quality conditions, as well as building energy consumption, exhibited significant differences. Amongst these parameters, IWWR, EWWR and SW were more sensitive to UDI, EWWR and EBD were more sensitive to PMV, BO, SH, and FH were more sensitive to U, and EBD was more sensitive to EUI. Additionally, the design of window openings, shading and balconies in the building envelope system of dormitory buildings was associated with varying degrees of correlation with indoor light and thermal comfort, ventilation performance and energy consumption. The optimal design parameter ranges for the integrated design of thermal comfort, ventilation performance and building energy consumption in student dormitories are as follows: EWWR between 0.44 and 0.55, IWWR between 0.31 and 0.36, BO between 253.12°–349.2° and 2.46°–48.25°, SH between 2.8 and 3.18 m, SW between 0.60 and 0.71 m, EBD between 1.61 and 1.79 m, and FH between 8.06 and 16.29 m. Compared with the baseline model, the optimal scheme improved UDI, PMV and U by 20.96%, 26.04% and 38.09% respectively, whilst EUI was reduced by 5.87%. With the objectives of enhancing indoor thermal comfort, improving natural ventilation and reducing building energy consumption, optimising the design of window openings, shading and balcony configurations in student dormitory buildings with different orientations results in significant differences in the optimal design ranges for parameters such as IWWR, EWWR, SH, SW, EBD and FH. Specifically, the IWWR (0.30–0.35) and EWWR (0.450–0.525) for south-facing buildings were larger than those of other orientations. West-facing SH (2.80–3.10) was lower than other orientations, whilst the range of SW (0.85–1.00) was wider compared with other orientations. Additionally, the optimal design ranges for EBD in west-facing (1.710–1.750) and north-facing (1.725–1.800) orientations were slightly larger than those in south- and east-facing orientations. Optimal floor ranges also varied by building orientation: east-facing buildings achieve optimal conditions on the third to fifth floors; west- and south-facing buildings on the third to fourth floors; and north-facing buildings on the fourth to fifth floors. Whilst these optimal floor ranges cannot directly inform dormitory design, they may serve as a reference for students selecting their accommodation. Furthermore, they may provide a basis for institutions to categorise and price dormitories according to their environmental quality. This approach helps avoid disputes arising from substantial variations in living conditions being charged at identical rates, thus promoting more equitable accommodation arrangements.
However, this study has several limitations. First, the measurements and validation cover only typical orientations and floor levels, and the sample size is limited, which may not fully capture the effects of spatial variation on indoor lighting, thermal conditions, ventilation and energy consumption. Second, only characteristic parameters such as window-to-wall ratio, sunshade size, orientation, balcony depth and floor height were considered, whilst the potential influences of dormitory space geometry, envelope structure, building form factor, thermal conductivity and surface reflectivity on indoor environmental quality and energy performance were not addressed. Third, when floor height was treated as a design variable, the unique characteristics of top- and bottom-floor envelopes were not fully accounted for. Finally, the research primarily focused on student dormitories with enclosed balconies in cold regions. Although such buildings are mainly distributed in cold areas of China, a small proportion is located in severely cold regions and in hot-summer/cold-winter zones.
Future research could address these limitations by expanding the number of measured samples to more comprehensively evaluate the effects of different orientations and floor levels on indoor lighting, thermal conditions, ventilation and energy consumption. Additionally, the influence of building form factor, envelope thermal conductivity, surface reflectivity and other relevant parameters should be incorporated to better assess indoor environmental quality and energy performance. Special attention could be given to the characteristics of top- and bottom-floor spaces. Furthermore, increasing the number of case studies in severely cold and hot-summer/cold-winter regions would improve the generalisability and applicability of the findings.
Footnotes
Authors' contribution
Kaixing Shen contributed to conceptualisation; investigation; methodology; software; visualisation; and writing–original draft. Hui Xi contributed to project administration; resources; methodology; supervision; and writing–review and editing. Wanjun Hou contributed to project administration; resources; methodology; supervision; writing – review and editing; funding acquisition.
Declaration of conflicting interests
The authors declared no potential conflicts of interest with respect to the research, authorship, and/or publication of this article.
Funding
The authors disclosed receipt of the following financial support for the research, authorship, and/or publication of this article: This work was supported by the Hebei Natural Science Foundation, National Natural Science Foundation of China (grant numbers E2025402020 and 52268004).
Appendix A