
Abstract
The accurate prediction of thermal sensation for pregnant women is not achievable with existing predicted mean vote (PMV) models, likely due to alterations in metabolic rate associated with gestation. Existing studies and standards lack data on the metabolic rates of pregnant women in China across trimesters, making it impossible to verify whether deviations in the PMV model are associated with changes in metabolic rate. This study recruited 30 women with pre-pregnancy normal body mass index (BMI) at different gestational stages. Indirect calorimetry measured sitting-still metabolic rate and respiratory parameters, and the PMV model was modified based on actual metabolic rates. Results indicate that the sitting-still metabolic rates of 0.86, 1.06 and 1.21 met were measured for pregnant women, corresponding to the three pregnancy stages in order. Metabolic rates differed significantly between the first and third trimesters of pregnancy (p < 0.01). The modified model (termed PMVm), which incorporated measured metabolic rates, showed a 22% improvement in accuracy during the third trimester, with no significant effect in the first or second trimesters. These findings contribute to the refinement of thermal comfort theory for pregnant women, offering data references to improve the precision of thermal model predictions.
Keywords
Introduction
An accurate thermal comfort model is important for enhancing occupants’ satisfaction and optimizing building energy efficiency.1–4 Fanger's predicted mean vote (PMV) model, derived from the human balance equation, evaluates thermal comfort by quantifying subjective thermal sensations. 5 PMV models are globally employed to evaluate thermal comfort in indoor environments. 6 However, the predictive accuracy of prevailing thermal comfort models remains biased when applied to specific populations. A comparison of thermal sensation amongst pregnant women, men and ordinary women showed that the PMV model exhibits deviations when predicting thermal sensation in pregnant women. 7 Further studies on women at different gestational stages have indicated that the PMV model lacks accuracy in predicting thermal sensation throughout all gestational stages. 8 To address the aforementioned discrepancies, previous studies have only attempted to improve the ‘scissors gap’ phenomenon between PMV and mean thermal sensation vote (MTSV) in pregnant women through linear correction methods. 9 However, this approach fails to fundamentally optimize the PMV model, as it remains reliant on extensive thermal sensation data for regression fitting, thus exhibiting inherent limitations. Therefore, there is a critical need to undertake fundamental modifications to the PMV model.
Compared to non-pregnant women, pregnant women undergo significant physiological changes in systems such as blood circulation, respiration and metabolism. Specifically, cardiac output increases by approximately 30% to 50%, 10 while ventilation significantly increases during both rest and exercise, with the increase exceeding the growth in oxygen consumption and metabolic rate. 11 These physiological changes may impact the body's thermoregulation and perception of thermal comfort. 12 However, traditional PMV models typically do not account for these physiological changes. Consequently, directly applying existing thermal comfort standards to pregnant women may lead to systematic prediction errors, highlighting the necessity of incorporating pregnancy-specific physiological data into model modifications. Within the general population, individual differences in thermal preference are strongly associated with metabolic rate. Individuals with a preference for cooler environments typically exhibit a higher metabolic rate, leading to greater internal heat production and a need to dissipate body heat to maintain thermal equilibrium. 13 Under low-temperature conditions, women tend to feel cooler due to generally lower metabolic rates than men. 14 Zhang et al. 15 selected three distinct methods to calculate the metabolic rate in elderly subjects and observed that its value influences the PMV model. Luo et al. 16 demonstrated that a variation of 0.6 met in the metabolic rate could induce a fluctuation of up to 1.5 units in the PMV index. This general principle may manifest in a more complex manner amongst the specific demographic of pregnant women. Yang et al. 8 observed a tendency for women in the third trimester to favour cooler thermal conditions compared to those in earlier trimesters. Based on the above studies, it was hypothesized that variations in thermal preference in pregnant women during different gestational stages may be associated with variations in metabolic rate. Furthermore, variations in metabolic rate may be a contributing factor to the deviation between predicted thermal comfort outcomes and actual values for pregnant women at various gestational stages.
Existing thermal comfort standards, including ISO 7730 17 and ASHRAE 55-2023, 18 lack metabolic rate data for Chinese women across different gestational stages. Furthermore, metabolic rates reported in existing studies on pregnant women are predominantly expressed in units of kcal/day or kJ/day, which are primarily applicable to the fields of nutrition and clinical medicine.19–22 Consequently, data on the metabolic rate for pregnant women under sedentary conditions, essential for thermal comfort studies (1 met = 58.2 W/m2), remain insufficient. This lack of directly applicable data has led most studies assessing thermal comfort among pregnant women in China to adopt standardized metabolic rate values established for the general population,7,8,23,24 without actual metabolic rate measurements for women across different gestational stages. Additionally, the respiratory parameters incorporated into Fanger's PMV model were derived from data on European populations and have been demonstrated to differ from those of young Chinese males. 25 The applicability of the respiratory parameters proposed in the PMV model to pregnant Chinese women remains unverified. Therefore, elucidating the patterns of metabolic rate changes across pregnancy stages and integrating them into thermal comfort model modifications holds significant theoretical and practical importance. Based on these research gaps, it is necessary to refine both the metabolic rate and respiratory parameters for Chinese women across different gestational stages.
This study filled the gap in metabolic rate data for pregnant women with normal pre-pregnancy body mass index (BMI) by measuring their sitting-still metabolic rates and respiratory parameters across three trimesters using indirect calorimetry. Based on these measured metabolic rates, the PMV model was physiologically modified to enhance its accuracy in predicting thermal comfort for pregnant women. Specific research objectives included: (1) Measuring and analysing the characteristics of resting metabolic rate and respiratory parameter changes across pregnancy stages; (2) To compare differences between measured values and existing standard values; (3) To construct a modified PMV model (PMVm) based on measured metabolic rates and validate its predictive performance using field survey data across four seasons; (4) To explore the applicability of the traditional adaptive model (aPMV) for pregnant women. Findings from this research offer data and a theoretical foundation for refining the theory of thermal comfort for women during pregnancy and improving the precision of the thermal comfort model.
Methods
The outpatient ward of a hospital in Xi'an served as the setting for this investigation. This study comprised two main components: (1) Experimental Study: experimental trials to measure metabolic rates were conducted during the winter season (from November 2024 to February 2025), which received ethical approval (No. KJLL-H-K-2024017); and (2) Field Survey: seasonal field investigations were carried out across all four seasons to collect thermal sensation data.
These two components were integrated to enable the use of experimentally measured metabolic rates to modify the PMV model. Subsequently, the model was validated using full-year thermal sensation data collected during field surveys, combined with the measured metabolic rates. All studies and surveys were conducted within the same physical environment.
Experimental study: Metabolic rate measurement
Subjects
To control for the effect of variations in body size on metabolic rate,25–27 this study recruited subjects with normal-range pre-pregnancy BMI (18.5–24.0 kg/m2). Subjects reporting febrile, respiratory or other acute symptoms, along with those having pregnancy complications, were excluded. A final cohort of 30 pregnant women at various gestational stages was recruited. All participants provided written informed consent before the study. The cohort included 10 subjects per trimester (first: weeks 11–14; second: weeks 22–26; third: weeks 32–36). The subjects, aged 24 to 40 years, were all carrying a singleton pregnancy. Participant characteristics are detailed in Table 1. Although age varied between 24 and 40 years, the mean age across trimesters was comparable (Table 1).
Basic information of 30 pregnant subjects [mean ± standard deviation (SD)].
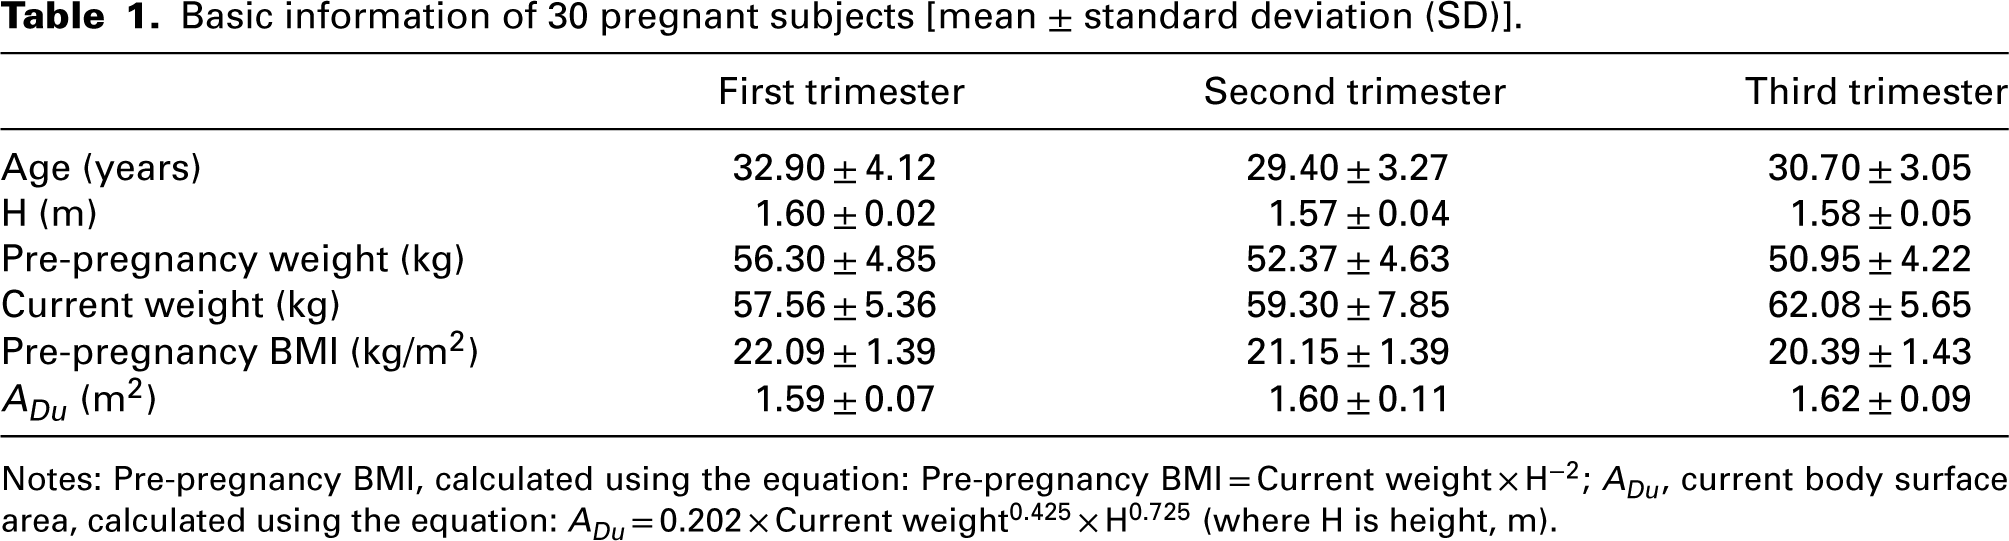
Notes: Pre-pregnancy BMI, calculated using the equation: Pre-pregnancy BMI = Current weight × H−2; ADu, current body surface area, calculated using the equation: ADu = 0.202 × Current weight0.425 × H0.725 (where H is height, m).
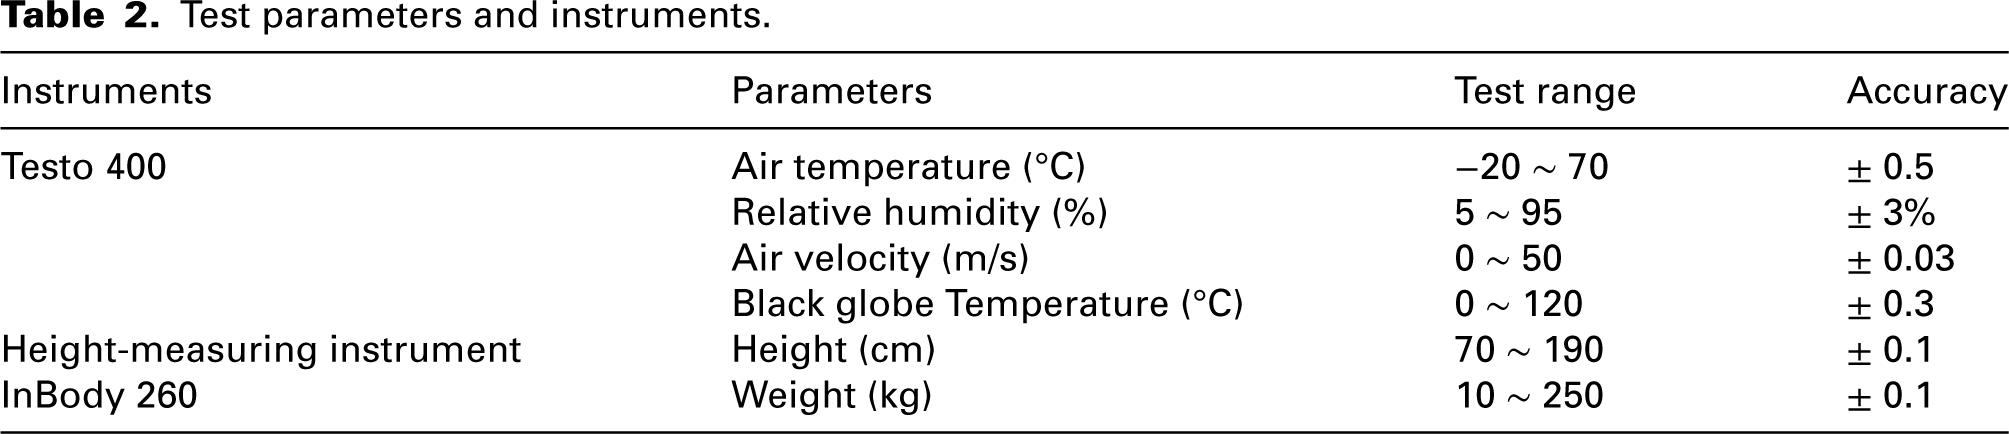
Test instruments and environmental control.
Detailed specifications of instruments used for measuring subject height, weight and environmental parameters, including their measurement ranges and precision, are summarized in Table 2.
Test parameters and instruments.
Operative temperature (Top) was employed as a comprehensive metric for the analysis of thermal sensation, as it effectively represents the aggregate thermal effect of the environment on the body.
28
Equation (1) was used for its determination, where Ta denotes the air temperature:
The average radiant temperature (Tmr) was calculated according to equation (2):

Determination of metabolic rate.
This study utilized a Cosmed K5 portable metabolic analyser to measure the sitting-still respiratory parameters of subjects using indirect calorimetry.29,30 In accordance with ISO 8996,
31
the metabolic rate was determined using equations (3) to (6):


Questionnaire.
The thermal sensation vote (TSV) was assessed using the ASHRAE seven-point scale: +3, ‘hot’; +2, ‘warm’; +1, ‘slightly warm’; 0, ‘neutral’; −1, ‘slightly cool’; −2, ‘cool’; −3, ‘cold’. Thermal comfort was evaluated using a separate five-point thermal comfort vote (TCV) scale: 0, ‘comfortable’; +1, ‘slightly uncomfortable’; +2, ‘uncomfortable’; +3, ‘very uncomfortable’; +4, ‘limited tolerance’.
Test procedures.
The experimental sessions were scheduled from 08:00 to 12:00. Subjects were instructed to fast for two hours beforehand, abstain from caffeine and vigorous exercise in the prior 24 h, and ensure adequate sleep. We measured subject weight using an InBody 260 and height using a height-measuring instrument. Each parameter was measured three times consecutively, and the mean value was recorded. Prior to testing, a 15-min warm-up period for the K5 was implemented. The gas sensors were then adjusted utilizing ambient air and a certified reference gas mixture. Subsequently, the flowmeter was verified using a standardized 3-litre syringe. During the testing phase, subjects were assisted in donning the experimental equipment, after which the mask's airtightness was verified. Upon confirmation of an adequate seal, subjects remained seated posture for 15 min to complete respiratory parameter measurements. Steady-state data from the intermediate 8-min period of the test were selected for analysis. The testing procedure is illustrated in Figure 1. Subsequently, subjects completed a subjective questionnaire. The clothing insulation was determined using the values stipulated in the ASHRAE 55 standard. 18
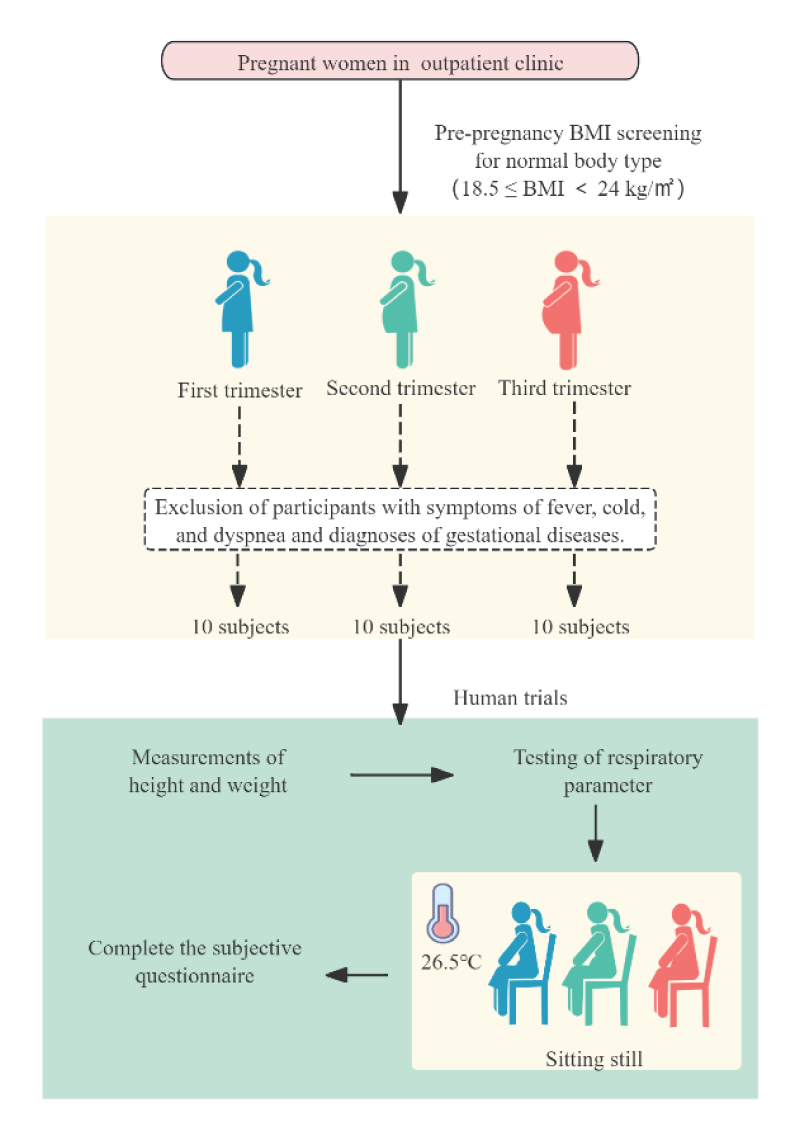
Schematic illustration of the test procedure.
This study maintained the indoor environment under steady-state comfortable conditions. An indoor environmental monitor (Testo 400) was employed to record the environmental parameters. During the metabolic rate tests, the average air temperature was 26.5°C, the average black globe temperature was 25.6°C, the average relative humidity was 48.1%, and the air velocity remained below 0.2 m/s. Figure 2 illustrates the test conditions for the subjects.
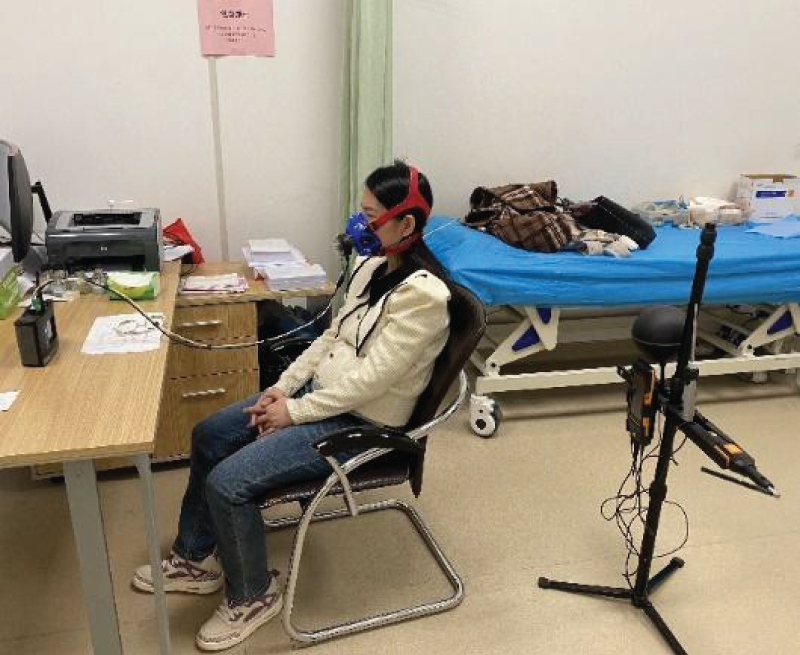
Field test picture.
Field survey: Four-season thermal sensation data collection
Survey design and data collection.
Data collection for thermal sensation encompassed four seasons from 2023 to 2024: spring (March–May), summer (June–August), autumn (September–November) and winter (December–February). The surveys were conducted in the same outpatient area of the hospital where metabolic rate measurements were performed, ensuring a consistent research setting. Pregnant women were recruited during their waiting time or routine visits in the outpatient zone. For each participant who provided consent, researchers first measured real-time environmental parameters at her immediate location using a Testo 400 instrument. Subsequently, the participant completed a subjective questionnaire capturing TSV and TCV, identical to the one administered during the metabolic rate studies. For each participant during the field survey, clothing insulation was calculated based on their reported attire at the time of the questionnaire, following the clothing insulation values provided in the ASHRAE 55 standard. 18 A total of 1660 valid questionnaires were collected across the annual cycle, distributed as follows: 395 in spring (first/second/third trimester: 182/179/286), 445 in summer (71/116/309), 410 in autumn (36/49/138) and 410 in winter (97/115/82).
The thermal sensation data collected during field investigations were utilized for two analyses: first, to validate the PMV model modified based on measured metabolic rates; second, to assess the applicability of the aPMV model in the pregnant population.
Data analyses.
Based on a G*Power 3.1.9.7 power analysis, a sample size of at least 21 was required. A pilot study with seven participants in each group revealed an effect size of 0.8. The selected statistical models were F-tests and one-way analysis of variance (ANOVA). 32 The significance level α, the statistical power and the number of groups were 0.05, 0.8 and 3, respectively. The G*Power analysis indicated that a minimum total sample size of 21 participants (seven participants per trimester group) was required to achieve the desired statistical power. Therefore, the sample size of 10 participants per group in this study (n = 30 total) exceeds the minimum requirement, ensuring adequate statistical power to detect significant differences amongst the three trimesters.
Data analysis and computations were conducted using SPSS 27.0 and MATLAB R2024b. Data normality was evaluated using the Shapiro–Wilk test and histograms, followed by ANOVA to assess differences in metabolic and respiratory parameters across gestation and determine their significance. Single-sample t-tests were utilized to compare measured values with standard values and findings from previous studies. Pearson correlation analysis was employed to identify factors influencing metabolic rate. For seasonal validation, the mean values of the dependent variable were calculated for each 0.5 °C bin of Top using the temperature frequency method.
The accuracy and stability of the modified PMV model were assessed using the MAE and SD,
33
calculated based on equations (7) to (9).


Results
Respiratory parameters by direct measurement
Figure 3(a) indicates significant differences in sitting-still oxygen consumption rates and CO2 production rates across the different trimesters (p < 0.01). The mean oxygen consumption rates across successive gestational stages were 241.62, 293.08 and 344.88 mL/min. A statistically significant increase in mean oxygen consumption was observed between the early and mid-pregnancy. The mean CO2 production rates across successive gestational stages were 182.27, 232.15 and 254.14 mL/min. The mean CO2 production rate in the mid- and late-pregnancy stages was significantly higher than that in the early-pregnancy stage.
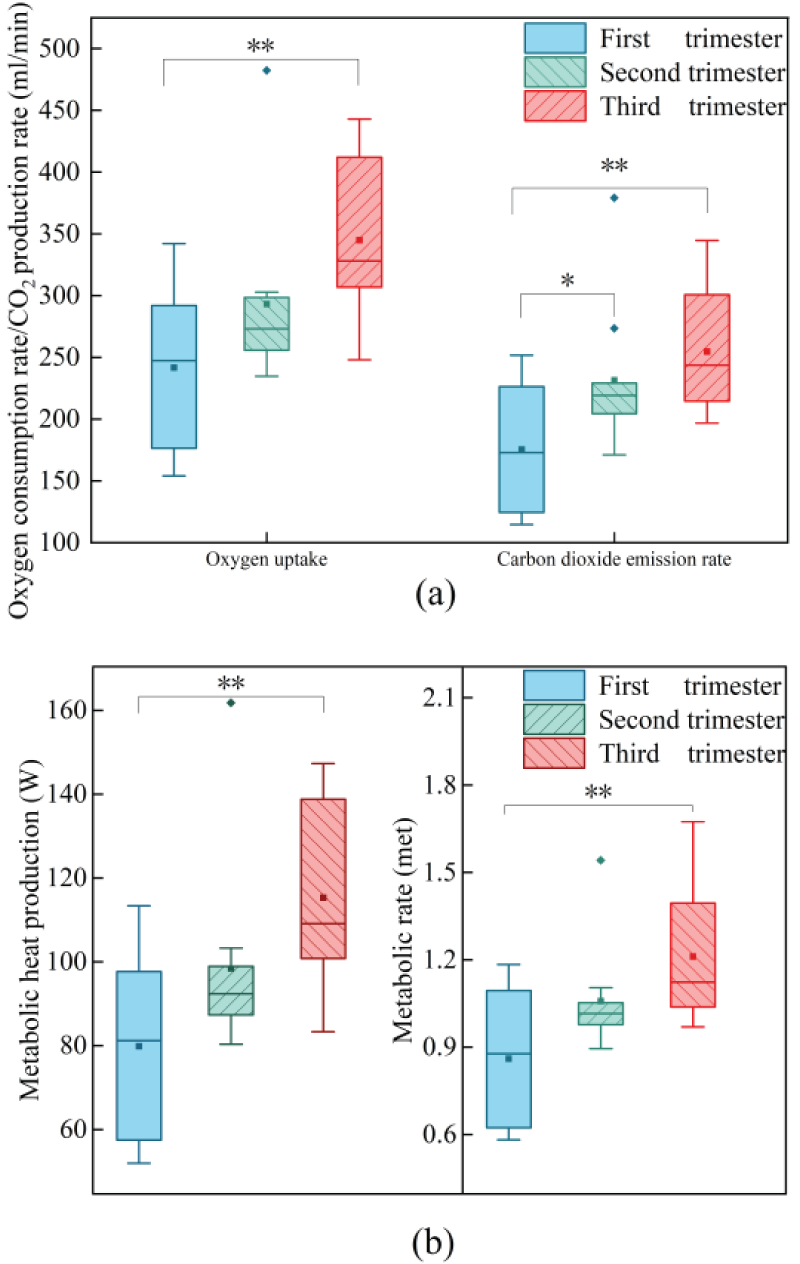
(a) oxygen consumption rates and CO2 production rates; (b) metabolic heat production and metabolic rates at different gestational stages.
Ventilation volume, tidal volume and respiratory rates are presented in Table 3. An ANOVA indicated that respiratory rate differed significantly across gestational stages (p < 0.05). Both ventilation volume and tidal volume showed no significant differences across these stages (p > 0.05). All three parameters demonstrated a gradual increasing trend with advancing gestational stages. The statistical analysis of directly measured respiratory parameters is summarized in Table 3.
Univariate analysis of variance of respiratory parameters during pregnancy (mean ± standard deviation (SD)).
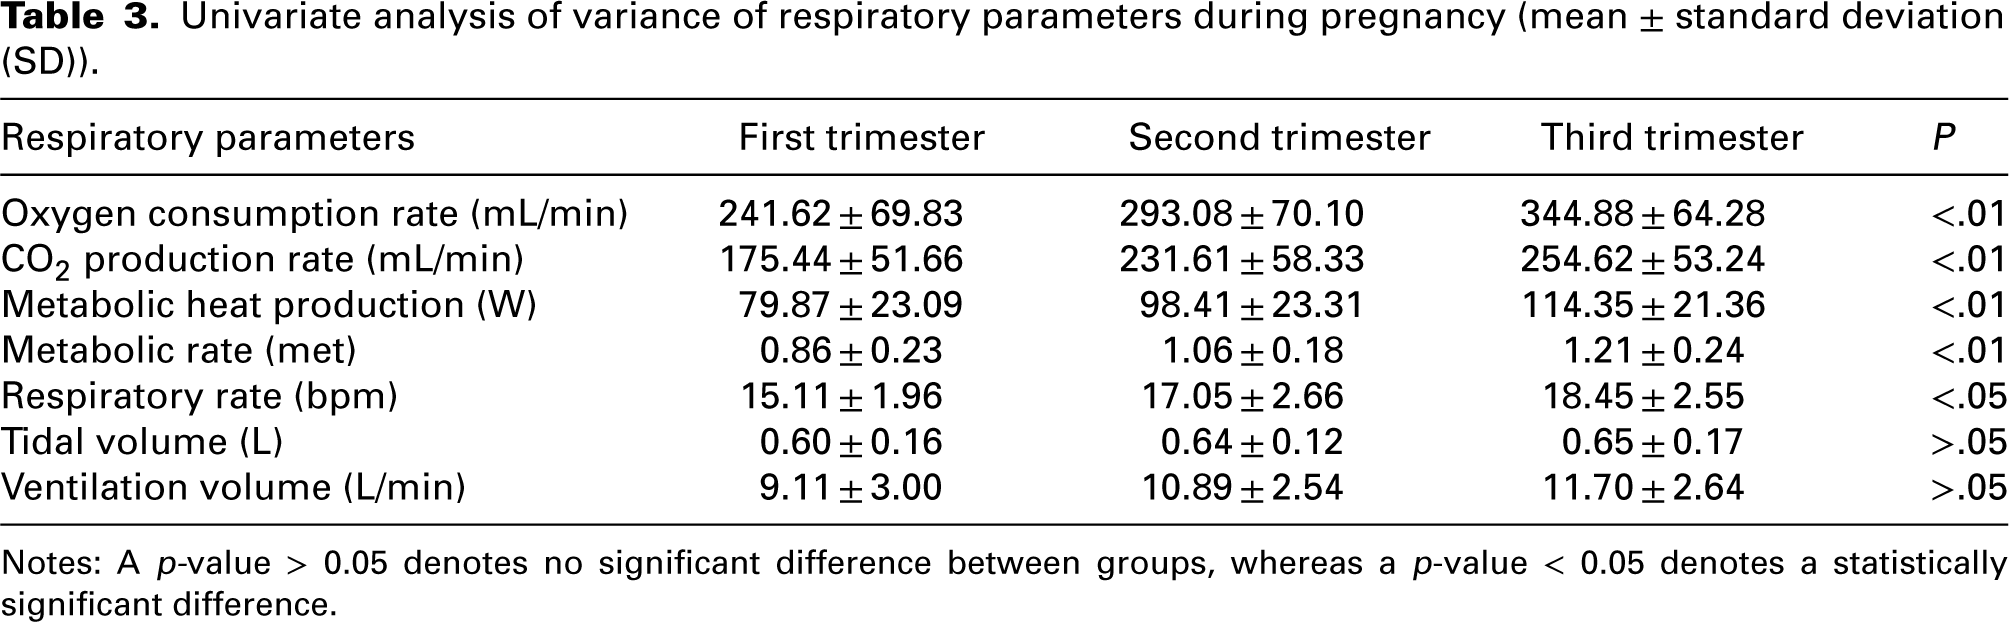
Notes: A p-value > 0.05 denotes no significant difference between groups, whereas a p-value < 0.05 denotes a statistically significant difference.
Metabolic heat production and metabolic rate by calculation
Figure 3(b) indicates that the metabolic heat production and metabolic rate exhibit significant differences during pregnancy (p < 0.01). The mean metabolic heat production across successive gestational stages was 82.21 W, 95.70 W and 112.79 W. A statistically significant increase in the metabolic heat production was observed between the first and third trimesters of pregnancy, a trend that aligns with the observed changes in oxygen consumption rates. The mean metabolic rates for pregnant women across successive gestational stages were 0.86, 1.06 and 1.21 met, respectively. The analysis revealed a statistically significant difference in metabolic rate between the early and mid-pregnancy (p < 0.01), whereas variations amongst other gestational stages were not significant. Table 3 summarizes the statistical analysis results of indirectly measured respiratory parameters.
Amongst all pregnant women (regardless of gestational stage), current body weight showed a significant positive correlation with metabolic rate (r = 0.411, p < 0.05). As the current weight of pregnant women increased, their metabolic rate also rose significantly. Linear fitting of current weight and metabolic rate for women at different gestational stages revealed in Figure 4 that metabolic rate increased with current weight in the first and second trimesters, whereas pregnant women in the third trimester showed no significant change.
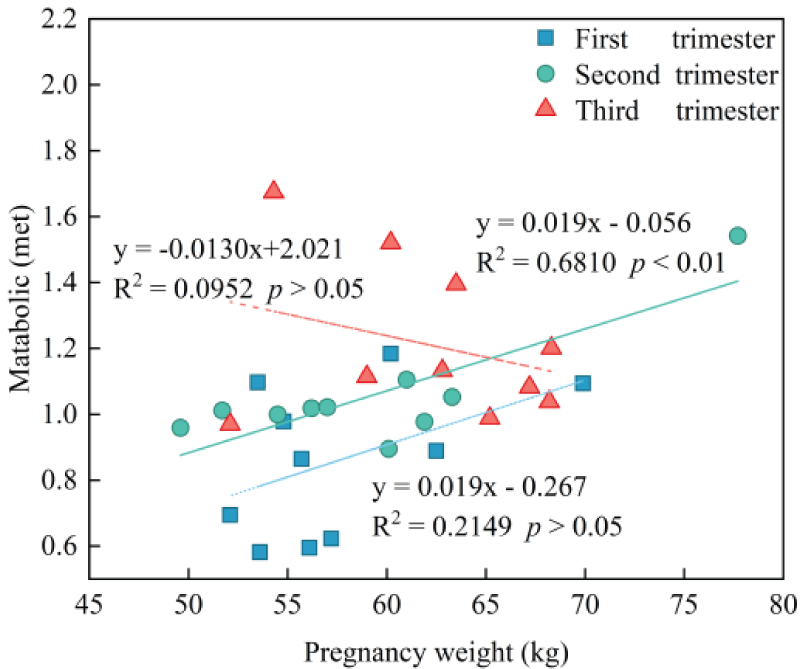
Correlations between metabolic rate and weight in the three trimesters.
Modification and validation of the PMV model based on metabolic rate
Further analysis revealed no significant correlation between age and metabolic rate across all trimesters (p > 0.05), indicating that the observed increases in metabolic rate are primarily due to gestational progression rather than age-related effects.
Figure 5 illustrates the variation trends of TSV and PMV with changes in Top. This study has demonstrated that the PMV exhibits a significant deviation from the actual TSV. To improve the predictive accuracy of the PMV model, this study introduced a modified model, referred to as PMVm. The modification entailed replacing the standard metabolic rate value of 1.0 met, as used in the conventional PMV model, with trimester-specific metabolic rates measured in this study according to different stages of pregnancy. The results presented indicate that a reduction in the predictive error of the PMVm model occurred exclusively during the third trimester of pregnancy. Specifically, the PMVm, which incorporated measured metabolic rates, reduced the MAE from 1.45 to 1.13 and the SD from 0.80 to 0.74, relative to the traditional PMV model. Consequently, the PMVm model achieved a 22% improvement in thermal comfort prediction accuracy and enhanced prediction stability by 6% compared to the original model.
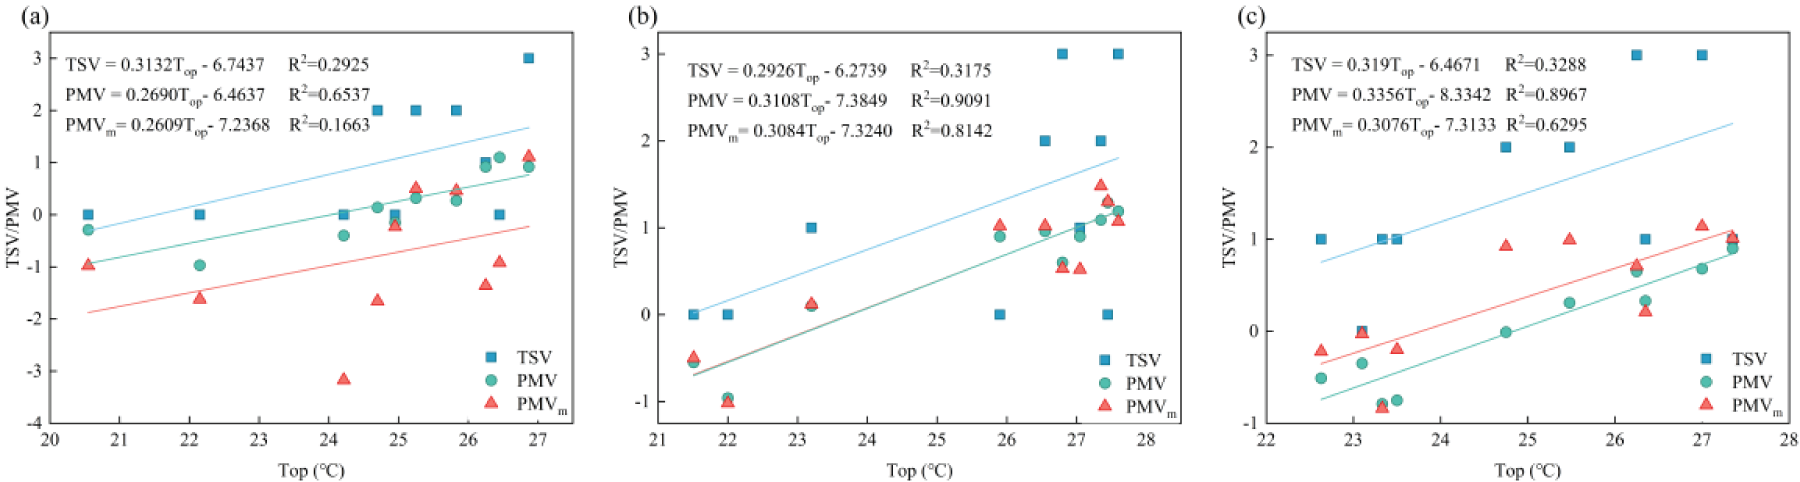
Comparison of PMV, PMVm and TSV in the (a) first trimester; (b)second trimester and (c) third trimester.
To validate the applicability of a small sample of measured metabolic rates to a large sample of thermal sensation data and evaluate the predictive performance of the PMVm across different seasons, we analysed field survey data collected throughout the four seasons. Figure 6 illustrates the relationships among the TSV, PMV and Top for all twelve combinations of the four seasons and the three trimesters. The size of the bubble indicates the sample size. 34 Results showed the PMV model is inadequate for predicting thermal sensation across the varying seasons and trimesters. This inaccuracy further substantiates the necessity of modifying the PMV model for application to various stages of pregnancy. Since seasonal variation has been demonstrated to have no significant effect on metabolic rate, 35 the metabolic rates measured for different trimesters of pregnancy in this study were integrated into the PMV model. This modified model is designated as PMVm (Figure 6).
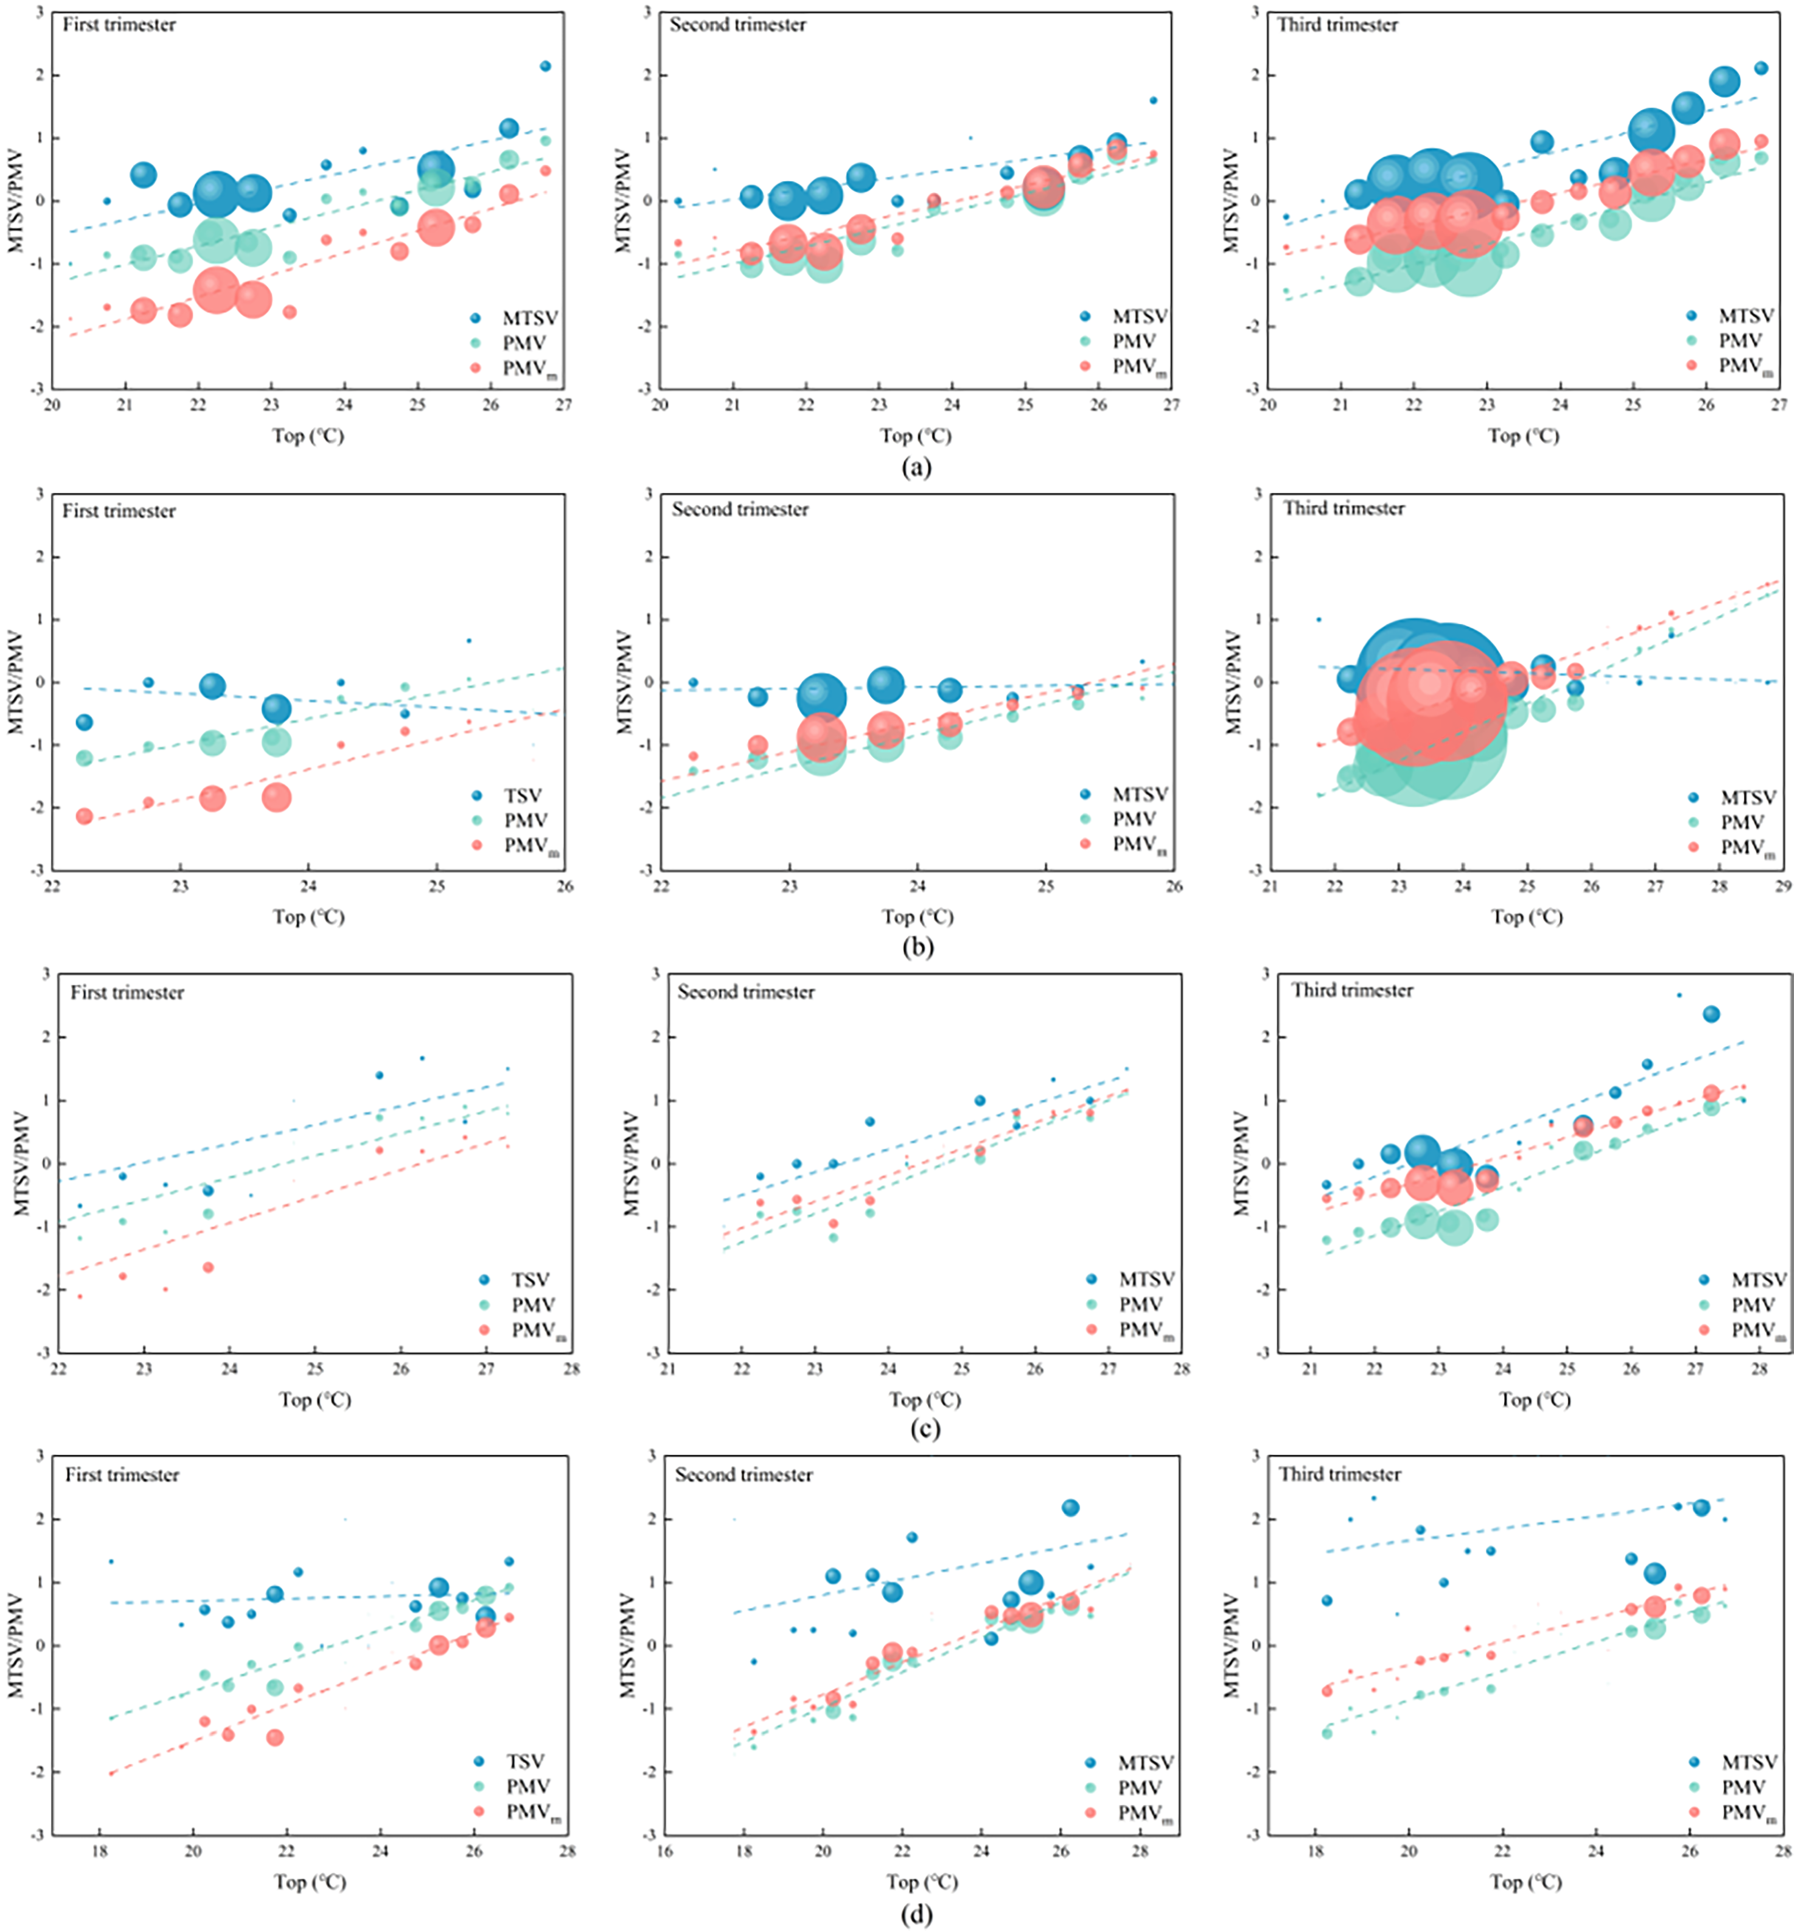
(a) spring; (b) summer; (c) autumn; (d) winter: different gestation stage models and top fitting.
As shown in Figures 7 and 8, the performance of the PMVm model was evaluated against the original PMV. In spring, predictive accuracy was improved by 12.9% and predictive stability by 5.6% during the second trimester of pregnancy, and by 32.0% and 7.8%, respectively, in the third trimester. In summer, the improvements were 18.2% for accuracy and 13.0% for stability in the second trimester of pregnancy, and 45.7% and 10.3%, respectively, in the third trimester. In autumn, predictive accuracy was improved by 9.1% and stability by 5.7% in the second trimester of pregnancy, and by 48.1% and 12.8%, respectively, in the third trimester. In winter, the predictive accuracy was improved by 6.0% and stability by 6.4% during the second trimester of pregnancy, and by 16.8% and 14.8%, respectively, in the third trimester.
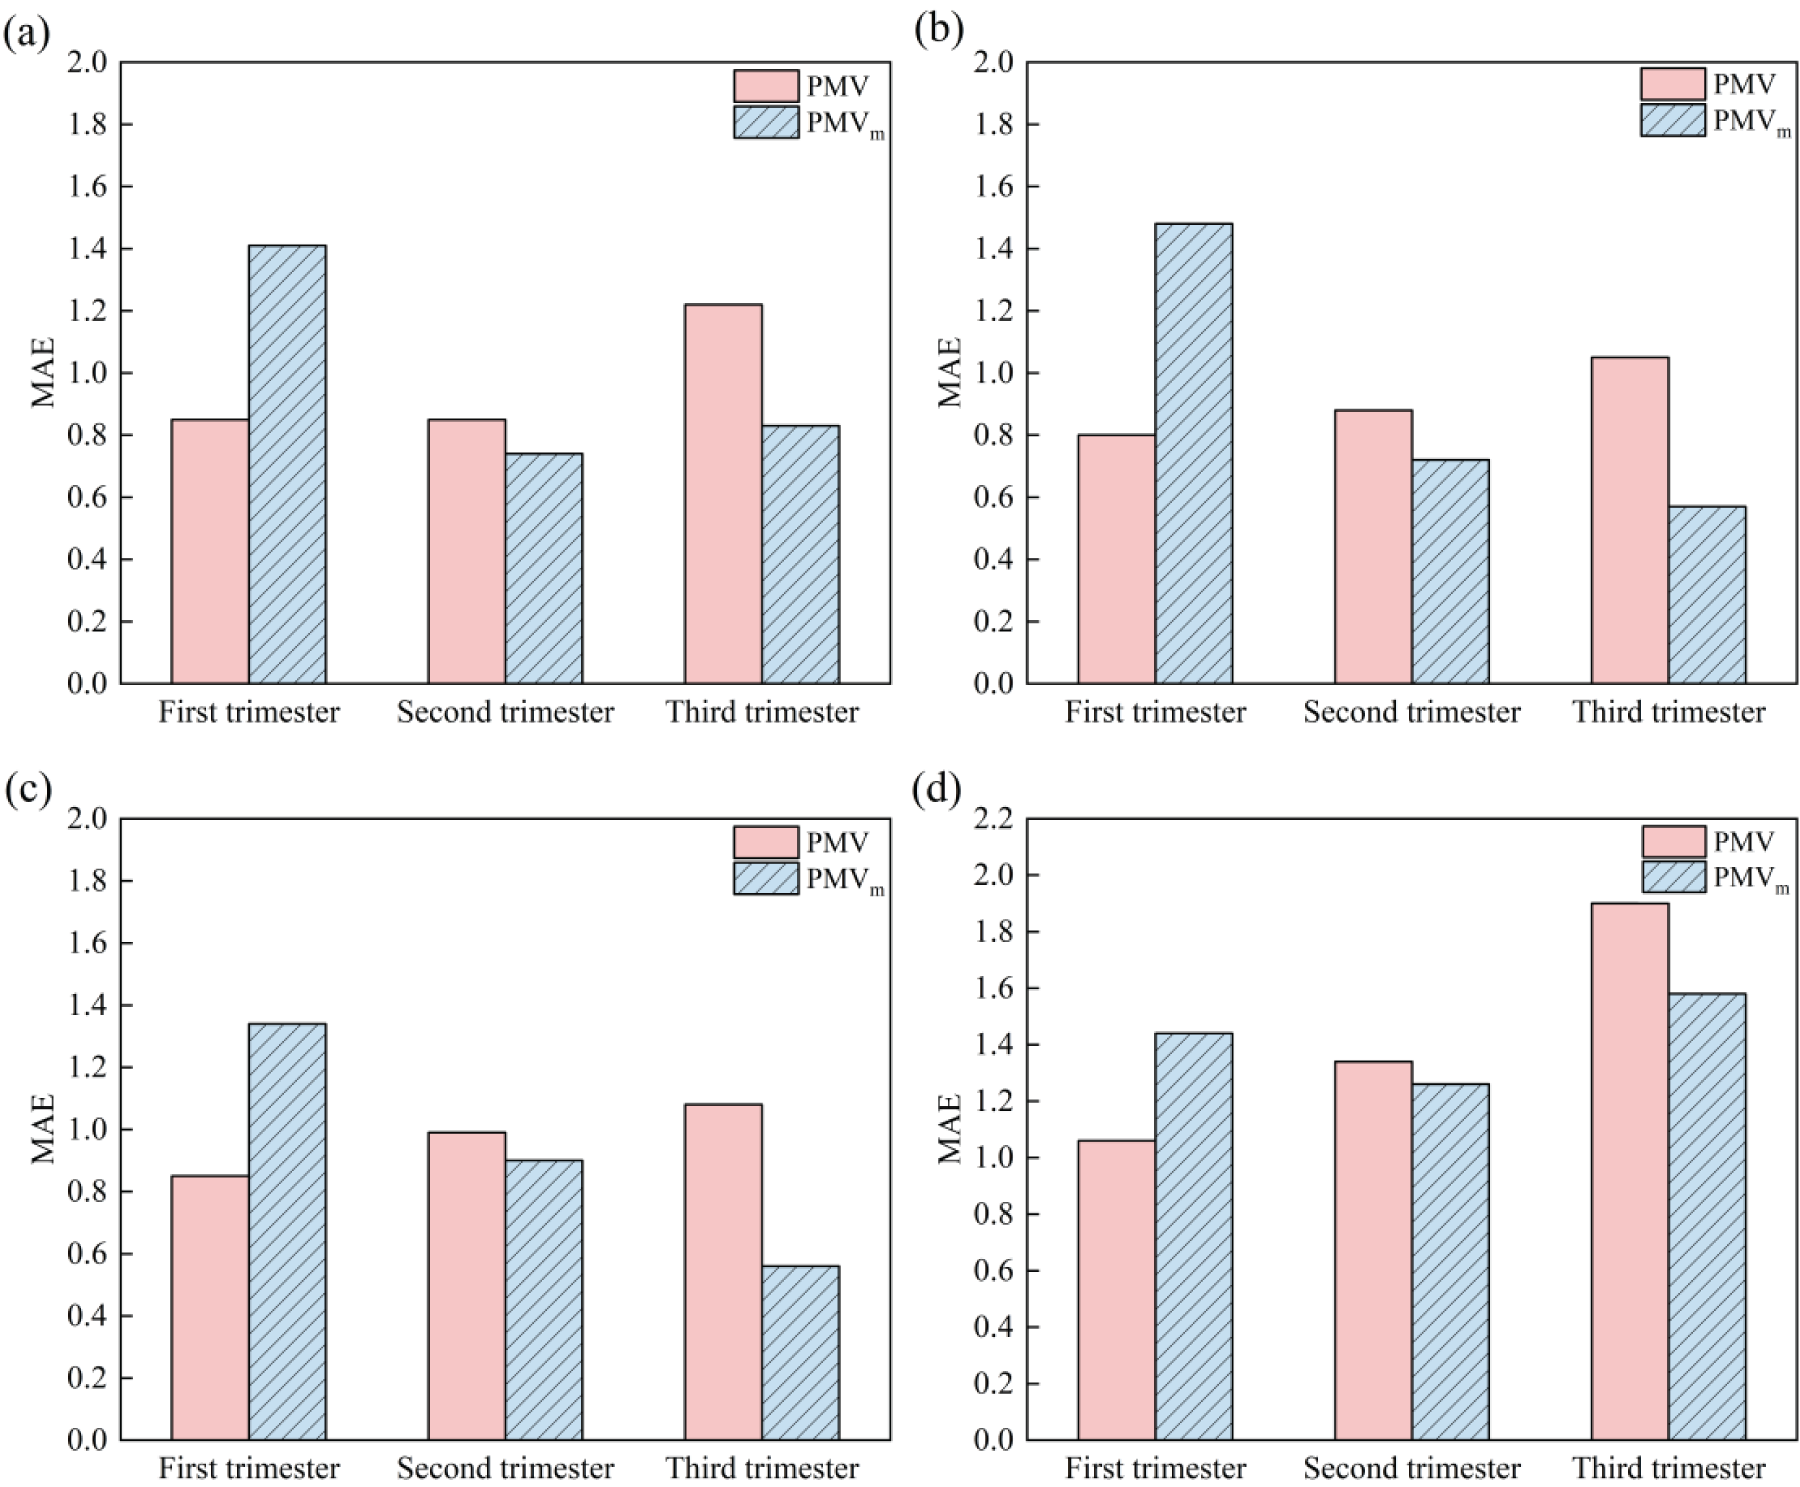
Comparison of model-predicted MAE for (a) spring; (b) summer; (c) autumn; (d) winter for three trimesters.
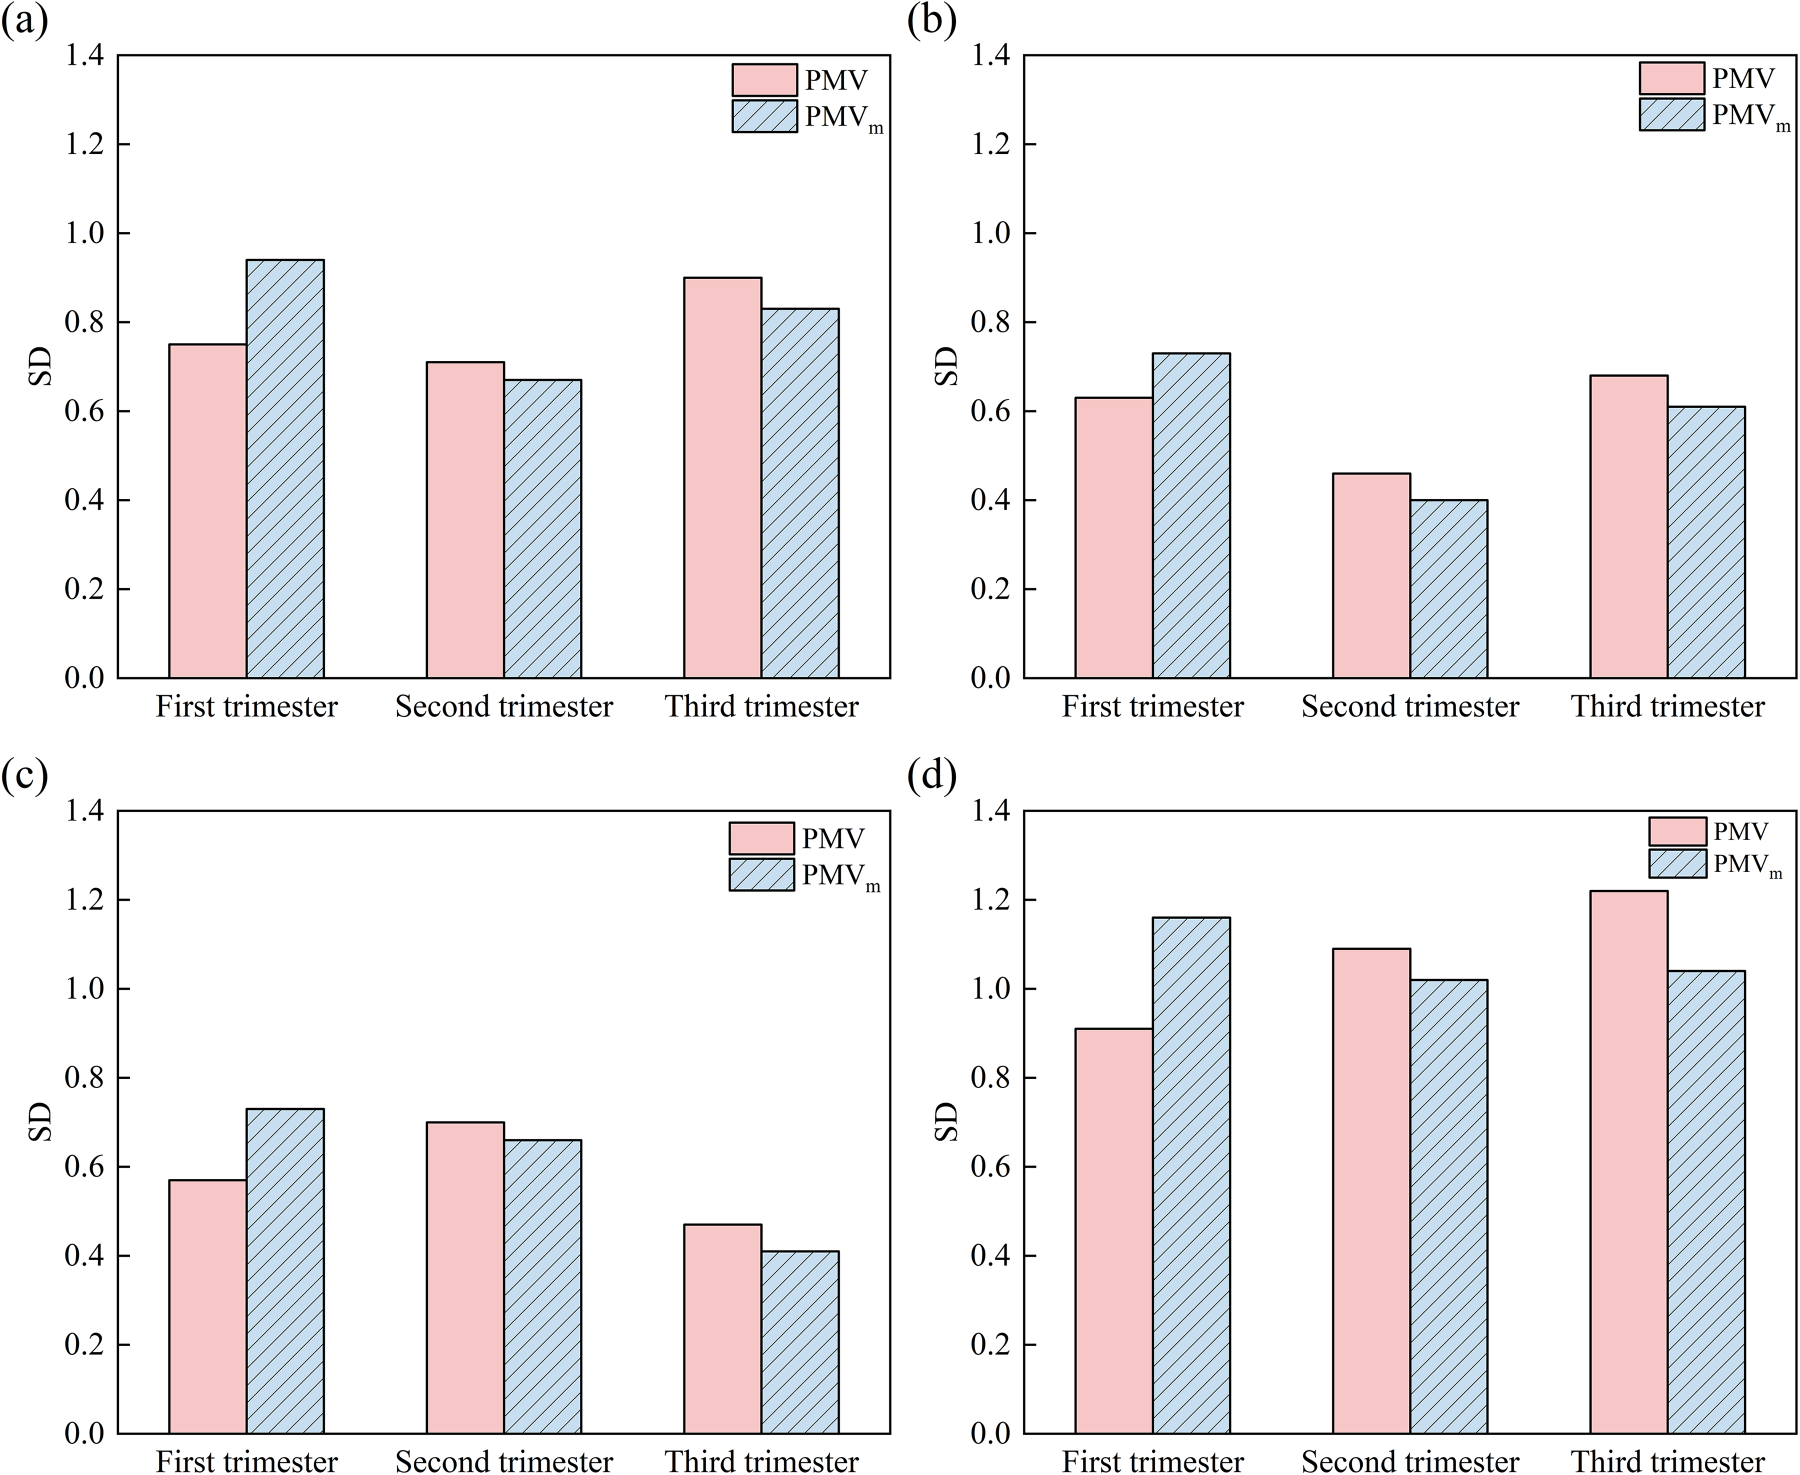
Comparison of model-predicted SD for (a) spring; (b) summer; (c) autumn; (d) winter for three trimesters.
Figures 6–8 summarize the seasonal validation results of the PMVm model across the three trimesters. The MAE and SD values varied by season and gestational stage. In general, the PMVm model showed a notable improvement in predictive accuracy and stability during the third trimester, particularly in summer and autumn, where MAE was decreased by up to 45.7% and 48.1%, respectively. In contrast, improvements in winter and spring were more modest. SD values also decreased across all seasons in the second and third trimesters, indicating enhanced stability of prediction. These seasonal variations in model performance likely stem from the different ranges of indoor thermal conditions encountered across the year, even within the climate-controlled hospital setting.
Modification and validation of the aPMV model based on thermal adaptation theory
Yao et al.
36
developed the adaptive PMV (aPMV) model. It has been proven to be suitable for climate-controlled environments.
37
Equation (10) is the corresponding equation.

The applicability of the aPMV model to pregnant women, a special population, remains unexplored, despite its previous use in hospital buildings.
38
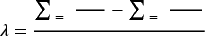
Extremely small TSV or PMV values in Equation (11) may lead to singularities in the inverse calculation. To circumvent this issue, Equation (12) was employed in this study, as it has been demonstrated to improve the accuracy of the aPMV model.
39
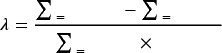
In this study, the actual survey data of pregnant women in four seasons of the year were substituted into Equation (12) to calculate ‘
Predictive performance of the aPMV model at different gestations in different seasons.
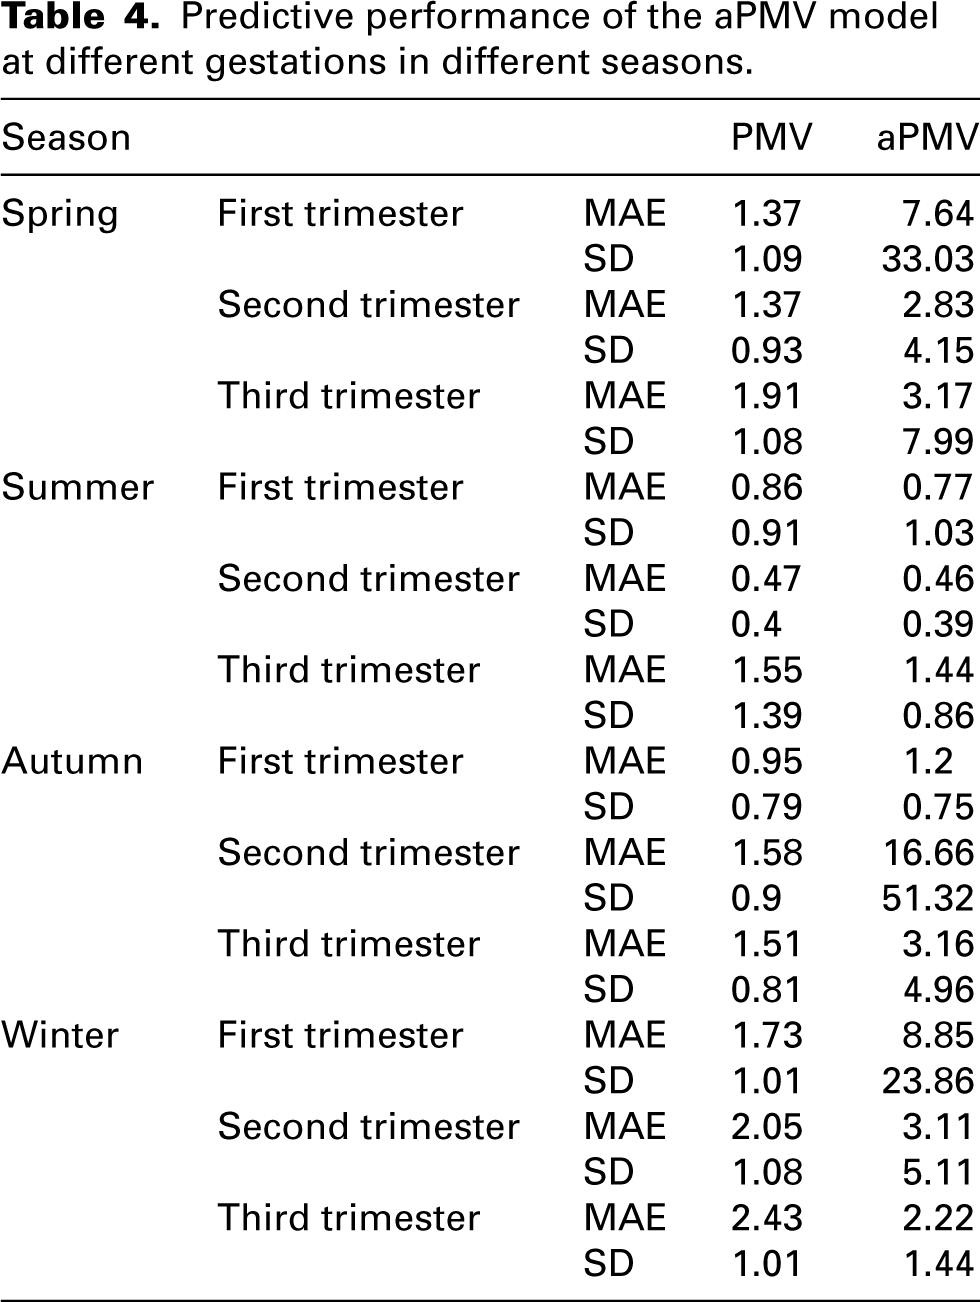
The results indicated that the aPMV yielded only marginal (negligible) improvement in predictive accuracy across all three trimesters of pregnancy in summer and during the third trimester of winter, while failing to adequately capture the complex interactions occurring during transitional seasons and in the first trimester.
Discussion
The characteristics and mechanisms of metabolic rate changes during pregnancy
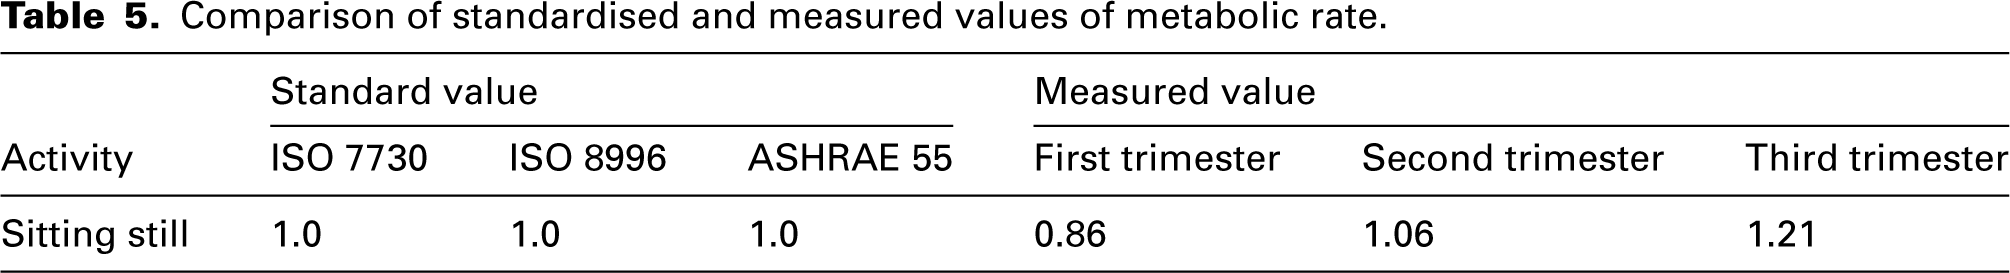
The present study identified significant differences in sitting-still metabolic rates amongst women at different gestational stages, exhibiting an increasing trend as gestation progressed (0.86 vs. 1.06 vs. 1.21 met). Table 5 compares the sitting-still metabolic rate values provided in ISO 7730, 17 ISO 8996 31 and ASHRAE-2023 18 with the measured data obtained in this study. The results indicate that the mean metabolic rate was 0.21 met higher than the standard value for third-trimester women and 0.14 met lower for first-trimester women. These differences may be attributed to the fact that the standards are primarily based on experimental data derived from young European and North American populations, whereas the subjects in this study were Chinese pregnant women.
Comparison of standardised and measured values of metabolic rate.
The increasing trend in metabolic rate throughout pregnancy is consistent with findings from previous studies.40,41 The low metabolic rate observed in the first trimester of pregnancy may be related to responses to severe vomiting in pregnancy. This is corroborated by the research conducted by Chihara et al., 42 who reported lower ventilation and oxygen consumption in pregnant women with severe vomiting. Metabolic rate exhibits a direct relationship with the body mass of pregnant women.
In contrast to the first and second trimesters, no significant correlation was observed between metabolic rate and current body weight during the third trimester (Figure 4). This may arise from several interrelated physiological adaptations characteristic of late pregnancy, though the limited sample size per group (n = 10) should also be considered as a potential factor affecting statistical power. 32 First, maternal metabolism may reach a relatively stable state during late pregnancy. At this stage, further weight gain primarily stems from foetal growth, increased amniotic fluid and other factors, with weight contributing relatively little to metabolic rate.40,43 Secondly, placental metabolism becomes increasingly dominant during this stage. The placenta functions as a highly active endocrine and metabolic organ, and its energy demands are regulated more by foetal needs and hormonal signals than by maternal weight per se. Consequently, the contribution of placental metabolism may partially decouple overall energy expenditure from maternal body weight. 44 These mechanisms indicate that body weight alone may be insufficient to predict metabolic rate during late pregnancy.
The core mechanism underlying the elevated metabolic rate during pregnancy is a complex hormonally regulated process, primarily driven by placental secretions. Human placental lactogen (hPL) acts synergistically with oestrogen, progesterone and cortisol to antagonize insulin function, thereby inducing maternal insulin resistance. This metabolic adaptation prioritizes the allocation of key nutrients, such as glucose, to the foetus via the placenta. 44 Additionally, substantial changes in maternal pulmonary and cardiovascular physiology occur to support the growth and maintenance of foetal, placental and uterine tissues. These physiological adjustments themselves consume increased energy, collectively elevating the basal metabolic rate. 45 The ultimate objective of these adaptive changes is to ensure continuous and adequate nutritional and energy supply for the foetus.
The characteristics of respiratory parameters change during pregnancy
Oxygen consumption rate, CO2 production rate and ventilation rate in the sedentary state exhibited an increasing trend throughout the progression of pregnancy, a finding consistent with previous studies. 46 Oxygen consumption rates (241.62 vs. 293.08 vs. 344.88 mL/min) and CO2 production rates (182.27 vs. 232.15 vs. 254.14 mL/min) increased significantly across trimesters. Increased energy expenditure in late pregnant women may be the main driver. There was also an increasing trend in respiratory rates (15.11 vs. 17.05 vs. 18.45 bpm), a trend that aligns with the results of Teli et al. 47 Tidal volume (0.6 vs. 0.64 vs. 0.65 L) increased across trimesters, in line with the study by Shailaja et al.48,49
Elisabet et al. 50 measured 22 European women in the third trimester of pregnancy via indirect calorimetry, reporting mean oxygen consumption rate and CO2 production rate of 264 mL/min and 249 mL/min, respectively. In our investigation, the mean oxygen consumption rate amongst third-trimester pregnant women markedly exceeded the values documented by Elisabet et al. 50 (p < 0.01). Although the mean CO2 production rate was also elevated, the difference was not statistically significant. Zhai et al. 51 measured 30 Chinese female university students via indirect calorimetry, reporting mean oxygen consumption rate and CO2 production rate of 241.8 mL/min and 189.5 mL/min, respectively. The present study observed lower first-trimester metabolic rates but significantly higher second- and third-trimester rates (p < 0.05) compared to Zhai et al. 51 These results indicate that pregnant women consume more oxygen and produce more CO2 than their non-pregnant counterparts.
Comparative analysis of model performance
The PMVm model proposed in this study has modified the traditional PMV model by incorporating measured metabolic rates, aiming to more accurately reflect pregnant women's thermal comfort perceptions across different gestational stages of pregnancy. Validation results using thermal sensation data across different seasons indicate that the PMVm model's predictive improvement is limited. Despite incorporating metabolic rates across different gestational periods, the PMVm model failed to improve predictive accuracy during the first trimester across all four seasons (Figures 5–8). This limited improvement in early pregnancy suggests that metabolic rate alone is insufficient to explain thermal perception at this stage. Psychologically, the first trimester is often accompanied by anxiety, uncertainty or heightened somatic awareness, 52 which may modulate subjective thermal evaluation independently of actual thermal conditions.
Physiologically, early pregnancy is characterized by hormonal fluctuations, —particularly elevated progesterone and human chorionic gonadotropin (hCG), —which can influence thermoregulatory set points and vasomotor responses. 53 Therefore, while metabolic rate adjustments can enhance the accuracy of models for late pregnancy, the accuracy of models for early pregnancy appears to be governed by more complex interactions between physiological and psychological variables.
In contrast, the notable improvement of the PMVm model during the third trimester can be directly attributed to physiological mechanisms. As metabolic rates were significantly increased in the third trimester, PMVm could more accurately reflect the actual rise in heat production within pregnant women by adjusting metabolic rate inputs, thereby narrowing the gap between TSV and PMV.
The limited improvement demonstrated by the PMVm model during the third trimester, coupled with the persistent gap between model predictions and actual TSV, collectively indicates that elevated metabolic rate is one of the key physiological drivers causing TSV deviation from traditional PMV predictions in pregnant women, particularly during the third trimester. This necessitates model refinement. However, this discrepancy also clearly demonstrates that a single metabolic rate parameter is insufficient to fully capture the entirety of thermal sensation changes during pregnancy. Therefore, the incremental improvements achieved through metabolic rate adjustments in this study have validated the validity of a physiology-based approach. Simultaneously, they point to a direction for future research: the need to establish a dedicated thermal comfort model framework for pregnant women that integrates multiple physiological and psychological parameters.
The aPMV model demonstrated limited applicability in this study. This limitation can be attributed to several factors: the aPMV model was originally developed under the assumption that physiological adaptations exert a weaker influence on thermal comfort than psychological and behavioural adaptations. 37 However, subsequent research has demonstrated that physiological adaptations play a more critical role than either psychological or behavioural adjustments. 54 Given that both physiological55,56 and psychological 52 states undergo significant fluctuations during pregnancy – and considering that such physiological parameters were not incorporated into the aPMV model – its corrective capacity remained limited. Additionally, the model's inherent constraints may contribute to this shortcoming, as it was primarily designed for predictive correction in non-neutral environments and requires cautious application when TSV = 0 or PMV = 0. 54 The inadequacy of the aPMV model underscores the necessity of incorporating physiological parameters, such as metabolic rate, into PMV model corrections for pregnant women.
In response to these limitations, we did not attempt to directly integrate our measured metabolic rates into the aPMV framework because its formulation is not designed to accommodate such physiological inputs; it operates solely on the relationship between PMV and TSV to derive an adaptive coefficient. Our findings therefore suggest that the standard aPMV model is not merely inaccurate but is inherently unsuitable for pregnant women in its current form, as it cannot capture the dominant physiological drivers of thermal comfort during pregnancy.
Given the fundamental limitations of the conventional aPMV framework in capturing pregnancy-specific physiological adaptations, future efforts should move beyond simple coefficient fitting and towards a hybrid modelling approach that integrates gestation-stage physiological parameters into adaptive thermal comfort frameworks. One promising direction is the development of a physiology-enhanced adaptive PMV model, which incorporates trimester-specific metabolic rates and respiratory parameters as explicit inputs rather than implicit adaptive coefficients. Such a model would retain the adaptive theory's strength in accounting for behavioural and psychological adjustments while grounding its predictions in measurable physiological changes.
Practical implications for HVAC design in outpatient waiting areas
The metabolic rates measured in this study provide quantitative evidence for revising HVAC design strategies in outpatient waiting areas. Current standards (1.0 met)17,18,31 underestimate metabolic heat production during mid- and late-pregnancy by 0.06–0.21 met, causing pregnant women to feel excessively warm in conventional air-conditioned environments. For spaces primarily occupied by late-pregnancy women, appropriately lowering the temperature setpoint can more effectively achieve thermal neutrality while avoiding energy waste from excessive cooling or heating. 57 Additionally, the 30–40% increase in CO2 production rate during late pregnancy suggests that ventilation design should be re-evaluated. 58 Incorporating these pregnancy-specific physiological parameters into building performance simulation tools would enable more personalized and energy-efficient environmental control in healthcare facilities.
Limitations
Considering the health and safety of the subjects, this study was limited to measuring the sedentary metabolic rate of pregnant women in a comfortable environment. Consequently, metabolic rates under different thermal conditions and common activity states were not investigated.
Although pre-pregnancy BMI was controlled, gestational weight gain and age may introduce individual variability in metabolic responses. Future studies with larger samples stratified by age and body composition could further elucidate these demographic influences.
Additionally, while the sample size met the statistical power requirements for detecting differences across trimesters, the limited number of participants per trimester may not fully capture inter-individual variability in metabolic response. Future studies with larger cohorts are recommended to enhance generalizability.
Conclusion
In this study, 30 pregnant women with a pre-pregnancy BMI within the normal range (18.5–24 kg/m2) and at varying gestational stages were selected to measure their metabolic rates and respiratory parameters under sedentary conditions. The principal findings are as follows: Significant differences were observed in the oxygen consumption rate, CO2 production rate, metabolic rate, metabolic heat production, and respiratory rate across the three trimesters. The respective mean metabolic rates were 0.86, 1.06 and 1.21 met. Corresponding values for oxygen consumption rates were 241.62, 293.08 and 344.88 mL/min; for CO2 production rates, 182.27, 232.15 and 254.14 mL/min; for metabolic heat production, 82.21, 95.70 and 112.79 W; and for respiratory rate, 15.11, 17.05 and 18.45 breaths per minute. In contrast, neither ventilation nor tidal volume demonstrated significant differences across the groups. Mean ventilation values were 9.11, 10.89 and 11.7 L/min, while mean tidal volumes were 0.60, 0.64 and 0.65 L. Compared with the sedentary metabolic rate specified in ISO 7730, ISO 8996 and ASHRAE 55-2023, the metabolic rate in the first trimester of pregnancy was 0.14 met lower than the standard value, while that of women in the second and third trimesters of pregnancy was 0.06 met and 0.21 met higher, respectively. Compared with the average Chinese woman, oxygen consumption rate and CO2 production rate were not significantly different in the first trimester of pregnancy, but were 51.28 mL/min and 42.11 mL/min higher in the second trimester of pregnancy, and 103.08 mL/min and 65.12 mL/min higher in the third trimester of pregnancy. Under the experimental conditions of metabolic rate testing, the PMVm model, incorporating a corrected metabolic rate, demonstrated a 22% improvement in thermal comfort prediction accuracy and a 6% enhancement in prediction stability during late pregnancy. Further validation using year-round field survey data revealed seasonal variations in model performance, with the most pronounced improvements in accuracy during the third trimester occurring in summer and autumn (45.7% and 48.1%, respectively), whilst improvements in winter and spring were more moderate. Furthermore, the aPMV model, developed based on conventional adaptive theory, was found to be inapplicable to thermal comfort model adjustments for pregnant women.
Footnotes
All authors contributed equally in the preparation of this manuscript.
Declaration of conflicting interests
The authors declared no potential conflicts of interest with respect to the research, authorship and/or publication of this article.
Ethics statement
The research protocol was reviewed and approved by the Ethics Committee of Xi'an People's Hospital (Xi'an Fourth Hospital) (Approval No. KJLL-H-K-2024017). Written informed consent was obtained from all subjects before their inclusion in the study.
Funding
The authors disclosed receipt of the following financial support for the research, authorship, and/or publication of this article: This work was supported by the National Natural Science Foundation of China (grant number 52378106).