
Abstract
Ethnic diversity is portrayed in the literature as a threat to a community’s ability to regulate the behaviour of its members. While there is no shortage of studies examining the effects of ethnic diversity on the social processes important for crime control, findings are inconclusive across national contexts. Further, definitional issues associated with ‘ethnicity’ make cross-cultural comparisons difficult. Using Australian Community Capacity Study survey data from 4091 respondents in 147 Brisbane suburbs, combined with census and police incident data, multivariate regression techniques are utilised to determine the extent to which ethnic diversity influences collective efficacy once we control for other known correlates; and which aspect of diversity ‘matters most’ to levels of collective efficacy. Specifically, we consider the relationship between the diversity or concentration of language, religion and country of birth and collective efficacy. Results indicate that the presence of language diversity and indigeneity in the community are most detrimental to collective efficacy.
In Europe, the United States and Australia, there is significant concern regarding the effect of growing ethnic diversity on the processes necessary for social organisation (Andrews, 2007; Gijsberts et al., 2011; Percival and Currin-Percival, 2013; Twigg et al., 2010). Robert Putnam (2007: 149) states that ethnic diversity challenges social solidarity as it encourages those living in ethnically diverse neighbourhoods to ‘hunker down’ or withdraw, in turn encouraging the distrust of others and reducing social interaction and participation within the community. Studies support this association in the United Kingdom and the United States (Alesina and La Ferrara, 2002; Laurence, 2011; Letki, 2008; Putnam, 2007; Taylor et al., 2010), Sweden (Sampson and Wikström, 2008), the Netherlands (Gijsberts et al., 2011) and Belgium (Lancee and Dronkers, 2011). Recent research in Australia also demonstrates the negative relationship between the presence of minority ethnic groups, neighbourhood social capital and neighbourhood informal social control (Leigh, 2006; Wickes et al., 2013).
In this article, we consider the relationship between ethnic diversity and collective efficacy. Collective efficacy refers to social cohesion among neighbours, and the willingness of local residents to intervene on behalf of the common good (Sampson et al., 1997). Sampson and colleagues (1997) argue that residents living in even the most diverse neighbourhoods can share common goals, such as the desire to create a safe and orderly environment in which to live. Although some research is beginning to unpack the relationship between ethnic diversity and collective efficacy, we extend this scholarship in two ways.
First, what we know about the ethnic diversity–collective efficacy link is primarily based on research in the United States, where race, as opposed to ethnicity, is the predominant focus. Studies such as Sampson et al. (1997) and Putnam (2007) request participants to mark one racial category with which they most identify, such as black, white, Hispanic or Asian. Moreover, these racial and ethnic groups often live in highly segregated communities. Segregated neighbourhoods are harmful to race relations as they encourage racial isolation (Massey, 2001), which in turn may impact residents’ perceptions of collective efficacy. Studies that focus on race alone do not focus on other differences between and within groups. For example, focusing on race as the main difference between groups obscures the effect of other, perhaps more important characteristics of ethnic difference, on collective processes.
Second, unlike qualitative studies of ethnic diversity, many of the quantitative studies that examine the relationship between ethnic diversity and social processes treat ethnic diversity rather unproblematically and include one measure of diversity, such as country of birth, nominated ancestry, religion or language spoken at home (Gijsberts et al., 2011; Lancee and Dronkers, 2011; Laurence, 2011). In the neighbourhood effects literature, studies rarely consider more than one of these markers of ethnicity. Thus the relationship between ethnicity, as a multi-dimensional concept, and collective efficacy remains unclear.
In this article, we examine the effect of language, country of birth and religion on neighbourhood collective efficacy. Controlling for other area-level socio-demographic characteristics, we further consider whether it is the diversity or concentration of these aspects of ethnicity that matters most for generating a sense of cohesion and an expectation to work together to solve local problems. We integrate administrative data with survey data from over 4000 residents living across 148 suburbs in Queensland, Australia.
Literature review
A long history of research examines how ethnic diversity impacts upon the mechanisms necessary for social organisation. In their pioneering neighbourhood study, Shaw and McKay (1969) found a strong relationship between levels of crime and delinquency and ethnic heterogeneity. Yet high delinquency rates continued in certain neighbourhoods for long periods of time, despite changing ethnic compositions, suggesting that ‘race’ did not cause crime (Shaw and McKay, 1969). Instead it was argued that socially disorganised neighbourhoods were those with poor social stability, weak social controls and an inability to generate collective action to solve local problems (Kubrin and Weitzer, 2003).
In the last two decades, social disorganisation research has considered links between neighbourhood characteristics and key processes associated with regulation of unwanted behaviour. Most prominently, Sampson and colleagues (1997) suggest that the socio-demographic composition of the neighbourhood influences crime indirectly through its impact on social regulatory processes. They propose that a neighbourhood’s collective efficacy, or the degree to which neighbours shared a working trust and a willingness to work together to solve local problems, more comprehensively explains differences in crime rates across geographical communities than demographics alone (Sampson et al., 1999). From this perspective, the relationship between the concentration of immigrant groups and social problems is indirect, operating through the communication of shared values and expectations for action.
In the broader sociological literature, considerable attention has been paid to the relationship between disadvantage, diversity and a range of social processes necessary for the regulation of unwanted behaviour in the neighbourhood. Empirical research suggests that ethnic and racial heterogeneity in a neighbourhood are associated with decreased interpersonal trust, social interaction, participation in civic activities/organisations, and increased social anxiety (Alesina and La Ferrara, 2000; Goodhart, 2004; Putnam, 2007). This is evidenced not only in the United States, but also in Canada (Stolle et al., 2008), the United Kingdom(Laurence, 2011; Letki, 2008), the Netherlands (Lancee and Dronkers, 2011; Tolsma et al., 2009) and Australia (Leigh, 2006; Wickes et al., 2013). These problems then lead to problems in the creation of forms of social capital, such as cooperation and support necessary for collective action, social cohesion and solidarity.
While research from the United Kingdom and Europe highlights the negative impact of ethnic or racial heterogeneity in a neighbourhood, research consistently demonstrates that economic deprivation is more strongly associated with decreased social cohesion in these countries (for example Laurence, 2011; Tolsma et al., 2009; Twigg et al., 2010). Resource threat theories propose that diversity undermines cohesiveness in communities where a majority group feel they are competing against incoming minority groups for access to resources (Brief et al., 2005). This intergroup hostility is detrimental to trust and neighbourhood cohesion.
Yet Sampson et al. (2002) argue that even neighbours who reside in impoverished and culturally diverse neighbourhoods can and do agree on what aspects are important for neighbourhood safety. He suggests that cultural and language barriers associated with ethnically heterogeneous communities mean that these beliefs cannot be conveyed. There is some evidence of this in the wider literature. In Australia, Leigh (2006) contrasted the effects of ethnic and linguistic heterogeneity on trust in communities. Leigh (2006) created an index of ethnic heterogeneity using participants’ country of birth, and an index of linguistic diversity based on language spoken. He found a strong negative relationship between localised trust and ethno-linguistic fractionalisation, suggesting that linguistic diversity within a community hinders trust levels. This relationship was less significant for country of birth, suggesting that a shared ethnic heritage may be less important for localised trust than the ability to communicate effectively (see also Wickes et al., 2013).
Examining difference in a multi-ethnic society
In the neighbourhood effects literature, race is often used as an indicator of difference. Race, as defined in the literature, denotes a biological category of visual difference of skin colour (Gabbidon, 2010). Yet there is much debate as to whether there are truly distinct races that warrant different classifications (Green, 2006). Anthropologists have long argued that ‘there are no clearly isolatable populations of human beings that vary from one another significantly on … physical dimensions’ (Meneses, 1994: 139). As humans share 99.9% of their genetic make-up (Gabbidon, 2010), race is a construct used to identify people based on physical appearance.
Although race and ethnicity are often inaccurately treated as interchangeable constructs (Baer et al., 2012), ethnicity refers to the cultural traits of a given group of people (Brown, 1986). It highlights the shared historical, linguistic and cultural values of a group rather than denoting a membership based on alleged biological attributes (Burgess, 1978). There are different definitions of ethnicity in the literature, yet most scholars would agree that the concept of ethnicity incorporates several forms of collective identity including cultural, religious and national identities (Castles, 1995, 2000; Jakubowicz et al., 1984; Nagel, 1994; Nash, 1996). Like race, ethnicity is a social construct and as a consequence group belonging can, at times, be arbitrary (Nagel, 1986).
In multi-ethnic settings, the concept of ethnicity is widely used to examine differences between groups (eg Blum et al., 2000; Colic-Peisker, 2009; Contrada et al., 2001). Yet, in contrast to qualitative studies of ethnicity that emphasise the multi-dimensionality of the construct (e.g. Caperchione et al., 2011; Carmichael and Whittaker, 2007), few quantitative studies consider more than one dimension of ethnicity when examining its impact on neighbourhood social processes (see Lancee and Dronkers, 2011; Leigh, 2006 for exceptions). Skin colour is one dimension that differentiates between majority and minority populations, yet country of birth may also affect neighbourhood social dynamics. In multicultural English-speaking nations, speaking a language other than English may represent another important dimension of ethnicity. Language is strongly tied up with ethnicity and nationhood and, as Sniderman and Hagendoorn (2007) note, it can be viewed as a source of cultural threat in some contexts. In the Australian context, language is an important dimension of ethnicity as a common language enables access and social participation (Lo Bianco, 1990).
An additional dimension of ethnicity that is often overlooked in the neighbourhood effects literature is religion. Globally, religious differences are a major trigger of prejudice and bias. Using data from the European Social Survey, Hjerm and Nagayoshi (2011) find that increases in Muslim population are strongly related to xenophobic attitudes. In Australia, scholars also identify similar patterns of Islamophobia where anti-Muslim sentiment is high (Dunn, 2009; Poynting and Mason, 2007; Saniotis, 2004).
Considering that ethnicity is a multi-dimensional construct, and one that is distinct from race, we argue there is a need to better understand the various dimensions of ethnicity that might be important for social processes, like collective efficacy. Across various studies, language, ancestry and/or religion have been identified by Australians as markers of difference (Borland, 2006; Johnstone and Kanitsaki, 2008; Noble et al., 1999). We believe that the inclusion of multiple measures of ethnicity will illuminate whether collective efficacy is impacted by the visibility of certain minority groups in the community or whether there are practices, like language or religion, which might impede community participation. This examination is essential in determining why the presence of ‘different’ people in the community hinders the development of community regulation.
Methodology
This article draws on survey data from the Australian Community Capacity Study (ACCS), a longitudinal panel study of urban communities supported by Australia Research Council funding (Mazerolle et al., 2007; Wickes et al., 2011). The overarching goal is to understand and analyse the key social processes associated with the spatial variation of crime and disorder across urban communities over time. We use data collected in the second wave of the ACCS (2008) in the Brisbane Statistical Division (BSD). The Brisbane ACCS sample comprises 148 randomly drawn neighbourhoods with a residential population ranging from 245 to 20,999 (total neighbourhoods in the BSD = 429 with residential population ranging from 15 to 21,001).
Brisbane is the third largest city in Australia with a population of approximately 2 million (ABS, 2014). It has one of the largest metropolitan Indigenous populations in Australia and its immigrant composition has been shaped by two distinct post-war immigration waves. The first wave occurred between 1950 and the early 1970s and comprised persons originating from English-speaking countries (Hugo, 1995), with stable populations of immigrants arriving between 1954 (12%) and 1976 (13.1%). In the late 1980s, Queensland experienced a second influx of immigrants (increasing to 15% of the population) with 5.8% of Queenslanders speaking a language other than English at home. Although immigrants predominantly came from English-speaking countries during this time, there was a significant increase in arrivals from South and East Asia (Burnley, 2001). In recent years, the immigrant population of Queensland broadly, and Brisbane specifically, has steadily increased and diversified. In 2011, 29.7% of the population was born overseas and 17.9% spoke a language other than English at home (ABS, 2014).
The ACCS survey participants
The Brisbane ACCS sample comprises 4404 participants. The Wave 2 participant sample includes a longitudinal sample and a top-up sample. The participant sample for Brisbane employed in this study comprises respondents from Wave 1 (N = 1077) and a randomly selected top-up sample (N = 3149). The survey was conducted from September 2007 and May 2008 by the Institute for Social Science Research at the University of Queensland. Trained interviewers used computer-assisted telephone interviewing to administer the survey which lasted approximately 20 minutes. The in-scope survey population comprised all people aged 18 years or over who were usually resident in private dwellings with telephones in the selected neighbourhoods.
Administrative data
In our analyses we control for a range of neighbourhood socio-structural characteristics as well as prior crime rates. Thus, in addition to the ACCS survey data, we use census data from the ABS and police incident data from the Queensland Police Service (QPS). These measures are described in further detail below.
Variables
Collective efficacy
The collective efficacy scale within the ACCS comprised 10 items derived from the Project on Human Development in Chicago Neighbourhoods (PHDCN; Sampson et al., 1997), with item responses being combined to create a collective efficacy score (α = 0.7681; see Appendix 1 for items). For each statement, respondents rated (coding values in parentheses) ‘very unlikely’ (1), ‘unlikely’ (2), ‘don’t know’ (3), likely (4) and ‘very likely’ (5). This measure was then aggregated to a mean of each suburb.
Neighbourhood measures of ethnicity
The review of the literature identified several measures of ethnicity previously used to examine neighbourhood trust, cohesion and collective efficacy. These previous measures include place of birth, language spoken at home, religion and nominated ancestry. Some studies utilise a concentration measure of ethnicity, while others use examine the range of diversity within each community. As a result, we consider concentration and diversity measures in our analyses. All measures of ethnicity were derived from census data obtained from the Australian Bureau of Statistics (ABS, 2007). Descriptive statistics for the sample are summarised in Table 1.
Descriptive statistics.
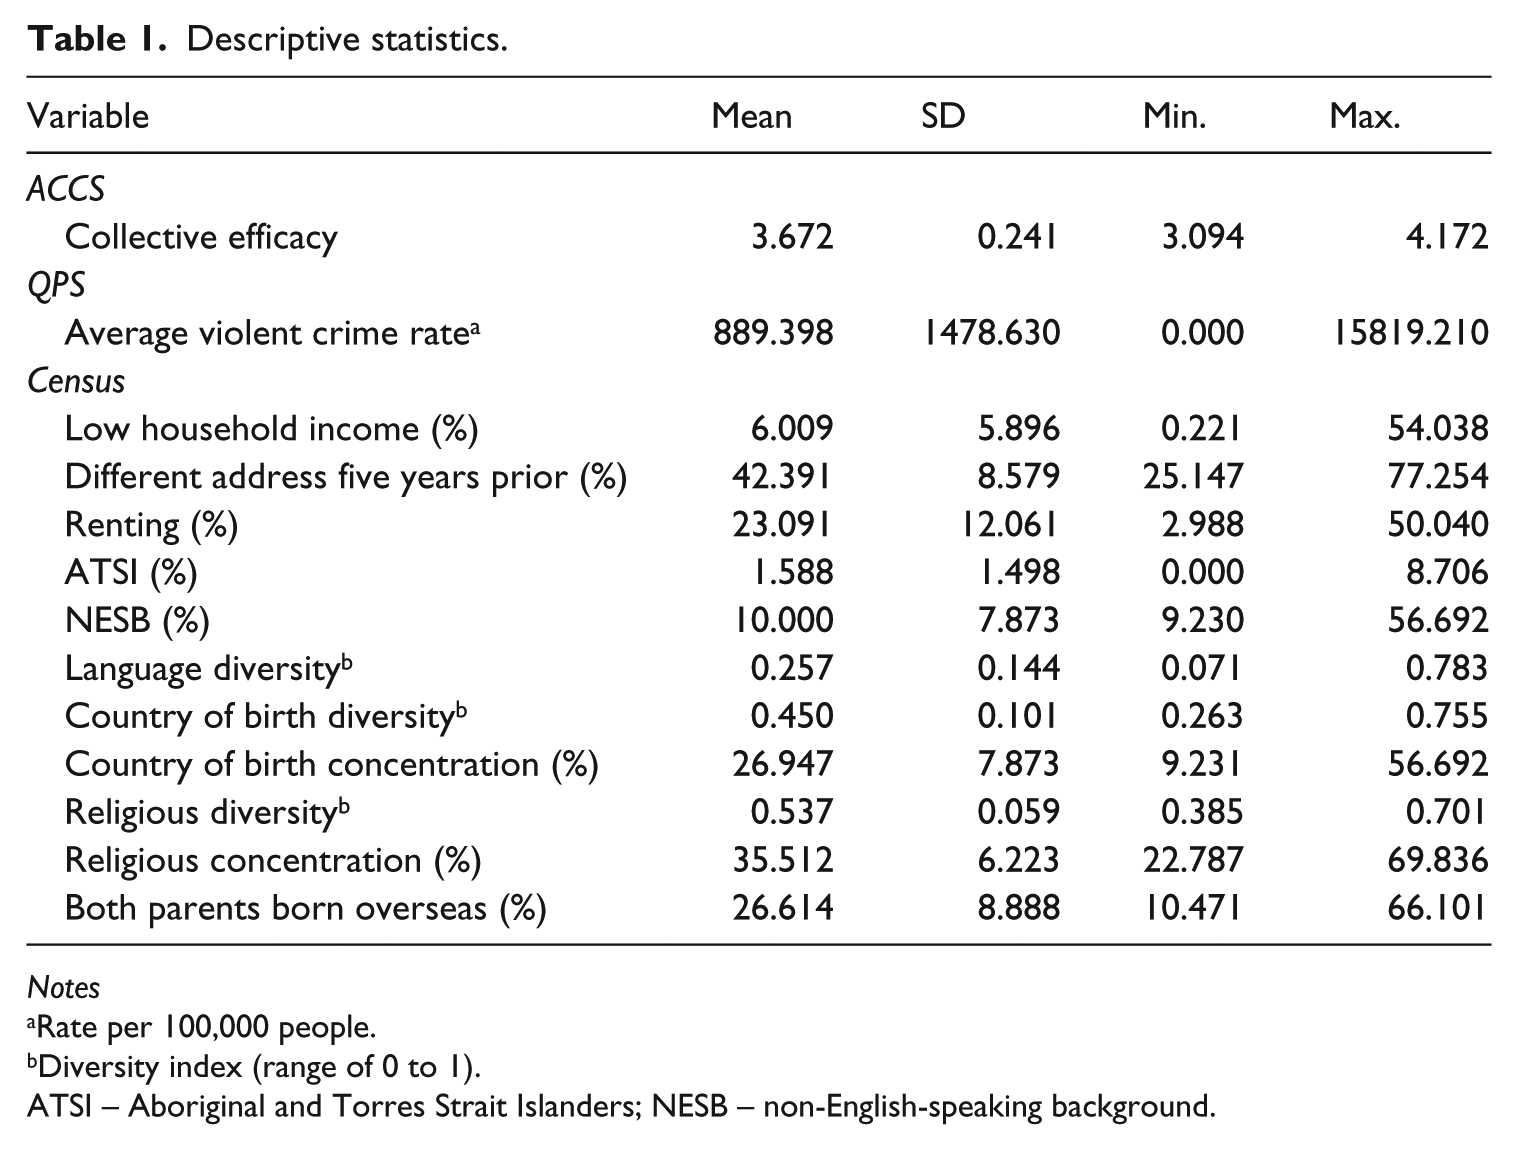
Notes
Rate per 100,000 people.
Diversity index (range of 0 to 1).
ATSI – Aboriginal and Torres Strait Islanders; NESB – non-English-speaking background.
Non-English-speaking background
We created a percentage of concentration of language by calculating the number of people speaking a language other than English and dividing by the suburb population.
Language diversity
The census recorded the nominated language spoken at home for each respondent. In the Australian Bureau of Statistics data, classification categories were Northern European Languages, Southern European Languages, Eastern European Languages, Southwest and Central Asian Languages, Southern Asian Languages, Southeast Asian Languages, Eastern Asian Languages, Australian Indigenous Languages, or other. Each of these categories was divided by 100 to obtain a proportion of the suburb, then each squared and summed. This number was subtracted from 1 to create a Blau index of diversity with the objective of identifying scores between 0 and 1 to indicate low and high diversity respectively (Blau, 1977). Thus, the formula for this index is:
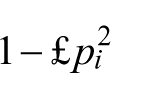
where pi is the proportion within group i. This value was then added to the dataset.
Country of birth diversity
We examined country of birth (COB), recorded in the ABS regions of Oceania, North-West Europe, Southern and Eastern Europe, North Africa and the Middle East, South-East Asia, North-East Asia, Southern and Central Asia, the Americas, Sub-Saharan Africa.1, 2 After further separating Oceania into those born in Australia and other Oceania, we used these figures to create a Blau index using the formula above.
Country of birth concentration
Census data was used to calculate a percentage of those not born in Australia by adding all regions except Australia together.
Religious diversity
Religion is not a frequently used measure of diversity within the existing literature, however we suggest that religious groups are likely to share attitudes instilled by their beliefs and that groups encourage communication with like-minded citizens. While the presence of these groups within the community may encourage shared values and therefore increase collective efficacy, the opposite may also be true. With a number of terrorist attacks having occurred around the world, religious minorities within the community have been met with conflict and become the target of violence in Western countries (Ghanea et al., 2010; Griffiths and Pedersen, 2009; Poynting and Mason, 2007). Thus, it may be that a visible presence of religion, such as Islamic practices of women being veiled in public, may hinder community cohesiveness.
The 2006 census data recorded religion of each individual within the suburb. Data detailing the percentage of each religion was obtained for categories of Buddhism, Christianity, Hinduism, Islam, Judaism, no religion, and other religions. These percentages were then divided by 100 to obtain a proportion, and a Blau index created.
Religious concentration
Data from the census indicated that Christianity constitutes Australia’s primary religion. Utilising the same data extracted from the census as for religious diversity, a percentage of people not Christian was calculated.
Parents’ country of birth
Scholars suggest that parents pass their values and beliefs on to their children (Sampson et al., 1999) and that tensions in the community might be heightened by second-generation immigrants who must assert their right to be seen as Australian (Poynting and Mason, 2007). We included this measure to examine if beliefs instilled in their parents while immersed in another culture would affect collective efficacy in Australian neighbourhoods. We obtained the proportion of people in each suburb who reported both parents were born overseas from the census.
Aboriginal and Torres Strait Islander population
As Australian society’s most socially and economically disadvantaged group (Australian Human Rights Commission, 2008), we included the percentage of Aboriginal and Torres Strait Islander residents in a neighbourhood as an ethnicity in the analyses.
Neighbourhood socio-structural control variables
Census data was obtained from the Australian Bureau of Statistics to control for the socio-demographic composition of each neighbourhood (ABS, 2007). A review of the literature highlighted several recurring aspects believed to impact upon collective efficacy, including household income, homeownership, residential mobility and rates of crime in the neighbourhood.
Poverty has a significant effect on trust and informal social control (Letki, 2008; Twigg et al., 2010). Household income: one measure of disadvantage was defined by the Australian Bureau of Statistics as those earning less than 30% of the income distribution, which in Queensland suburbs qualified as less than $500 per week.
Renting affects attachment to the neighbourhood (Holdsworth, 2005; Sampson et al., 1997), which in turn impacts informal social control. Data from the census measured a percentage of people renting in each suburb.
Residential mobility also impacts neighbourhood attachment and as a result, trust and informal social control (Letki, 2008). This is measured by the percentage of people who had a different address five years prior to the census.
As a violent crime in a community has a significant negative effect on trust and informal social control (Sampson et al., 1997), we included the rate of violent crime as a control variable. Queensland Police Service data measured violent crime offences reported in 2005, 2006 and 2007, including figures of homicide, assaults (excluding sexual assaults) and both armed and unarmed robbery. From this data we obtained an average crime rate per 100,000 people.
Analytic strategy
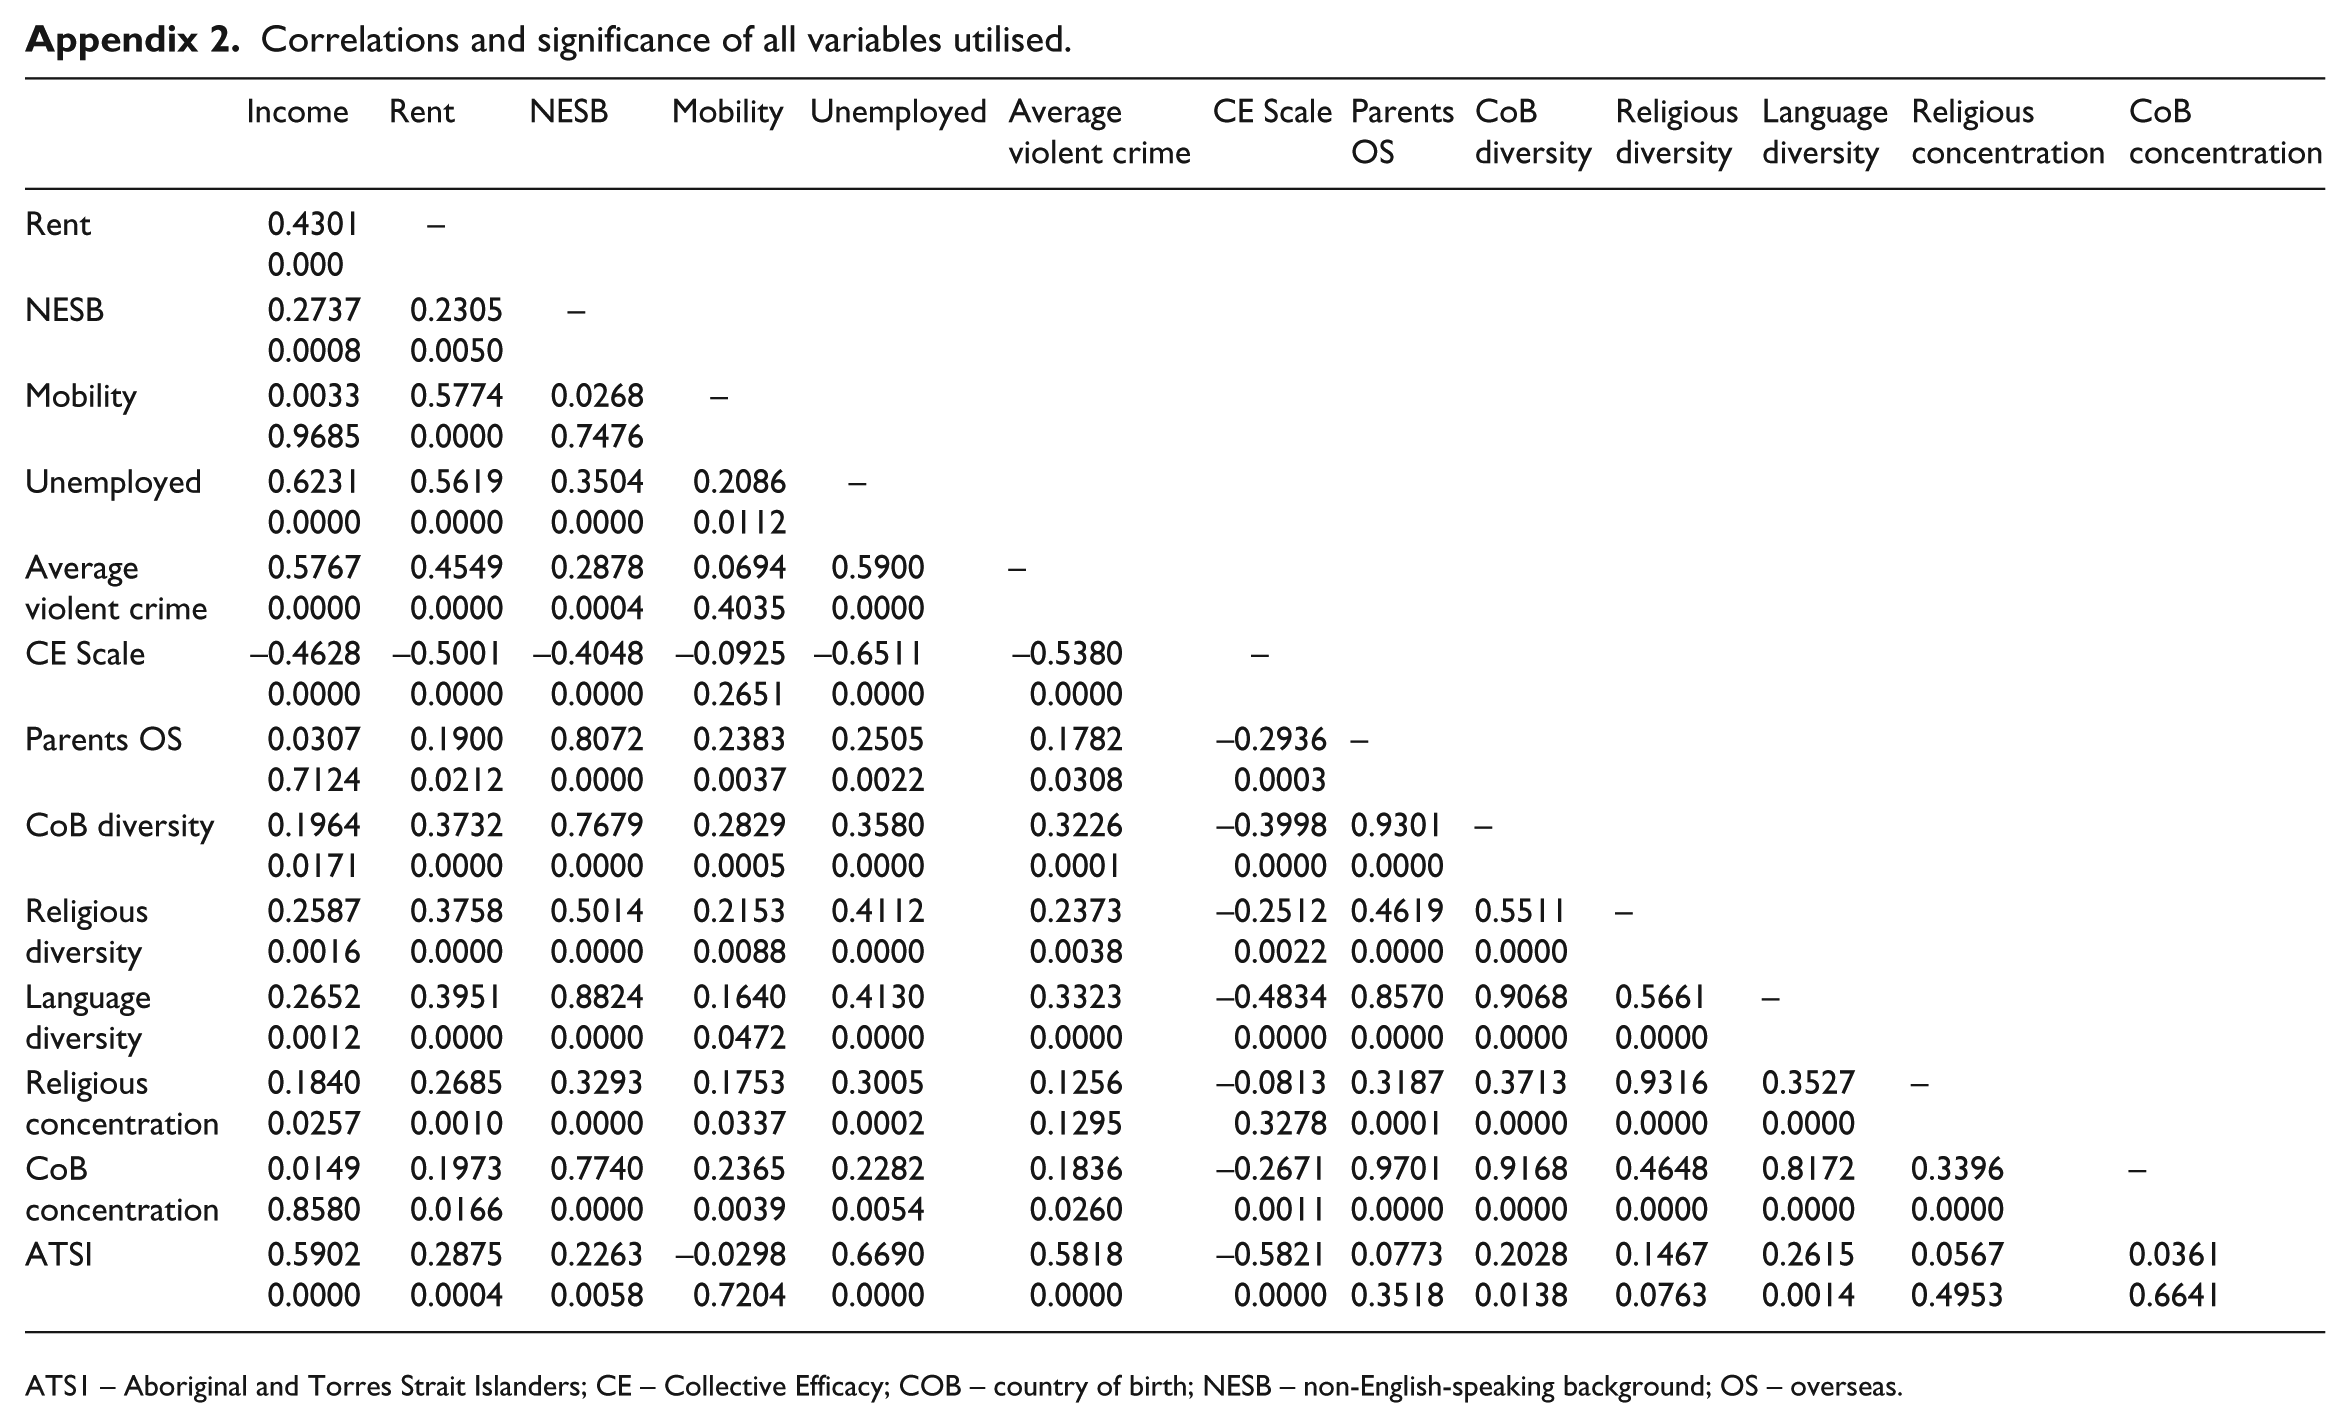
Bivariate correlations demonstrated strong correlations between many of the ethnicity measures, as was expected as these measure similar, though not identical, aspects (see Appendix 2). Ordinary Least Square (OLS) regression was conducted to examine the variation in collective efficacy explained by each of the variables individually (see Table 2). From these results, religion, country of birth concentration and parents’ country of birth explained limited variance in collective efficacy and were not examined in the multivariate regression models.
Regression of measures individually with collective efficacy.
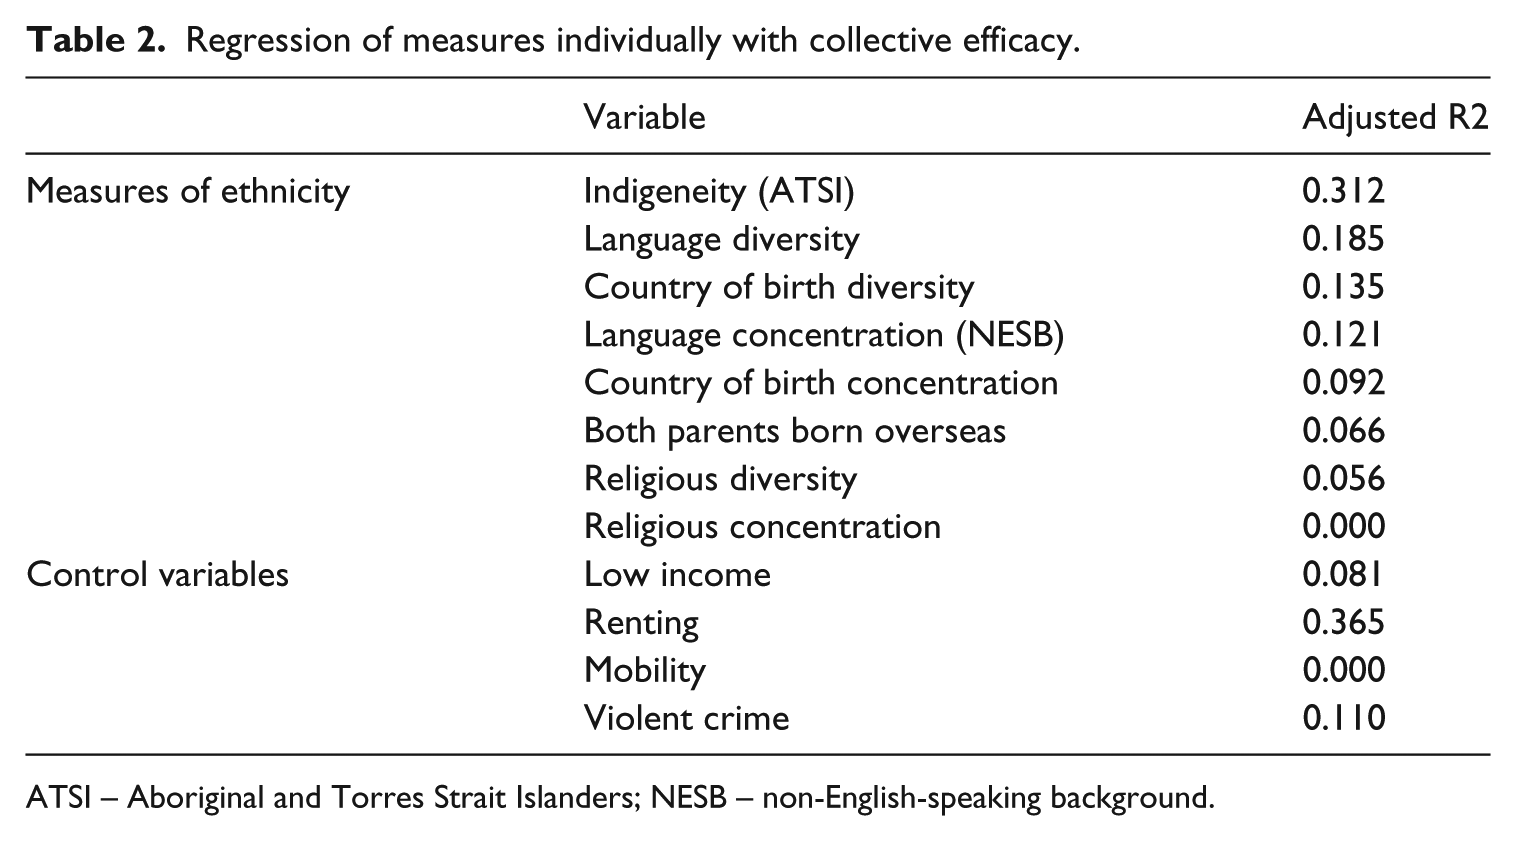
ATSI – Aboriginal and Torres Strait Islanders; NESB – non-English-speaking background.
We then included the neighbourhood controls. An initial structural model provided a baseline for calculating how much variance was accounted for by the control variables alone. Model 2 examined the effect of the control variables on collective efficacy when the percentage of Australian and Torres Strait Islander population was included into the model. The third model included non-English-speaking background with the control variables, and the fourth language diversity with the controls to determine whether concentration or diversity matters most for effects of language on collective efficacy. Finally, country of birth was examined in model 5.
Results
Regression models examined the variation in collective efficacy with the full complement of control variables and those variables that captured indigeneity, language and country of birth. The first model considered the impact of the control variables (household income, renting, mobility and average crime) on collective efficacy (see Table 3). Calculating the proportion of variance in collective efficacy accounted for by these control variables provided a baseline to determine the impact of each measure of ethnicity above and beyond these controls. We standardised the variables to ascertain which variable had the strongest influence on collective efficacy.
Individual regression models with each of the key independent variables.
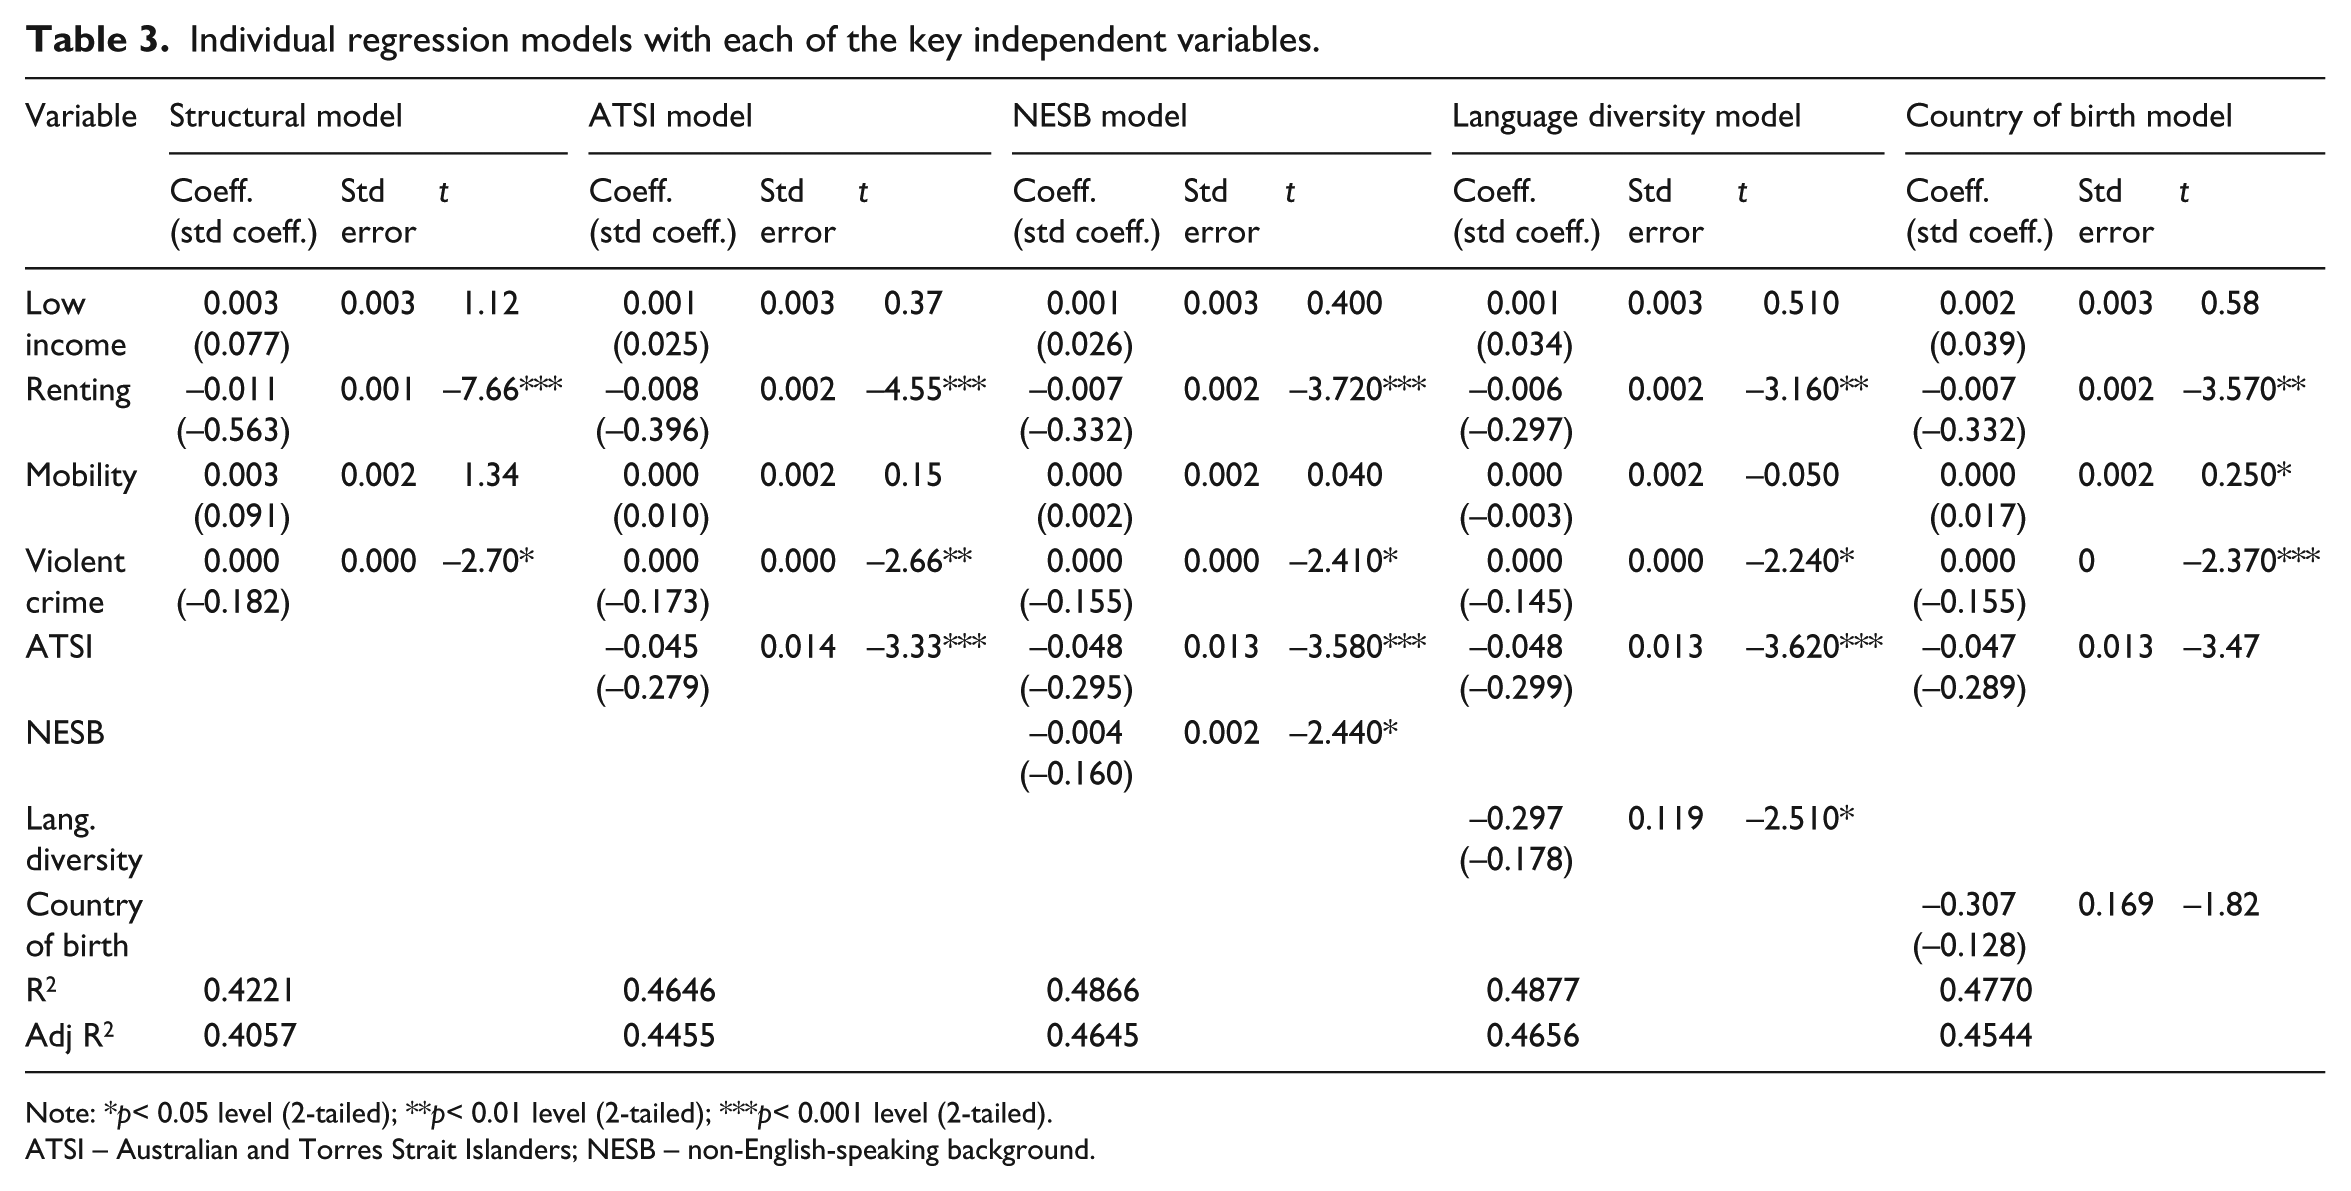
Note: *p< 0.05 level (2-tailed); **p< 0.01 level (2-tailed); ***p< 0.001 level (2-tailed).
ATSI – Australian and Torres Strait Islanders; NESB – non-English-speaking background.
This set of control variables accounted for a moderate amount of variance in collective efficacy (R2adj = 0.41). Renting explained a significant amount of variance in collective efficacy across neighbourhoods (t = -7.6, p<0.001), as did violent crime rates in the neighbourhood (t = -2.7, p<0.05).
In model 2 we added ATSI. This increased the explained variance in collective efficacy (R2adj = 0.44), suggesting that a further 3.9% of variance was explained by the presence of an ATSI population above the control model. ATSI had a significant negative relationship with collective efficacy (t = -3.33, p<0.001), suggesting that the presence of Indigenous Australians within a community significantly lowers collective efficacy. As a result, we left this variable in as a control in later models.
In model 3, we included the proportion of NESB residents. This variable increased the explained variance in collective efficacy (R2adj = 0.46) and was negatively associated with collective efficacy (t = -2.44, p<0.05). In this model the percentage of Indigenous residents remained statistically significant (t = -3.58, p<0.001). Renting and violent crime also retained significant negative effects (t = -3.72, p<0.001; t = -2.41, p<0.05). Standardised coefficients in this model demonstrated that renting was the most important factor, followed by ATSI.
In model 4, we considered language diversity within the neighbourhood. This increased the explained variance in collective efficacy (R2adj = 0.46) and had a negative relationship with collective efficacy (t = -2.51, p<0.05). Here, the percentage of ATSI residents remained highly significant (t = -3.62, p<0.001), although the significance of renting and violent crime dropped (t = -3.16, p<0.01; t = -2.24, p<0.05). Comparing the Adjusted R2 of the models 3 and 4, it is visible that language diversity accounted for 2.0% of variance, while language concentration (NESB) accounted for 1.9%.
In the final model, the diversity of country of birth variable was introduced. The result was an explained variance figure higher than the controls alone, but lower than the previous models looking at language measures (R2adj = 0.45). Although country of birth diversity had a negative relationship with collective efficacy, this was not significant (t = -1.82, ns). In this model, renting and violent crime maintained their negative relationships with collective efficacy (t = -3.57, p<0.01; t = -2.37, p<0.001).
Discussion
Studies that consider the impact of ethnic diversity on community regulation find that ethnic heterogeneity and concentrated disadvantage are most likely to reduce community capacity to control crime and disorder. In these studies, ethnicity is defined by ancestry, place of birth or language spoken. Rarely do studies consider the multi-dimensionality of ethnicity. A second problem is the focus on ‘race’ rather than ‘ethnicity’. As much research on community regulation is conducted in the United States, the ‘ethnicity’ factor often centres on the African-American or Latino population. While the standardised coefficients in our models demonstrate that in the Australian context collective efficacy is significantly affected by the proportion of people renting in the neighbourhood, we focus on the results around the measures of ethnicity.
Our findings are consistent with research that considers the influence of ‘outsiders’ within a community as posing problems for the development of mutual trust and informal social control (Alesina and La Ferrera, 2000; Leigh, 2006). It is not enough to propose that ‘outsider’ status is the key driver of lower collective efficacy as it is likely that different aspects of ethnicity impede community regulation in different ways. For example, Leigh’s (2006) Australian-based research demonstrated that ethno-linguistic fragmentation was detrimental to trust. While language may certainly represent difference, we suggest that it is not so much that the presence of residents speaking a language other than English poses a direct threat to social order. Rather, it is possible that language diversity hinders shared participation in community regulation because it impedes the level of communication necessary to develop the shared norms around action.
Although we cannot address this in our study, we suggest that being able to share a common language would assist residents’ levels of trust, participation, and agreement on social norms and informal social control. Language is a critical barrier to integration and communication, and failing to speak English creates social distance and isolation (Department for Communities and Local Government, 2007). Research into trust suggests it is strongly influenced by opportunities for communication (Cook and Cooper, 2003). Language diversity is seen as an impediment to asking for and receiving help. Without this key instrument for trust, it is also difficult to negotiate differences and neighbourhood tensions may build (Department for Communities and Local Government, 2007). Future research could consider this notion of shared language, specifically comprehension of English, to determine if differences in levels of collective efficacy are a result of this lack of shared language rather than the use of Language other than English (LOTE) as a measure of ‘other’.
Further evidence of the importance of language was revealed when comparing the impact of diversity with concentration. One of the aims of this study was to investigate if diversity or concentration measures of ethnic diversity appeared more important for informal social control. Results show that diversity has the most significant impact on collective efficacy. This reflects Fieldhouse and Cutts’ (2010) research which suggests that neighbourhood organisation participation is lower in racially diverse communities than those with a concentration of residents differing from the majority. As language is critical to communication and integral to the acceptance of new immigrants within the community, understanding how language barriers can be overcome to enhance the safety and security of the local neighbourhood remains an important area for sociological research.
Yet our results also indicate that it is more than just language barriers at work. In communities with more Aboriginal and Torres Strait Islander residents, collective efficacy was diminished, even after controlling for all other socio-demographic characteristics. This relationship may be the result of the ‘other’ status of the Indigenous population. We argue that the presence of Indigenous persons in a given community might signal an inability of residents to work together to solve local problems. Indigenous Australians not only experience disadvantage across a range of social and economic indicators, but their mere presence in a community conjures associations with crime and disorder (Dunn et al., 2004). Thus, we suggest that in communities where Indigenous residents are visible, residents may report lower collective efficacy based on biases associated with Indigenous people.
The visible minorities research demonstrates that in Australia, both the Aboriginal and Torres Strait Island People and the African populations face negative stereotypes and face discrimination (Colic-Peisker and Tilbury, 2008). Such findings resonate with the literature on African-Americans in the United States context. Here studies show that when there is a visible presence of dark skin in the neighbourhood, residents perceive there are also more problems (Sampson and Raudenbush, 2004). In America, dark skin is a readily observable characteristic that is associated with crime and disorder (Loury, 2002). Thus the visibility of those who ‘look’ different may provide the visual cues to neighbours that a neighbourhood is unsafe (Griffiths and Pedersen, 2009; Sampson, 2009; Skogan, 1986). Future research is needed to determine the role of visible minority groups on neighbourhood collective efficacy, as census data cannot adequately provide this evidence.
Methodologically, this study has advanced previous quantitative research by considering the multi-dimensional aspect of ethnicity. While the majority of studies that examine trust, social cohesion and social control utilise ancestry data, we identify that ancestry had a minor effect on collective efficacy when compared to language diversity. While some studies consider non-English-speaking background in their work, few consider linguistic diversity within a community and the impact of this on community regulation. Thus, future studies should incorporate this measure into analyses to determine the full impact of ethnic diversity on trust and informal social control. Yet we acknowledge the assumption of homogeneity within the groups in our data, as we do not control for intra-group differences such as age, gender and other person characteristics that might be important.
Despite this limitation, our study provides a comprehensive account of the aspects of ethnic diversity that matter most to the development of social cohesion and informal social control in urban residential communities. We identified the greatest obstruction to a community’s collective efficacy to be language diversity, suggesting that communication barriers may prevent the formation of norms around informal social control. Additionally, the proportion of Indigenous residents significantly impeded the development of collective efficacy. As previous studies in the United Kingdom and the United States report mixed findings, it would be interesting to repeat a similar study using these aspects of ethnicity (rather than race) to determine if results of the current study are reflected in differing contexts internationally. Having many studies incorporating measures which are directly comparable would allow researchers to fully unpack the impact of ethnic diversity in different countries. This would illuminate whether particular ethnic markers have a universal or particularistic impact on key social processes necessary for community regulation.
Footnotes
Appendix
Correlations and significance of all variables utilised.
| Income | Rent | NESB | Mobility | Unemployed | Average violent crime | CE Scale | Parents OS | CoB diversity | Religious diversity | Language diversity | Religious concentration | CoB concentration | |
|---|---|---|---|---|---|---|---|---|---|---|---|---|---|
| Rent | 0.4301 0.000 |
− | |||||||||||
| NESB | 0.2737 |
0.2305 |
− | ||||||||||
| Mobility | 0.0033 |
0.5774 |
0.0268 |
− | |||||||||
| Unemployed | 0.6231 |
0.5619 |
0.3504 |
0.2086 |
− | ||||||||
| Average violent crime | 0.5767 |
0.4549 |
0.2878 |
0.0694 |
0.59000.0000 | − | |||||||
| CE Scale | −0.4628 |
−0.5001 |
−0.4048 |
−0.0925 |
−0.6511 |
−0.5380 |
− | ||||||
| Parents OS | 0.0307 |
0.1900 |
0.8072 |
0.2383 |
0.2505 |
0.1782 |
−0.2936 |
− | |||||
| CoB diversity | 0.1964 |
0.3732 |
0.7679 |
0.2829 |
0.3580 |
0.3226 |
−0.3998 |
0.9301 |
− | ||||
| Religious diversity | 0.2587 |
0.3758 |
0.5014 |
0.2153 |
0.4112 |
0.2373 |
−0.2512 |
0.46190.0000 | 0.5511 |
− | |||
| Language diversity | 0.2652 |
0.3951 |
0.8824 |
0.1640 |
0.4130 |
0.3323 |
−0.4834 |
0.8570 |
0.9068 |
0.5661 |
− | ||
| Religious concentration | 0.1840 |
0.2685 |
0.3293 |
0.1753 |
0.3005 |
0.1256 |
−0.0813 |
0.3187 |
0.3713 |
0.9316 |
0.3527 |
− | |
| CoB concentration | 0.0149 |
0.1973 |
0.7740 |
0.2365 |
0.2282 |
0.1836 |
−0.2671 |
0.9701 |
0.9168 |
0.4648 |
0.8172 |
0.3396 |
− |
| ATSI | 0.5902 |
0.2875 |
0.2263 |
−0.0298 |
0.6690 |
0.5818 |
−0.5821 |
0.0773 |
0.2028 |
0.1467 |
0.2615 |
0.0567 |
0.0361 |
ATS1 – Aboriginal and Torres Strait Islanders; CE – Collective Efficacy; COB – country of birth; NESB – non-English-speaking background; OS – overseas.
Funding
This research was supported by the Australian Research Council (DP0771785).