
Abstract
Social capital is upheld for its value in explaining variations in crime across place. Collective efficacy is understood to be the superlative link between less effectual components of neighbourhood social capital (such as social ties and reciprocity) and lower rates of crime. The current study examines the value of neighbourhood social capital in explaining another community attribute associated with neighbourhoods: fear of crime. We conduct a secondary analysis of survey data collected from over 2000 people clustered in 82 Statistical Local Areas in Brisbane, Australia, to examine the correlates of fear of crime. We find that when comparing elements of social capital, the agentic element of social capital – collective efficacy – has the strongest relationship to reduced fear of crime.
Fear of crime is detrimental to individual and community wellbeing 1 (Box et al., 1988; Bursik and Grasmick, 1993; Grabosky, 1995; Kornhauser, 1978; Lagrange et al., 1992; McCrea et al., 2005; Sampson et al., 1997, Shaw and McKay, 1942; Skogan, 2009). Fear can lead to anxiety, depression, community withdrawal and the spiral of decline in neighbourhoods (Box et al., 1988; Grabosky, 1995; McCrea et al., 2005; Skogan, 2009). Fear of crime can be understood at both the individual and the neighbourhood levels of analysis through three models: the vulnerability model, the disorder model and the social integration model (Bursik and Grasmick, 1993; Kornhauser, 1978; Lagrange et al., 1992; Sampson et al., 1997, Shaw and McKay, 1942). When taken together, these three perspectives link personal characteristics and the lived environment to crime fears and suggest that demographics (such as age and gender), neighbourhood disorder and social capital all explain fear of crime (Brunton-Smith and Sturgis, 2011).
Research about the actual incidence of violent crime in neighbourhoods similarly considers the relative effects of demographic characteristics, neighbourhood structural characteristics, disorder and elements of social capital (see Jobes et al., 2004; for an Australian example, see Mazerolle et al., 2010). Studies find that collective efficacy is most important for understanding variations in crime across place, and that collective efficacy helps to explain the relationship between the other, less effectual, elements of social capital and crime (Armstrong et al., 2015; Mazerolle et al., 2010; Morenoff et al., 2001; Oberwittler and Wikström, 2009; Odgers et al., 2009; Sampson et al., 1997, 1999; Zhang et al., 2007). Collective efficacy is such a powerful explanatory factor because it is the agentic element of social capital and best articulates how social capital is converted into action to prevent and control crime.
Fear of crime research also considers the relevance of collective efficacy, however it is not yet clear if collective efficacy is the key explanatory factor when modelling social capital and fear of crime. The current study employs data collected in the Australian Community Capacity Study (ACCS) survey to examine the role of social capital, and particularly collective efficacy, in buffering against crime fears in Brisbane, Australia. We build on prior research, comparing and contrasting the three models of fear of crime and examining the relative effect of different elements of social capital in explaining fear of crime. As collective efficacy appears more important than the other elements of social capital when predicting neighbourhood crime, we anticipate that collective efficacy will also be the key predictor of fear of crime (Brunton-Smith et al., 2014). We begin the article with a review of prior literature. We then outline our methods and present the results of logistic regression models. We conclude with a discussion of our findings and implications for future research and policy.
Modelling fear of crime
Fear of crime is currently conceptualised within three theoretical models: the vulnerability model, the disorder model and the social integration model. The vulnerability model accounts for fear of crime via a personal risk perspective. In this model, physical, social and economic vulnerabilities translate into fear of crime (Franklin et al., 2008). Traits of perceived physical and social vulnerability include age, gender, prior victimisation and disadvantage (Ferraro and LaGrange, 1992; Skogan and Maxfield, 1981).
In the disorder model, rather than drawing on personal vulnerabilities, fear of crime is influenced by the observed characteristics of the neighbourhood. Perceived social and physical disorder signals the likelihood of victimisation (Brunton-Smith, 2011; Wilson and Kelling, 2015). Seeing physical disorder (e.g. graffiti, trash) and/or social disorder (e.g. drunkenness, prostitution), also evokes the belief that neighbourhood residents do not care about the neighbourhood, and are therefore unlikely to supervise the neighbourhood or intervene in community problems (Bursik and Grasmick, 1993; Markowitz et al., 2001; Perkins and Taylor, 1996; Skogan, 1990; Skogan and Maxfield, 1981; Wyant, 2008).
The social integration model and the disorder model often go hand in hand. In the social integration model the degree to which residents feel integrated into their neighbourhood (as demonstrated by social capital) predicts fear of crime. Residents feel safer when they know their neighbours and believe they can rely on them (Hunter and Baumer, 1982). Evidence for the social integration model is mixed, however.
For example Alper and Chappell (2012) find trust in neighbours, but not organisational participation, predicts fear of crime. Similarly, Gainey et al. (2011) find trust in neighbours predicts lower fear of crime. On the other hand, Ferguson and Mindel (2007) find neither social support networks nor participation in neighbourhood watch/community meetings have a direct impact on fear of crime. While LaGrange et al. (1992) find that neighbourhood cohesion predicts social disorder but not fear of crime directly. In an Australian study of 140 Brisbane residents, McCrae et al. (2005) find that, in comparison to the vulnerability and disorder models, social capital matters less for explaining fear of crime.
To advance neighbourhood perspectives on fear of crime and to bring together models of disorder and social integration, collective efficacy can be incorporated. Collective efficacy is conceptualised as the agentic element of social capital in neighbourhoods. Putnam (1995: 36) defines social capital as ‘features of social organization, such as networks, norms, and trust that facilitate coordination and cooperation for mutual benefit’. Considering the neighbourhood perspective, Sampson and Graif (2009) spell out four elements of ‘neighbourhood social capital’: collective efficacy, local networks, organisational participation and cultural norms. Sampson and his colleagues argue that ‘collective efficacy’ is the process that captures a neighbourhood’s capacity to respond to crime problems, and that collective efficacy can manifest even in the absence of strong local networks (see, for example, Sampson et al., 1999). Collective efficacy – defined as social cohesion combined with the willingness to intervene in neighbourhood problems – is therefore the agentic element of neighbourhood social capital that facilitates action (Sampson et al., 1997).
Collective efficacy features in both the disorder model and the social integration model. In the disorder model, social and physical disorder signal that people do not care about the neighbourhood or supervise what goes on there. In other words, disorder leads to low collective efficacy, and low collective efficacy is likely to increase crime fears (Brunton-Smith et al., 2014; Lee and Earnest, 2003).
As with the other elements of social capital, the role of collective efficacy in predicting fear of crime is clouded by contradictory findings. For example Gibson et al. (2002) find that collective efficacy is negatively related to fear of crime in three US cities (see also Lee and Earnest, 2003; Stein, 2014). In contrast, Zhao et al. (2002), in their study of Community Oriented Policing Services (COPS) volunteers and a random sample of residents, find collective efficacy is not significantly related to fear of crime (see also Xu et al., 2005). While Jackson (2004) finds perceptions of social cohesion and neighbourhood informal social control partially mediate the relationship between perceptions of disorder and risk perceptions. Swatt et al. (2013), on the other hand, find contradictory results within their own study: collective efficacy directly predicts fear of crime in two out of the four Colorado neighbourhoods they investigate.
One of the more conspicuous problems with studies of fear of crime is the relative lack of hierarchical sampling designs that best capture the clustering of residents within neighbourhoods. Brunton-Smith et al. (2014) provide one exception. They employ data collected from 61,436 individuals living in 4761 London neighbourhoods and find that collective efficacy has a direct negative effect on worry about violent crime and also mediates the relationship between neighbourhood structural characteristics and worry about crime. Brunton-Smith et al. (2014) did not, however, examine the effect of the other elements of neighbourhood social capital, such as social ties and reciprocity. These features of neighbourhood social capital should be considered because the relationship between collective efficacy and fear of crime may be explained by these other features of neighbourhood social capital.
In this study we present the first test of the three models of fear of crime and collective efficacy in the Australian context. We build on the work of McRae et al. (2005) (who examine the relationship between social capital and fear of crime in Australia), and the work of Brunton-Smith et al. (2014) (who examine the collective efficacy–fear relationship with a hierarchical sampling design) to comprehensively test the three models of fear of crime, and to distinguish between different elements of social capital utilising a hierarchical sampling design. As with research examining social capital and crime, we suggest that research examining fear of crime should consider which of the features of neighbourhood social capital are most effective at explaining fear (Brunton-Smith et al., 2014). We anticipate that collective efficacy will be a strong predictor of fear of crime, as collective efficacy captures the agentic process that converts social capital into action. We predict the belief that neighbours will exert social control over the neighbourhood – collective efficacy – will be most effective in allaying crime fears.
Data and methods
To meet the study aims we undertake secondary analyses of data collected in Wave 1 of the ACCS. The ACCS was designed to explore the role of community processes in local geographic areas in the Australian context (Mazerolle et al., 2007). The ACCS was and is the first and only study of collective efficacy in Australia to employ a hierarchical sampling design. The ACCS Wave 1 surveyed 2859 people living in 82 Statistical Local Areas (SLAs) in Brisbane, Australia. SLAs are geographic areas that approximate a local geographic community or neighbourhood.
The ACCS employed a three-stage random sampling design to select SLAs, households within SLAs, and residents within households. Of the 224 eligible SLAs, 82 were randomly selected to form the neighbourhood sample. A quota system was devised to determine how many households/participants were selected per SLA (Mazerolle et al., 2007). Households were randomly selected using Random Digit Dialling and the Electronic White Pages. Participants were randomly sampled from within these households. The survey was conducted between February and March 2005 and was administered by the Office of the Government Statistician (OGS) using Computer Assisted Telephone Interviewing (CATI). A total of 2881 people were surveyed. The response rate was 35.71% (Mazerolle et al., 2007). Following geo-coding and data cleaning the total number of eligible survey respondents was 2859.
Variables
Fear of crime
In the ACCS survey, fear of crime was measured as a single item. This measure has often been used in prior research (Alper and Chappell, 2012; Gibson et al., 2002). Participants were asked to rate their level of agreement with the statement ‘I feel safe walking down the street after dark’. Items were scored on a four-point Likert scale ranging from 1 = ‘strongly agree’ to 4 = ‘strongly disagree’. Due to the limited number of response categories, the variable was dichotomised to form a binary measure of fear of crime. Scores of 1 and 2 were reallocated a score of 0 and scores of 3 or 4 were given a score of 1, with a score of 1 indicating the participant was fearful of crime. Dichotomising the measure allows us to compare those who are fearful to those who are not. This measure of fear of crime is considered to be a global measure of fear and does not tap into emotional responses to fear, more specific crime fears, or the risk of victimisation (Hale, 1996). These limitations are considered when interpreting the results
Disorder
Disorder was measured by asking participants to indicate ‘how big a problem’ specific types of incivilities were in their local community. Participants could respond with ‘don’t know’, ‘no problem’, ‘some problem’ or ‘big problem’. Items were recoded to be dichotomous. Those who responded ‘don’t know’ or ‘no problem’ were given a score of 0 and those who responded ‘some problem’ or ‘big problem’ were given a score of 1. Two indexes were computed from these items to form measures of social and physical disorder. The social disorder index captured problems including: drugs, public drinking, people loitering or hanging out, paint sniffing or chroming, prostitution, traffic problems like speeding or hooning, young people getting into trouble and transients/homeless people. The physical disorder index captured problems including: run-down or broken buildings, vandalism and or/graffiti, poor lighting and overgrown shrubs or trees.
Social capital
Numerous measures of social capital were included in the ACCS. These were: social ties, reciprocity, civic engagement and collective efficacy. To measure social ties the ACCS employed a single item. Participants were asked to respond to the following: ‘Apart from the people that you live with, how many relatives and friends live in your community?’ Response categories included: ‘none’, ‘one or two’, ‘three or four’ and ‘five or more’. Social ties was coded as a categorical variable with ‘none’ as the reference category. To measure reciprocity participants were asked ‘About how often do you and people in your community do favours for each other?’ Responses were scored on a four-point Likert scale ranging from −2 = ‘never’ to 2 = ‘often’. 2 To measure civic engagement, participants were asked whether or not in the past 12 months, without being paid they had: ‘signed a petition’, ‘attended a public meeting’ or ‘joined with people to resolve a local or community problem’. For each item, if a participant answered ‘Yes’ they were given a score of 1, if a participant answered ‘No’ they were given a score of 0. Scores were added to form an index of civic engagement. Higher scores indicate a higher level of civic engagement. To measure collective efficacy the ACCS drew on Sampson et al. (1997). In the ACCS survey, six items were included to measure the willingness of neighbours to intervene in community problems (e.g. ‘If a group of community children were skipping school and hanging around on a street corner, how likely is it that people in your community would do something about it?’) and four items were included to measure social cohesion or a lack of social cohesion and trust (e.g. ‘People do not share the same values’). Items measuring informal social control were scored on a five-point Likert scale ranging from −2 = ‘very unlikely’ to 2 = ‘very likely’. Items measuring social cohesion and trust were scored on a five-point Likert scale ranging from −2 = ‘strongly disagree’ to 2 = ‘strongly agree’. Items were combined to form a mean scale of collective efficacy with a Cronbach’s Alpha = .76.
Demographic variables
Variables were included to measure and control for demographic characteristics. According to the vulnerability perspective, it was particularly important to measure age, gender and prior victimisation (Franklin et al., 2008; Hale, 1996). We also controlled for ethnicity (represented as language), length at current address, marital status, home ownership and employment status. These factors are important to control for in neighbourhood research (see for example Sampson et al., 1997). Participants were asked to indicate their age (⩾60 = 1; <60 = 0), gender (Male = 1; Female = 0), whether or not they spoke a language other than English at home (Speaks English only at home = 1; Other = 0), how long they had lived at their current address (Less than 5 years = 1; 5 years or more = 0), their marital status (Married or de facto = 1; Other = 0), whether or not they owned their own home (Own = 1; Other = 0), and their employment status (Unemployed seeking work = 1; Other = 0). To measure violent victimisation participants were asked to indicate whether or not they or a member of their household had been a victim of violent crime in the past six months (Victim in the past 6 months = 1; Other = 0).
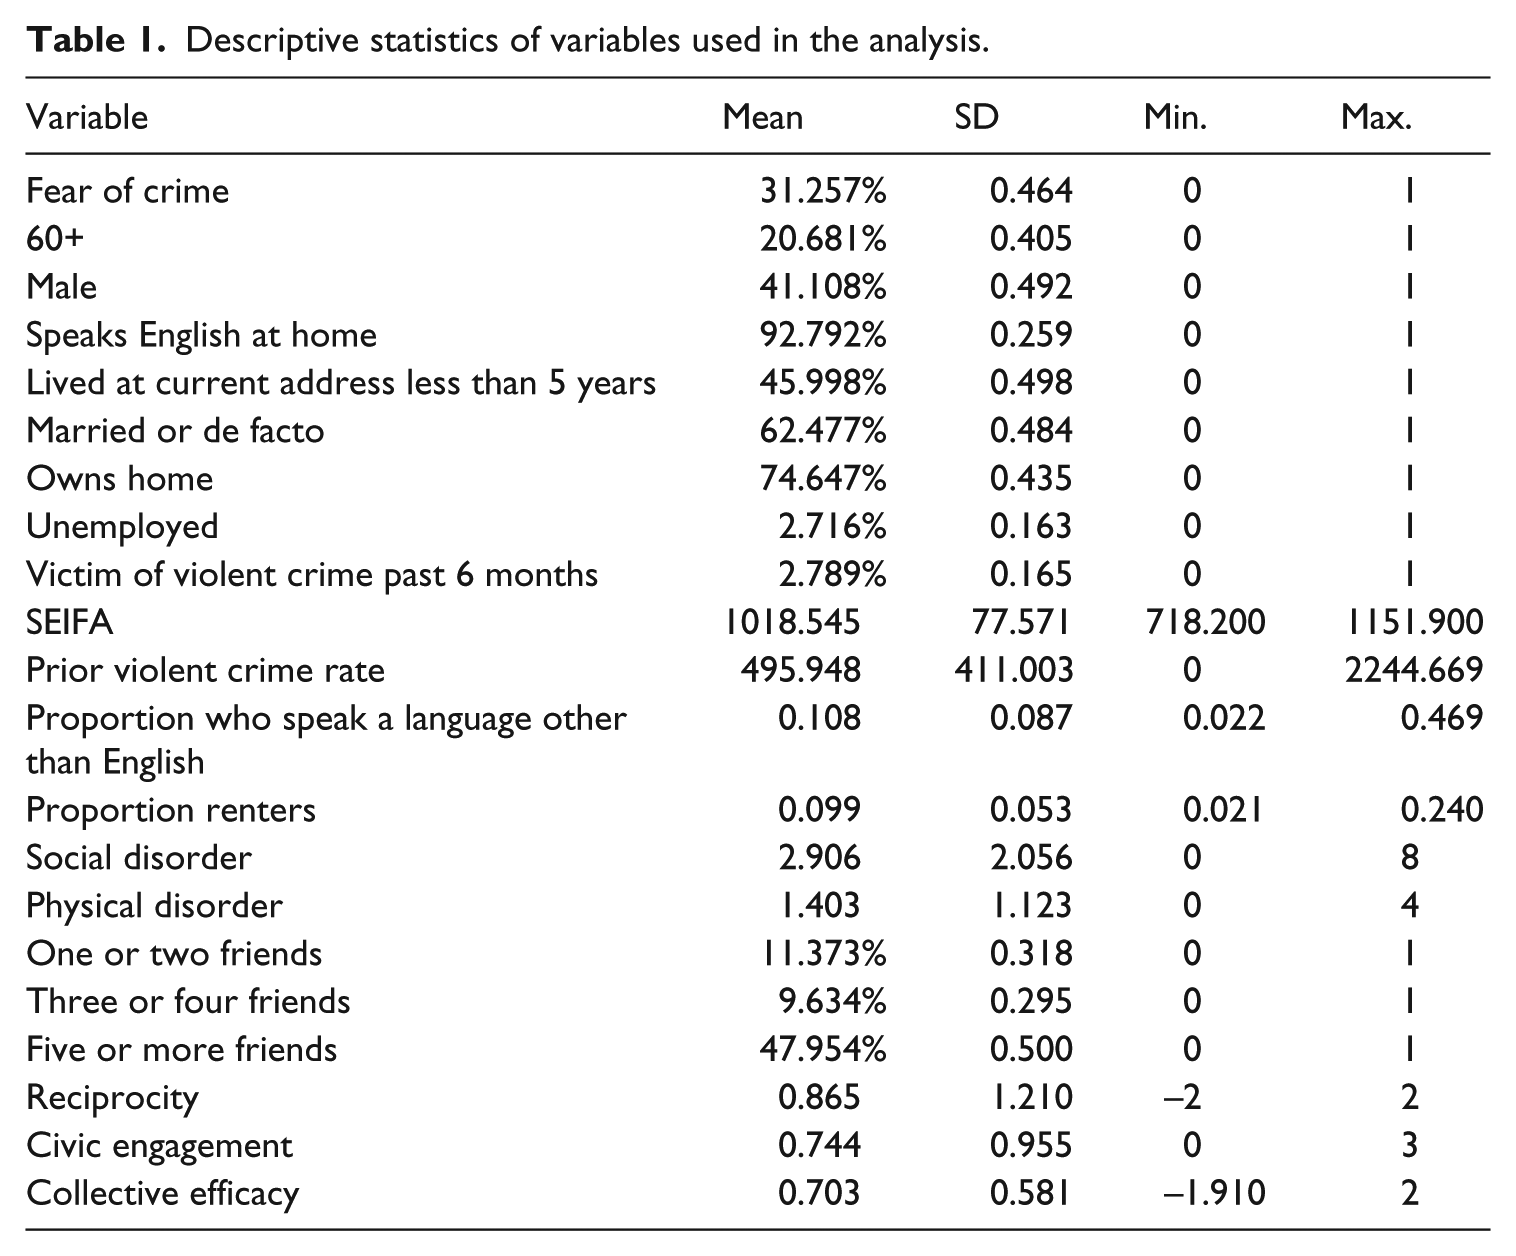
Descriptive statistics of variables used in the analysis.
Neighbourhood structural characteristics
Neighbourhood structural characteristics and the prior rate of violent crime were also included. Neighbourhood structural variables were drawn from the 2001 Australian Bureau of Statistics census. These measures included disadvantage, residential mobility and ethnic heterogeneity. Disadvantage was measured using the Socio-economic Indexes for Areas Index of Relative Socio-economic Disadvantage or SEIFA disadvantage index. This index combined ‘low income, low educational attainment, high unemployment, jobs in relatively unskilled occupations and variables that reflect disadvantage rather than measure specific aspects of disadvantage (e.g. Indigenous and Separated/Divorced)’ (Trewin, 2003: 3). Higher scores represent SLAs with a higher level of advantage, lower scores represent SLAs with a higher level of disadvantage. To measure residential mobility we included a measure of the proportion of renters in each SLA. To tap into ethnic heterogeneity we included a measure of the proportion of people who speak a language other than English (LOTE) for each SLA. The prior violent crime rate (in 2004) was obtained from the Queensland Police Service. The violent crime rate captures incidents of homicide and homicide related incidents, serious assaults, common assaults, armed robbery and unarmed robbery, per 100,000 people living in the SLA (Mazerolle et al., 2007).
Analysis
Analyses were conducted in STATA. Descriptive statistics were computed first, followed by the logistic regression models. Due to the binary nature of the dependent variable and the hierarchical structure of the data, mixed-effects logit models were computed. Following computation, a likelihood ratio test indicated there was no significant difference between the multi-level and single-level models. As a result, single-level logistical regression models were computed and the results are presented herein. Models were nested, with variables entered in blocks so as to observe the changes in variance explained by each model. Demographic and neighbourhood structural variables were entered first, followed by perceptions of disorder, social capital measures, and collective efficacy in the final model. Collective efficacy was entered separately from the other elements of social capital, so as to observe whether or not collective efficacy explained the relationship between the other social capital measures and fear of crime.
Results
Descriptive statistics
Descriptive statistics are presented in Table 2. Descriptive statistics show that 20.68% of the sample was aged 60 years or over, 41.11% of the sample was male, 92.79% spoke English only at home, 46% of the sample had lived at their current address for less than five years, 62.48% were married or living in a de facto relationship, 74.65% were home owners, 2.72% were unemployed, and 2.70% of households in the sample had experienced violent victimisation in the six months prior to the survey. On average, participants were less likely to be fearful of crime, and held positive beliefs about reciprocity and collective efficacy (i.e. the means are greater than the midpoints), and reported some civic engagement and friendships in their neighbourhood
Logistic regression of independent variables on fear of crime (N = 2761).
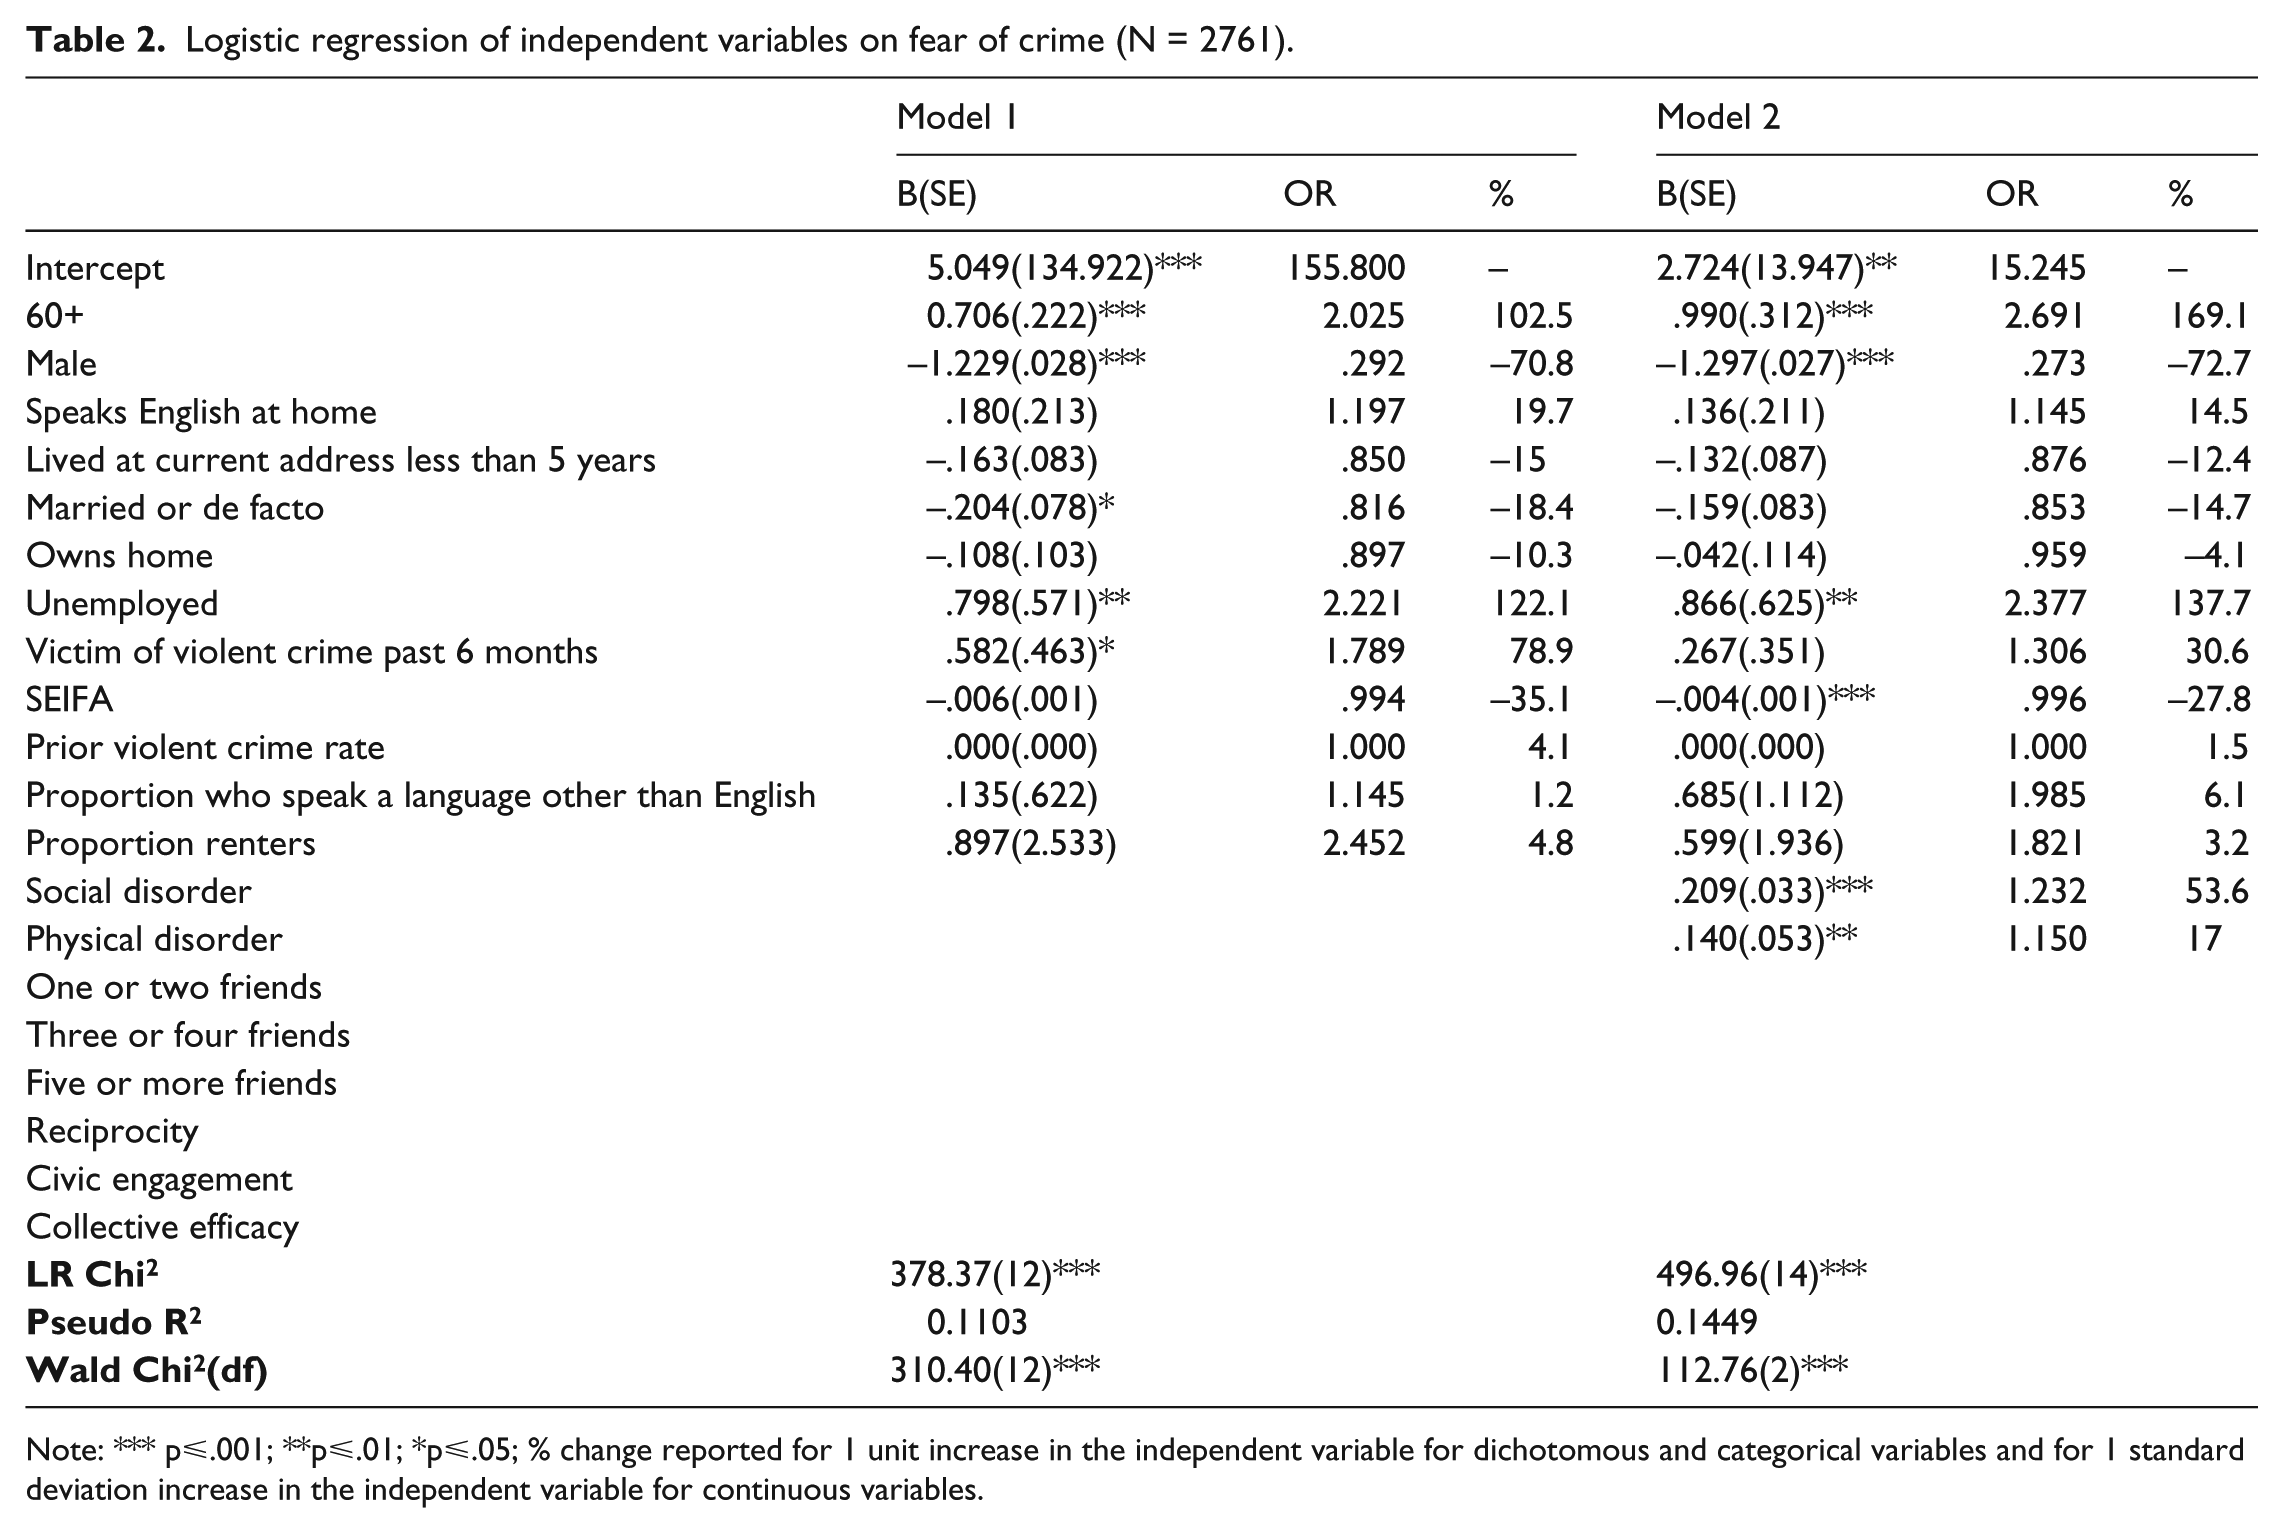
Note: *** p⩽.001; **p⩽.01; *p⩽.05; % change reported for 1 unit increase in the independent variable for dichotomous and categorical variables and for 1 standard deviation increase in the independent variable for continuous variables.
Logistic regression models
Logistic regression results are presented in Tables 2 (Models 1 and 2) and 3 (Models 3 and 4). In Model 1 demographic and neighbourhood structural characteristics were entered. Together these variables explained 11% of the variation in fear of crime (as indicated by the pseudo R2). According to the vulnerability thesis, we would expect factors such as age, gender, victimisation and neighbourhood crime rate to be associated with greater fear of crime (Franklin et al., 2008). Being 60 years old or older (OR = 2.025, p ⩽ .001), and experiencing victimisation (or having a victim of violent crime in your household) (OR = 1.789 p ⩽ .05) increased the odds of being fearful, while being male (OR = .292, p ⩽ .001) decreased the odds of being fearful. These findings are consistent with the vulnerability thesis. Variables indicating advantage/disadvantage were also associated with fear. The SEIFA index was associated with decreased odds of being fearful (OR = 0.994, p ⩽ .001), and unemployment was associated with increased odds of being fearful (OR = 2.221, p ⩽ .01). These findings show that neighbourhood advantage is associated with decreased fear of crime and disadvantage is associated with increased fear of crime.
Logistic regression of independent variables on fear of crime (N = 2761).
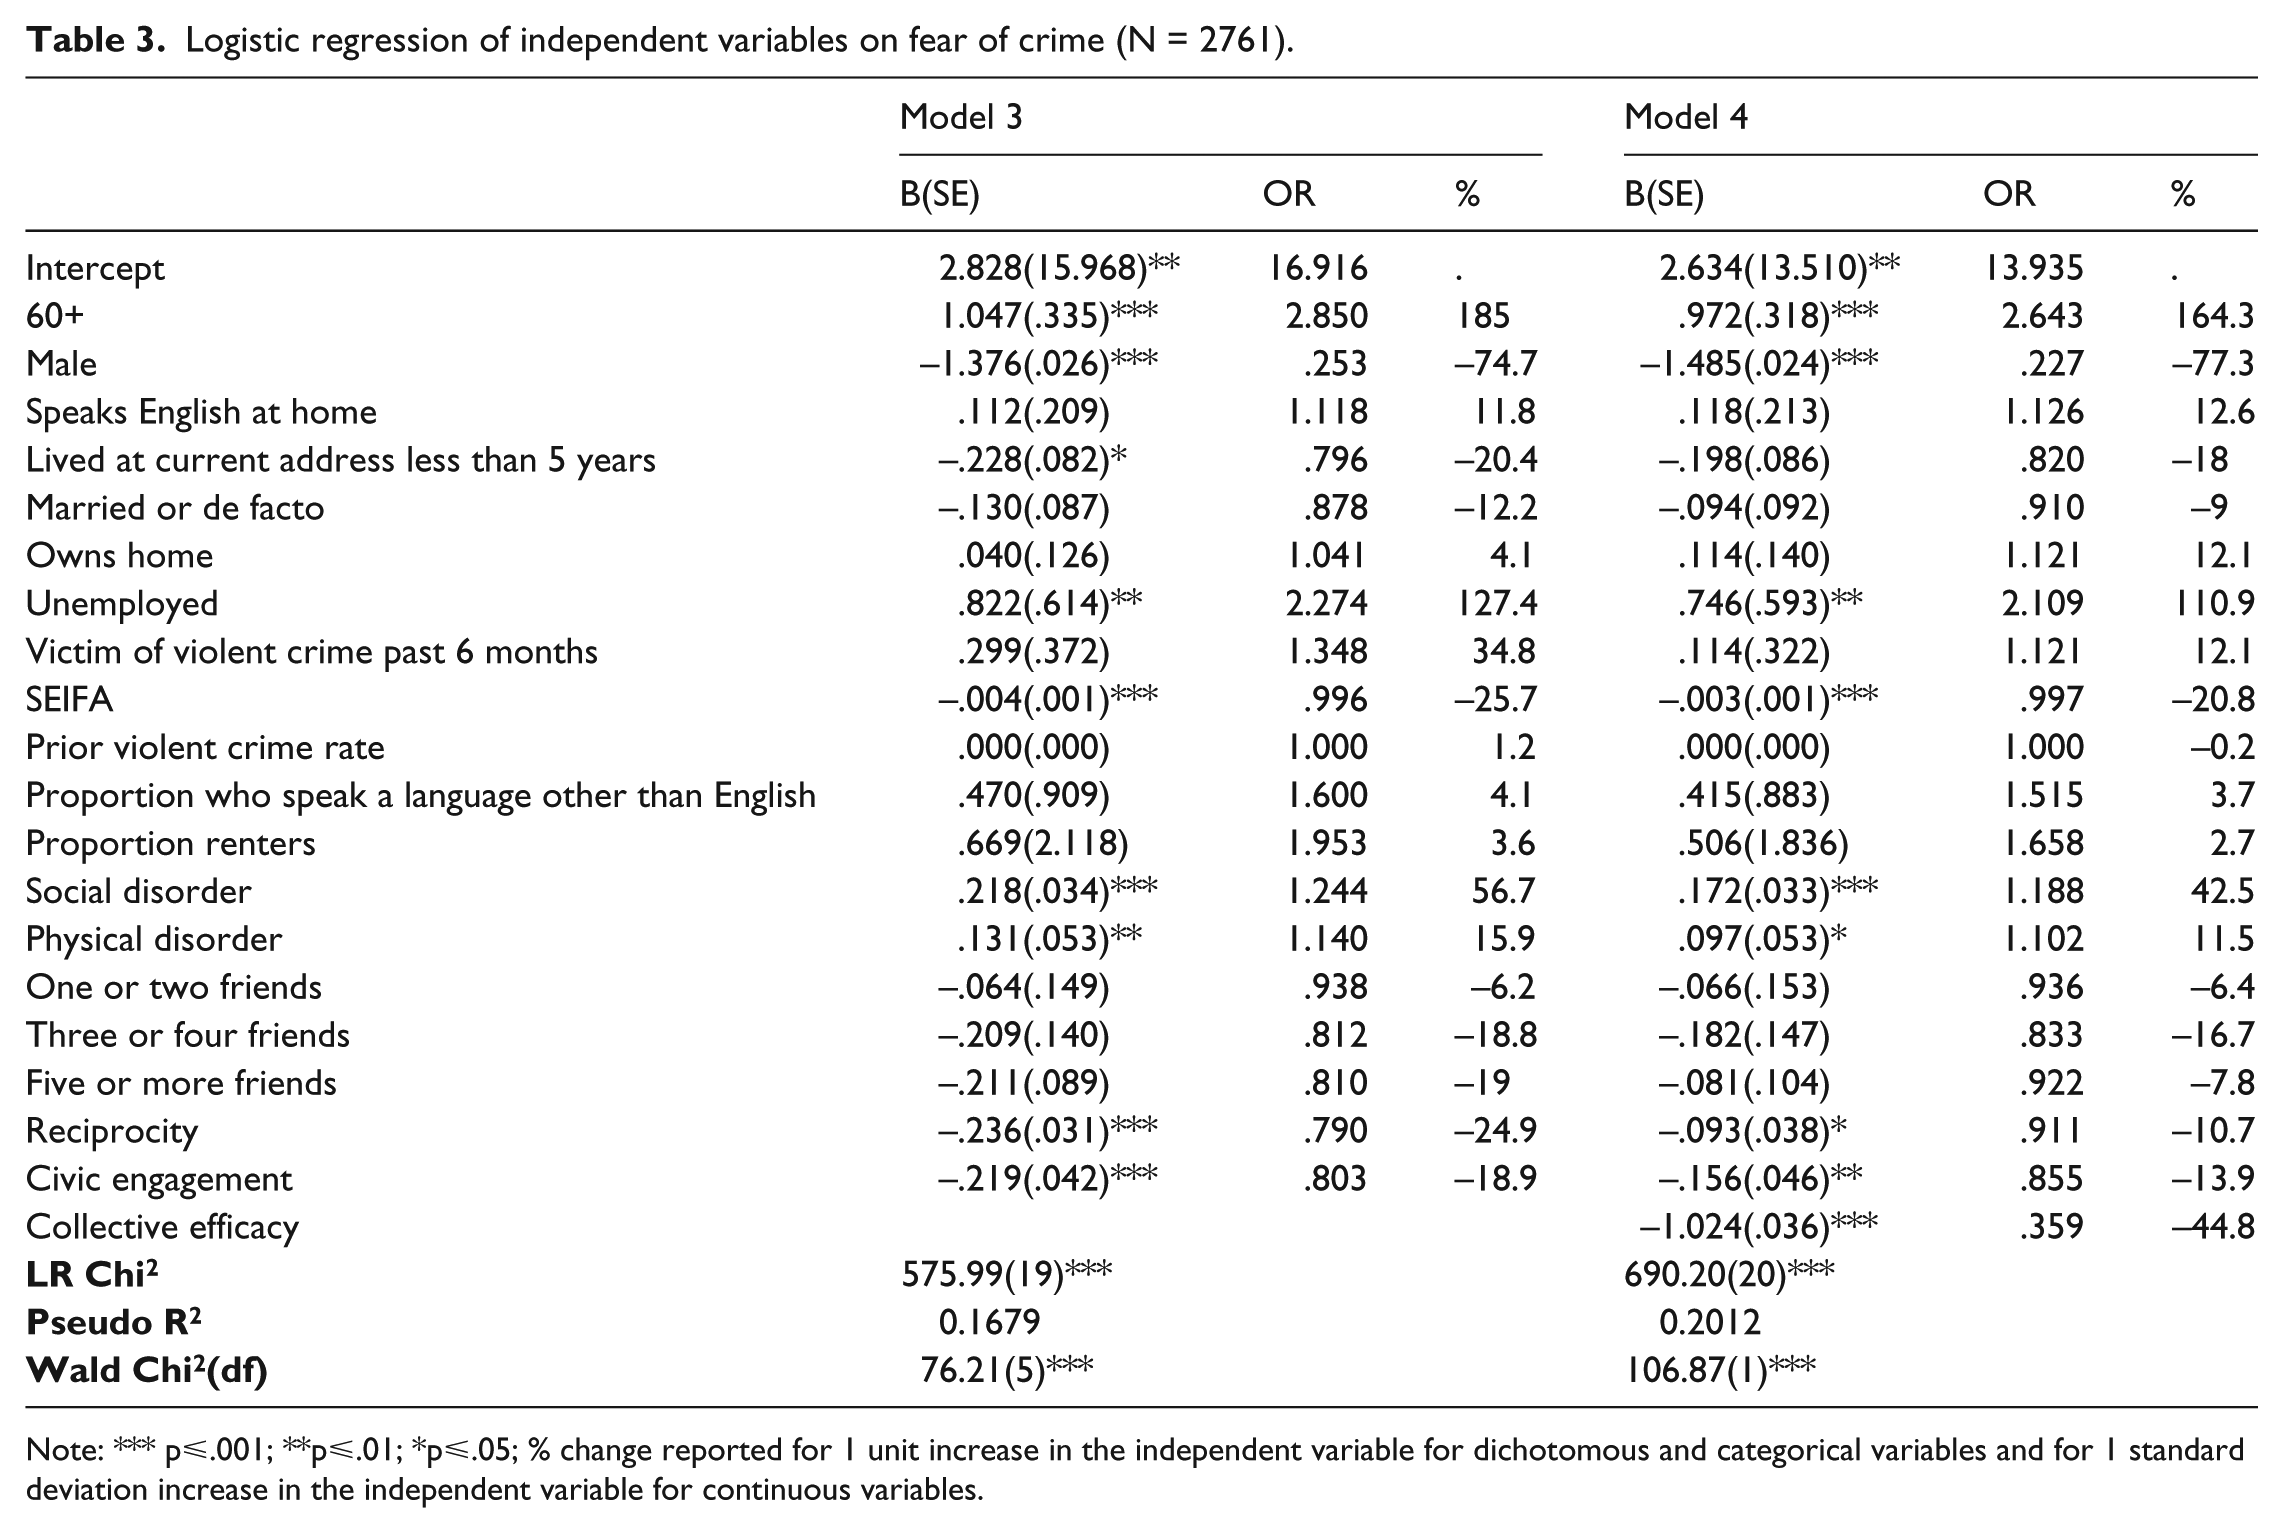
Note: *** p⩽.001; **p⩽.01; *p⩽.05; % change reported for 1 unit increase in the independent variable for dichotomous and categorical variables and for 1 standard deviation increase in the independent variable for continuous variables.
In Model 2 perceptions of social and physical disorder were added to the model. With the addition of these variables the pseudo R2 increased to .145 indicating that an additional 3.5% of the variation in fear of crime was explained by the introduction of social and physical disorder. As we would anticipate based on the disorder model (e.g. Brunton-Smith et al., 2014; Markowitz et al., 2001), both social (OR = 1.232, p ⩽ .001) and physical disorder (OR = 1.150, p ⩽ .01) increased the odds of being fearful.
In Model 3 social capital variables were added to the model (see Table 3). Taken together the social capital variables (social ties, reciprocal exchange and civic engagement) explained an additional 2.5% of the variation in fear of crime. Having social ties in the neighbourhood (compared to lacking social ties) was not significantly related to fear of crime. However, reciprocity and civic engagement were significantly associated with fear of crime. Reciprocity among neighbours reduced the odds of being fearful (OR = .790, p ⩽ .001), as did civic engagement (OR = .803, p ⩽ .001).
In Model 4 collective efficacy was added. Collective efficacy significantly reduced the odds of being fearful (OR = .359, p ⩽ .001). When taking all of the variables into account, Model 4 explained 19.6% of the variation in fear of crime. To compare the effects of the variables in the final model we can compare the percentage change in fear of crime for one unit increase (for categorical variables) in the independent variable, or the percent change per standard deviation of the independent variable (for continuous variables). When comparing the social capital variables we can see that the addition of collective efficacy reduces the effects of the other social capital variables in the model, but did not fully mediate these relationships. We also see that collective efficacy had the strongest effect on fear of crime of the social capital/social integration variables included.
Discussion and conclusion
This article examined the predictors of fear of crime, providing a thorough examination of the vulnerability, disorder and social integration models, with the addition of collective efficacy. Using data collected from residents living in Brisbane neighbourhoods, we built on prior research to distinguish the effects of different features of social capital and to test these fear of crime models incorporating a hierarchical sampling design.
We found support for the theory that community processes (including reciprocal exchange, civic engagement and collective efficacy) are associated with reduced fear of crime. Consistent with prior studies, we found collective efficacy is an important social process associated with reduced crime fears (Brunton-Smith et al., 2014; Gainey et al., 2011; Gibson et al., 2002; Lee and Earnest, 2003; Pitner et al., 2012; Swatt et al., 2013). Moreover collective efficacy (one element of social capital) resulted in the largest percentage change of fear of crime of all the community process variables. Our findings help to delineate collective efficacy’s comparative strength in predicting fear of crime and support the notion that community processes go some way toward explaining fear of crime.
Our findings also extend our understanding of fear of crime in the Australian context, and, specifically, in the city of Brisbane. Previous research has examined the spatial distribution of crime in Australia (see Jobes et al., 2004; Mazerolle et al., 2010). However only one study examined the spatial distribution of fear of crime, and this analysis involved a much smaller sample (McCrea et al., 2005). McCrea et al. (2005) investigated fear of crime in the neighbourhood context with a sample of one resident per neighbourhood. The current study extends on this research by including a large sample of individuals situated within neighbourhoods. While the structure of the data did not necessitate multi-level modelling, our sample of residents situated within neighbourhoods helps us to better realise the neighbourhood context of fear of crime.
Despite these contributions, our study is not without limitations. In the analyses, we utilised a single-item measure of fear of crime, and single-item measures can be unreliable. Moreover, our measure of fear captures global cognitions of fear and does not measure the specific crimes that participants fear (see Brunton-Smith et al., 2014 for a more sophisticated measure of fear of crime; see also Farrall et al., 1997; Girling et al., 2000; Hollway and Jefferson, 2000; Jackson and Gray, 2009). While our use of this single-item measure was consistent with that used in prior studies (see for example McRae et al., 2005), we recommend that future research incorporate multi-dimensional measures of fear of crime. Similarly, our measure of civic engagement tapped into only three types of civic engagement (i.e. signing a petition, attending a public meeting and joining with people to solve a local problem), while there may be many other types of civic engagement (e.g. writing a letter to a local government representative or attending a rally or protest march) that are not captured by this measure.
Our study is also cross-sectional in nature. We employed data collected at one time-point in 2005. To establish an understanding of fear of crime trends over time, a longitudinal design is required (Markowitz et al., 2001; Robinson et al., 2003). In particular, scholars have noted that there may be reciprocal effects between collective efficacy and fear of crime, and collective efficacy and disorder (Sampson and Raudenbush, 1999; Xu et al., 2005). That is, if disorder and fear of crime can result in community withdrawal, they may also lead to further losses in collective efficacy and other elements of social capital. We recommend that future research examine the longitudinal changes in community processes and fear of crime in the neighbourhood context.
Despite these limitations, our study offers insight for policy development. Renauer (2007) argues that a disproportionate amount of current research focuses on how individual factors (such as gender and victimisation history) and socio-economic factors (like social disadvantage) affect fear of crime, while the role of community processes is often neglected. Our findings show that community processes are indeed associated with reduced fear of crime in neighbourhoods.
When considering how we can reduce fear of crime, relatively static factors like socio-economic status are clearly hard to change. Our research indicates that supporting and encouraging positive community processes in neighbourhoods may be a viable option when seeking to reduce fear of crime in neighbourhoods (see also Gittell and Vidal, 1998; Woolcock and Narayan, 2000). Implanting social capital in neighbourhoods may be achieved with the help of local institutions. For example, in their qualitative study of Brisbane neighbourhoods, Sargeant et al. (2013) found that the role of public institutions (particularly the police) in helping to facilitate collective efficacy was particularly important in the face of disadvantage. We suggest that institutions such as local governments, schools and police may all have a role to play in encouraging social capital and collective efficacy in communities. For example, local governments can play a role by providing resources to support community groups (e.g. community halls or meeting places) and local sporting teams (e.g. equipment and sporting fields). Local schools can play a role by establishing ‘phone trees’ and facilitating parent and citizen associations. Local police can play a role by improving people’s experiences with, and perceptions of police, and implementing community policing partnerships. Research finds that policing may be particularly important in encouraging collective efficacy as police can ‘signal norms for behaviour to community residents’ and can provide a supportive resource to community residents when they seek to intervene in community problems (Sargeant et al., 2013; see also Kochel, 2012; Sargeant, 2015; Silver and Miller, 2004).
As we note, fear of crime can lead to anxiety, depression and community withdrawal (Box et al., 1988; Grabosky, 1995; McCrea et al., 2005; Skogan, 2009). In this study we found that community processes can have a significant effect on reducing fear of crime in Brisbane neighbourhoods. Implanting strategies to boost social capital and collective efficacy may therefore have a significant effect on individual and neighbourhood wellbeing.
Footnotes
Acknowledgements
Our thanks to Dr Judy Rose, who provided feedback and guidance to the authors on previous drafts and Dr Renee Zahnow, who compiled the crime data.
Funding
The author(s) disclosed receipt of the following financial support for the research, authorship, and/or publication of this article: This article was supported by ARC Linkage Grant LP0453762. The authors wish to thank the research partners of the ACCS Wave 1 project including the Office of Economic and Social Research (Queensland Treasury), the Queensland Police Service, and the Department of Communities.