






Abstract
Diabetic Retinopathy (DR) is a medical condition in which high blood sugar levels damage the retina’s blood vessels. Existing Solutions for multi-class DR identification are computationally intensive and also suffer from low accuracy. There is an immense need for an automated, computationally efficient approach for monitoring DR progression in diabetic patients. The study proposed Random Forest (RF), Logistic Regression (LR), Decision Tree (DT), and Gaussian Naive Bayes (GNB) models for the classification of retinal images into five DR classes (No, Mild, Moderate, Proliferate, and Severe) using spatial features extracted through a Convolutional Neural Network (CNN), textural features extracted through a Grey Level Co-occurrence Matrix (GLCM), and hybrid features by combining these features. The CNN, EfficientNet, PyramidCNN, and Pyramid Vision Transformer (PVT) were also evaluated for the classification of DR stages. The results revealed that the RF model with hybrid features outperformed, with an accuracy of 98.00% and high performance across all evaluation metrics, with a 1.00% increase over existing approaches. The EfficientNet model also performs competitively with 97.00% accuracy. The ML models also emerged as computationally efficient in terms of training and inference time for deployment in low-resource clinical environments for automated monitoring of DR progression in diabetic patients.
Keywords
Introduction
Diabetes is a global health issue that affects around 589 million individuals across the world. 1 According to one estimate, it is expected that diabetic patients might reach 853 million individuals worldwide by 2050. 1 Diabetes causes many health-related complications, including Diabetic Retinopathy (DR).2,3 Diabetes affects the blood vessels of the eye due to high blood sugar levels. With the passage of time, the DR might lead to blindness in a diabetic patient if not treated properly. Around 30-40% of the diabetes patients are suffering from the issue of DR. 4 Among people who have diabetes, 80.00% will develop DR, especially the longer they have the disease. Detection of DR is the foundation for effective management of DR in diabetic patients. 5
Early diagnosis and DR management are the only measures against the progression of DR in diabetic patients. 4 Existing resources are limited to the management of DR in diabetic patients.6,7 Regular monitoring of diabetic patients is very important for effective management of DR in diabetic patients.8,9 Existing solutions for DR detection are costly and time-consuming, making it difficult for regular monitoring of DR progression in diabetic patients.10,11 DR can cause severe issues if not identified in the early stages of DR. Therefore, regular monitoring of DR in diabetic patients is very important.
Global health expenditures for diabetes are attributed to be more than 1 trillion United States Dollar (USD) with a 338.00% increase over the past 17 years. 12 Urbanisation, poor diets, sedentary lifestyles, and obesity are the major reasons for the increase in diabetes across the world. People in low-income countries are more prone to diabetes due to a lack of information and facilities for its early diagnosis. 13 People in low-income countries are also unable to manage it effectively and are more prone to the development of DR in diabetic patients. 14
The primary cause of DR in diabetic patients is inadequate management of diabetes, leading to blood sugar levels that affect blood vessels.
15
This deterioration results in vascular abnormalities and progression of DR over time.
16
Diabetes is a global epidemic and the leading cause of vision impairment.
17
DR progresses through several stages, which are described below. The stages of DR progression are depicted in Figure 1. 1. 2. 3. 4. 5. Stages of DR progression in the diabetic patient.

The most important step in the management and treatment of DR in diabetic patients is the regular monitoring of the diabetic patients. The health sector is working very hard to create awareness and tools for the early management of DR to avoid loss of vision in diabetic patients. Despite these efforts, a substantial portion of the population remains affected by diabetes, projections suggesting a two-fold increase by 2030. 18 Addressing this growing number of DR patients requires early diagnosis and regular monitoring from the initial stages of DR onset.
Accurate identification of DR levels from retinal images is important for effective management of DR in diabetic patients. 15 Current diagnostic methods rely heavily on expert interpretation and detailed clinical analysis, which are both resource-intensive and time-consuming. Machine learning significantly impacts every aspect of life. 19 Machine learning has an important contribution in the medical field.20,21 Machine learning has the potential to play a significant role in medical diagnosis, especially for the DR classification.22,23
Machine learning advancements have shown remarkable progress to play significant roles in every aspect of life.24–27 Recent advances in Computer-Aided Diagnosis (CAD) systems have shown significant success in detecting and classifying DR stages. 28 The ML approach accelerates the diagnostic process and improves accuracy. 29 Integrating ML -based systems into clinical practice could revolutionise the diagnosis of DR. These systems offer several advantages, including reduced diagnostic time, greater consistency, and the ability to handle large numbers of patients. 20 The healthcare sector can provide more effective, timely, and accessible solutions. Machine learning technologies hold great promise for achieving these goals. 30 Integrating ML technologies into clinical practice will be crucial in combating the growing prevalence of DR worldwide. 31
Machine learning-based methods can accurately analyse retinal images for the accurate diagnosis of DR in diabetic patients. 16 These technologies can help reduce vision loss and improve disease management around the world. 32 The health sector is actively working to treat DR and raise awareness about diabetes management. 33 Despite these efforts, there remains a need to focus on managing DR patients by developing advanced diagnostic tools with the aid of ML. 13 Addressing this growing number of DR patients requires early diagnosis and regular monitoring of the initial levels.
Computer vision has played a substantial role in medical diagnostics by automatically interpreting the visual information from X-ray, Medical Resonance Imaging (MRI) and retinal images. Computer vision has taken over the role of an expert in detecting and identifying precise medical diagnostics from medical imaging. Nowadays, computer vision technologies are an integral part of medical diagnostics and assist the expert in medical diagnosis. Computer vision has played a significant role in improving diagnosis accuracy, clinical inspections and early disease detection. Convolutional Neural Networks (CNN) are an integral part of computer vision that have the ability to automatically extract features.
The CNN have also shown its potential for accurate medical diagnostics. In the case of DR, the CNN model has already shown tremendous success in the automatic extraction of features for different applications. Moreover, the CNN-based diagnosis of DR can prove to be very cost-effective in regions with limited access to ophthalmologists. The CNN-assisted computer vision can also support clinical findings, improve decision-making, screening, and help prevent diabetes-related blindness through timely diagnosis and intervention. Despite its performance, its requirements for a large dataset and heavy computational inefficiency demand exploration of more lightweight alternatives to be used in resource-constrained medical setups.
Advancements in computer vision, particularly, have shown very promising performance in medical diagnosis. 15 Deep learning approaches also shown excellent performance in the identification of DR. The deep learning approaches are computationally exhaustive and difficult to deploy in clinical settings with limited resources. 34 Due to computational inefficiency, these approaches are also hard to integrate with smart model devices that also tend to be very resource-constrained. 35 The exhaustive and high resource requirements for deep learning approaches limit their practical deployments in real-world clinical scenarios. The requirements of a large dataset for a deep learning model are also a major limitation of these approaches for use with a limited available dataset. For applications with limited data availability, alternative approaches need to be explored that can work well with a limited dataset. Moreover, existing models often focus on distinguishing between a limited number of DR levels, typically two to three, and struggle with the complexity of accurately classifying a broader spectrum of DR conditions. The similarity in different stages of DR is also a major issue in accurately classifying different stages of DR. There is a need to explore alternative ways of exploring features to deal with the complexity of features in the DR stage identifications.
Lightweight computer vision-based models must be able to classify multiple stages of DR from retinal images effectively. Such models would significantly improve clinical decision-making by providing accurate and timely assessments. Different feature extraction approaches have also emerged. In this respect, spatial and textural features are very important. Grey-Level Co-occurrence Matrix (GLCM) is a mathematical approach to analyse textures in images by examining the spatial relationship between pixels.36,37 Spatial features refer to characteristics of an image that are based on the arrangement and relationships of pixels in space.
38
Both of these features are very important for better classification and understanding of images. The study also intends to evaluate ML models with spatial and textural features and with combinations of these features as a hybrid approach. Taking into account the importance of similar and complex features, the objectives of the study are given below. 1. To evaluate different feature extraction approaches and ML models in terms of their predictive accuracy and computational efficiency. 2. To explore light-weight ML models that can be trained with limited data for accurate classification of DR levels. 3. To explore computationally efficient models for deployment in low-resource clinical settings and smart medical devices with integrated diagnosis of DR in diabetic patients.
The contributions of the study are as follows: 1. A systematic approach is proposed for the evaluation of feature extraction methods and ML models under similar evaluation protocols. 2. The study provides useful insights into the selection of appropriate features for the classification of the DR, regarding predictive accuracy and computational efficiency for deployment in a resource-constrained clinical environment. 3. The study also demonstrates the effective use of hybrid features with the LR model for accurate classification of DR. 4. The performance of the lightweight LR model provides an opportunity to deploy a lightweight, computationally efficient model in low-resource clinical settings and to be used with smart medical devices for integrated classification of DR stages. 5. The computationally efficient LR model with high discrimination ability among the five stages of DR, rather than being limited to a binary detection of DR.
The proposed solution is unique in its application and evaluation of different feature extraction methods and in the performance analysis of multiple ML models for multi-class identification of five distinct stages of DR. The study focuses on exploring the computationally efficient ML models that can be trained with limited available data. Moreover, the computationally efficient model also helps to deploy the model in resource-constrained smart medical devices with integrated diagnosis of DR stages.
Organisation of the study as follows:
literature review
This section reviews the current knowledge on using ML approaches to classify different stages of DR. The relevant literature is searched using the major bibliographic indices. This review was organised on the basis of the methodology of each approach.
Transfer learning based deep learning approaches
In this section, transfer learning approaches for the classification of DR classes are reviewed.
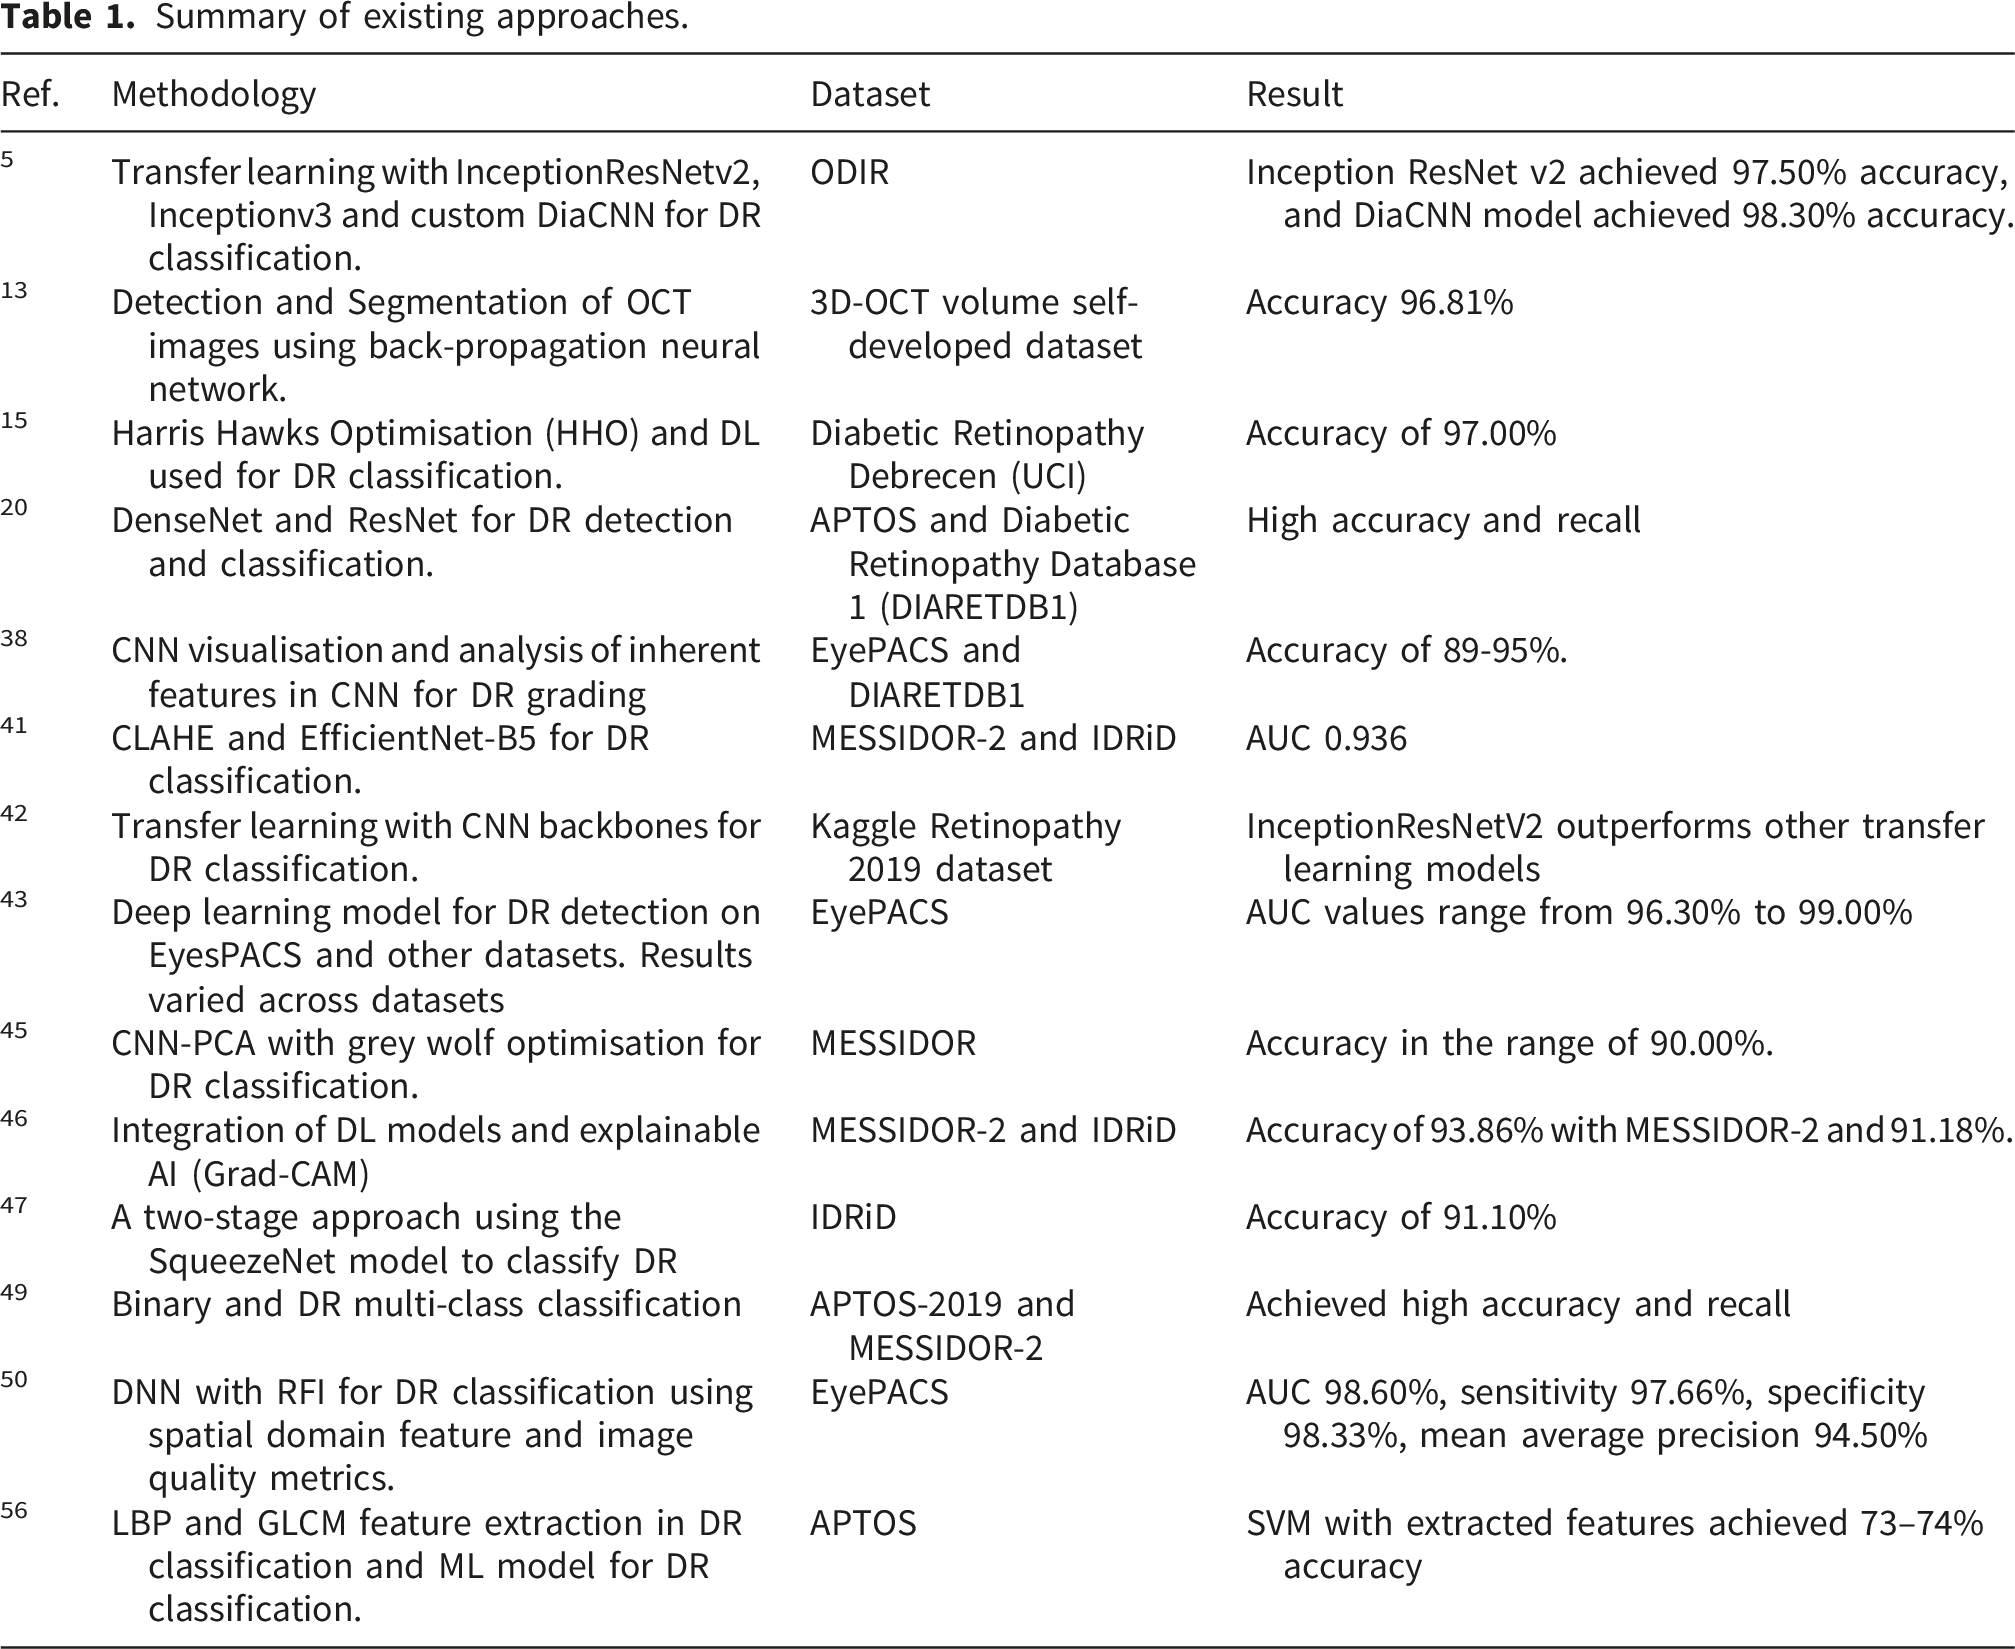
Mohamed R. Shoaib et al. 5 recommended transfer learning models named InceptionResNetv2, Inceptionv3 and custom DiaCNN for DR classification with the ODIR (Ocular Disease Intelligent Recognition) dataset. The InceptionResNetv2 achieved 97.50% accuracy, and the DiaCNN model achieved 98.30% accuracy.
Mondal Sambit et al. 20 proposed a Densely Connected Convolutional Network (DenseNet) and Residual Network (ResNet) based approach for the classification of DR. Contrast-limited Adaptive Histogram Equalisation (CLAHE) was used to preprocess the images. The study showed a high accuracy of 96.98% and a recall and precision of 0.97 in binary classification. The proposed approach also achieved an accuracy of 86.08%, a precision of 0.76% and a recall of 0.82, for five DR classes.
Vora and Sudhir 28 proposed a CNN model for the classification of healthy retinal images with DR using the Eye Picture Archive Communication System (EyePACS) dataset. The model achieved an accuracy of 76.00%. Sungheetha et al. 32 proposed a method to classify five classes of DR from low to severe using the CNN model. The proposed model showed a recall of 92.00%, a precision of 89.00%, a specificity of 92.00%, and an accuracy of 97.00%. Saranya et al. 33 proposed the identification of blood vessel-based DR in fundus images using the Visual Geometry Group (VGG-16) on two datasets with an accuracy of 96.oo% and 95.00% for both datasets.
Vijayan et al. 39 presented a binary classification of DR using the CNN and InceptionV3 models. The proposed solutions attained an accuracy of 84.32%. Macsik et al. 40 proposed a CNN with a minimum training set and memory use for the binary classification of DR. The study compared the performance of CNN and the Local Binary Convolutional Neural Network (LBCNN) for DR classification. The results showed that LBCNN performed better for the binary classification of DR compared to the CNN model.
Pour, Asra Momeni et al. 41 proposed CLAHE and EfficientNet-B5 for DR classification using the MESSIDOR-2 (Methods to Evaluate Segmentation and Indexing techniques in the field of Diabetic Ophthalmology Retinal images) and IDRiD (Indian Diabetic Retinopathy Image Dataset) datasets. The proposed model showed an Area under the Curve (AUC) of 0.936. Yadav, Yadavendra et al. 42 proposed transfer learning with CNN backbones for DR classification using the Kaggle Retinopathy 2019 dataset. The proposed approach with the InceptionResNetV2 model outperformed for the DR classification. Chetoui, Mohamed et al. 43 suggested a deep learning approach for DR detection on EyesPACS and other datasets. The evaluation of the models revealed that results varied across datasets, with AUC values ranging from 96.30% to 99.00%.
Jordi de La Torre et al. 44 proposed a pixel-wise score propagation-based approach for the classification of DR. The EyePACS dataset was used by dividing it into two split points. A Quadratic Weighted Kappa (QWK) value of 0.814 and 0.801 was observed from the validation and testing datasets.
Hybrid machine learning (ML) and deep learning models
In this section, the hybrid approaches for DR classification were reviewed, in which two or more models were integrated to improve performance for DR classification.
Sudarmadji et al. 30 recommended CNN-based models using methods to evaluate segmentation and indexing techniques using the MESSIDOR and Kaggle datasets for DR classification. The proposed architecture achieved an accuracy of 99.66% using the MESSIDOR dataset and an accuracy of 98.43% with the Kaggle dataset in the DR classification. Pour et al. 41 proposed a CLAHE-based approach for DR classification. The proposed approach helped to improve image quality and provided better results in pre-processing. The AUC of the proposed approach for DR classification was recorded at up to 0.932.
Gadekallu et al. 45 recommended a CNN-Principal Component Analysis (CNN-PCA) and grey wolf optimisation for the extraction of features from DR images. This method showed excellent performance in DR classification.
Kazi Ahnaf Alavee et al. 46 proposed a CNN-based deep learning model for binary and multi-classification of DR with integration of explainable Artificial Intelligence (xAI). The DenseNet121, Xception, ResNet50, VGG16, VGG19, and InceptionV3 were used to extract high-level features from fundus images. The ML models, such as Support Vector Machines (SVM) and Recurrent Neural Networks (RNN), were used for comparative analysis. The proposed CNN model outperformed existing transfer learning approaches for the detection of DR. The proposed CNN model showed a high accuracy of 95.27% in the multi-class classification of DR, which is very high compared to a high baseline transfer learning model, Xception, which achieved an accuracy of 82.00%. The proposed approach also showed the potential of a hybrid model.
S. Zulaikha Beevi 47 proposed a two-stage deep learning approach for multilevel classification of DR. In the first stage, the SqueezeNet model optimised with the Fractional War Strategy Optimisation (FrWSO) algorithm was used to classify retinal images into normal and abnormal images. In the latter stage, the retinal images were classified into different severity stages using a Deep Convolutional Neural Network (DCNN). The proposed approach showed high performance with an accuracy of 91.10%. Alfian et al. 48 proposed Recursive Feature Elimination (RFE) and Deep Neural Network (DNN) for DR classification and feature extraction using the dataset developed in Iran. The evaluation showed an accuracy of 82.03% for the DR classification. Nahiduzzaman et al. 49 proposed binary and multi-class DR classification using the Asia Pacific Tele-Ophthalmology Society-2019 (APTOS-2019) and MESSIDOR-2 datasets with high accuracy and recall.
Pinedo-Diaz et al. 50 recommended a DNN and a Random Forest Importance (RFI) model for feature extraction-based DR classification. The proposed methodology achieved an AUC value of 98.60%, a sensitivity of 97.66%, a specificity of 98.33%, and a mean average precision of 94.50% for the classification of DR.
Nahiduzzaman et al. 51 proposed the CLAHE and parallel CNN model for feature extraction for accurate DR classification. The study showed an accuracy of 91.78% and 97.27% with the DR-2015 and APTOS-2019 datasets. Modi Praveen et al. 52 proposed preprocessing and deep belief nets with an accuracy of 91.28% for the identification of DR classes.
Segmentation-driven and lesion-based approaches
In this section, the segmentation-based approaches for DR classification were reviewed. Bilal et al. 53 recommended a two-stage deep learning approach for the classification of DR using U-Net models to segment blood vessels using the EyePACS dataset. The proposed methodology achieved 97.92% to classify retinal images.
Math Laxmi and Ruksar 54 used a model based on segmentation and detection of retinal images. The proposed model is based on the segmentation of retinal images and the integration of all segments for better classification. End-to-end segmentation was applied to treat abnormal lesions in DR.
Handcrafted and texture-based feature extraction approaches
In this section, different feature extraction-based approaches for DR classification were reviewed.
Ramzi Adriman 55 proposed DR detection and classification of the DR using textural features of the fundus images. The study used the Local Binary Patterns (LBP) to extract discriminating texture features from fundus images. The ResNet, DenseNet, and DetNet were used to classify the DR using textural features. The evaluation of the model showed 96.35%, 84.05%, and 93.99% for ResNet, DenseNet, and DetNet, respectively.
Nathanael Matthew Makmur et al. 56 proposed an LBP and GLCM feature extraction-based approach for DR classification with the APTOS dataset. The SVM model with extracted features achieved 73–74% accuracy.
Dharmana et al. 57 proposed a feature extraction approach for blob detection from retina images with an accuracy of 83%.
Mohamed Eman et al. 58 proposed a multi-class DR classification using PCA and deep learning models with an accuracy of 85.00%.
Review and survey for ML-assisted DR classification
In this section, different survey and review-based studies were analysed to observe the current state of DR classification using ML approaches.
Huma Naz et al. 4 reviewed deep learning techniques for DR detection. The review covers the dataset, image processing, segmentation method, feature extraction, and classification approach used. The study streamlined the selection of appropriate techniques in the development of medical diagnostics for DR. Sebastian Anila et al. 59 reviewed the recent deep learning segmentation and lesion detection of DR from retinal images. The study highlights the current methodologies and challenges associated with automated detection of DR and also explores the recent research trends.
Anila Sebastian et al. 60 reviewed recent emerging deep learning and computer vision approaches for the diagnosis of DR. The study also reviewed the publicly available datasets of DR. The study also highlights current achievements and research trends in automated DR detection.
Dolly Das 61 reviewed the emerging ML and clinical features for the classification of DR. The study also highlights the challenges for early identification of DR-related vision loss.
Summary of existing approaches.
Materials and methods
The flow chart of the proposed methodology is shown in Figure 2. Flow chart of methodology.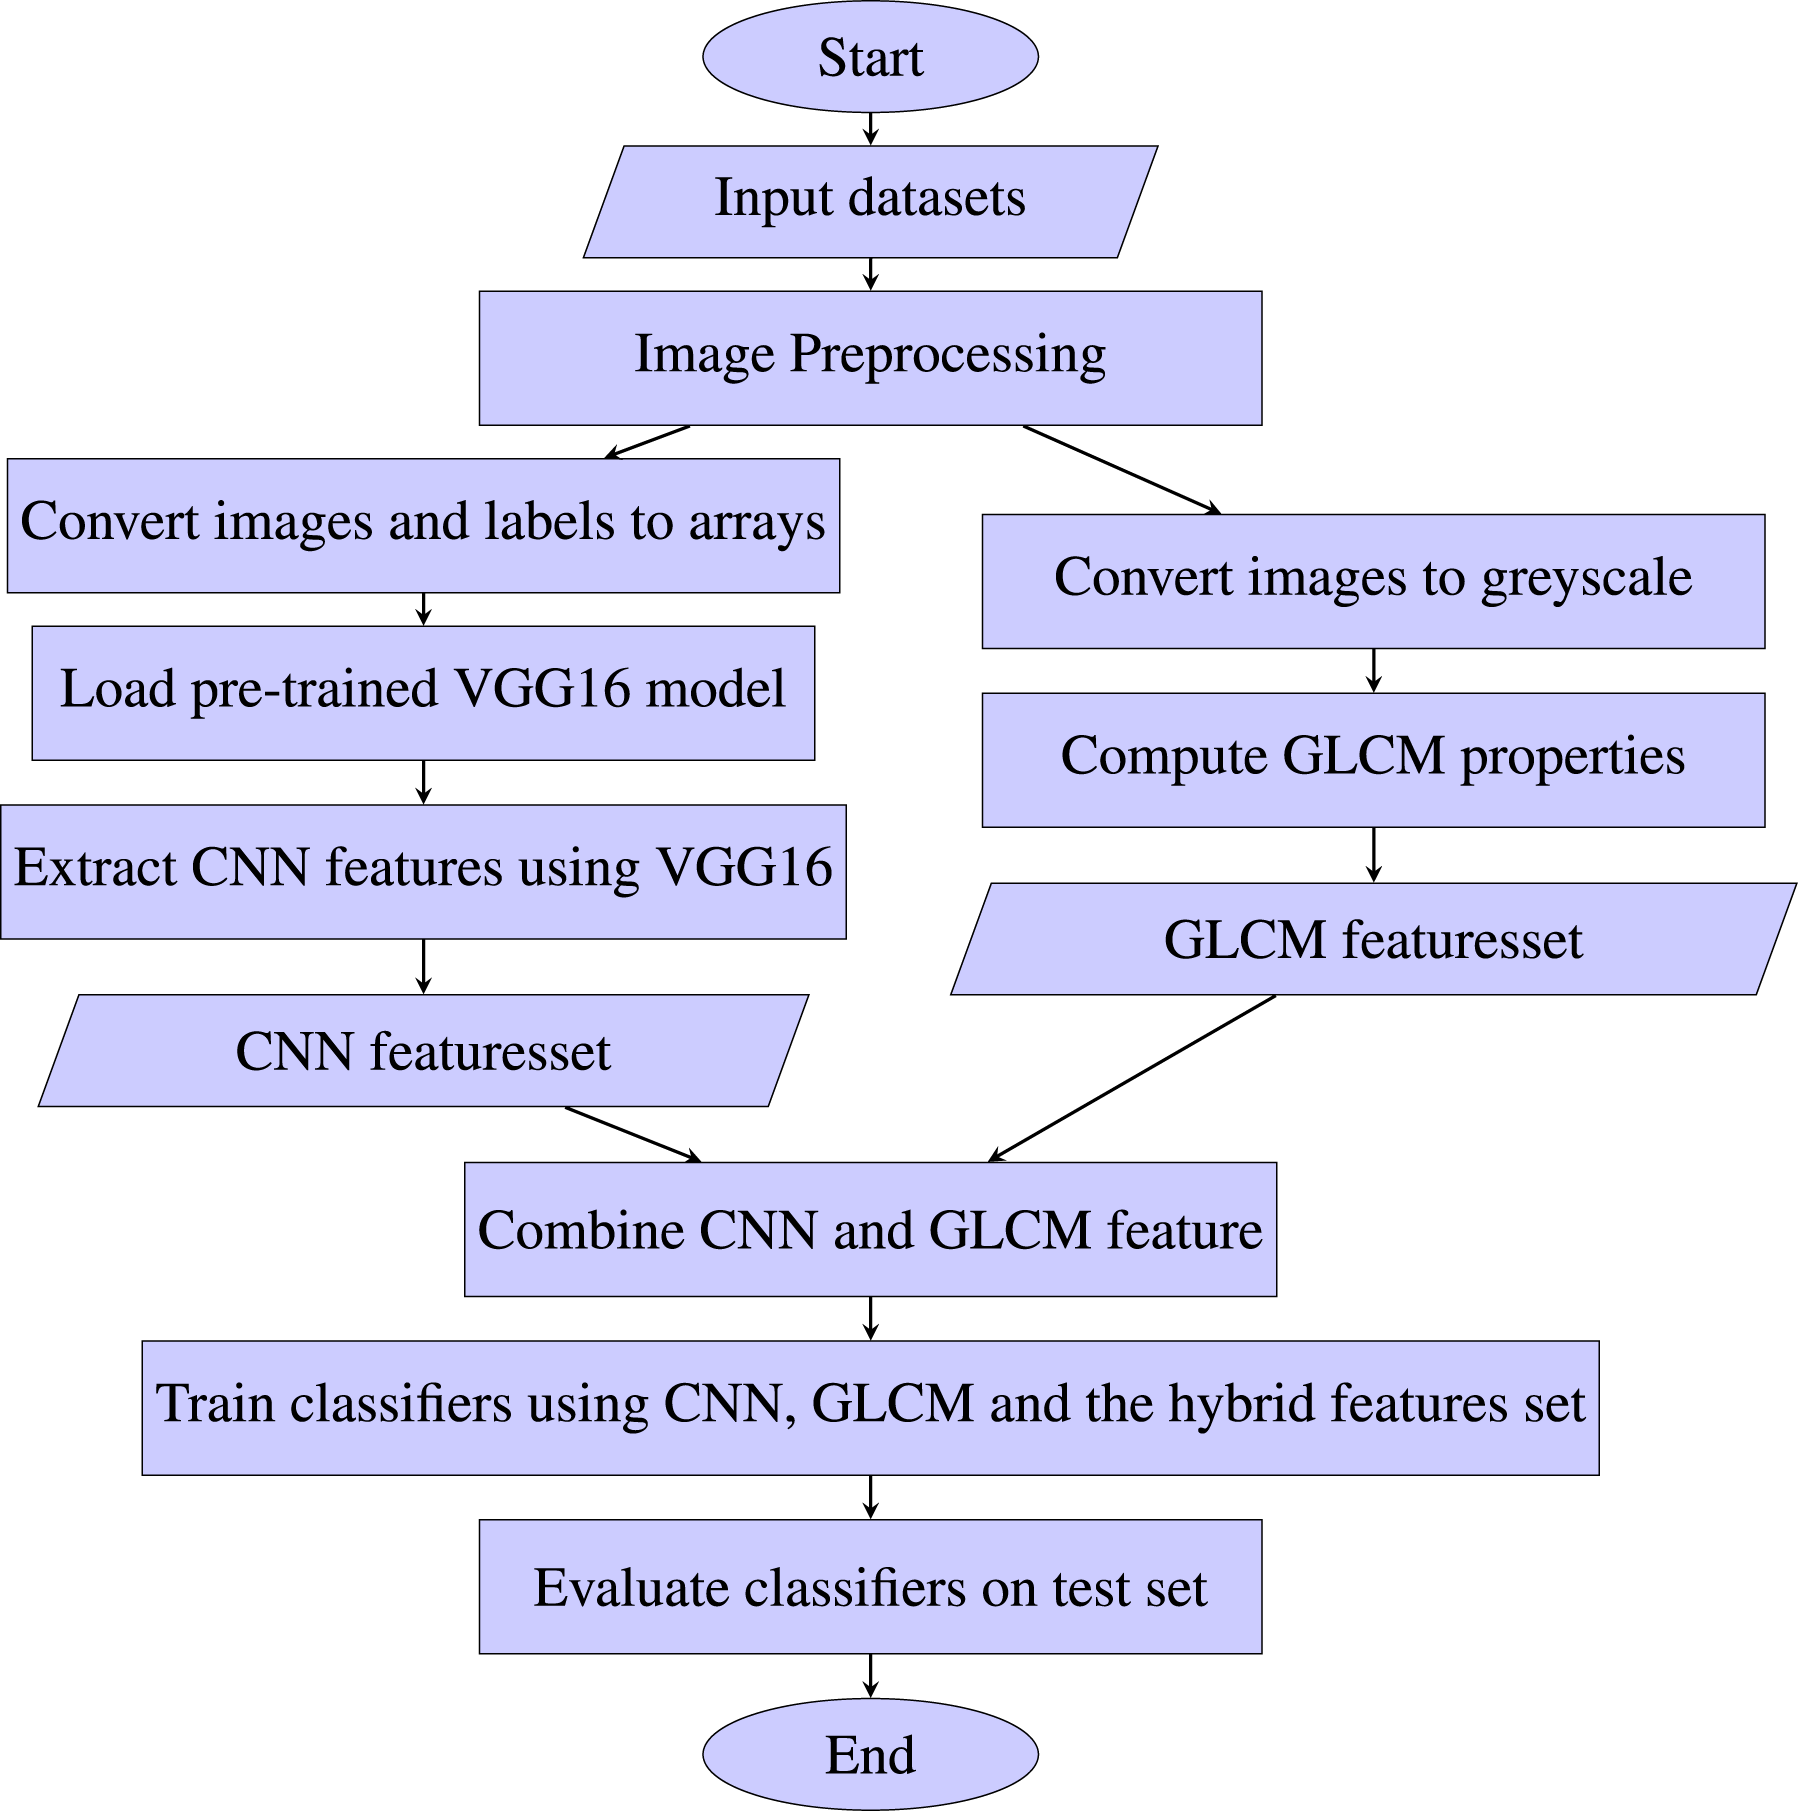
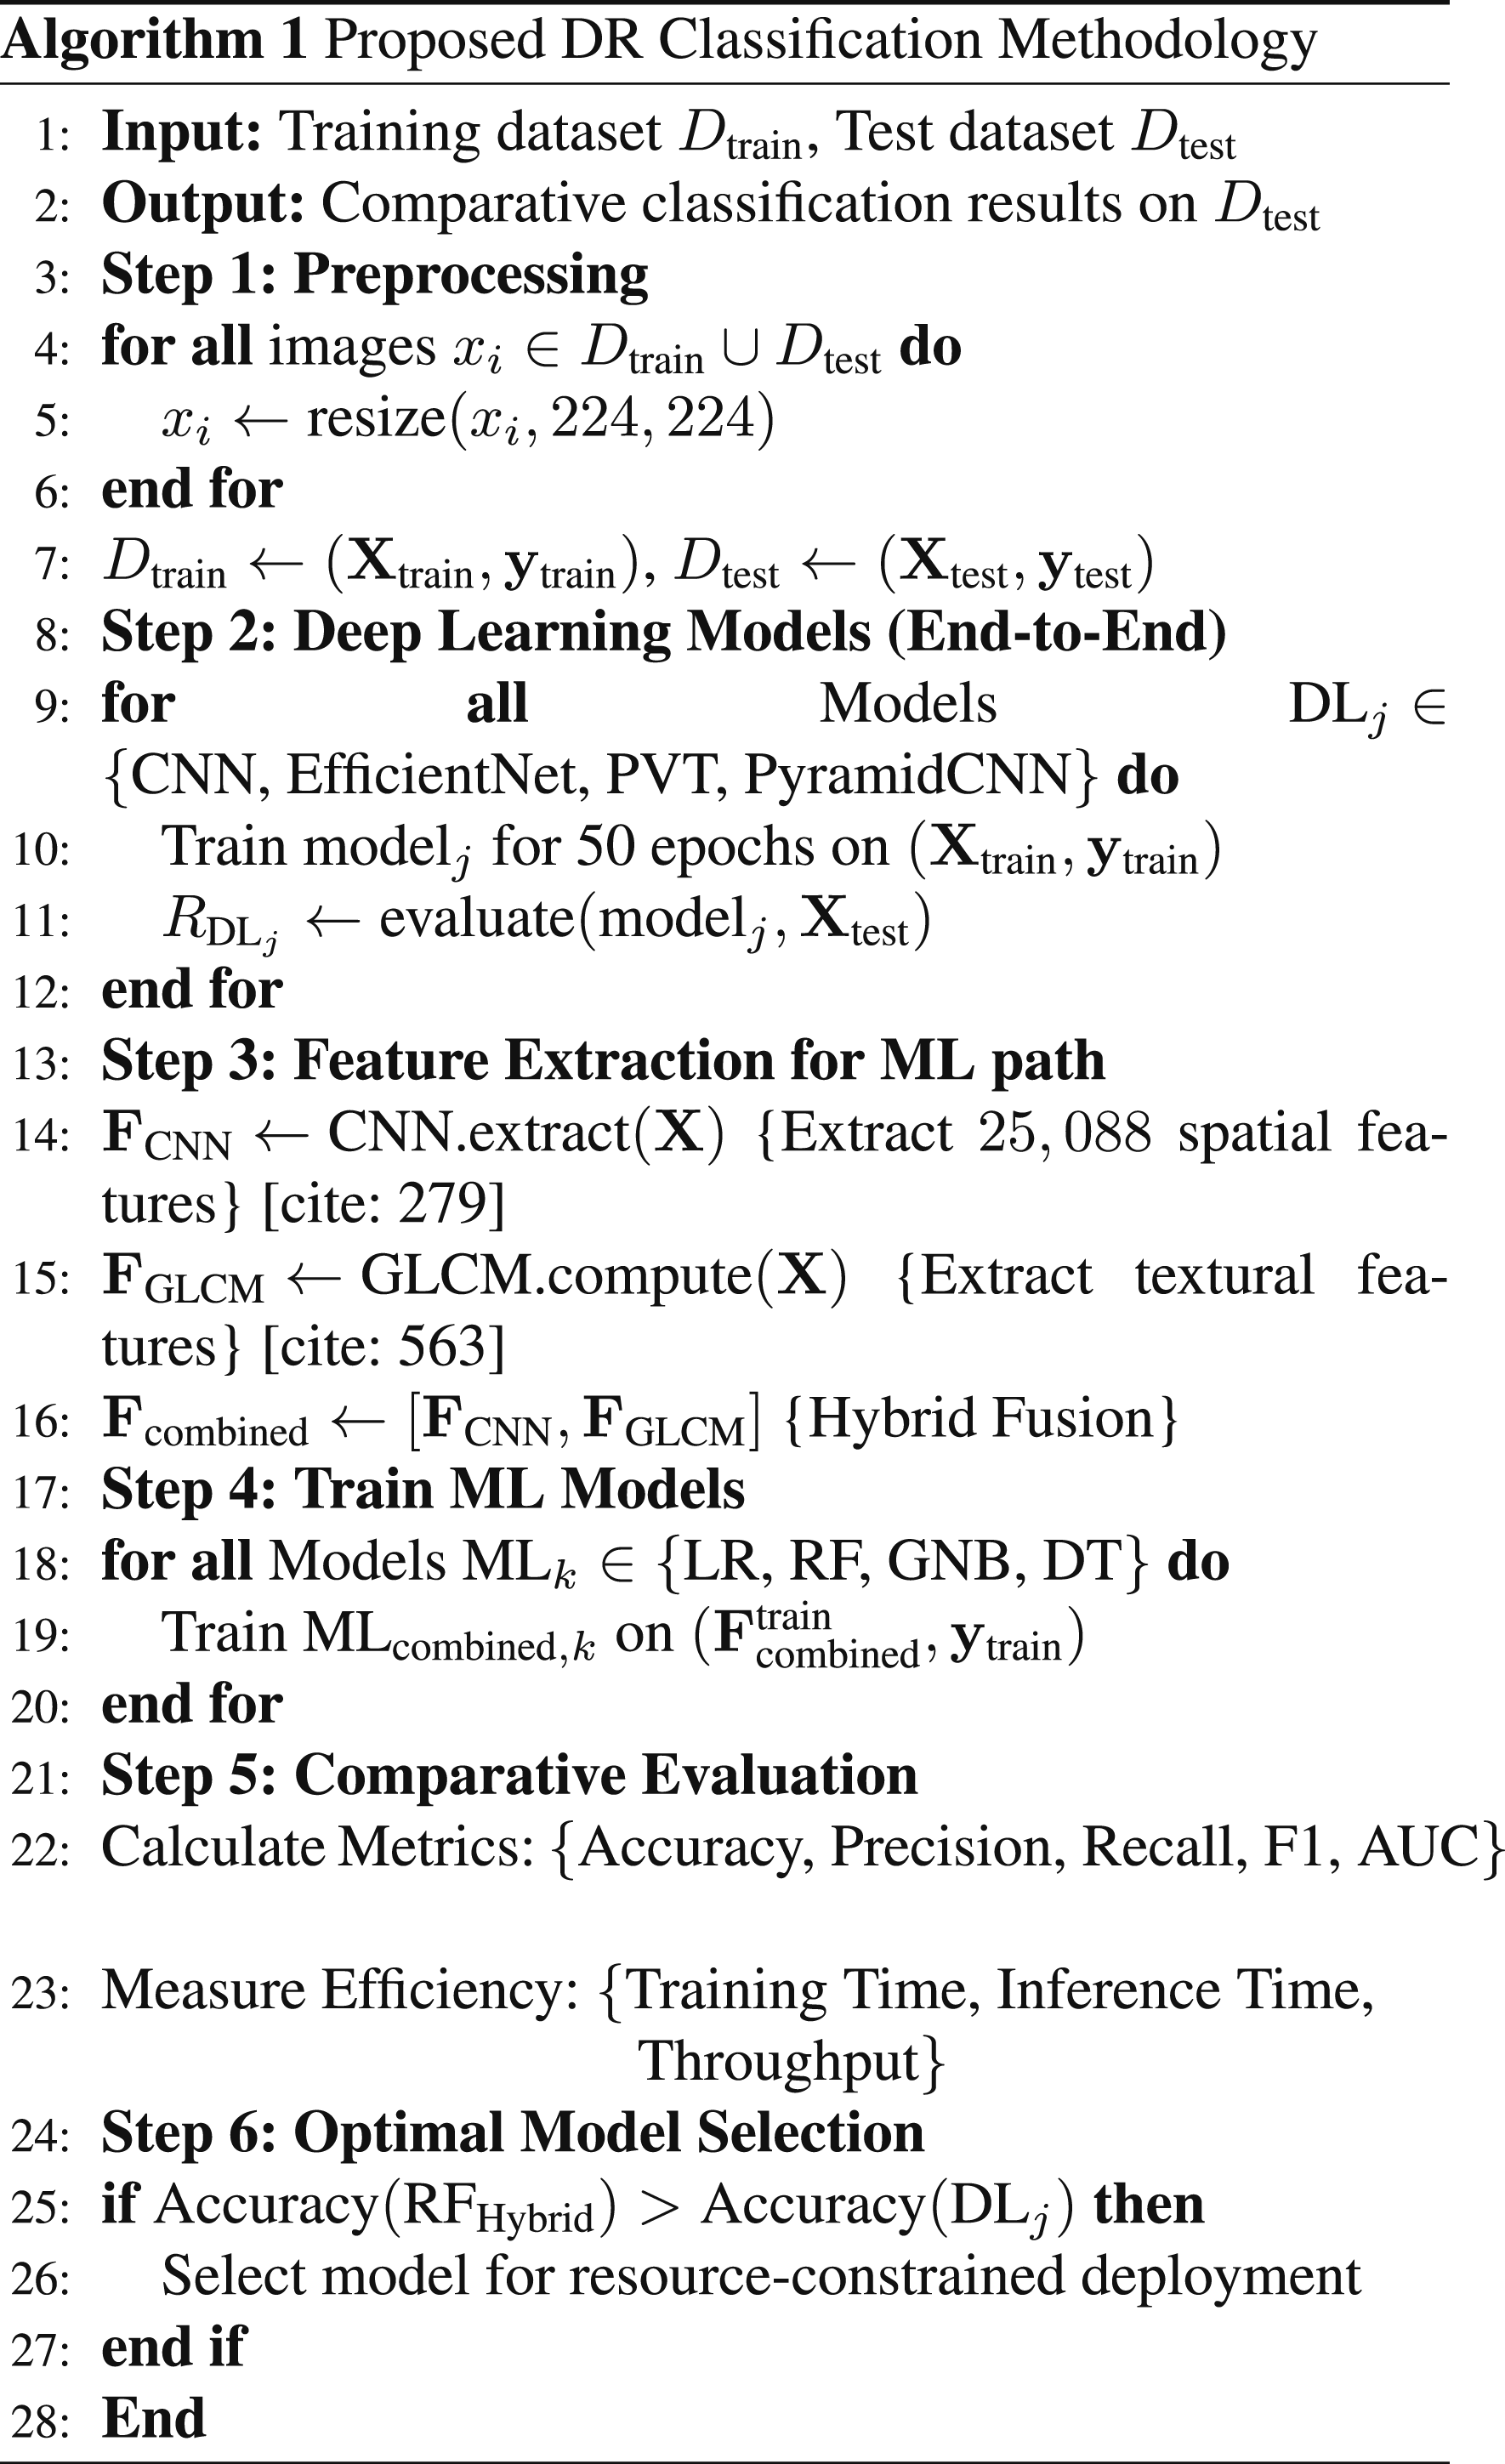
The flowchart shows the data processing, feature extraction, model training, and evaluation process. The images of the training and test datasets are processed using image enhancement techniques. The pre-trained CNN model is used to extract features from the images. The textural features of the images are extracted using the GLCM approach. The CNN-based feature set and the GLCM-based textural feature are combined. Different ML models are trained and evaluated using predefined evaluation metrics using these features. Each methodology step is also outlined in Algorithm 1 and discussed in the corresponding subsection.
Dataset
The dataset is taken from Kaggle. 12 The dataset is composed of retinal images of diabetic patients suffering from different stages of DR. The dataset is organized into five classes based on the DR level: mild, moderate, (’No’), proliferate, and severity stages of DR. The dataset consists of a large collection of retinal images with substantial variations in images. The significant variations across images in image quality, illumination, and acquisition condition provides a good opportunity to evaluate the performance of the features and ML models. These variations reflects real world clinical scenarios. The dataset provides all five standardized DR severity levels, making it very suitable for multi-class classification. In contrast, the MESSIDOR contain a relatively smaller number of images and is often used for binary classification with the purpose of detecting the presence and absence of DR. The selected dataset is also derived from EyePACS with a more fine-grained and curated form, very suitable for evaluating the performance of different ML approaches.
Data preprocessing
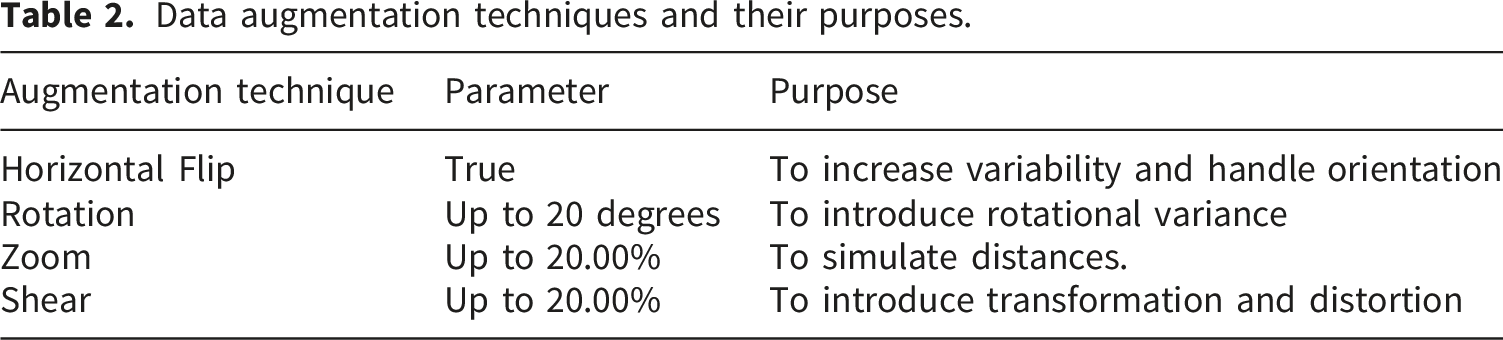
Data augmentation techniques and their purposes.

Impact of data augmentation on images.
Dataset splitting
Dataset distribution.
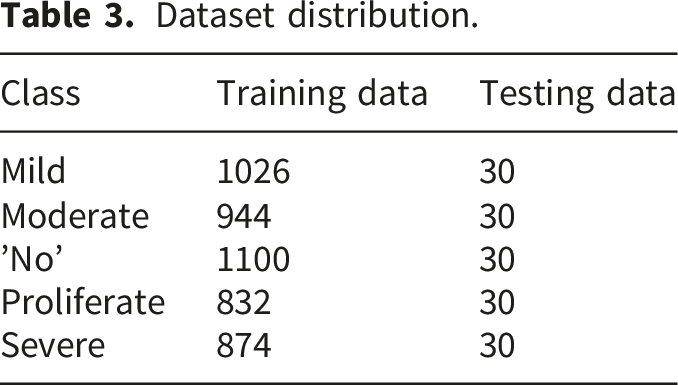
During model training, the training dataset extracts features relevant to the DR stage. An unseen dataset is used as the test dataset to assess the model. This approach helps build an accurate model to identify different stages of DR.
Feature extraction
The proposed solution is based on ML models trained using CNN-based spatial features, GLCM-based texture features, and combinations of these features as a hybrid approach. The CNN-based spatial features and GLCM-based texture features were used to capture complementary information from retinal images. Spatial features are very useful in capturing high-level semantic and structural information, such as vessel patterns, lesion shapes, and spatial distributions of pathological regions in fundus images. The spatial features are limited in capturing the texture variations that are important for discriminating the severity level of DR by identifying changes in microaneurysms and exudates. The textural features are very effective in capturing statistical texture properties, such as contrast and homogeneity, which are effective in modeling local intensity variations in retinal images. Both spatial and textural pattern provides a comprehensive representation of both global structural patterns and local texture characteristics for accurate classification of DR severity levels. Both feature types were used to assess their capability in discriminating the DR severity levels with different ML models.
Spatial feature (CNN)
The VGG-16 was used for CNN-based feature extraction. The pre-trained VGG-16 model was used for the extraction of spatial features due to its widely recognized efficiency in extracting features. 62 The VGG-16 model is loaded without the classification layer to extract features with the intermediate layer. The output of the last pooling layer was used to extract high-level spatial features and patterns in the retinal images. The resized images were used as input to the VGG-16 network. High-level spatial information was obtained from the output feature maps of the final convolutional block of the VGG-16 network. The pre-trained VGG-16 model extracts feature vectors from the different classes of DR images. The extracted feature vectors are organized into spatial feature sets. These convolutional layer outputs capture intricate spatial characteristics, such as the structure and morphology of blood vessels, which are essential for identifying different stages of DR.
Grey Level Co-occurrence Matrix (GLCM) feature
GLCM is a statistical technique to extract texture features from images by modeling the textural information from the image.36,37 GLCM describes the distribution of pixel intensity values at a given distance and direction within an image. GLCM features are based on spatial associations between pixel intensities, which quantitatively define the variations in pixel intensity in an image.56,63 The GLCM features were computed using a pixel distance of 1 and an angular orientation of 0 radians in the horizontal direction from grey-scale retinal images. The images were converted into 256 grey levels, and the GLCM was generated in a symmetric and normalized form. The contrast and homogeneity features were extracted from GLCM features for DR classification. The contrast and homogeneity were used as GLCM features to help learn textural patterns and intensity variation within an image.
64
Contrast and homogeneity were selected as textural features because they can capture local intensity variation and grey-level uniformity in retinal images and have been very successfully used as textural features for the DR classification.65,66 The contrast and homogeneity were described as follows. 1. 2.


GLCM features for the identification of different stages of DR were extracted in the following ways. 1. 2. • • 3.
The GLCM features are computed and combined with CNN to create a hybrid set of features. This approach uses deep feature representations to improve classification performance.
Machine learning models
The hybrid features extracted through CNN and GLCM were used to train four regression models: LR, RF, Gaussian Naive Bayes (GNB), and DT models. Four deep learning models were also trained and evaluated to bench mark the performance of all the models with automatic feature extraction approaches. Descriptions of these models are provided here. 1. 2. 3. 4. 5. 6. 7. 8.
Evaluation metrics
The performance of models to identify the stages of DR from retinal images is assessed using different evaluation methods. The accuracy was used to assess the overall performance of the models for the prediction of all stages of DR. The precision, recall, and F1 scores were used to evaluate the performance of the models for the identification of each stage of DR. The AUC is also used to assess the ability of the models to distinguish different stages of DR accurately. The AUC values were determined using the Receiver Operating Characteristics (ROC) curves. Moreover the computational efficiency of the model was also analyzed to determine efficiency of the models in low resource clinical environment. The computational efficiency of the model was observed in terms of training time in seconds and model inference time in milliseconds (ms). Inference time is the time taken by a model to predict the stage of DR by analyzing the image. Moreover the throughput of the model in terms of number of image processed per second also analyzed.
Result
LR, DT, RF, and GNB models were compared for the five stages of DR identification. The models were evaluated using spatial (CNN), textural (GLCM), and a combination of these feature sets as a hybrid approach. The four deep learning models named CNN, PyramidCNN, PVT and EfficientNet were also trained and evaluated using same dataset to bench mark the performance of the models for the identification of different stages of DR. The models were evaluated using the test dataset. The single-step baseline model was used to benchmark the performance and to observe the performance impact with the use of different features.
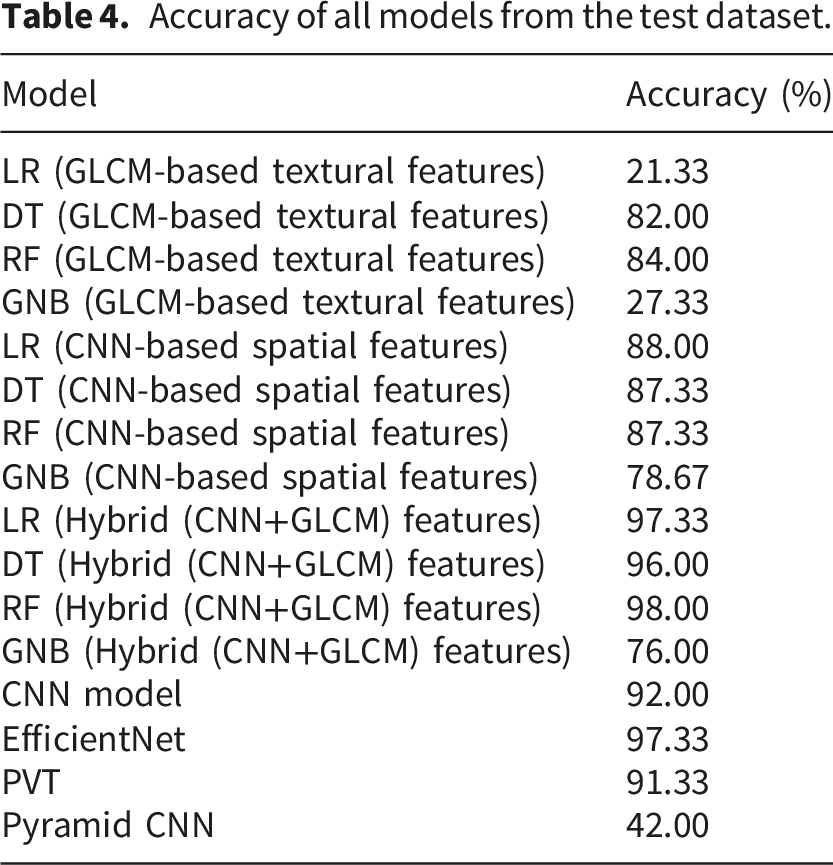
Accuracy of all models from the test dataset.
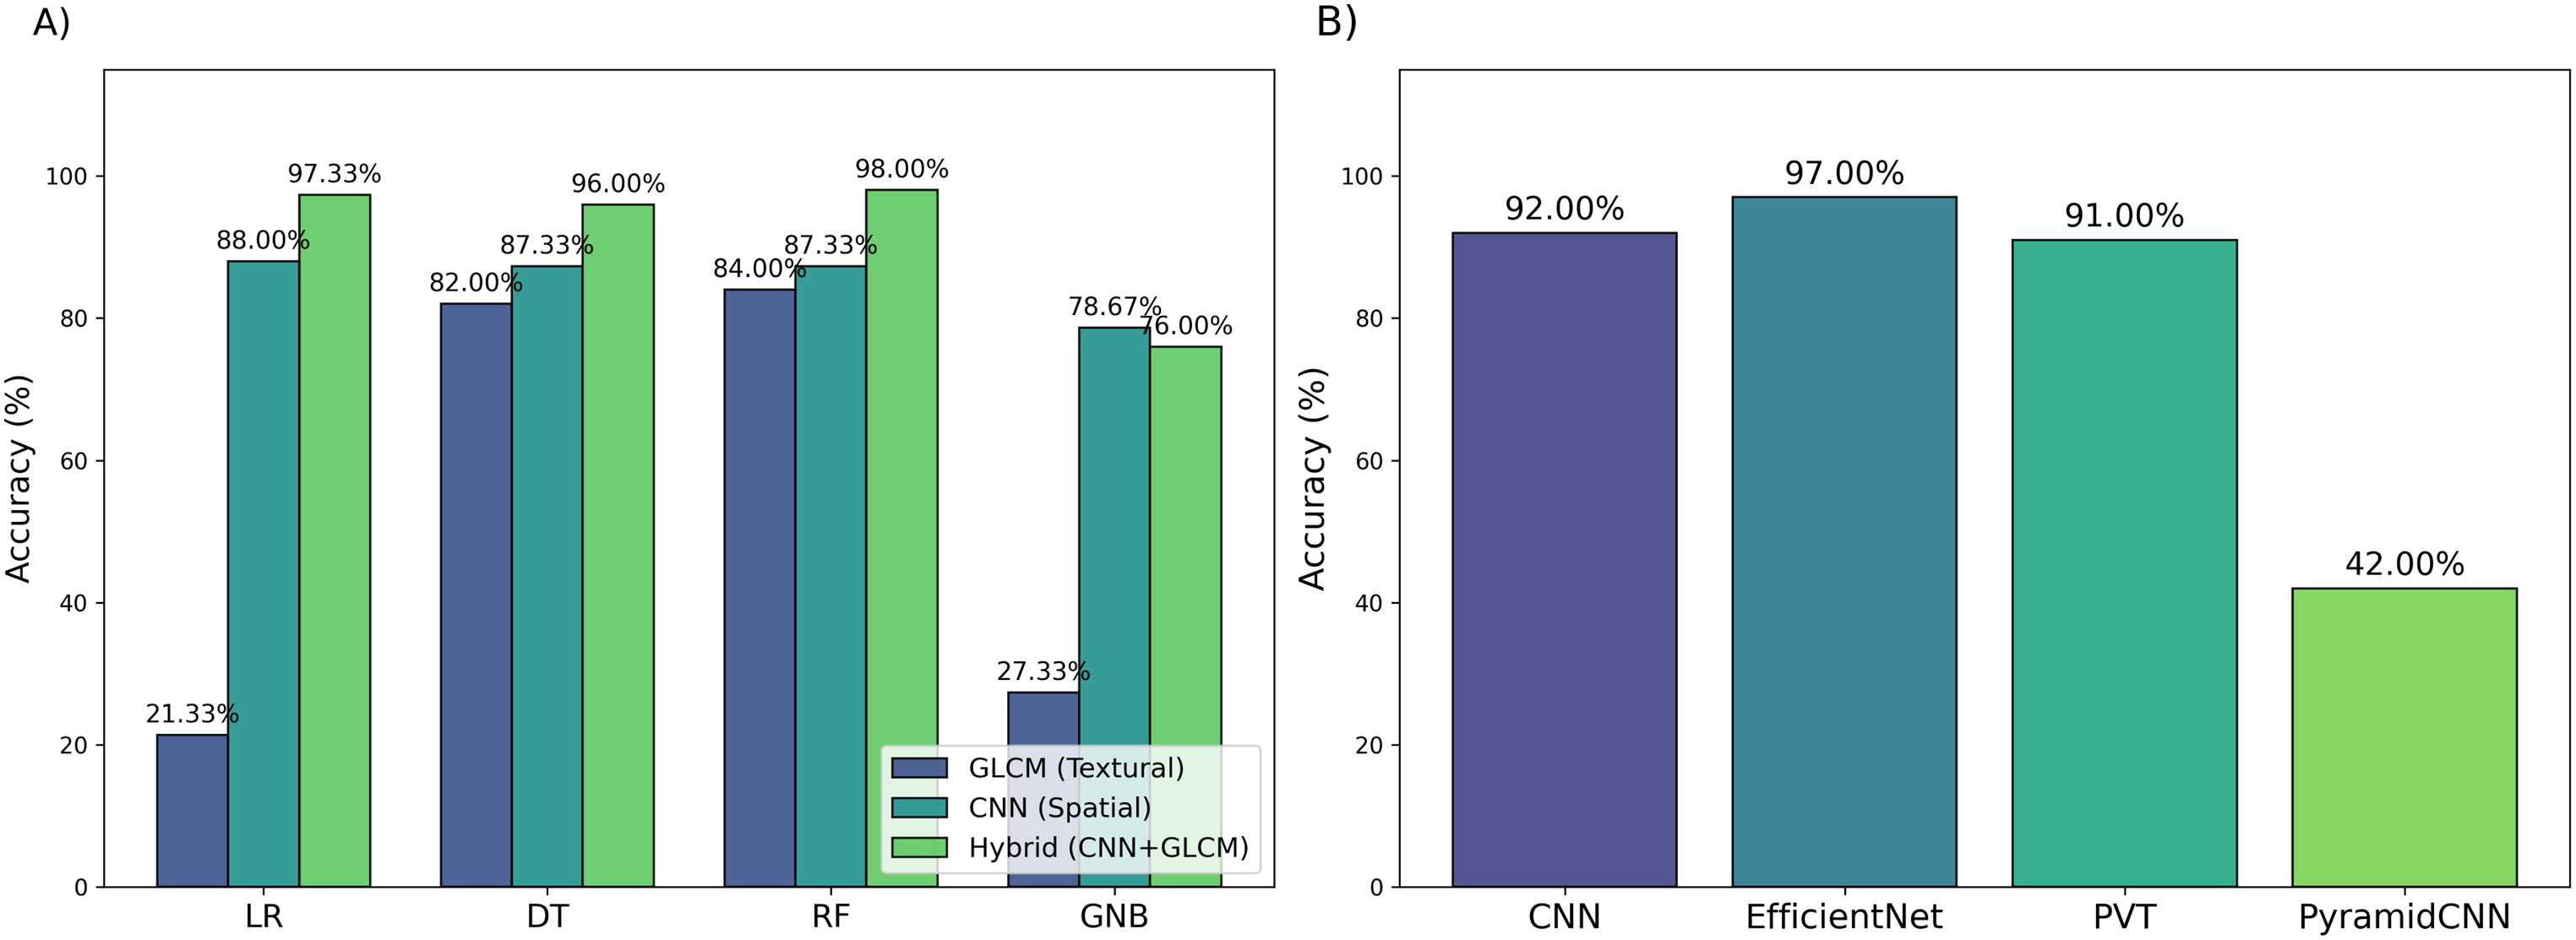
Accuracy comparison of the models from the test dataset.
The ML models with the GLCM features showed different levels of accuracy with the test dataset. The tree-based RF and DT models performed well with GLCM features compared to the LR and GNB models. The RF model with GLCM features achieved the highest accuracy of 84.00%. The DT model with GLCM features achieved an accuracy of 82.00%. The LR and GNB models with GLCM features achieved accuracy of 21.33% and 27.33%, respectively. In the case of GLCM features, the tree-based models performed well compared to linear and probabilistic models. However, the performance of the ML models with GLCM features was lower compared to those models trained with CNN-based spatial features and hybrid features.
In the case of the CNN feature, the LR model outperformed with an accuracy of 88.00% compared to ML models trained with CNN-based spatial features. The tree-based models DT and RF with CNN features achieved an accuracy of 87.33%. The GNB model with CNN features attained an accuracy of 78.67%. The GNB model showed poor performance across all models trained with CNN features. The ML models trained with CNN-based spatial features also showed less accuracy compared to ML models trained with hybrid features.
The CNN and GLCM were also used in combination as a hybrid approach to train and evaluate the ML models to explore the capabilities of these features used as hybrid feature. LR and RF performed well with an accuracy of 97.33% and 98.00%, respectively, with hybrid features. The DT model with the hybrid features also performed well with an accuracy of 96.00%, but its performance in terms of accuracy is below that of the LR and RF models. GNB model with the hybrid features showed low performance, with an accuracy of 76.00% compared to all ML models trained with hybrid features. The GNB performance is consistently low compared to all ML models trained with different features. The analysis showed that RF and LR performed well with high accuracy compared to DT and GNB with hybrid features. The RF model showed better accuracy across all features and also highest accuracy with all features set.
The use of hybrid features results in improved performance compared to the use of only CNN and GLCM features with ML models. The integration of the features in the form of hybrid features also results into improvement in the performance of all ML model. The combination of CNN-based spatial and GLCM-based textural features enhances the model learning capability, which results in high performance, in the identification of five stages of DR.
Four deep learning models as auto feature extraction approaches are also trained and evaluated. The EfficientNet model showed highest accuracy of 97.33% across all deep learning models. The CNN, PVT and PyramidCNN models showed accuracy of 92.00%, 91.33% and 42.00% against the test dataset. In summary, in the case of the use of CNN-based spatial features, the LR model achieved the highest accuracy of 88.00%. In the case of GLCM features, the tree-based model performed well, where the RF model outperformed with an accuracy of 84.00%. EfficientNet model outperformed in case of deep learning models with 97.33% accuracy. Overall, the RF model with hybrid features showed a high accuracy of 98.00% across all models and features. The RF model with hybrid features even shows improvement in accuracy over the deep learning models for DR classification.
Figure 5 shows confusion matrices of each model trained using the GLCM features. The RF and DT models with GLCM features showed higher true positive values for each stage of DR than the LR and GNB models. The high true positive values show the ability of the RF and DT models to accurately identify the positive case for each stage of DR. The LR and GNB models showed the lowest true positive values, showing the low performance of these models for the accurate identification of different stages of DR. The performance of the LR and GNB models is better for only ’No’ class. The performance of the LR and GNB models against the mild, moderate, proliferate, and severe classes is very low. In the case of GLCM features, the confusion matrix of RF and DT shows moderate resemblance with the confusion matrix of the single-step CNN model. Confusion matrices of ML models with textural (GLCM) feature.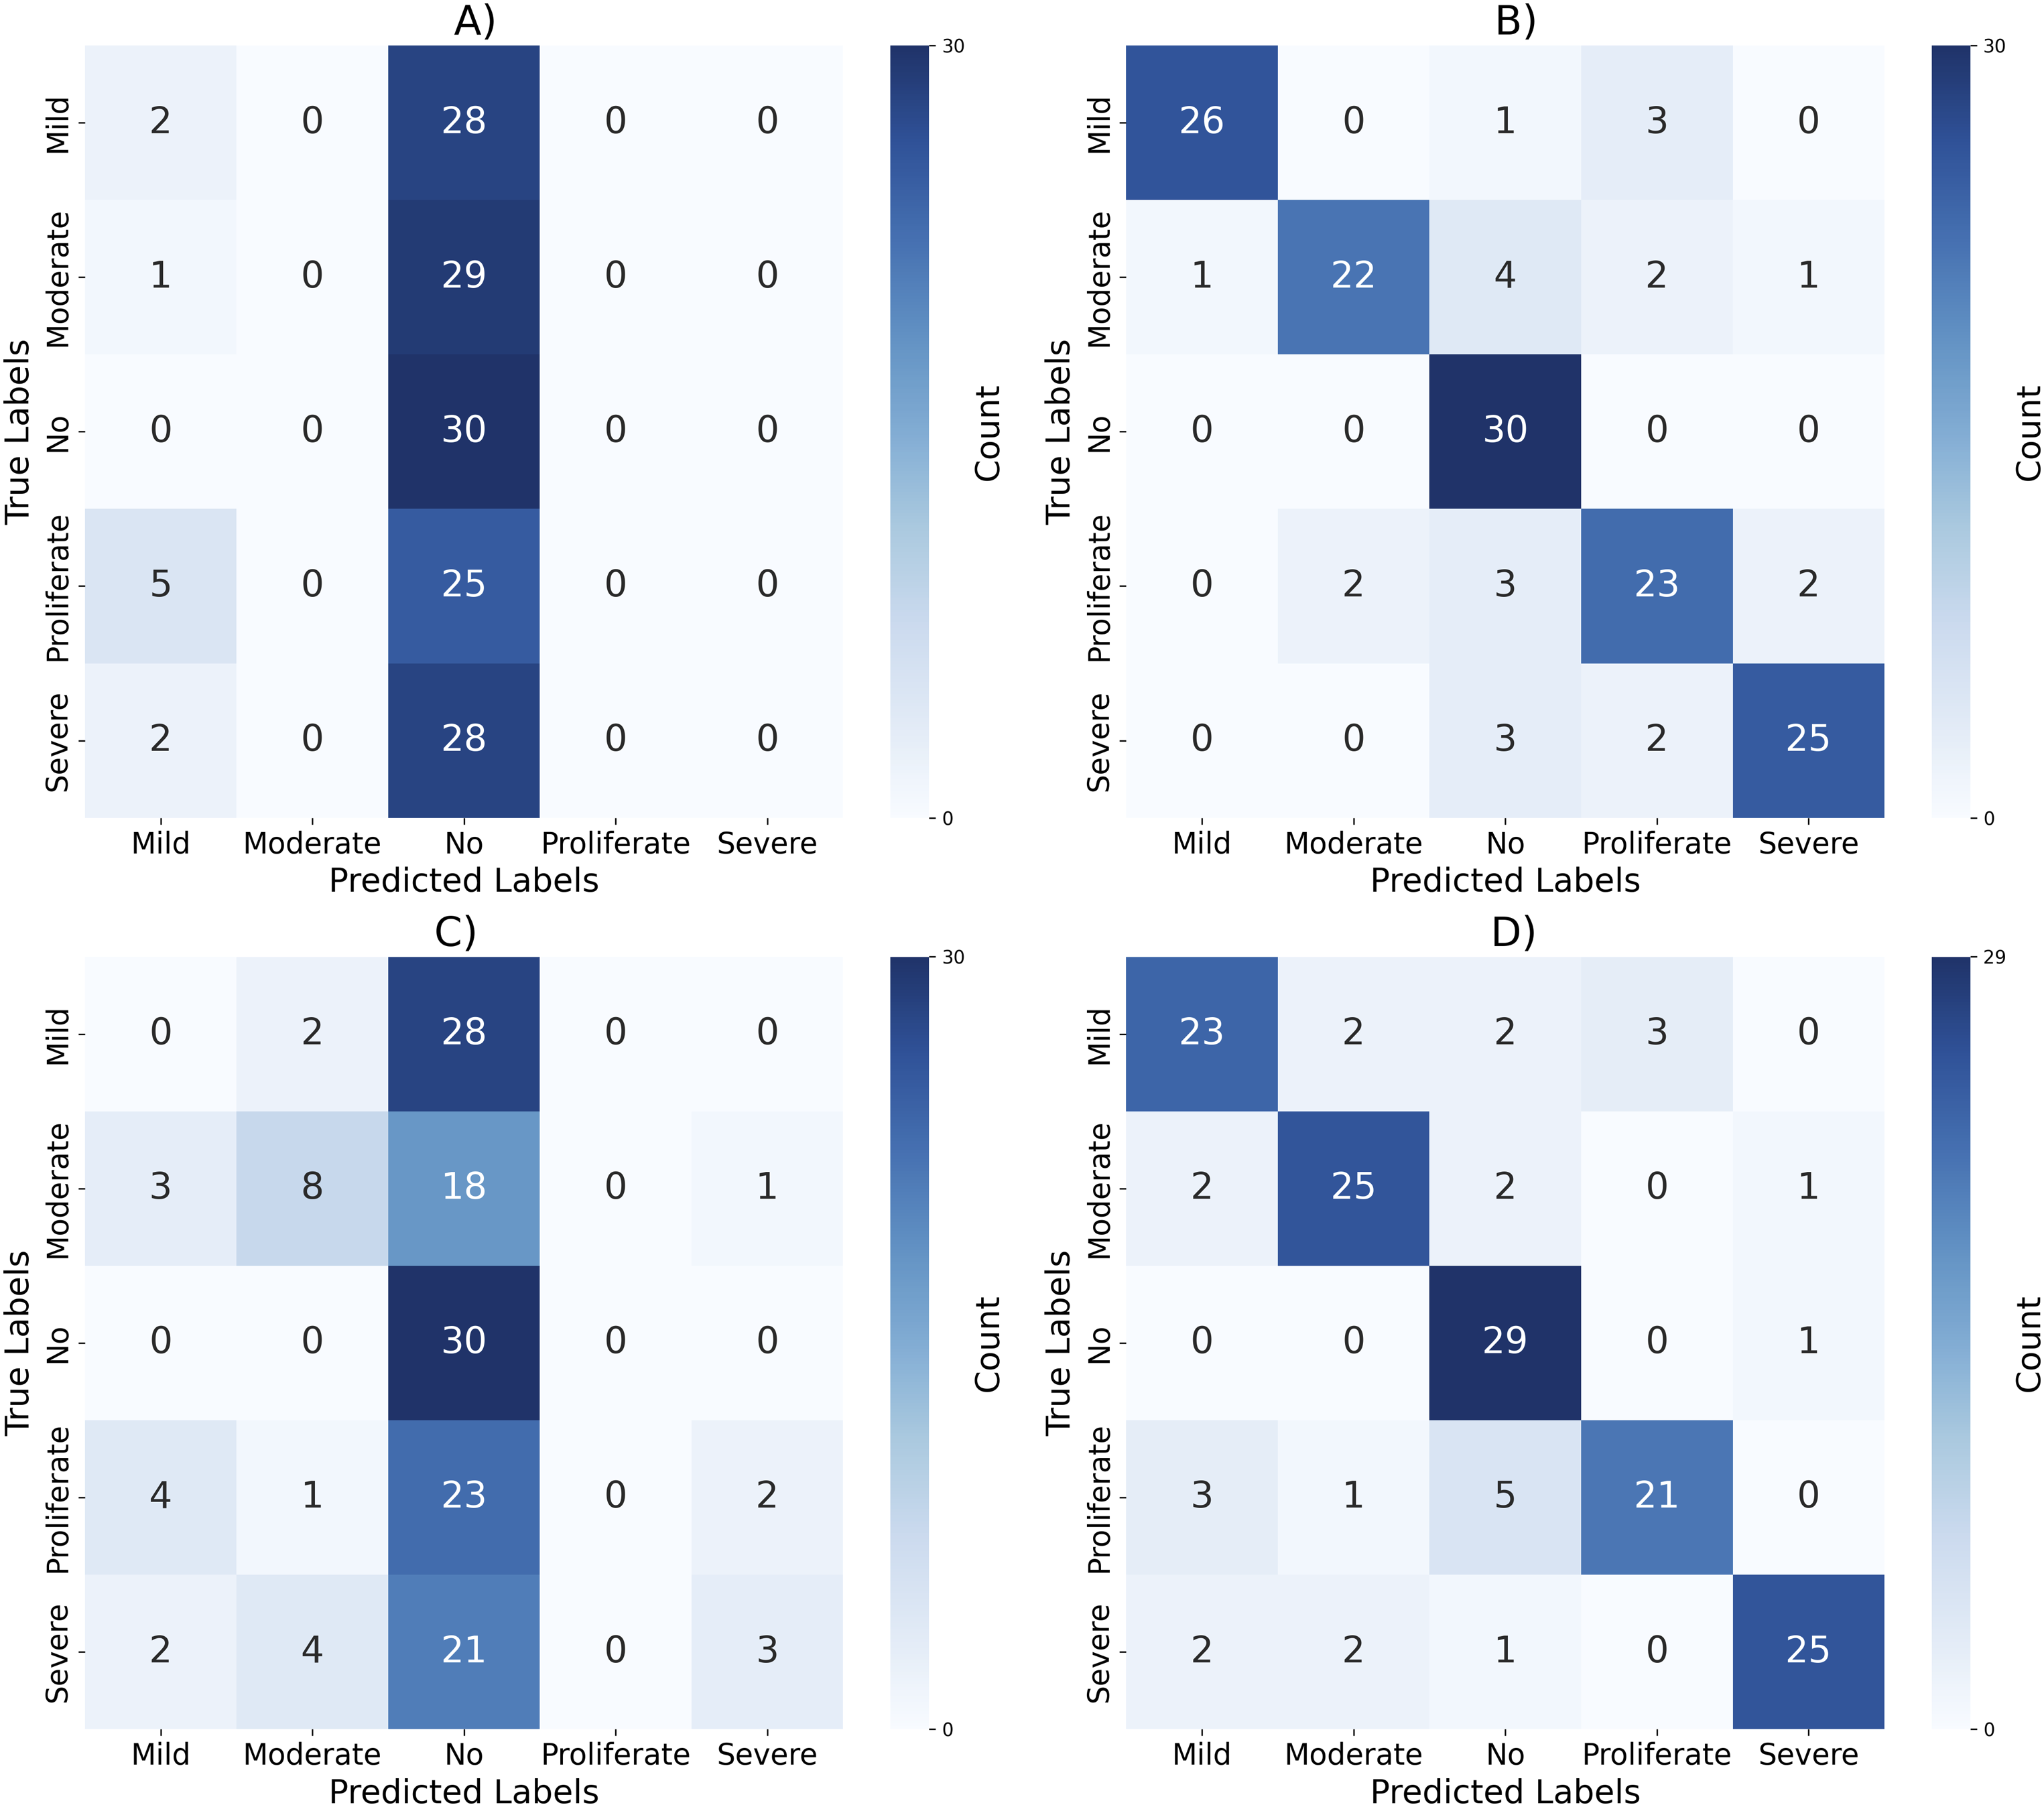
Figure 6 shows confusion matrices of each model with CNN features to identify the DR stage. The LR, RF, and DT models showed higher true positive values than the GNB model. These values show the ability of the LR, RF, and DT models to accurately identify the positive cases of each stage of DR. The GNB model showed the lowest true positive values, showing its low performance in accurately identifying the different stages of DR. The GNB performance against the mild, proliferate, and severe classes is very low. The performance of the LR model in terms of confusion matrix analysis is also high, with high values of true positive instances. DT and RF models also showed good performance, with high true positive instances for each stage of DR identification. Confusion matrices of ML models with spatial (CNN) feature.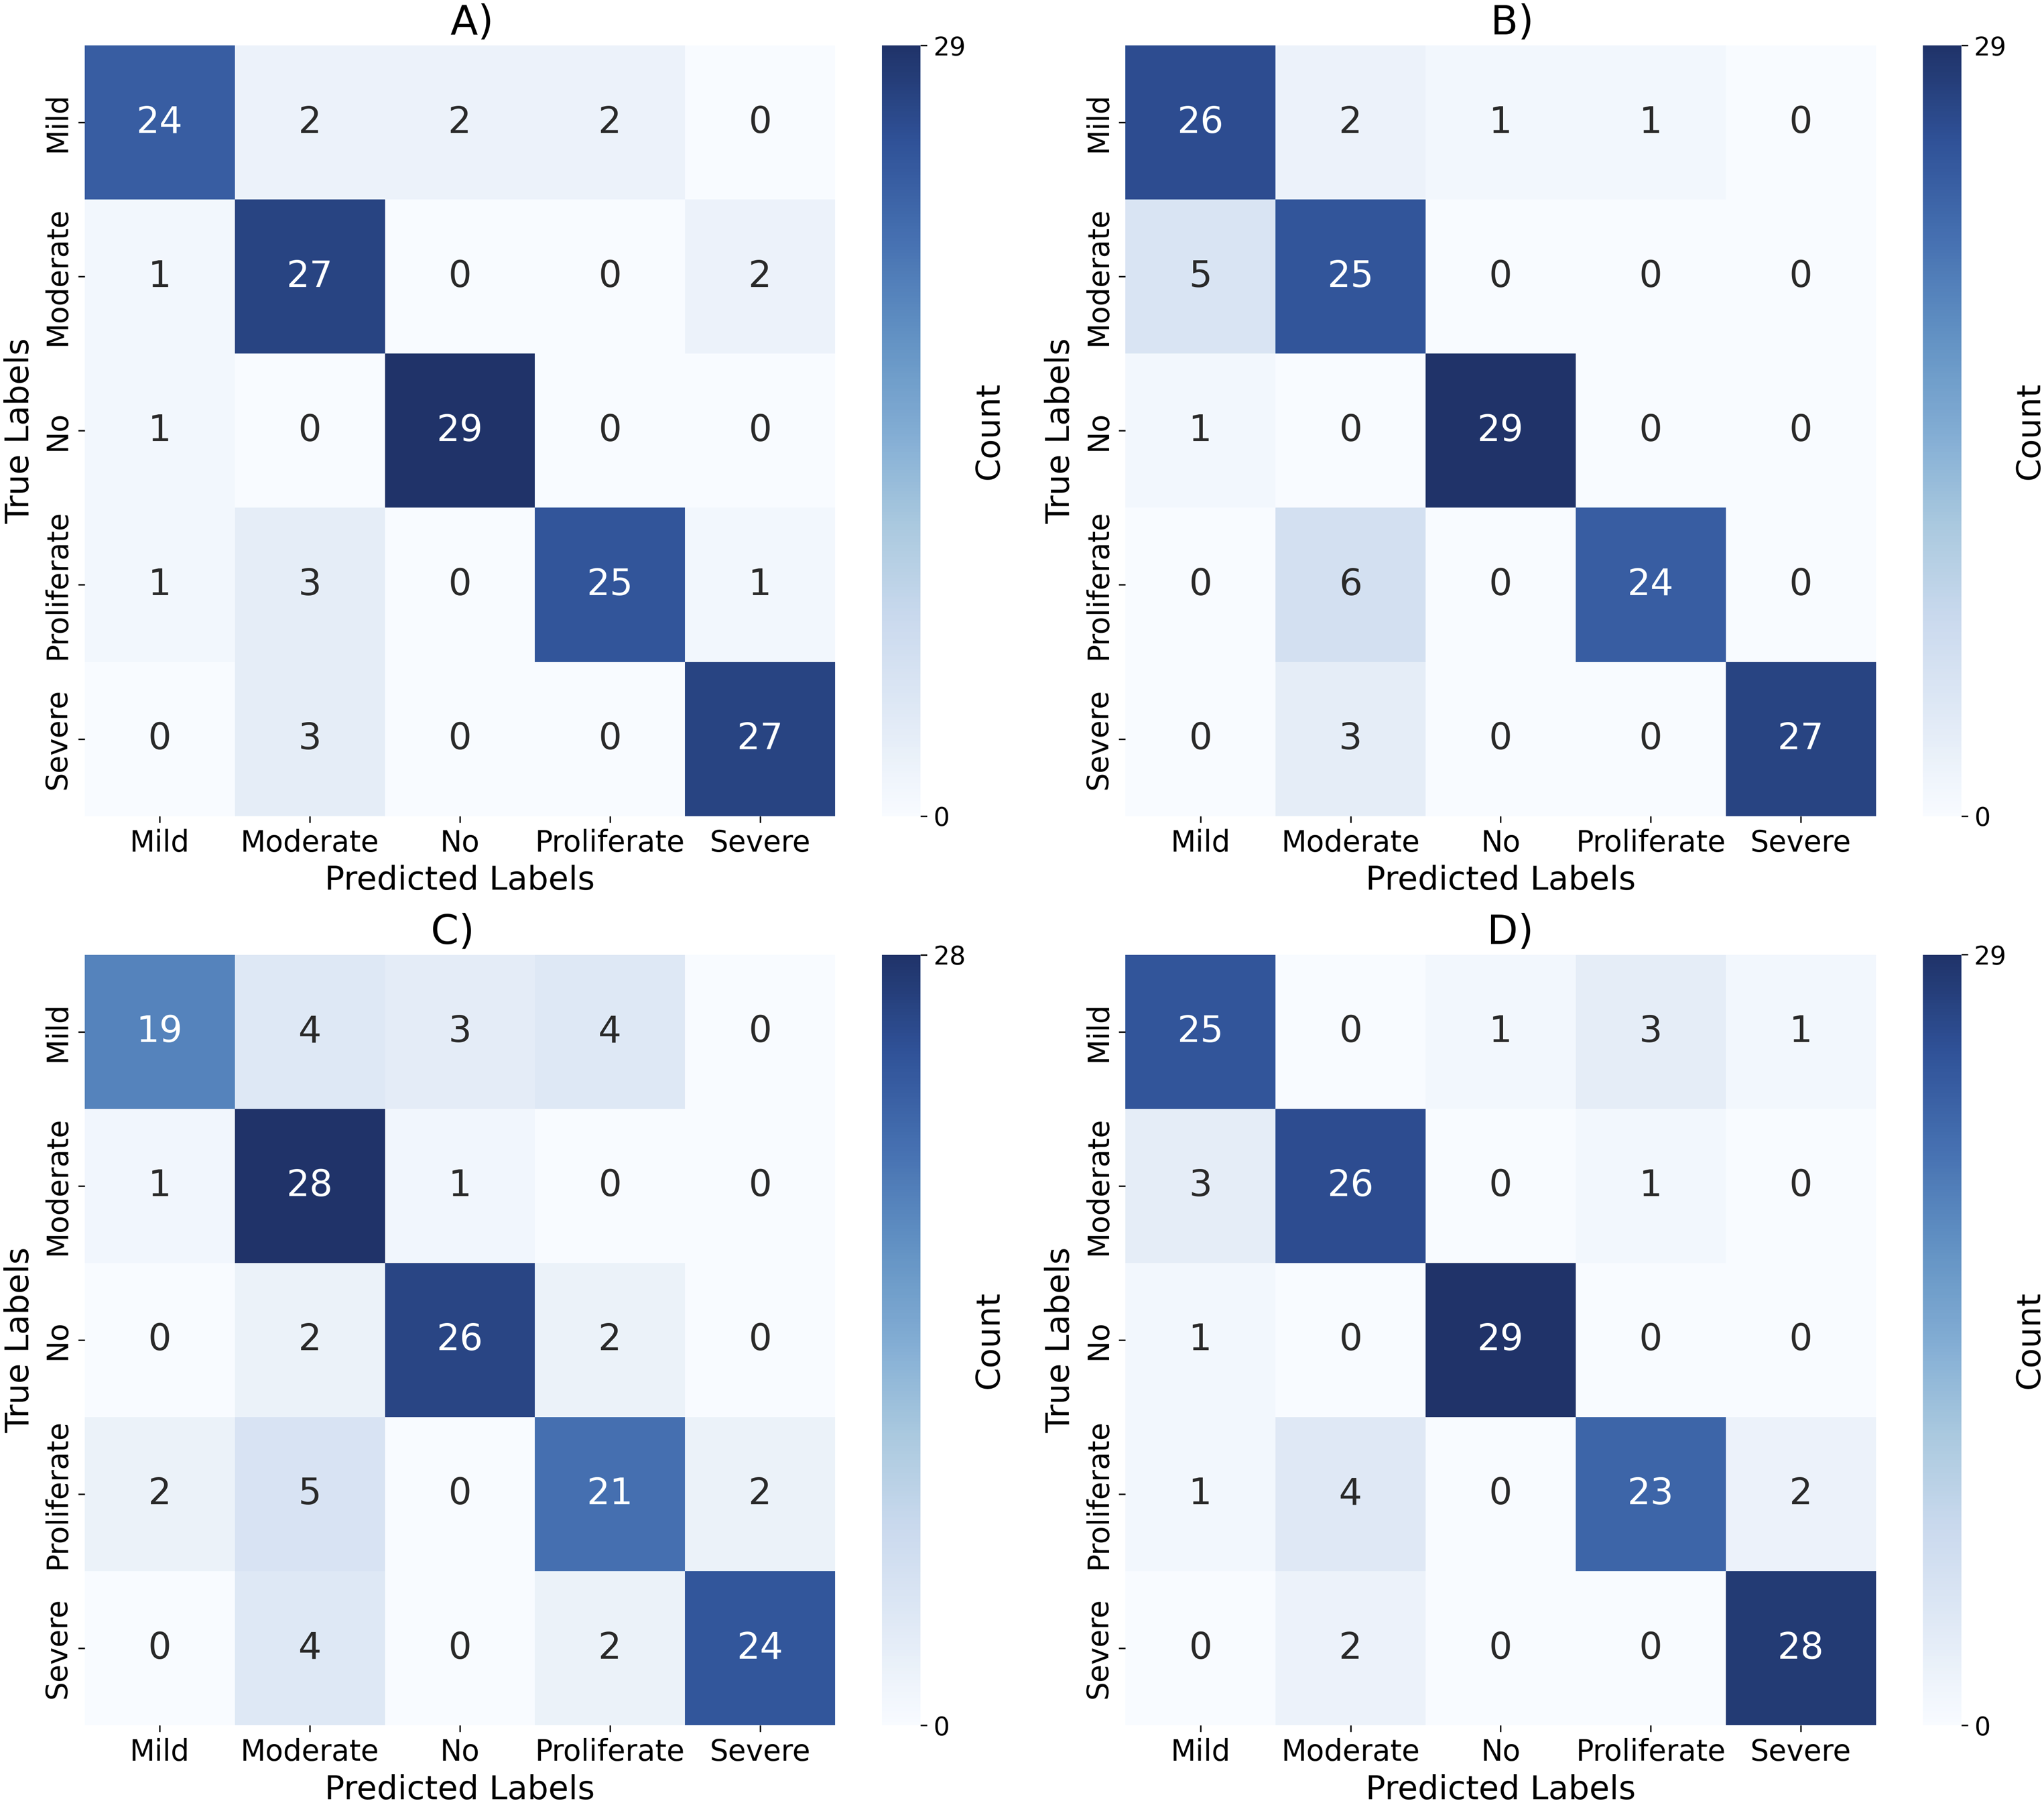
Figure 7 shows confusion matrices of each model to identify the DR stage using the hybrid feature set. The RF, LR, and DT models showed higher true positive values than the GNB values. The RF model showed a high incidence of true positives compared to the confusion matrix of any other model with hybrid feature. These values show the ability of the RF model to identify the positive case of each stage of DR. The GNB model showed the lowest true positive values, showing its low performance in accurately determining the different stages of DR. The GNB performance against the mild, proliferate, and severe classes is comparatively low. The performance of the LR and DT models in the confusion matrix analysis is also high. The confusion matrix further validated the importance of the integration of different features for the accurate identification of different stages of DR. Confusion matrices of ML models with the combination of CNN and GLCM feature.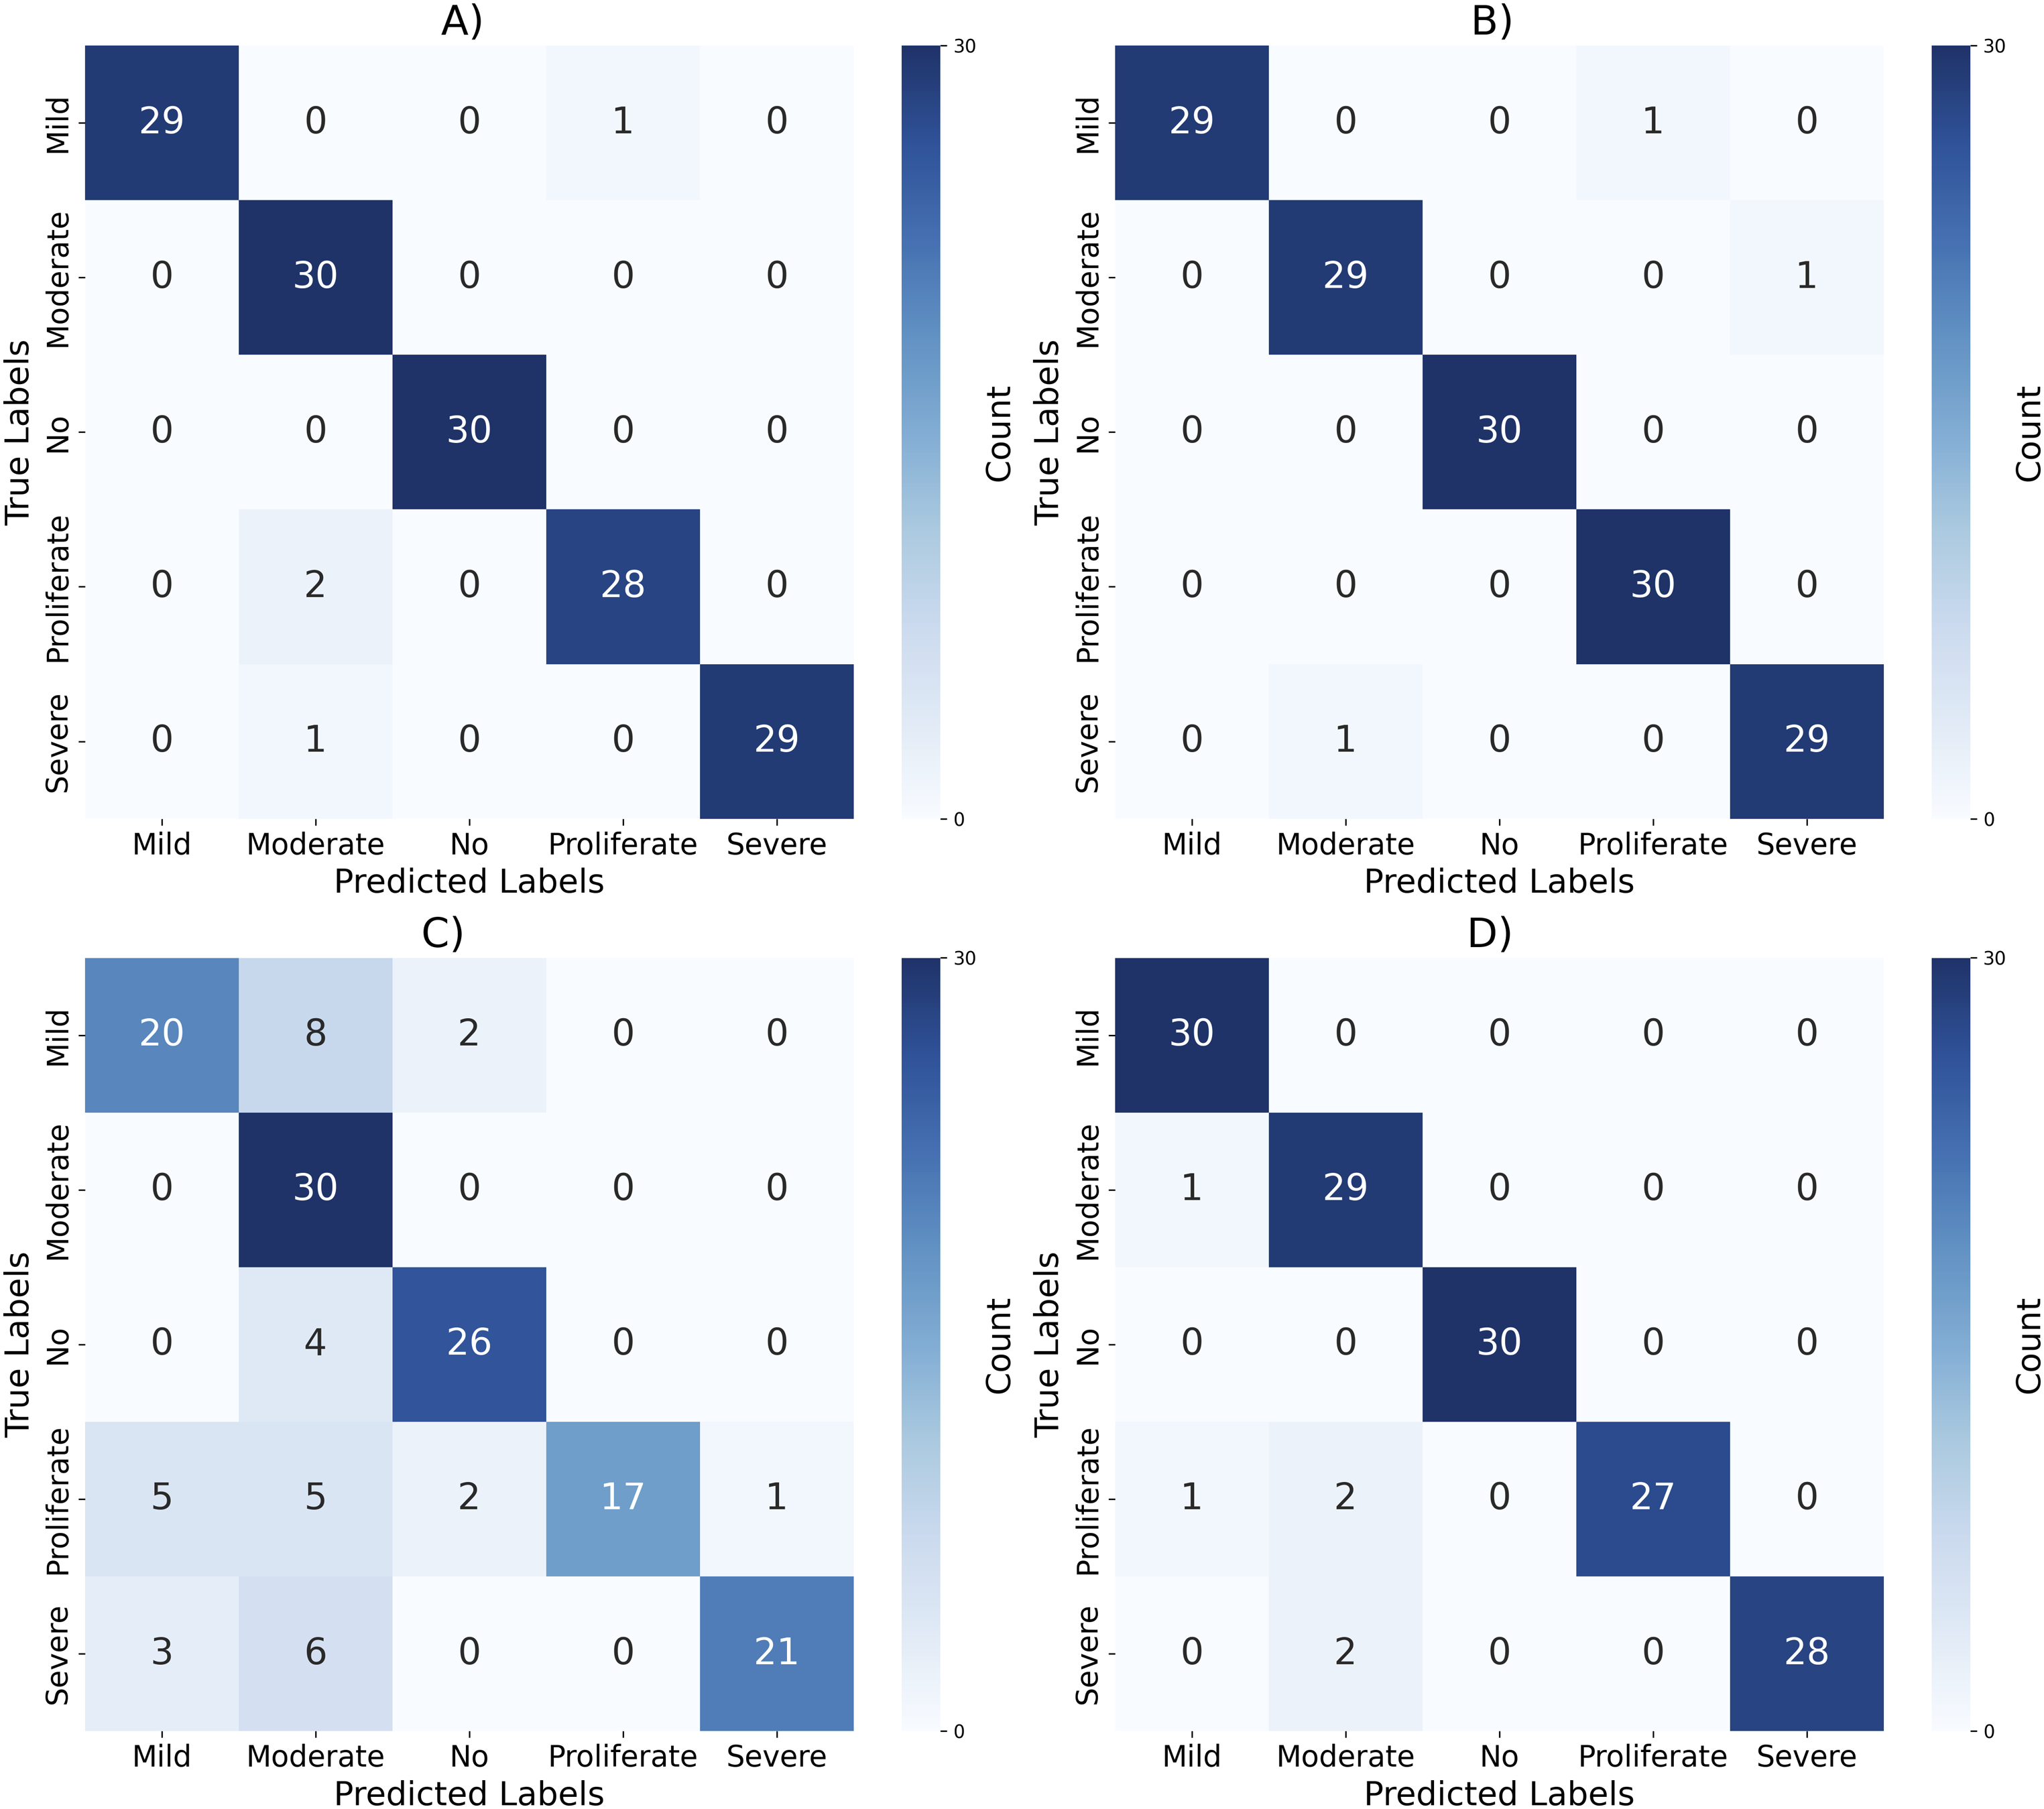
The confusion matrices of deep learning models are shown in Figure 8. The EfficientNet model showed high incident of true positive compared to any other deep learning model. The CNN and PVT also showed better confusion matrices with better incidents of true positives. The confusion matrix of the PyramidCNN model showed low incident of true positive. Confusion matrix of deep learning models.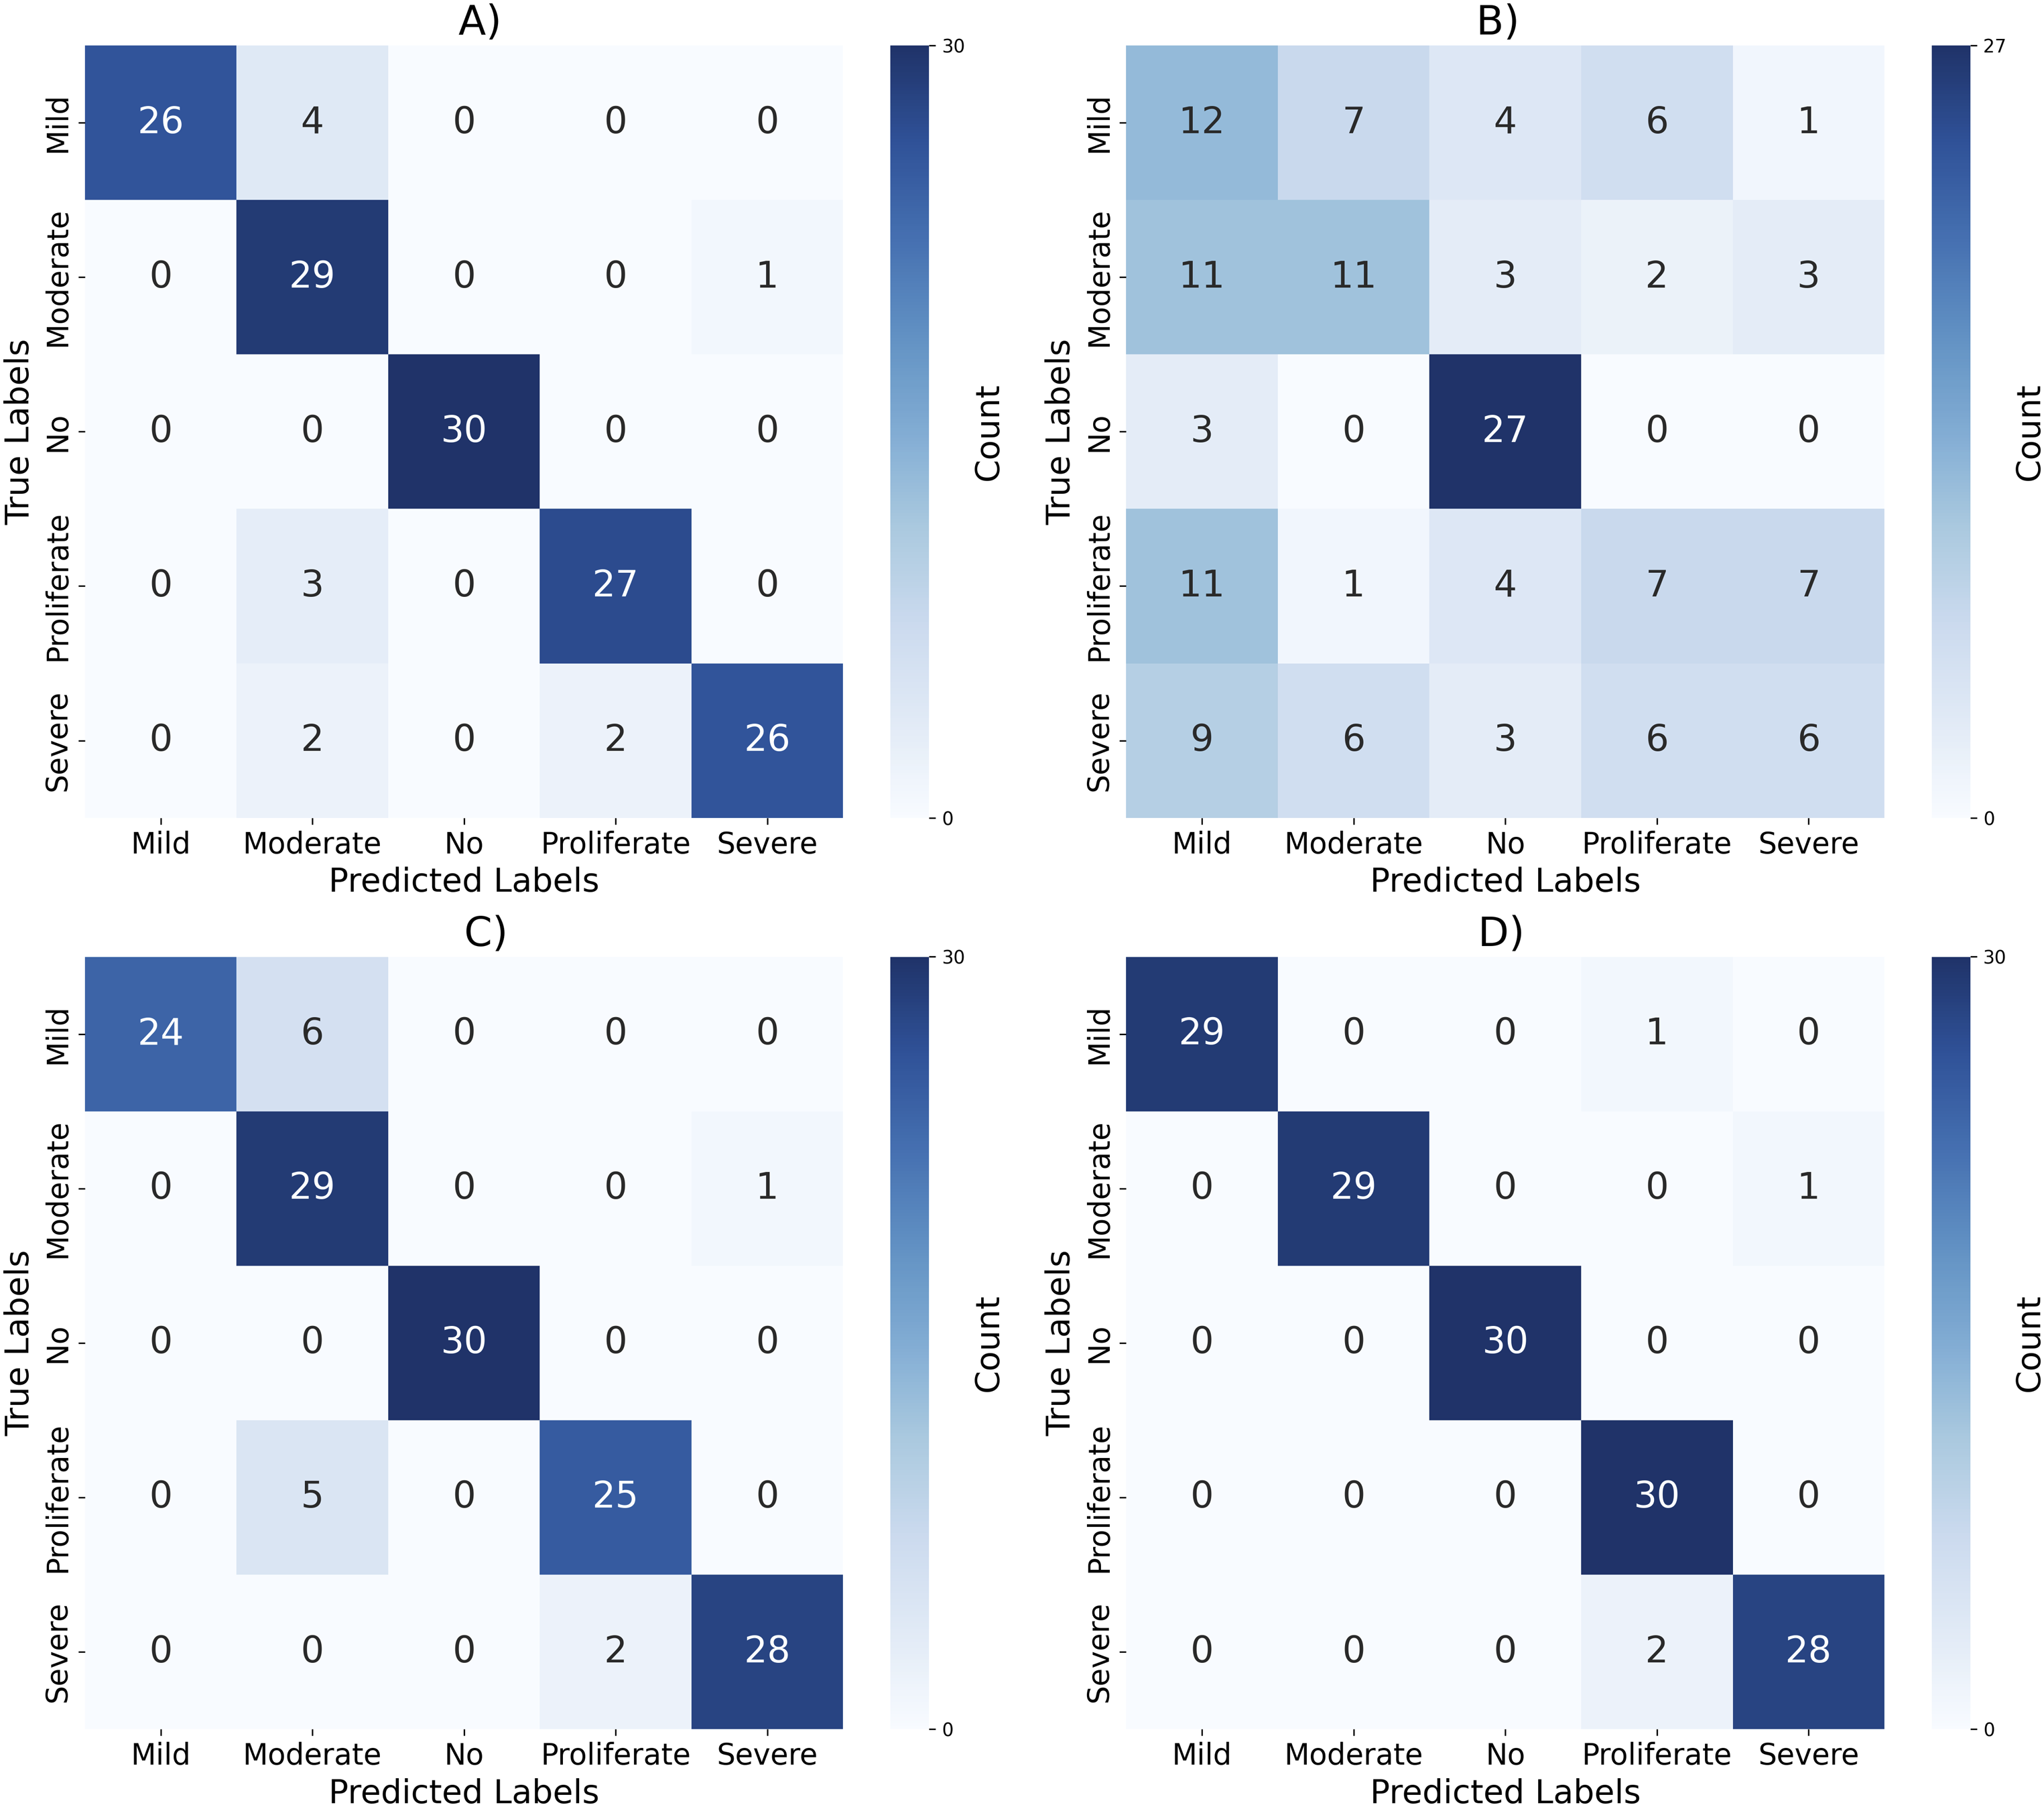
The integration of CNN and GLCM features in the form of hybrid features results in high accuracy and performance compared to models trained with CNN and GLCM features. The ML models trained with the CNN features showed high performance compared to the ML models trained with the GLCM features. The integration of GLCM features enhances model learning capability, providing more meaningful insights for model learning resulting in improved performance. The RF model trained with a hybrid feature showed better performance compared to the deep learning models, indicating the importance of integration of multiple features to enhance model learning capability.
Precision values (%) for different models using CNN, GLCM, hybrid features, and deep learning architectures.
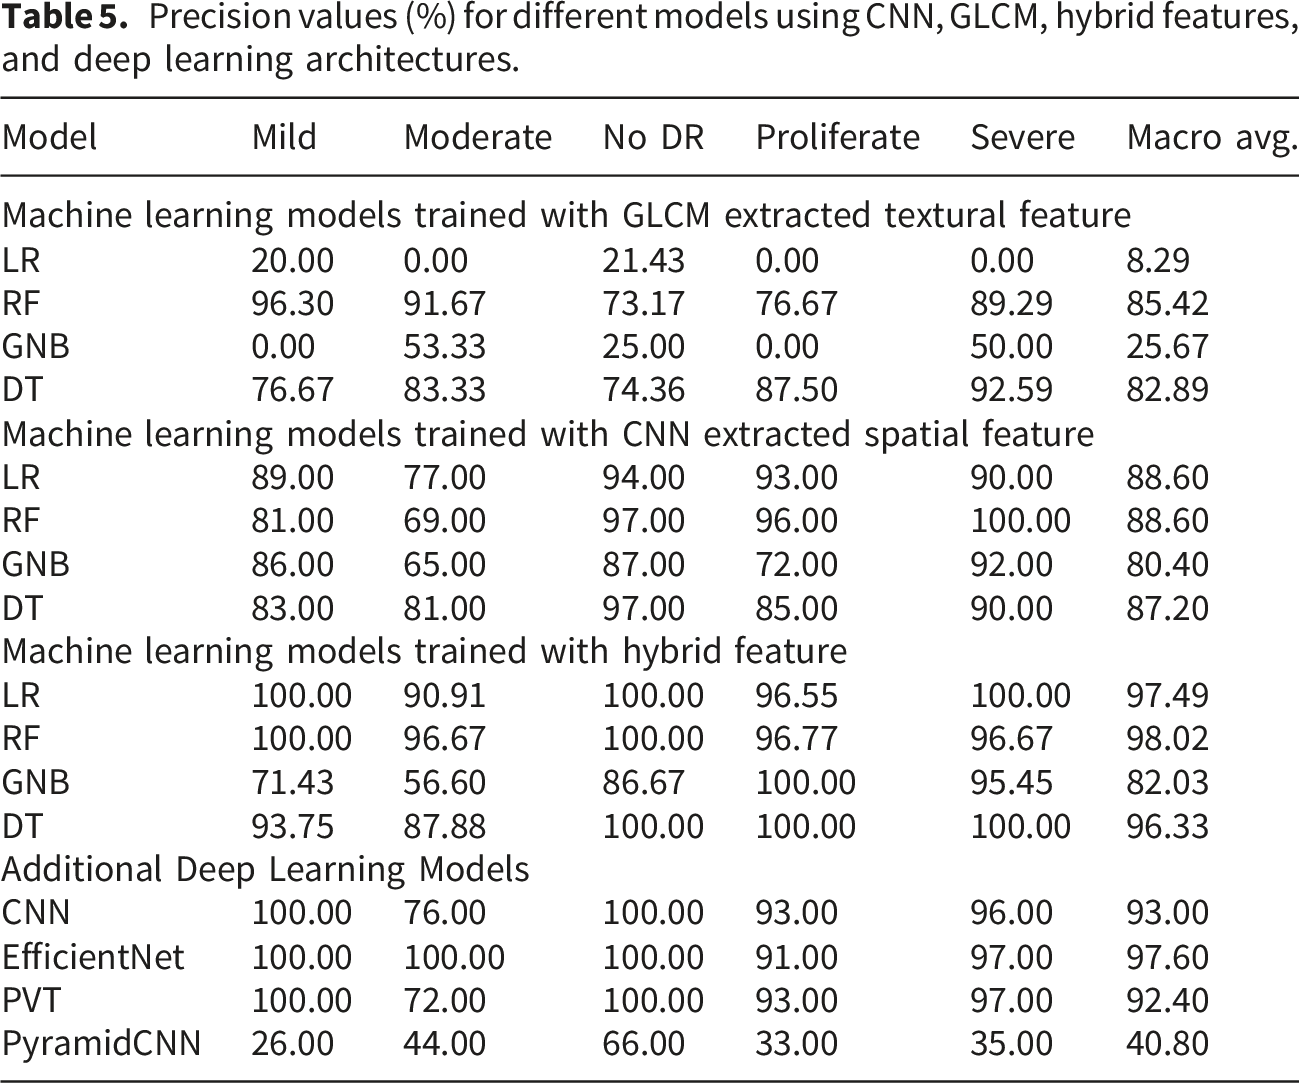
The precision values for each stage of the DR for each model with the GLCM features are shown in part (A) of Figure 9. The ML models incorporating GLCM features exhibited varying performance levels. RF and DT models with GLCM features achieved the highest macro-average precision of 85.42% and 82.89%, respectively. The performance of tree-based models with GLCM features demonstrates their effectiveness in using these features. LR and GNB models performed inadequately with the GLCM feature, with macro-average precision of 8.29% and 25.67%, respectively. The performance of the ML model trained with GLCM textural features is far less than that of the CNN based textural features models, hybrid feature models and deep learning models. Comparison of precision values of each stage of DR across different features.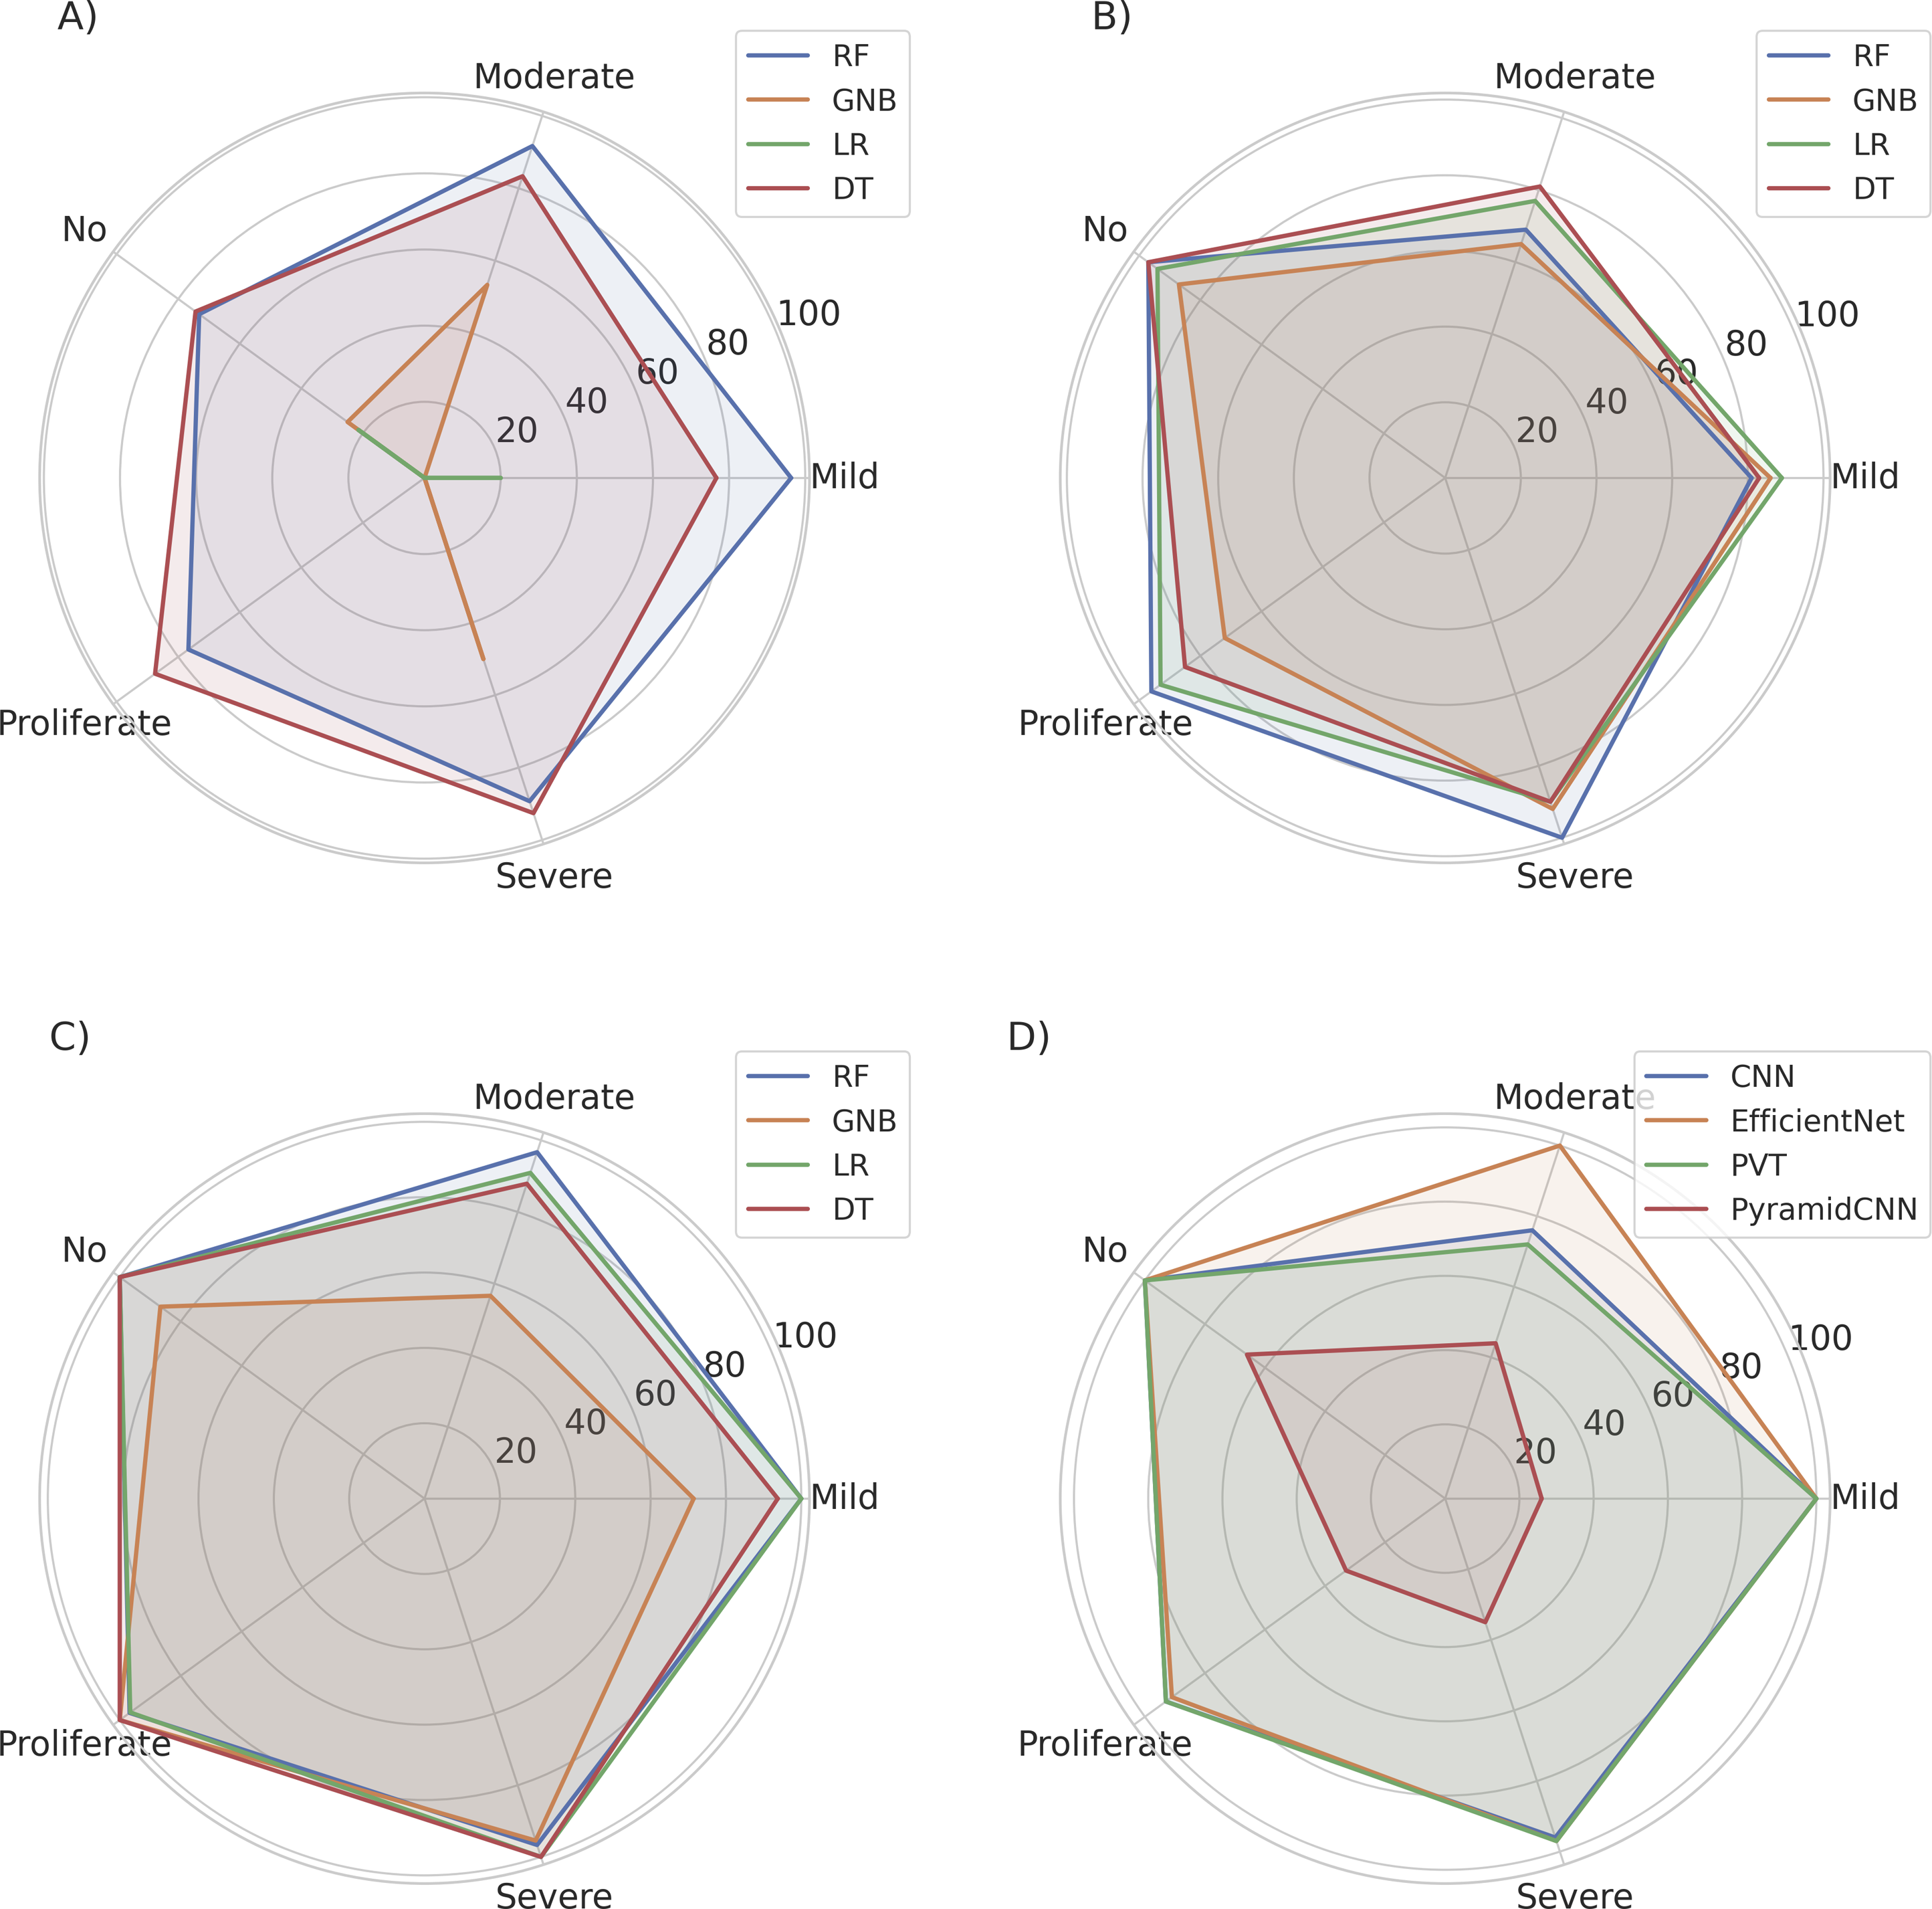
The ML models with CNN-extracted spatial features showed relatively better performance than those trained with GLCM-extracted features in terms of the precision analysis. The precision values for each stage of the DR of each model with the CNN features are compared in part (B) of Figure 9. LR and RF model with spatial features extracted through CNN attained a macro-average precision of 88.60%. The LR and RF models with spatial features extracted through CNN outperformed other models with features extracted through CNN in terms of precision analysis. The DT model with spatial features extracted through CNN attained a macro-average precision of 87.20%. The GNB model with features extracted through a CNN achieved a macro-average precision of 80.40%. The GNB model with features extracted through CNN showed the lowest performance among all models trained with CNN based spatial features.
The ML models, which combined CNN and GLCM features, showed better performance compared to models with only GLCM and CNN features. The precision values of each stage of the DR of each model with the hybrid features are compared in part (C) of Figure 9. The RF model with the hybrid features attained a macro-average precision of 98.02%. The RF model with the hybrid features outperformed other models with the hybrid features. The LR model with the hybrid features also showed high-precision values for each stage of the DR. The LR model with the hybrid features set attained a macro-average precision of 97.49. Both RF and LR showed high precision values for all stages of DR. The RF model achieved a very high precision score of 100.00% for the ’No’, ’Mild’ and ’Severe’ classes of DR, reflecting its strong ability to discriminate different stages of DR. The LR model also showed high precision values for each stage of DR, reflecting the ability to distinguish between multiple stages of DR. The DT model with the hybrid features attained a macro-average precision of 96.33%. The GNB model with the hybrid features attained a macro-average precision of 82.03%. The GNB model with hybrid features exhibited lower precision for the ’Mild’ and ’Moderate’ classes. The GNB model with hybrid features showed the lowest performance among all models with hybrid features. The RF and LR models outperformed every other models trained with hybrid features.
The deep learning models also performed well with EfficientNet model achieving the highest macro average precision of 97.60%. The CNN and PVT model also performed well with macro average precision of 97.60% and 92.40%. The PyramidCNN model showed lowest macro average precision of 40.80% across deep learning models. The precision values of each stage of the DR of each model with the deep learning models are compared in part (D) of Figure 9.
The macro average precision of every model with different features is compared in Figure 10. The RF models showed high macro precision across all models. The combination of both spatial and textural features in the form of a hybrid model enhance model’s learning capability to identify each class of DR with high precision. Comparison of macro average precision of DR classes with different models.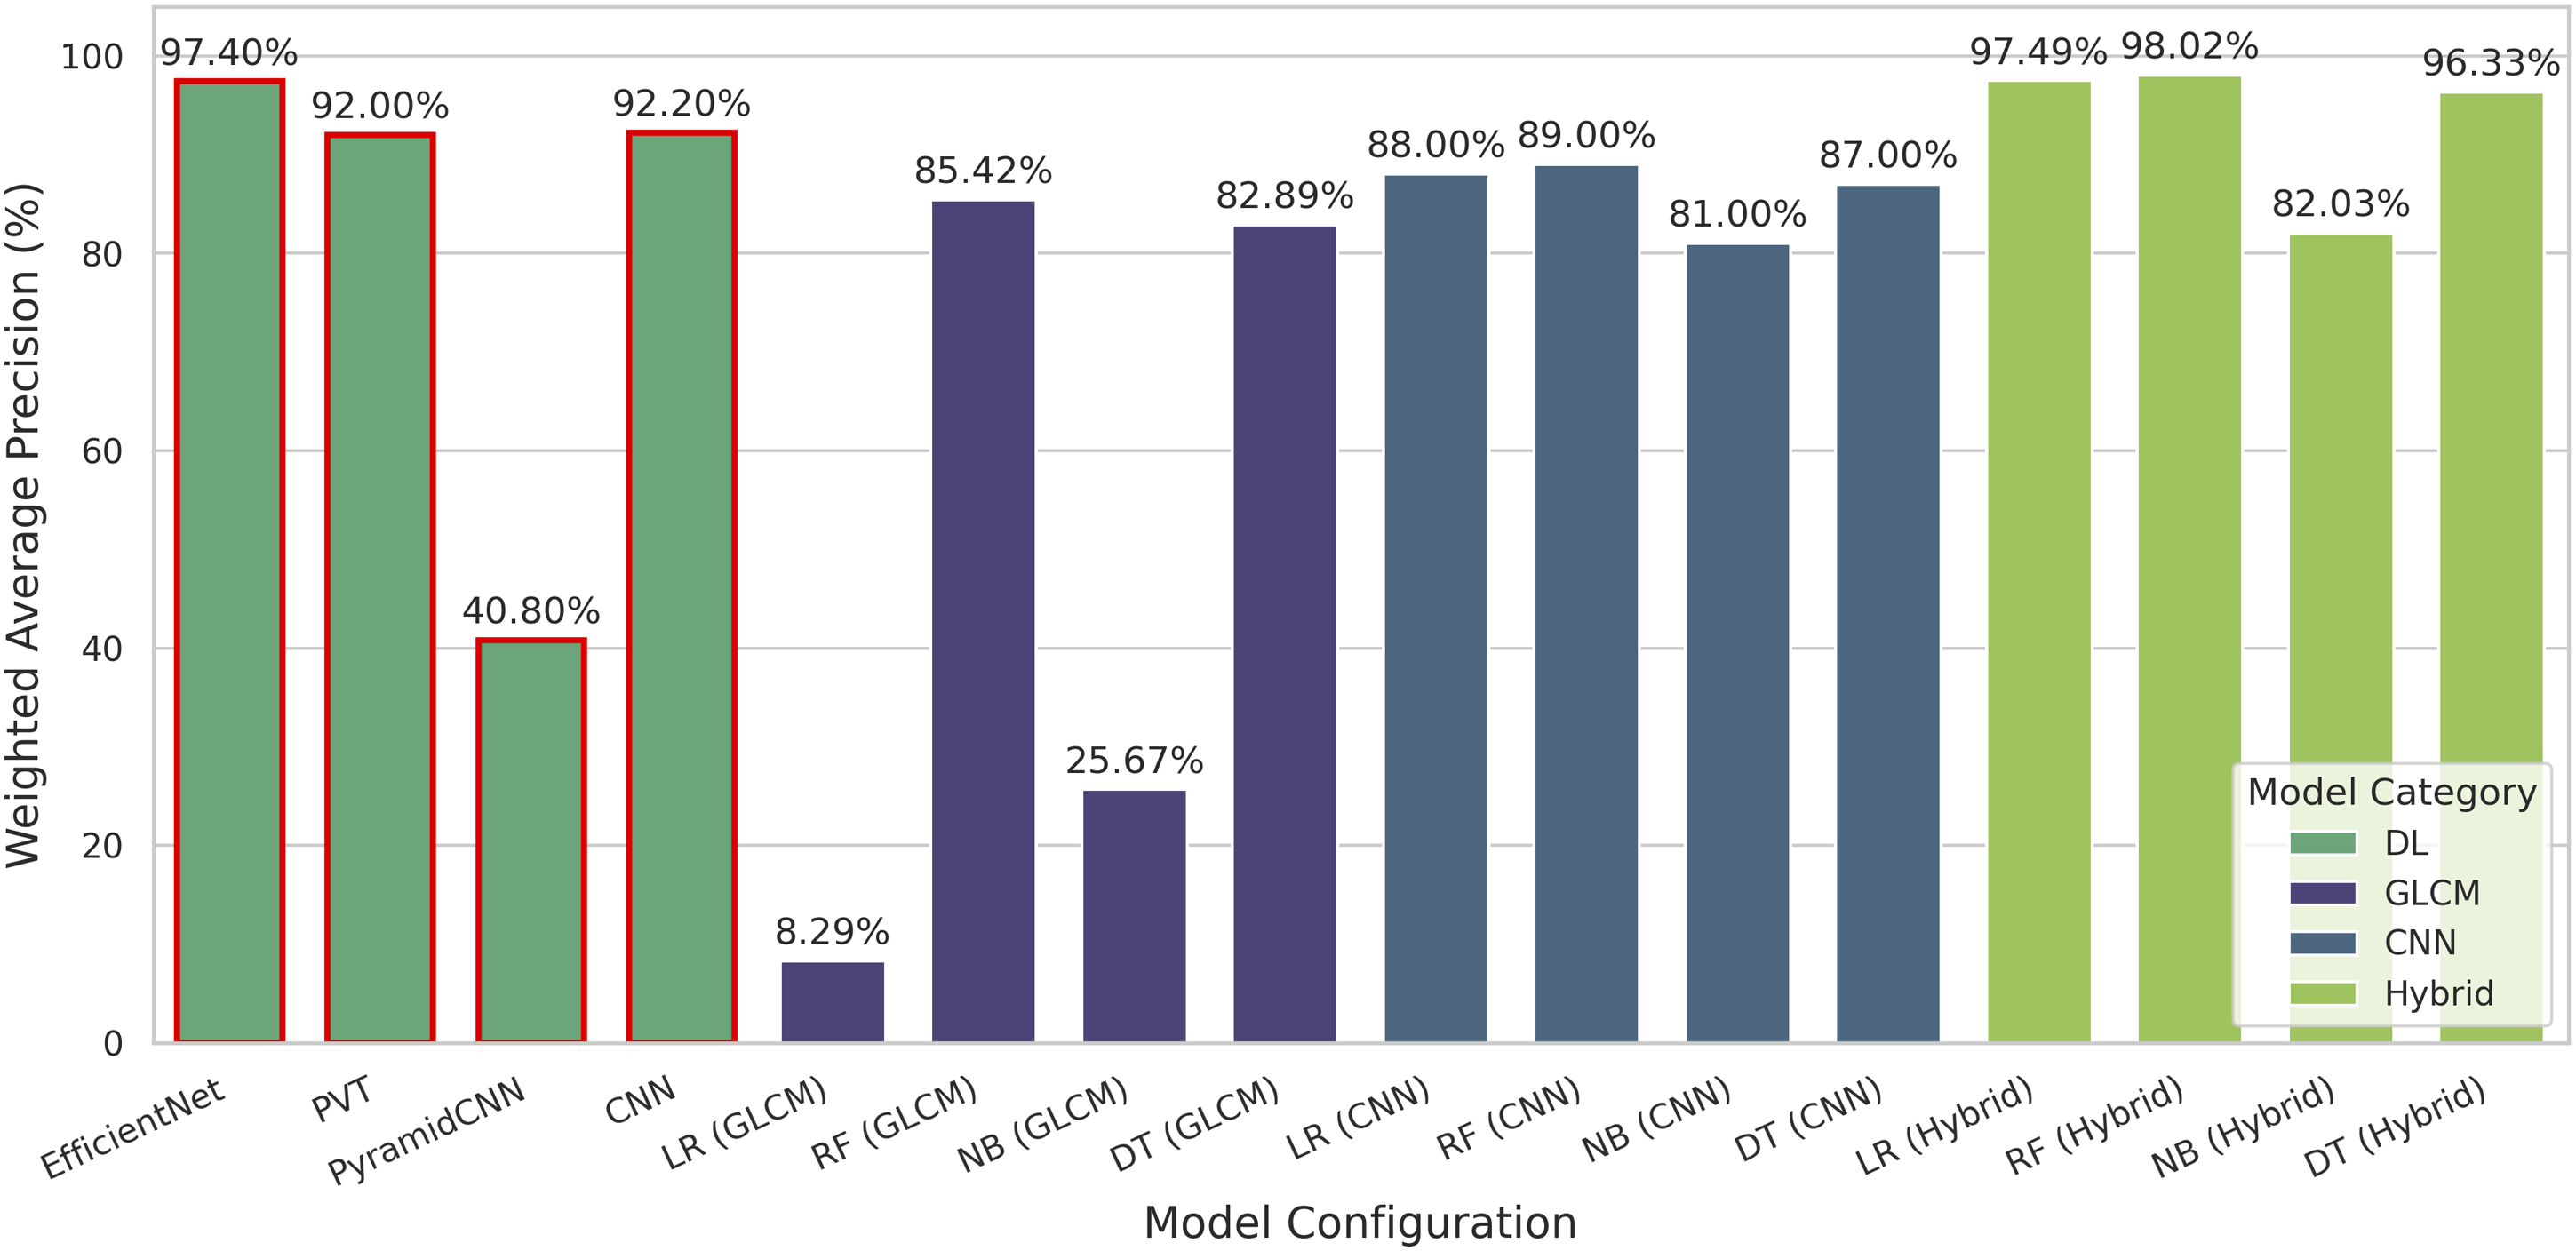
The results revealed the importance of selecting appropriate feature extraction methods and ML models to identify different stages of DR. Machine learning models with the hybrid features showed significant performance improvements compared to those using only the GLCM and CNN features, and even with deep learning models. The RF model with the hybrid features set emerged as the best performer, achieving an impressive macro-average precision of 98.02%.
Recall values (%) for different models using CNN, GLCM, hybrid features, and deep learning architectures.
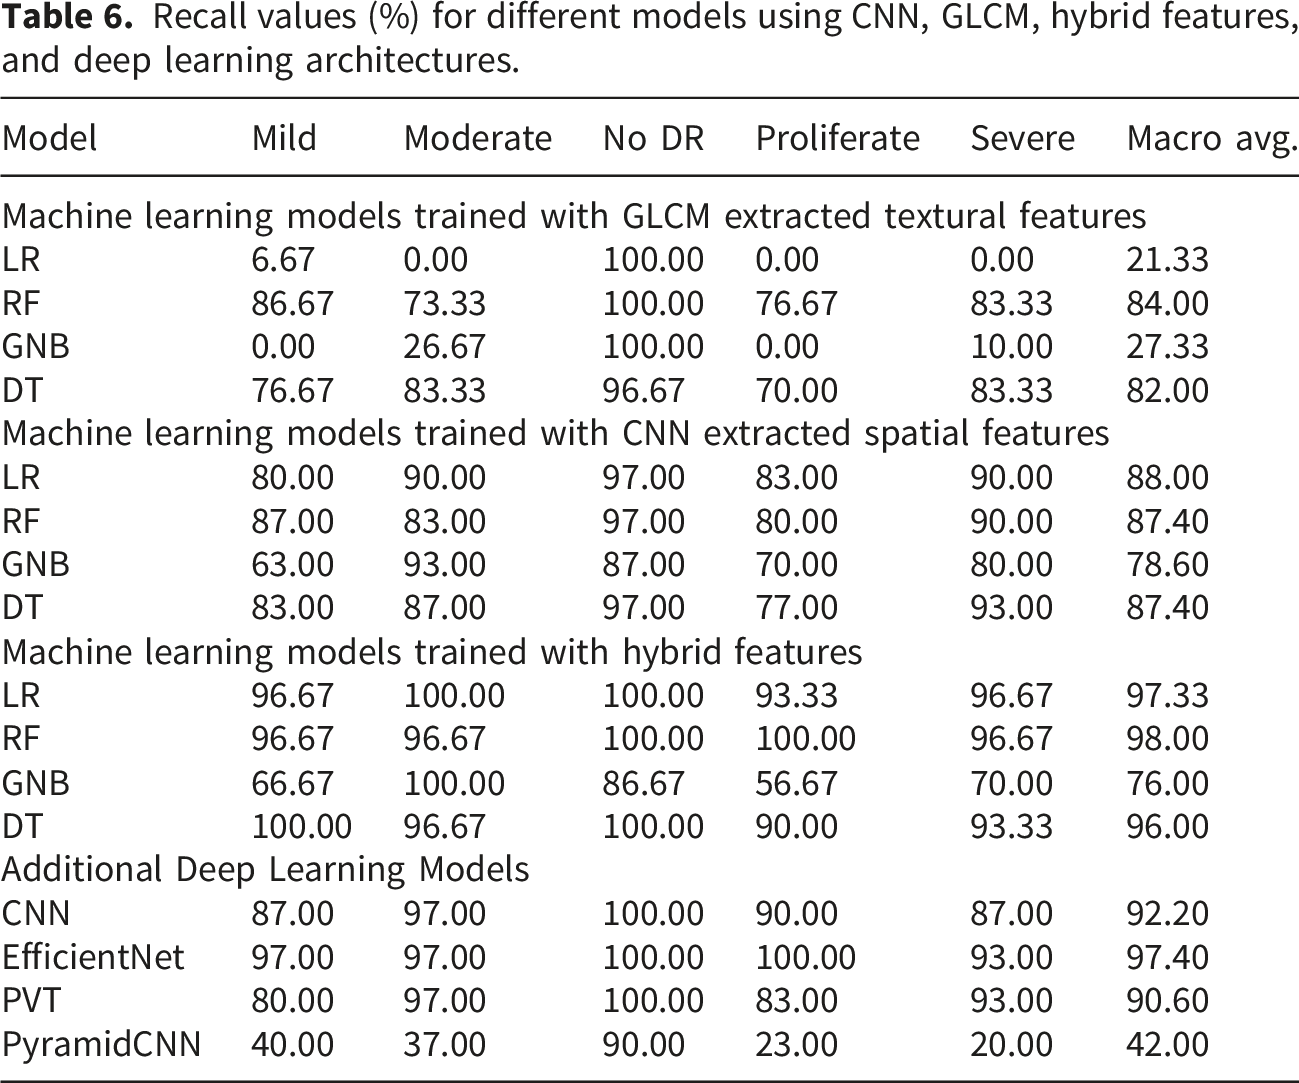
The ML models incorporating GLCM features exhibited varying performance levels. The recall values of each model with the GLCM features are shown in part (A) of Figure 11. The RF model performed well with the GLCM feature, with a high level of recall of each stage of the DR compared to other models. RF model with GLCM features achieved the highest macro-average recall of 84.00%. The DT model with GLCM features showed a macro-average recall of 82.00%. The best performance of tree-based models with GLCM features shows their suitability for working well with the GLCM feature. LR and GNB models showed poor performance with the GLCM feature, yielding a macro-average recall of 21.33% and 27.33%, respectively. Comparison of recall values of each stage of DR with ML models across different features.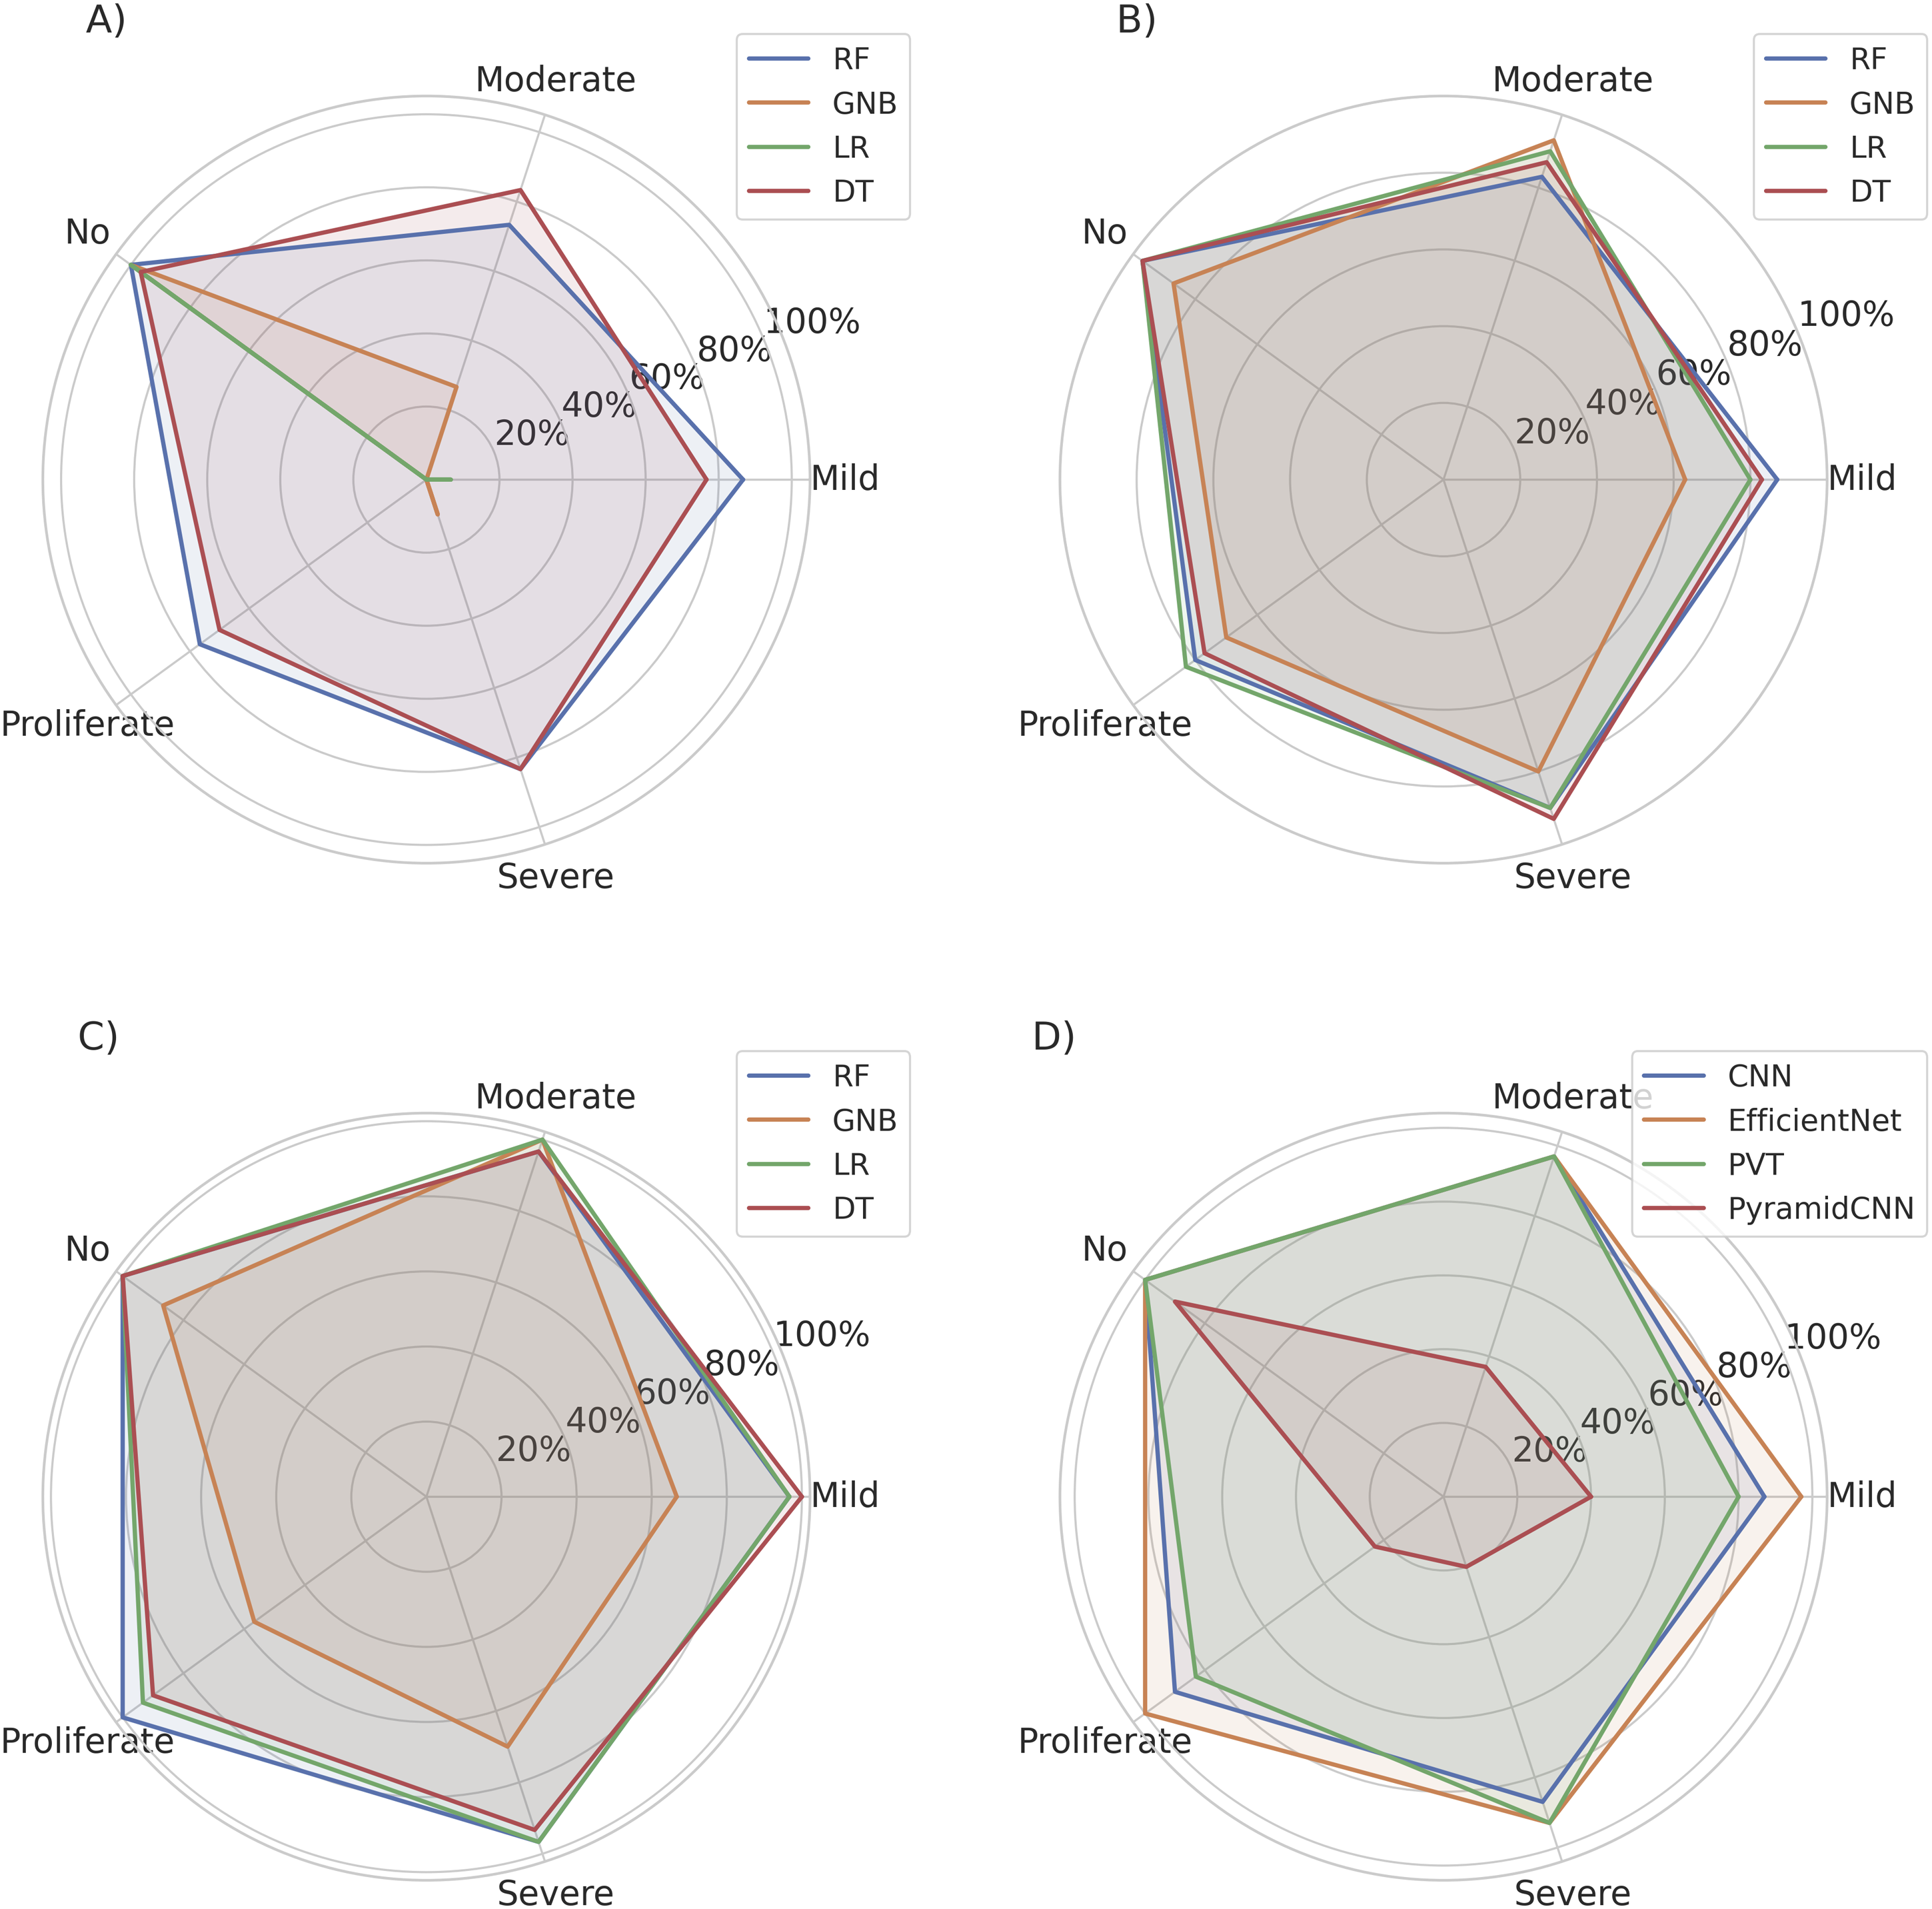
Machine learning models with features extracted using CNN showed relatively better performance than GLCM features in terms of recall at each stage of DR. The recall values for each stage of the DR of each model with CNN features are compared in part (B) of Figure 11. The LR model with features extracted through CNN achieved a macro-average recall of 88.00%. The LR model with features extracted through CNN outperformed other models with features extracted through CNN. RF and DT models with CNN features achieved a macro-average recall of 87.40%. The GNB model with features extracted by CNN achieved a macro-average recall of 78.60%. The GNB model with CNN features showed the lowest recall performance among all models with CNN features.
The ML models with hybrid features showed better performance than models trained with only GLCM or CNN features. The recall values for each stage of the DR of each model using the hybrid features are compared in part (C) of Figure 11. The RF model with the hybrid features achieved a macro-average recall of 98.00%. The RF model with the hybrid features outperformed other models with the hybrid features in terms of recall analysis. The RF model with the hybrid features also showed high recall values for each stage of DR compared to any other models. The RF model achieved a very high recall score of 1.00 for the ’No’ and ’Proliferate’ classes of DR. The high recall of the RF model with the hybrid features reflects its strong ability to differentiate among different stages of DR. The RF model with the hybrid features achieved better recall than any other models.
The macro average recall from all models trained with hybrid features is compared in Figure 12. The LR model with hybrid features also showed better macro average recall of 97.33%. The DT model with the hybrid features achieved a macro-average recall of 96.00%. The GNB model with the hybrid features achieved a very low macro-average recall of 76.00% compared to the macro average from other models trained with the hybrid models. The GNB model with hybrid features also showed lower recall of 66.67% and 57.67% for ’Mild’ and ’Proliferate’ classes of DR, respectively. The GNB model with the hybrid features showed the lowest performance compared to all models with the hybrid features. The results revealed the importance of selecting appropriate feature extraction methods and ML models to identify different stages of DR. ML models with the hybrid features showed significant performance improvements compared to the use of only the GLCM and CNN features, and even from the deep learning models. The RF model with the hybrid features emerged as the best performer, achieving an impressive macro-average recall of 98.00%. Comparison of macro average recall of DR classes with different ML models.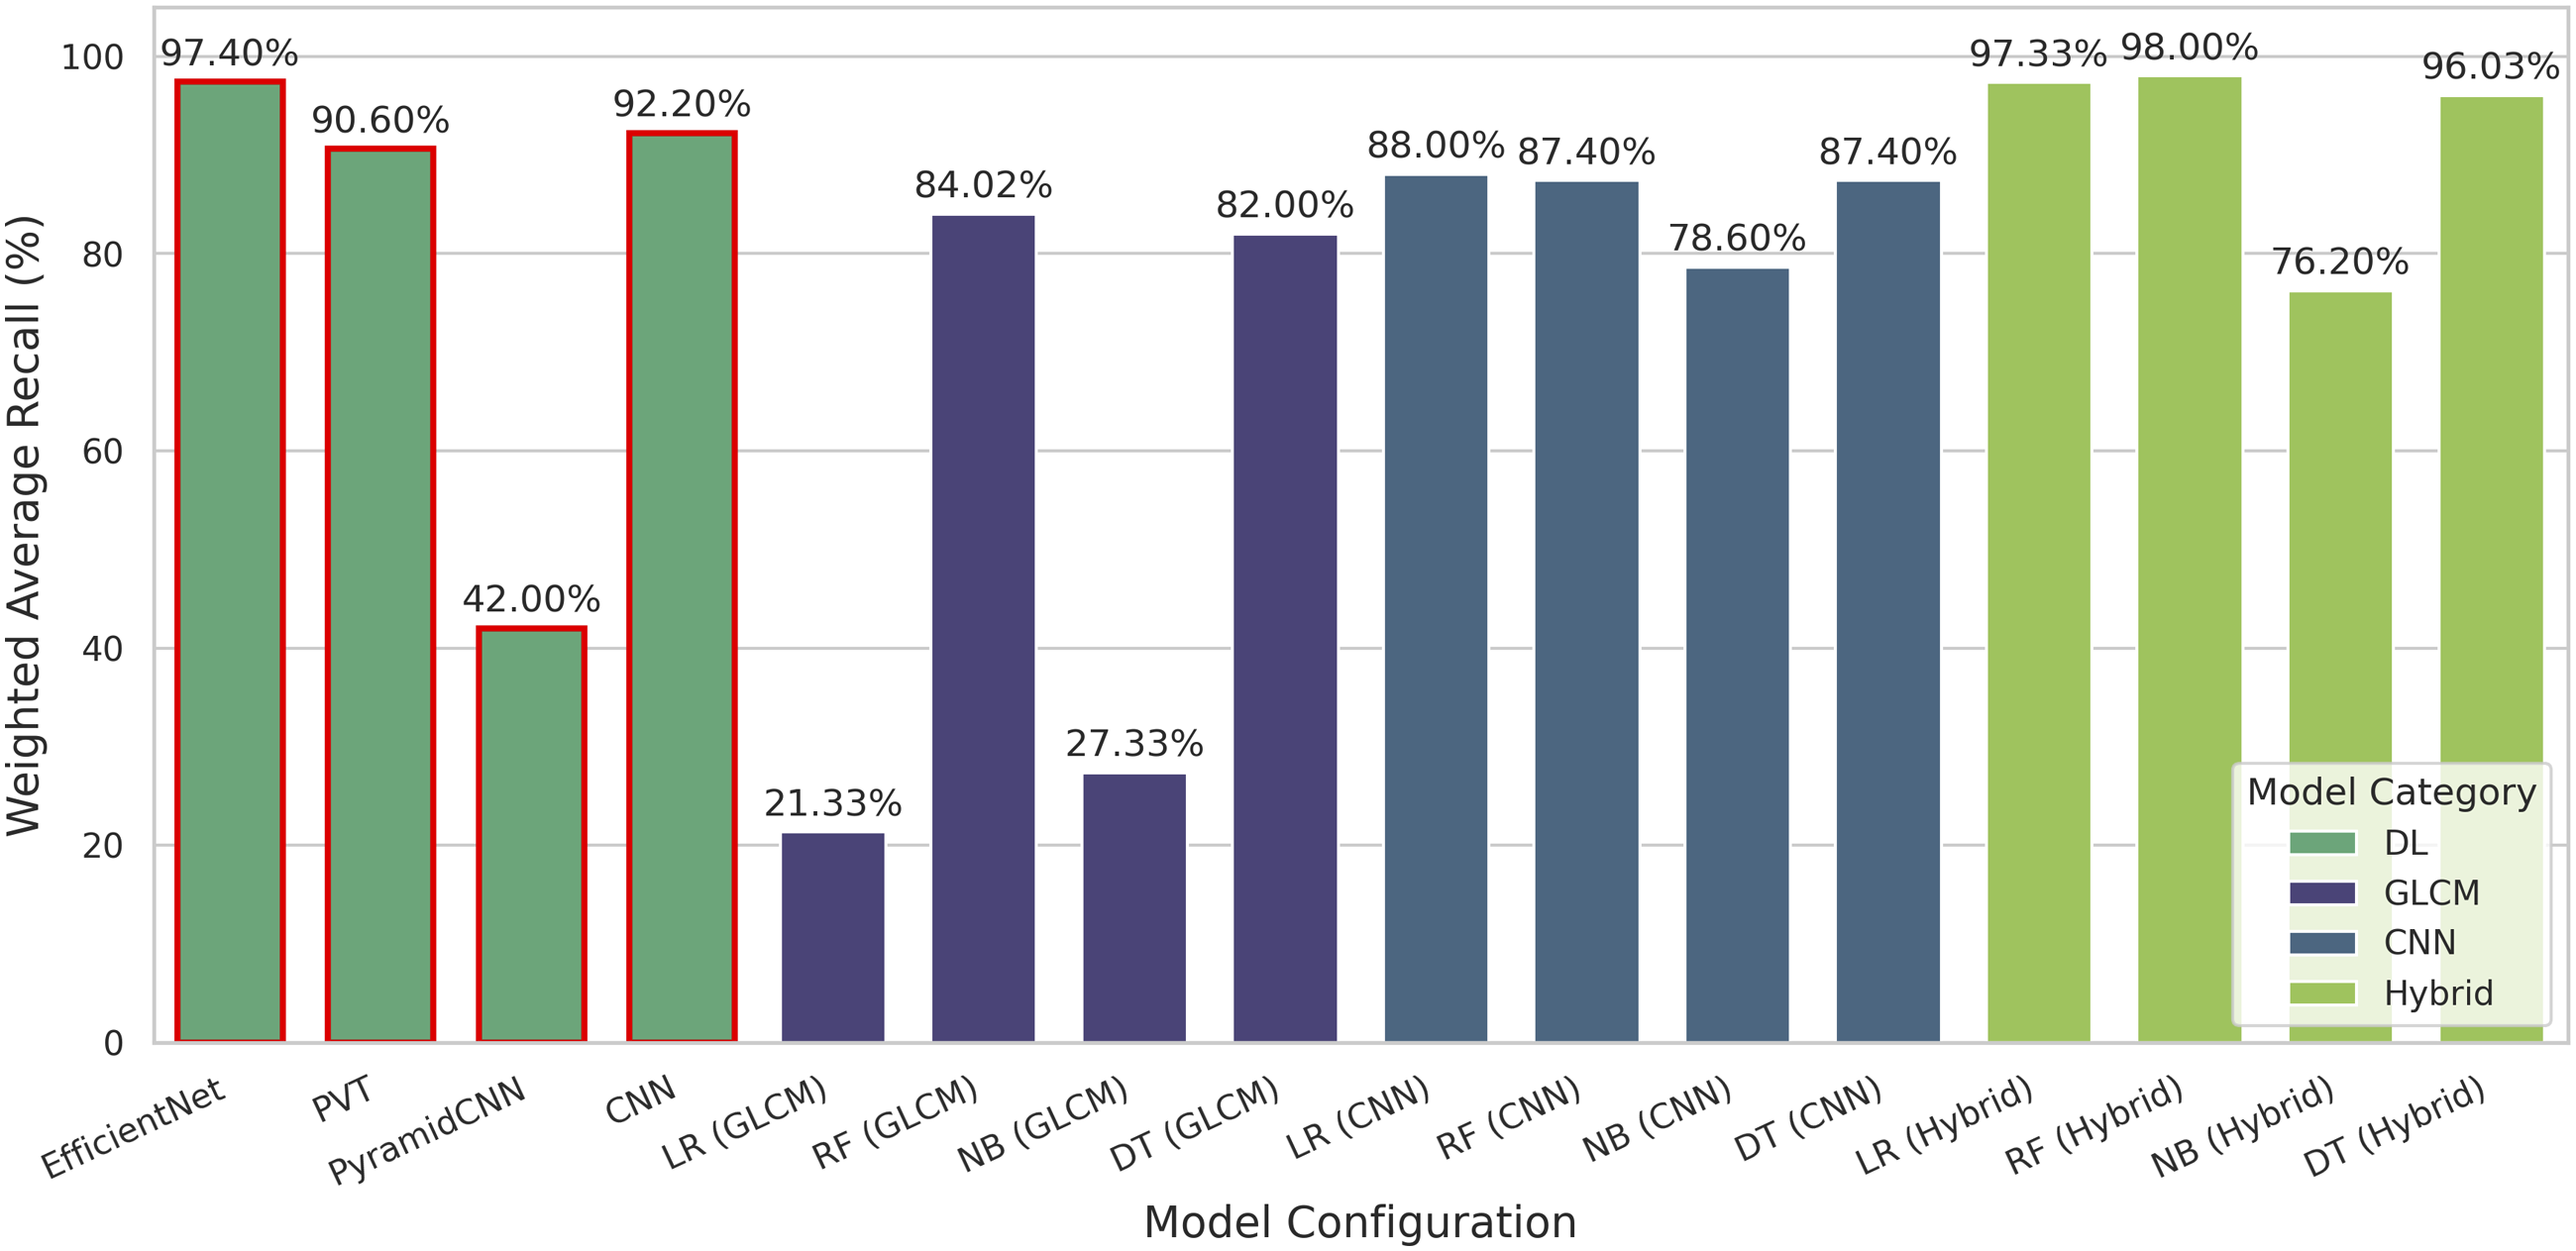
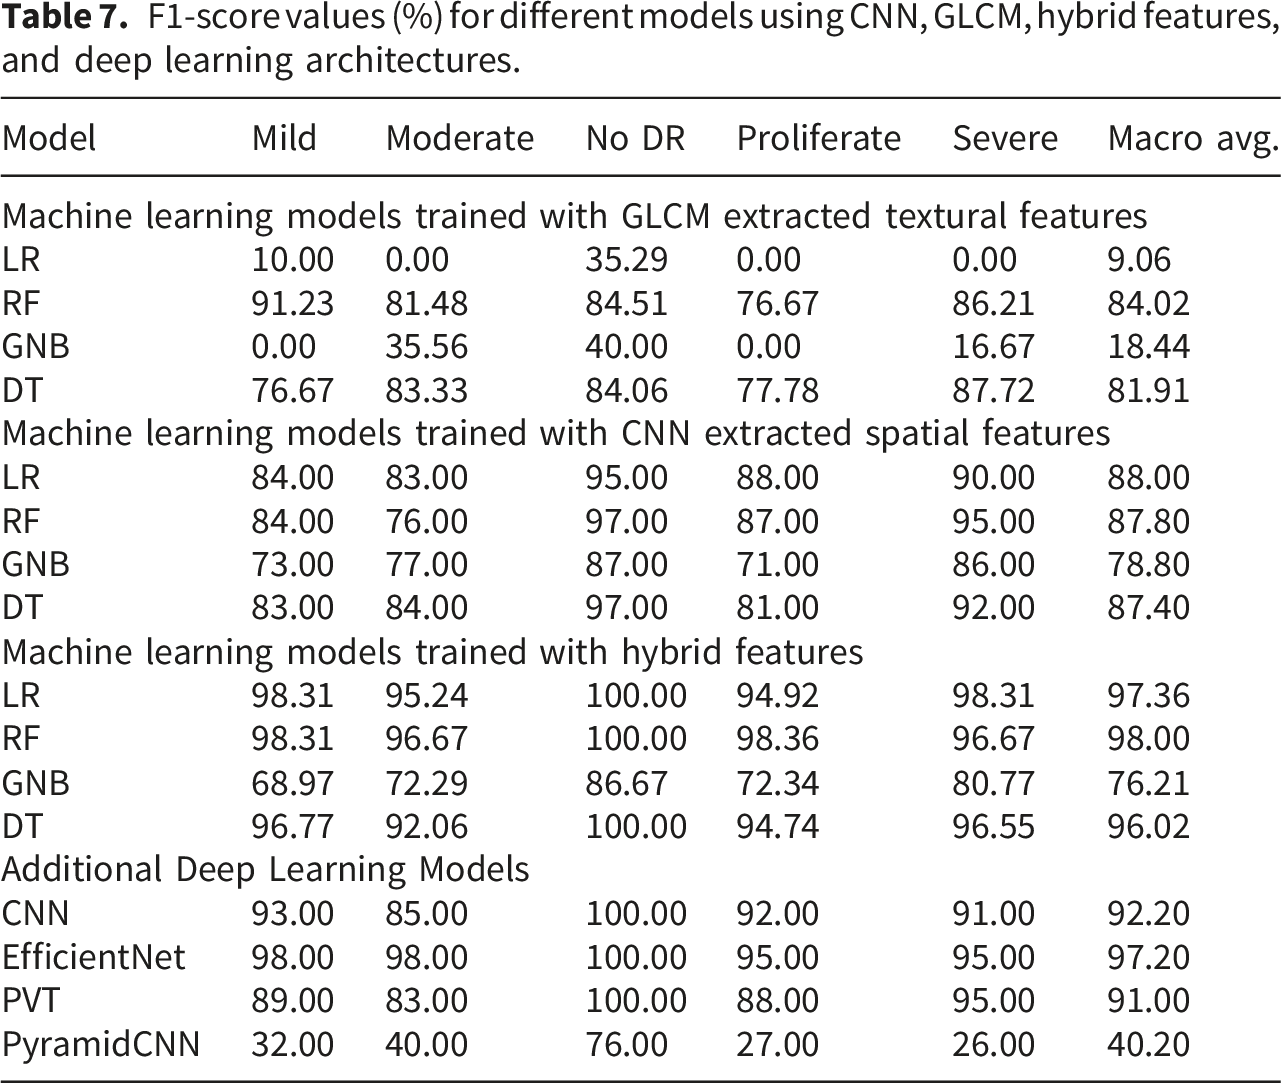
F1-score values (%) for different models using CNN, GLCM, hybrid features, and deep learning architectures.
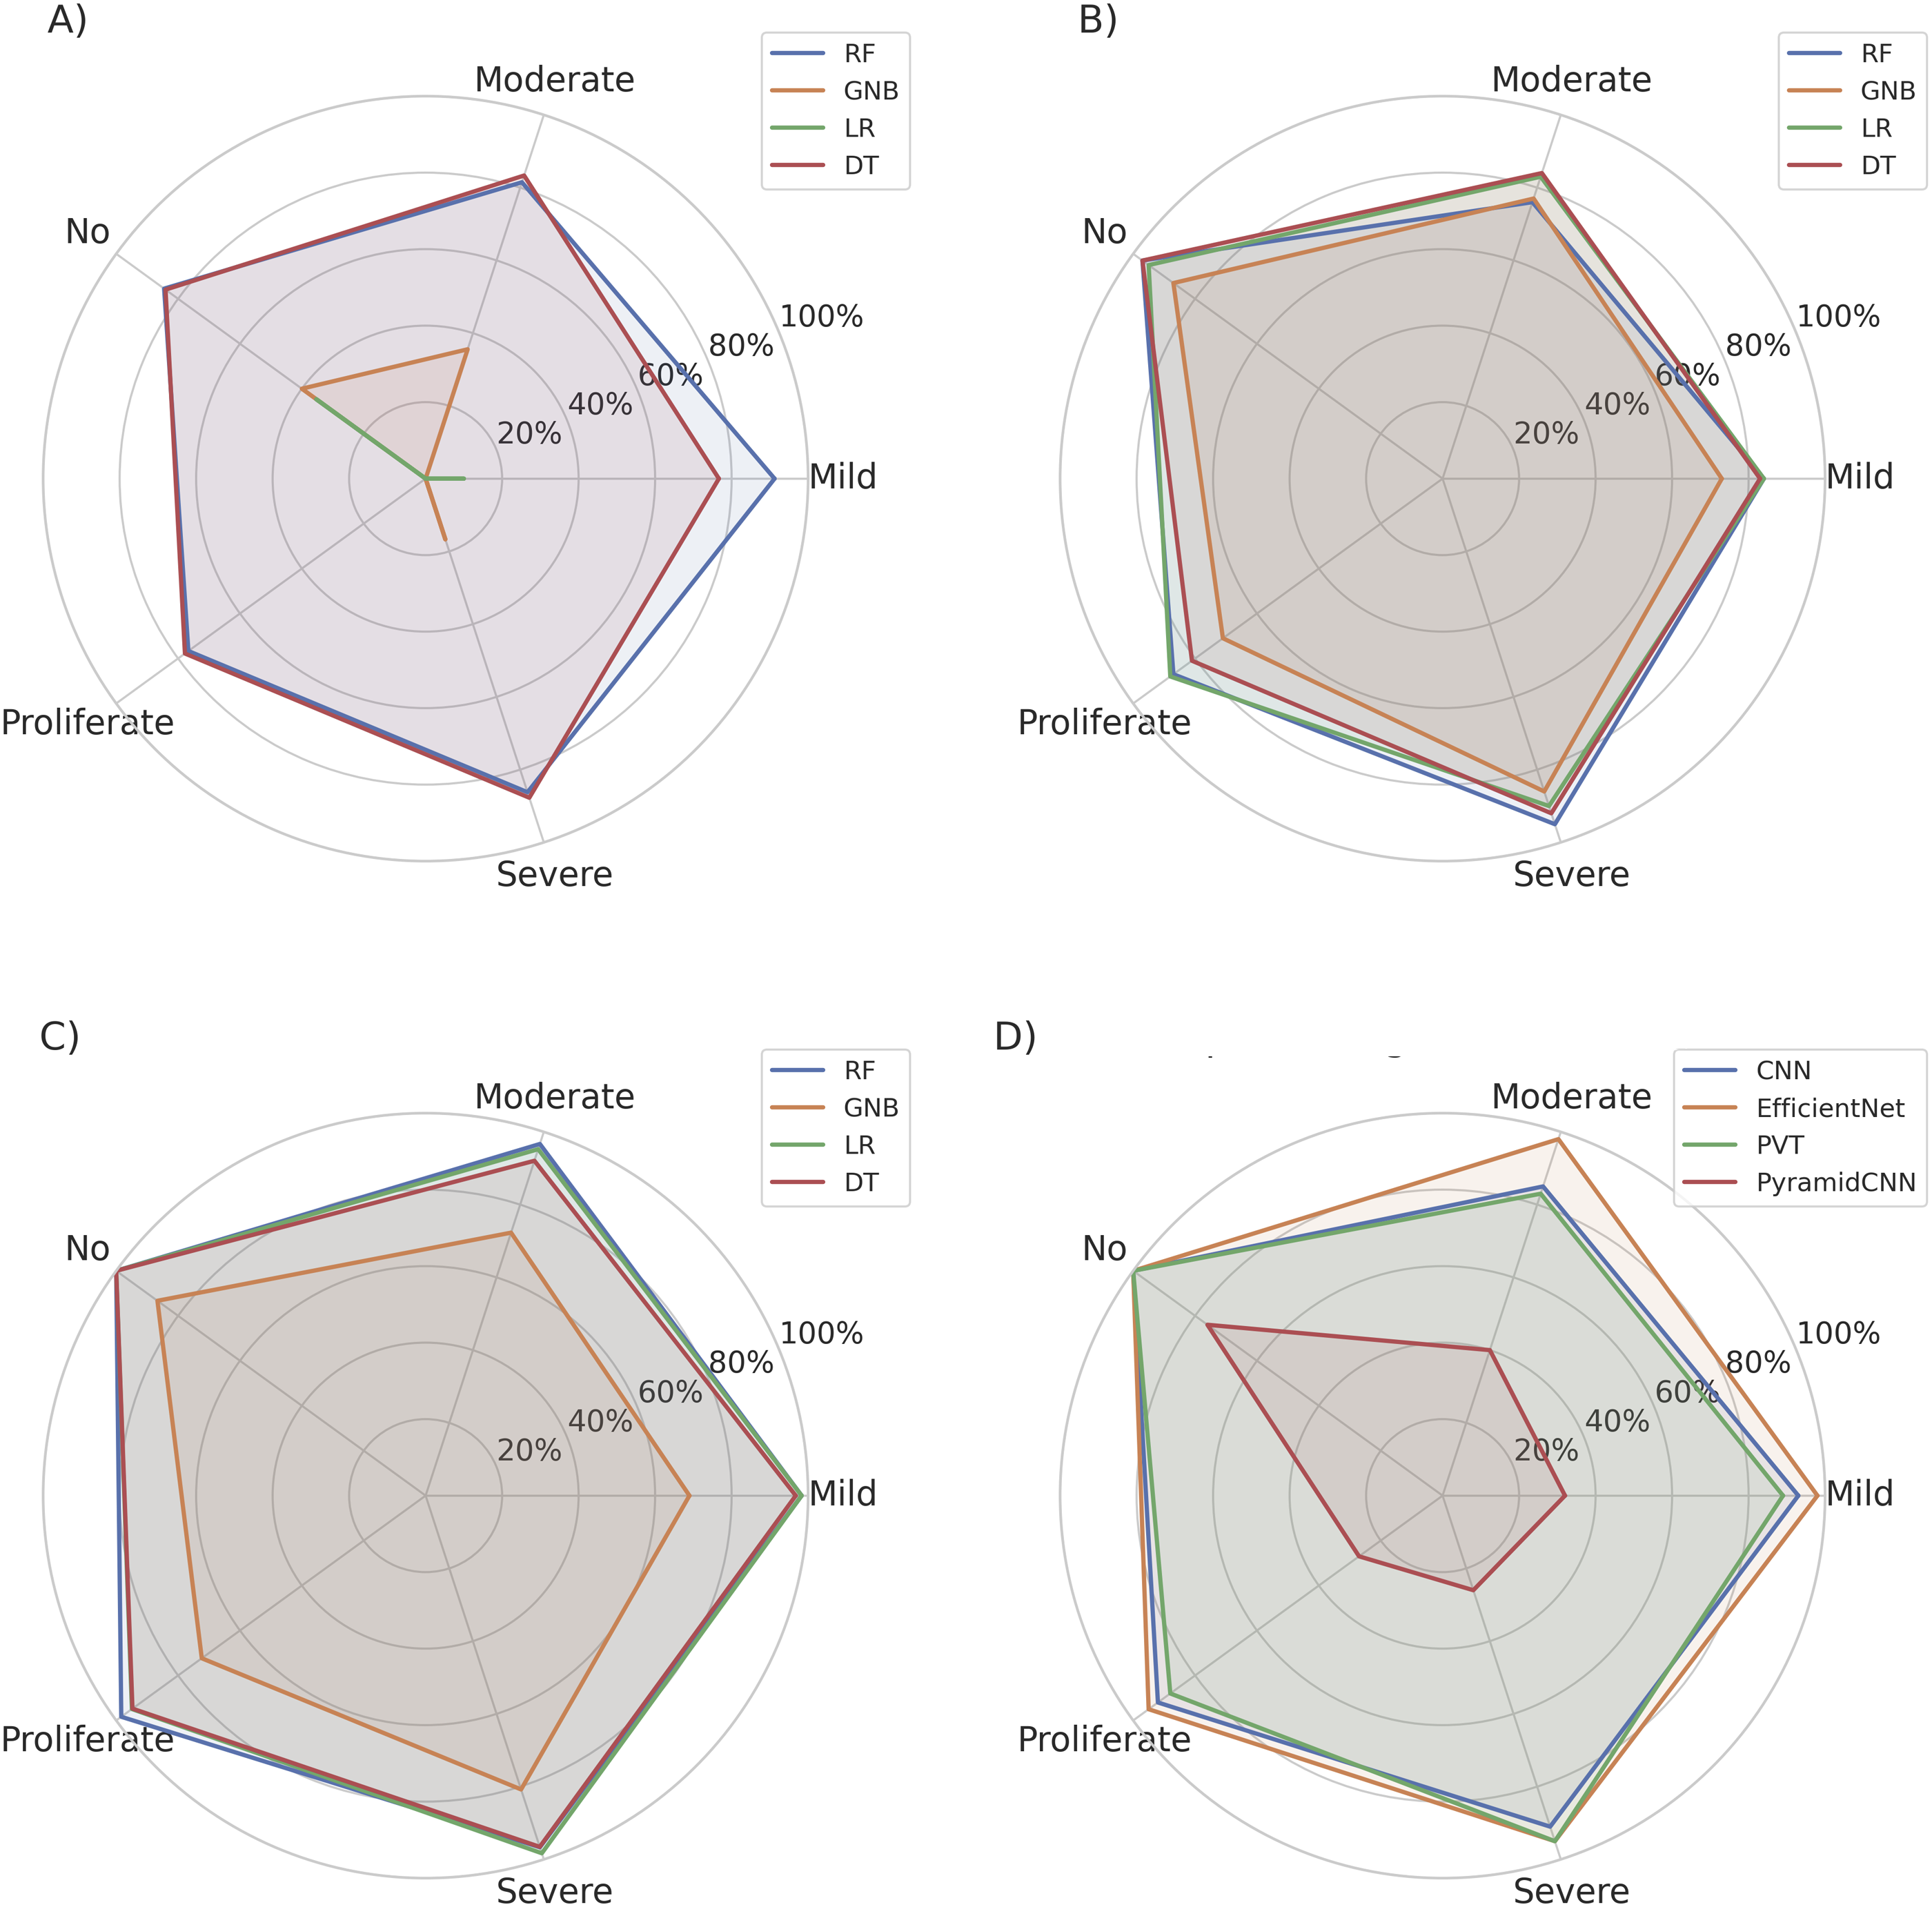
Comparison of F1 score of each stage of DR with different ML models across different feature sets.
The ML models with the GLCM features showed different levels of performance in terms of the F1 score. The F1 scores for each stage of DR from each model in the GLCM features are shown in part (A) of Figure 13. The RF model performed well with the GLCM feature, with a high F1 score for each stage of the DR compared to the other models. RF model with GLCM features achieved the highest macro-average F1 score of 84.02% across all models trained with GLCM features. The DT model with GLCM features showed a macro-average recall of 81.91%. The best performance of tree-based models with GLCM features shows their suitability to work well with the GLCM feature. LR and GNB models showed poor performance with GLCM feature, with a macro-average recall of 9.06% and 18.44%, respectively. The ML models with GLCM features showed low performance.
Machine learning models with features extracted using CNN showed relatively better performance compared to GLCM features in terms of F1 score for each stage of DR. The F1 scores for each stage of the DR of each model in the CNN features are compared in part (B) of Figure 13. The LR model with features extracted through CNN achieved the highest macro-average F1 score of 88.00% compared to the models with CNN based spatial features. The LR model with spatial features extracted through CNN outperformed other models with features extracted through CNN in terms of F1 score analysis. RF and DT models with CNN features achieved a macro-average F1 score of 87.80% and 87.40%, respectively. The GNB model with the feature extracted by CNN achieved a macro-average F1 score of 76.21%. The GNB model with features extracted through CNN showed the lowest performance in terms of F1 score among all models with features extracted through CNN.
The ML models with the combination of CNN and GLCM features showed better performance compared to models with only the GLCM and CNN features in terms of F1 score. The F1 score for each stage of the DR of each model using the hybrid features is compared in part (C) of Figure 13. The RF model with the hybrid features achieved the highest macro-average F1 score of 98.00% across all models. The RF model with the hybrid features outperformed other models with the hybrid features in terms of F1 score analysis. The RF model with the hybrid features also showed a high F1 score for the identification of each stage of DR. The RF model achieved a very high F1 score of 100.00% for the ’No’ class of DR. The high F1 score of the RF model with the hybrid features reflects its strong ability to differentiate among different stages of DR. The LR model with the hybrid features also achieved a macro-average F1 score of 97.36%. The LR model also achieved a high F1 score for the identification of all classes of DR. The DT model with the hybrid features achieved a macro-average F1 score of 96.02%. The GNB model with the hybrid features achieved a low macro-average recall of 76.21% compared to the models trained with hybrid features. The GNB model with the hybrid features showed a lower F1 score of 68.97% and 72.29% for the ’Mild’ and ’Moderate’ classes of DR compared to the F1 score of these classes from the spatial feature based ML models. The GNB model with the hybrid features showed the lowest performance compared to all models with the hybrid features. ML models incorporating hybrid features showed significant performance improvements compared to those trained with only GLCM and CNN features. The RF model with the hybrid features achieved the best performance in terms of F1 score, with a high macro-average recall of 98.00%.
The EfficientNet deep learning model also performed well with high macro average F1 score of 97.20% and high recall value for each class of DR. The CNN and PVT also showed high macro average F1 score of 92.20% and 91.00%. The PyramidCNN showed low macro average recall of 42.20%.
The macro average F1 scores from all models are compared in Figure 14. The RF model with the hybrid features achieved the highest macro-average recall compared to all models, which is even higher than the F1 scores from the deep learning models. The RF model with hybrid features also showed better macro average recall of 98.00%, which is also higher compared to the F1 score from the high performing EfficientNet deep learning model. Comparison of macro average F1 score of DR classes with different ML models.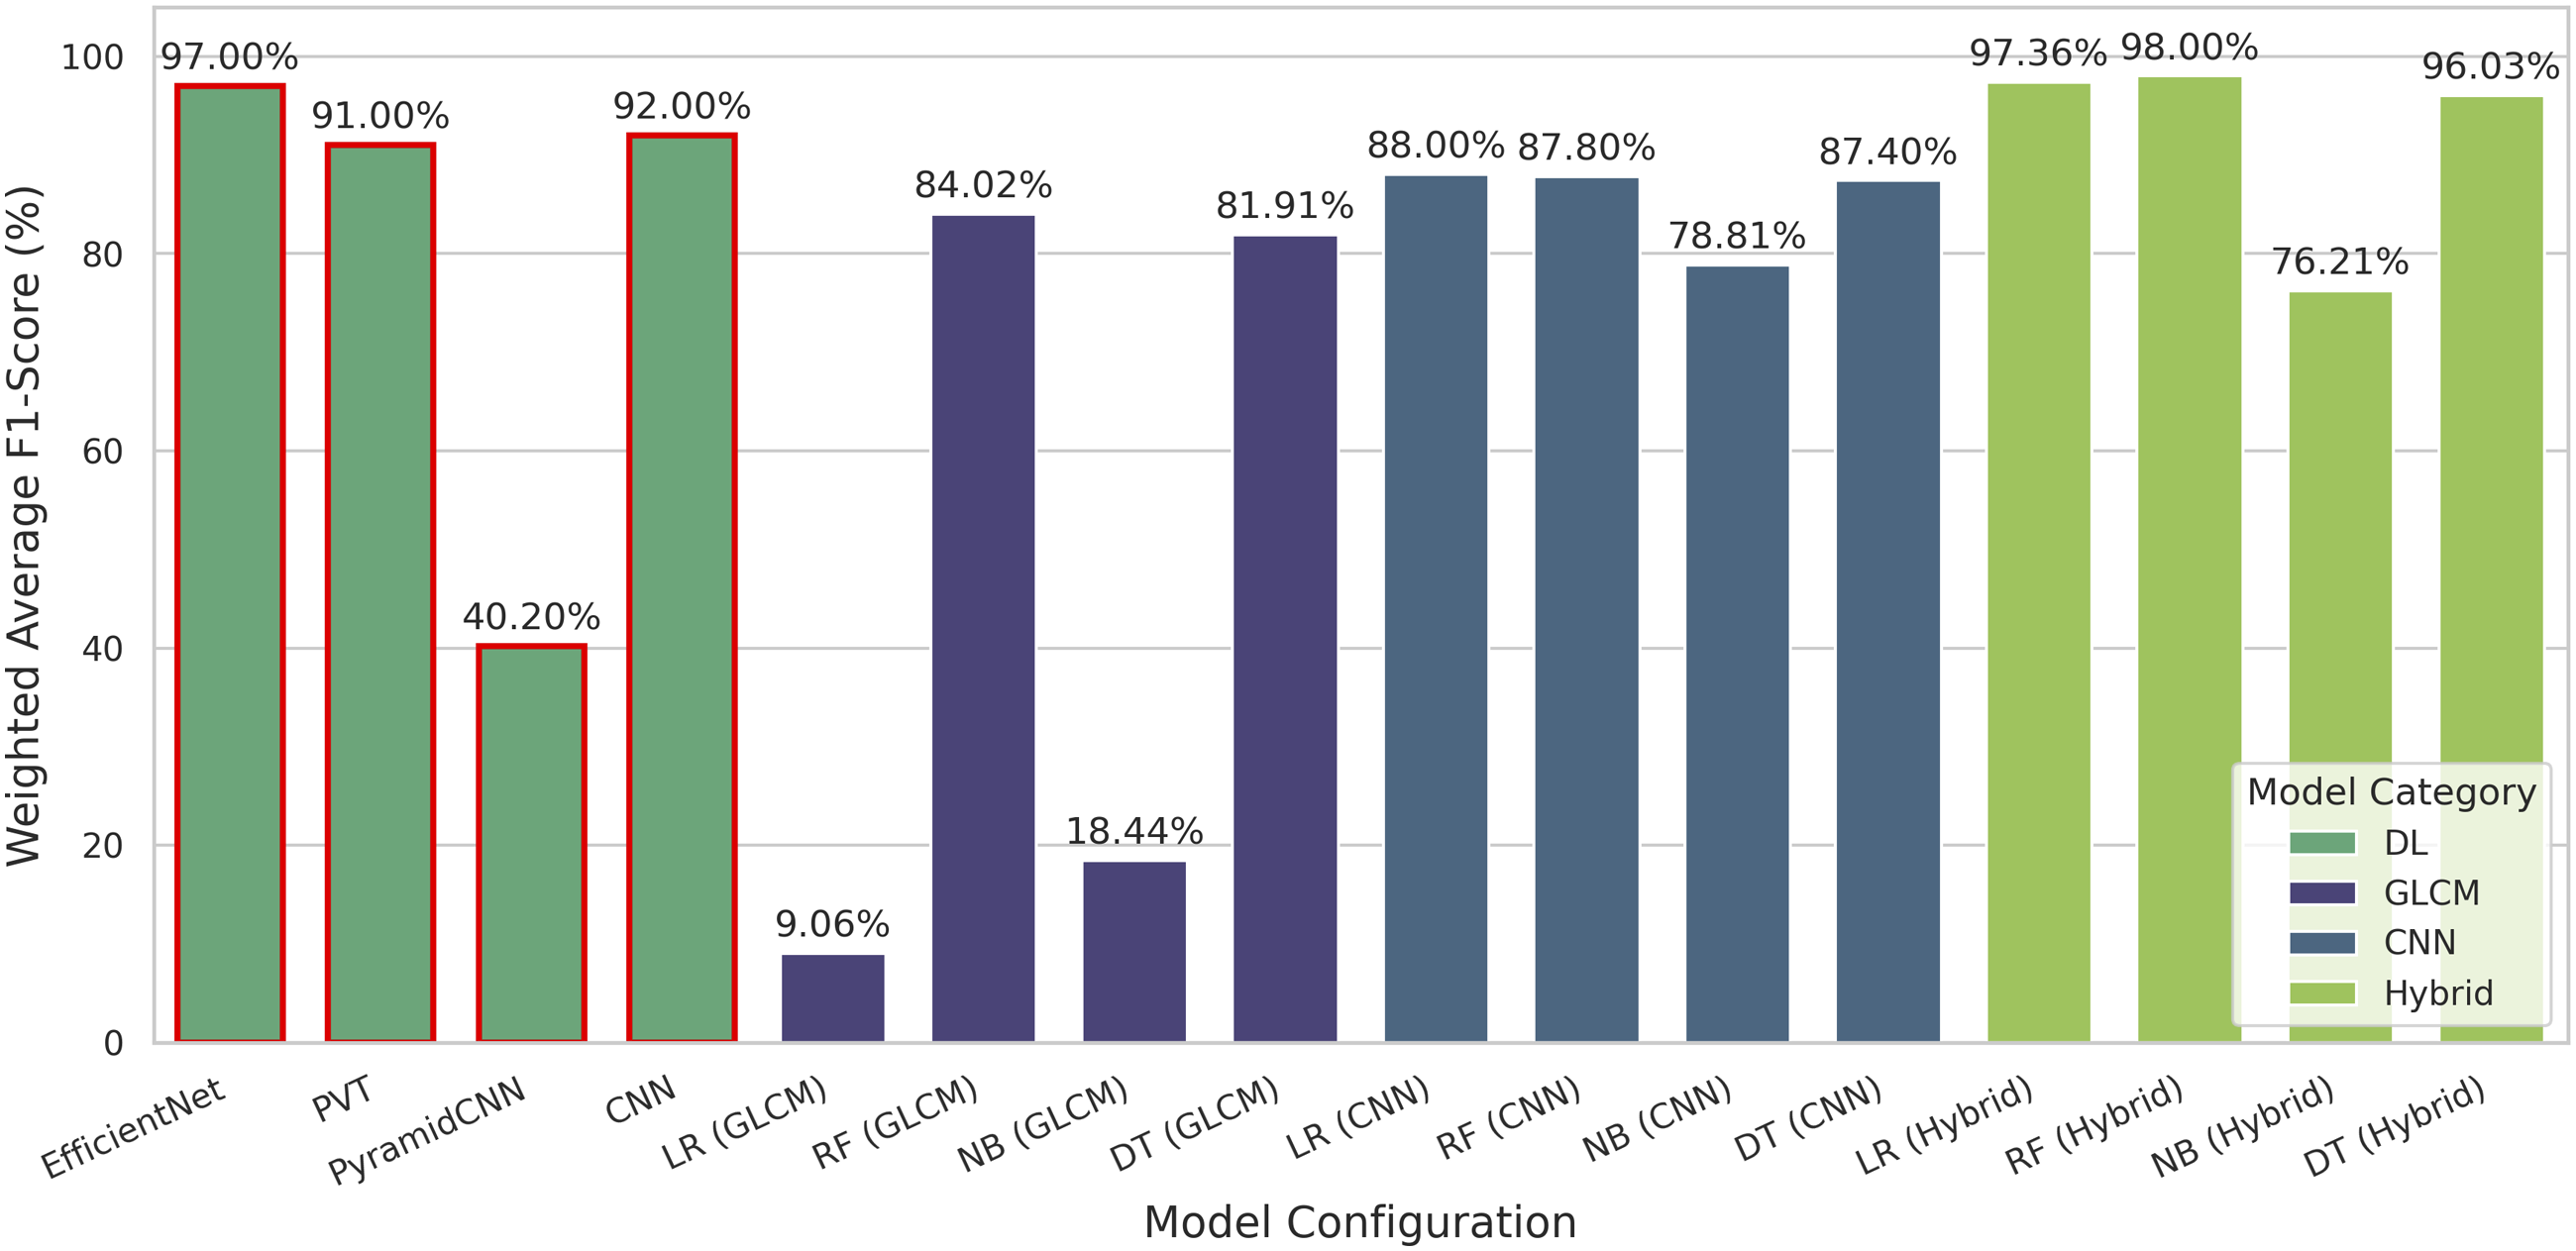
The ROC curves and AUC values for each stage of the DR of each model with the GLCM features are shown in Figure 15. The AUC values of each stage of DR of every model with GLCM features are also given in Table 8. RF and DT models with GLCM features outperformed other models with high AUC values compared to the AUC values of models trained with GLCM features. The LR and GNB models with GLCM features showed poor performance, characterized by low AUC values across all stages of DR. These results suggest that the RF and DT models with GLCM features exhibit higher predictive abilities for each stage of DR compared to the LR and The GNB model with GLCM features. The high AUC values from the RF and DT models indicate the high discriminating ability of these models with GLCM features. ROC curves of ML models with GLCM extracted textural feature. AUC values of models across different feature extraction methods.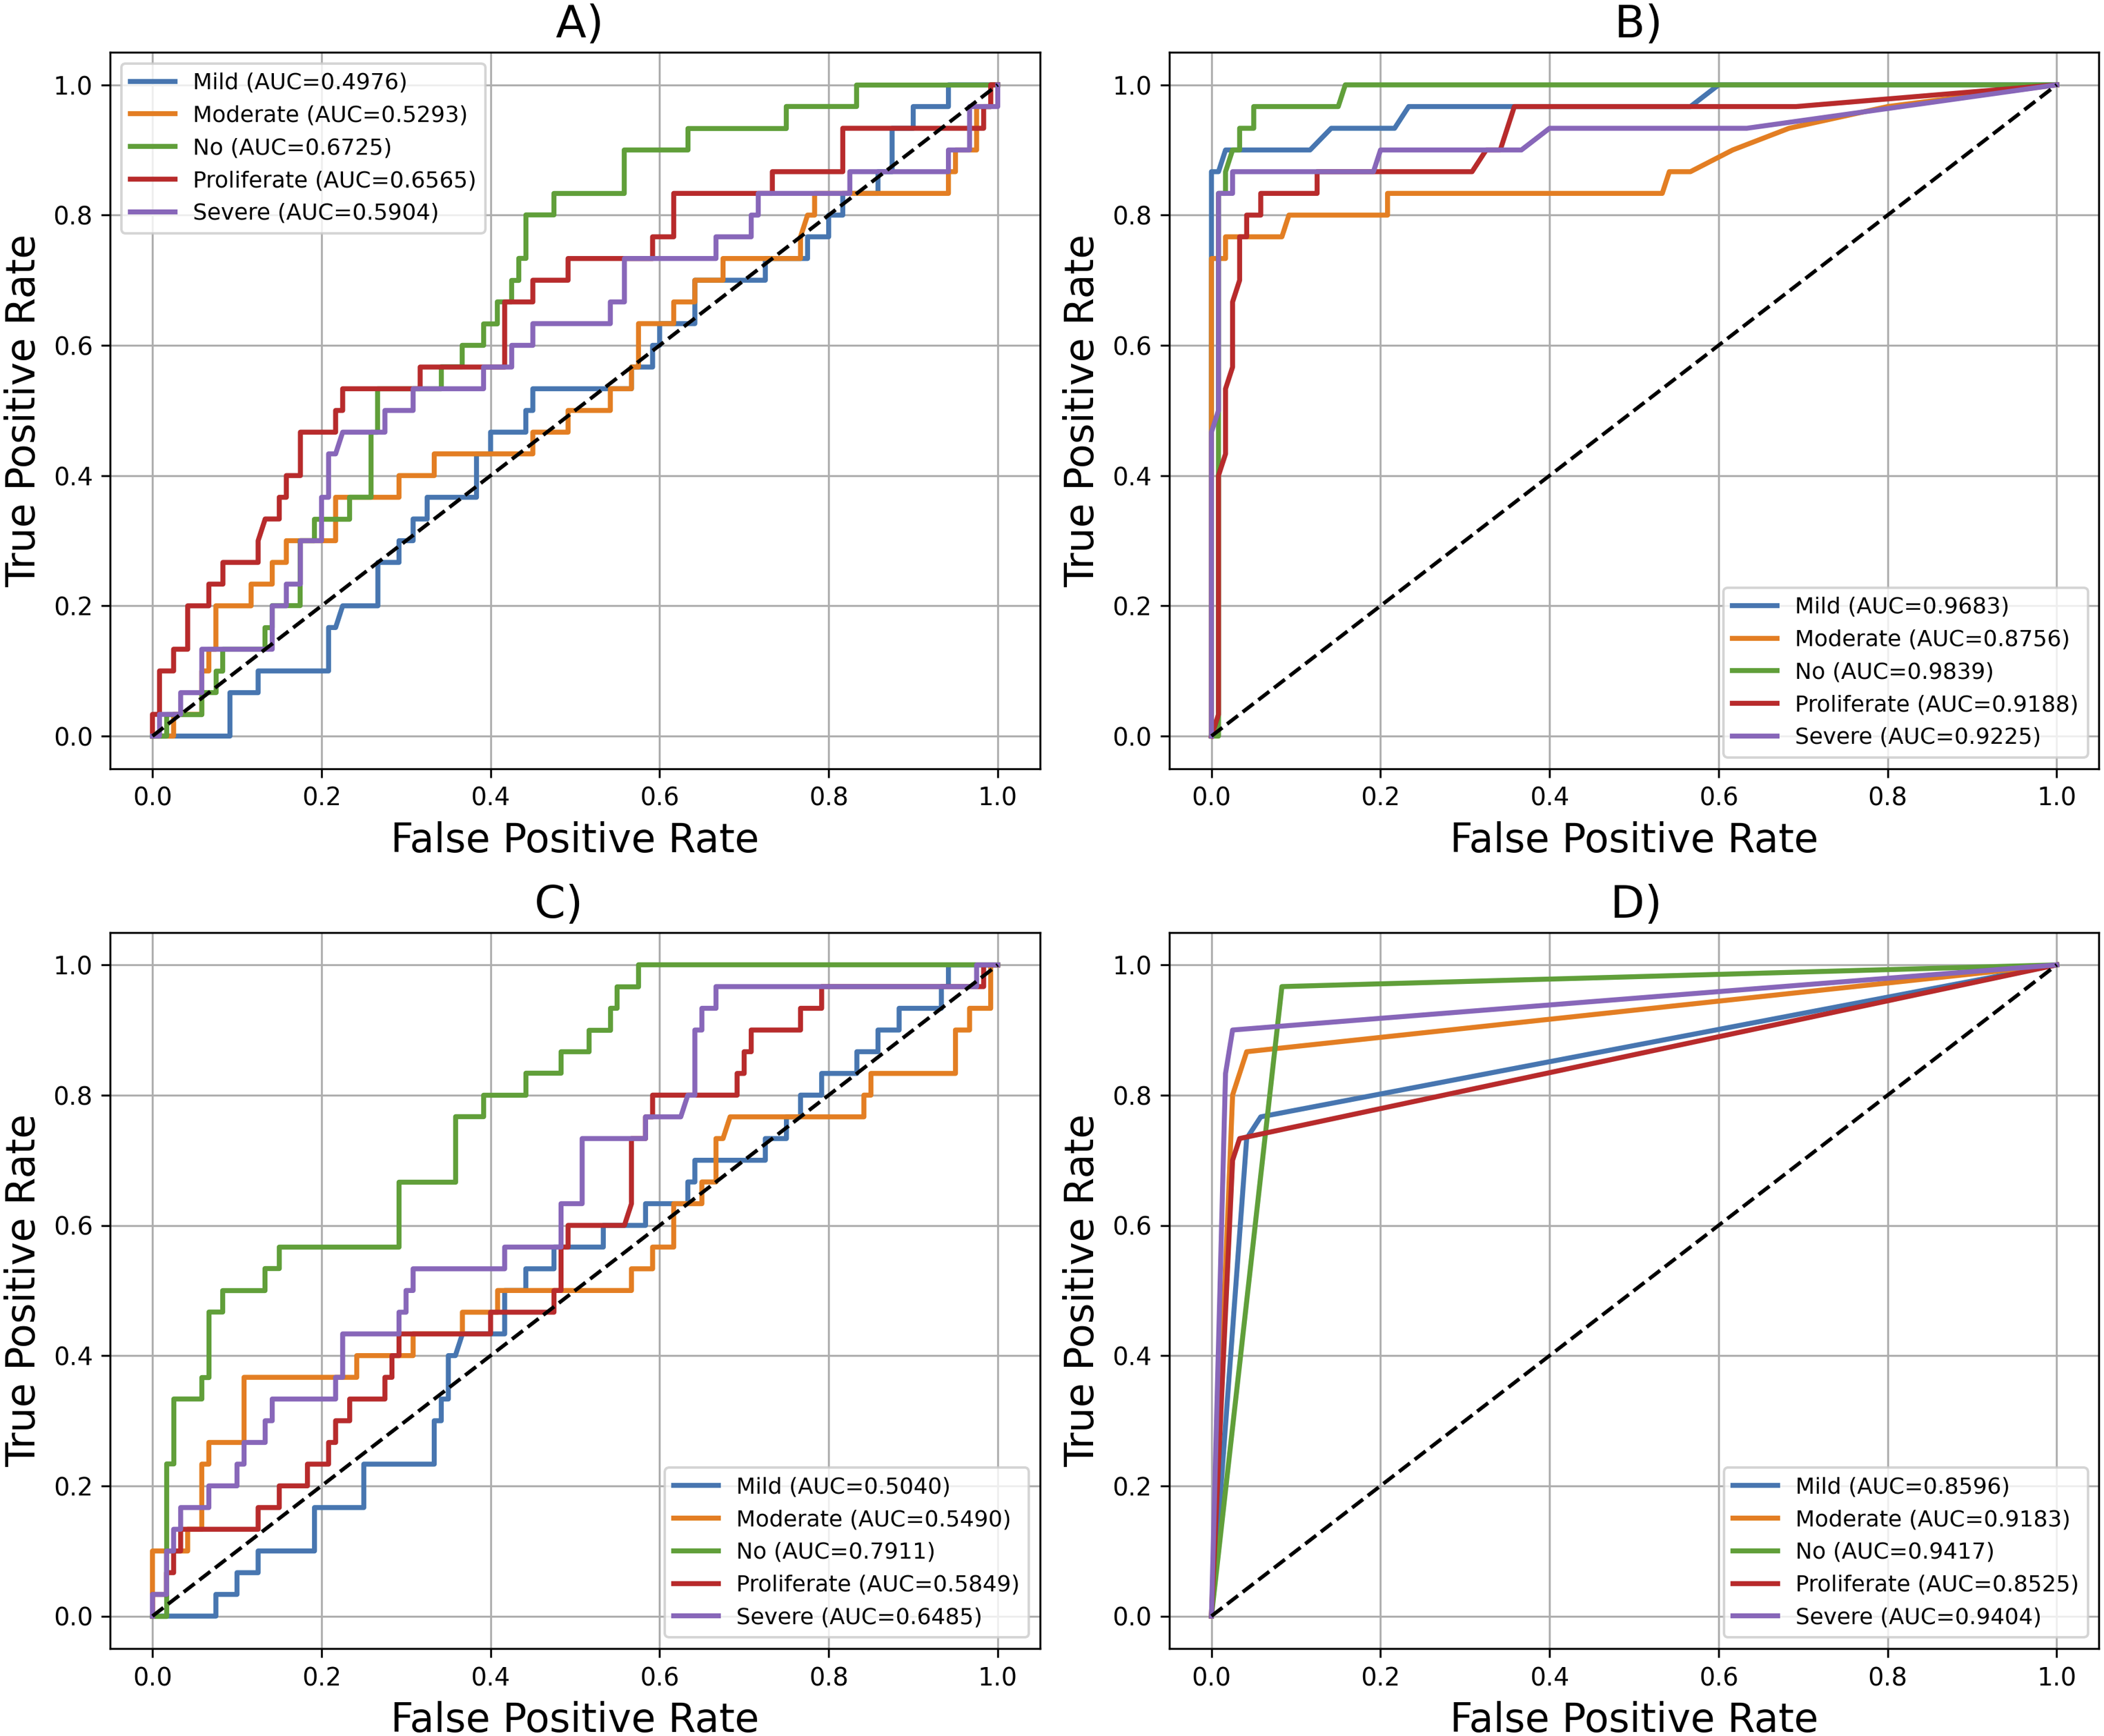
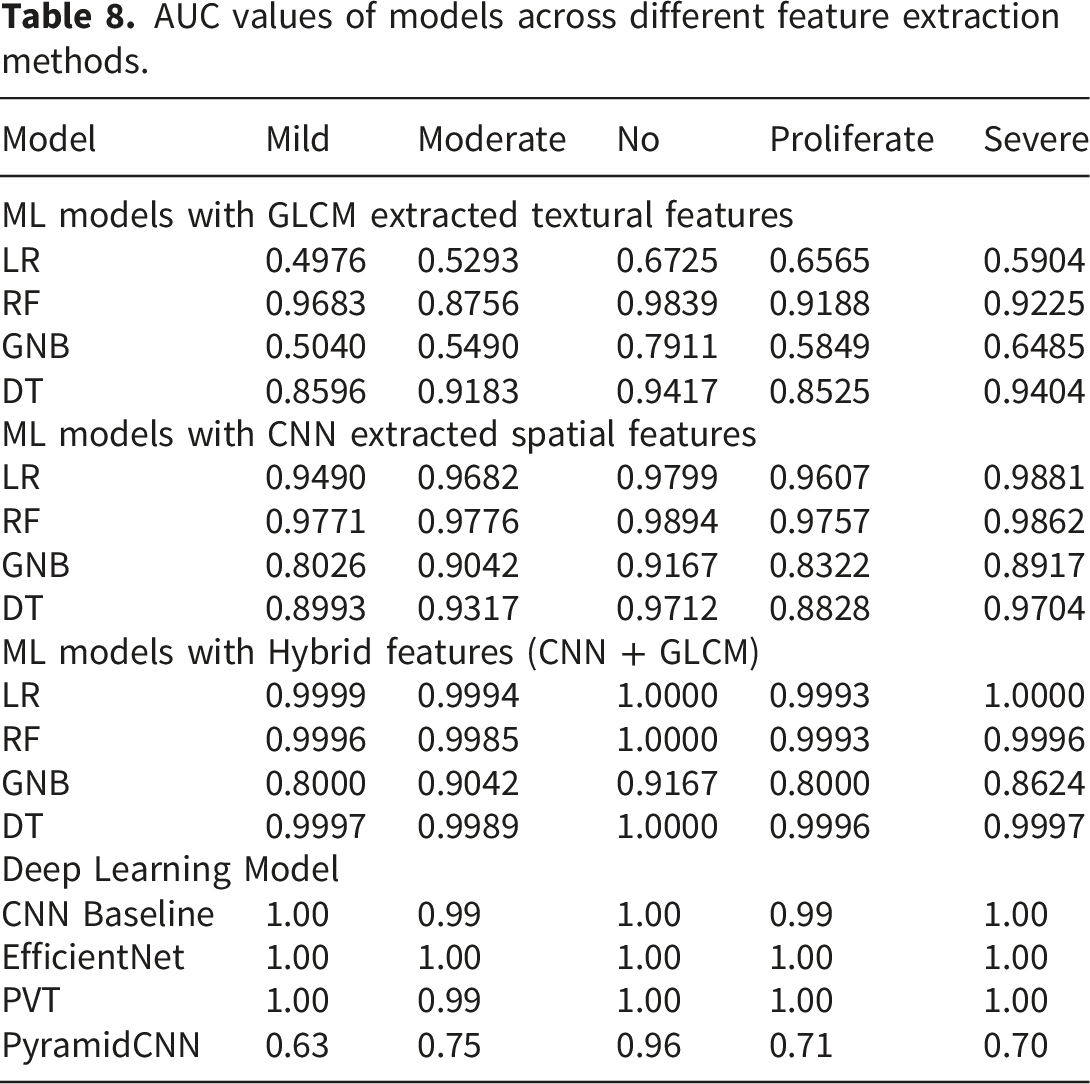
The ROC curves and AUC values for each stage of the DR of each model with spatial features extracted through the CNN are shown in Figure 16. The AUC values of each stage of DR from every model with CNN features are also given in Table 8. LR and The RF model with CNN features outperformed other models, with high AUC values compared to AUC values from the models trained with CNN features. The DT model with the CNN features also showed good performance with high AUC values. The GNB model with the CNN features showed poor performance in terms of AUC values. These results show that LR, RF, and DT have high discriminating abilities for each stage of DR. The LR and RF models with spatial features showed high discriminating abilities of these models for discriminating different DR classes. ROC curves of ML models with CNN extracted spatial features.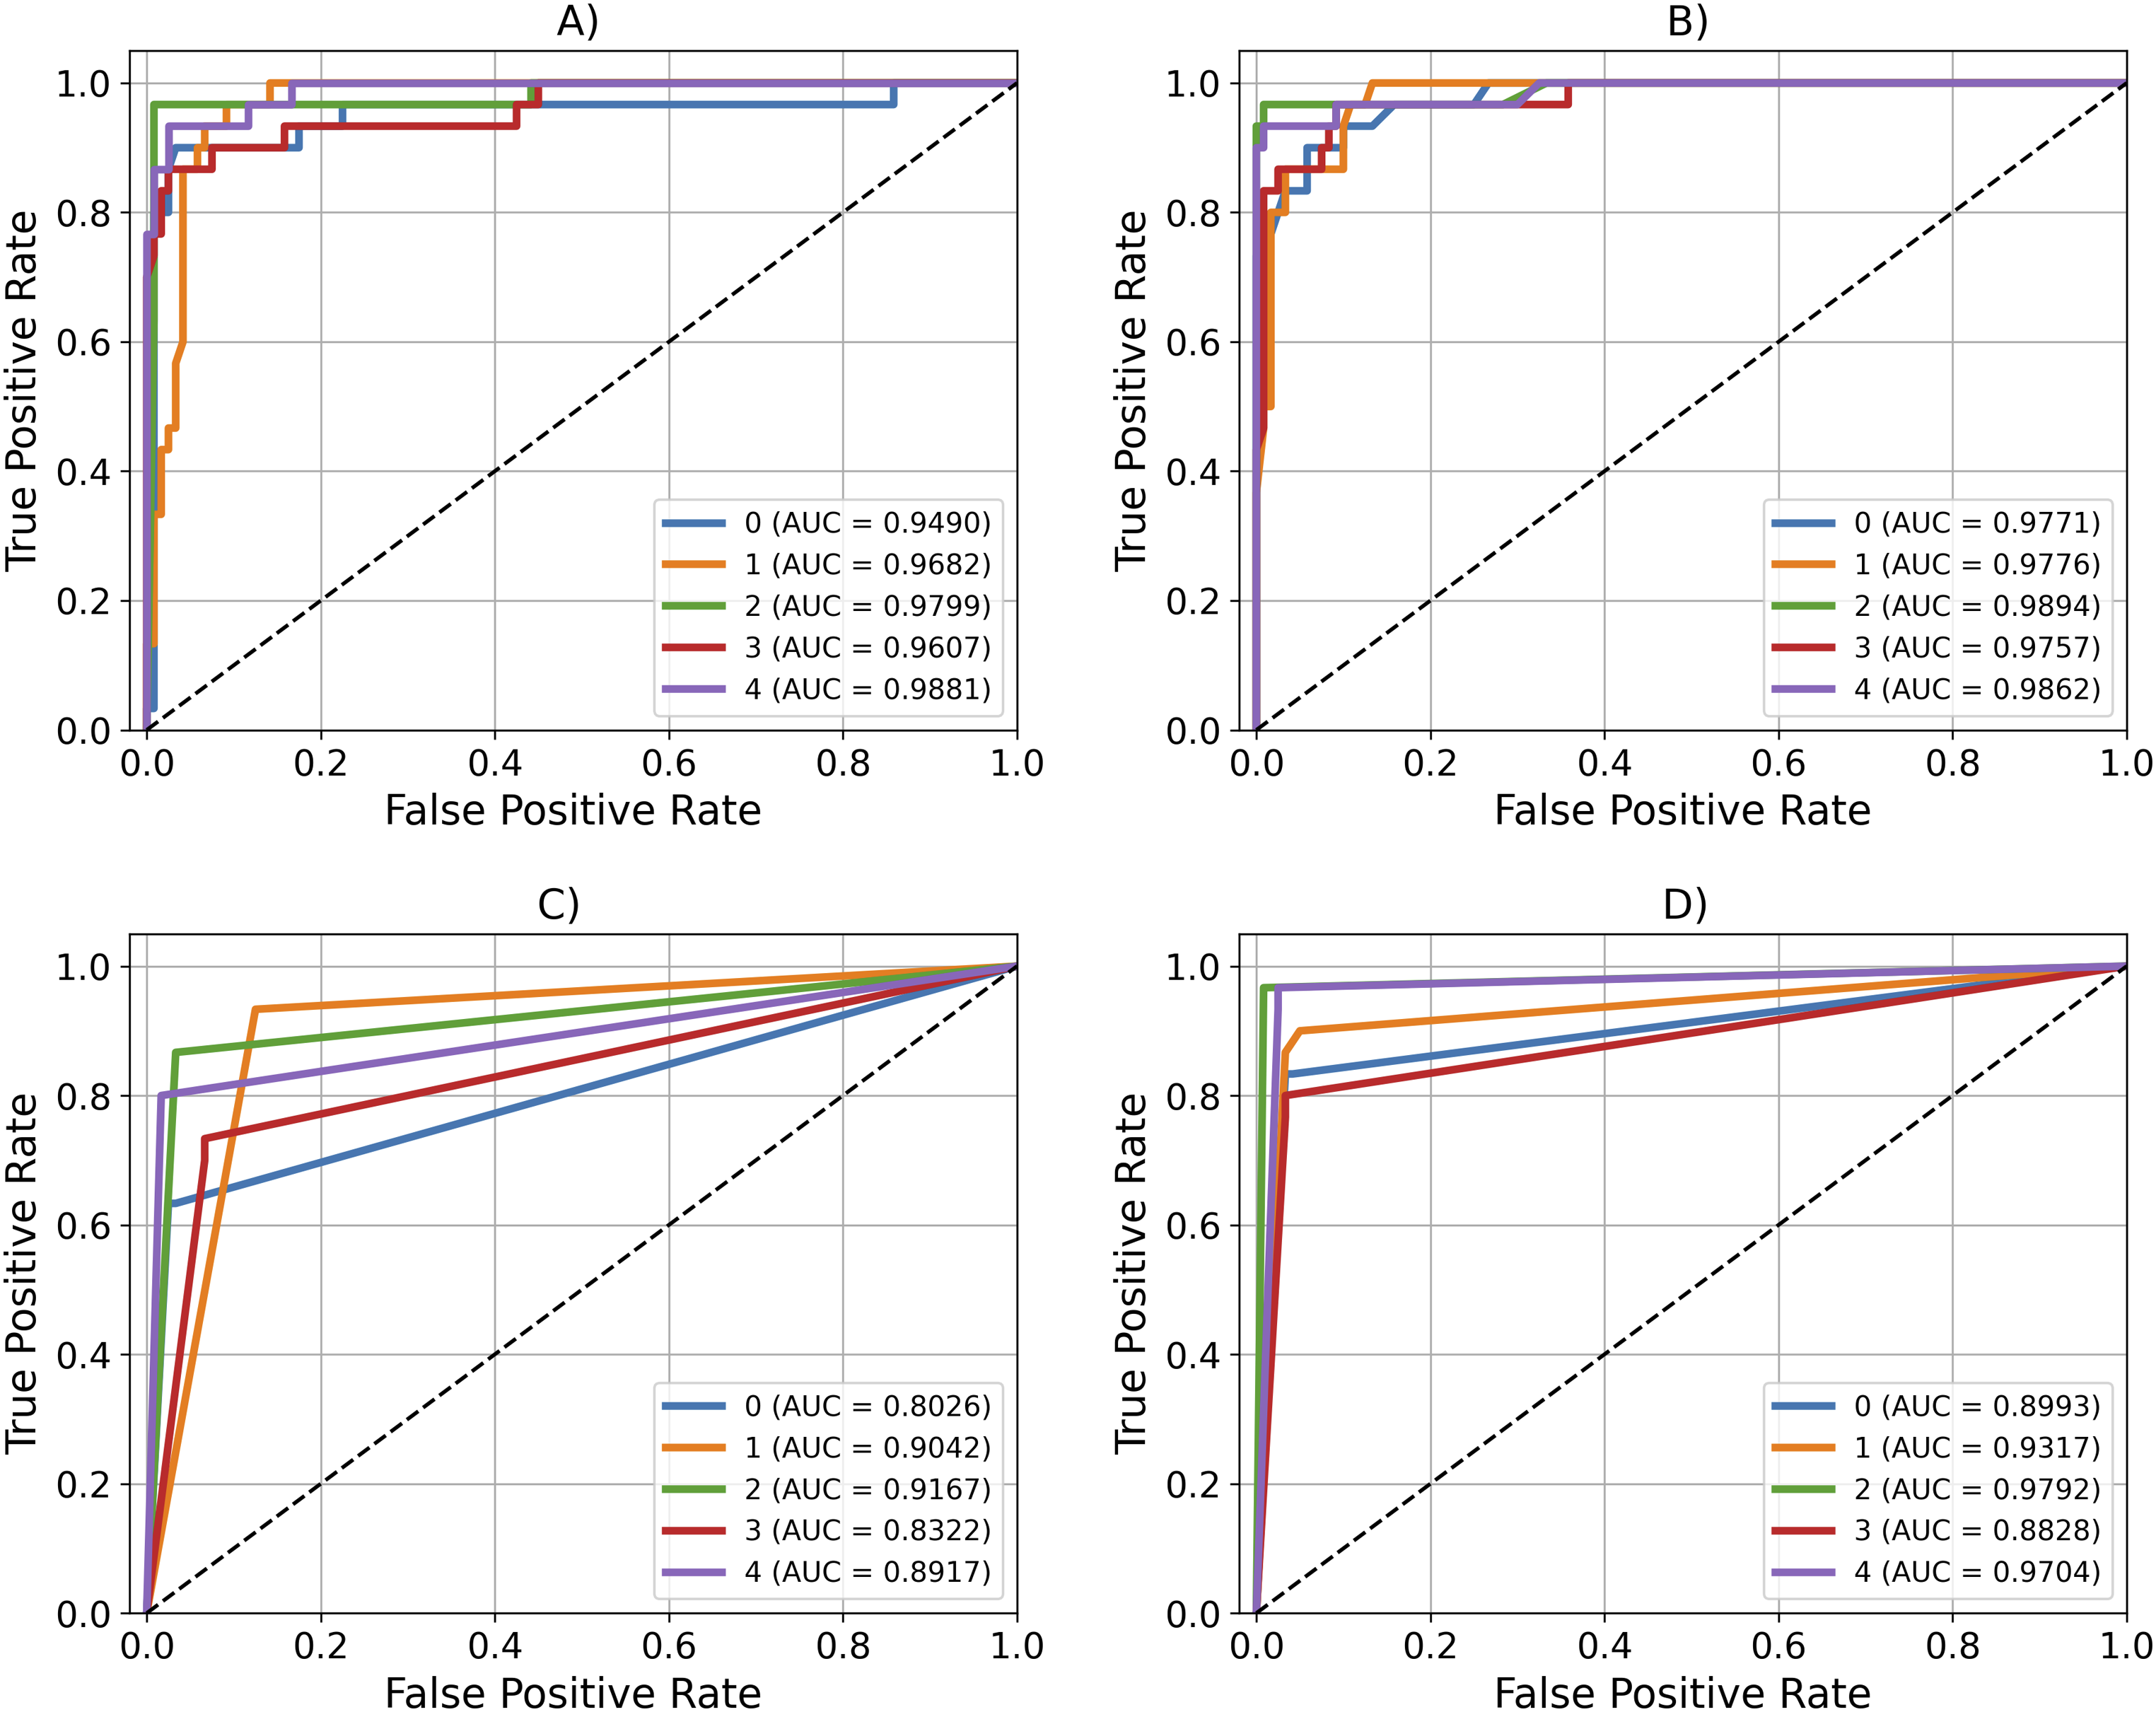
The ROC curves and AUC values for each class of the DR of each model with the hybrid features are shown in Figure 17. The AUC values for each stage of DR from every model with hybrid features are presented in Table 8. The LR model with the hybrid features outperformed other models with high AUC values compared to the AUC values of different models with the hybrid features. The RF and DT models with hybrid features also showed good performance with high AUC values. The GNB model with the hybrid features low performance in terms of AUC values. These results show that the LR, RF, and DT models with the hybrid features have high discriminating abilities for each class of DR. ROC curves of ML models with the hybrid features.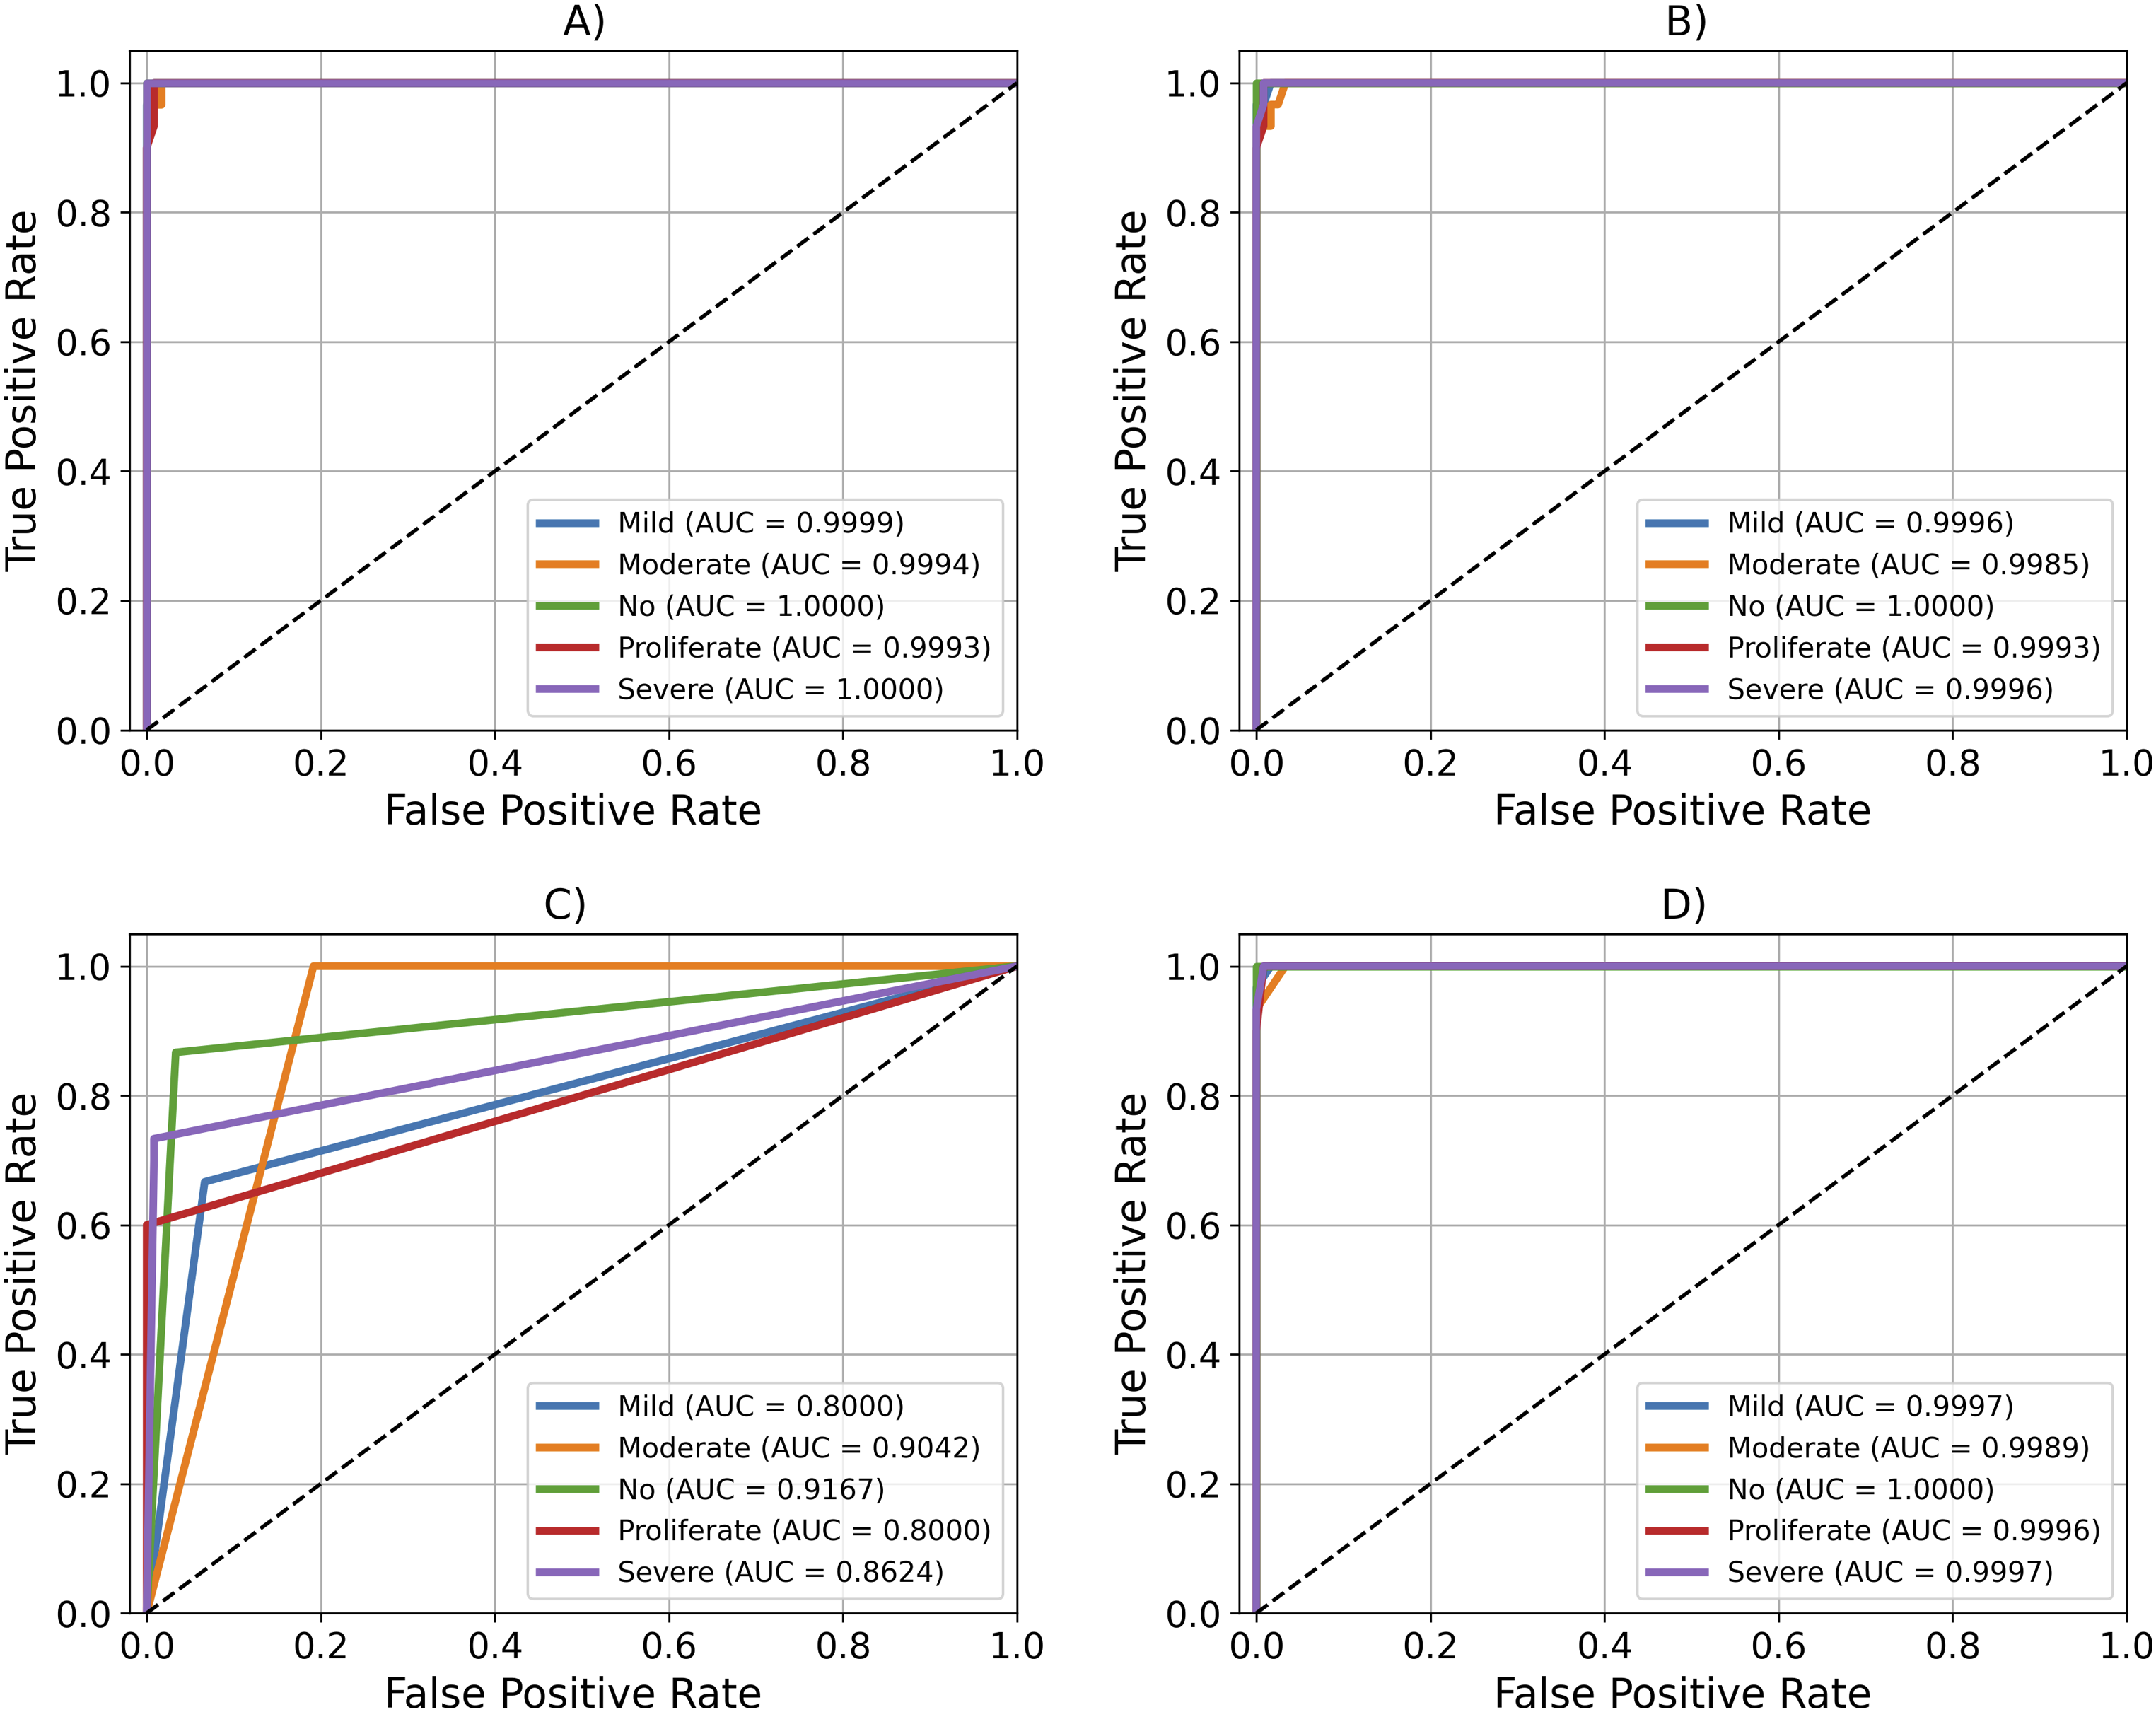
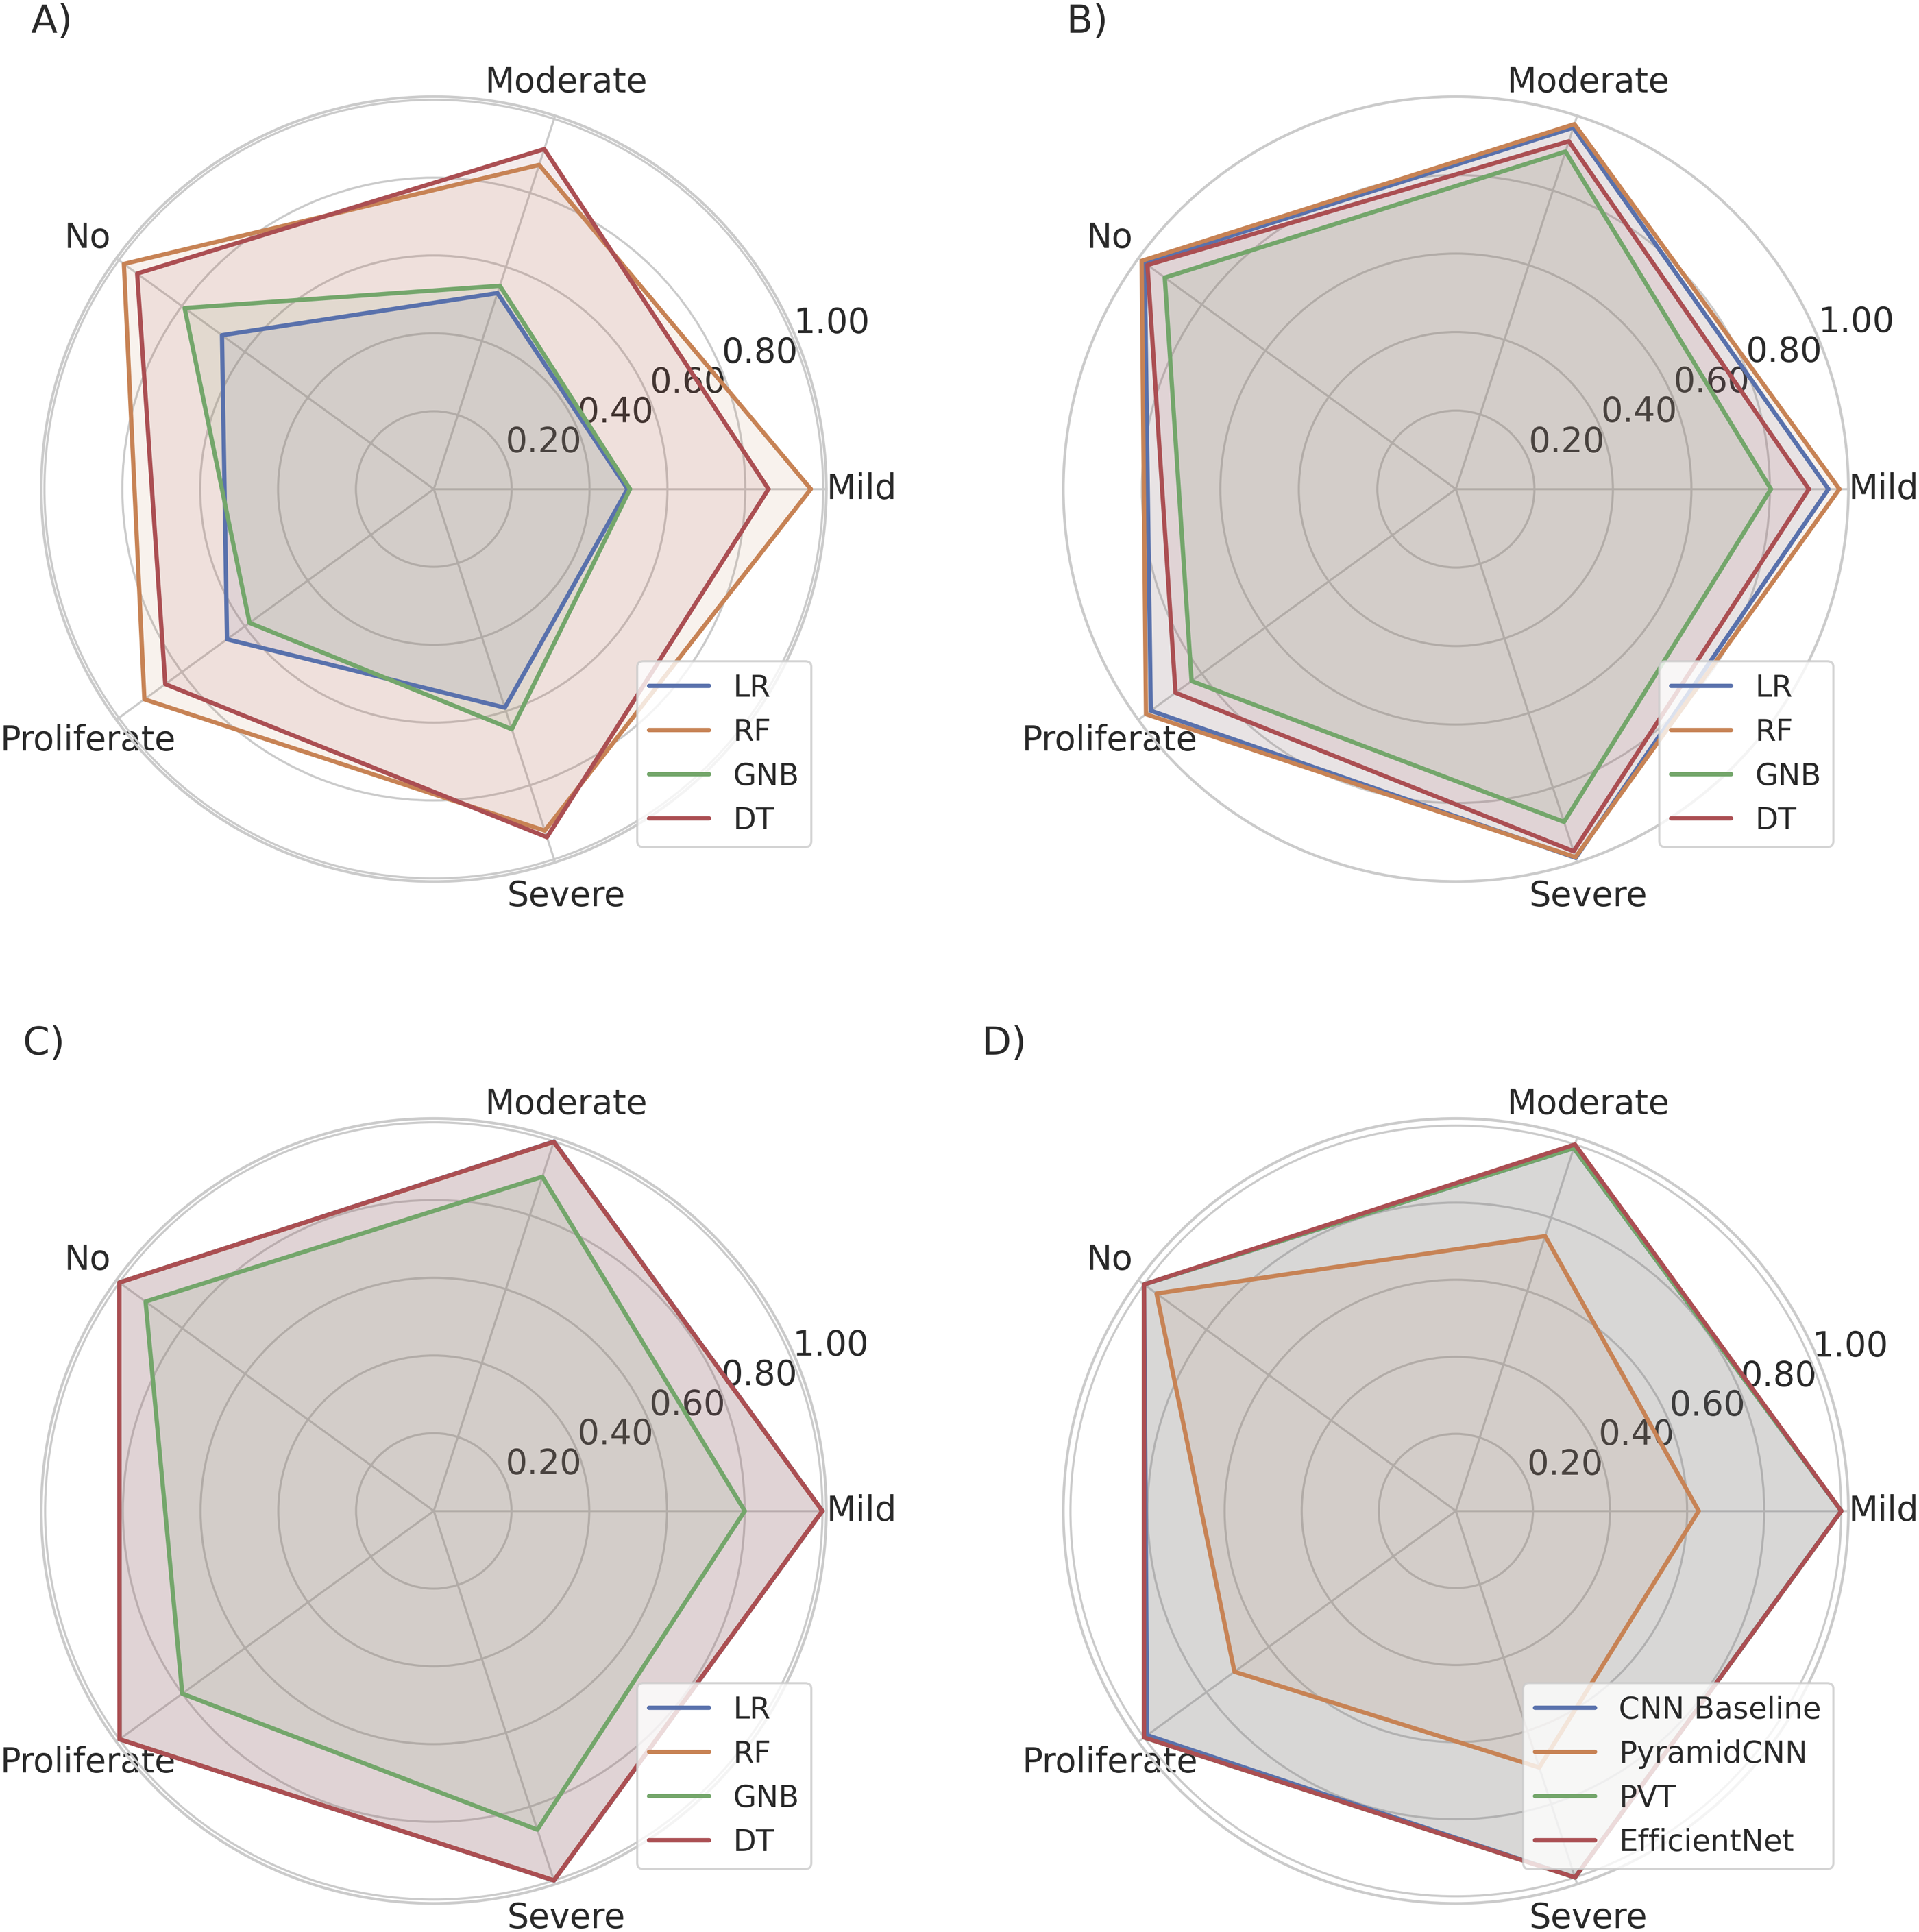
The shape of the ROC curves in Figures 15–17 showed that the ROC and AUC values were quite justified with the performance of the model. The ROC curves of the models trained with the hybrid features shown in Figure 17, were drawn according to the model performance and were in better shape than the ROC curves from the models with the individual textural and GLCM features shown in Figures 15 and 16. The ROC curves of models with CNN features, shown in Figure 16, indicate high AUC values compared to the AUC values from models trained with GLCM features, as shown in Figure 15, indicating the ability of the CNN features to fit the models in a better manner compared to the GLCM features. Finally, Figure 17, showed the ROC curves of the models trained with hybrid features in a better shape, with a high AUC, compared to the performance of these models with the use of individual CNN and GLCM features. The ROC curves of deep learning model also showed better ROC curves except PyramidCNN as shown in Figure 18. The high performance of the ROC and AUC of the models trained with hybrid features indicates the ability of the model trained with hybrid features, to discriminate different DR classes in a better way. The RF model with hybrid features showed better AUC values, indicating better discriminating abilities of the RF model trained with hybrid features. The RF model again showed overall better performance with hybrid features, compared to other models trained with hybrid features (Figure 19). ROC curves of deep learning models. Comparison of AUC score of each stage of DR with different ML models across different feature sets.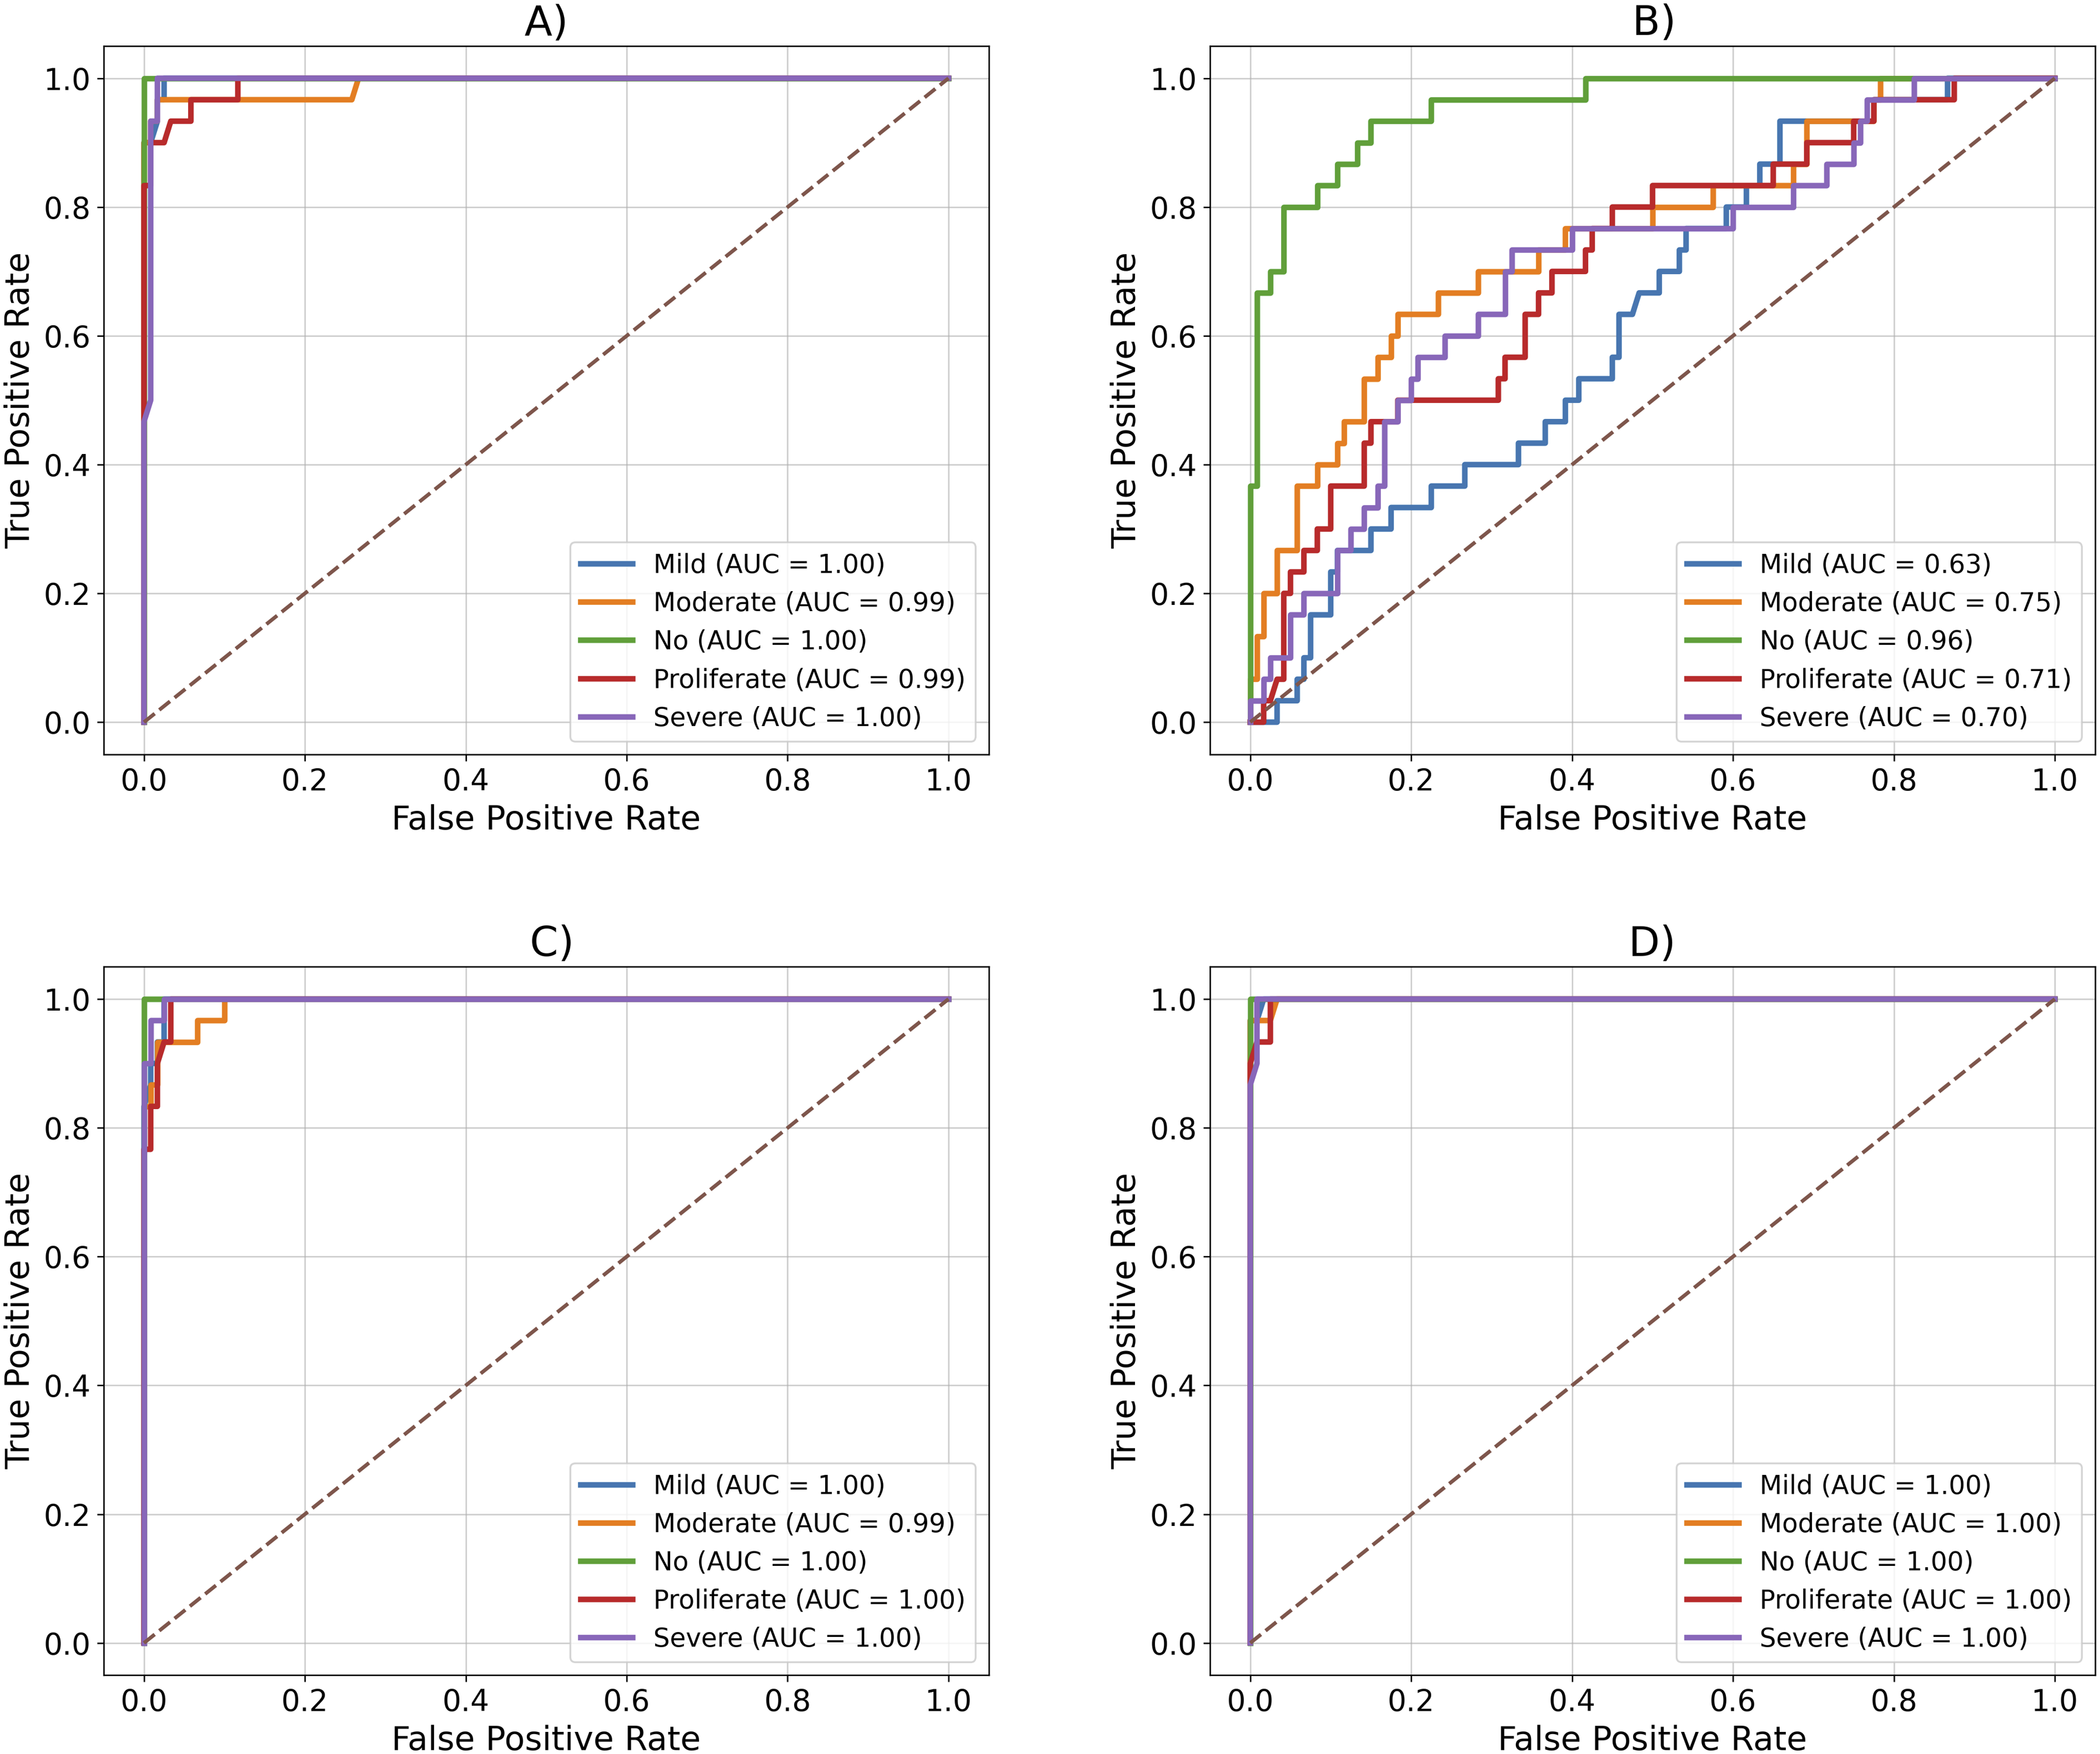
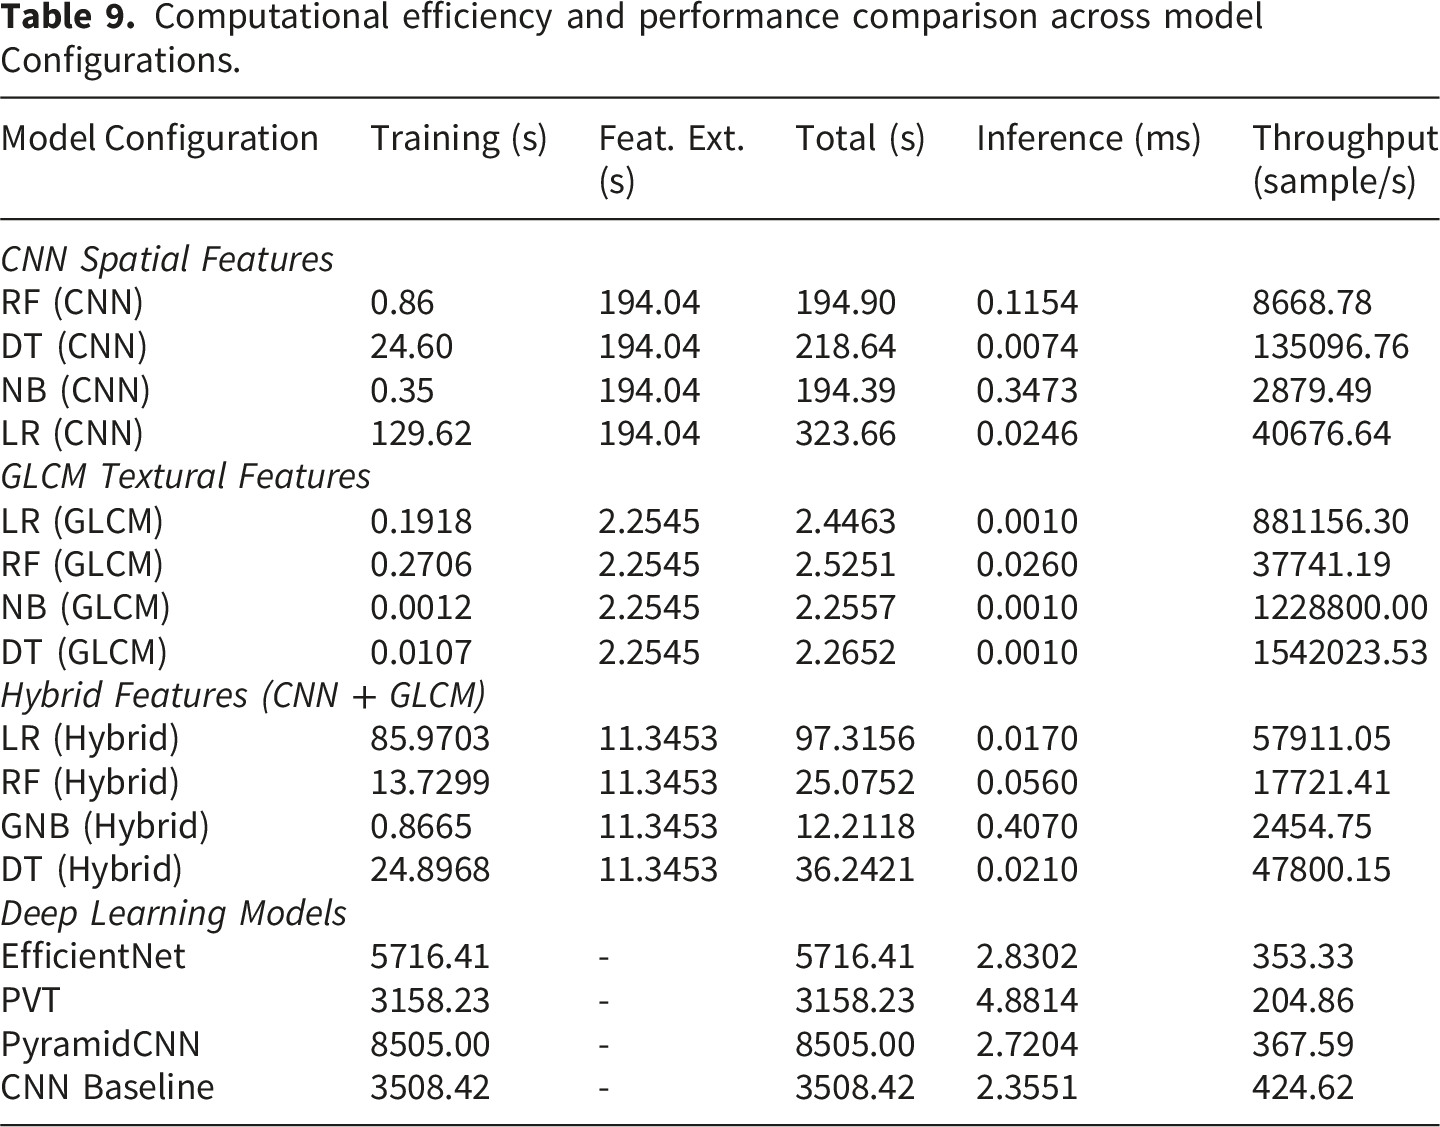
Computational efficiency and performance comparison across model Configurations.
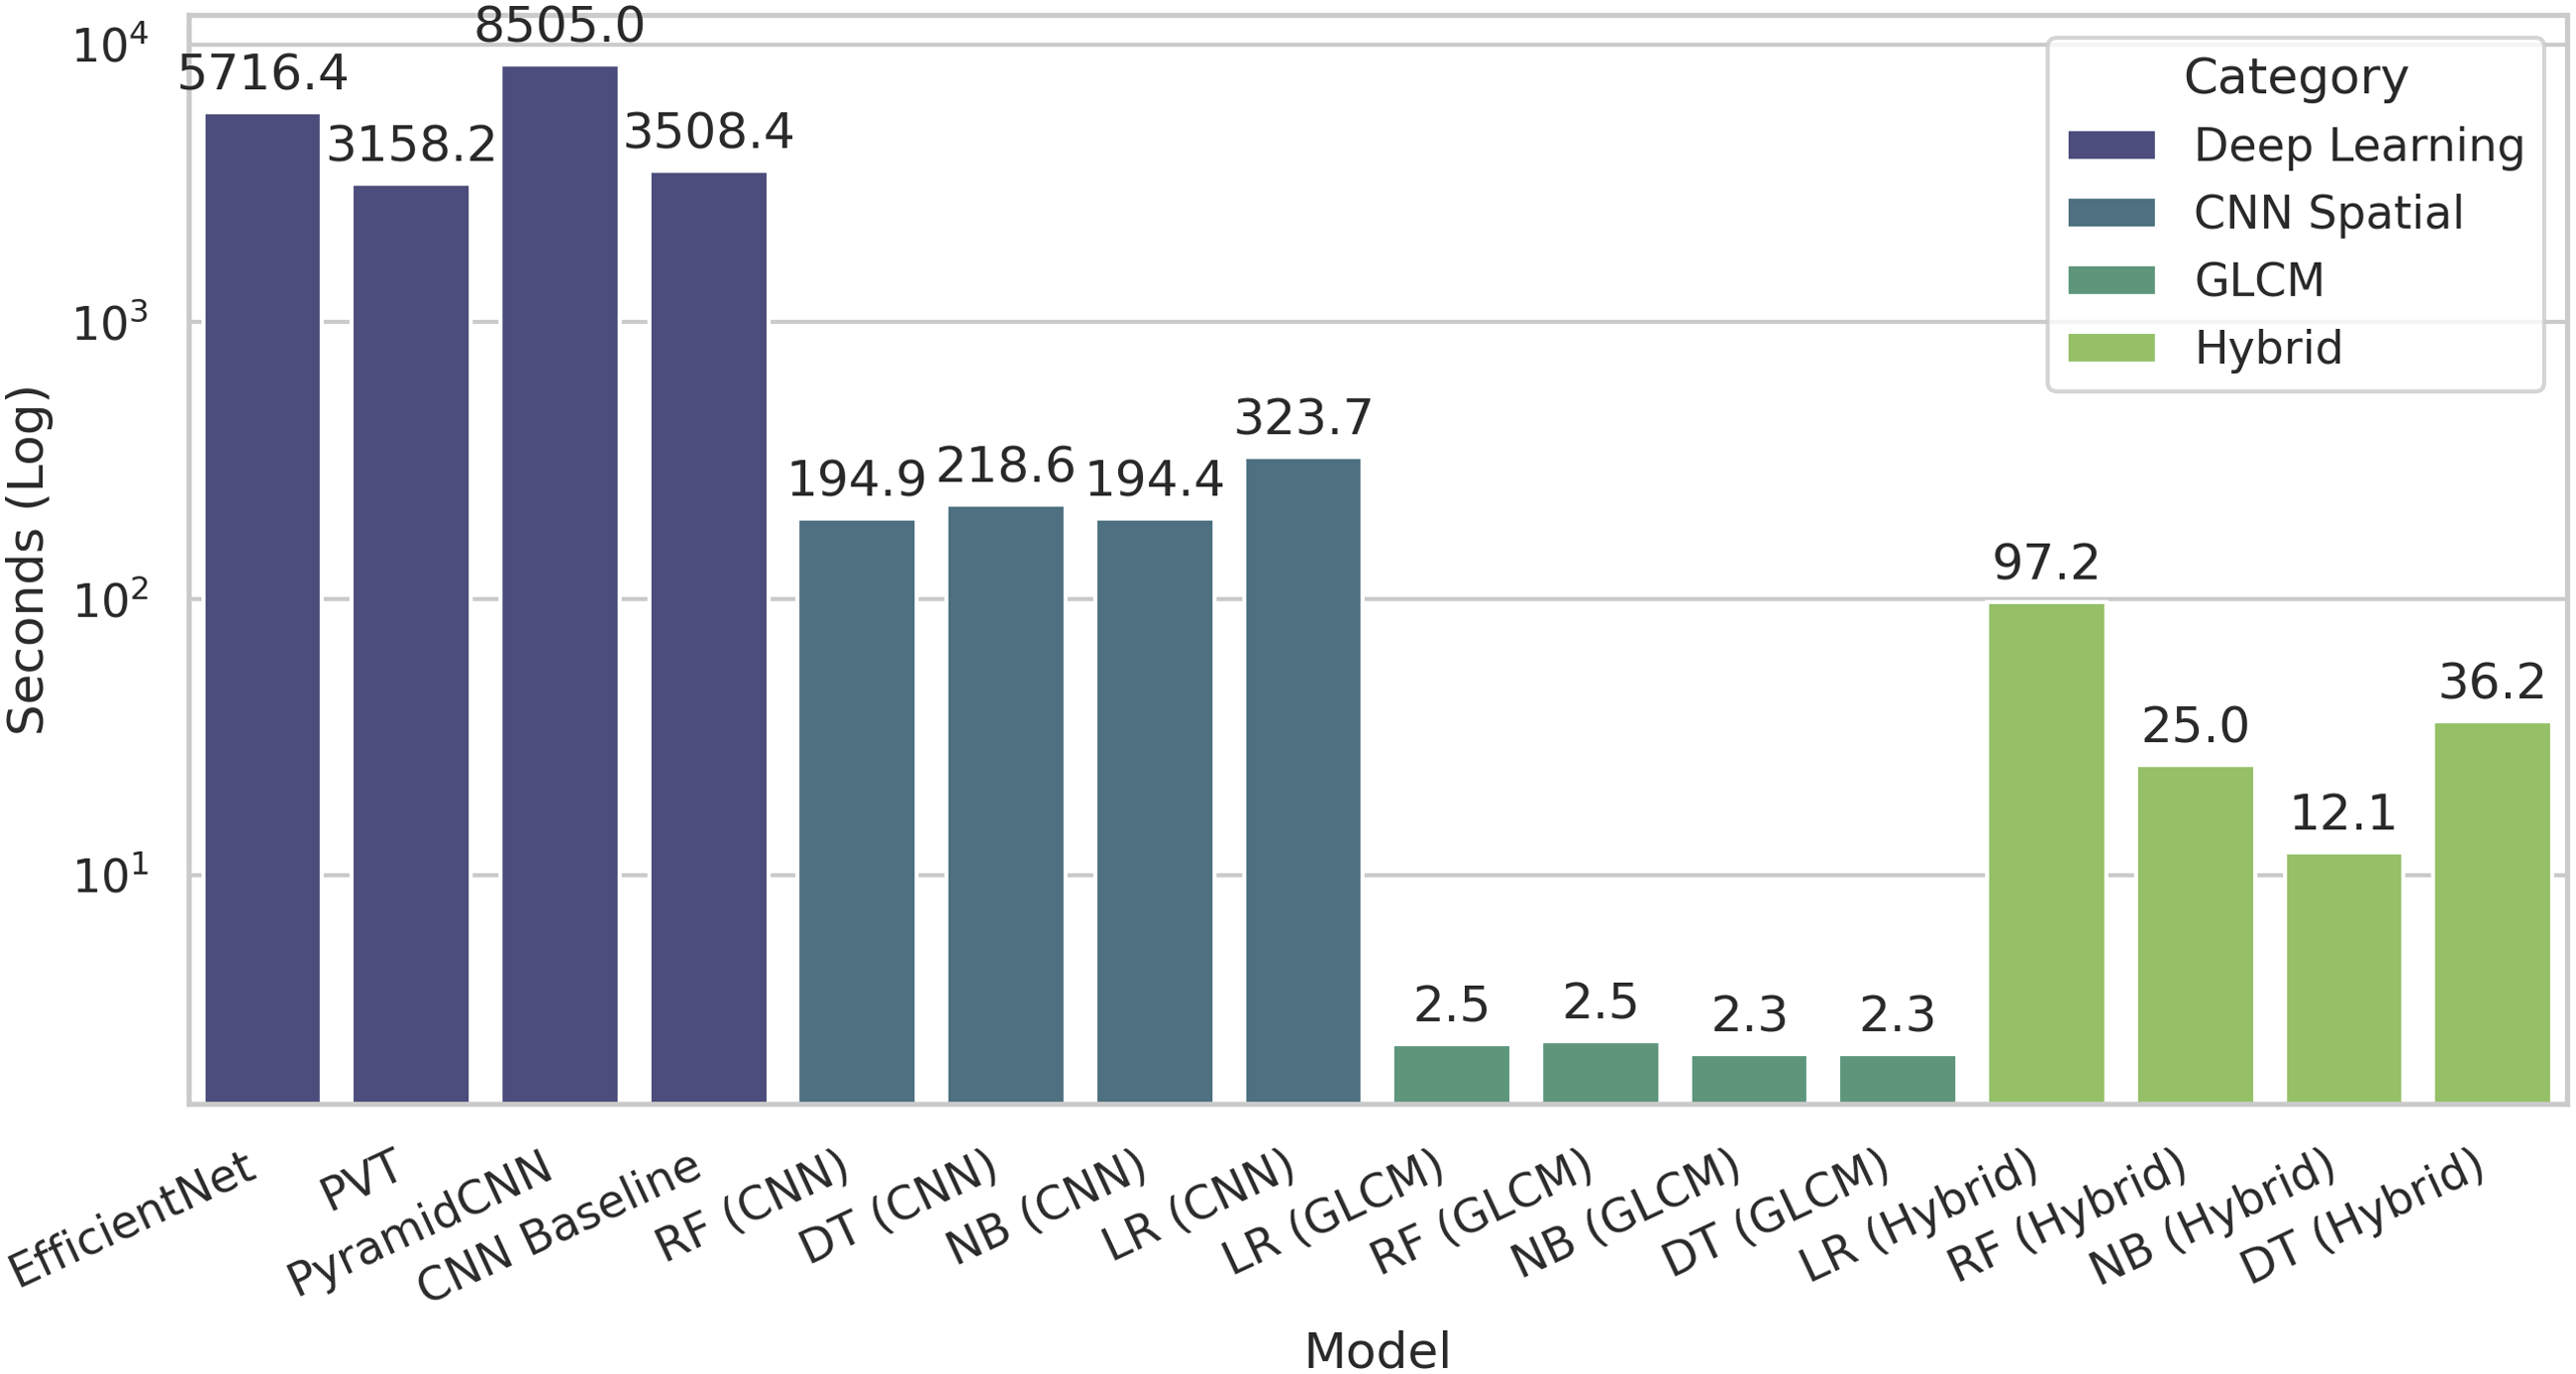
Comparison of training time of models.
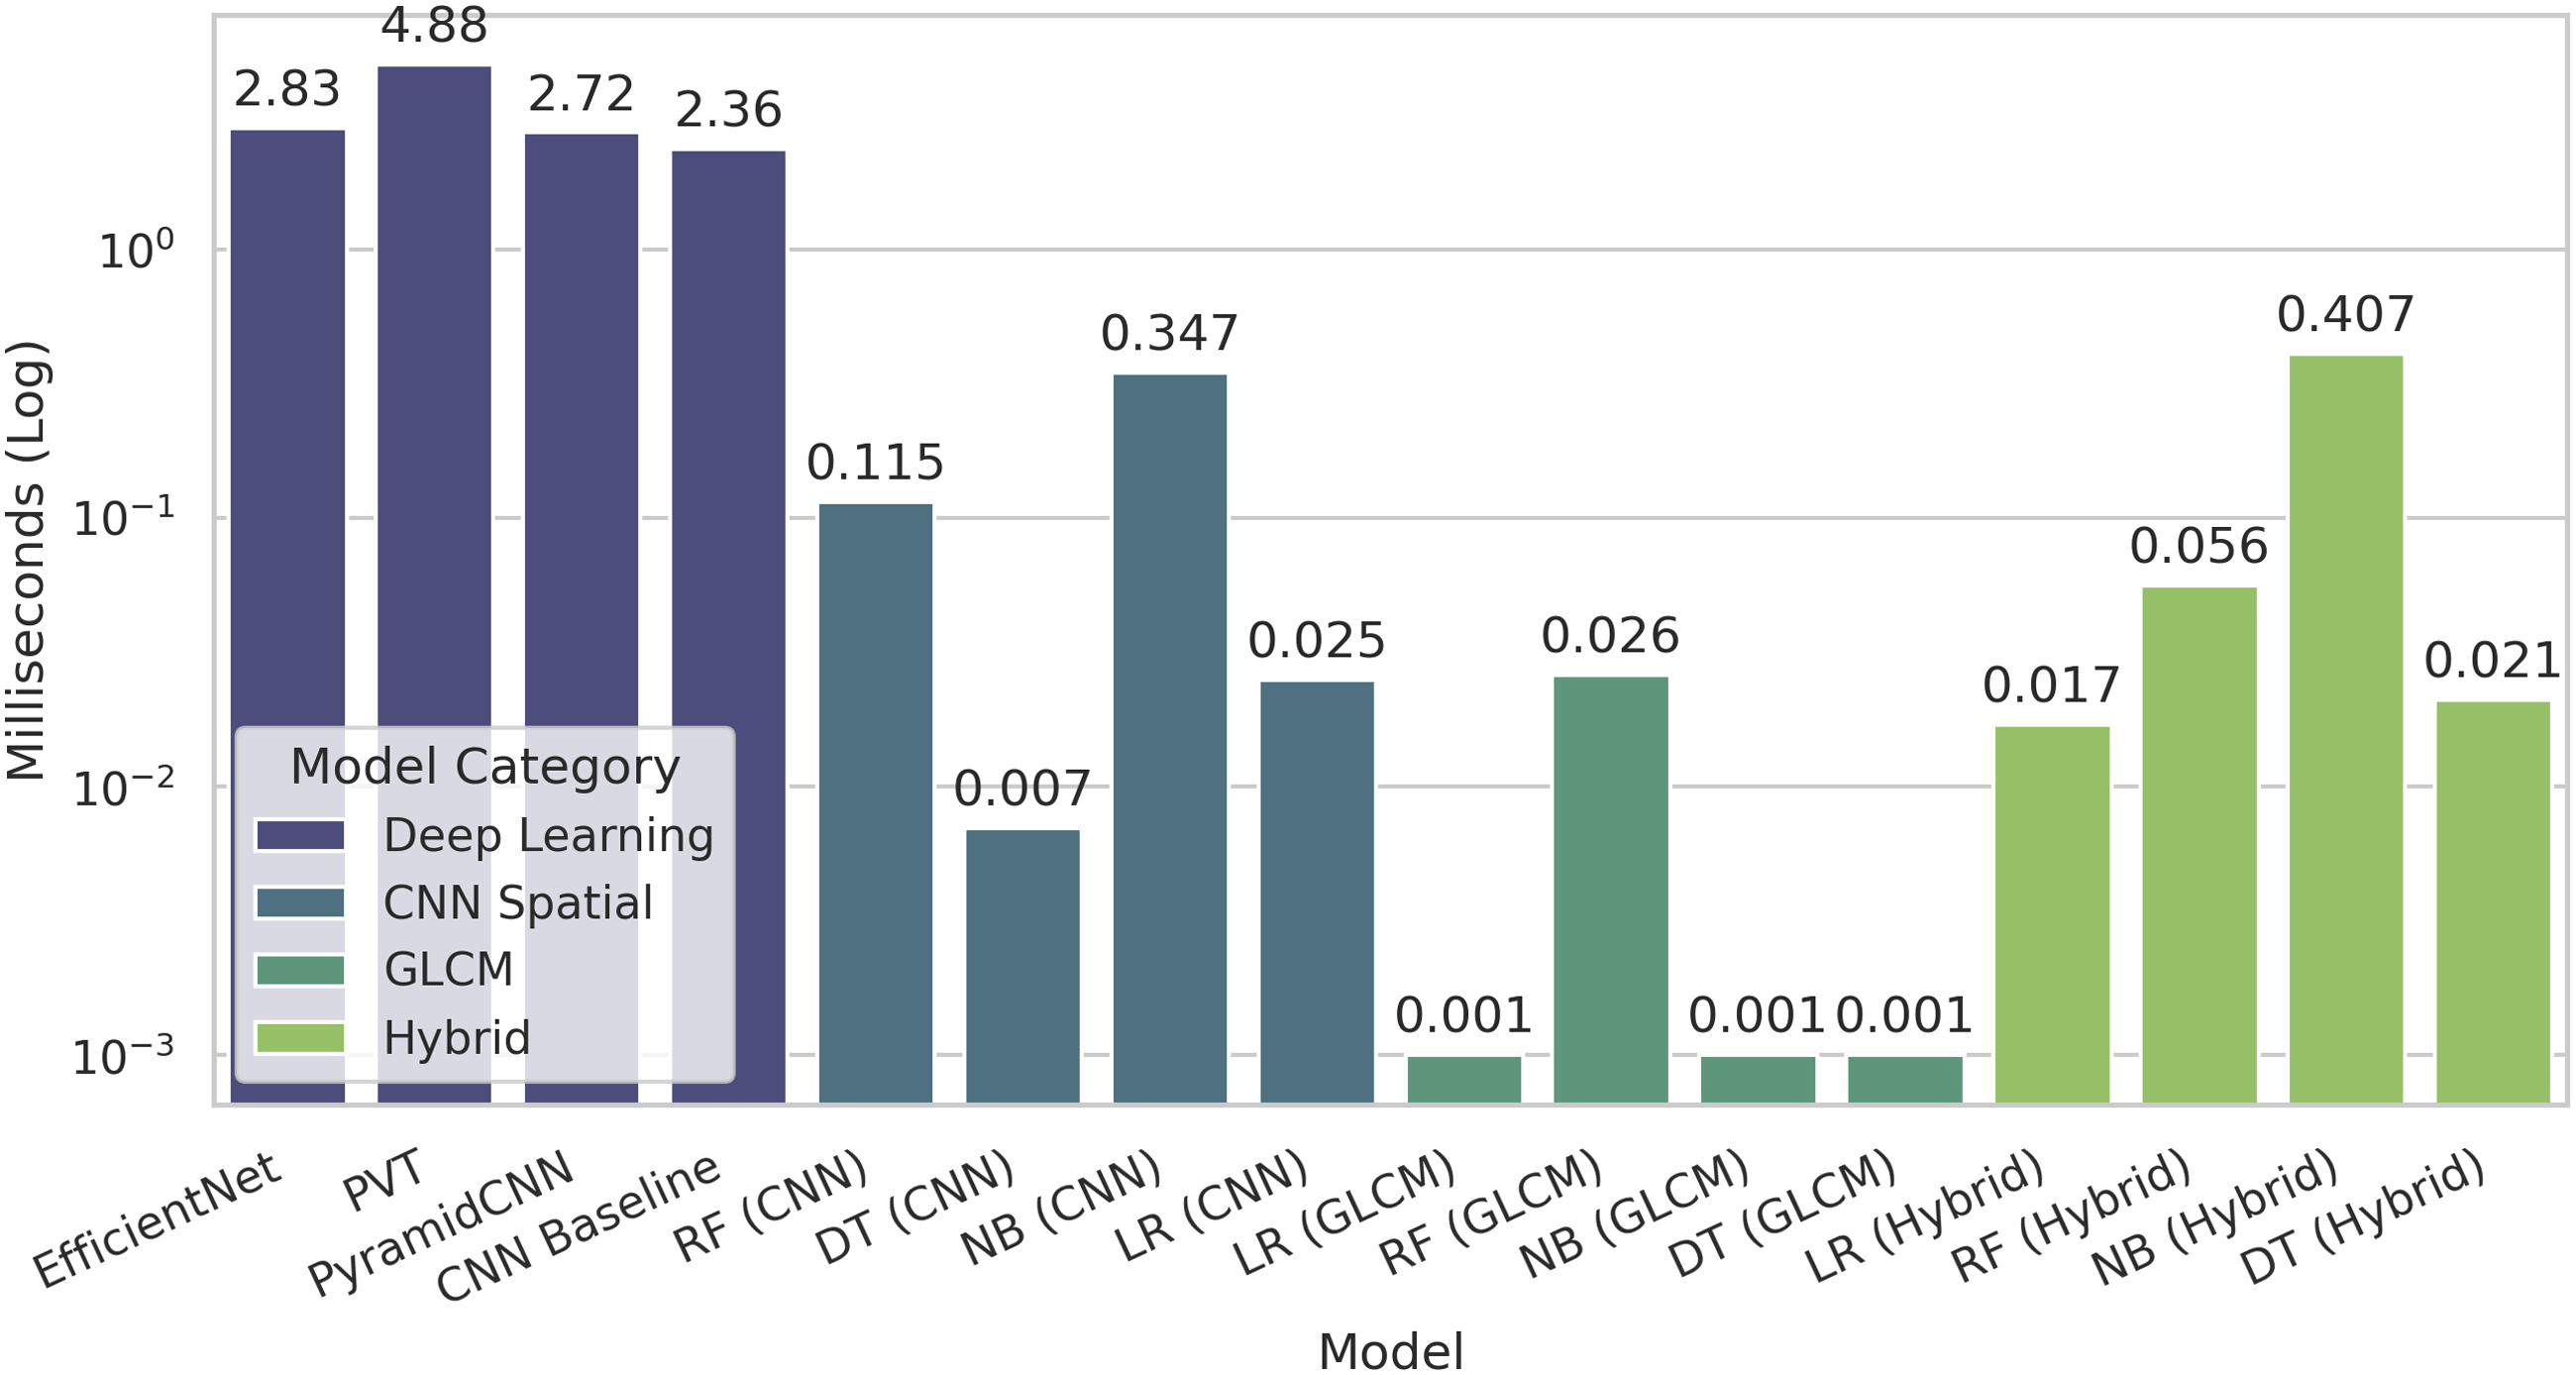
Comparison of inference time of models.
Discussion
The study evaluated the performance of LR, RF, GNB, and DT ML models for identifying different stages of DR using textural (GLCM), spatial (CNN), and hybrid features. In this respect, three feature extraction approaches were used, including CNN-extracted spatial features, GLCM-extracted textural features, and the hybrid features approach that combines CNN and GLCM features. The hybrid feature extraction approach was applied to leverage the ability of CNN to capture spatial features and GLCM to capture textural features. The study also evaluated the performance of CNN, EfficientNet, PyramidCNN and PVT model as auto feature extraction approaches.
The hybrid approach, which combines CNN and GLCM features, outperformed models trained with individual spatial and textural feature-based models. The RF model with hybrid features achieved an accuracy of 98.00% in identifying different stages of DR from retinal images. The RF model with hybrid features achieved a high macro-average precision, recall, and F1 score of 98.02%, 98.00% and 98.00%, respectively, which is higher than any other model, even from deep learning models. The LR and DT models with hybrid features also achieved high accuracy of 97.33% and 96.00%, respectively. The RF, LR, DT and GNB models also showed significant improvements in accuracy and AUC values with the hybrid features compared to these models with individual feature sets. This emphasizes the complementary nature of spatial and textural features, which together capture both structural patterns and pixel-level relationships. The performance of the GNB model was significantly lower compared to all LR, RF, and DT models across all feature sets; however, it achieved its maximum performance with the hybrid features, yielding an accuracy of 76.00%. The integration of both features results in a model learning capability to effectively deal with problem complexity in much better way.
The spatial (CNN) feature also achieved good performance. The LR model with spatial (CNN) feature attained an accuracy of 88.00%. The RF and DT models also performed well with spatial features, achieving accuracy of 87.33%. The GNB model achieved the lowest accuracy of 78.67% with the spatial (CNN) feature. The performance of ML models with spatial features is less than that of models with hybrid features.
The models with textural feature sets achieved the lowest performance compared to spatial (CNN) and hybrid features in accurately identifying the different stages of DR. In the case of textural features, the RF and DT models performed better than the LR and GNB models, with accuracy of 82.00% and 84.00%, respectively. The better performance of the tree-based model with the GLCM features highlights the ability of these models to better understand the textural feature than the spatial feature. The LR and GNB models performed low with GLCM features with an accuracy of 21.33% and 27.33%, respectively.
Overall the RF model outperformed the LR, DT, and the GNB model, achieving an accuracy of 98.00% with the hybrid features. The LR model with hybrid features also performed well, achieving an accuracy of 97.33%. The comparative analysis of the confusion matrix for each mode from the test dataset also showed that the RF and the LR models showed a higher identification ability for each stage of DR than the DT and GNB models, with a high number of true positive cases. The results also show that the RF and the LR models performed well in identification of different classes of DR. RF and the LR model with the hybrid features have high precision, recall, and F1 scores for all stages of DR identification from retinal images.
RF and LR with the hybrid features were explored as the most effective models for identifying the stage of DR. Both models also showed high precision and recall across all DR stages. The RF ensemble approach and LR’s ability to handle linearly separable data make them effective in dealing with the hybrid features. The DT model with hybrid features showed a moderate accuracy of 96.00% compared to the RF and LR models. In the case of DT, the performance for the moderate stage of the DR was reduced, which may reflect limitations in handling the difference between different DR classes.
The CNN, EfficientNet and PVT model also performed well with an accuracy of 92.00%, 97.33% and 91.33%, respectively. The PyramidCNN performed low with an accuracy of 42.00%, in case of deep learning models. Although deep learning models achieved competitive performance but lower than the RF and DT models with hybrid features. The small dataset is the major reason for comparative low performance of the deep learning models. The pre-training of EfficientNet model helped to gain better insights even with small dataset which results in better performance of the EfficientNet model in identification of different stages of DR.
The ensemble approach of the RF model is the reason for high performance of the RF model to handle feature fusion in better way compared to the other ML models. The high performance of the LR model with hybrid features was due to the complementary fusion of the CNN-based spatial and GLCM-based textural features. The spatial and textural features provide a comprehensive learning opportunity for the models to accurately distinguish between different classes of DR. 67 The hybrid features provide comprehensive features where CNN features proved to be effective for capturing global and local lesion structures, and GLCM features for reinforcing fine-grained texture differences.38,56 The combination of features results in a more comprehensive and discriminating representation of retinal images compared to the use of a single set of features. The hybrid features also help in providing discrimination across DR classes that helps the LR model to learn better to distinguish between different DR stages with minimal overlap. The hybrid feature representation increased class separability among the DR stages. The improved class separability aligns with the learning characteristics of the LR model, which performs well with a linear feature space. The simplicity of the LR model also helps the LR model to perform well due to comparatively less overfitting in the linear feature space compared to other models. 68
The models were also evaluated in terms of their computational efficiency to explore the potential of deployment in resource constrained clinical environment. The ML model showed substantial less training and inference time and high throughput compared to deep learning models. As concerned of ML models the ML models with GLCM features showed lowest training and inference time, but their predictive accuracy is very low compared to ML models trained with hybrid features. In case of ML models with hybrid features the GNB model showed lowest training time and LR model showed the lowest inference time. The RF and DT model also showed low inference time and high throughput. Keeping in view the predictive performance and computational efficiency the RF and LR models were recommended for deployment in resource constrained clonal environment.
Previous work has shown different levels of success in classifying DR using traditional ML approaches and neural network architectures.41,50 Existing studies have extensively used CNN models with high success levels to classify DR stages with different datasets.42,49,69 The study also utilized CNN-extracted features to accurately classify the different stages of DR. The results related to the ability of the CNN model to extract features from retinal images for DR classifications accurately align with the results explored in the existing literature.49,69 The proposed approach showed high performance compared to the existing classification approaches for the DR stages. 28 The proposed approach also outperforms other studies that used multiple ML and deep learning techniques, in addition to CNN. 70 The proposed approach achieved a 1.00% increase in accuracy for the identification of five stages of DR. 32 The proposed approach also showed high precision, recall, and F1 score compared to existing approaches.32,71 The proposed approach also shows a high incidence of true positives in the confusion metric analysis for each stage of DR compared to existing approaches. 42 The AUC values for each stage of the proposed approach are also high compared to existing approaches, reflecting the better capability of the proposed approach to accurately identify the stages of DR. 72 In addition to the predictive performance, the proposed solution also provides useful insights regarding the computational efficiency of the models for deployment in resource constrained clinical environment.
Early detection of DR and diagnosis of the stage of DR are significant in the effective treatment of DR in diabetic patients. The hybrid features are important for the accurate identification of different stages of DR in diabetic patients. The proposed cost-effective methods also enable patients to monitor DR development on a regular basis. The proposed solution facilitates the easy and frequent examination of the DR stage for early treatment of DR in diabetic patients. The high accuracy and reliability of the proposed approach for identifying different stages of DR have significant clinical implications. Early and accurate detection of DR is crucial for timely intervention and management, which could prevent vision loss. The high-performance model for detecting ’Mild’ and ’Moderate’ classes of DR is particularly important, as these levels are often challenging to diagnose but critical for early treatment. The findings establish RF and LR with the hybrid features as the most suitable models for the real-world identification of DR. Their high accuracy and balanced performance across multiple metrics make them ideal candidates for deployment in automated diagnostic systems. The combination of CNN and GLCM in the form of the hybrid features offers a comprehensive approach to DR stage identification and streamlines their applications in other related problems.
Moreover, the additional insights regarding computational insights paved the way for implementation of these approaches in resource constrained clinical setting. The high performance of the RF and LR model with hybrid features helps to use lightweight ML models in resource-constrained medical settings. 34 Moreover, the lightweight ML models also facilitated the integration with smart medical devices that are also limited in terms of processing and memory capabilities. 35 The performance of a computationally efficient model helps to overcome the application of AI in smart medical devices for integrated diagnosis of different classes of DR with high accuracy. The findings regarding the performance of hybrid features and the RF model also paved the way application of a ML model where the dataset is limited for training the deep learning models. The findings also paved the way for the application of a ML model in smart devices and resource-constrained applications in general.
The study is limited by its reliance on a single dataset. The findings related to the performance of the proposed methodology need to be validated against other datasets. Variations in imaging conditions, device-specific artifacts, and patient demographics must be tested to identify DR stages. Future work should focus on utilizing more datasets in multiple settings and exploring additional computer vision approaches, such as ResNet and AlexNet, to detect the onset of DR and identify different stages of DR. Enhancing the dataset with more balanced samples at all DR levels could improve the model’s performance. The application of the Vision transfer model with data enhancement is recommended for future work.
Conclusion
The study proposed the hybrid features-based identification of five stages of Diabetic Retinopathy (DR) named ’Mild’, ’Moderate’, ’No’, ’Proliferate’, and ’Severe’. Five ML models, namely Logistic Regression (LR), Random Forest (RF), Gaussian Naive Bayes (GNB), and Decision Tree (DT), were trained using spatial (CNN), textural (GLCM), and combinations of these features as a hybrid approach. The four deep learning models named CNN, EfficientNet, PyramidCNN and PVT were also trained and evaluated. The RF model with hybrid features outperformed other models with hybrid and other feature sets, achieving an accuracy of 98.00% in identifying the five stages of DR. The LR model with hybrid features achieved an accuracy of 97.33% on the test dataset. RF and LR models with the hybrid features also showed high precision, recall, and F1 scores for the five stages of DR. EfficientNet model also performed high with 97.00% accuracy. The small dataset is the major reason for comparative low performance of deep learning models. The RF and LR models are also computationally effective with low training and inference time compared to the deep learning models. The computational efficiency of the ML model make them a good choice for deployment in low resource constrained setting. Exploring other feature extraction techniques and dataset enhancements is recommended as future work. The high performance of the proposed approach across all stages of DR is highly significant for clinical practice, potentially leading to improved patient outcomes and reduced vision loss from DR. The lightweight RF model also facilitates its deployment in resource-constrained clinical settings and smart medical devices with limited processing abilities.
Footnotes
Acknowledgments
The authors want to acknowledge the fund by Princess Nourah bint Abdulrahman University Researchers Supporting Project number (PNURSP2026R346), Princess Nourah bint Abdulrahman University, Riyadh Saudi Arabia. The authors would also like to acknowledge the support of Prince Sultan University, Riyadh Saudi Arabia for APC of this publication.

Funding
This research was funded by Princess Nourah bint Abdulrahman University Researchers Supporting Project number (PNURSP2026R346), Princess Nourah bint Abdulrahman University, Riyadh, Saudi Arabia.
Declaration of conflicting interests
The authors declared no potential conflicts of interest with respect to the research, authorship, and/or publication of this article.
Data and code Availability
Data can be accessed from here. 1. Dataset.