






Abstract
Recycled rubber fiber-reinforced elastomeric isolators (RR-FREIs) represent a sustainable and cost-effective alternative for seismic protection, particularly in low-rise structures in developing countries. Despite their practical advantages, accurately modeling their complex hysteretic shear behavior remains challenging due to nonlinearities and parameter uncertainties. Accordingly, this study aims to determine, within a probabilistic framework, which hysteretic formulation provides the most robust and physically consistent representation of the cyclic shear response of RR-FREIs. Four OpenSeesPy hysteretic models are investigated: Elastomeric Bearing (Plasticity), Elastomeric Bearing (Bouc–Wen), ElastomericX, and HDR. Bayesian inference, implemented through Markov Chain Monte Carlo sampling, is employed to calibrate the models against experimental cyclic shear tests of scaled prototypes, allowing for explicit quantification of parameter uncertainty. Model performance is evaluated through posterior predictive checks, energy dissipation metrics, and Bayesian information criteria (WAIC and LOO). Unlike conventional deterministic calibration approaches, the proposed methodology enables a probabilistic and statistically consistent comparison between competing hysteretic models while explicitly quantifying parameter uncertainty and its influence on the predicted cyclic response. Results indicate that the Bouc–Wen formulation provides the most robust agreement with experimental data, accurately reproducing both hysteresis loops and energy dissipation trends. The proposed framework offers a rational and physically interpretable basis for hysteretic model selection in performance-based seismic analysis and supports the reliable implementation of RR-FREIs in earthquake-resistant design.
Keywords
1. Introduction
Seismic isolation systems represent a well-established and increasingly adopted strategy in structural engineering to mitigate earthquake-induced damage in buildings. 1 By decoupling the structure from ground motion, seismic isolators significantly reduce the forces transmitted to the building, protecting both the structural system and its contents. In this context, there is growing interest in exploring sustainable and cost-effective materials for the fabrication of isolation devices. Recycled rubber reinforced with fibers (RR-FREIs) has emerged as a promising alternative, gaining significant attention within the research community. 2
In contrast to conventional seismic design, which focuses on increasing structural stiffness, ductility and strength, seismic isolation aims to reduce demand by dissipating energy generated by ground motion. 3 Among the various types of isolators, fiber-reinforced elastomeric isolators (FREIs) offer a more economical solution by replacing steel with fiber reinforcements.4,5 FREIs can also be manufactured as unbonded systems, eliminating the need for top and bottom plates and further reducing costs (Strauss et al., 2014). In line with sustainable development goals, several studies have explored the substitution of natural rubber in FREIs with recycled rubber from used tires, resulting in RR-FREIs, 6 a viable solution for low-rise structures in seismic regions.
The characterization of fiber-reinforced composite structures is a broad research field with applications that extend beyond seismic isolation. In other engineering domains, several researchers have extensively addressed the mechanical behavior of composite configurations, such as laminated plates7–9 and complex shell systems,10–12 including lattice metamaterial-based sandwich structures and doubly curved truss-core configurations.13,14 These studies utilize advanced high-order shear deformation theories and specialized numerical simulation approaches to analyze flexural, buckling, and vibroacoustic responses under various conditions.15–19 While these investigations focus on different materials and structural components, they collectively emphasize the universal necessity for robust numerical formulations to accurately capture complex mechanical behavior, providing a broader context for the Bayesian framework presented in this study.
Considering the environmental challenges posed by the accumulation of discarded tires and the potential of recycled rubber, prototypes of seismic isolators using recycled rubber reinforced with locally sourced fibers and without base connections (RR-FREIs) have been developed. 20 This approach seeks to reduce production costs and environmental impact while enhancing the safety of structures, particularly in seismically active regions such as Colombia, classified as having intermediate to high seismic hazards. 21 Research efforts on RR-FREIs or similar sustainable isolation systems have also been reported in other countries exposed to seismic risk, including Italy, 22 Indonesia, 23 and Peru, 24 highlighting the global interest in cost-effective and environmentally conscious seismic protection.
As a novel alternative, RR-FREIs require accurate numerical modeling to represent their behavior and interaction with other structure’s elements. This ensures the precise characterization of their shear hysteretic response and supports their broader implementation in structural design.
Previous research has explored the numerical modeling of RR-FREIs, such as the study by, 5 which investigated advanced hysteresis models calibrated using the differential evolution algorithm. Their work demonstrated the potential of low-cost RR-FREIs by comparing experimental and numerical results using OpenSeesPy. 25 However, their approach relied on deterministic optimization techniques and did not incorporate Bayesian inference, limiting the ability to quantify parameter uncertainty or assess model robustness.
Similarly, Li and Peng 26 proposed a surrogate constitutive model for high-damping rubber devices based on GRU-attention neural networks, also implemented in OpenSees. While their data-driven approach effectively captured nonlinear hysteresis and showed strong agreement with experiments, it relied on deterministic training and did not incorporate uncertainty quantification, reducing its robustness in extrapolative or unobserved scenarios.
In contrast, this study introduces a Bayesian calibration framework, offering a probabilistic perspective that enables uncertainty quantification and more reliable model selection. This approach not only refines the identification of model parameters but also provides a statistically grounded basis for evaluating model performance under seismic loading conditions.
Although numerous hysteresis models have been developed to describe the nonlinear response of conventional isolators — ranging from advanced unified phenomenological frameworks designed for complex rate-independent behaviors with evolving shapes27,28 to classical formulations — their applicability to the cyclic response of RR-FREIs remains to be validated. Selecting an appropriate model is critical for accurately representing the seismic behavior of RR-FREIs and facilitating their implementation in the design of earthquake-resistant structures.
In light of these challenges, this study evaluates the suitability of different hysteretic formulations for RR-FREIs by transitioning from a deterministic approach to a Bayesian probabilistic framework. The objective is to identify which model provides the most physically consistent and robust representation of the cyclic shear response while explicitly quantifying parameter uncertainty. The proposed methodology utilizes Markov Chain Monte Carlo (MCMC) sampling for model calibration and information-theoretic criteria (WAIC and LOO) for model selection. The significance of this work lies in providing a rational basis for choosing hysteretic models in performance-based seismic design, ensuring that model selection is grounded in statistical evidence and physical plausibility.
In this context, the main contributions of this study are: (i) the Bayesian calibration of four OpenSeesPy hysteretic models for RR-FREIs using experimental cyclic shear tests of scaled prototypes; (ii) the probabilistic comparison of the competing models through the WAIC and LOO information criteria; (iii) the quantification of parameter uncertainty and its propagation to the predicted cyclic response by means of posterior predictive checks and energy dissipation metrics; and (iv) the identification of the model that provides the most robust and physically plausible representation of both the hysteresis loops and the energy dissipation trends. To this end, the article is organized as follows: first, a detailed description of elastomeric bearing elements in OpenSees is provided. This is followed by an explanation of the Bayesian inference process and model calibration. The next section details the experimental methodology used to obtain shear hysteresis curves. Subsequently, the analysis results are presented and discussed. Finally, the study concludes with key findings.
2. Experimental program
2.1. Prototype design
The isolators examined were developed in compliance with the guidelines established by FEMA 450, with prior studies on natural rubber isolators serving as a point of reference (see citations6,29). To experimentally characterize the isolators, small-scale specimens were manufactured, considering geometric scale ratios (S
L
= 1/3) and mass ratios (S
M
= 1/9). The final dimensions of the isolator were 80 mm in diameter and 44 mm in total height. The isolator was composed of 15 layers of recycled rubber, each measuring 2 mm in thickness, interspersed with 14 layers of fiber, each measuring 1.1 mm in thickness. This configuration is illustrated in Figure 1. Geometry and composition of the reference unbonded isolator.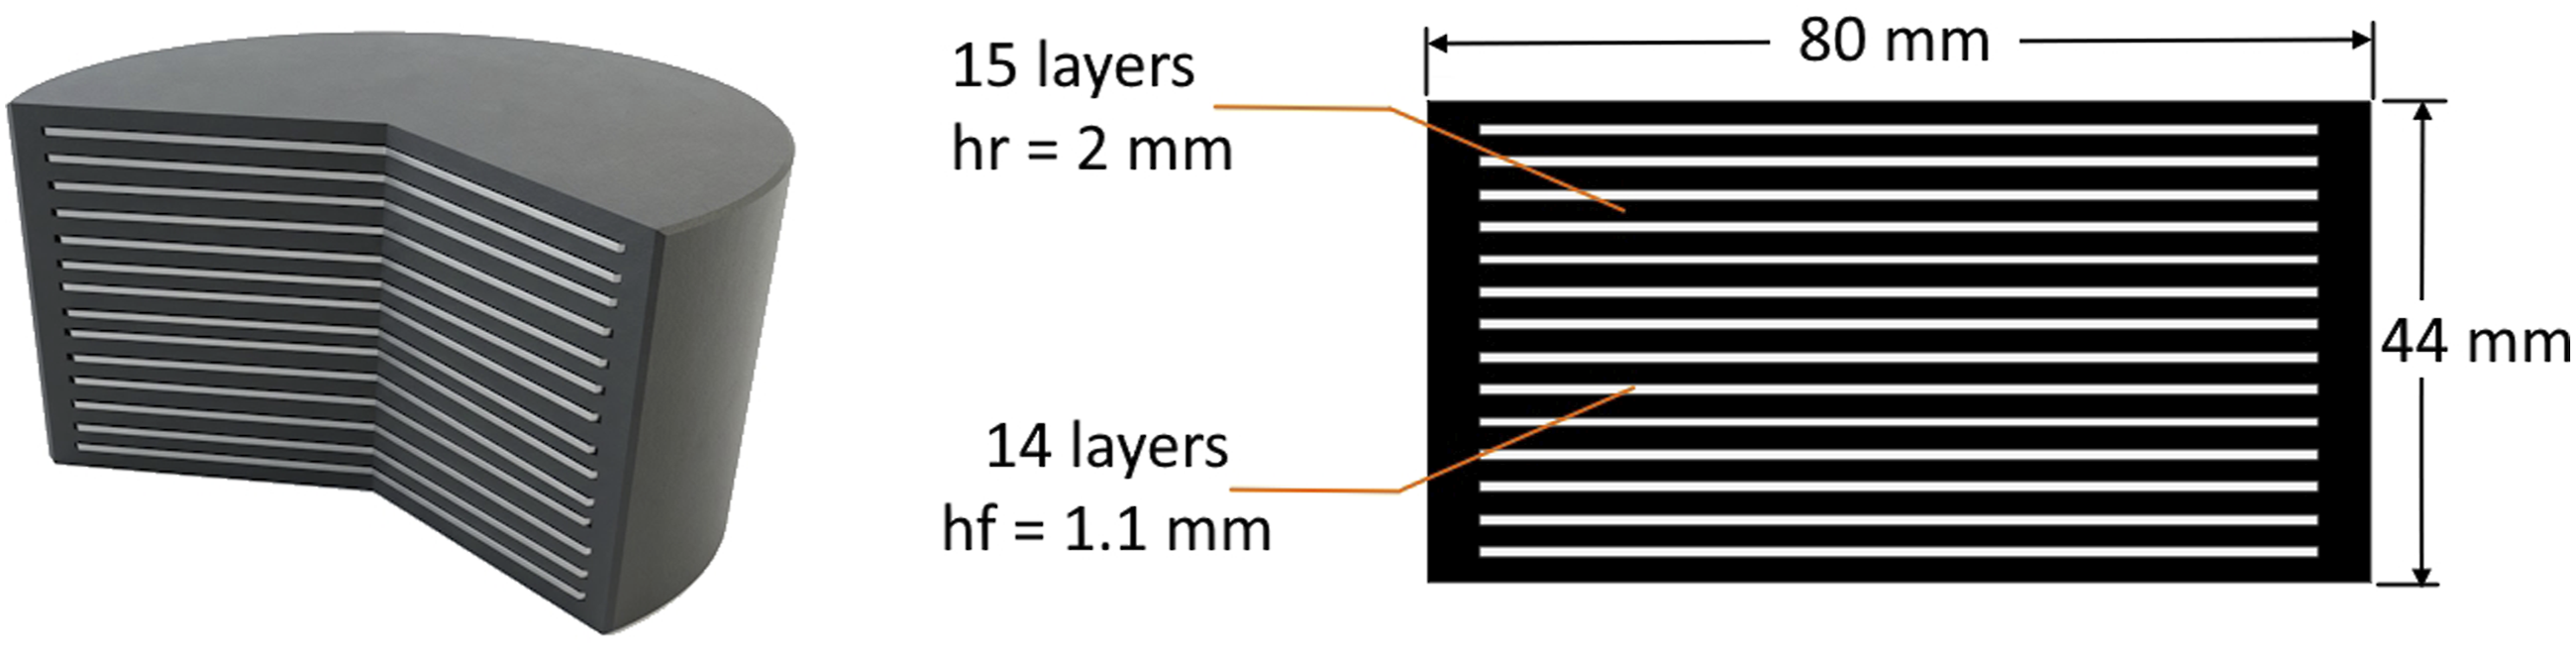
The design vertical load for these isolators was 19.25 kN, with a maximum horizontal displacement (D m ) of 90 mm, corresponding to a maximum deformation of 10%, and an equivalent vertical pressure of 4.0 MPa. These devices were utilized in both the experimental tests and the mathematical models developed in this study.
2.2. Shear testing
The experimental tests were conducted at the Structural Engineering Laboratory of Universidad del Valle using the setup shown in Figure 2. A horizontal loading frame was employed to impose displacement-controlled shear loads on the specimens. Tests were performed under unbonded conditions, with no mechanical anchorage between the isolators and the loading plates. To prevent slippage, rough materials were placed at the contact interfaces to increase friction. Experimental setup.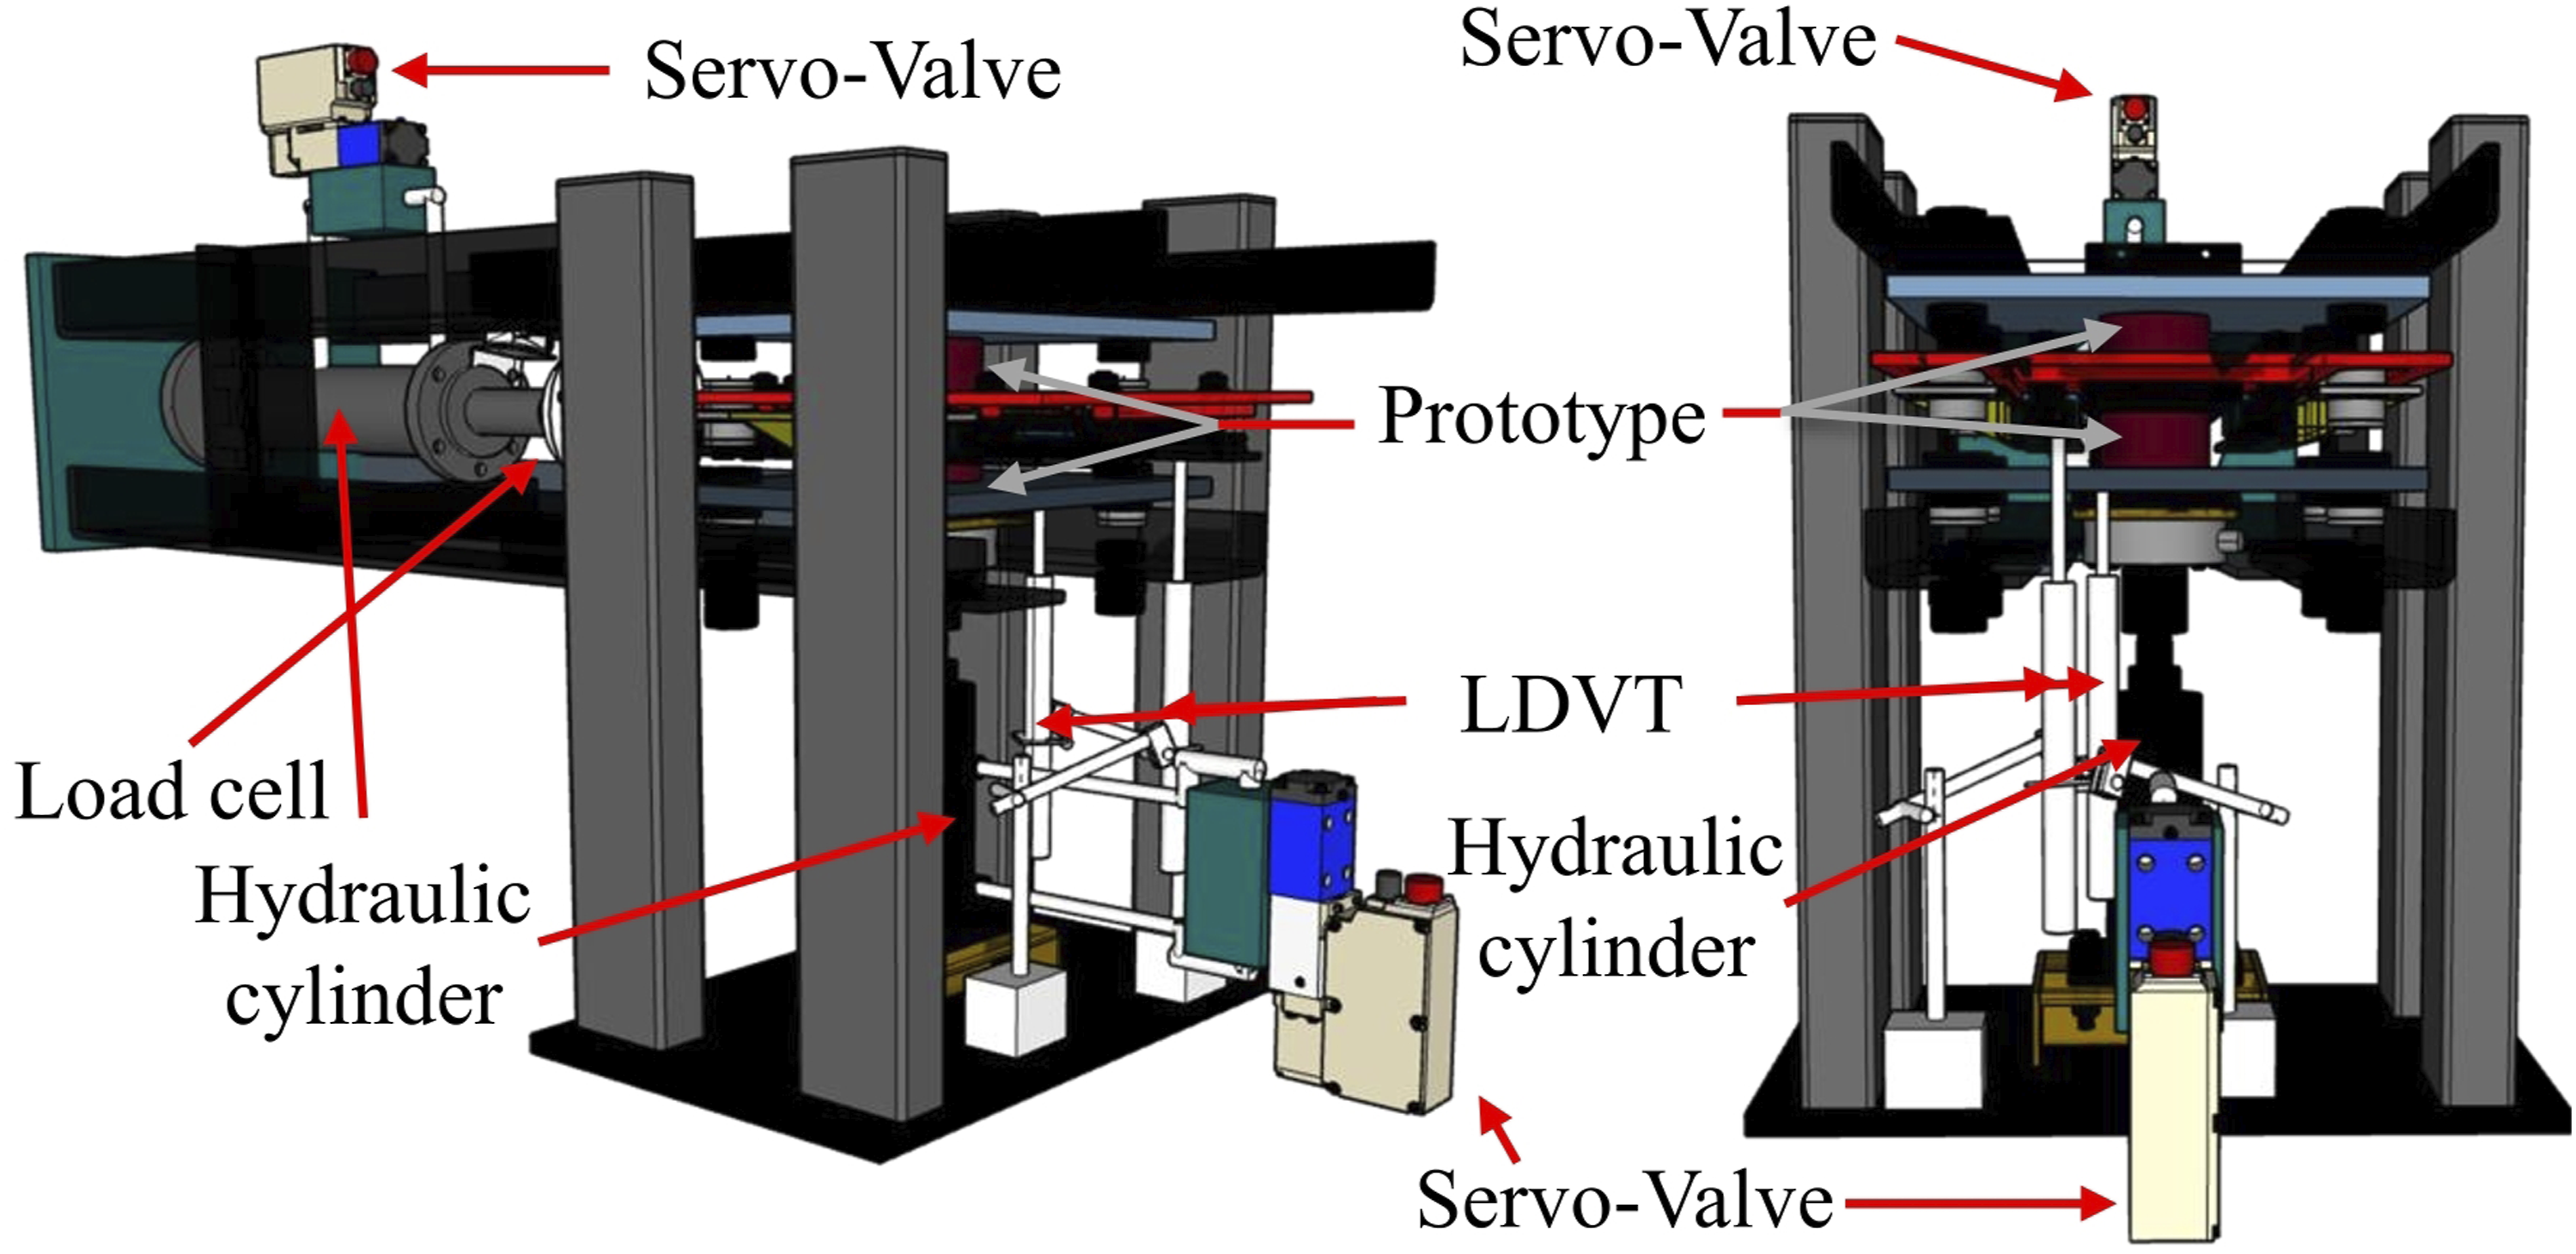
A constant vertical load of 19.25 kN —equivalent to the design load— was applied throughout each test, while horizontal displacements followed predefined protocols. These protocols were based on FEMA450 guidelines, 30 which recommend assessing isolator performance under target deformation levels of 25%, 50%, 67%, and 100% of the design displacement (DD). Each specimen pair was loaded through a rigid steel plate, ensuring uniform shear distribution. 31
Three reference displacement thresholds were established for the experimental program, defined with respect to a design period of 1.15 s: the design displacement (DD), corresponding to an earthquake with a 10% probability of exceedance in 50 years; the maximum displacement (DM), associated with a 10% exceedance probability in 100 years; and the maximum total displacement (DTM), which considers additional components such as torsional effects and structural eccentricities.
Four displacement protocols were developed using these reference levels. Protocol 1 consisted of three fully reversed cycles at each of the following amplitudes: 0.25, DD, 0.5, DD, 1.0, DD, and 1.0, DM. This protocol was used exclusively for model calibration. Protocols 2 and 3 applied different cyclic sequences to test the robustness of the models, while Protocol 4 consisted of a monotonic (non-cyclic) loading path intended to simulate extreme deformation scenarios. The latter three protocols were used for model validation. Figure 3 displays the displacement time histories for each protocol (left column: a, c, e, g) and the corresponding experimental responses (right column: b, d, f, h). These protocols aim to replicate realistic seismic demands, combining lateral cyclic displacements with sustained vertical loads. Applied displacement protocols (a), (c), (e), (g) and corresponding experimental force–displacement responses (b), (d), (f), (h) obtained during shear testing.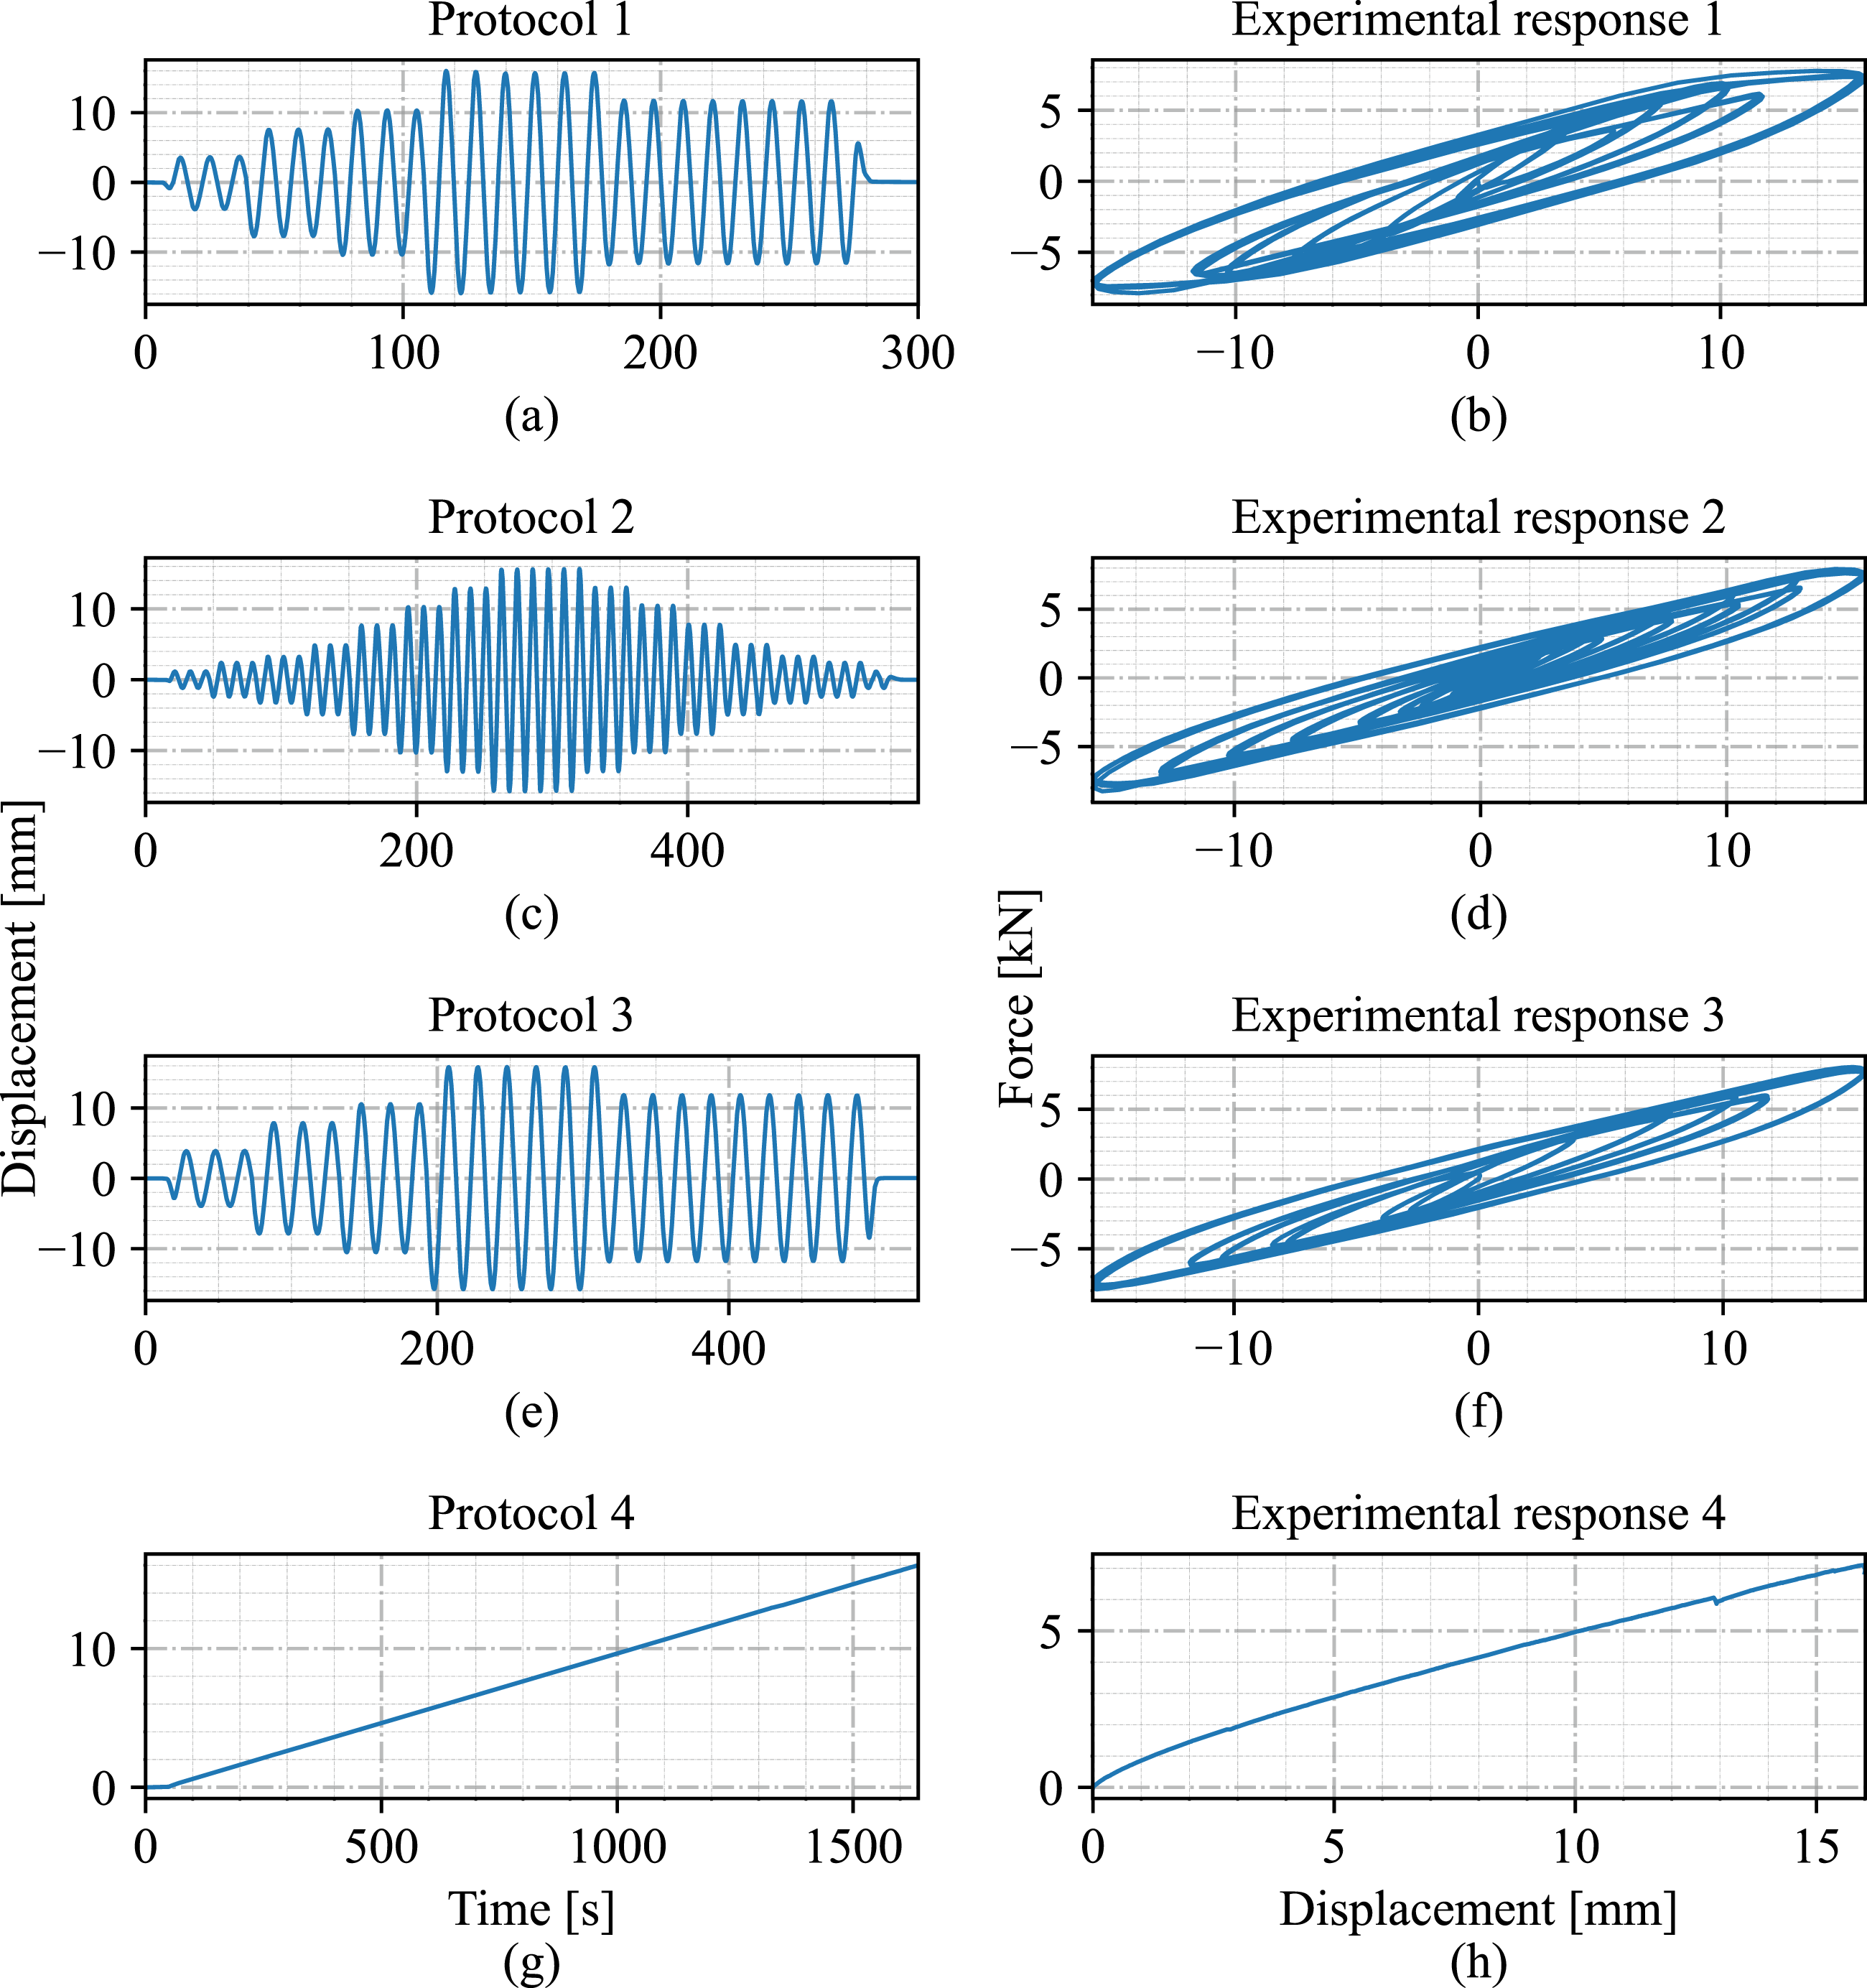
The experimental campaign was conducted under specific boundary conditions: (i) the vertical load was maintained constant to simulate a steady axial pressure, and (ii) the horizontal displacement was applied unidirectionally. While the circular geometry of the RR-FREIs provides isotropic properties, these testing conditions focus on the uniaxial shear response, neglecting potential coupling effects from variable axial forces or multidirectional loading paths that may occur during complex seismic events.
3. Numerical modeling of hysteretic behavior in OpenSeesPy
In OpenSeesPy, 25 the majority of elastomeric bearing elements are modeled as two-node components, which can represent either zero-length or finite-height bearings. These elements are typically implemented as discrete components that connect two nodes, accurately simulating the shear behavior of elastomeric isolators. They incorporate either unidirectional (2D) or coupled (3D) plasticity formulations to represent shear deformations. In order to simulate shear tests on elastomeric bearings, a two-node configuration is used, whereby a controlled horizontal displacement is applied to one node while the other remains fixed. Rotational degrees of freedom are constrained with the objective of isolating the shear response of the bearing, thus replicating the conditions of experimental shear testing.
The present study focuses on calibrating four elastomeric bearing elements available in OpenSeesPy to model the shear hysteretic behavior of RR-FREIs. These elements—Elastomeric Bearing (Plasticity), Elastomeric Bearing (Bouc-Wen), ElastomericX, and HDR—represent different constitutive formulations for elastomeric bearings. To ensure alignment with the software environment, the description of these models retains the native OpenSeesPy parameter nomenclature, which represents macroscopic device-level behavior. The following section describes the theoretical formulation of each element, which will subsequently be calibrated against experimental shear data using Bayesian inference.
3.1. Elastomeric bearing - plasticity element
The Elastomeric Bearing (Plasticity) element in OpenSeesPy
32
models the shear hysteretic behavior of elastomeric isolators using a bilinear plasticity formulation. This constitutive model captures the transition from elastic to post-yield behavior through a combination of linear and nonlinear hardening components. The shear force–displacement response follows the bilinear behavior illustrated in Figure 4 and is governed by five parameters, summarized in Table 1. Bilinear shear behavior of elastomeric bearing-plasticity element. Parameters of the Elastomeric Bearing (Plasticity) element.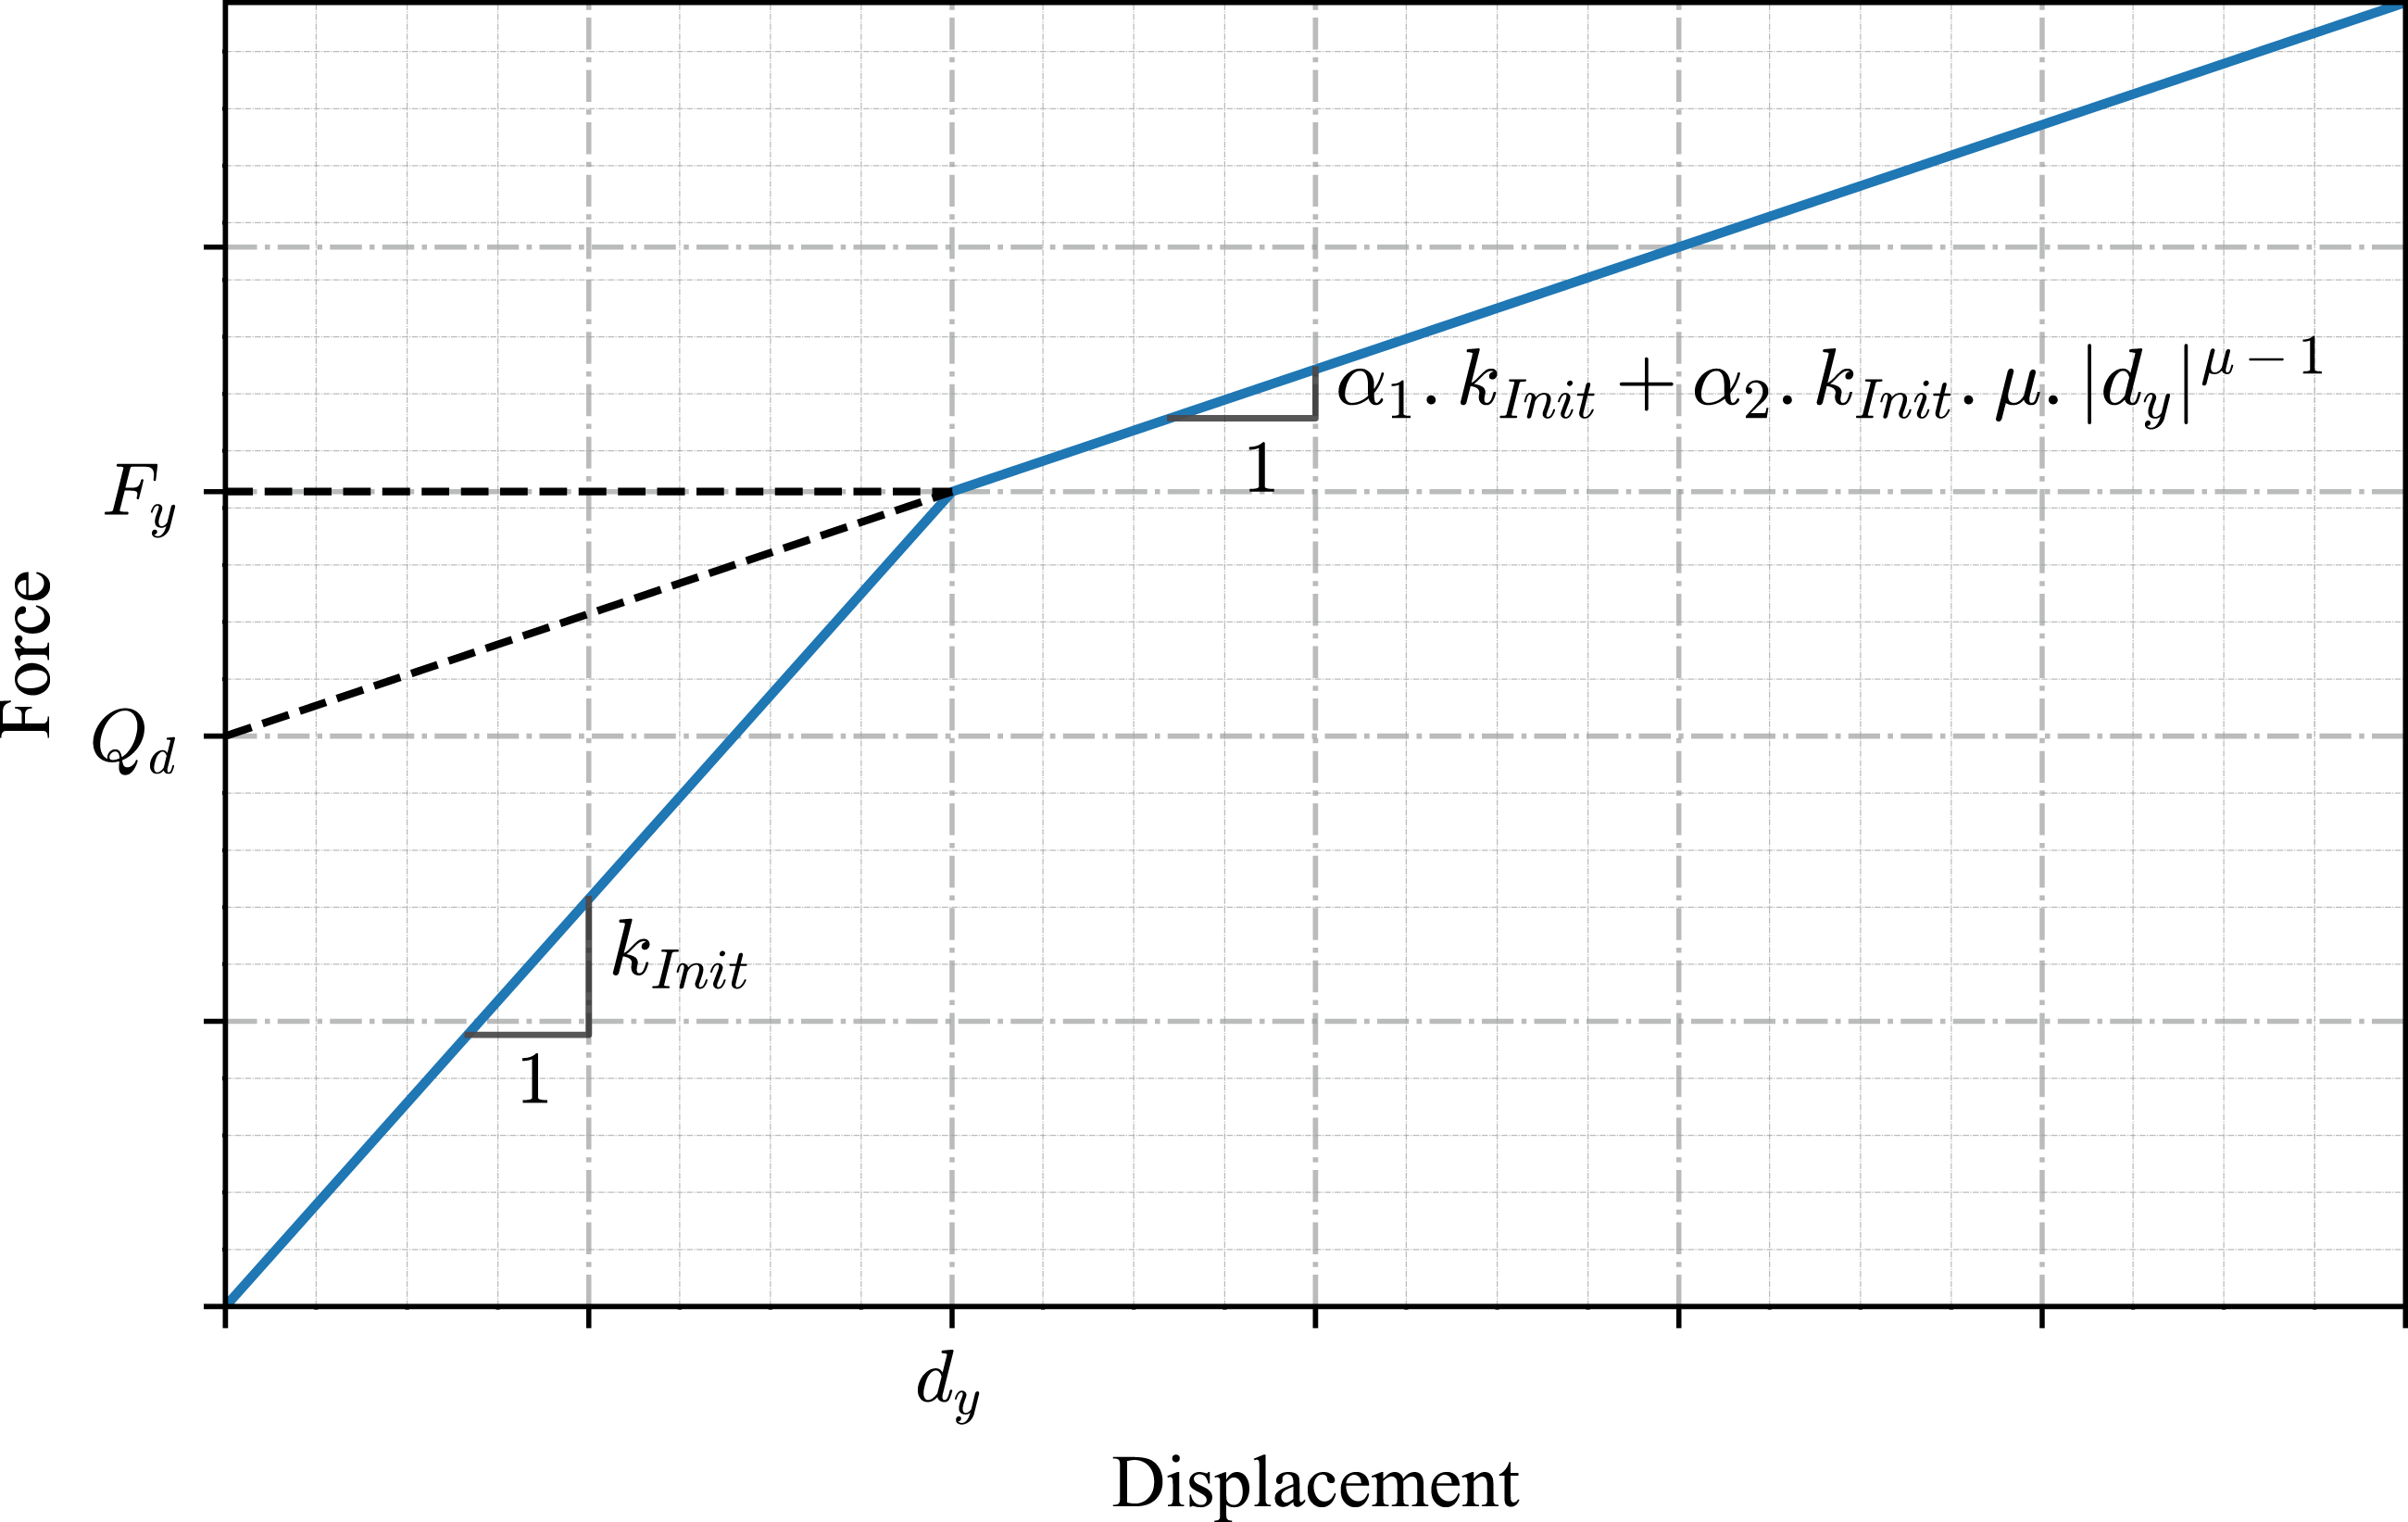
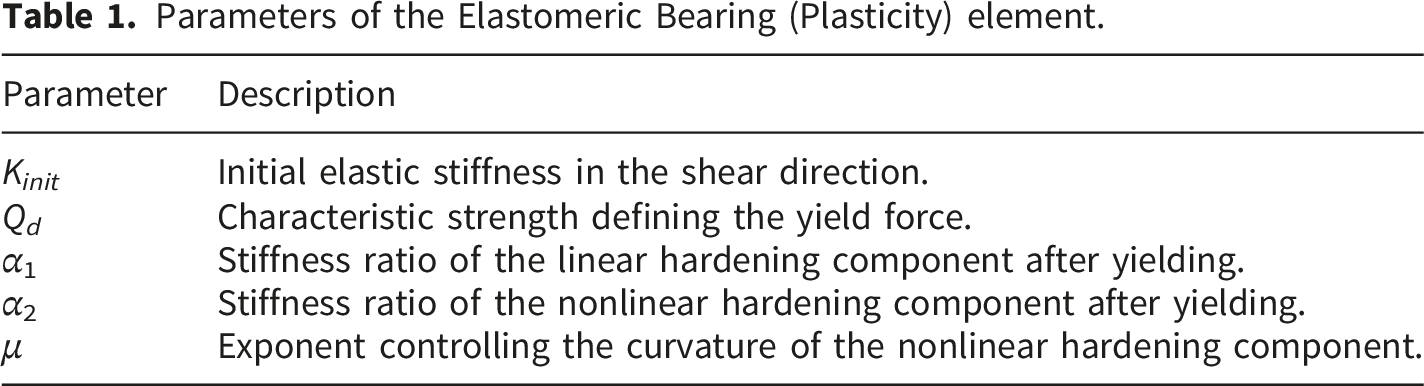
The initial elastic shear stiffness (K
init
) is determined by Equation (1), where G
r
denotes the shear modulus of recycled rubber, A is the cross-sectional area of the isolator, and H
r
is the total height of the rubber. This relationship establishes a direct link between the material properties of recycled rubber and the geometric characteristics of the isolator, providing the basis for the elastic response.
The characteristic strength Q
d
defines the yield force at which the isolator begins to exhibit significant plastic deformation under shear loading. It is related to the total yield force F
y
and the post-yield stiffness ratio α as:
The parameters α1 and α2 describe the linear and nonlinear hardening behavior following yielding, while μ controls the shape of the nonlinear hardening response, allowing the model to capture gradual or abrupt stiffness changes in the post-yield regime.
3.2. Elastomeric bearing (Bouc-Wen) element
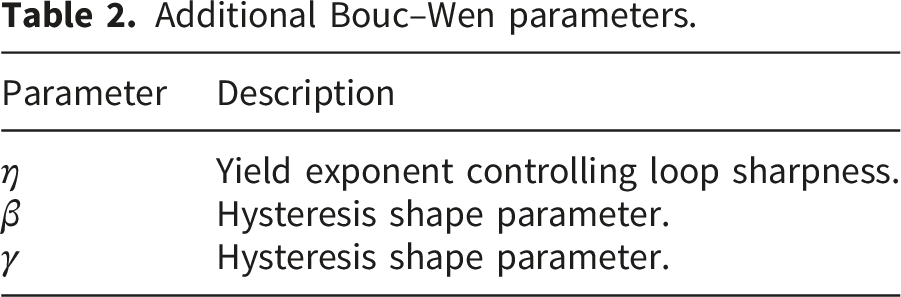
Additional Bouc–Wen parameters.
The Bouc–Wen model is a widely adopted phenomenological model that captures complex hysteresis behaviors in mechanical systems. Originally developed by Wen, 34 and later extended in works such as Peng and Zhou, 35 it provides a smooth transition from elastic to inelastic behavior and allows for refined control over the shape and sharpness of the hysteresis loops.
The constitutive behavior of the Bouc–Wen model is given by the stress–strain relationship:

Here, γ, β, and η are dimensionless parameters that define the shape and sharpness of the hysteresis loop, and ɛ y = f y /E is the yield strain. In OpenSeesPy, these parameters are mapped to the shear response of the isolator. 33
Figure 5 illustrates the shear behavior captured by the Bouc–Wen model. Compared to the bilinear behavior of the Plasticity model, this formulation offers increased flexibility to simulate pinching, stiffness degradation, and smooth nonlinear transitions. Shear behavior representation of the elastomeric bearing Bouc–Wen element.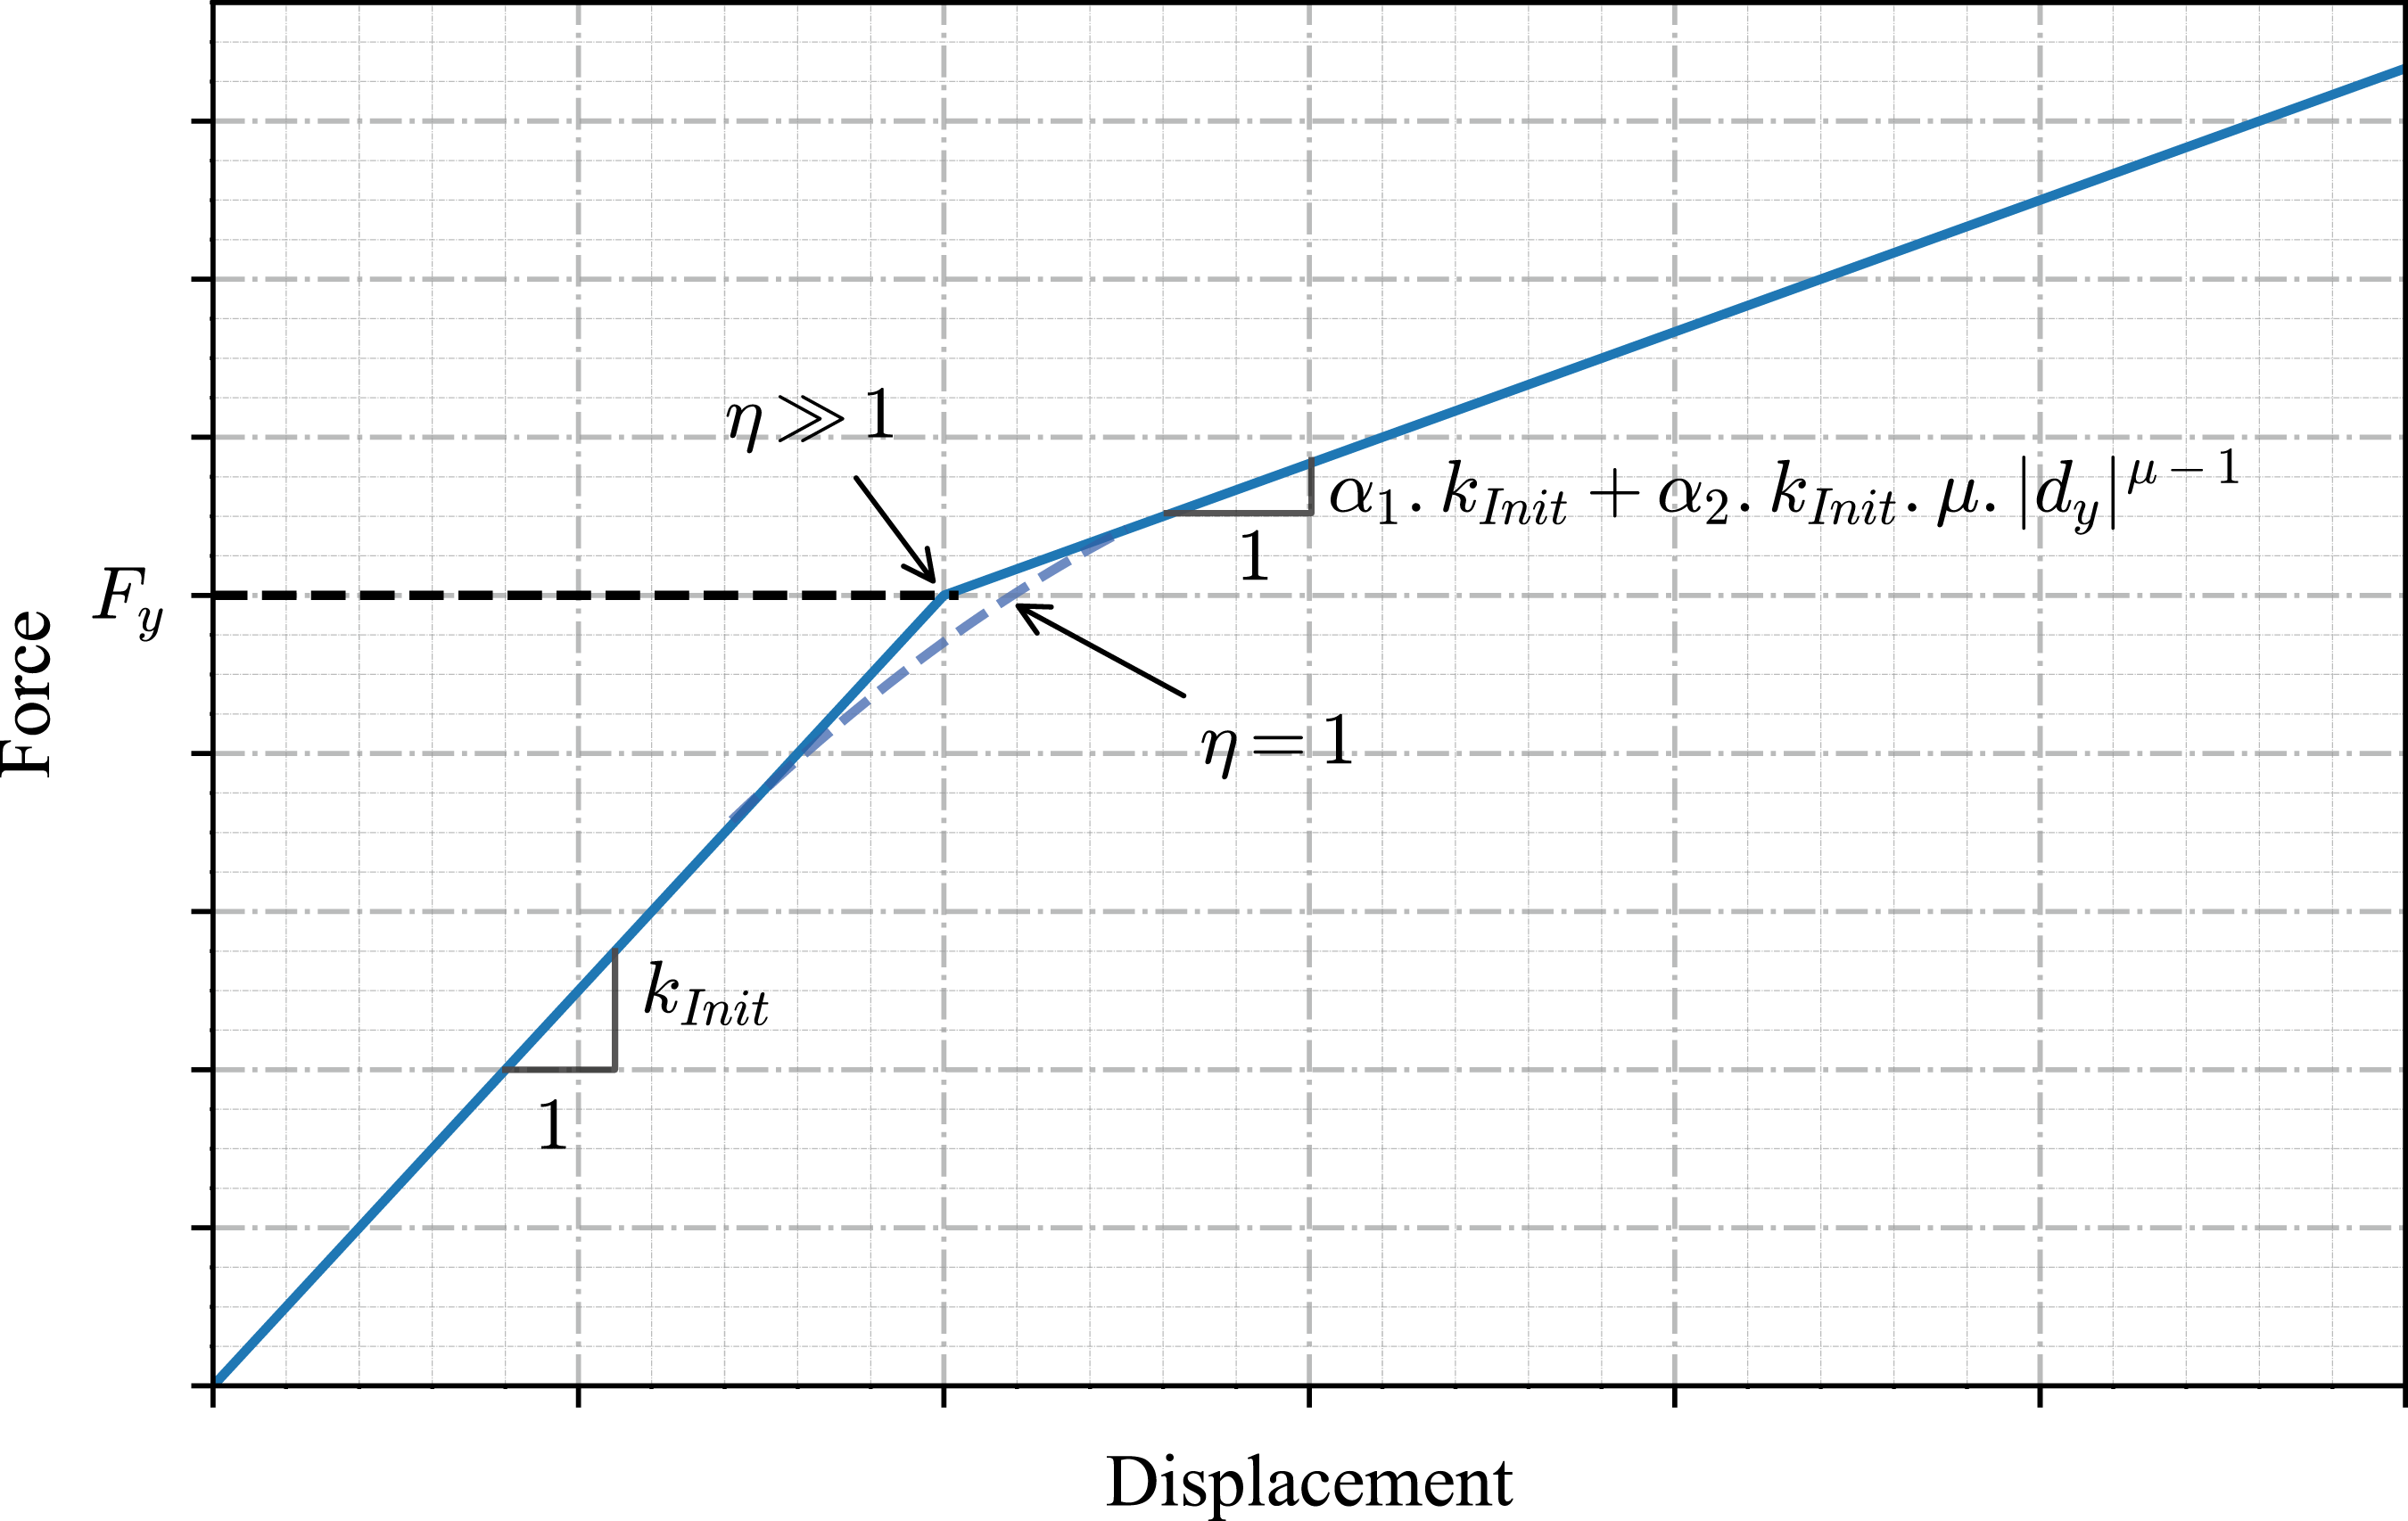
The post-yield stiffness in this element is modified by the Bouc–Wen parameters, and follows the general form:
3.3. ElastomericX element
The ElastomericX element in OpenSeesPy 36 is a comprehensive and advanced formulation for modeling the behavior of elastomeric isolators.25,37 It extends the capabilities of the Elastomeric Bearing (Bouc-Wen) element by internally generating uniaxial material models for all six degrees of freedom, based solely on the isolator’s geometric and material properties. This eliminates the need for the user to explicitly define UniaxialMaterial tags for each direction, simplifying the model specification.
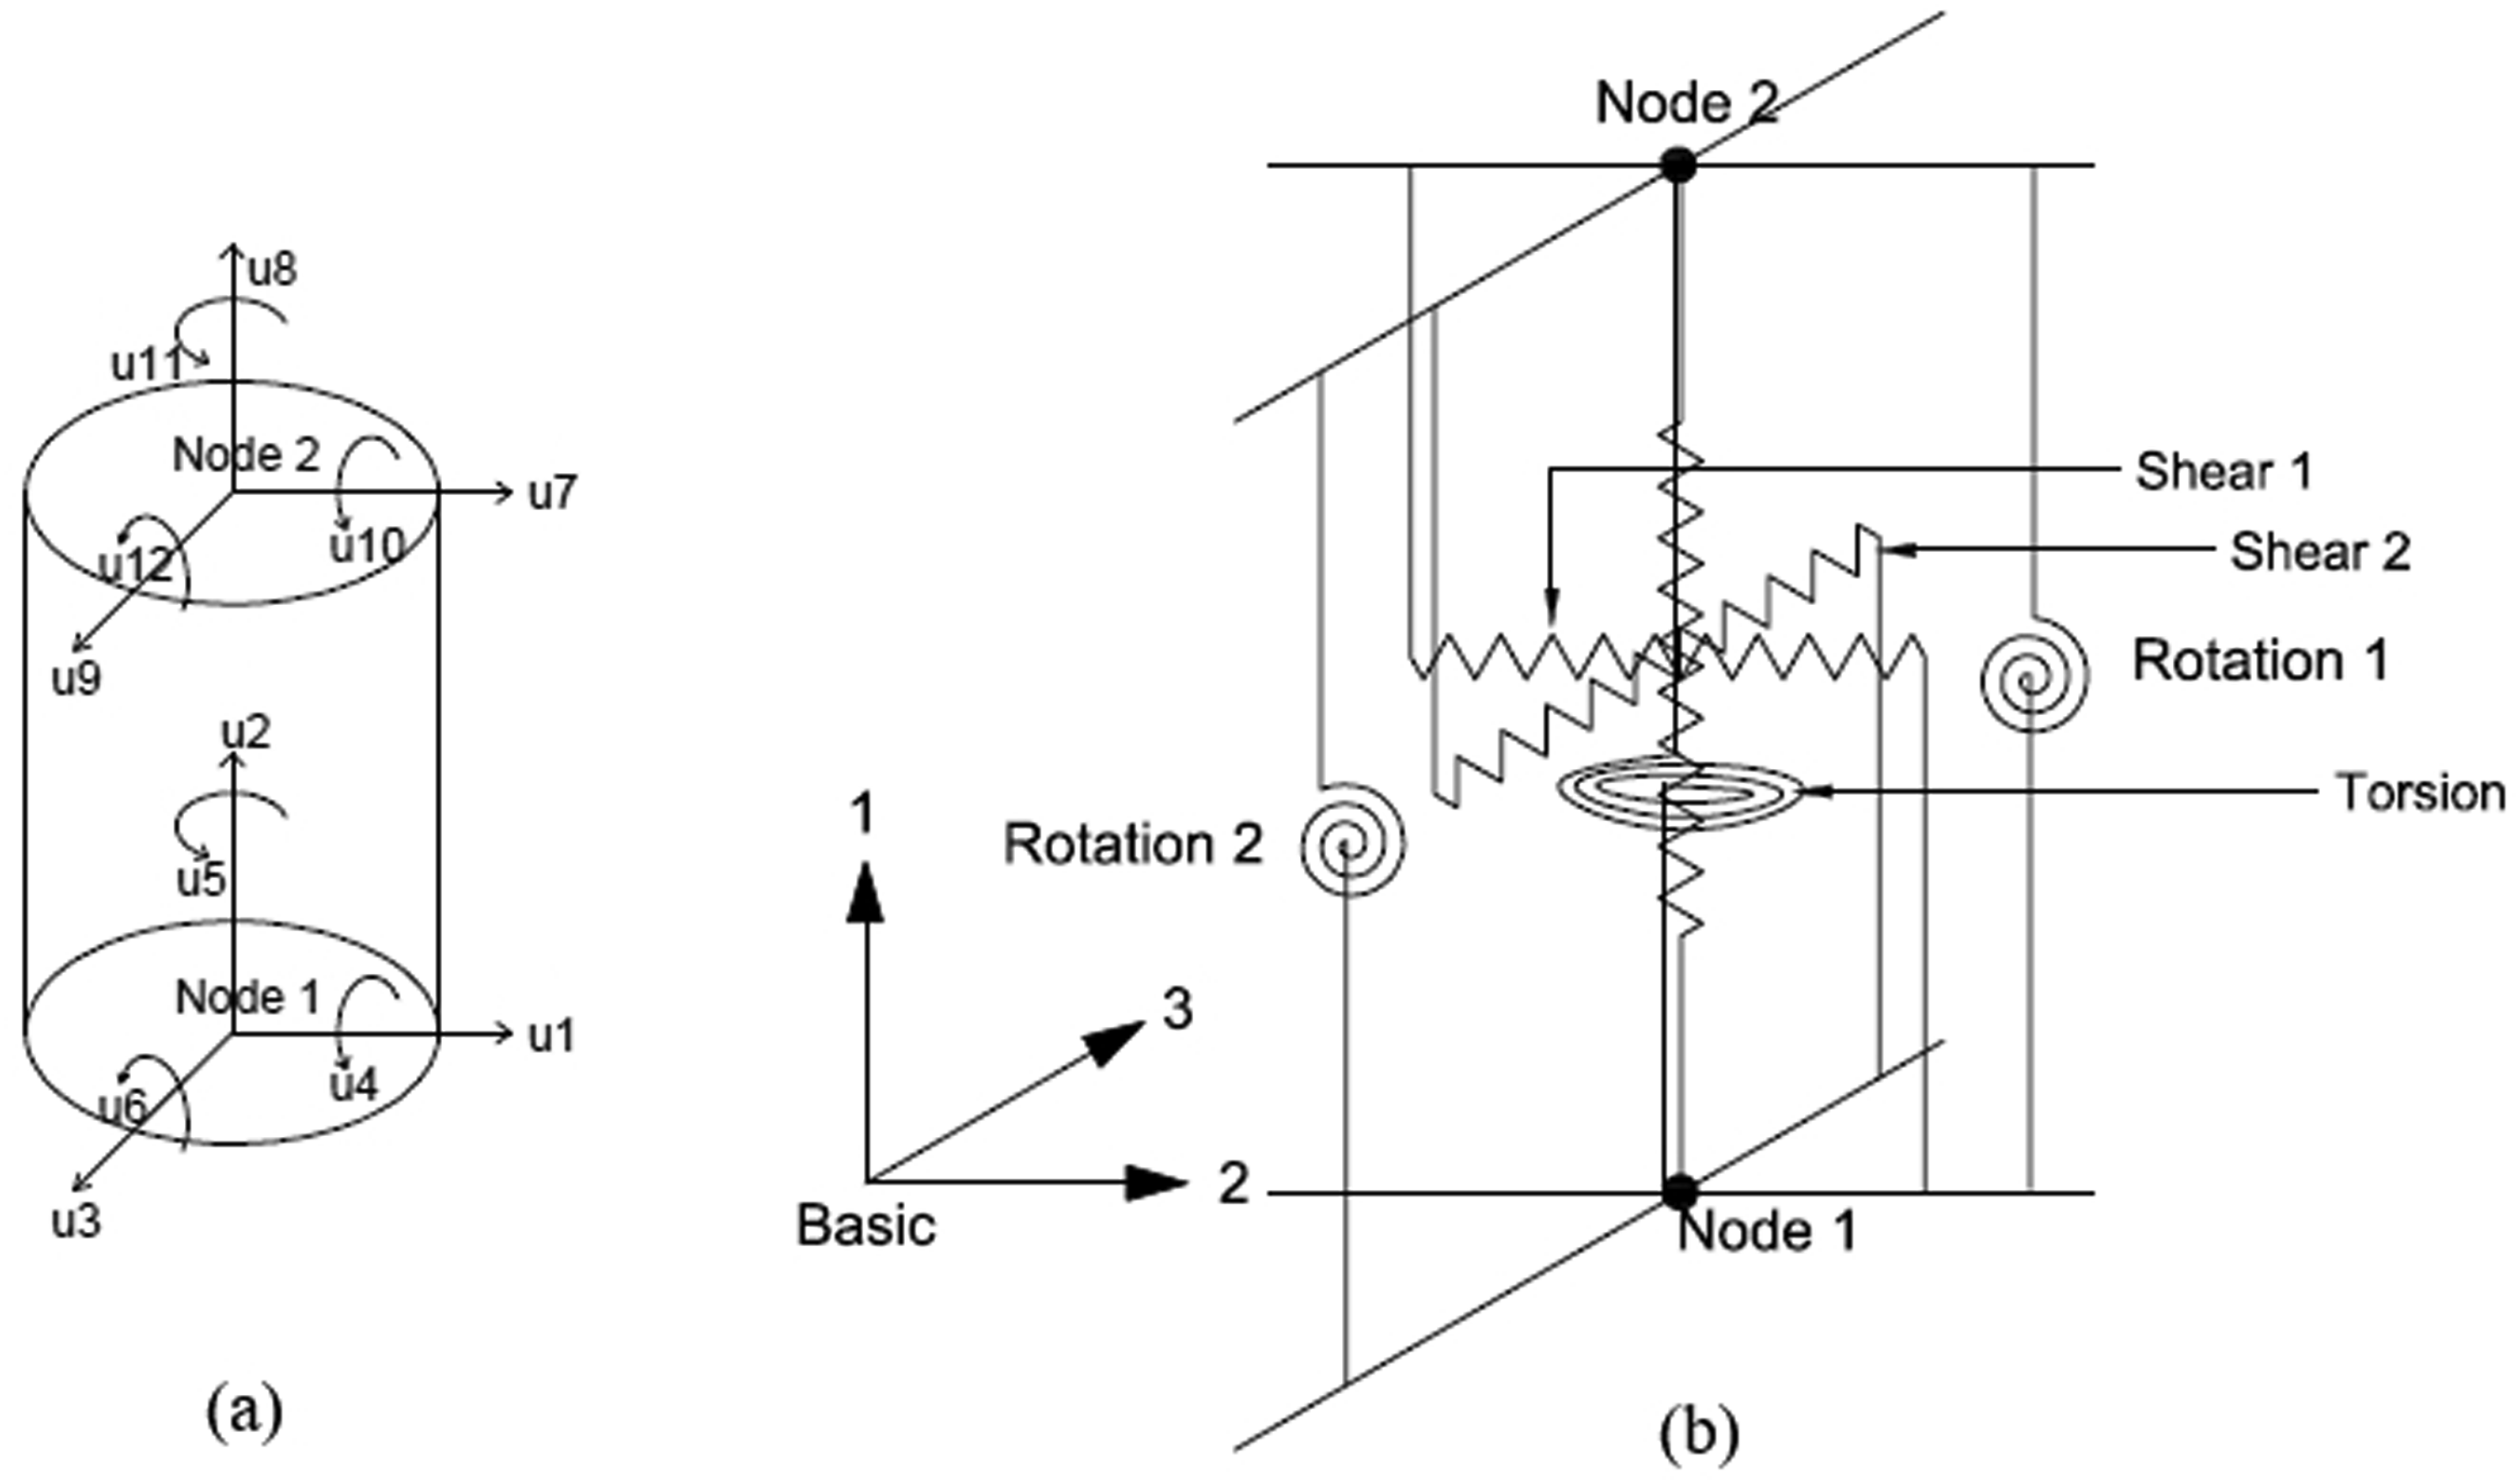
Physically, the isolator is modeled as a two-node element with twelve degrees of freedom, connected by six discrete nonlinear springs that represent the axial, torsional, shear, and rotational behaviors of the bearing. These internal springs are derived from analytical expressions for the mechanical properties of laminated elastomeric bearings and include the effects of geometric nonlinearity due to large displacements. Figure 6 shows the conceptual spring-based representation. Physical model of an elastomericX element. (a) Degrees of freedom and (b) discrete spring model representation (adapted from
37
).
The force vector and stiffness matrix of the element in the basic system take the general form: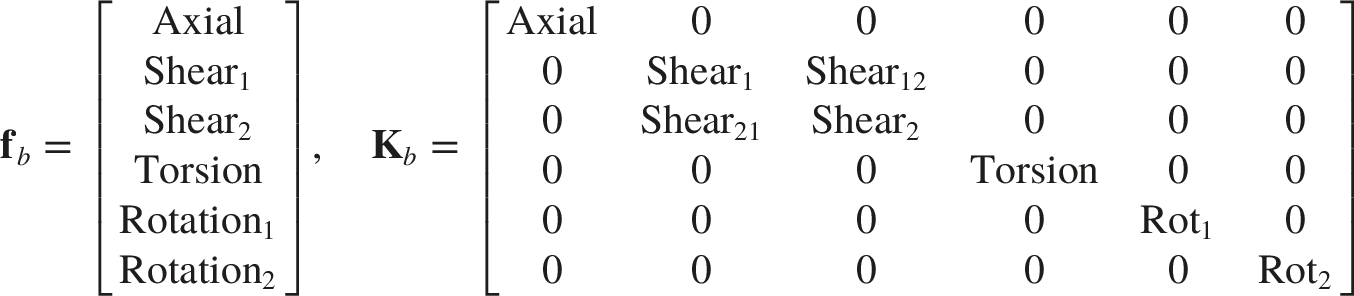
The two orthogonal shear springs are modeled using an extension of the Bouc-Wen hysteretic formulation, 39 while the torsional and rotational springs are assumed to follow linear elastic behavior. Axial response includes optional features such as cavitation, buckling degradation, and strength reduction, depending on user-specified flags.
Input parameters for the ElastomericX element.
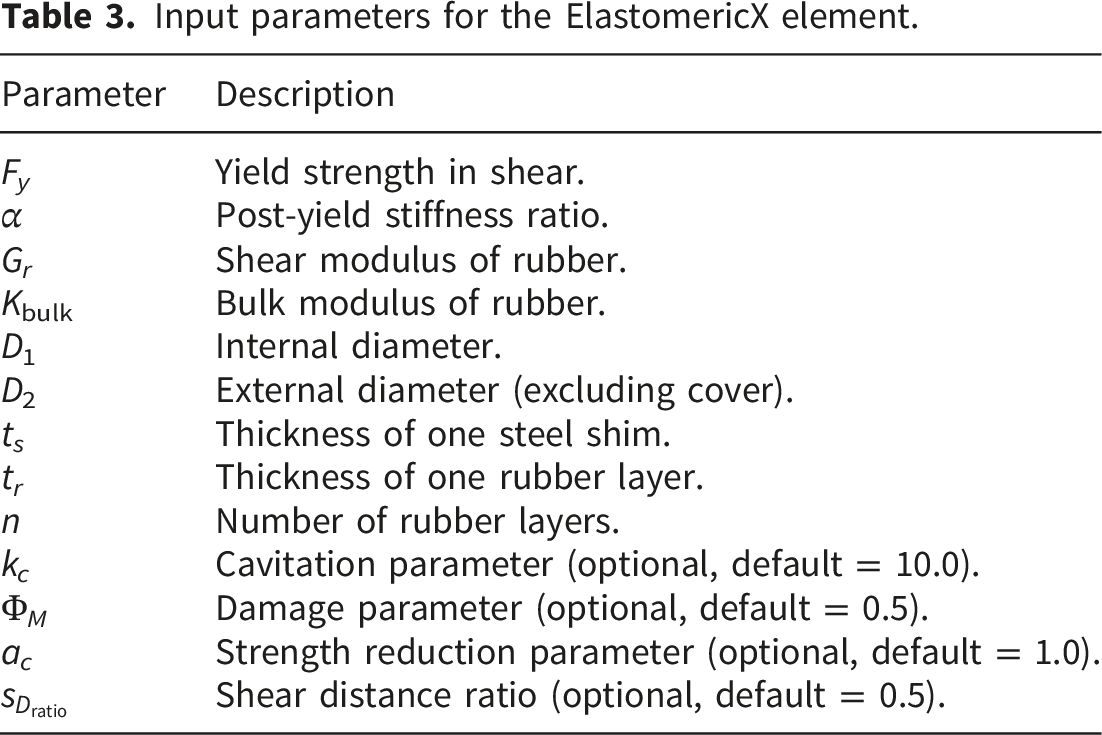
This element supports the following additional physical behaviors, which can be activated as needed: (i) cavitation and post-cavitation in axial tension, (ii) variation of critical buckling load with lateral displacement, (iii) dependency of shear stiffness on axial load, and (iv) coupling between vertical and horizontal responses.
The ElastomericX element provides a computationally efficient yet highly detailed representation of seismic isolators. It is especially well-suited for advanced applications requiring accurate modeling of stiffness degradation, coupling effects, and nonlinear axial-shear interactions. 38
3.4. HDR element
The
Additional shear model parameters in the
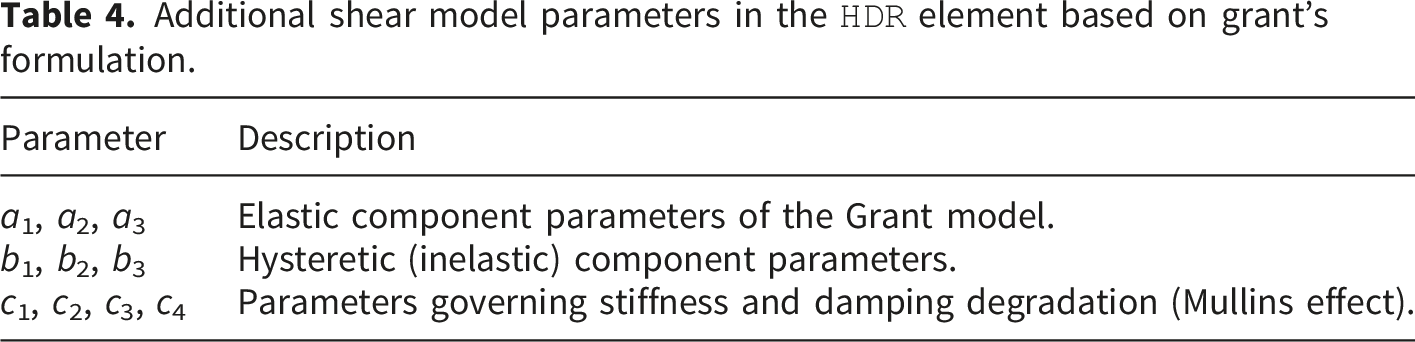
The elastic parameters (a1, a2, a3) define the nonlinear elastic backbone, while the hysteretic parameters (b1, b2, b3) control energy dissipation and inelastic response. The degradation parameters
To facilitate implementation,
42
proposed dimensionless formulations for these parameters using geometric and material properties of the bearing. These relationships are given by:


4. Bayesian calibration and model selection
4.1. Bayesian inference framework
This section presents the application of Bayesian inference for both parameter calibration and model selection in the context of seismic isolators composed of recycled rubber reinforced with polyester fibers. The analysis is based on cyclic shear tests performed on scaled prototypes, from which force-displacement hysteresis curves were obtained. The previous four mechanical models, implemented in OpenSeespy, are evaluated based on their ability to replicate the experimental response. The primary objectives are to estimate the posterior distributions of the model parameters and to compare models using Bayesian criteria to identify the most suitable representation for the observed behavior.
To achieve these objectives, the framework must explicitly account for the main uncertainties inherent to the problem, which are categorized into aleatory and epistemic. Aleatory uncertainty stems from the stochastic nature of the experimental data, such as measurement noise and variability in testing conditions. Conversely, epistemic uncertainty arises from the limitations of the numerical models themselves, including errors introduced by the discretization of the hysteretic response and the use of simplified bilinear or idealized models to represent the complex, continuous mechanical behavior of recycled rubber isolators.
Bayesian inference provides a probabilistic framework that integrates prior knowledge about the parameters with experimental observations to update uncertainty and estimate the most likely parameter values.
43
This process is governed by Bayes’ theorem, which expresses the posterior distribution of the parameters as proportional to the product of the likelihood function and the prior distribution, normalized by the marginal probability of the data. Formally, the posterior distribution P (θ∣D, M) is given by:
In this expression, θ denotes the vector of model parameters, D represents the experimental data (i.e., the force-displacement measurements), and M refers to the model under consideration. The term P(θ) corresponds to the prior distribution, which encodes any prior knowledge or assumptions about the parameters before observing the data. The likelihood function P (D∣θ, M) quantifies how probable the observed data are given a particular set of parameters and a chosen model. Finally, the denominator P (D∣M), known as the model evidence or marginal likelihood, acts as a normalizing constant and is particularly important in model selection, since it measures the overall probability of the data under the model by integrating over all possible parameter values. 44
The likelihood function used in this study assumes that the discrepancy between the observed and predicted responses follows a normal distribution.
43
The model prediction μ corresponds to the output from a forward simulation in OpenSeesPy using a given set of parameters. Under the Gaussian assumption, the likelihood is defined as:
Here, N is the number of data points, D i is the observed force at the i-th displacement, μ i (θ) is the predicted force, and σ is the standard deviation of the error term, which is also treated as an unknown parameter. The posterior distribution of θ and σ is estimated via Markov Chain Monte Carlo (MCMC) sampling, 45 allowing not only point estimates but also full uncertainty quantification through credible intervals and joint distributions.
4.2. Prior distributions and sampling configuration
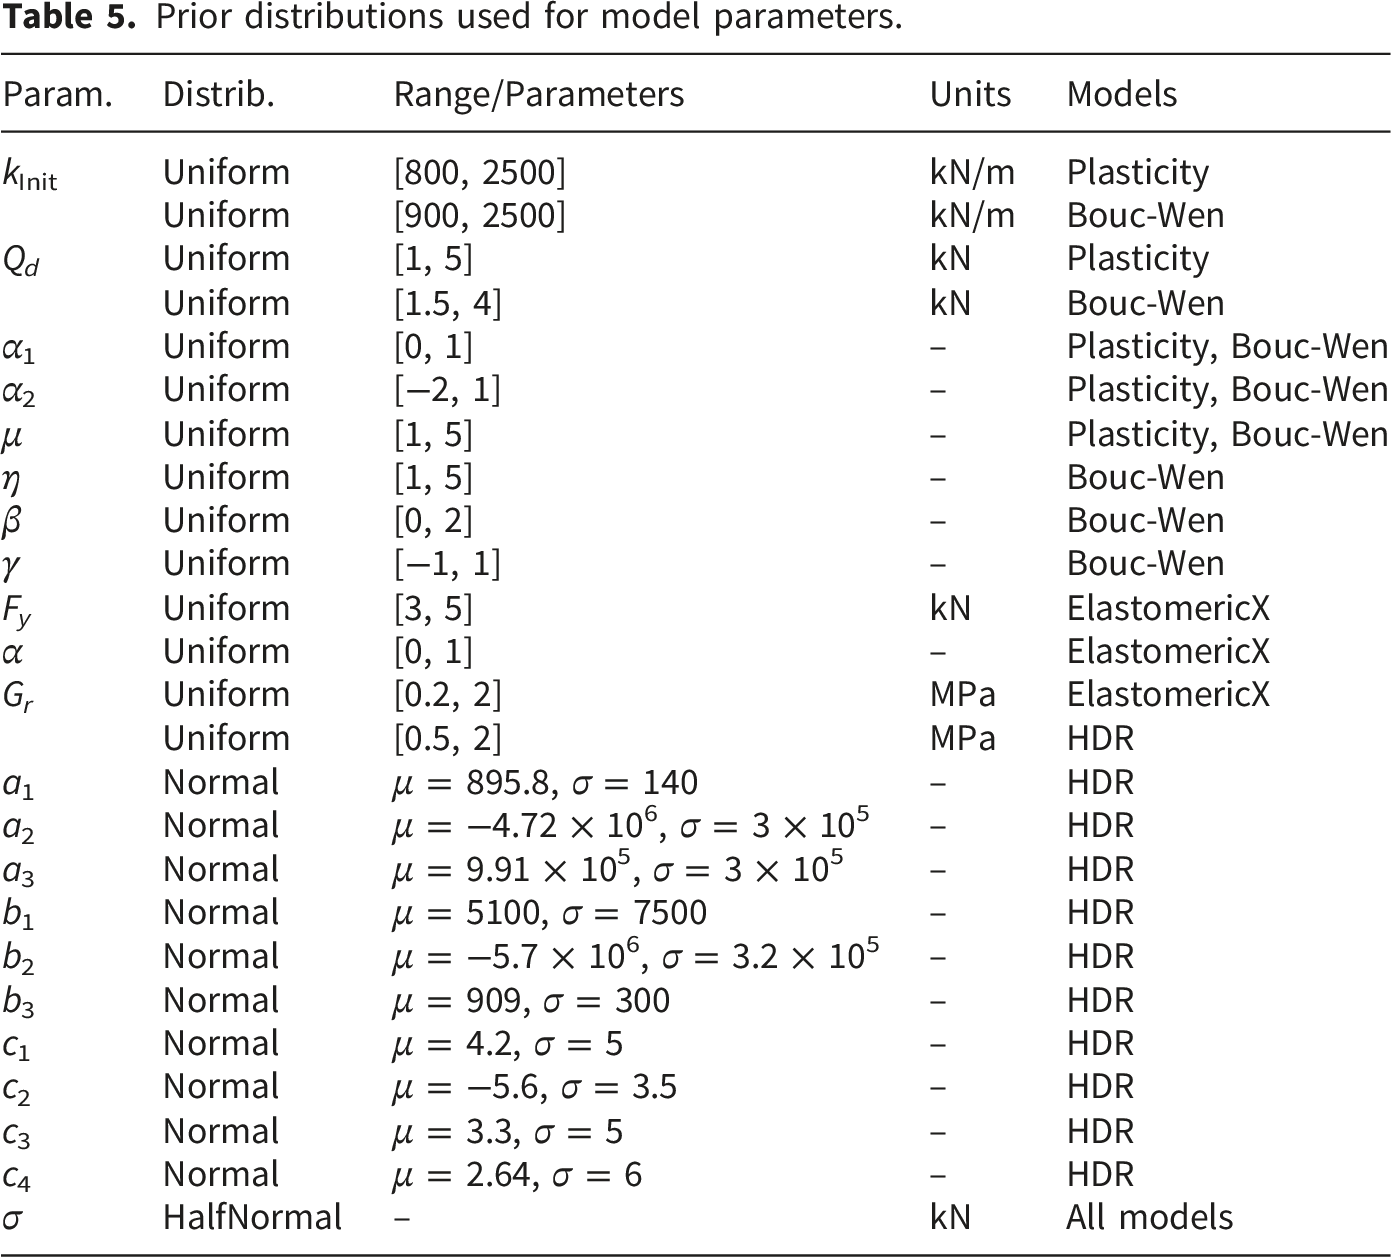
The Bayesian inference process was implemented using
Convergence of the chains was assessed using the potential scale reduction factor 
Prior distributions used for model parameters.
4.3. Computational workflow and implementation
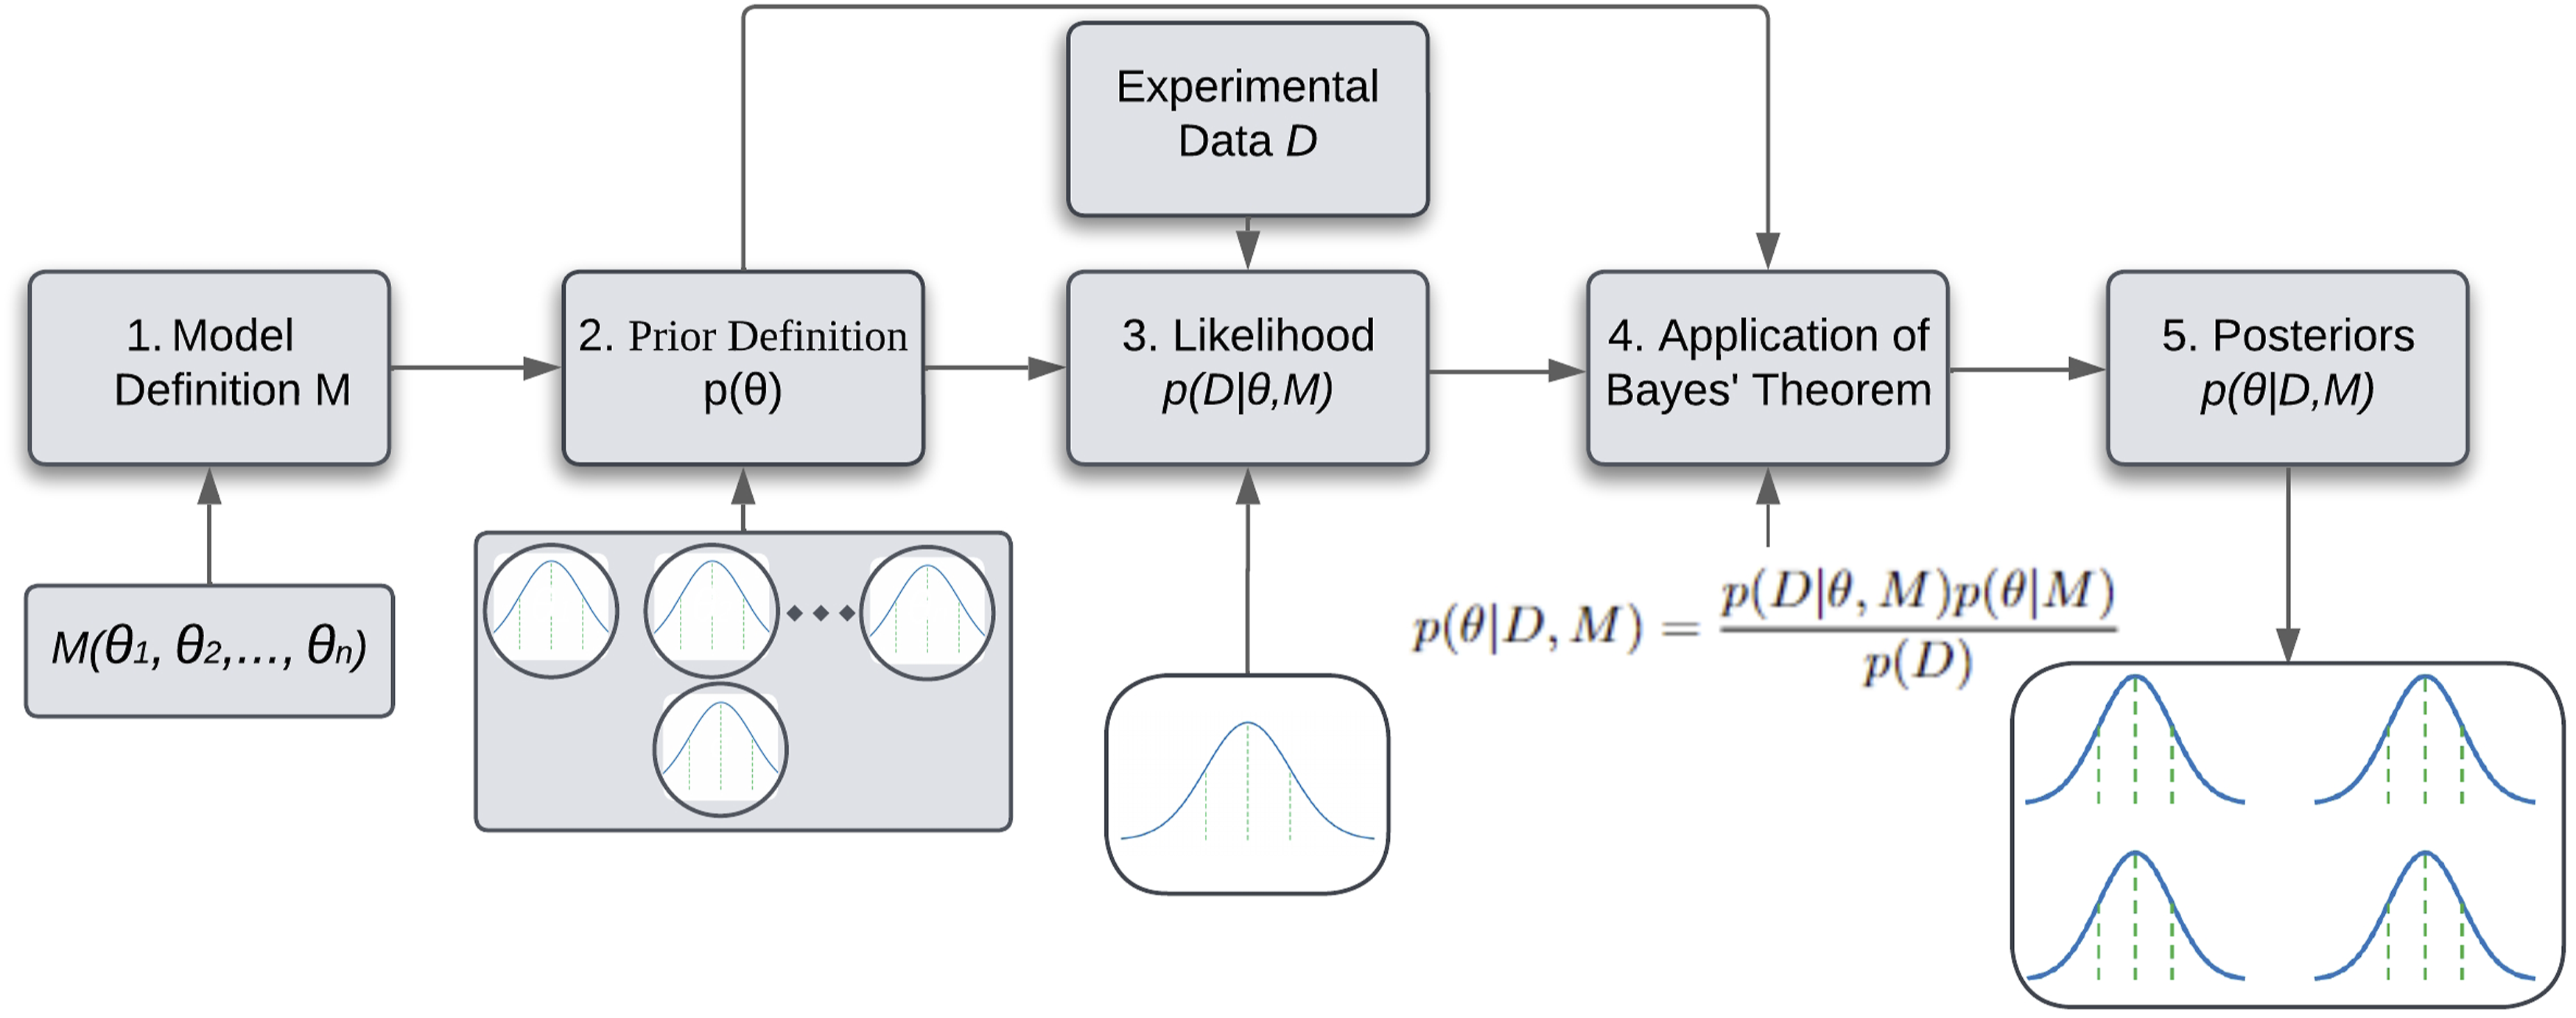
To ensure the reproducibility of the probabilistic calibration framework and clarify the interaction between the open-source structural solver (OpenSeesPy) and the probabilistic programming environment (PyMC), a structured computational workflow was established. The implementation procedure is systematically divided into five main stages, as illustrated in the flowchart of Figure 7: 1. 2. 3. 4. 5. Flowchart of the Bayesian calibration framework integrating OpenSeesPy and PyMC.
4.4. Model comparison criteria
In addition to parameter calibration, Bayesian inference enables model comparison by quantifying how well each model is expected to generalize to new data. Unlike traditional fit-based metrics, which may favor models with more parameters, Bayesian criteria balance goodness-of-fit with model complexity. 48 In this work, the model selection process is carried out using the Widely Applicable Information Criterion (WAIC) 49 and Leave-One-Out Cross-Validation (LOO-CV), 48 both of which are computed using the posterior samples from the MCMC algorithm.
WAIC estimates the out-of-sample predictive performance by averaging the log-likelihood over the posterior distribution, while incorporating a penalty term based on the variance of the log-likelihood across samples. Specifically, WAIC is formulated as WAIC = −2 (lppd − p
WAIC
), where the log pointwise predictive density (lppd) is calculated as:

In these expressions, y i represents the i-th experimental observation (measured force), θ s denotes the s-th posterior sample of the parameter vector (containing the hysteretic properties of the isolator), S is the total number of posterior samples, and n is the number of observations used in the calibration.
LOO-CV provides a complementary perspective by evaluating the model’s ability to predict each observation when that observation is excluded from the training dataset. Although leave-one-out procedures are typically computationally intensive, recent advances in importance sampling and Pareto-smoothed importance sampling (PSIS) allow efficient estimation of LOO from existing posterior draws.
48
This approach estimates the expected log pointwise predictive density 
Both WAIC and LOO-CV produce scalar metrics that can be directly compared across candidate models. The model with the lowest WAIC or LOO-CV value is considered to have the highest expected predictive accuracy. It is important to note that both criteria incorporate mechanisms to penalize model complexity. WAIC does so through the variance of the log-likelihood across posterior samples, while LOO-CV does so through its data-partitioning nature, evaluating performance on held-out observations.
5. Results
This section presents the results of the Bayesian calibration performed for each modeling approach. Specifically, each model corresponds to a distinct OpenSees element used to represent the nonlinear behavior of the seismic isolator. The calibration was carried out using experimental data from Protocol 1.
For each element, two key outputs are presented: (i) the posterior distributions of the model parameters, and (ii) a posterior predictive check comparing the experimental hysteresis loops with model predictions. These predictions are obtained using the Maximum A Posteriori (MAP) estimate, which corresponds to the parameter vector that maximizes the posterior distribution and serves as a representative point estimate under a mode-seeking loss. The 95% posterior credible interval (PCI) of the simulated response is also shown to visualize uncertainty. The posterior predictive checks (PPCs) enable visual inspection of the model’s ability to reproduce the experimental hysteretic behavior, including stiffness, energy dissipation, and potential degradation effects. In this framework, the PPC serves as the primary tool for assessing model adequacy, bridging the gap between statistical inference and the physical mechanical response of the isolator.
All inferred parameters exhibited satisfactory convergence, with
5.1. Elastomeric bearing — plasticity
The posterior distributions of the Plasticity model parameters are shown in Figure 8. The parameters Q
d
, kInit, and α1 exhibit narrow posterior distributions, suggesting high identifiability. In particular, the yield strength Q
d
has a posterior mean of 2.30 kN and a standard deviation of only 0.04 kN. Similarly, α1 concentrates around 0.49, and kInit centers at approximately 1042 kN/m. Table 6 summarizes the posterior statistics for each parameter, including the mean, maximum a posteriori (MAP) estimate, standard deviation, and 95% credible interval, defined by the 2.5% and 97.5% quantiles. Posterior distributions of the calibrated parameters for the Plasticity model. Posterior summary statistics for the Plasticity model parameters.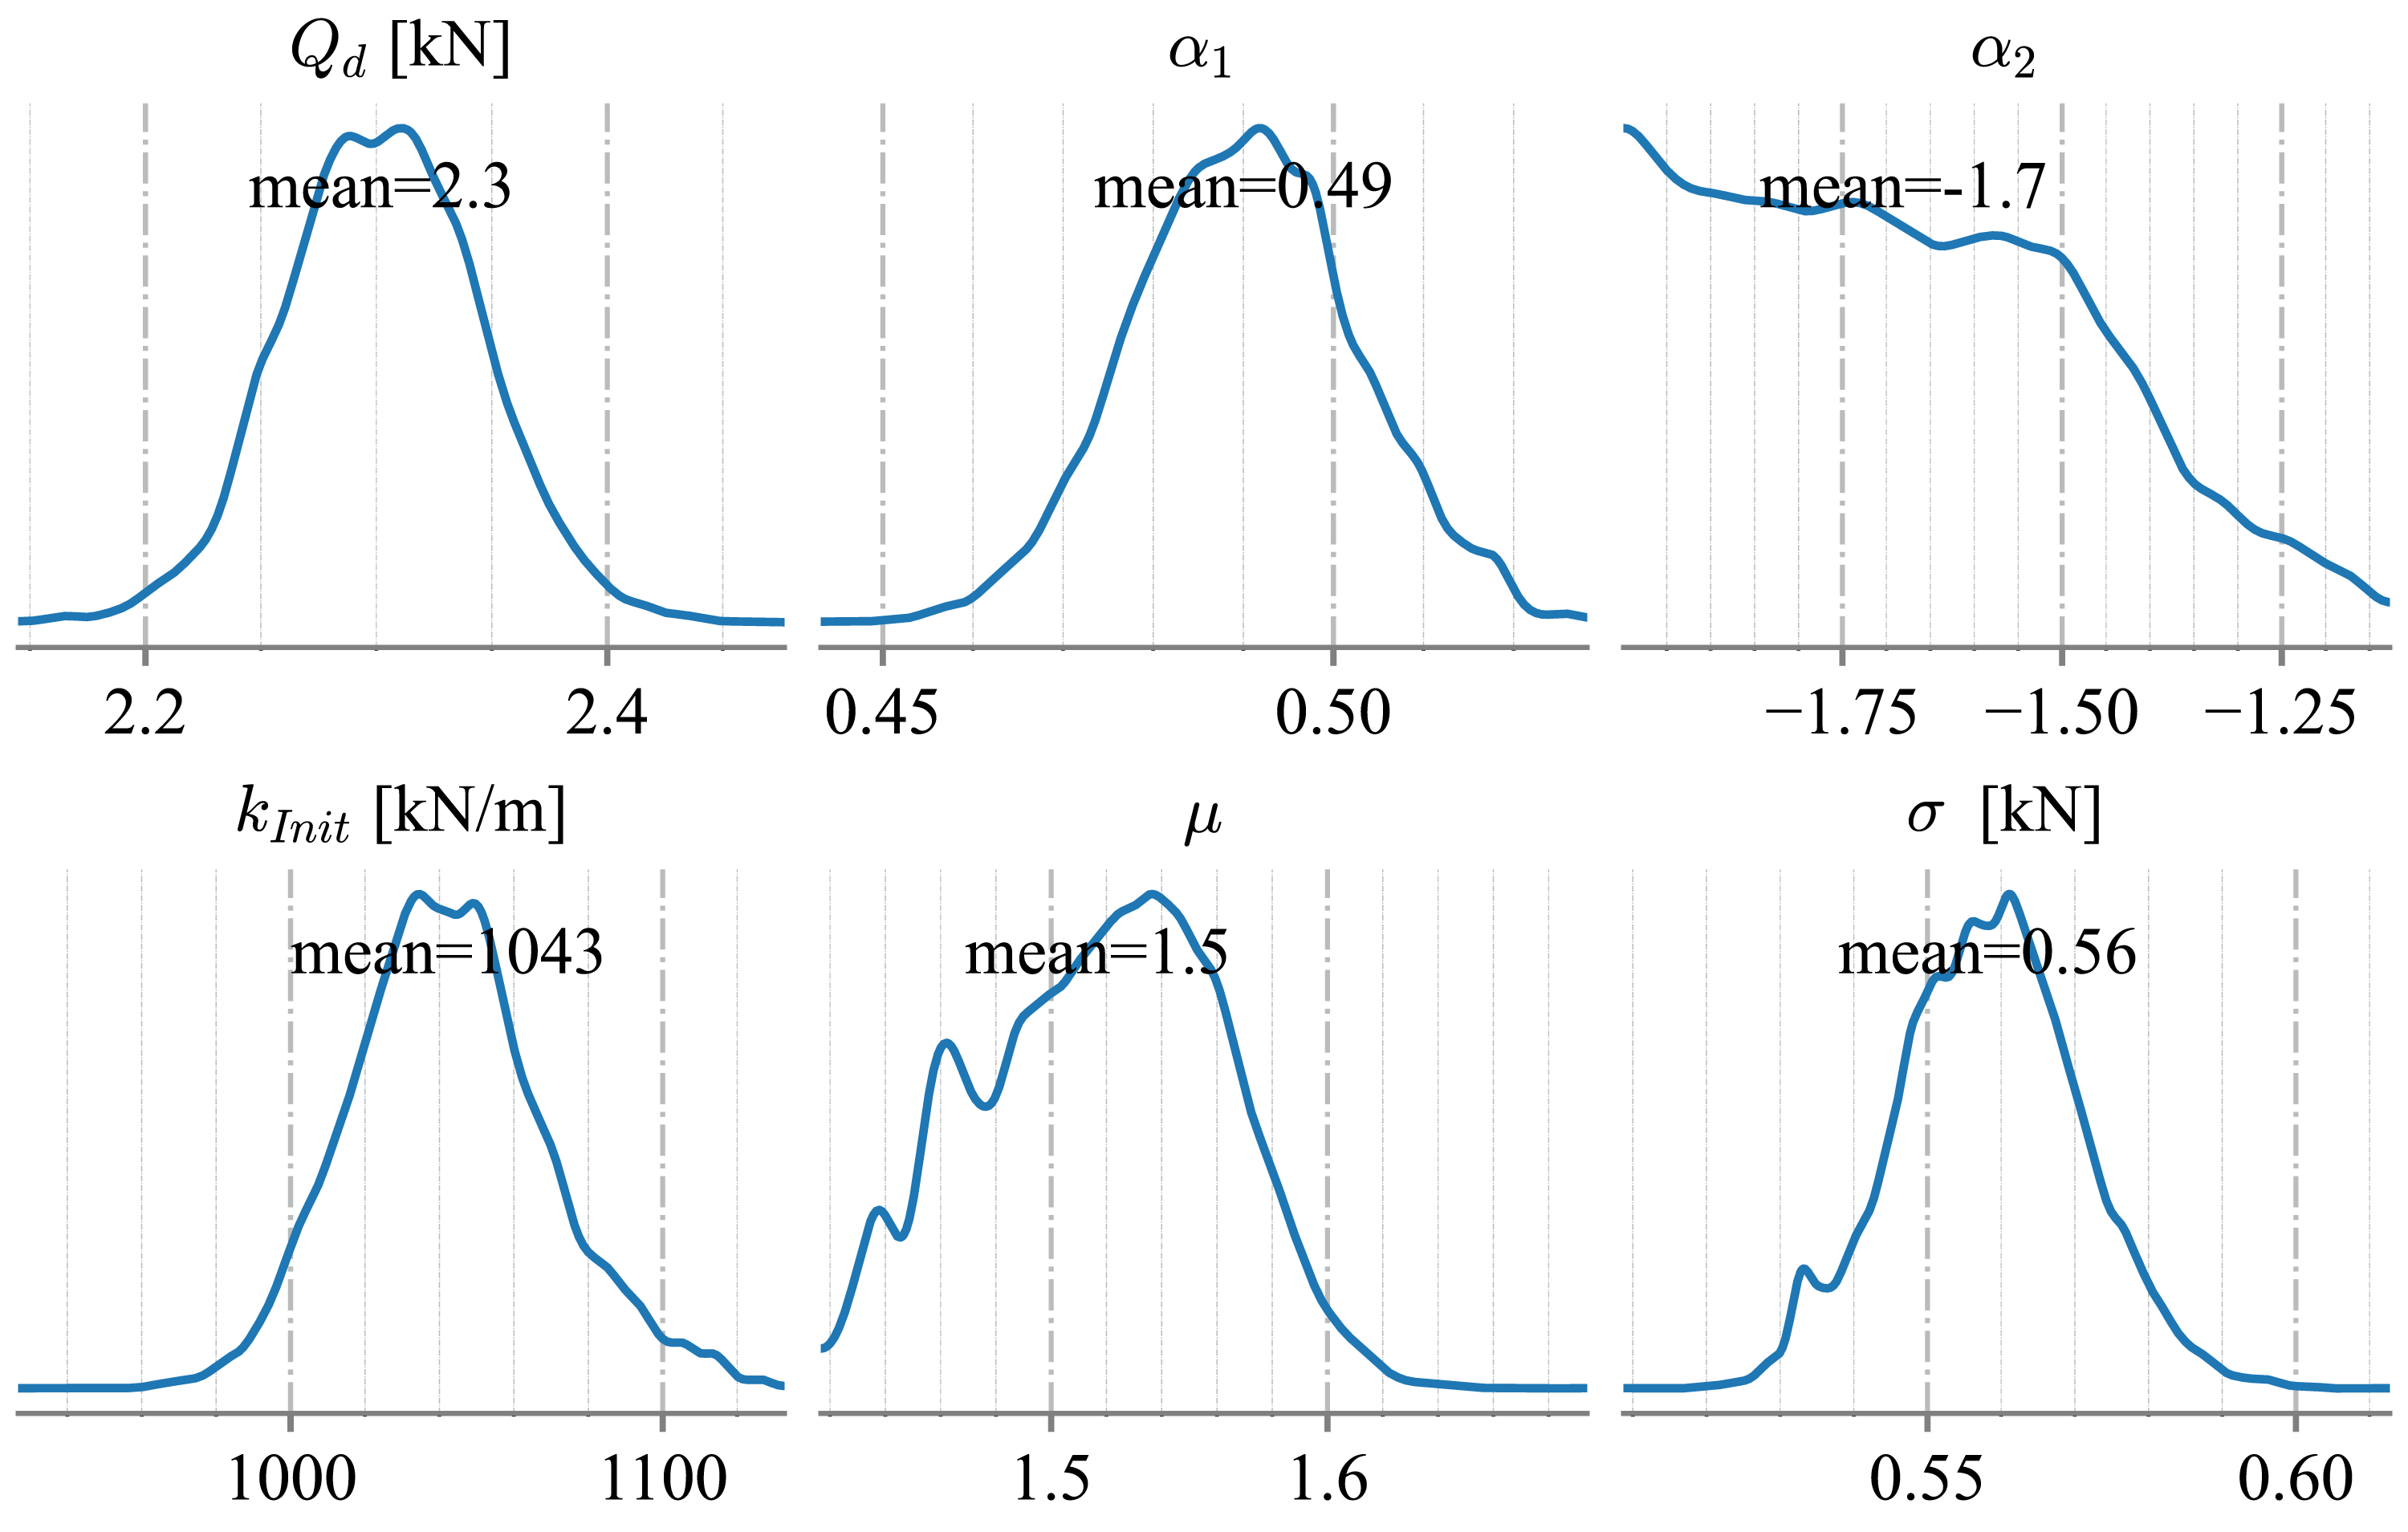
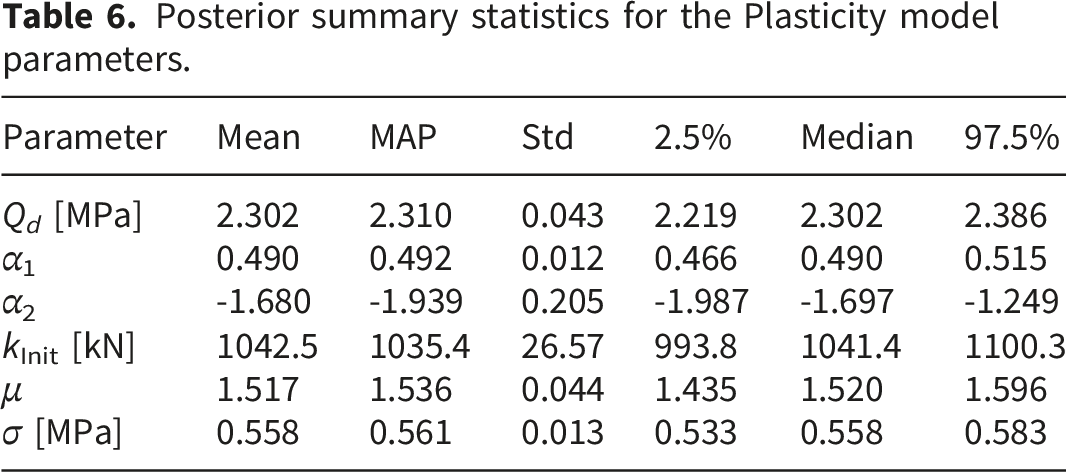
Figure 9 validates the Plasticity model’s performance and quantifies its uncertainty. The PPC shows that the MAP prediction captures the overall shape of the experimental hysteresis. The 95% credible interval envelops the observed response, although slight deviations are observed at larger displacement amplitudes. This suggests the model captures well the initial stiffness but may have limited flexibility in reproducing subtle degradation effects. Posterior predictive check for the Plasticity model.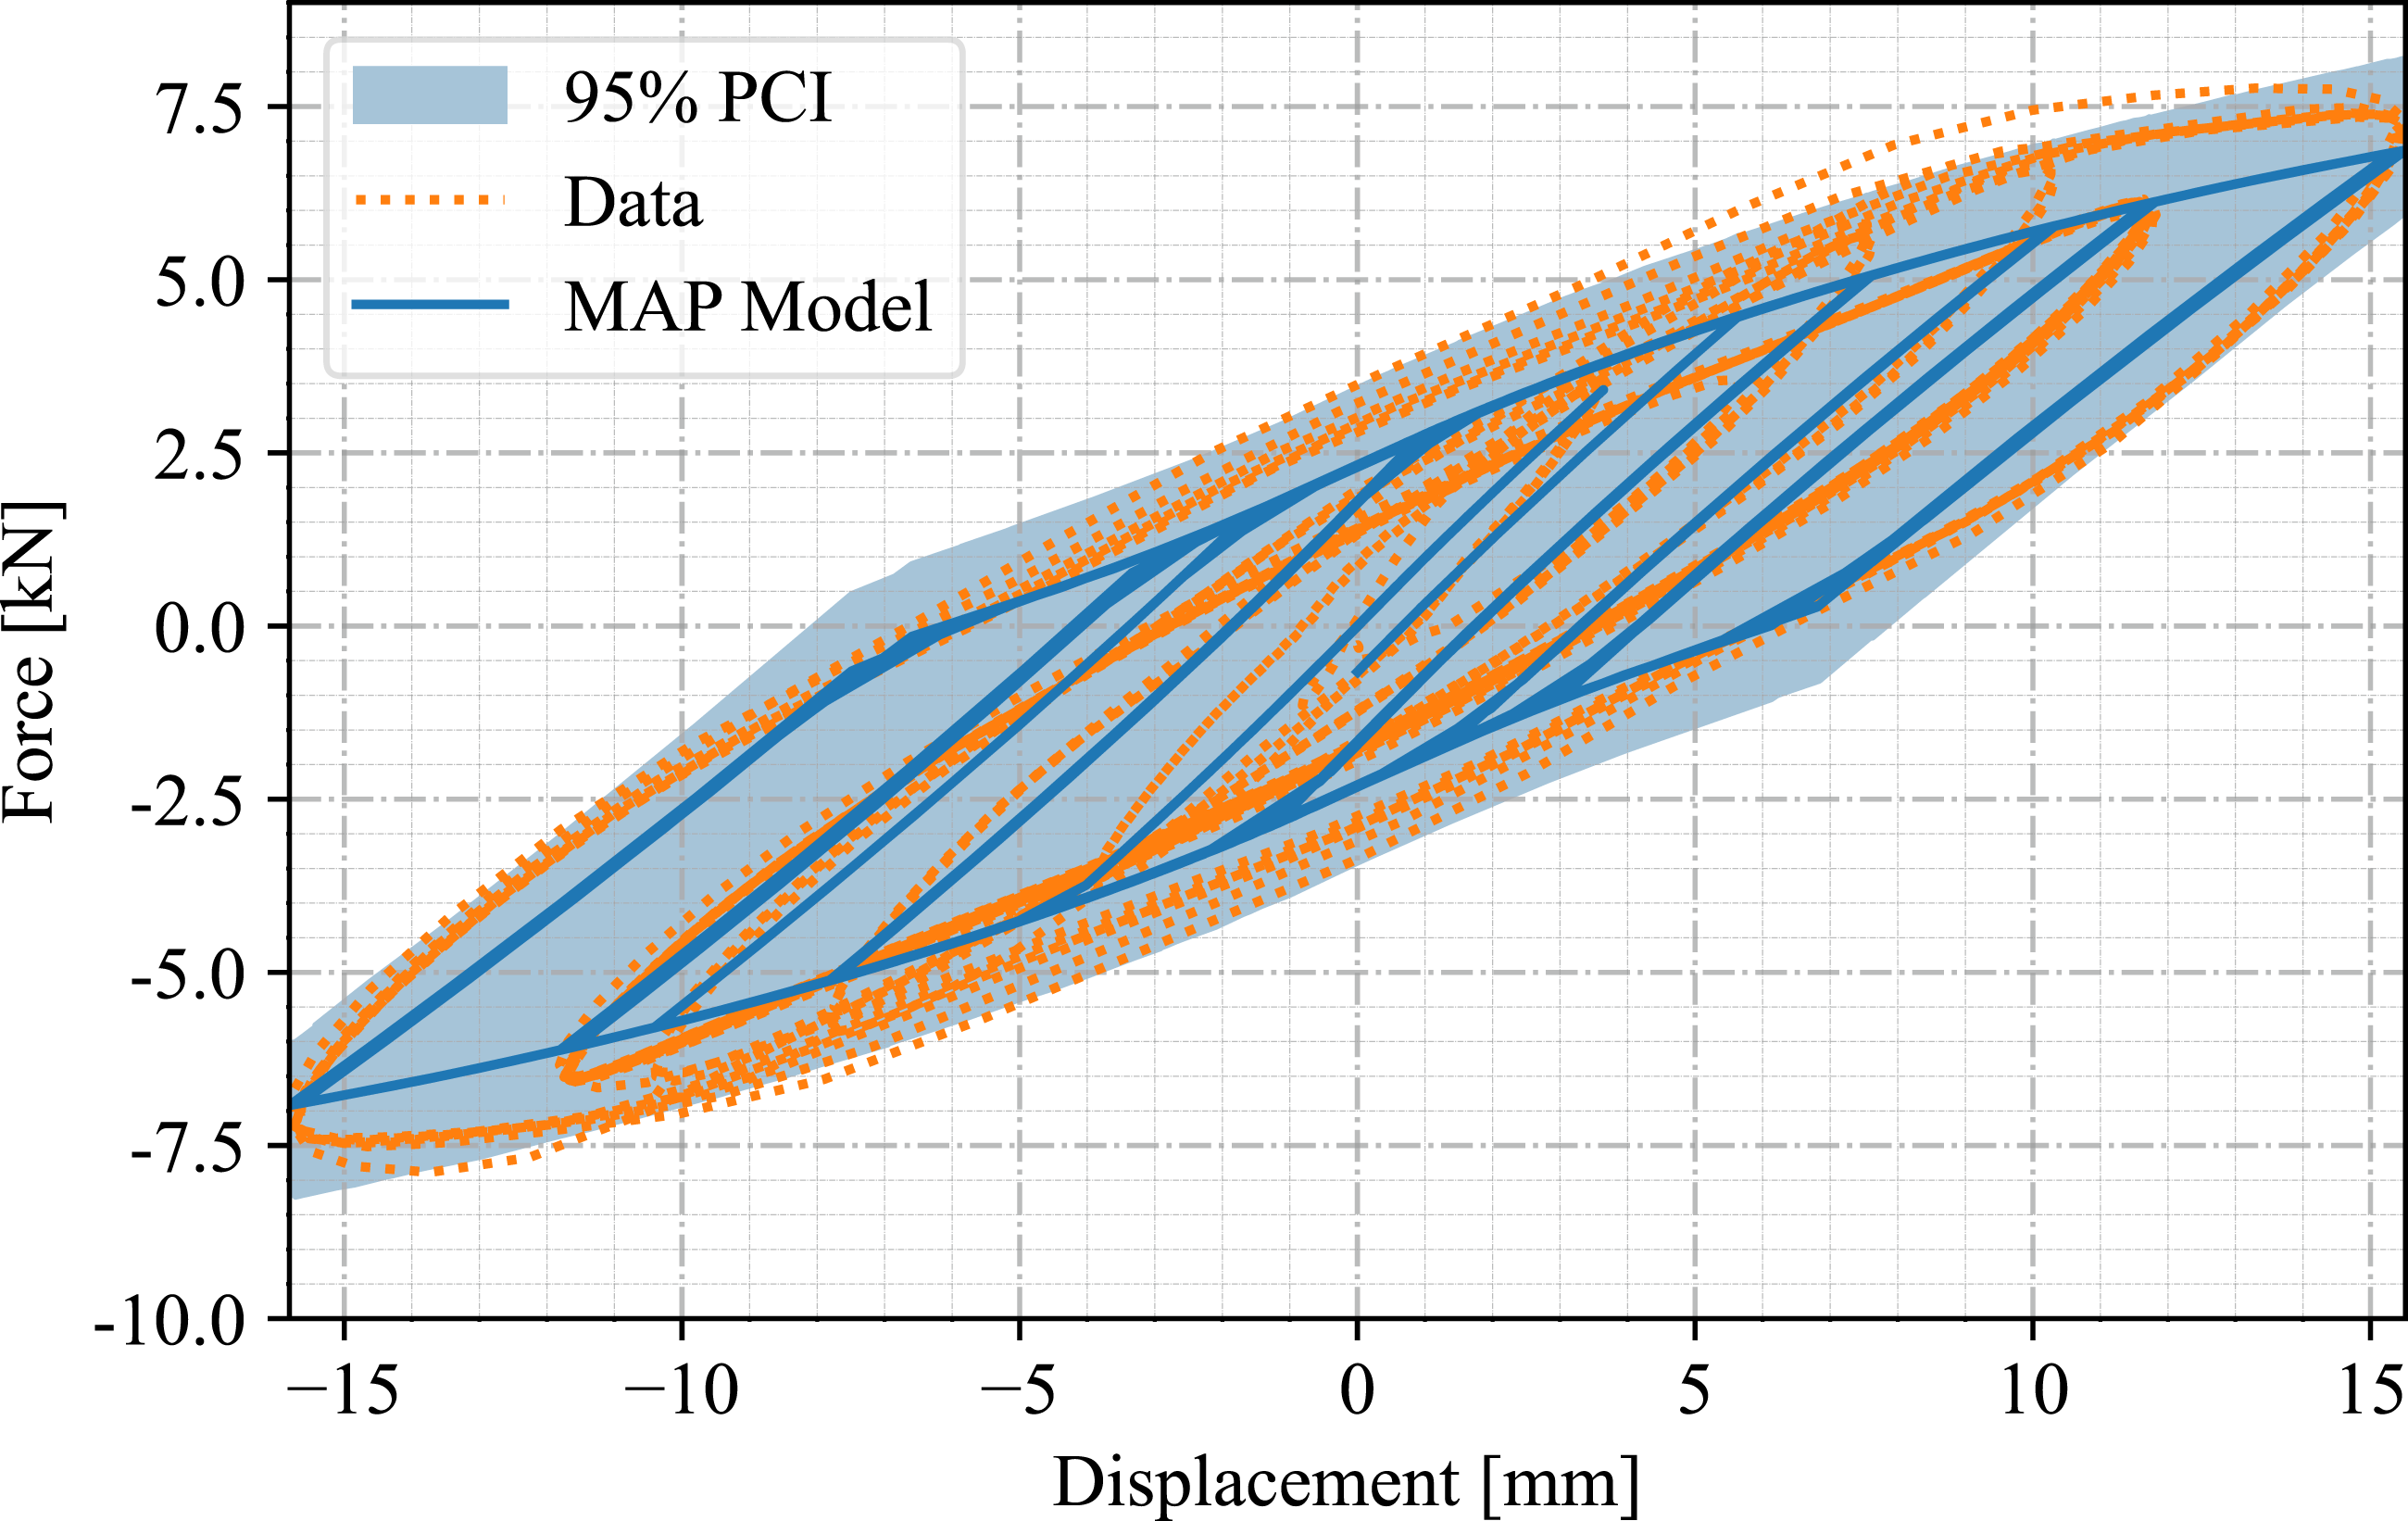
5.2. Elastomeric bearing — Bouc-Wen
Figure 10 shows the posterior distributions of the Bouc-Wen model parameters. The initial stiffness kInit, characteristic strength Q
d
, and shape parameters β, η, and γ display moderate dispersion, indicating the model’s flexibility in reproducing nonlinear hysteretic responses. The posterior of Q
d
has a wider spread compared to the Plasticity model, suggesting greater uncertainty in identifying this parameter. The parameters α1 and μ are relatively well-constrained. Table 7 summarizes the posterior statistics, highlighting the flexibility of the Bouc-Wen element to represent nonlinear behavior through its extended set of parameters. Posterior distributions of the calibrated parameters for the Bouc-Wen model. Posterior summary statistics for the Bouc-Wen model parameters.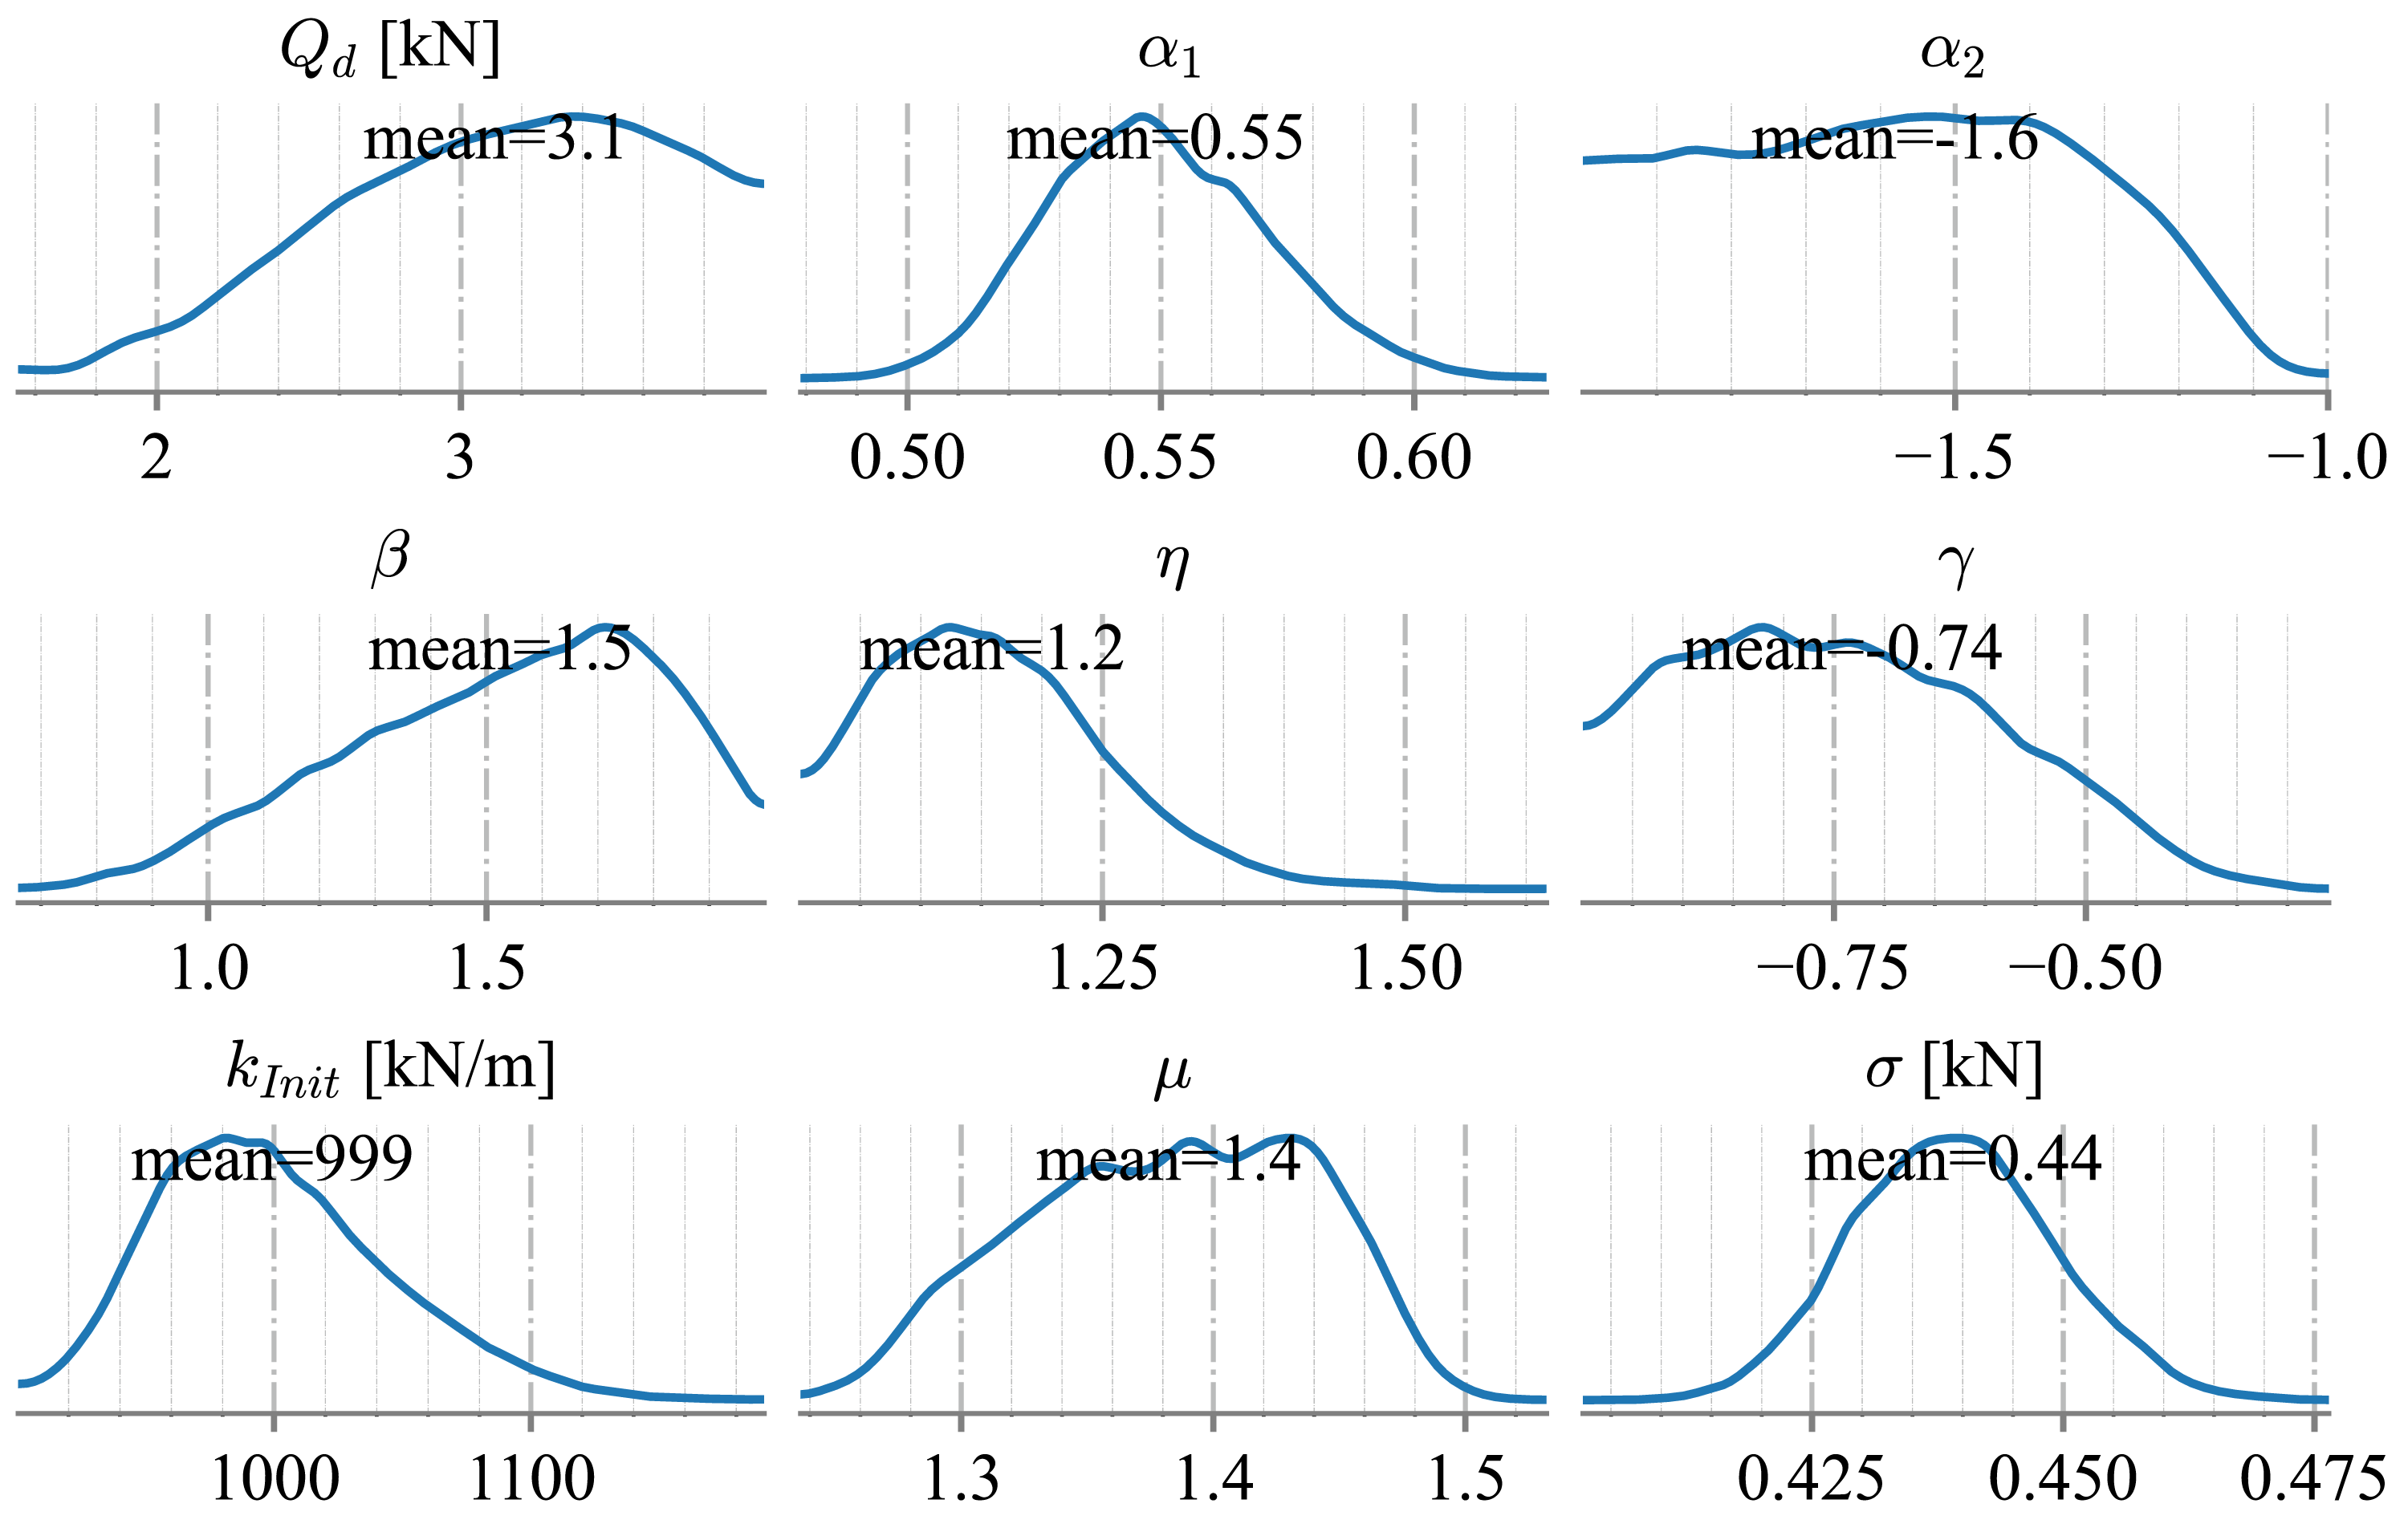
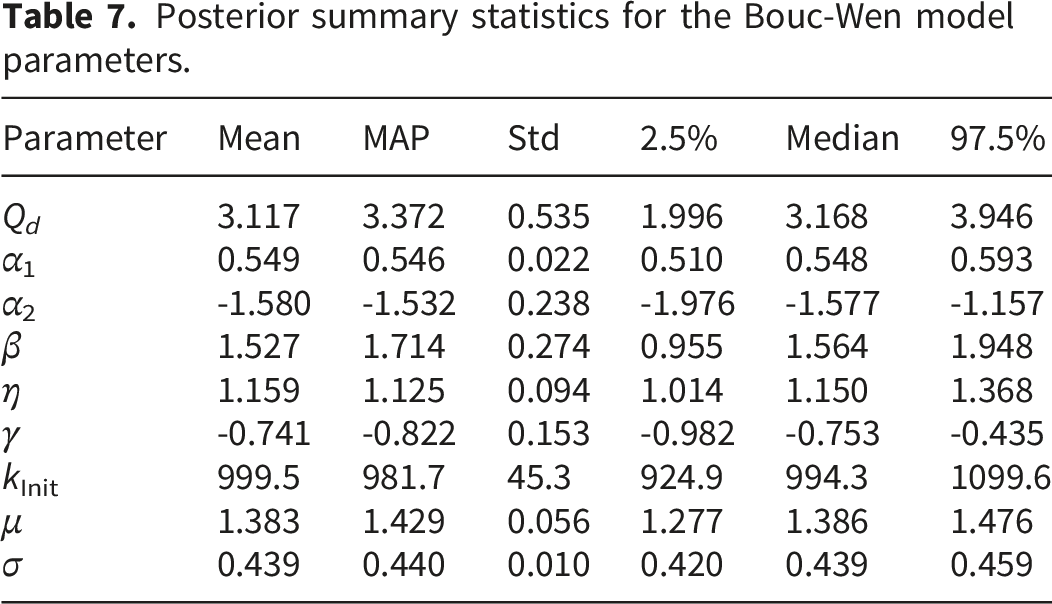
Figure 11 validates the Bouc-Wen model’s performance and quantifies its uncertainty. The results demonstrate that the model effectively captures the shape and amplitude of the experimental hysteresis loops. All observed cycles lie within the 95% posterior credible interval, indicating strong agreement. The inclusion of Bouc-Wen parameters provides greater flexibility, as seen in the accurate tracking of pinching, stiffness degradation, and energy dissipation patterns. Posterior predictive check for the Bouc-Wen model.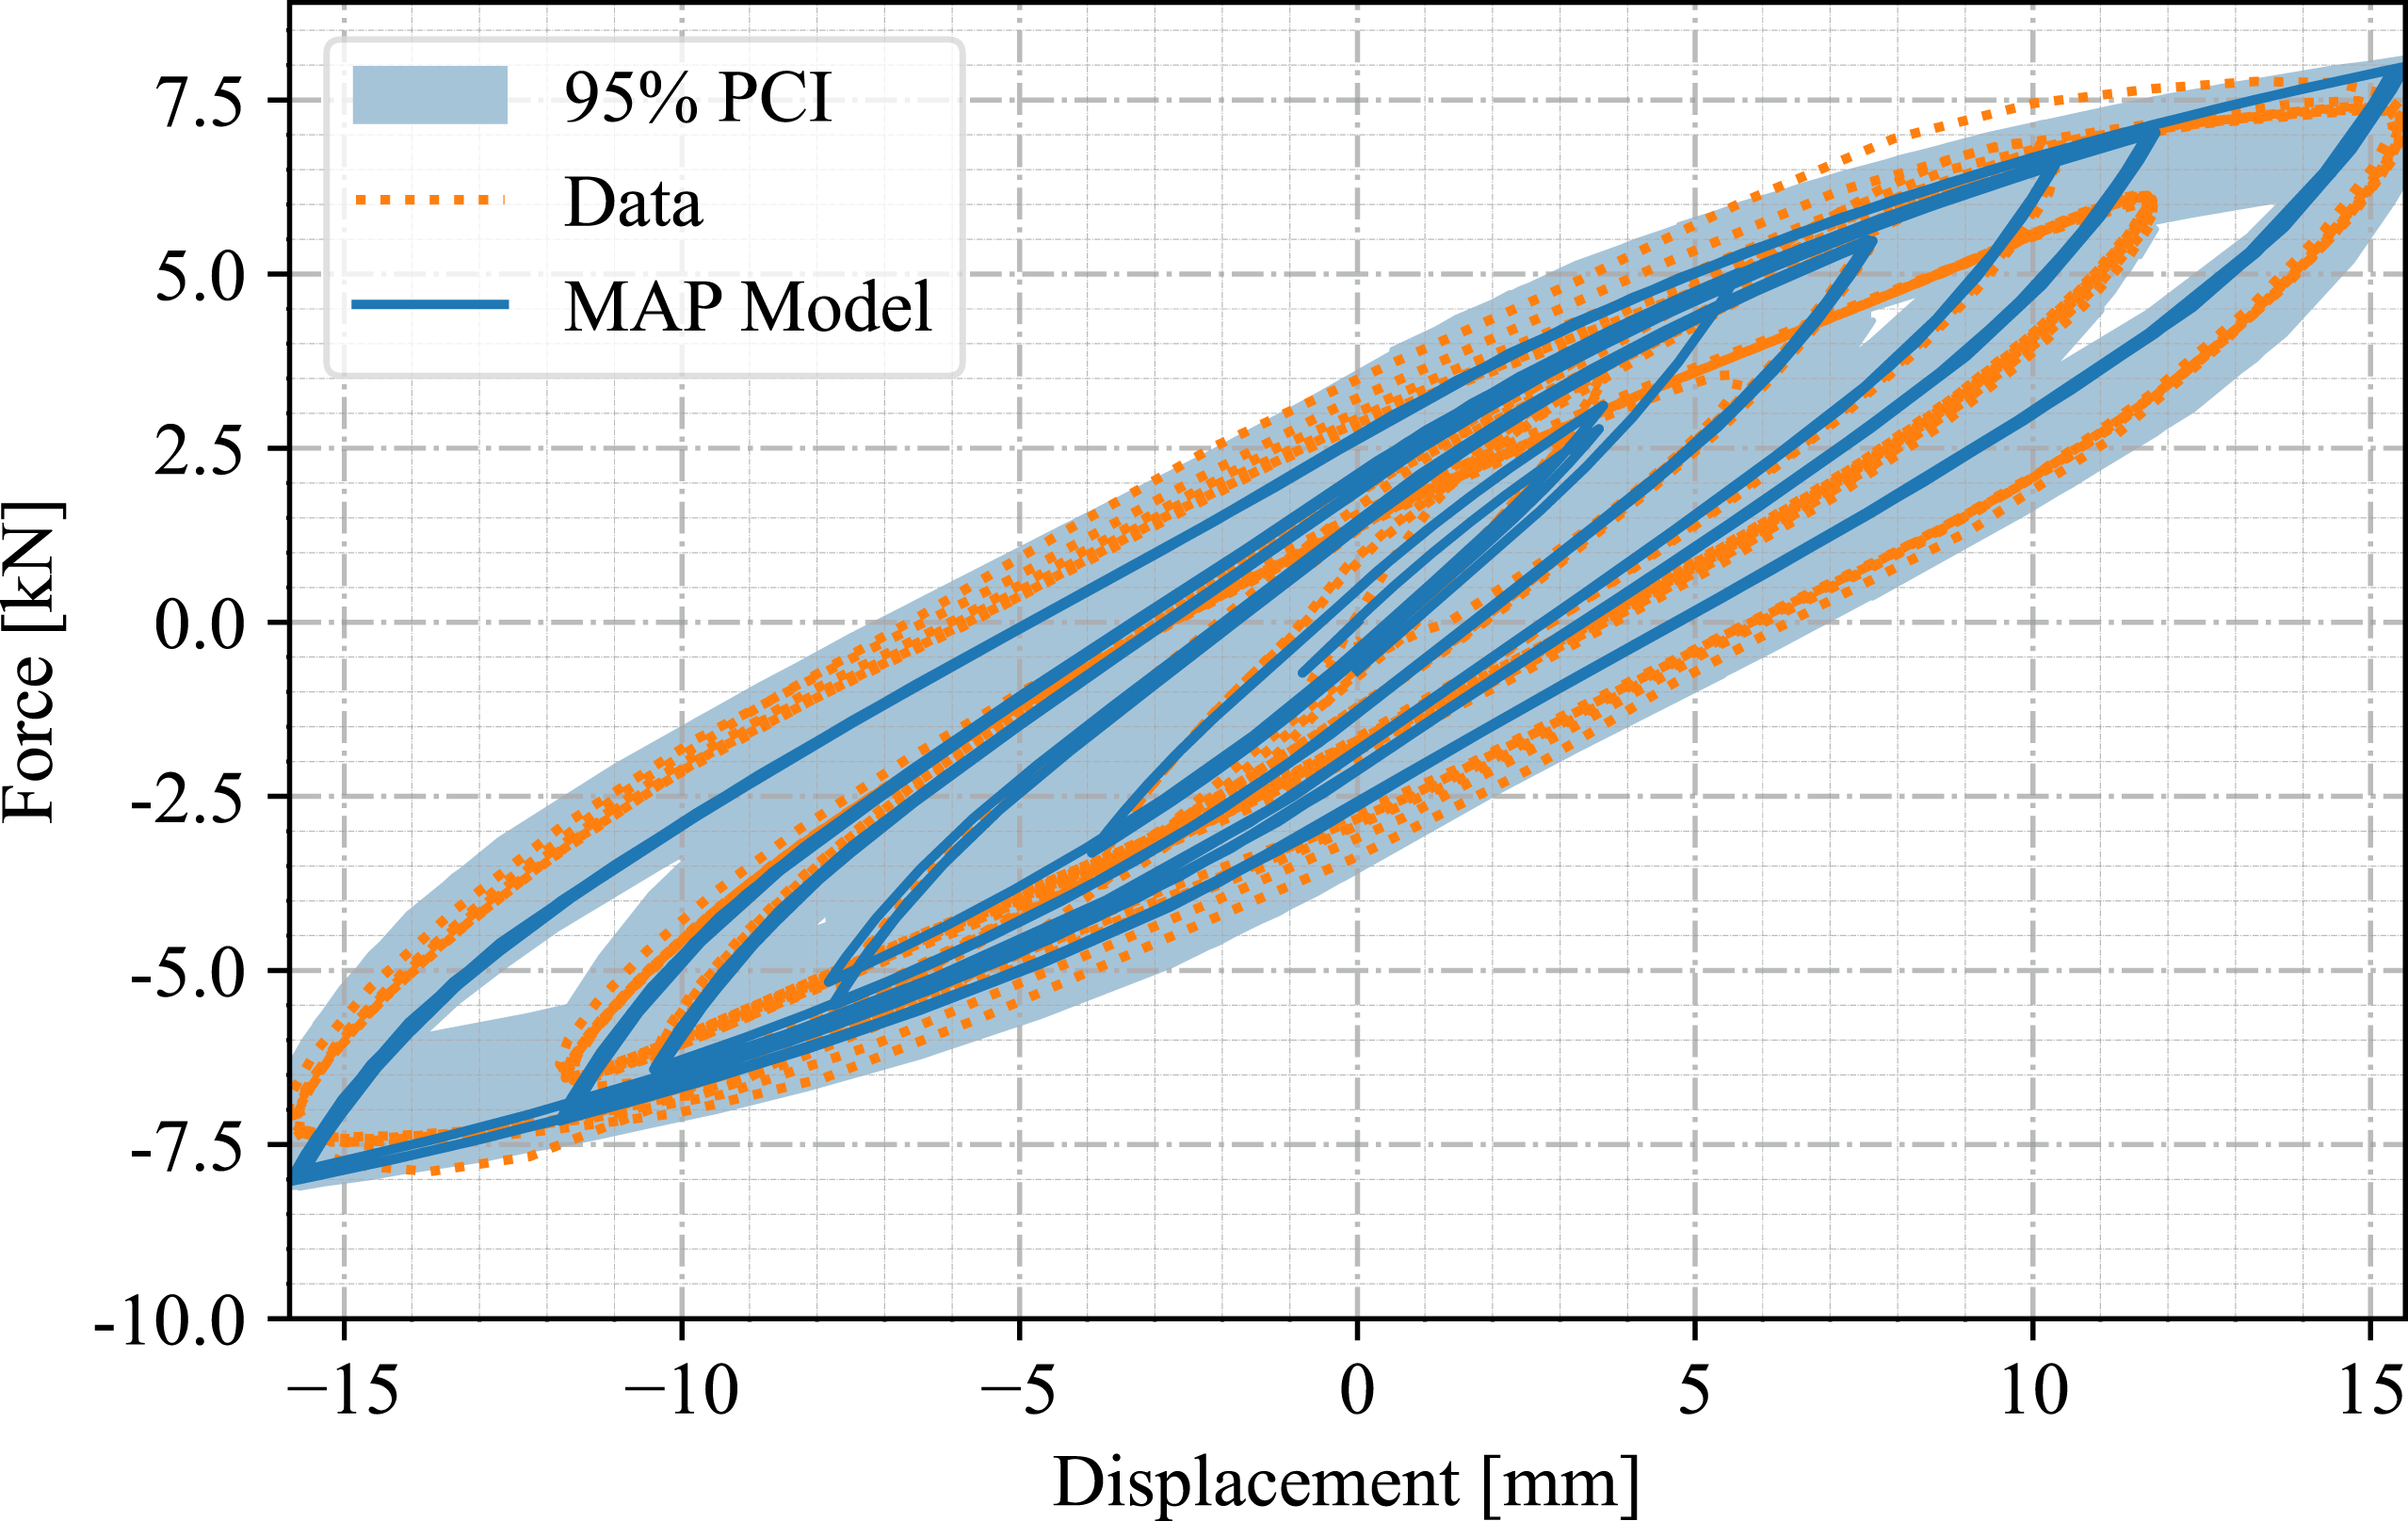
5.3. ElastomericX element
The posterior distributions of the parameters for the ElastomericX model are shown in Figure 12. The yield force F
y
, shear modulus G
r
, and post-yield stiffness ratio α exhibit narrow distributions, indicating good parameter identifiability. Notably, G
r
is concentrated around 1.93 MPa, and F
y
centers at approximately 3.25 kN. The parameter α shows tight dispersion around 0.33. The observation noise σ also demonstrates low uncertainty, with a mean of 0.51 kN. Table 8 summarizes the posterior statistics for each parameter, including the mean, MAP estimate, standard deviation, and 95% credible interval. Posterior distributions of the calibrated parameters for the ElastomericX model. Posterior predictive check for the ElastomericX model.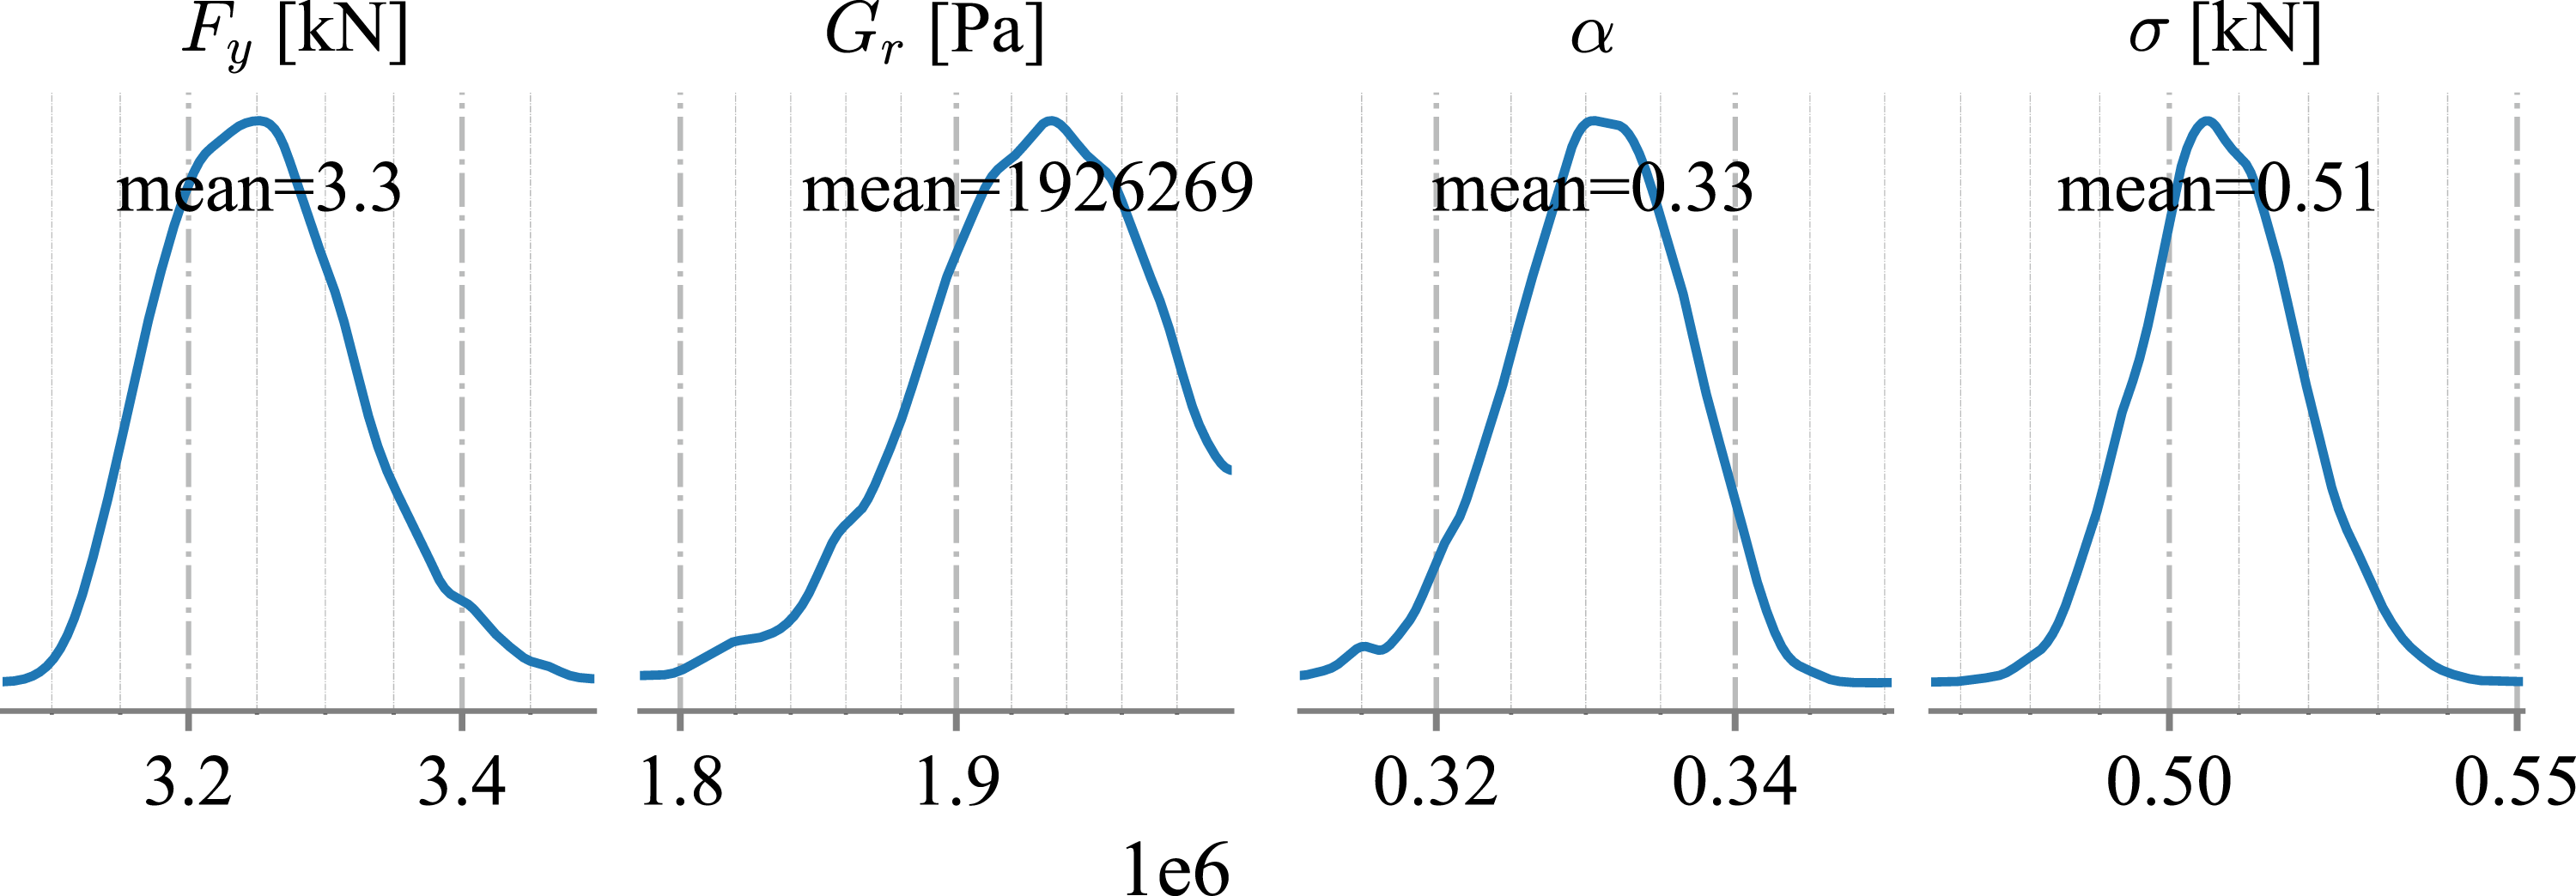
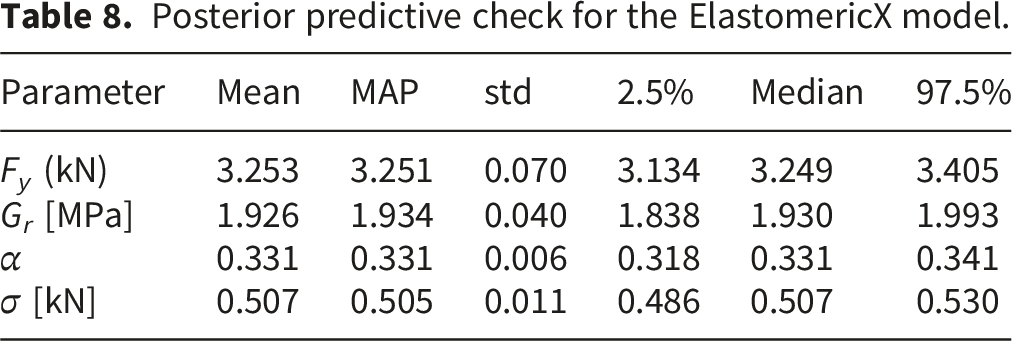
Figure 13 validates the ElastomericX model’s performance and quantifies its uncertainty. The MAP prediction reproduces the general hysteretic behavior. However, some cycles of the experimental response fall outside the 95% credible interval, particularly at larger displacements. This suggests that although the model effectively captures stiffness and overall energy dissipation, it may have limitations in representing local nonlinearities or degradation behavior. Posterior predictive check for the ElastomericX model.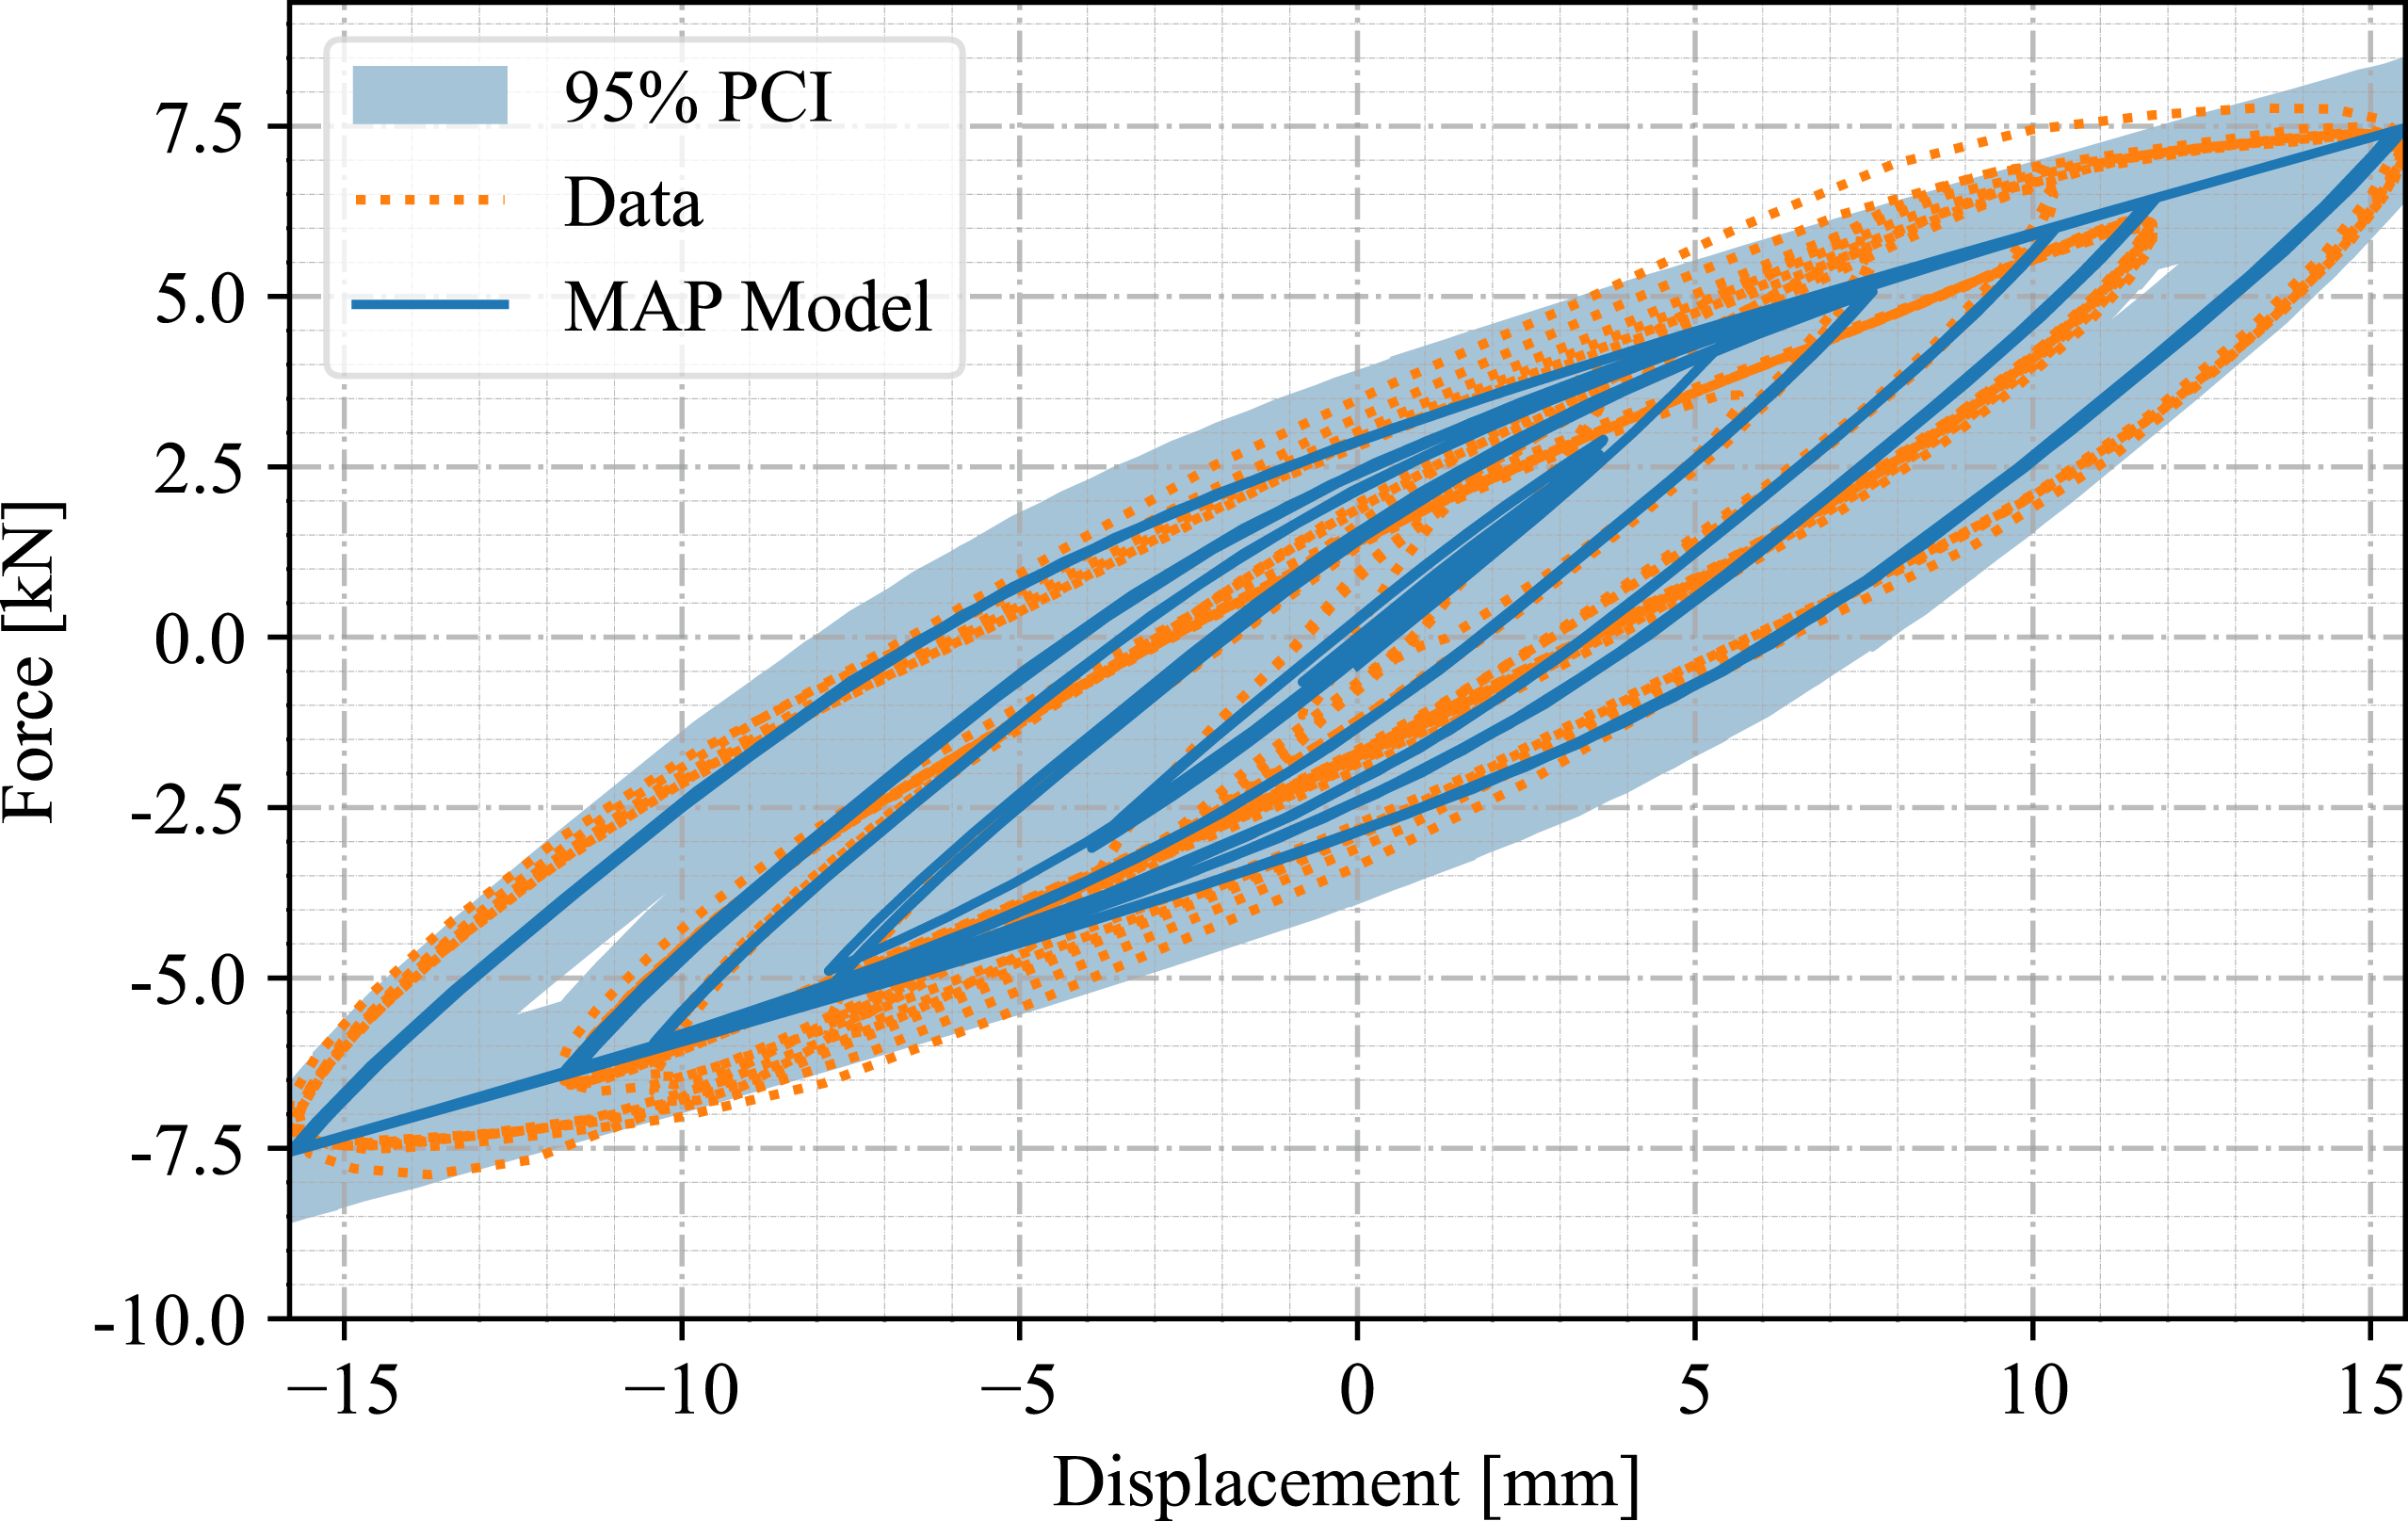
5.4. HDR element
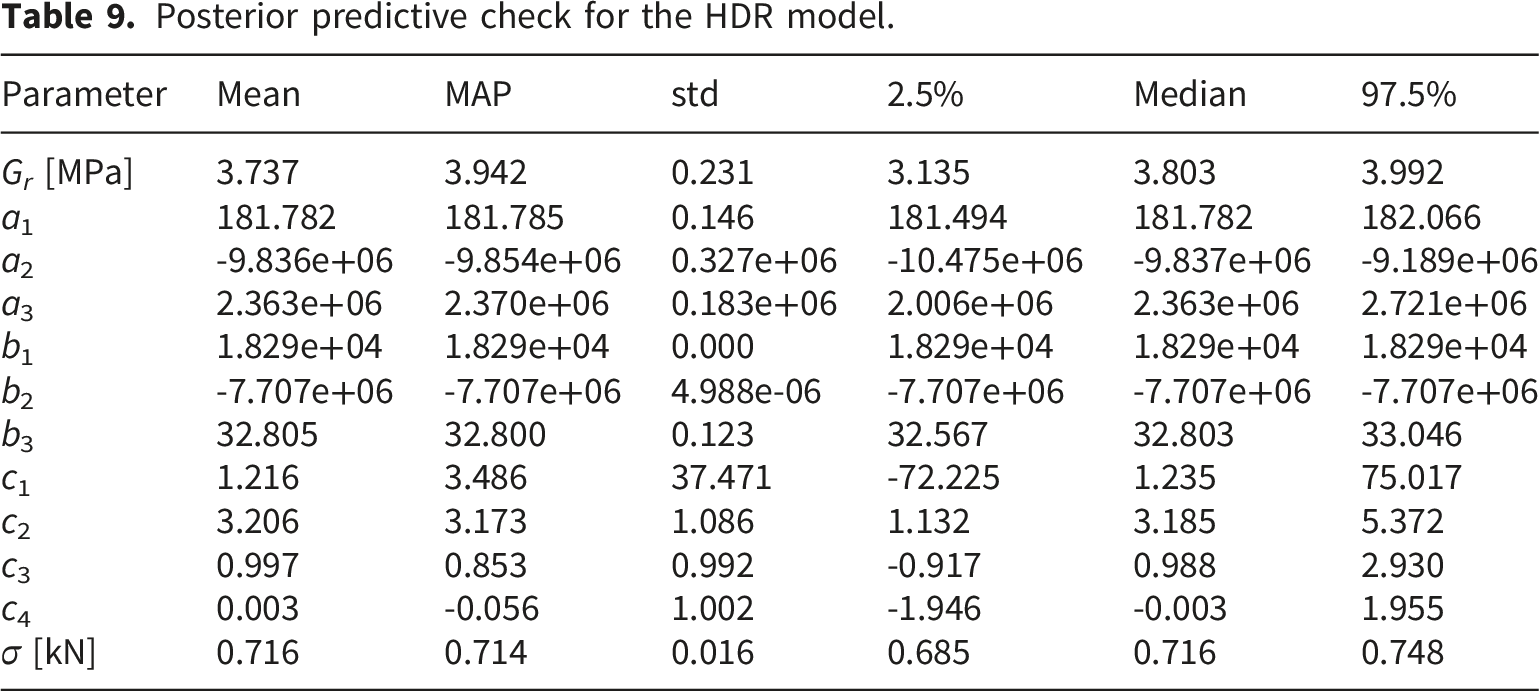
Figure 14 displays the posterior distributions of the calibrated parameters for the HDR element, including the shear modulus (G
r
), elastic coefficients (a1, a2, a3), inelastic coefficients (b1, b2, b3), degradation parameters (c1, c2, c3, c4), and error term (σ). The elastic parameters (a1 to a3) show moderately narrow posteriors, indicating good identifiability. In contrast, the degradation parameters (c1 to c4) exhibit greater dispersion, reflecting increased uncertainty in capturing cyclic softening effects. Posterior distributions of the calibrated parameters for the HDR model.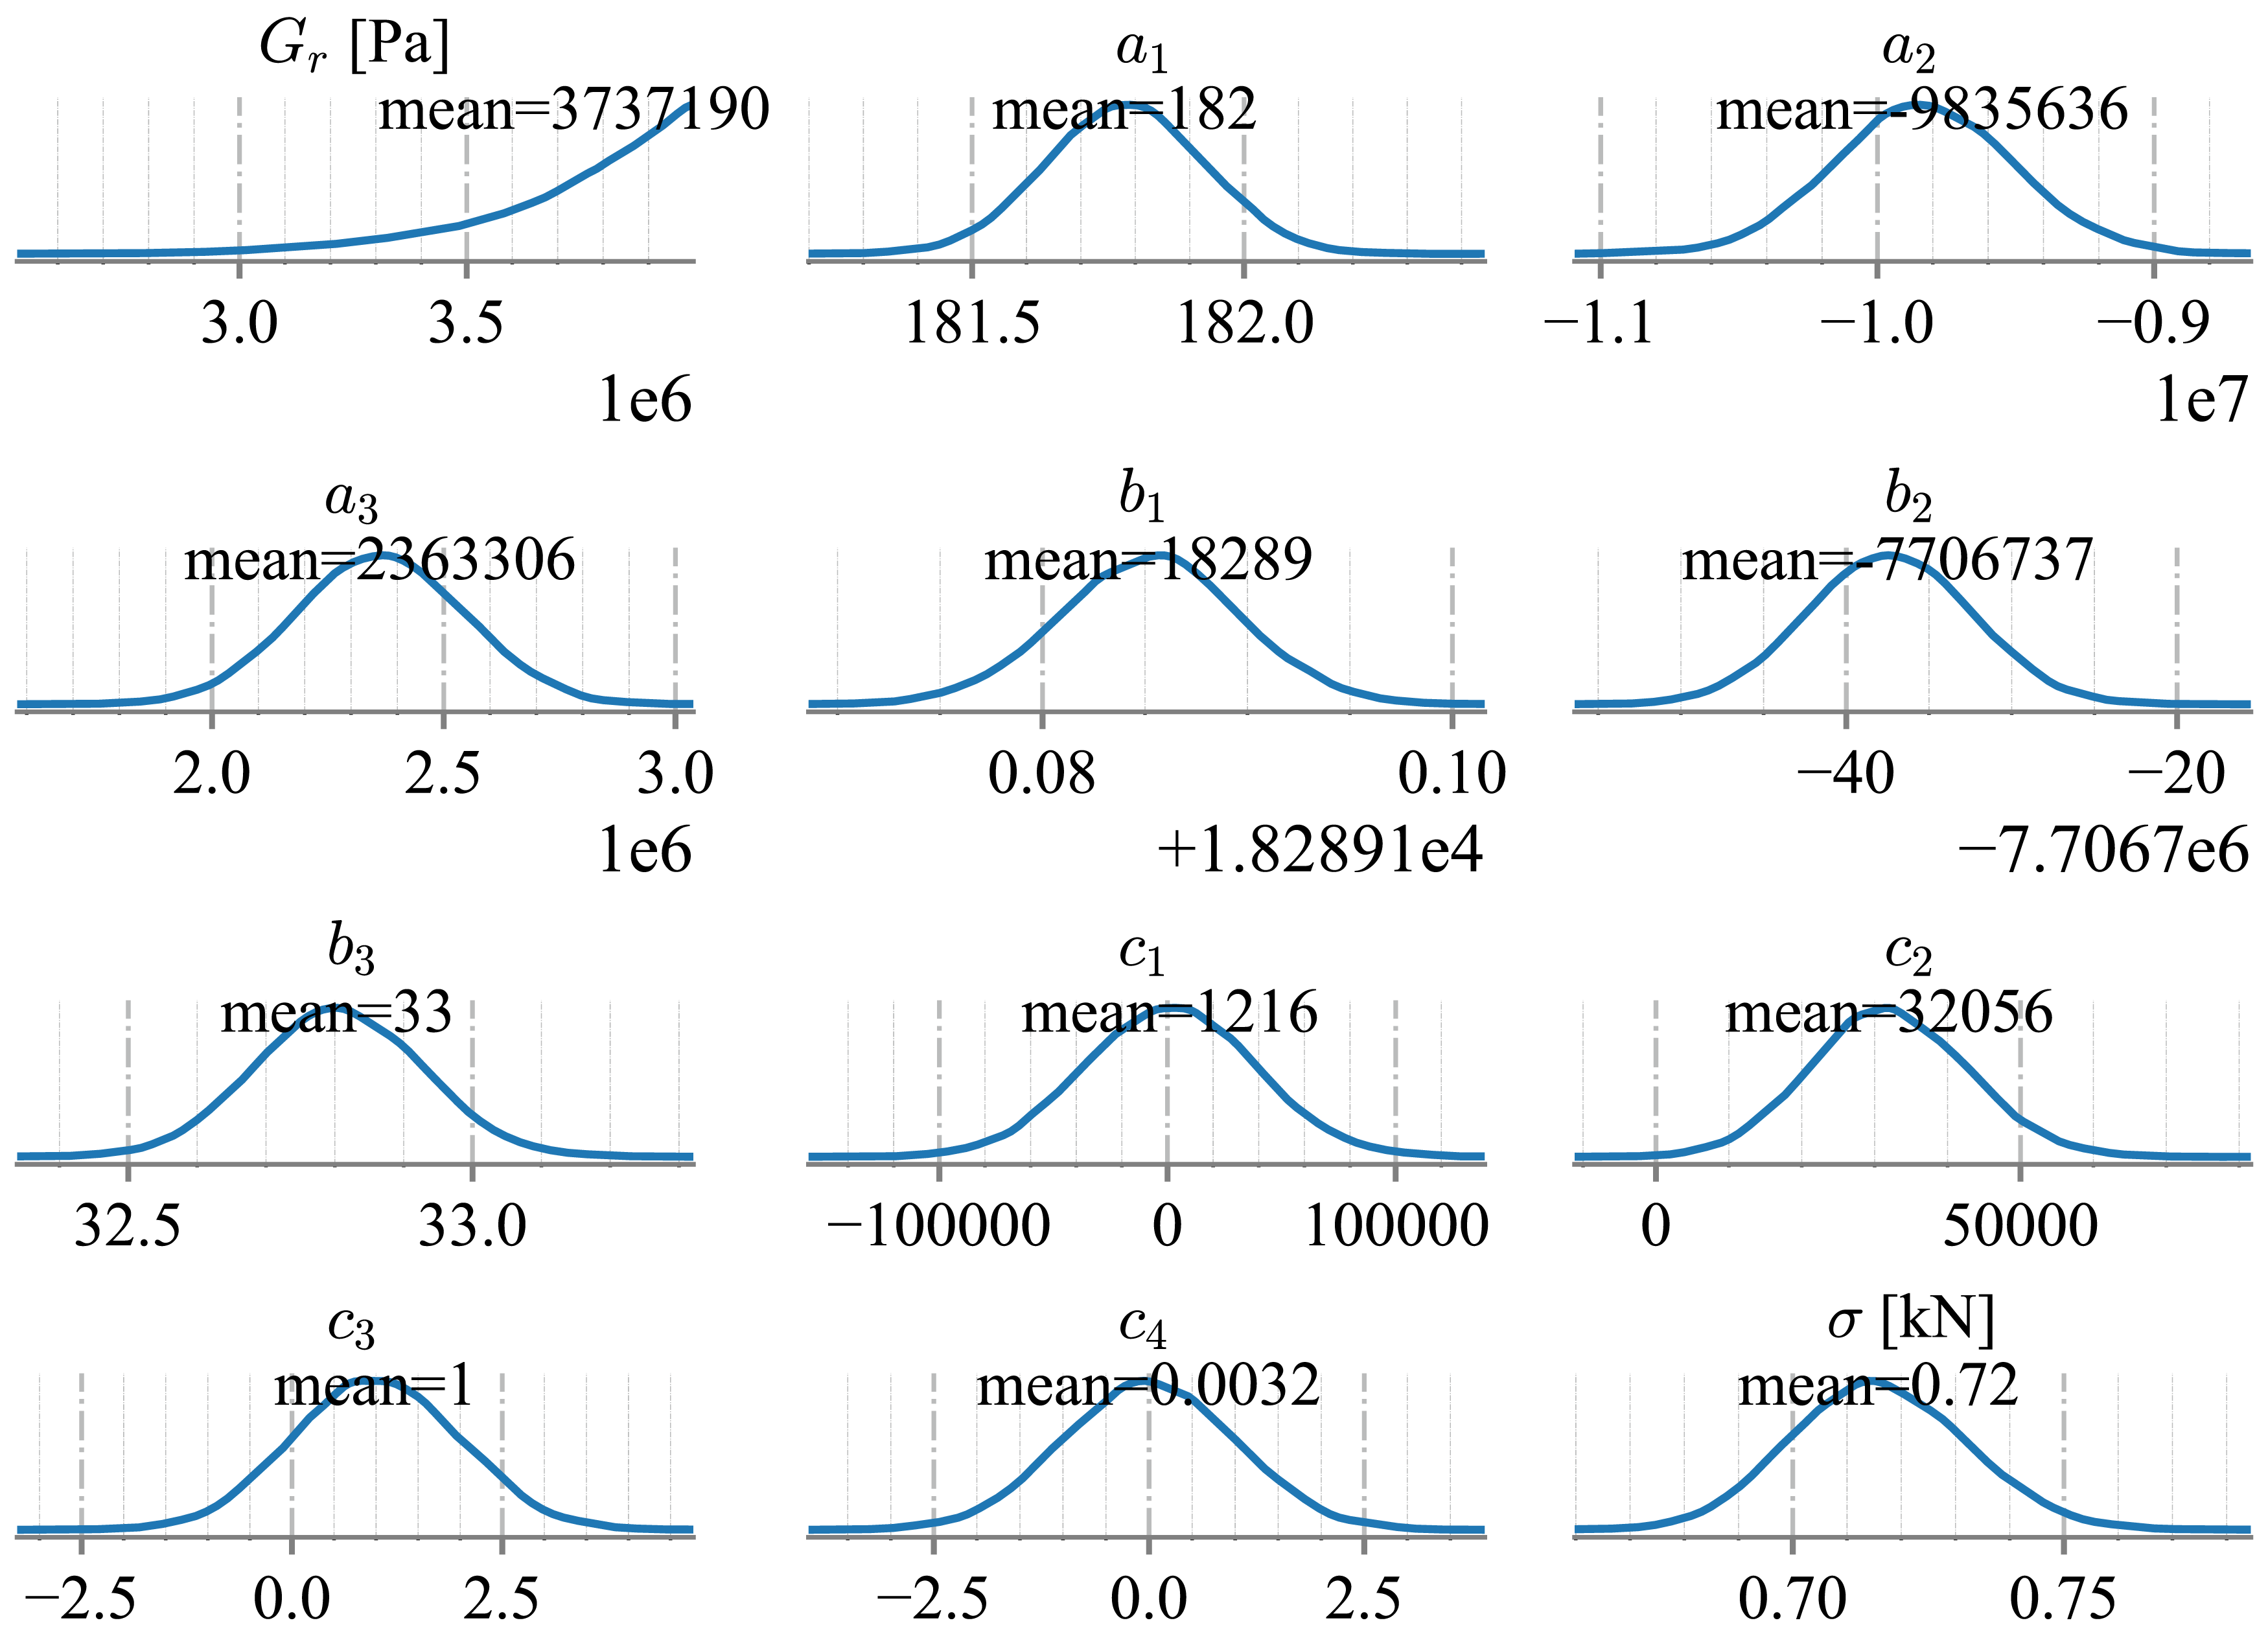
Posterior predictive check for the HDR model.
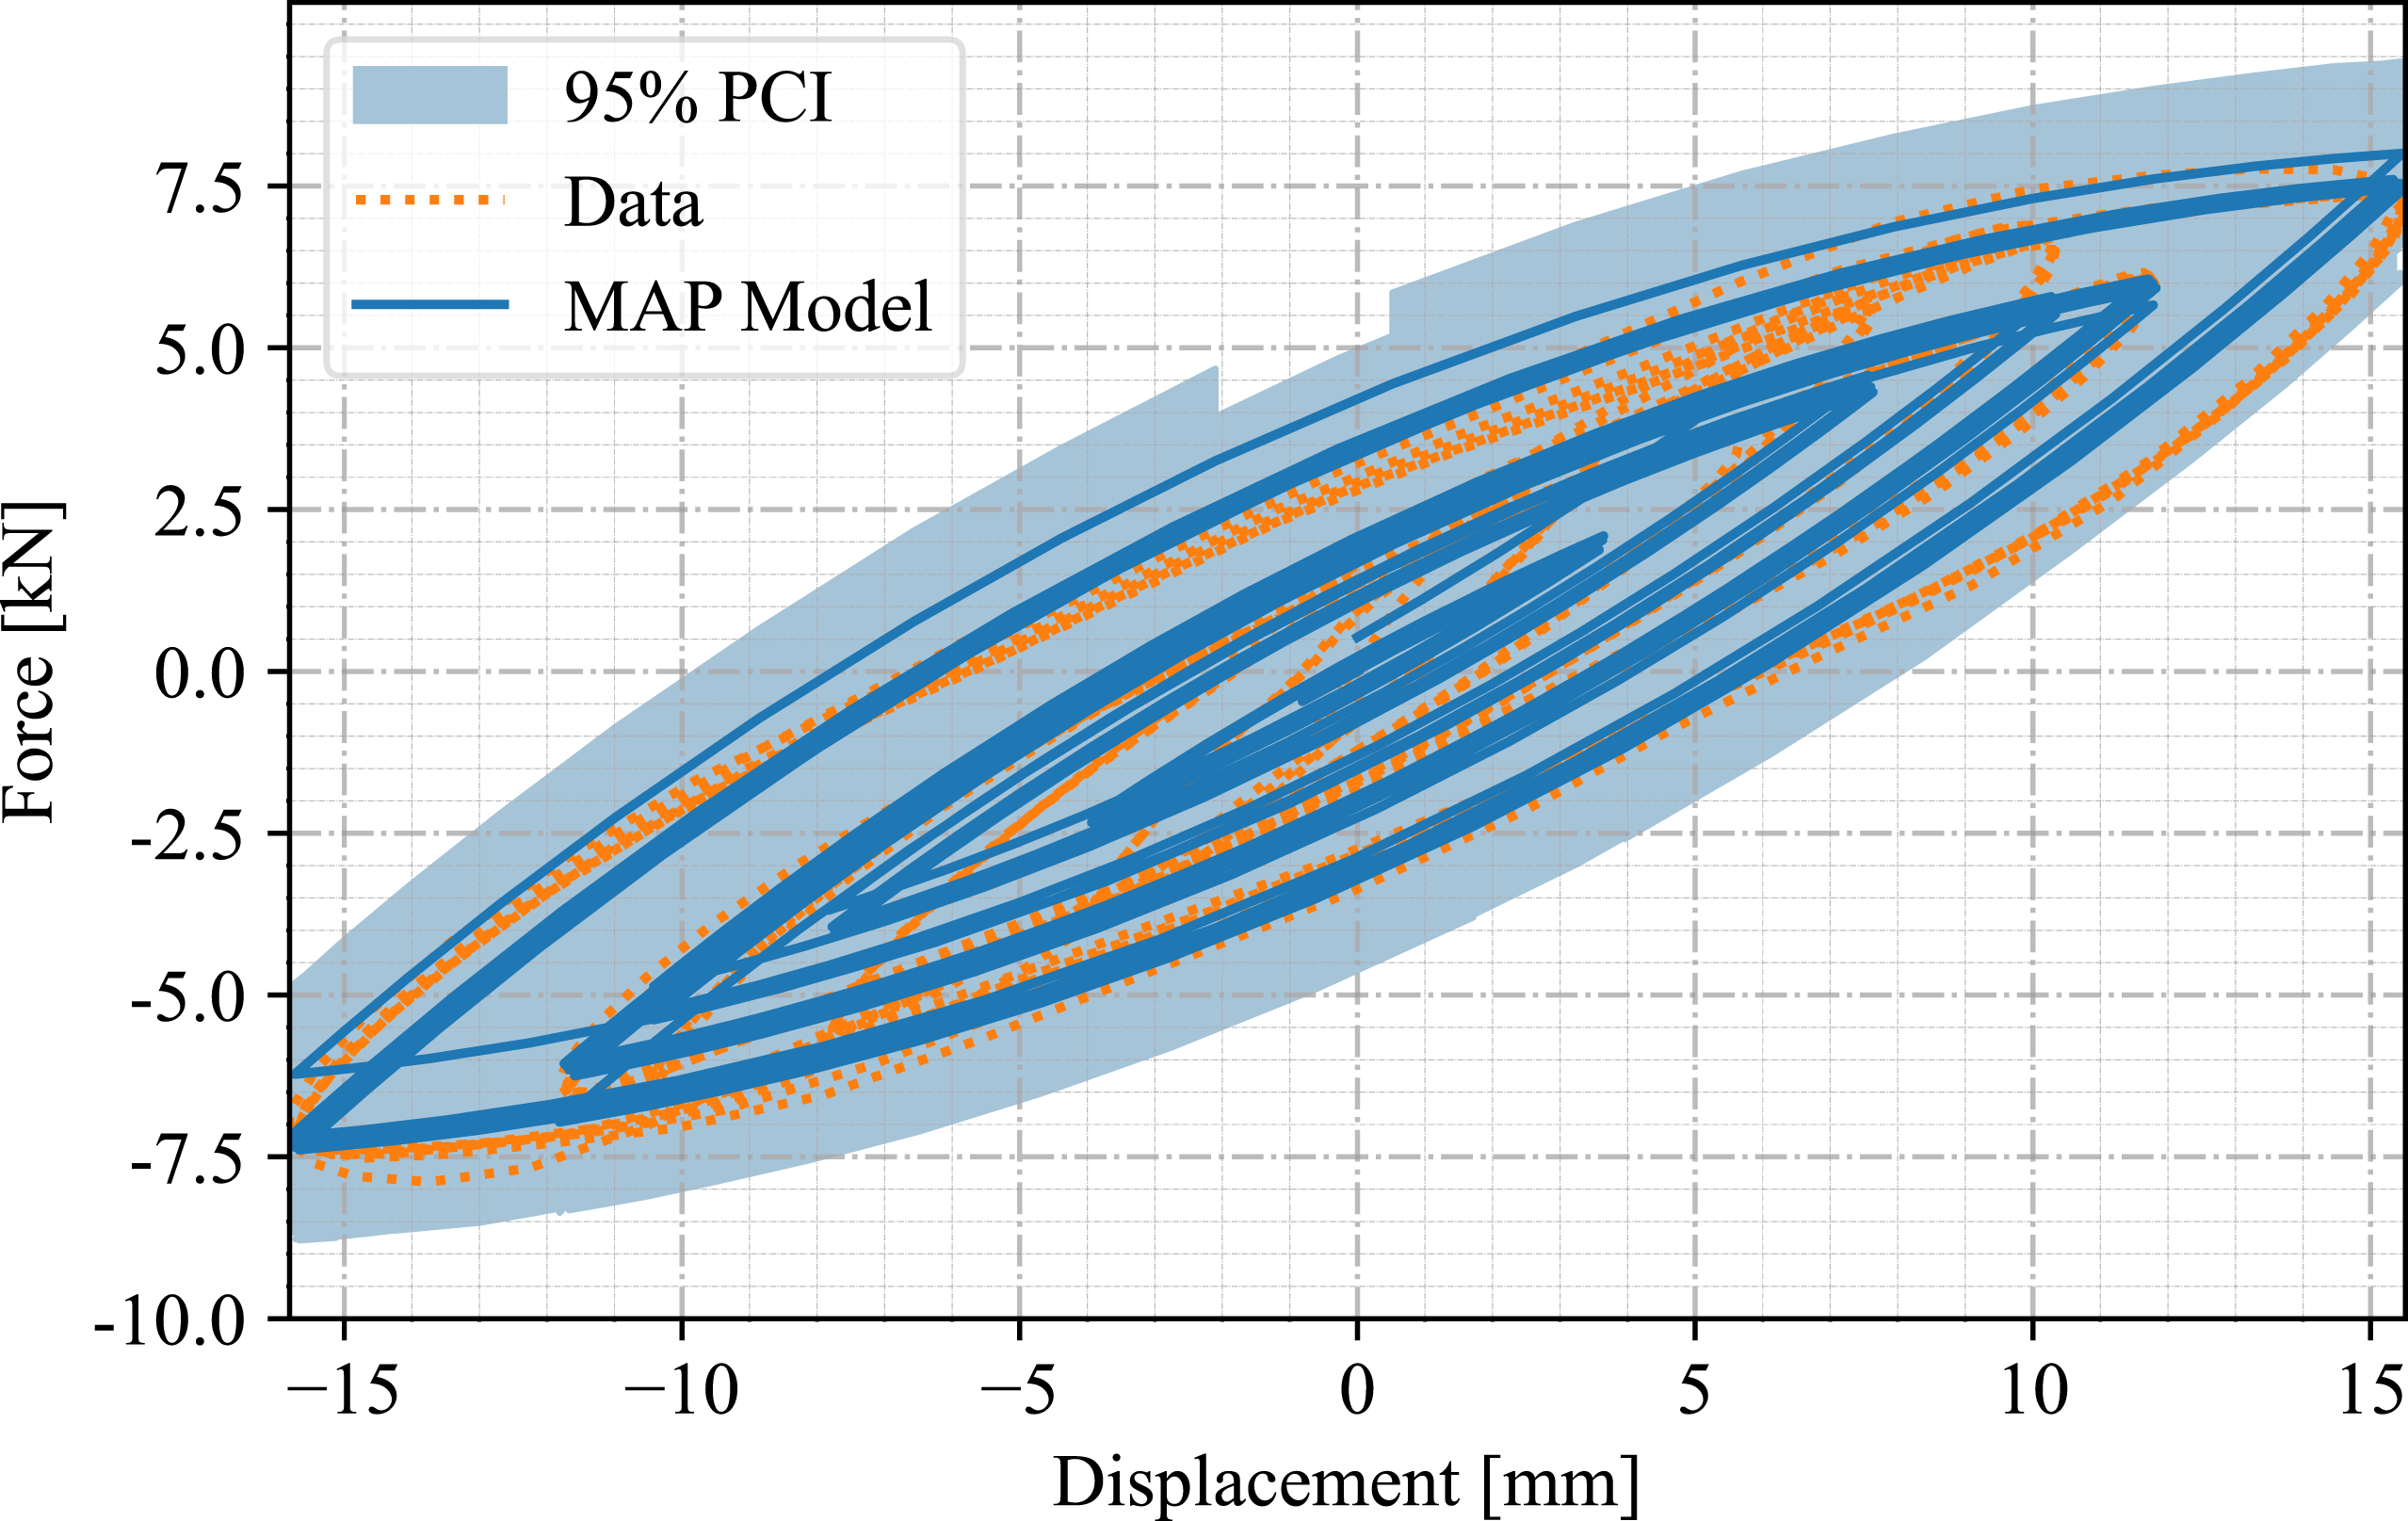
Posterior predictive check for the HDR model.
5.5. Model comparison
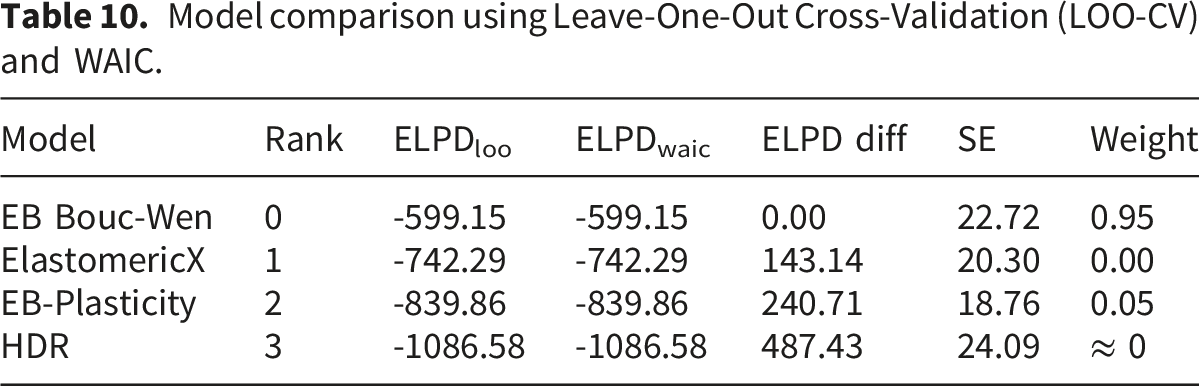
Bayesian model comparison was conducted using the WAIC and LOO-CV metrics, as introduced earlier. Both criteria quantify a model’s out-of-sample predictive accuracy while accounting for complexity, providing a principled approach to selecting among competing hysteresis models. The comparison is based on the expected log pointwise predictive density (ELPD), which summarizes how well a model is expected to predict new data. Higher ELPD values indicate better predictive performance.
Model comparison using Leave-One-Out Cross-Validation (LOO-CV) and WAIC.
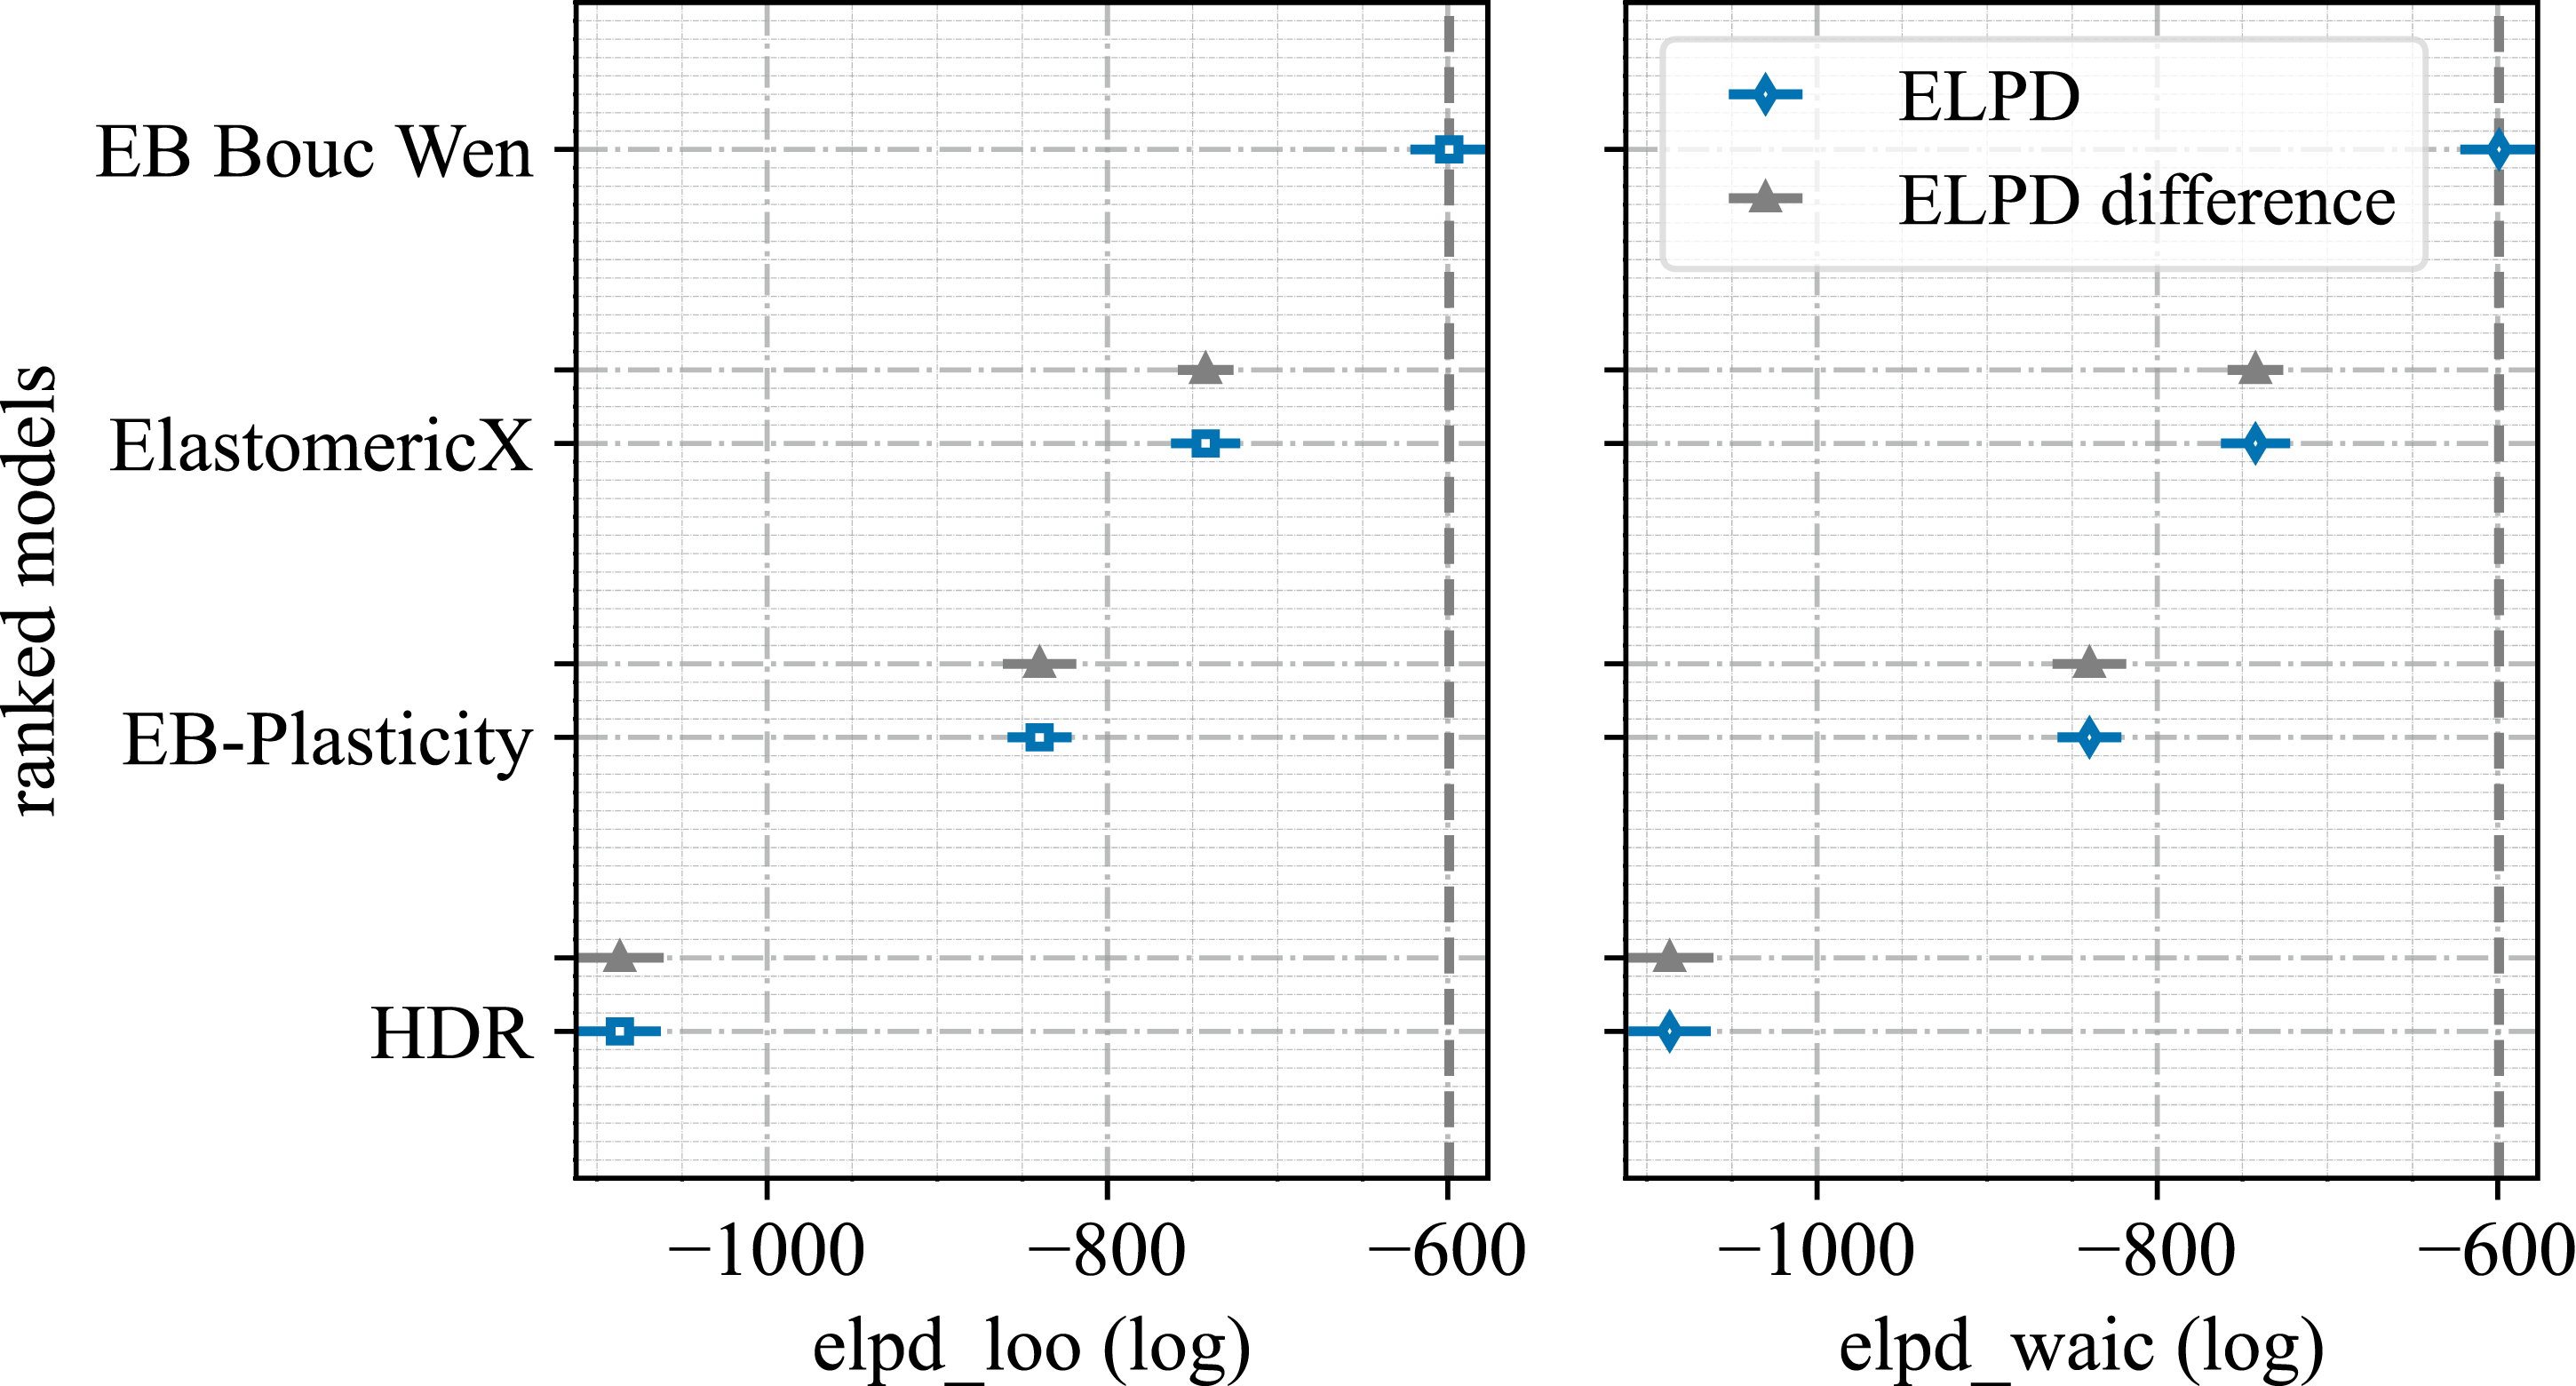
Model comparison using LOO and WAIC. Higher ELPD values indicate better predictive performance.
The results validate the superior performance of the Bouc-Wen element in reproducing the hysteretic response of RR-FREIs, with a high effective number of parameters (ploo = 6.53), which reflects both its flexibility and its capacity to generalize well despite model complexity. These findings are further explored in the next section by examining energy dissipation metrics.
5.6. Model validation
To complement the Bayesian model comparison, an additional evaluation was conducted based on the energy dissipation characteristics of each calibrated model. This analysis provides a physically interpretable metric to assess how well each model captures the inelastic behavior observed in the experiments.
In terms of energy dissipation per cycle (Figure 17), the Bouc-Wen model consistently shows the best agreement with experimental data across most of the loading sequence. In cycles 1–3, all models underestimate the energy dissipation, with Bouc-Wen yielding the closest values. For cycles 4–6, corresponding to intermediate displacements, the Plasticity and Bouc-Wen models show the best agreement, while the HDR model underperforms notably. In cycles 7–9, Bouc-Wen remains the most accurate, followed by ElastomericX and Plasticity. For the peak amplitude cycles (10–14), the HDR model best captures the experimental dissipation, outperforming the other models—Plasticity being the least accurate. Finally, in cycles 15–22, all models tend to overestimate the dissipated energy, with the HDR element providing the closest match to the experimental values, followed by Bouc-Wen. Energy dissipated per cycle for each model compared to the experimental data under Protocol 1.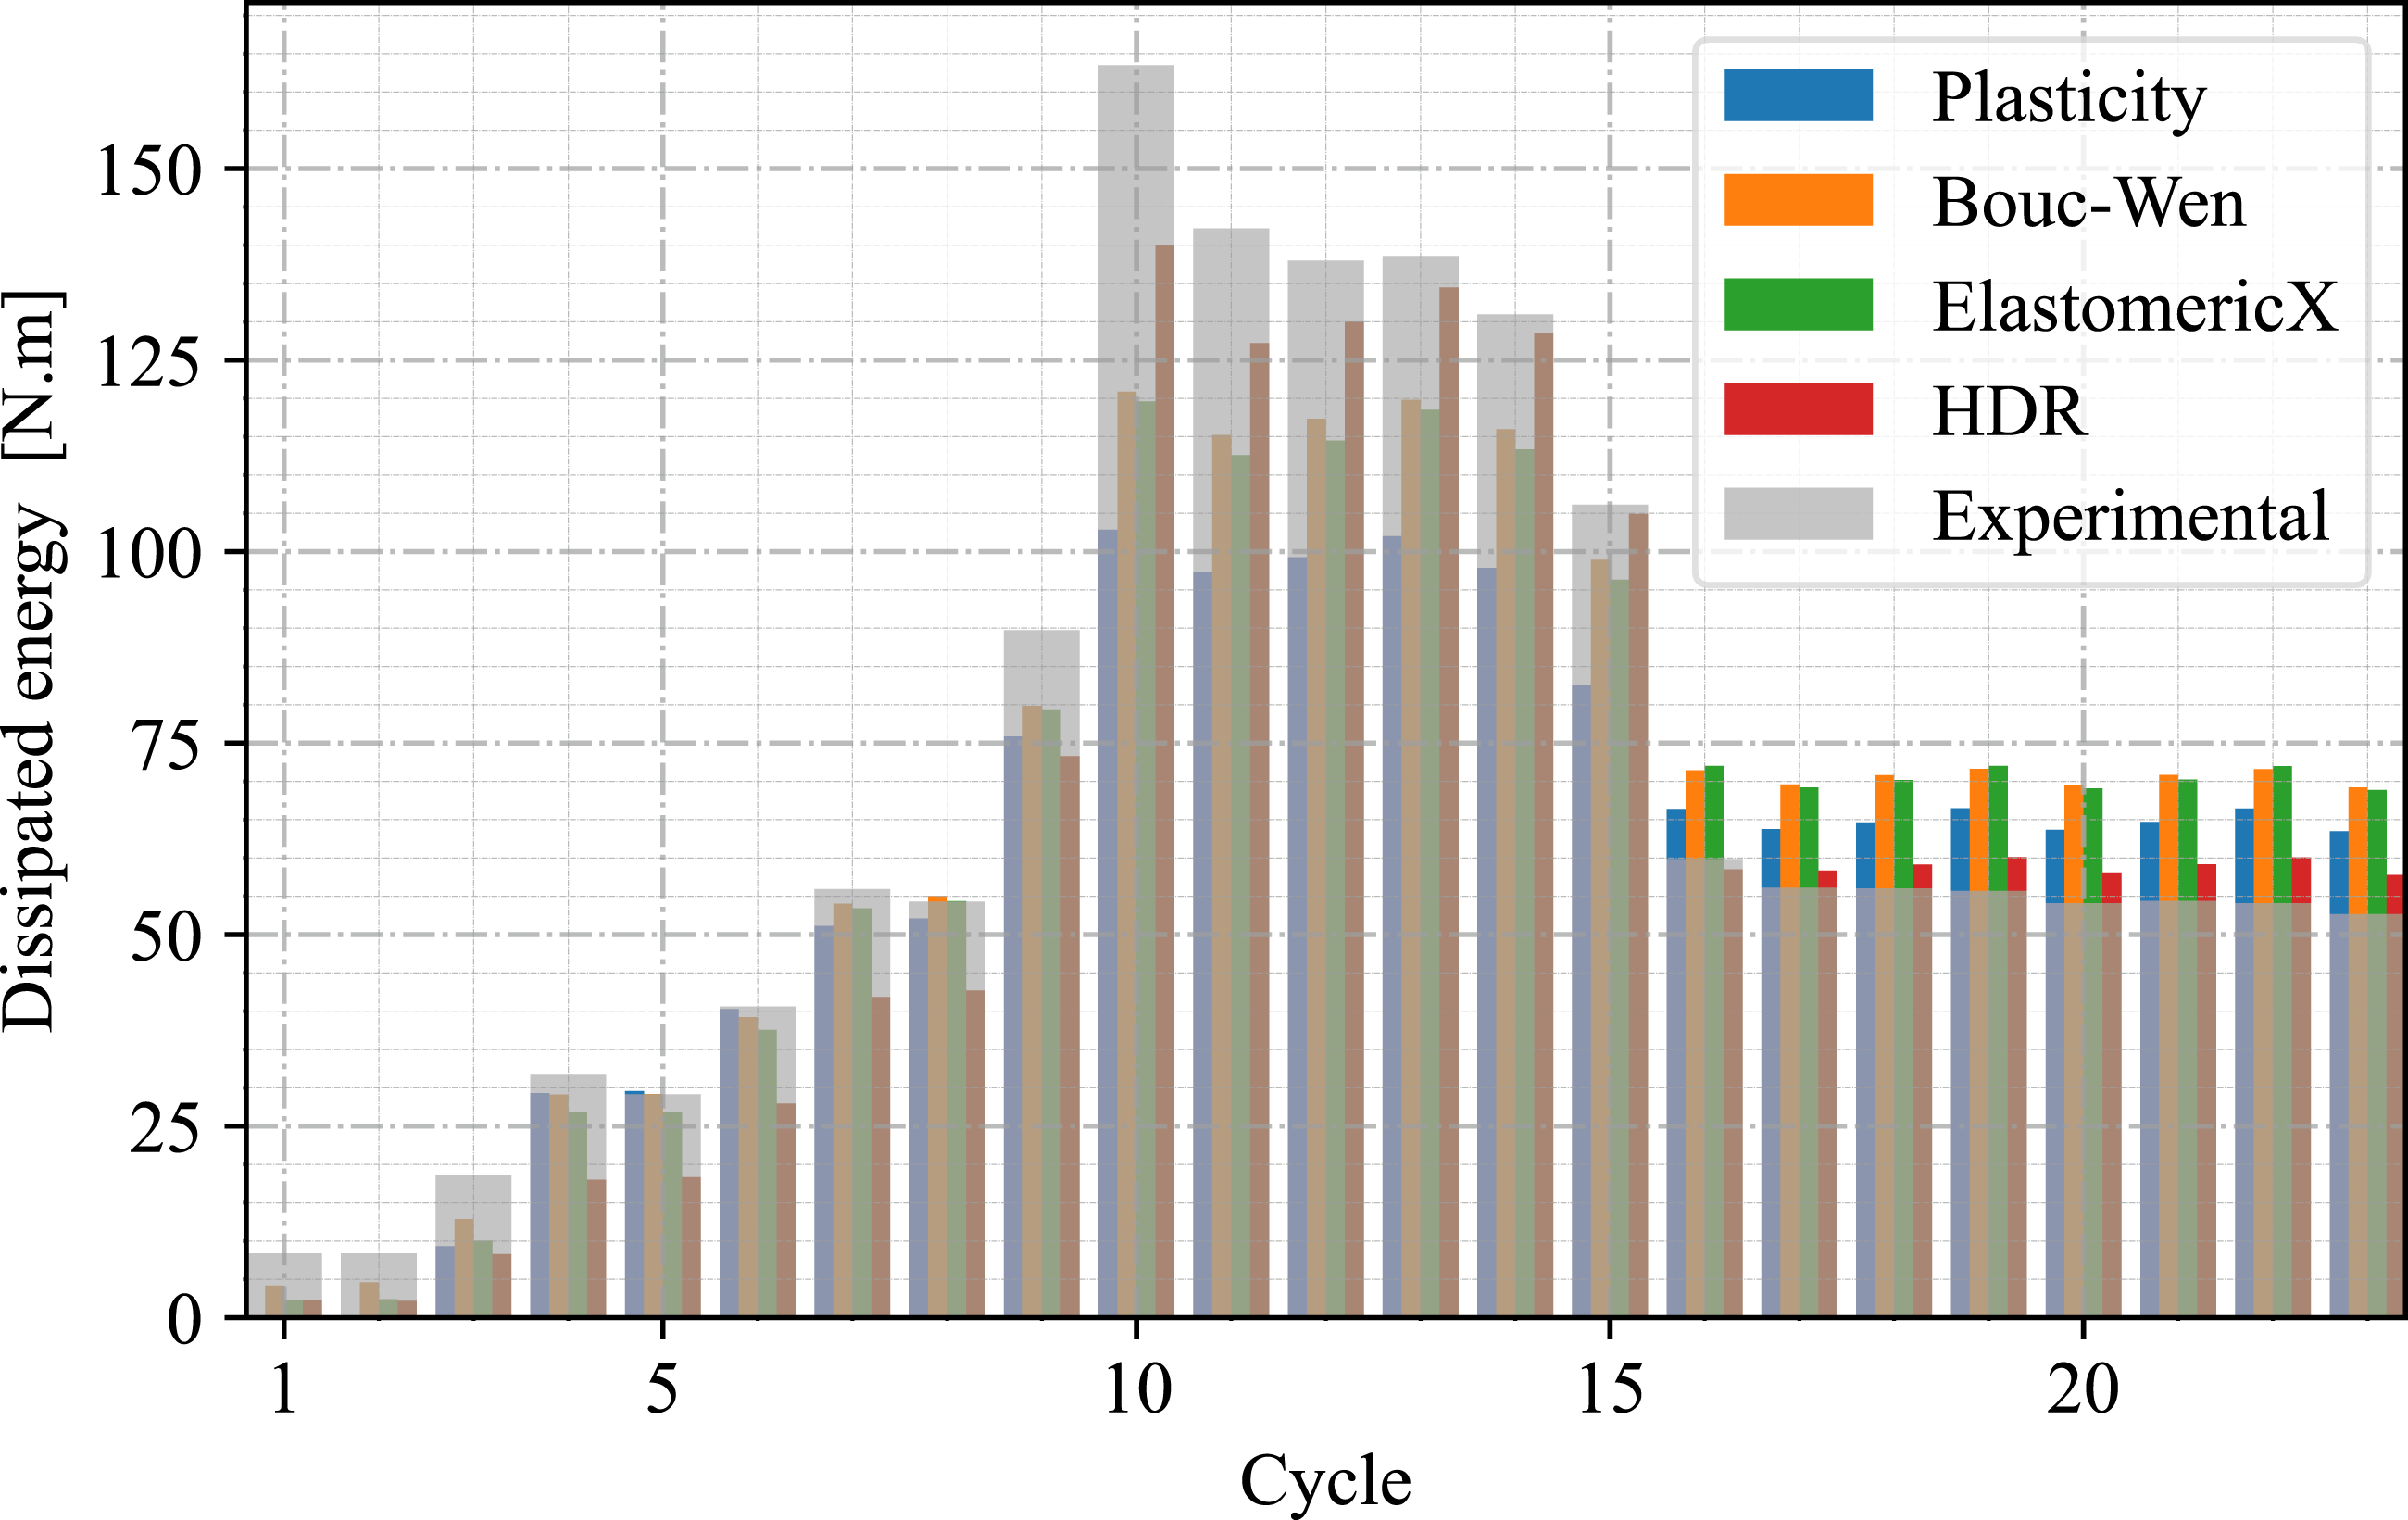
Cumulative energy dissipation is shown in Figure 18. The Bouc-Wen model once again exhibits the best agreement with the experimental curve, closely tracking the total energy dissipated throughout the loading history. The ElastomericX model follows with moderate accuracy, while the Plasticity and HDR elements significantly underestimate the accumulated dissipation. These results are consistent with the Bayesian selection criteria, further supporting the Bouc-Wen element as the most suitable model for representing the nonlinear response of the isolator. Comparison of cumulative energy dissipated per model versus experimental reference under Protocol 1.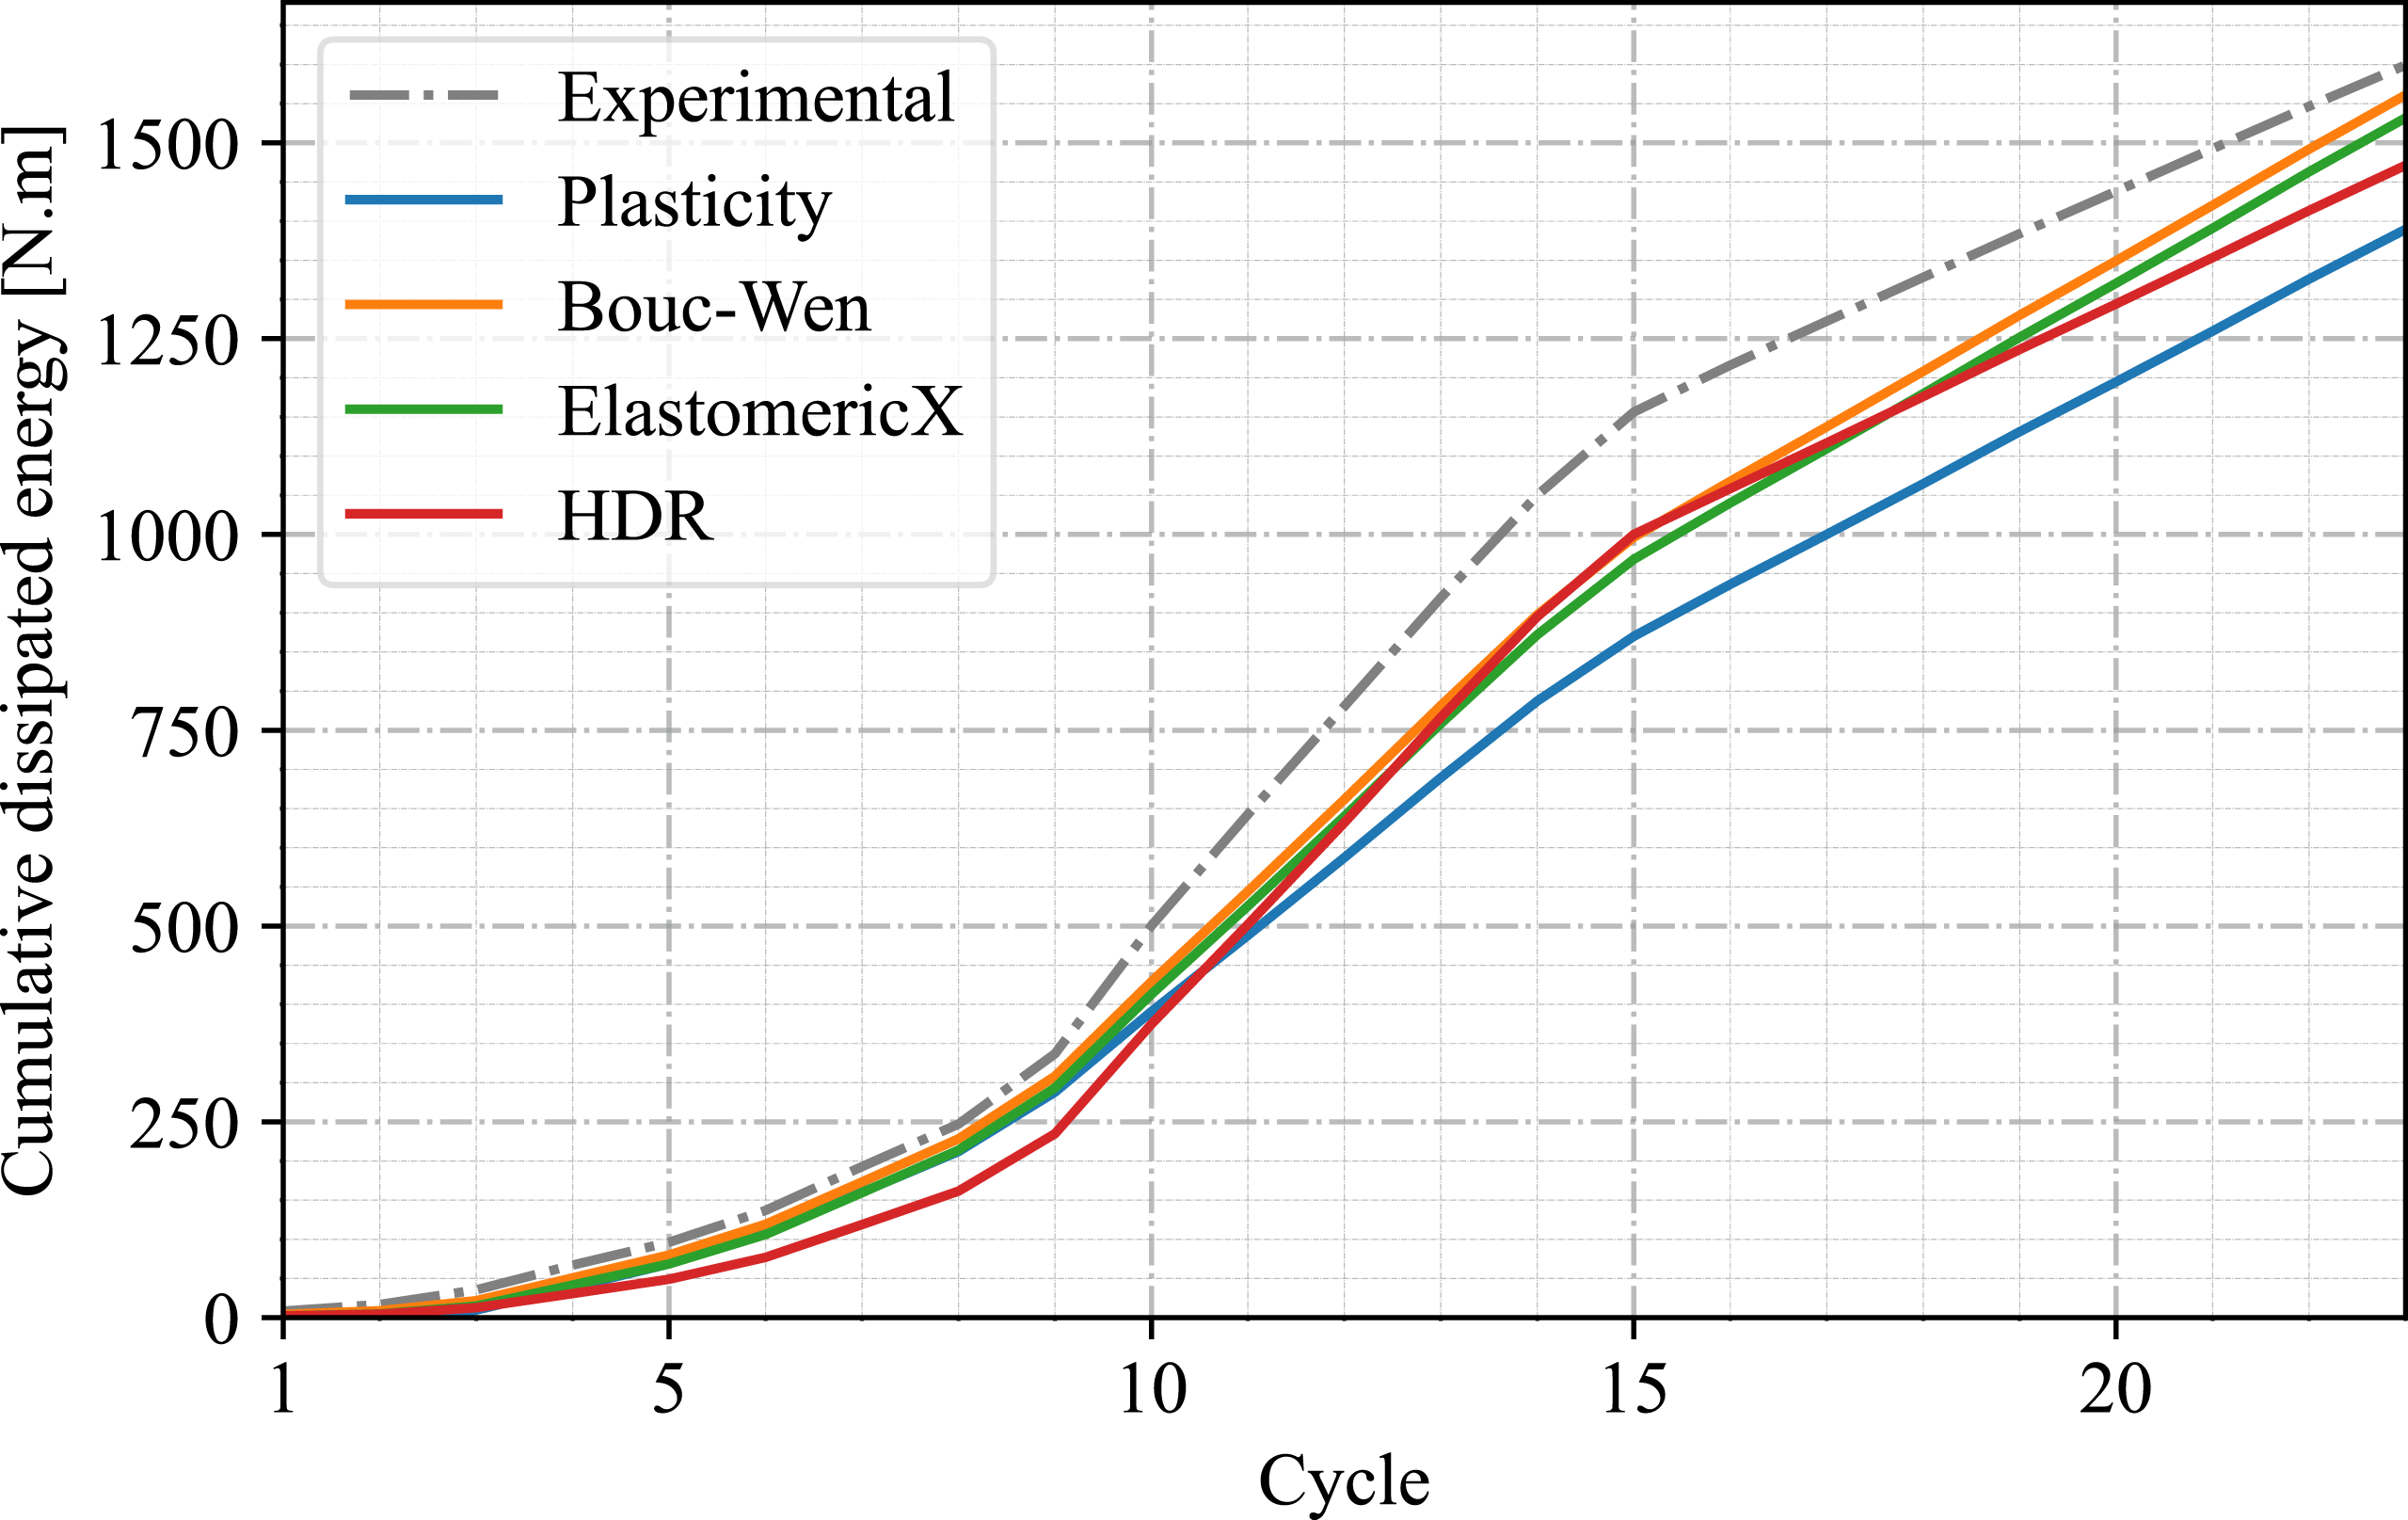
The second part of the validation addresses the generalization capacity of the selected model (Bouc-Wen) when applied to different loading histories. Specifically, the model is evaluated in relation to experimental results from three additional displacement protocols not used in the Bayesian calibration. Since the model was calibrated exclusively using Protocol 1, its performance on these alternative protocols serves as a meaningful test of its extrapolation ability.
Figure 19 presents the posterior predictive checks for Protocols 2 to 4, showing the experimental response (orange), the model prediction using the MAP estimates (blue), and the 95% posterior credible interval (blue shaded area). For Protocols 2 and 3, which include cyclic loading at various amplitudes, the Bouc-Wen model accurately captures the hysteresis behavior, with the predicted loops closely matching the experimental data. The observed cycles are all contained within the 95% credible interval, thereby confirming the model’s robustness in representing nonlinear cyclic shear behavior. Posterior predictive checks for the Bouc-Wen model under three additional displacement protocols.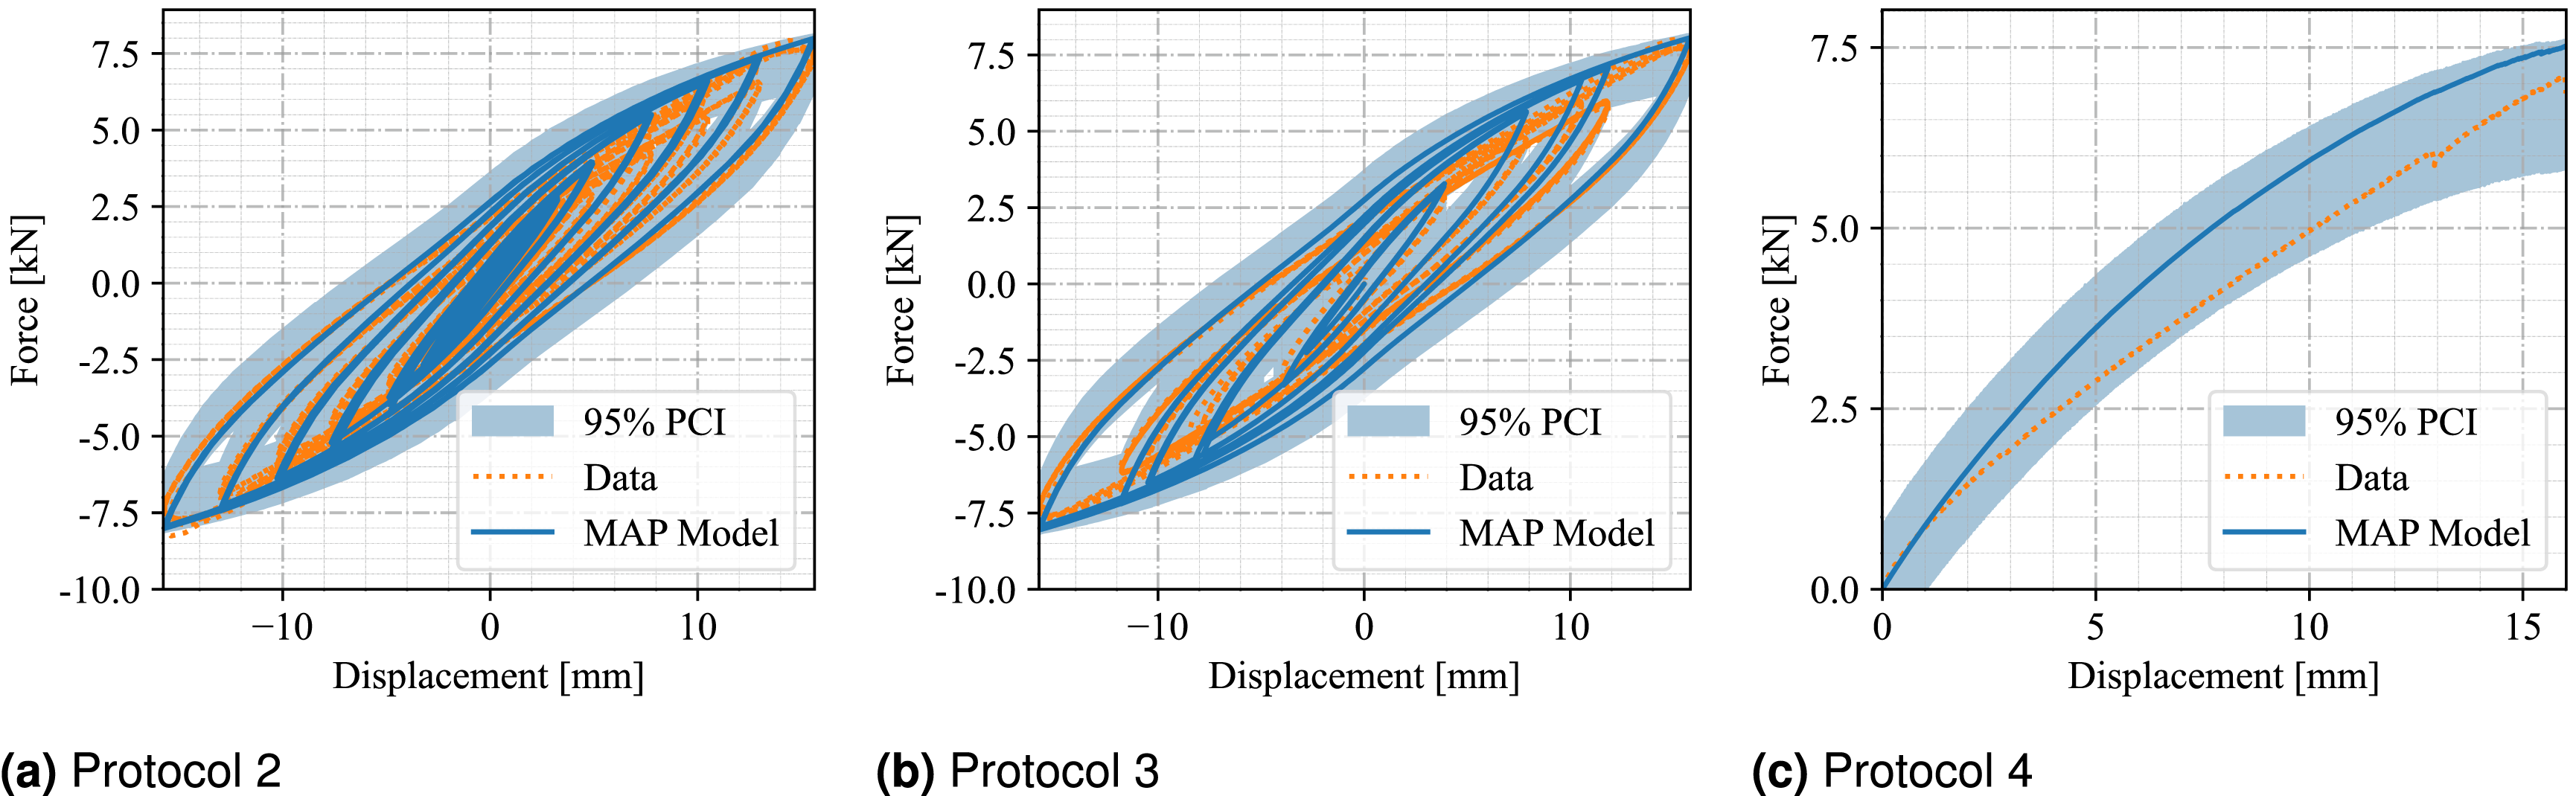
Protocol 4 corresponds to a monotonic loading sequence. While it does not involve hysteresis, the Bouc-Wen model is still able to reproduce the force–displacement envelope with fidelity. The predicted response aligns well with the experimental trend, and all data points fall within the credible region, further supporting the model’s generalization capability across different loading types.
6. Discussion
The Bayesian calibration and validation results presented in this work offer valuable insights into the strengths and limitations of each hysteretic model used to represent the behavior of RR-FREIs. The comparison of posterior distributions reveals that all models exhibit identifiable parameters, though with varying degrees of uncertainty depending on model complexity and flexibility. It is noteworthy that the Bouc-Wen element exhibited a balanced trade-off between parameter flexibility and identifiability, thereby enabling it to effectively capture key nonlinear features such as stiffness degradation and energy dissipation.
The posterior predictive checks indicate that all models possess the capacity to reproduce the overall shape of the experimental hysteresis loops, with their MAP predictions exhibiting a general alignment with experimental data. The majority of models effectively encapsulate the observed response within the 95% posterior credible intervals. However, it should be noted that the quality of fit and uncertainty bounds exhibit variability. Among them, the Bouc-Wen element not only matches the observed response closely but also provides well-calibrated uncertainty bounds, resulting in credible intervals that are informative yet not overly conservative. The findings are corroborated by model comparison using WAIC and LOO-CV. The Bouc-Wen model demonstrated the highest expected predictive accuracy while exhibiting a moderate effective number of parameters, indicating that its augmented flexibility does not incur the risk of overfitting. The ElastomericX element, characterized by a reduced number of parameters compared to the other models, exhibited a satisfactory level of performance. In contrast, the HDR and Plasticity elements exhibited lower predictive capability, with the HDR model particularly limited in reproducing observed energy dissipation at moderate amplitudes.
The evaluation based on energy dissipation provides a validation of the statistical findings. The Bouc-Wen model most accurately reproduced the cumulative energy dissipation, reinforcing its capacity to reflect the inelastic behavior of the isolator. It is noteworthy that the HDR element exhibited superior performance at higher displacement amplitudes, where degradation effects predominate. This observation indicates that its formulation may be more appropriate for large-cycle scenarios.
The validation of independent loading protocols underscores the Bouc-Wen model’s robustness and generalization capability. Despite having been calibrated using only one displacement history, the model accurately predicted the response under three additional protocols, including a monotonic loading path.
Overall, the results underscore the importance of combining statistical inference, physical validation, and uncertainty quantification in model selection. While the Bouc-Wen model emerges as the most reliable and generalizable, the insights gained from the comparative performance of all models can inform future developments in isolator modeling, particularly in hybrid or reduced-order formulations.
7. Conclusions
This study presented a thorough Bayesian calibration and validation of four hysteresis models (Plasticity, Bouc-Wen, ElastomericX, and HDR) for simulating the nonlinear shear behavior of rubber-based seismic isolators. The main findings are summarized as follows: • The application of Bayesian inference facilitated the estimation of posterior distributions for all model parameters, enabling rigorous uncertainty quantification alongside parameter estimation. • While all models reproduced the general hysteretic behavior, the Bouc-Wen model consistently achieved the best agreement with experimental data, accurately capturing stiffness, strength, and degradation patterns across the entire loading range. • Model comparison using WAIC and LOO-CV criteria identified the Bouc-Wen model as having the superior generalization capacity and the highest expected predictive accuracy among the evaluated candidates. • Energy-based validation confirmed that the Bouc-Wen model provides a close correspondence with both per-cycle and cumulative energy dissipation observed in the experiments. • The extrapolation capability of the Bouc-Wen model was successfully validated against three independent displacement protocols, with all experimental data falling within the 95% credible intervals, reinforcing its robustness and predictive reliability. • In summary, the Bouc-Wen element offers the optimal balance between flexibility, predictive power, and robustness, making it a highly effective option for simulating the nonlinear response of seismic isolators.
Footnotes
Acknowledgements
The authors thank Universidad del Valle, Colombia, for funding the project “Modelación en elementos finitos de aisladores sísmicos con matriz de caucho reciclado” (C.I. 21234) through an internal research call.

Funding
The authors disclosed receipt of the following financial support for the research, authorship, and/or publication of this article: This work was supported by the Universidad del Valle (C.I. 21234).
Declaration of conflicting interests
The authors declared no potential conflicts of interest with respect to the research, authorship, and/or publication of this article.