






Abstract
The offender’s journey to crime has attracted much attention in mobility triangle research, whereas the journey to victimization and the spatial distance between the offender’s and the victim’s residences have been relatively less examined. This research fills this gap in the literature by examining spatial comparisons of variations in journey to crime, journey to victimization, and the distance between victim’s and suspect’s residences for five types of offenses. Crime data from the Houston Police Department from 2010 to 2013 were used to analyze the mobility triangle in five types of crime. The results show that the dynamics of travel pattern vary by demographic characteristics of the suspects and victims. It is also contingent on the types of crime. The proximity of offender’s and victim’s residences is closely related to the chance of crimes. The findings provide important implications for theory, policy and policing practice.
Introduction
The mobility triangle literature examines the spatial distance between the offender’s residence, the victim’s residence, and the offense location (Andresen et al., 2012; Burgess, 1925; Rossmo, 2000). The core of spatial analysis involves three distances: from the offender’s and victim’s residences to offense location and from the offender’s residence to victim’s residence. Residence is an essential starting point of the offender’s journey to crime and the victim’s ill-fated journey to victimization. Researchers have argued that offenders tend to commit crime near their residences (Wiles and Costello, 2000). PL Brantingham and Brantingham (1981) proposed distance decay, suggesting the rate of criminal activities reduces as distance from the offender’s home increases. The primary explanations are: (a) that the cost of time, money, and effort increases as distance increases; and (b) it is easier for offenders to locate ideal targets in their knowledge space. The distance decay model predicts an inverse relationship between offense and distance from the offender’s home, but not within the immediate area of the home because of the high possibility of being recognized and apprehended (PL Brantingham and Brantingham, 1981; Rossmo, 2000).
Among the three routes in the mobility triangle, journey to crime has attracted the most attention in academic research (Block et al., 2007; Pizarro et al., 2007). Studies have concluded that the typical travel distance to crime locations is relatively short, usually within 3 miles (Sarangi and Youngs, 2006; Snook, 2004; Wiles and Costello, 2000) and the distance is even shorter for sexual offenses (Chopin and Caneppele, 2019). However, there are variations in different types of crime and among different types of offenders. For example, violent criminal offenders are less mobile than property crime offenders (Rossmo, 2000; Wiles and Costello, 2000). Young offenders have been reported to travel less than older offenders (Gabor and Gottheil, 1984; Warren et al., 1998), although some researchers reported a quadratic relationship between age and the distance traveled (Andresen et al., 2014). In addition, there are gender and race differences in travel mobility. White offenders are reported to travel more than minority offenders (Ackerman and Rossmo, 2015; Groff and McEwen, 2006). There is mixed evidence on gender; some research reported that female offenders traveled farther and some reported otherwise (Ackerman and Rossmo 2015; Nichols, 1980; Phillips, 1980).
The other two routes, distance between the offender’s home and victim’s home and journey to victimization have been relatively less examined (Pizarro et al., 2007). Although research has demonstrated that many crimes involve offenders and victims with familial relationships (Chan et al., 2013), there has been scant investigation regarding how close they live to each other and the actual distance between their homes. In addition, little research has examined the actual distance traveled by a victim to a crime. This research employs data from the Houston Police Department to investigate the spatial distance of the journey to crime, journey to victimization, and how close victims and offenders live to each other in three types of crimes: aggravated assault, burglary, and robbery. For the latter two offenses, this research examines business burglary and business robbery separately; first, because research has found that there are differences between personal and commercial crimes (Block et al., 2007) and second, because victims in business crimes do not travel. Spatial distributions were measured by calculating distances between the two parties involved in a crime.
Theoretical frameworks
Previous research on the mobility of crime has emphasized two theoretical perspectives: routine activity theory and rational choice theory. Each theory uses different approaches to address crime mobility and offers distinct frameworks to predict crime travel distances. Both perspectives, however, predict similar crime travel patterns and tendencies.
Routine activity theory
Routine activity theory maintains that for a predatory crime to occur, there must be a convergence in place and time of three elements: a motivated offender, a suitable target, and an absence of a capable guardian (Cohen and Felson, 1979). Changes in people’s routine activities can influence crime rates by affecting the convergence of the three elements (Rossmo, 2000). Based on routine activity theoretical framework, offenders are likely to commit crimes near their homes, and people are highly likely to be victimized close to their homes, in part because that is the place where they spend the most time (Pizarro et al., 2007). A motivated offender and a suitable target are more likely to converge when the distance between these two is short (Cohen et al., 1981).
Individual demographic and lifestyle characteristics are also important predictors of crime and victimization through their influence on routine activities (Chopin and Caneppele, 2019; Pizarro et al., 2007). For example, males and young people have a higher likelihood of being victimized than females and older people because they spend more time outside the home. Similarly, people who engage in activities such as going to bars and taverns are at a higher risk of victimization because drinking may facilitate an encounter with a potential offender and also because of the absence of a guardian due to drunkenness (Mustaine and Tewksbury, 1999; Schwartz et al., 2001; Schwartz and Pitts, 1995).
Rational choice theory
At the crux of rational choice theory is the idea that offenders make rational decisions when committing crimes (Clarke and Felson, 1993). The rational choice perspective proposes that individuals assess all the choices available, determine the possible outcomes of each choice, and then weigh the costs and benefits of the choices (Clarke and Felson, 1993). Criminal behaviors are just outcomes of this balancing processes (Cornish, 1993). Cornish and Clarke (1986) contended that rational choice is a multistage decision process made over time. Distance is one of the most significant factors that influence the decision-making process because time, energy, and money are required for travel, an important cost of criminal activity (PL Brantingham and Brantingham, 1981). Offenders’ decisions are made on a utilitarian base, thus varying for different types of crime, a “crime-specific focus” routine (Cornish and Clarke, 1986). Rational choice theory mainly focuses on the content of the decisions, whereas the routine activity approach is more concerned with the ecological contexts of the choices and opportunities (Cornish and Clarke, 1986).
Prior research
Consistent with the theoretical perspectives, previous research has observed that crimes often occur in close proximity to the residences of offenders and victims (Groff and McEwen, 2006; Sarangi and Youngs, 2006; Snook, 2004). Many offenses such as sexual assault occurred at the offender’s address, and many robberies happened within two blocks of the offender’s home location (Block et al., 2007). Prior research has demonstrated that offenders usually commit crimes within 3 miles of their homes, indeed within their own neighborhood, with only a small portion of offenders traveling long distances (Gabor and Gottheil, 1984). For example, PL Brantingham and Brantingham (1981) indicated that robbers traveled an average of 2.1 miles to the offense, burglars traveled a mean distance of 1.62 miles to the offenses, and rapists only traveled on average 1.15 miles to the crime scene. Similarly, Block et al. (2007) studied violent index offenses in Chicago and concluded that commercial robbers traveled a mean distance of 1.78 miles, whereas personal robbers traveled an average distance of 0.8 miles. In a study of homicide, Groff and McEwen (2006) revealed that the victims traveled an average of 2.68 miles from their homes, and in parallel offenders on average traveled 2.66 miles from their homes.
PL Brantingham and Brantingham (1981) argued that the journey to crime follows a distance decay pattern with crime occurrence decreasing as distance from the offender’s residence increases, but not within immediate places around the offender’s home (Bernasco and Nieuwbeerta, 2005; PJ Brantingham and Brantingham, 1984). A buffer zone exists around the home base where offenders are less likely to commit crimes, forming a “volcano” pattern around the offender’s residence. Some later research supported this model although others found little evidence for a buffer zone in the journey to crime (Block et al., 2007; Groff and McEwen, 2006).
Research indicates that spatial distance traveled not only differs by crime type, but also varies among different offenders. The pattern of the variation, however, has received mixed support. In terms of age, some research found that the distance traveled by young offenders is shorter than for older offenders due to limited awareness of places and insufficient experiences (Capone and Nichols, 1976; Gabor and Gottheil, 1984; Warren et al., 1998); other studies revealed that younger individuals preferred longer trips than older individuals (Rouwendal and Rietveld, 1994). A third study presented a quadratic relationship between age and the distance to crime (Andresen et al., 2014). Conclusions on gender are also inconsistent. Some studies demonstrated that female offenders traveled less than male offenders (Groff and McEwen, 2006; Nichols, 1980), whereas other research showed that females traveled farther than males (Ackerman and Rossmo, 2015). There is limited research on race and ethnicity distribution, but minority offenders are found to be less mobile than White offenders in existing research, in part as a result of limited financial resources (Ackerman and Rossmo, 2015; Phillips, 1980).
Owing to technical limits, many prior studies measured distance based on census tract or distance from a center to a zone (Caywood, 1998; Feeney, 1986; Hesseling, 1992; Lenz, 1986; Tita and Griffiths, 2005). Although these studies generated important information regarding crime and victimization travel patterns, the distances were approximate. The Geographic Information System calculates the actual distance from point to point through X and Y coordinates of the locations. This research measures the straight-line distance between the offender’s and victim’s home locations and offense locations. Most of the previous research reported distance in kilometers or miles (Andresen et al., 2012; Pizarro et al., 2007), whereas the current research reports the distance in meters (m). Travel distances in many incidents are very short and meters can better capture the details (Block et al., 2007). In addition, much of the literature investigating robbery and burglary did not distinguish between commercial crimes and personal crimes, but used the general categories of robbery and burglary. However, researchers have argued that there are variations between commercial and personal robbery; the researchers pointed out that commercial robbers traveled twice as far as non-commercial robbers (Block et al., 2007). There are also variations between commercial burglary and non-commercial burglary. This research distinguishes this difference and examines burglary, robbery, business burglary, business robbery, and aggravated assault.
The current research can make several important contributions. First, this research fills the gap of insufficient research on journey to victimization and the distance between the victim’s and the offender’s residences. Second, we use ArcGIS to measure the address-to-address distance and can thus reflect the crime and victimization travel patterns better. Third, this study can contribute to the literature by comparing how the spatial distances differ among different types of crimes in a large U.S. city. Last, although knowledge on crime travel patterns has advanced, there are still uncertainties about how individual and geographic factors impact offender’s mobility. For example, many examined factors received inconclusive findings. With the advance in technology and transportation, the travel distance and pattern may have changed. Therefore, it is still important to examine the journey to crime to update the geographic profiling and provide the most useful information for police crime investigations. Evidence generated from empirical research have the potential to help reduce policing costs and increase the efficiency of investigations (Ackerman and Rossmo, 2015; Canter et al., 2000).
Methods
Data
This research uses crime data from the Houston Police Department from 2010 to 2013. Houston is the fifth largest city in the United States with a population of over 2.2 million. The police data set contains offense type, offender and victim demographics, addresses, and X and Y coordinates of the addresses. The sample includes 1,409 aggravated assaults, 727 burglaries, 628 robberies, 1,177 business burglaries, and 1,172 business robberies. ArcGIS was used to measure the spatial distances of the crime triangle. This research examines three research questions: (1) How do the journey to crime and victimization vary by offense type? (2) How do victim and suspect characteristics influence the distance traveled from residence to offense location? (3) Does the distance between the suspect’s and the victim’s residences vary by offense type?
Variables
Based on the theoretical proposition, this study examines three distance-related variables: (a) journey to crime, the distance between residence of the suspect and the offense location; (b) journey to victimization, the distance between residence of the victim and the offense location; and (c) the distance between the suspect’s residence and the victim’s residence. Based on previous literature, this study also investigates how demographic characteristics influence the mobility of suspects and victims. These demographic characteristics include gender, age, race, and ethnicity. Gender was measured dichotomously as male and female. Age was a continuous variable. Race included Asian, Black, and White. Ethnicity measures whether the subject was Hispanic or not.
Findings
Descriptive statistics are reported in Table 1. Aggravated assault suspects had the highest average age (35), whereas robbery and business robbery suspects had the youngest average age (27). Males had a dramatically higher involvement in all types of crime. In robbery cases, males represented 92.7% of suspects. Generally, fewer than 10% of suspects were female, except for aggravated assault for which females accounted for 24%. Hispanics were less involved in crimes than non-Hispanics with the exception of business robbery in which 69.4% of the perpetrators were Hispanics. In terms of race distribution, Asian people were less likely than Black or White people to commit crimes; African Americans had the highest involvement in all types of crimes.
Regarding victim demographics, burglary victims had the highest average age (39). In general, females were less victimized than males apart from aggravated assault in which the gender distribution was almost equal. More than half of the victims were non-Hispanics in all three types of crime. In terms of race, similar to the offending trend, Asians were less likely to be victimized than Black and White people. For example, 1.2% of victims in aggravated assault, 5.9% in robbery, and 6.1% in burglary were Asian. White and Black people were equally likely to be victimized in aggravated assault, but White people were victimized at a much higher rate than Black people in burglary and robbery.
Descriptive statistics.

Crime triangle
Table 2 reports the mean distances for the five types of crime. Suspects traveled farthest in business robbery (7,268 m/4.5 miles) and least in aggravated assault (3,492 m/2.2 miles). The distance traveled to burglary was 5,285 m (3.3 miles) with 6,537 m (4.1 miles) and 5,748 m (3.6 miles) in robbery and business burglary, respectively. Victims traveled an average of 5,895 m (3.7 miles) in robbery and 3,795 m (2.4 miles) in aggravated assault. The distance between victims’ and suspects’ homes was farther in robbery (9,725 m/6.0 miles) than in aggravated assault (5,515 m/3.4 miles). This study examines the mobility triangle in aggravated assault and robbery cases. Figures 1 and 2 present the distances and areas covered by the crime triangle. The distances are drawn in proportion to the actual distance. The results show that robbery had a longer distance in all three routes and covered a larger mobility area than aggravated assault.
Mean distance in meters (miles).

Note: 1 mile = 1,609 m. To distinguish the detailed differences in distance, meter is used in this study; but unit in miles is also indicated.
a = Journey to crime, b = Journey to victimization, c = distance between the suspect’s and the victim’s residence

Aggravated assault triangle in meters (1: 50,000).

Robbery triangle in meters (1: 50,000).
The journey to crime
A detailed distribution of travel distances for the five types of crime is reported in Table 3. In general, suspects in the five types of crime exhibited similar travel patterns. Crimes declined as the distance from the suspect’s home increased, which was consistent with the general direction of the distance decay prediction. Also, each type of crime presented a similar distribution of the distance intervals (Figure 3). Offenses peaked at the first and last intervals in each type of crime and declined dramatically after the first interval, especially in aggravated assault where about 67% of the offenses were within 1,000 m (0.6 mile). More than 10 times the number of offenses fell in the first interval compared to the second interval (5%). About 22.3% of the aggravated assault occurred between 2,001 m (1.2 miles) and 20,000 m (12.4 miles). The second peak occurred in the interval above 20,001 m: 5.5% of the offenses fell into that category. For burglary, 41.7% of the incidents happened in the first interval, whereas 10.7% took place within the distance of 1,001–2,000 m from suspects’ homes. About 41.4% of the burglaries happened between 2,001 and 20,000 m, whereas 6.2% of the offenses took place more than 20,001 m from suspects’ homes. Compared with the previous two types of crime, robbery, commercial robbery and commercial burglary displayed a more gradual decaying effect. The results show that 28.2% of robberies happened within 1,000 m (0.6 mile), compared with 37.6% and 24.8% for commercial burglary and commercial robbery, respectively.

Journey to crime (aggravated assault)
Distance distribution.

The journey to victimization
Similar to the journey to crime distribution, the journey to victimization showed a similar pattern with two peaks at the first and last interval, respectively (Table 3). Also, the likelihood of victimization decreased significantly after the first interval. In aggravated assault, 67.4% of individuals were victimized within 1,000 m from their homes; 5.9% of the people were victimized beyond 20,001 m from their homes. There was a big gap between the first and the second interval; only about 5% of the people were victimized at a distance between 1,001 and 2,000 m. Robbery victims follow the same mobility pattern. In robbery, 46% of victims were targeted within 1,000 m from their homes, whereas 8.9% were targeted more than 20,000 m from their houses.
Regarding how the distance between the suspects’ residences and the victims’ residences influences crime rate, results in Table 3 show a consistent pattern with journey to crime and journey to victimization. The likelihood for a crime to take place was higher when the distance between the victim’s and the suspect’s residences was close, and the chance declined when the distance raised.
Mean distance differing by demographics
Table 4 presents the mean distances depending on gender, ethnicity, and race. The results show that female perpetrators generally traveled farther than males for all five types of crime. In business robbery, females traveled a mean distance of 9,621 m (6 miles), whereas males traveled 7,066 m (4.4 miles); the difference was statistically significant. Generally, both genders traveled the least in aggravated assault and farthest in business robbery. In terms of ethnicity, Hispanic suspects traveled shorter distances than non-Hispanic suspects. Hispanics were significantly less mobile than non-Hispanics in all five types of crimes. Among the three races compared, Asian suspects traveled the farthest in aggravated assault, burglary, and business burglary, whereas they traveled the least in robbery and business robbery. For Black and White suspects, the results show that White suspects traveled farther than Black suspects in non-commercial crimes—aggravated assault, burglary, and robbery. However, in business burglary and business robbery, White suspects traveled shorter distances than Black suspects.
Age had differential influence on the travel distance. Age was inversely correlated with crime mobility in aggravated assault where older suspects traveled less; but it was positively related to other four types of crime and older people traveled significantly longer than their younger counterparts.
Mean distance by gender, ethnicity, and race in meters (miles).

Note: * p<.05, ** p<.01, *** p<.001, 1 mile = 1,609 m
Regarding victims, females were victimized closer to their residences, whereas males were victimized much farther from their homes: the difference was statistically significant in aggravated assault. Compared with non-Hispanics, Hispanics were victimized closer to their homes in robbery but further in aggravated assault. In terms of victims’ race, Asians were victimized the farthest from their residences. Black victims traveled shorter distances than White victims in both aggravated assault and robbery.
For the journey to victimization, age was inversely and significantly correlated with travel distance in aggravated assault; older people were more likely to be victimized closer to their homes. Similar inverse effect of age appeared for robbery as well, though the relationship was not statistically significant.
Discussion
The purpose of this study was to investigate the mobility triangle—the distance traveled to the crime scene by suspects and victims, as well as the distance between the suspect’s and victim’s homes. This research asks three questions: How do the journey to crime and victimization vary by offense type? What is the relationship between victim and suspect characteristics and the distance traveled by them? How close do victims and suspects live to each other? The findings can provide important implications for theory, practice, and policy.
The results of this research are consistent with theory prediction that crimes take place most frequently at the offenders’ known and convenient places (Chopin and Caneppele, 2019; Pizarro et al., 2007). For example, routine activity theory predicts a high occurrence of crimes around an offender’s residence base, because that is the area where convergence of the three elements is most likely to happen. The statistics in this study show that suspects in most types of crime traveled a short mean distance from their homes. This is also in accordance with rational choice theory that offenders are rational. They balance the benefit against the cost of time and resources. Committing offenses at locations within their familiar places takes less time to plan and fewer resources, whereas farther places require more. Besides, risks may be lower in places near offenders’ residences as offenders are familiar with the security conditions and are more likely to get away if detected.
The results demonstrated that suspects were least mobile in aggravated assault and most mobile in business robbery. In general, the journey to crime was longer for business crimes than non-business crimes; property crime trips were longer than personal crime trips. Also, travel distance differed by gender, race, age, and ethnicity. Regarding gender, previous research has led to inconclusive findings on its effect; this study found that females were more mobile than males in all the five types of crime. This finding is consistent with Nichols (1990) and Hayslett-McCall et al. (2008) who observed longer trips for female offenders in a variety of crimes.
In terms of race, prior research concluded that White suspects tended to travel farther than Black suspects (Groff and McEwen, 2006). Findings from the current study concluded that the effect of race is not absolute, it dependents on the types of crime. This research observed that White suspects were more mobile than Black subjects in the three non-commercial crimes, however, they were less mobile than black suspects in business crimes. Therefore, future research should take into consideration the difference between business and non-business crimes when examining the effect of race. The results also show that Asian suspects traveled farther than White and Black suspects in aggravated assault and the two types of burglary, but shorter than their White and Black counterparts in the two types of robbery.
In addition, there is little research on the effect of ethnicity. This study observed that Hispanic suspects traveled less than non-Hispanic suspects in all five types of crime; the differences were statistically significant in robbery, business robbery, and business burglary. The influence of age was contingent on the types of crime; age was inversely related to travel distance in personal crimes while positively associated with property crimes. Older suspects were significantly less likely to take longer crime trips than younger suspects in aggravated assault, but were more likely to travel longer in the other four types of crime. The results indicate that it is important to consider the type of crime when discussing the relationship between demographic characteristics and travel mobility.
In addition, planning is an important part of an offense. It is an indication of motivation and investment for the offenders. More planning may indicate higher motivation and more investment, and thus a possible longer travel distance. Felson and Massogila (2012) analyzed a nationally representative sample of state and federal inmates and found that robbery offenders were more likely to plan before the crime than assault offenders; assaults involving African American offenders were less likely to involve plans ahead of time. This may in part help explain why robbery suspects in this study, on average, traveled longer than assault suspects and African American assault suspects were less mobile than Asian and White suspects.
In the journey to victimization, victims traveled farther in property-related crime (robbery) than in personal crime (aggravated assault). Females were victimized the most when they were close to their homes, whereas males were victimized farther from homes. This is consistent with routine activity theory because females, on average, spend more time proximate to their residences (Duxbury et al., 1994). In regard to spatial proximity of the suspects and victims, victims lived closer to suspects in aggravated assaults than in robbery. This may indicate that aggravated assault suspects and victims are more likely to be acquaintances, whereas robbery suspects tend to target victims who are not likely to know them. In terms of mean distances traveled, previous research found that suspects usually travel less than 3 miles (4,828 m) to the crime scene, which is in accordance with the “least-effort principle” (Ackerman and Rossmo, 2015). Results in the current study showed a longer travel distance. Suspects in all of the property crimes traveled more than 5,000 m (3.1 miles) with business robbery having a mean distance of 7,268 m (4.5 miles). This can be in part explained by the development of transportation—it is easier to travel longer distances now than in the past.
Environmental criminologists proposed that crimes occur at the intersection of the victim’s and offender’s activity space such as home, workplace, and social activity locations (PJ Brantingham et al., 2017). When the activity spaces of a potential offender and victim overlap, the probability of crime is high. Offenders locate targets outward from the overlapping activity place following a distance decay function (PL Brantingham and Brantingham, 1981). The search starts from the activity space paths and decreases as distance from the activity space increases (Rossmo, 2000). There is also a buffer zone centered around the offender’s home base that is viewed as the less desirable area for crimes due to high risk of being identified. In general, results in this study support the distance decay prediction that crime rates decline as distance increases; however, the results did not support the mimic volcano buffer zone with low crime rates immediately around the suspect’s home base, as predicted by PL Brantingham and Brantingham (1981). Instead of avoiding the risk of being recognized, suspects showed a willingness to take the risk; a large number of offenses were committed within 1,000 m (0.6 miles) of suspects’ homes. This finding is consistent with some previous studies that likewise failed to find a buffer zone around the suspect’s home base (Block et al., 2007; Groff and McEwen, 2006). The kernel density estimation in Figure 4 also shows that the occurrence of crime declines with the increase in distance, but showed no evidence of the mimic volcano buffer zone. However, it is possible that the buffer zone was concealed in the first interval due to the large range. To test this alternative explanation, the first interval was broken down into smaller subintervals. When we assigned 100 m and 50 m to each interval, we still could not see the volcano pattern around the suspect’s home base. When the first interval was broken down into 99 subintervals each representing 10 m, the volcano distance decay pattern appeared. Crime rates were low around the suspects’ home bases and then increased to a peak, followed by a gradual drop-down pattern. This provides support to the distance decay model proposed by PL Brantingham and Brantingham (1981), but only at short ranges. Future research should take the activity space into consideration and also use smaller units to better capture the pattern.
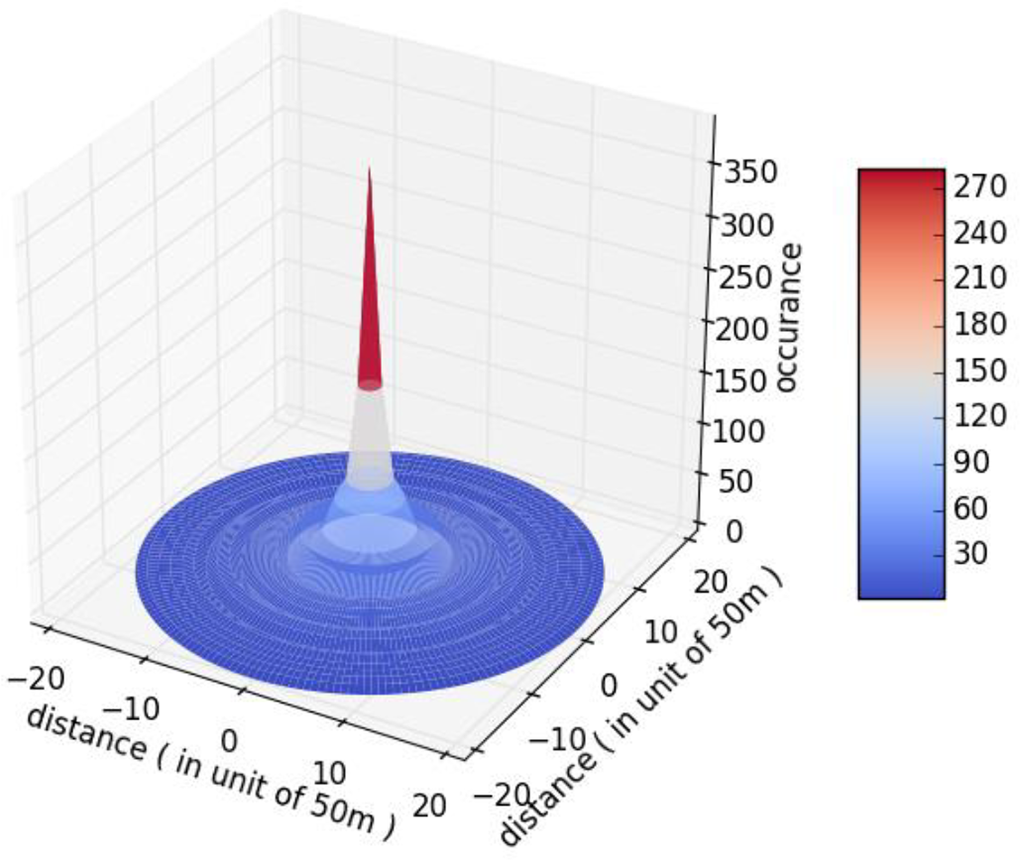
Journey to crime pattern in aggravated assault.
This study is not without limitations. First, this study only analyzed official records from the Houston Police Department; offenders who were not caught by the police and crimes that were not reported were not included in the analysis. In addition, official data on aggravated assault did not indicate whether intimate partner violence cases are included. Therefore, the results in this study should be interpreted with caution, and future studies should take these into consideration when investigating similar issues. Second, only cases with both a known offender and a known victim were analyzed. It is possible that travel patterns in those cases without a known offender/victim may differ from the cases with complete information. The results may not be generalized to all cases. Future replications with better representative data are needed to make the results more generalizable. Last, environmental criminologists emphasized the importance of activity space such as home, work, and social activity locations. Because of data limitations, this study did not incorporate other locations besides home. Future research should explore beyond the victim’s and offender’s residences.
However, this study examined the three complete routes involved in the mobility triangle distances using official crime data in a large U.S. city. Previous research has presented mixed findings on the dynamics of travel pattern and how individual characteristics influence their spatial decision-making process. Researchers have constantly called for more replications in different contexts before making any generalizations (Anderson et al., 2013). Findings from this study can make important contributions to the journey to crime and victimization literature. The results can advance the knowledge of geographic profiling and increase the efficiency of police investigations and crime prevention. Findings on journey to crime and victimization can help police narrow their investigations and concentrate resources on prioritized locations and suspects. In addition, offender travel patterns can provide important information for crime prevention strategies. Understanding of how offenders search for victims and the routes to victimization can make crime prevention efforts more effective (Bowers et al., 2011).
Footnotes
Declaration of conflicting interests
The author(s) declared no potential conflicts of interest with respect to the research, authorship, and/or publication of this article.
Funding
The author(s) received no financial support for the research, authorship, and/or publication of this article.
