
Abstract
The purpose of this article was to reassess patterns previously identified in the Federal Bureau of Investigation’s Law Enforcement Officers Killed and Assaulted (LEOKA) data, expanding the time frame from 5 years to 20 years, for application within law enforcement when considering training needs over the life cycle of an officer's career. Consistent with the findings of the earlier analysis, this study identifies two prevalent patterns: the age range with the highest frequency of death was 30–39, and the years of experience with the highest frequency of death was 0–4. In fact, the analysis indicates an even stronger pattern of the deadly combination of age and tenure. Implications of the study include the need for larger scale data collection on the national population of officers, detailed information on transfers and time of service overall (as opposed to time in service at current department), and evaluations of current training programs and practices regarding de-escalation and the use of force as well as self-defense and situational awareness.
Introduction
In light of recent widespread attention to policing practices, policies, and training operations, including calls to “defund the police” and “police reform”, it is important to understand and examine the danger of existing policing practices and policies as they pertain to officer safety, specifically line of duty deaths. By identifying those conditions associated with line of duty deaths (both increases and decreases), policy, practice, and training changes can be made with the goals of both increasing officer safety and addressing important community concerns around police practices and community member safety. The rate of law enforcement officer deaths has been decreasing for 20 years, falling from 3.4 deaths per 1,000 officers in 1973, to 1.6 per 1,000 officers in 1983, and further to 1.1 per 1,000 officers in 1993 (Fridell and Pate, 2001: 637). According to the Uniform Crime Reporting Program, “the (total) number of law enforcement officers who were feloniously killed fell from a high of 134 in 1973 to below 100 per year in the early 1980s, and then fell again in the late 1980s” (Fridell and Pate, 1993, 2001: 637). During the 1990s, law enforcement officer deaths fluctuated “between 66 (1990) and 76 (1994), representing a decline of about 50 per cent since the 1970s” (Fridell and Pate, 1993, 2001: 637). This decline was arguably even more significant because of the increasing number of law enforcement officers hired and placed on the street. Although no single explanation clearly identifies the reason for this dramatic decrease, several contributing factors have been identified such as “the introduction of soft body armor, … the adoption of sophisticated training procedures, … and revised policies and procedures” (Fridell and Pate, 1993, 2001: 637).
Overall, data from the Department of Justice suggest that felonious line-of-duty deaths decreased from the 1970s to 2009. The years 2000 and 2001 were an exception to this trend even after excluding officers who lost their lives in terrorist attacks. There was another spike in 2010 and 2011, which has been attributed to “cluster killings”, before the number of felonious officer deaths returned to its overall declining trend (Kachurik et al., 2013).
A 2001 California Law Enforcement Officers Killed and Assaulted (LEOKA) study concluded that, rather than demographics, the major contributors to felonious officer deaths for California law enforcement officers (1995–1999) were issues such as poor training and overconfidence. These conclusions led to policy and training implications and implementations (POST, 2001). Therefore, to aid the development of training and policy adjustments, Tucker-Gail et al. (2010) examined the patterns of age and tenure within the felonious officer death data between 1995 and 1999 nationwide and found that the age and tenure of most victim officers may be related to circumstances such as police department hiring rates (Tucker-Gail et al., 2010). Because of the effects of time on the police department hiring climate, the continued overall downward trend in felonious officer deaths, and the spike in 2010 and 2011, replication of this study on age and tenure patterns between 1995 and 2015 will allow for a clearer picture of how these key characteristics are related to felonious officer deaths. Such information will further benefit the development of training practices and policies toward keeping officers and communities safer.
Literature
Since 1945, the Federal Bureau of Investigation (FBI) has kept track of line-of-duty officer deaths. The FBI has consistently gathered information and expanded its collection of data on officer deaths, resulting in the publication of annual LEOKA reports. These reports continue to assess a number of dynamics, factors and circumstances, and reasons for the death of law enforcement officers across the United States. In essence, in its LEOKA reports, the FBI attempts on a yearly basis to look at what is referred to as a “deadly mix” understood as the combination of the characteristics of the officer, offender, and the circumstances that brought them together (Henry, 2004). In exploring this “deadly mix”, a study was conducted by the FBI (1992) that examined circumstances such as officer personality type and offender characteristics in an attempt to assess potential contributors to law enforcement officer deaths.
In 2009, the National Law Enforcement Officer Memorial Fund (NLEOMF) began collecting and continuously reporting law enforcement officer deaths across the United States. The Preliminary Law Enforcement Officers Fatalities Report focuses mostly on information relating to the circumstances or contexts of both incidental and felonious officer deaths, as well as the basic demographics of fallen officers (NLEOMF, 2018). These reports are derived from the Memorial Fund's own database of fallen officers with the purpose of honoring those officers as well as establishing safer practices for law enforcement practitioners.
There are four major categories of studies conducted on law enforcement officer deaths. First are the macro-social studies that explore the social and theoretical aspects of law enforcement officer deaths including community and structural foundation. Second is the collection of studies conducted on the characteristics of slain officers which examine the activities officers were involved with at the time of their death. Third are studies that examine the characteristics of offenders who committed police homicide (King and Sanders, 1997). Fourth is research conducted on the social–psychological aspects of law enforcement officer deaths. These studies attempt to measure the impact on officers who have survived near-death encounters and the psychological ramifications for the victim officers’ families and coworkers.
Two patterns emerge from research related to the characteristics of slain officers. The first is an effort to look at individual officer characteristics—often in an attempt to predict a personality type or trait of victim officers. One unique example of studying individual officer characteristics is the study by Gibbs et al. (2014). In this replication of a previous study, Gibbs and coworkers found that officers with greater social investment (such as marriage and/or having children) were less likely to be feloniously killed.
The second pattern is the identification of the specific circumstances in which the officer was murdered. An example includes the annual FBI LEOKA reports (King and Sanders, 1997). Further examples of studies that use descriptive statistics to “isolate a ‘typical’ victim officer” (King and Sanders, 1997: 395) are those conducted by Blair et al. (2016), Cardarelli (1968), Chapman (1976, 1986) and Wilbanks (1994). The results of these studies support the same findings. Victim law enforcement officers tend to be younger, white males (King and Sanders, 1997). One value of these studies is simply to provide agencies and society with an assessment of law enforcement officer deaths. More important, however, is their potential to aid in making recommendations for policy and training practices by identifying patterns or trends in the data.
In addition to the individual characteristics of the officers, a number of studies try to assess the circumstances and tasks the victim officer was performing when murdered. For example, Garner and Clemmer (1986) focus on the misconception that domestic disturbance calls account for the majority of police officer deaths. According to recent studies, domestic violence calls account for only a small number of police officer fatalities compared with the general disturbance category. For example, the International Association of Chiefs of Police (IACP) reports that 157 police officers were killed between 1976 and 1986 while responding to disturbance calls. This accounts for 22% of all police officer fatalities during this period. According to the FBI, from 1960 to 1984 the “Disturbance” category ranked third among the categories of police officer fatalities. Because the category “Disturbance” includes more than just domestic disturbances, for example, bar fights and gang fights, the conception that domestic disturbances are a major source of officer fatalities appears faulty. Thus, the FBI created a separate category to classify domestic disturbances and discovered that this category accounted for only seven officers (8%) who died in 1982 (Garner and Clemmer, 1986). Later, the FBI reported that 8% or 5 of the 57 officers killed in 2007 were on domestic disturbance calls (FBI, 2007).
More recent literature again disputes the conception that responding to domestic violence calls is the most common context for law enforcement officer homicides. In a focused effort to dispel the above-mentioned misconception, Meyer and Carroll (2011) reviewed all of the available cases of law enforcement officer homicide and found that 106 cases (of 771 in total) between 1996 and 2009 occurred during a domestic disturbance. In a study covering the same period, Kercher et al. (2013) determined that although there were 452 potential domestic disturbance cases based on the original report’s categorization, only 116 were confirmed as cases of a domestic disturbance. Both studies reveal that the proportion of officer homicides that actually result from domestic disturbances does not measure up to what has been traditionally believed.
Finally, there is existing literature that explores the circumstances of one- or two-officer car assignments on officer deaths (Dart, 1989; Kaplan, 1979; Larson and Rich, 1986). Most prior studies suggest that a single-officer patrol is statistically safer than a two-officer patrol when injuries and traffic accidents are analyzed, although findings have been somewhat mixed with regard to felonious deaths (Dart, 1989; Kaplan, 1979; Wilson and Brewer, 1992). Perceptions of safety favor two-officer patrols (Larson and Rich, 1986). However, counterintuitively, it appears that individual officers are more cautious when alone, yielding a net overall benefit to single-officer patrols according to other studies (Wilson and Brewer, 1992).
Method
We used a 20-year data set covering the period 1995 to 2015 obtained from the FBI, Criminal Justice Information Services Division (FBI 2018). To align with the work of Tucker-Gail et al. (2010), the current study sorted the variables age and tenure to determine their impact on other categorical data fields containing details of felonious officer deaths. The data represented the entire population of all known felonious officer deaths that occurred during the period 1995 to 2015, as reported to the FBI. Owing to the continued overall downward trend in the numbers of these deaths, the continued development of better policies and training programs, and the need to provide an informed foundation for those trends and developments, we chose this sample to continue our previous study and to determine whether the patterns found previously remain true over a wider time span.
The sample used in this study included 1,055 law enforcement officer deaths for the years 1995–2015. Of these victims, 48 were female (or 4.5%) and 1,007 were male (95.5%). Officer age ranged from 20 to 72 years with a mean of 37 years. On average, officers had roughly 10 years of experience on the job prior to being killed, with years of experience for these officers ranging from 0 to 42. The most common scenario was “investigating suspicious persons or circumstances”, which accounted for 14.5% of incidents. The next two most common scenarios were traffic pursuits and stops for a traffic violation (11.4%) and ambushes as an unprovoked attack (9.7%). Figure 1 shows the trend for total officer deaths by year. In 1995, 74 law enforcement officers were killed; this figure fell to 48 in 2000. In 2005, there were 53 officer deaths, and the total decreased to 48 for 2010. Finally, the total decreased even further to 36 total officer deaths in 2015.
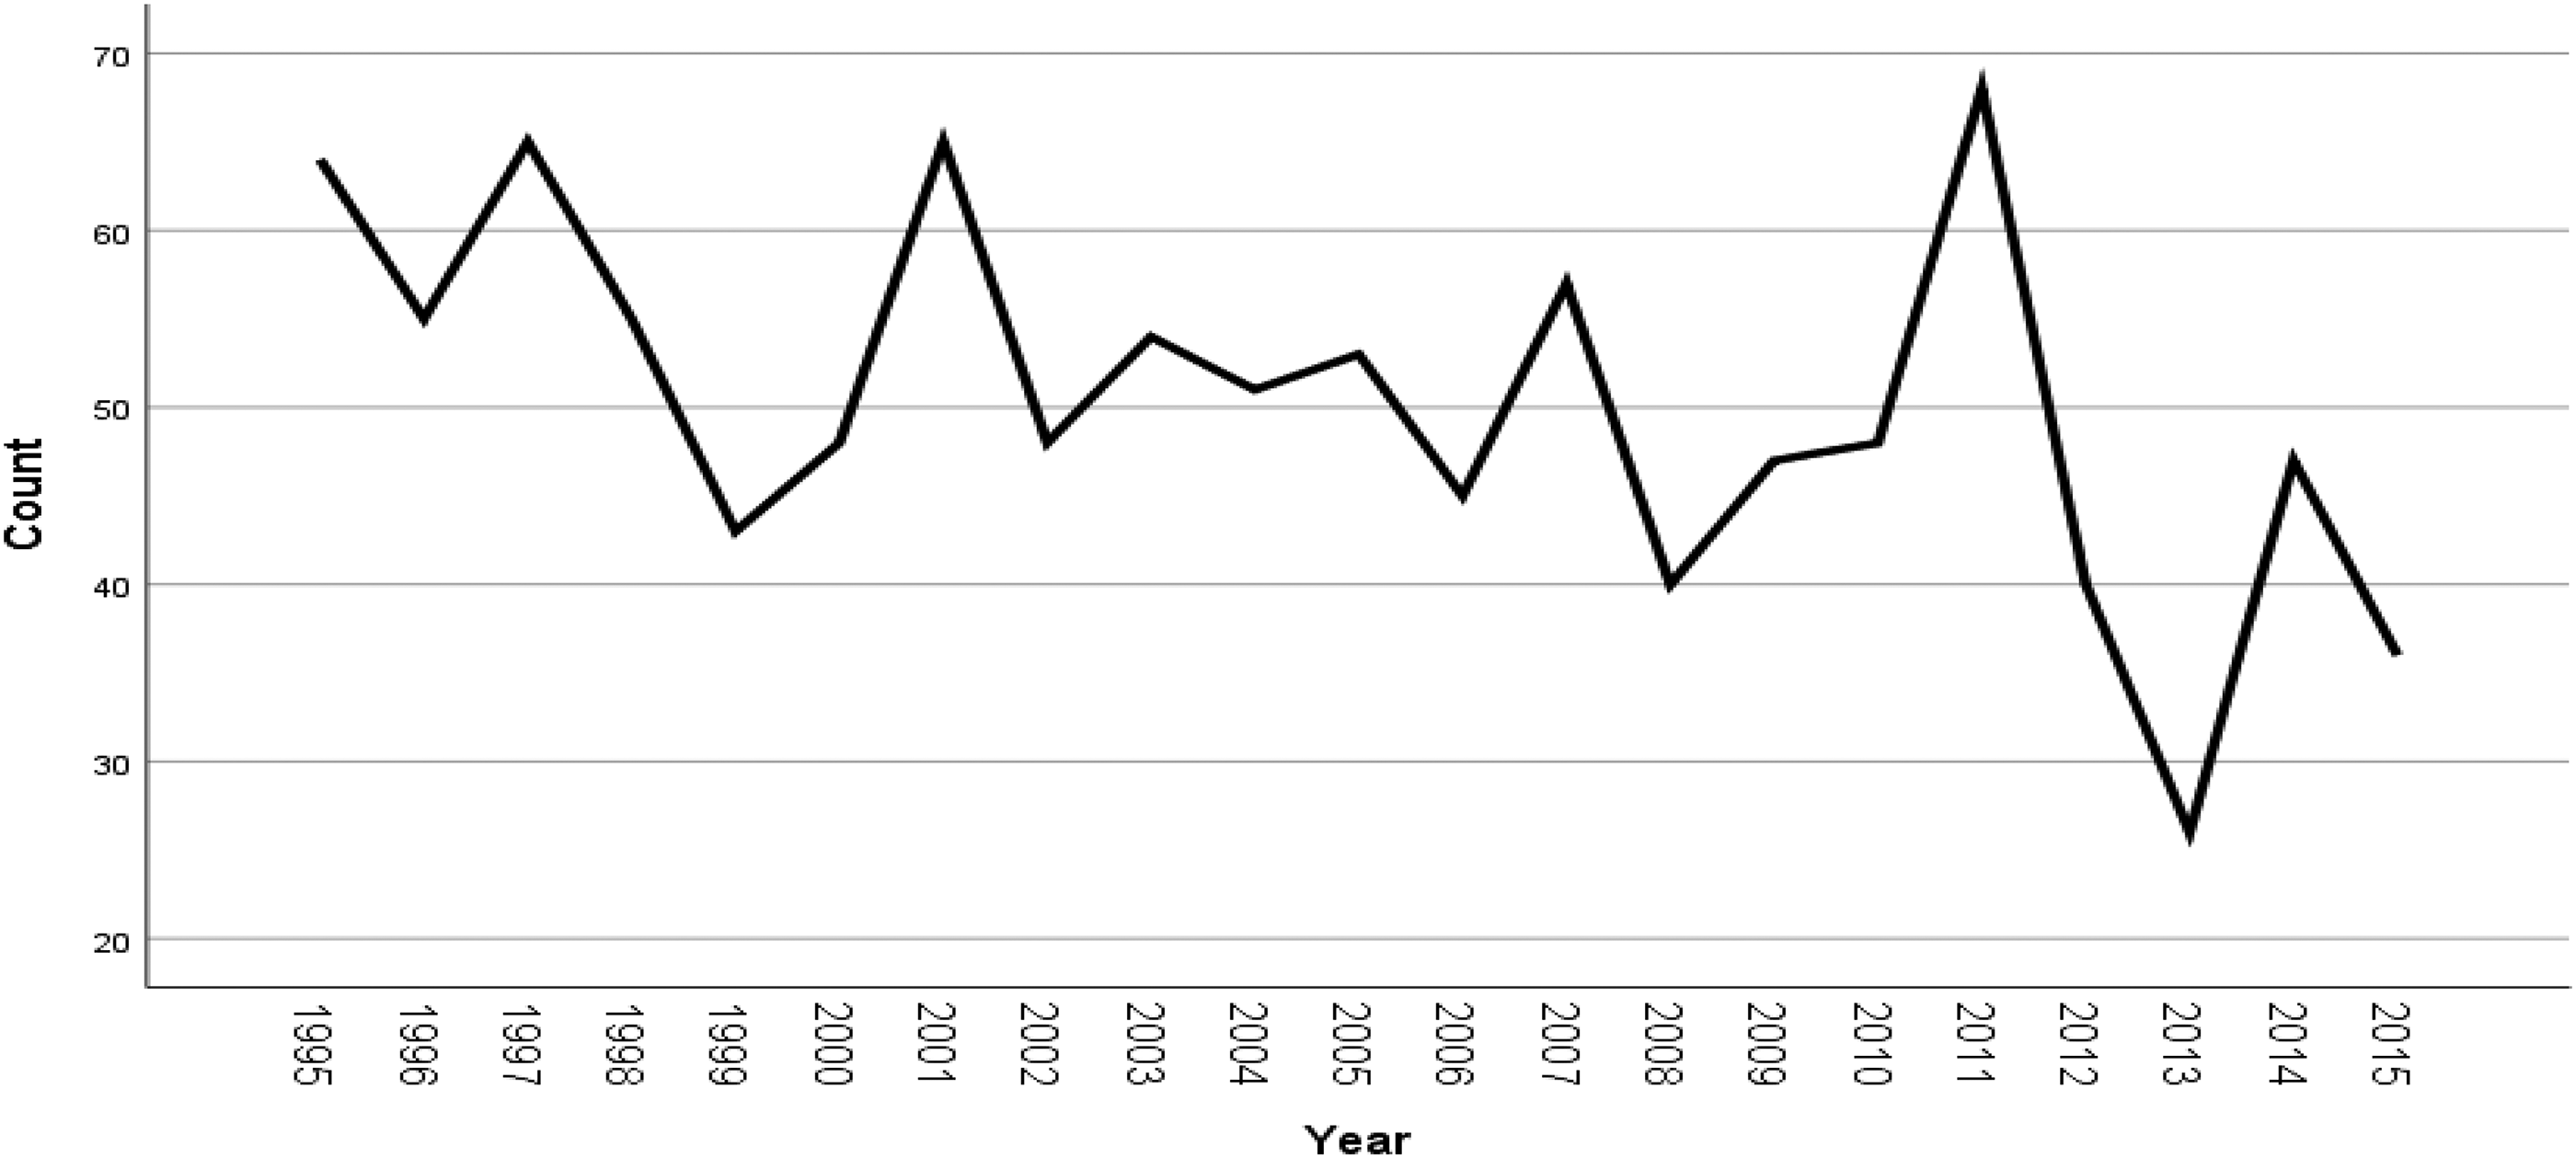
Officer death trend line by year.
Because the age of the victim officer is not a field in the data set, the age variable was created by inserting a field that used a formula to subtract the date of birth from the date of death. The age range for officers feloniously killed between 1995 and 2015 was 20–74 years, with three events not reporting the age of the deceased officer. For purposes of comparison, the age variable was broken down into five rows of age groupings divided into 10-year increments, and a row was included to count events where age was not reported.
Tenure combined two fields in the data, experience (years) and experience (months). A field was inserted that used a formula to multiply the years of experience by 12, and then added the experience (months) field, to establish the total months of employment. The total months of employment served as the baseline for determining tenure. Tenure on the job for officers feloniously killed between 1995 and 2015 ranged from 1 to 510 months, with six events not reporting length of officer experience. For purposes of comparison, the tenure variable was broken into eight rows of experience groupings divided into 5-year increments, and a row was included to count events where experience was not reported.
Crosstabs were developed to summarize and compare the age and tenure fields in table and chart formats against the fields year (1995–2015), month of death, time of day, presence of a uniform, presence of a bullet-resistant vest, type of assignment, and whether an officer was killed with his or her own weapon.
Two-way contingency tables were analyzed to investigate relationships between the variables age, tenure, use of body armor, and uniform. The data were entered into chi-square crosstabs. As anticipated, some cells were lower than the minimum expected count of 20%. This is due in part to the sample. For example, there are often fewer detectives killed in the line of duty than uniformed patrol officers, as indicated in this report.
Findings
The data revealed 1,055 felonious officer deaths between 1995 and 2015. In the previous study by Tucker-Gail et al. (2010), the data showed a negative linear trend from year to year with the exception of 1997, which showed a slightly positive trend. Therefore, as the years progressed from 1995 to 1999, the overall pattern with regard to felonious officer deaths was declining, with the exception of 1997. As explained in the sample description, the current study still shows an overall decline in officer deaths for the period studied. Occasional spikes in officer deaths are also shown to continue; there was a spike in 2001 even after accounting for the events of September 11th, and, as mentioned, there was also a large spike in 2011 which may be attributed to cluster killings.
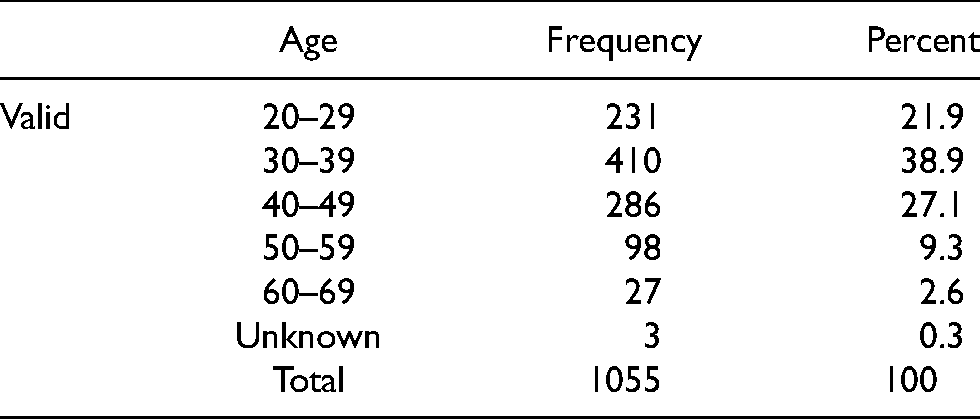
Because the impact of age and tenure are the focus of this article, it was important to establish the frequency ranges and frequencies of both age and tenure measurements. Age was sorted into five frequency ranges each of 10 years and tenure was sorted into eight frequency ranges each of 5 years. The age frequencies are displayed in Table 1. Similar to the previous study (Tucker-Gail et al. 2010), the age frequency range that had the highest overall number of deaths was the 30–39 category, which accounted for 39% (n = 410) of all officer deaths. This age range also accounted for the highest count by year for 16 of the 21 years. The age ranges 40–49 and 20–29 followed with 27% (n = 286) and 22% (n = 231) of all officer deaths, respectively. The significance of these findings is that while it is often assumed that the youngest officers are at risk, these data show that officers in their 30s and 40s are actually at the greatest risk for felonious death. It should also be noted that compared with the previous study, the 40–49 year age group had the same percentage of officer deaths over the study period, whereas the percentage of deaths for the 20–29 year age group decreased. This shows that when additional years are added, the highest proportion of officer deaths is skewed toward the middle age categories. There is a statistically significant relationship for the paired variables age and year during which the officers were killed, within p = .05 analyses.
Total age frequencies for years 1995–2015.
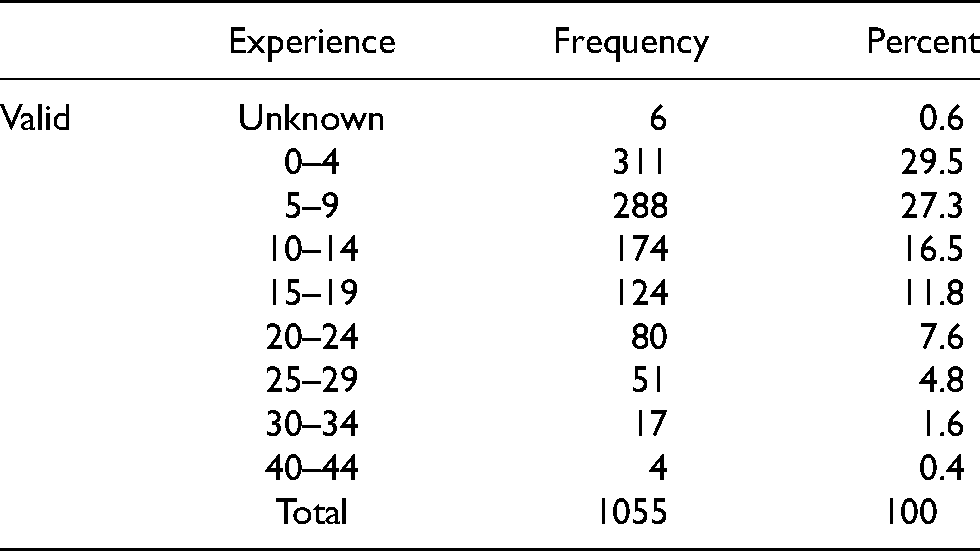
Based upon the findings for age, the tenure of officers feloniously killed was examined to determine whether experienced officers in their 30s and 40s were at risk, or whether the officers killed were newer to law enforcement, and less experienced. Table 2 revealed patterns that may be counterintuitive to the age data, suggesting that officers in the 0–4 years of experience group have the highest frequency of felonious officer deaths by experience increment, with 30% (n = 311) of the deaths occurring in that range. The ranges 5–9 and 10–14 years of experience followed with 27% (n = 288) and 17% (n = 174) of officer deaths, respectively. Evidence from the tables indicates that the officers most at risk of a felonious death are those in their 30s with 0–4 years of experience. This is consistent with the previous study and seems counterintuitive because entry-level law enforcement positions would seem to be attractive to people in their 20s who are entering the career straight out of either school or the military. However, these data do not reveal total experience within law enforcement as an occupation, only time with the agency at the time of death. There is no way to determine the impact of job migration practices that have emerged in law enforcement in recent years, such as lateral transfers. Other career data relative to education or military experience are not contained in the data.
Total experience frequencies for years 1999–2015.
Time of day is a field often used in measuring when officers are killed. Within these data, fields were constructed for traditional daytime hours (06.00–17.59) and evening/night hours (18.00–05.59). These fields were measured against the age and tenure increments. These findings were more in line with intuitive conclusions because younger officers early in their career are more likely to be part of an assignment requiring evening/night hours, and officers who are more tenured in their career are more likely to work daytime hours. The highest frequencies of officers killed by age were found during the evening/night hours of 18.00 to 05.59. In the data set, these hours accounted for 56% (n = 592) of officers killed. Within the evening/night hours, the 20–29 and 30–39 year age ranges accounted for the largest frequency of officer deaths, 148 and 255, respectively. Again, however, it should be noted that the 30–39 and 40–49 year age ranges had higher numbers of deaths than the 20–29 year age range. The age ranges of 40–49, 50–59 and 60–69 years all showed higher incidences of death during daytime hours, with frequencies of 150, 55 and 20, respectively. So within these data, and similar to the previous study, officers in the 20–29 and 30–39 year age ranges have the highest frequency of death during evening hours, and officers in the 40–49, 50–59 and 60–69 year age ranges have the highest frequency of death during the daytime hours.
The time-of-day fields were then used to measure the frequency of officers killed by experience increments. Again, the results were fairly consistent with intuitive thought and the previous study as officers in the 0–4 and 5–9 years of experience ranges had the highest death rates in the data set at 311 and 288, respectively. In addition, these officers were more often killed during the evening/night hours of 18.00 to 05.59, with 192 and 176 officers killed at these times, respectively. Officers in the 10–14 years of experience range were killed more often during daytime hours of 06.00–17.59, with 89 officers killed at these times, respectively. Interestingly, the 15–19 and 20–24 years of experience ranges had the same number of officers killed for both times of day. All other advanced experience ranges showed higher frequencies of death during daytime hours.
When the presence of a uniform was compared with decade of age, it was interesting to note that all five decade increments showed higher death frequencies when officers were in uniform than out of uniform. This is especially interesting because the previous study showed this for only three of the five increments. All but one of the age ranges also met or exceeded a ratio of three to one in the number of uniform to non-uniform deaths. As shown in Figure 2, the comparative frequencies for each of the 20–29, 30–39, 40–49, and 50–59 age ranges for number of deaths in uniform compared with not in uniform were 194 to 37, 312 to 95, 231 to 55, and 75 to 22, respectively. The 60–69 age range had over twice as many deaths of officers in uniform, with a comparative frequency of 19 in uniform to 8 not in uniform. Overall, more officers were killed in uniform in the 30–39 age range than in any other decade. However, when a two-way contingency table analysis was used to evaluate whether there was a significant relationship between age and uniform, no significant relationship was found (χ2 = 12.042).
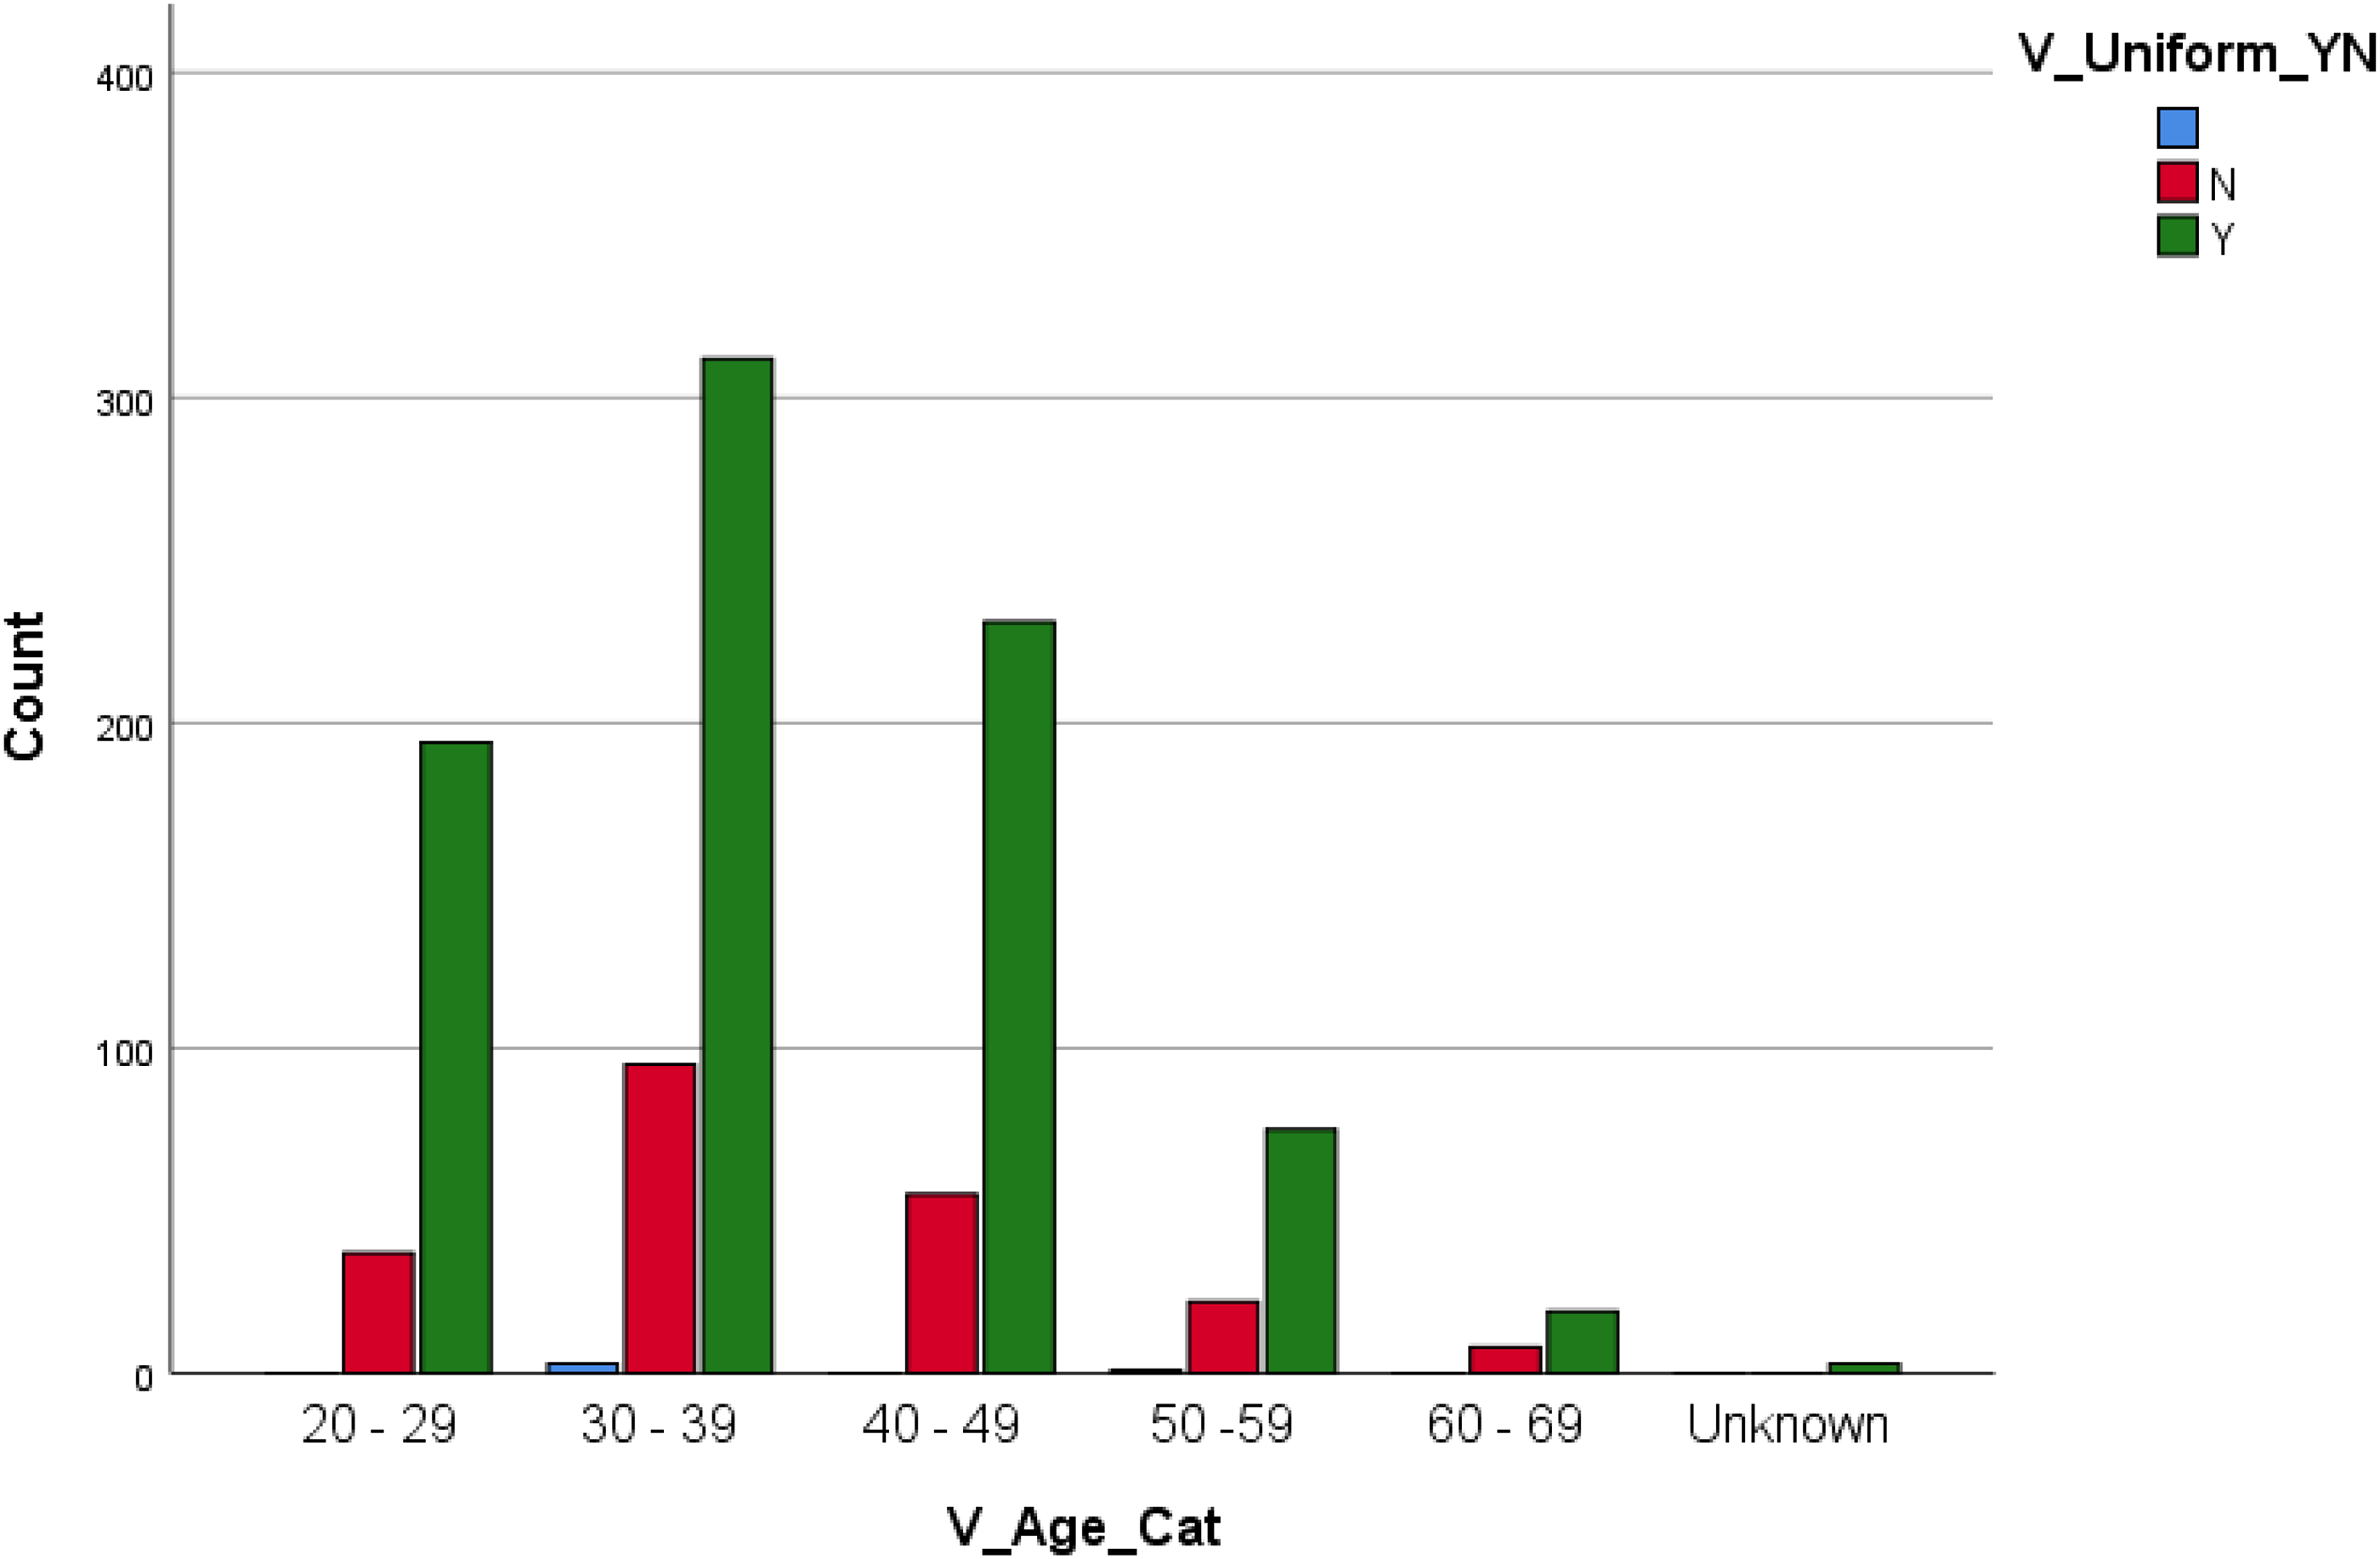
Frequency of officer deaths by age and presence of uniform.
When the presence of the uniform was compared with experience, our calculations show that overall, 79% of the officers recorded were killed when in uniform compared with 21% who not in uniform when killed. Figure 3 reveals that, similar to what occurred when comparing age ranges with the presence of the uniform, all eight experience increments showed more officers killed in uniform than not in uniform: those experience increments included 0–4 years (265 to 46), 5–9 years (224 to 62), 10–14 years (129 to 43), 15–19 years (87 to 37), 20–24 years (67 to 13), 25–29 years (38 to 13), 30–34 years (15 to 2), and 40–44 years (3 to 1). These results were again different from the previous study, as they show more experience ranges with more officer deaths in uniform than not in uniform. Overall, more officers in uniform were killed in the 0–4 years of experience group than any other experience increment. However, when a two-way contingency table analysis was used to evaluate whether there was a significant relationship between experience and uniform, no significant relationship was found (χ2 = 24.976).
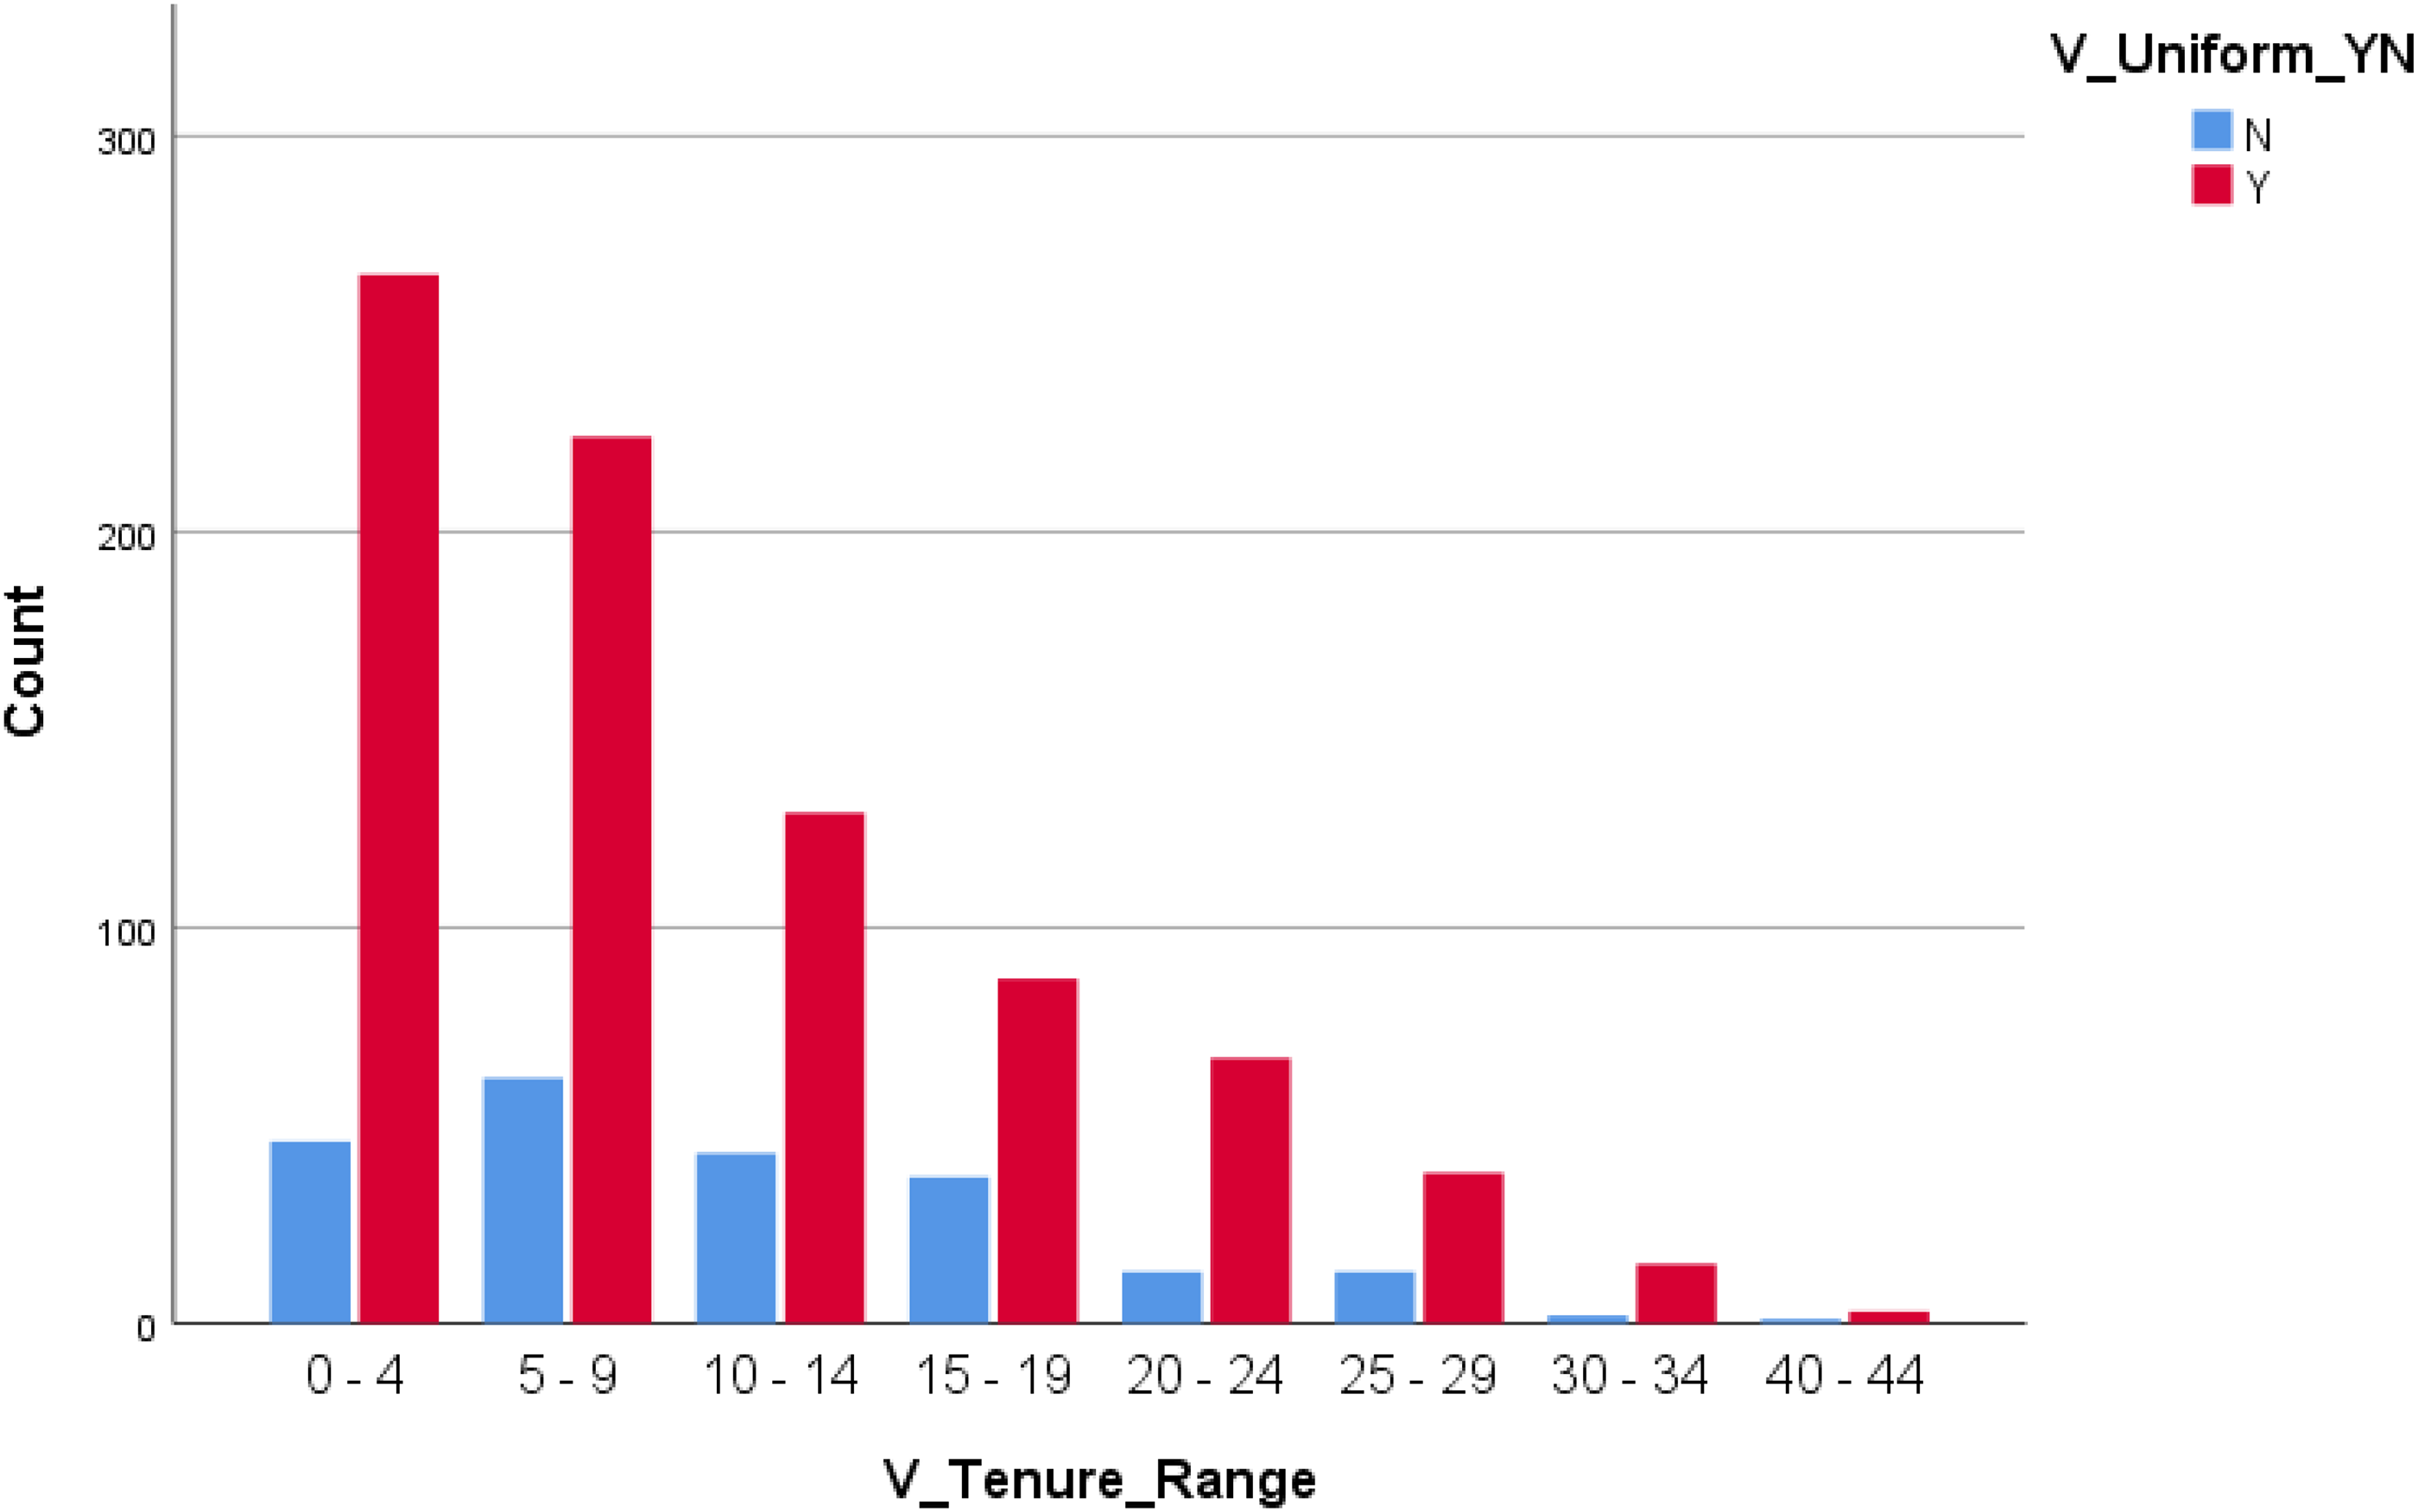
Frequency of officer deaths by experience and presence of uniform.
Building on the presence of the uniform, the next logical area of comparison in the data was the presence of a bullet-resistant vest. The presence of the vest was first measured against the age decade (Figure 4). The age increments of 20–29, 30–39, and 40–49 years had higher frequencies of officers wearing a vest than not wearing a vest: 184 to 43, 287 to 117, and 167 to 113, respectively. By contrast, the two age ranges of 50–59 and 60–69 years had higher frequencies of officer deaths not wearing a vest compared with wearing a vest. When these two age ranges with and without a vest are compared with uniform and no-uniform deaths, both had higher rates of death in uniform. This suggests that officers in the 50–59 and 60–69 years age ranges are more often killed in uniform, but are not most frequently killed while wearing a vest. These appear to be age ranges that could benefit from the presence of a bullet-resistant vest when in uniform. Within these ranges, 94 of 125 officers were killed in uniform and 83 of 125 officers were killed while not wearing vests. Overall, within these data within this category, the highest frequency of death for the years 1995–2015 is among officers in the 30–39 year age range who are wearing a vest. There is also a statistically significant relationship for the paired variables age and whether the officer was wearing body armor for officer deaths between 1995 and 2015 (χ2 = 102.732, p < .001).
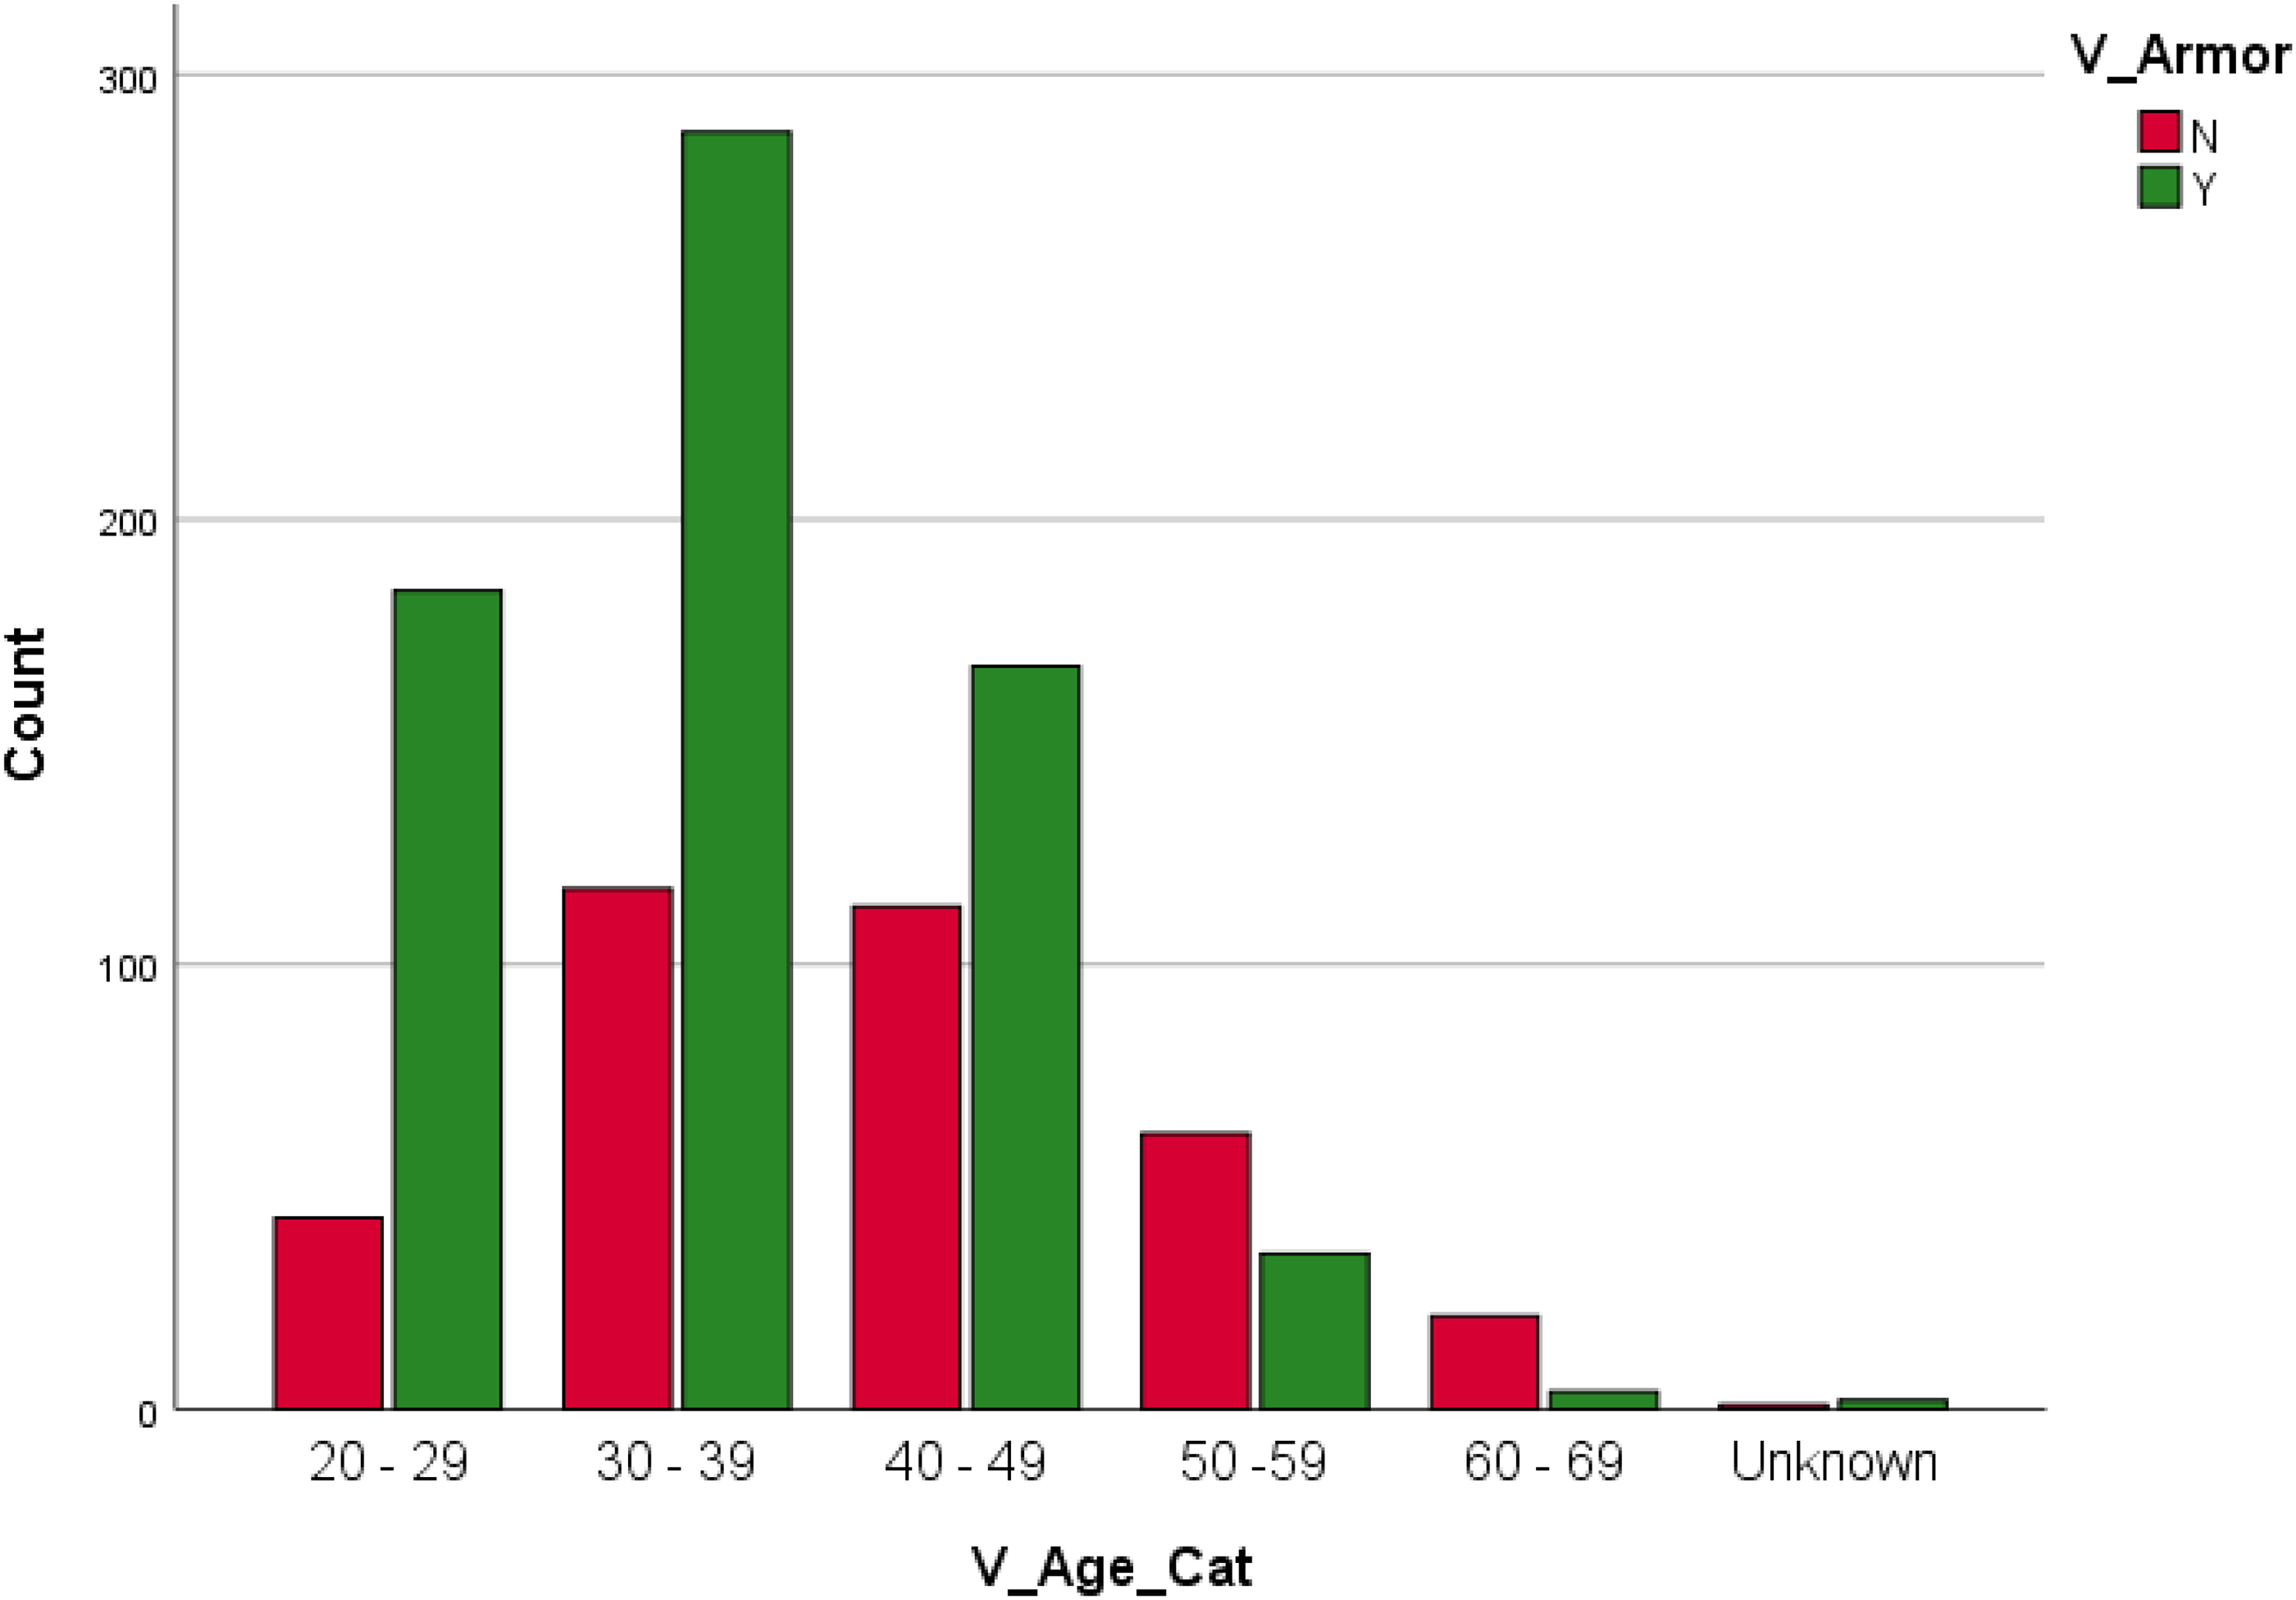
Frequency of officer deaths by age and presence of a bullet-resistant vest.
In Figure 5 the presence of a bullet-resistant vest was then compared with experience increments. Four experience increments showed higher officer death rates when comparing wearing vests to not wearing vests: these were 0–4 (247 to 61), 5–9 (189 to 92), 10–14 (111 to 60), and 15–19 (67 to 55). The other four increments of experience, consistent as expected with the age groups, had lower frequencies of death when comparing wearing a vest to not wearing a vest: those increments were 20–24 (35 to 43), 25–29 (22 to 29), 30–34 (3 to 14), and 40–44 (0 to 2) years. Overall, within the data in this category, an officer in the 0–4 years of experience range, wearing a vest, has the highest frequency of death for the years 1995–2015. When the variable years of experience was paired with body armor in a two-way contingency table analysis, a statistically significant relationship was found. The relationship between years of experience and whether the officer was wearing body armor at the time of death was significant (χ2 = 138.633, p < .001). This means that for officer deaths between 1995 and 2015, as years of experience increases, the rate at which officers were killed while wearing body armor decreases (0–4 years = 79.42%, 5–9 years = 65.63%, 10–14 years = 63.79%, 15–19 years = 54.03%, 20–24 years = 43.75%, 25–29 years = 43.14%, 30–34 years = 17.65%, and 40–44 years = 0%).
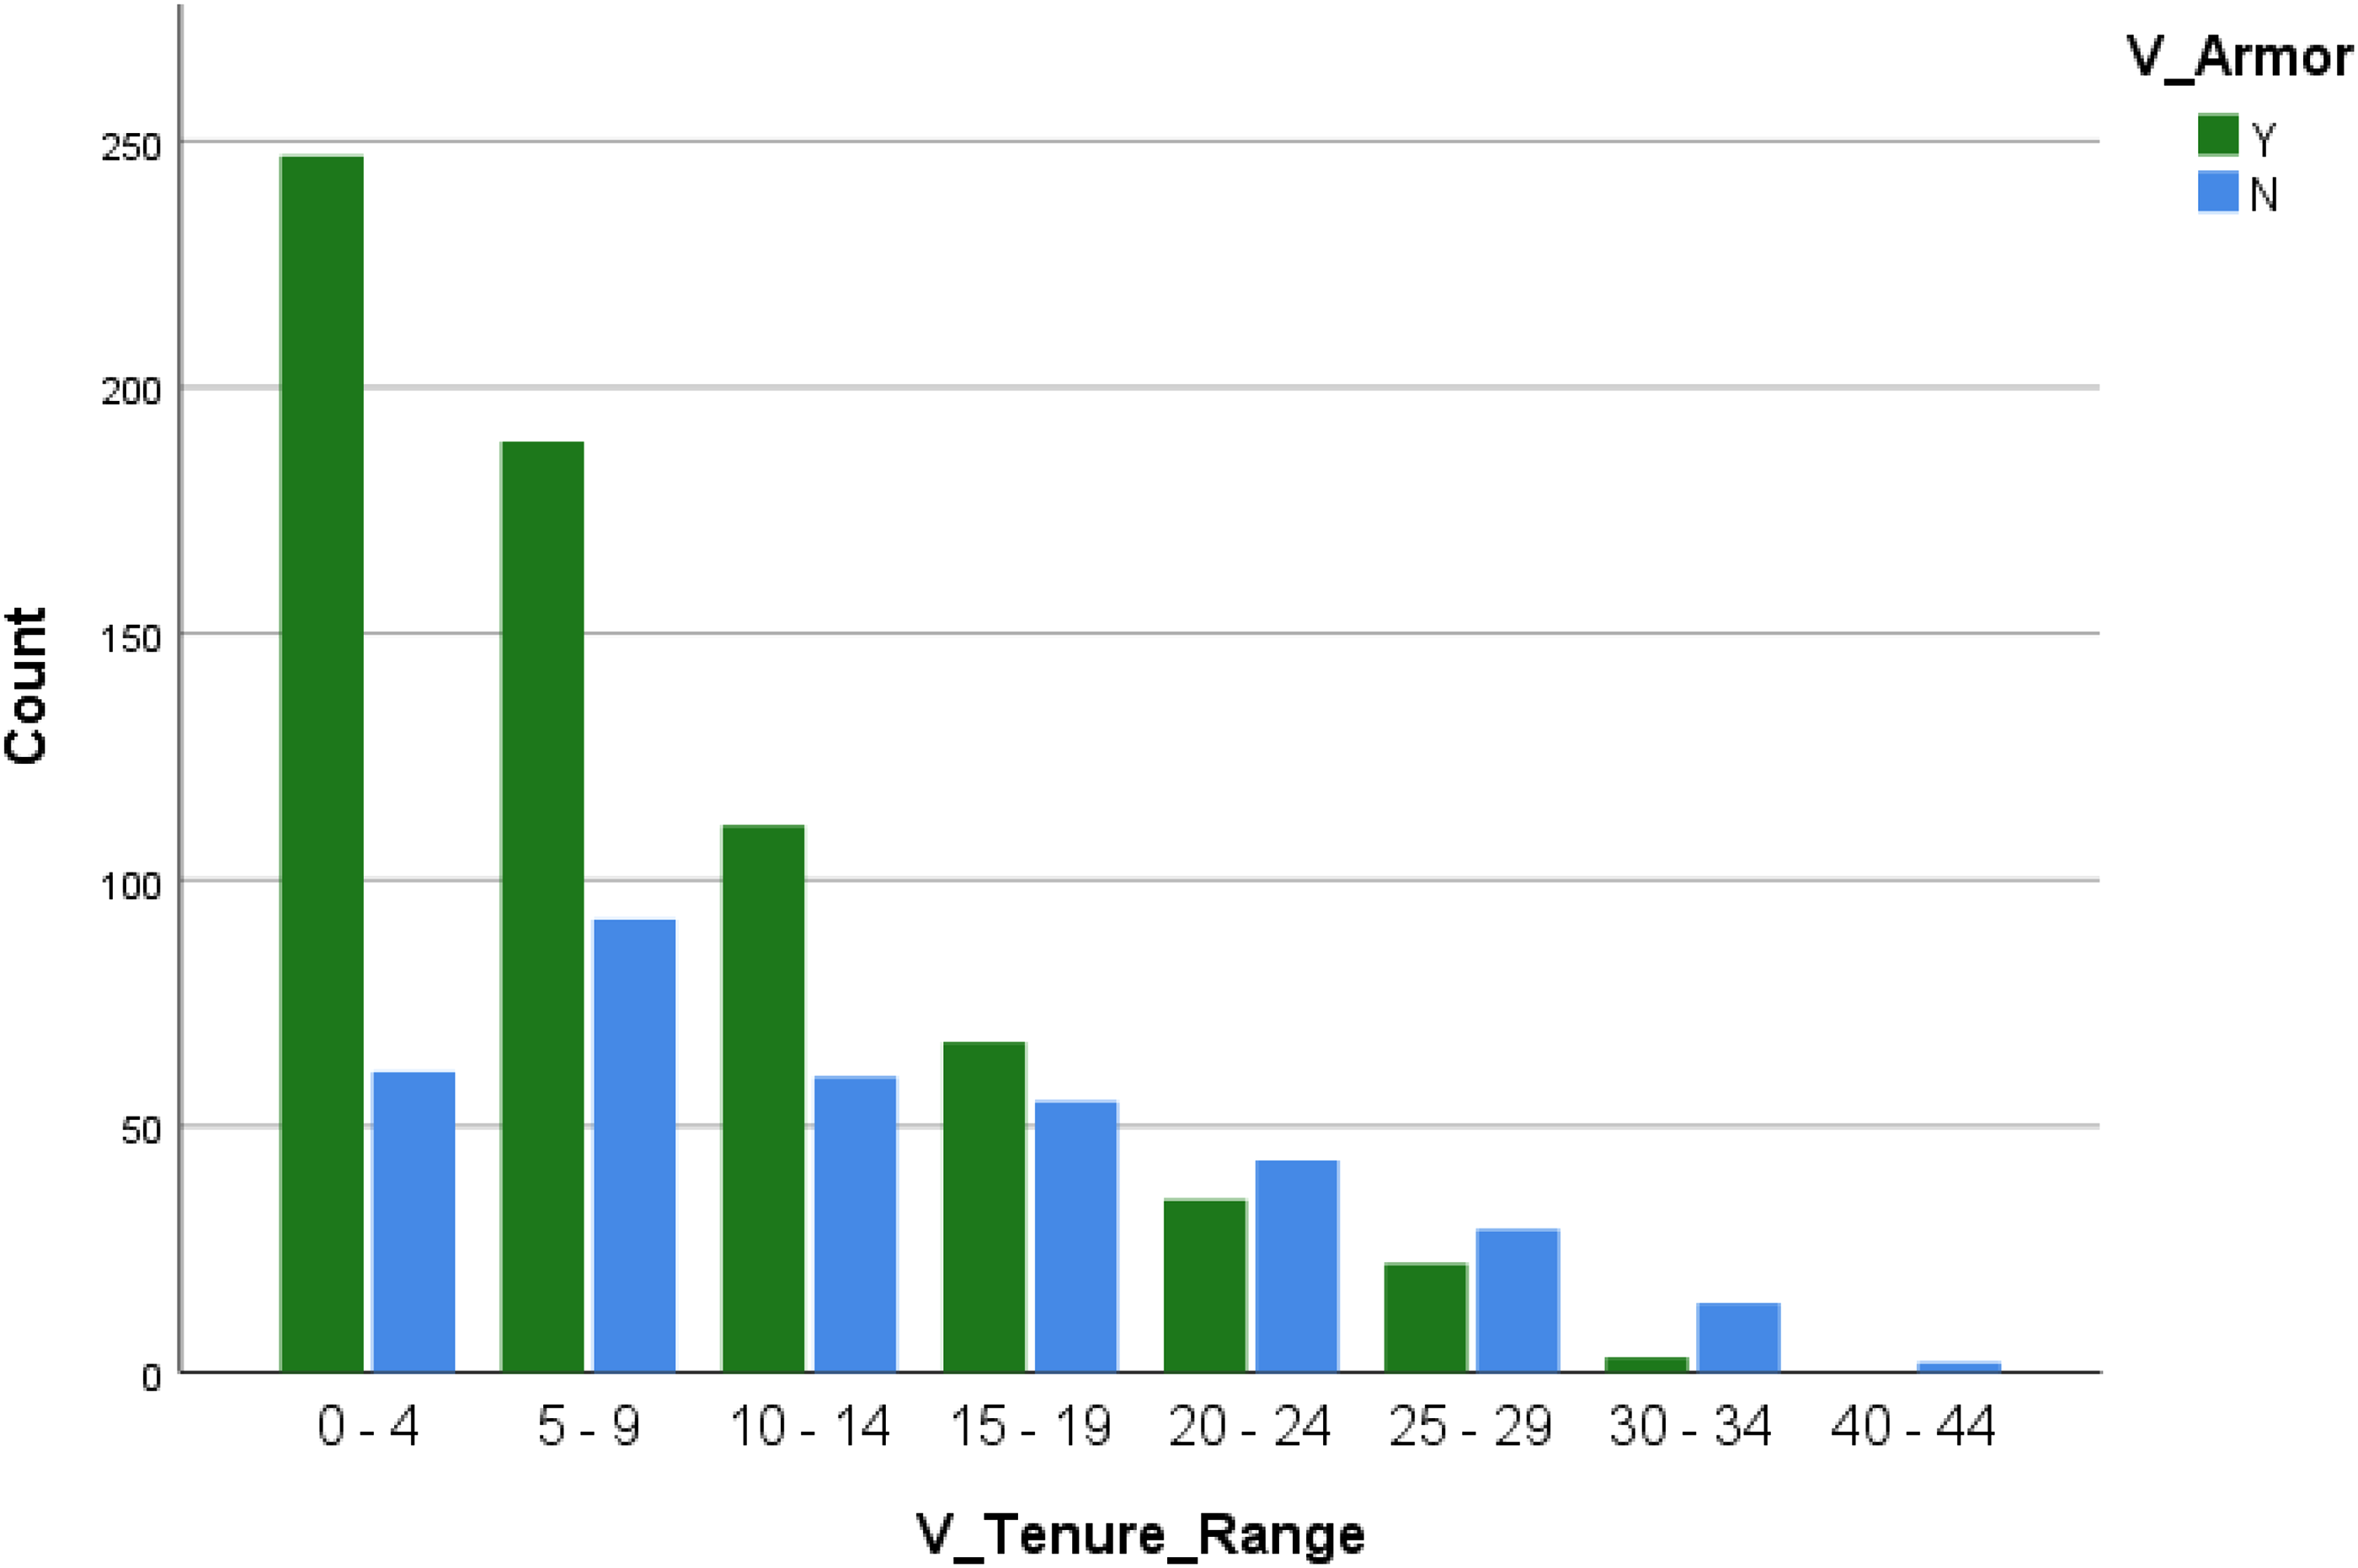
Frequency of officer deaths by experience and presence of a bullet-resistant vest.
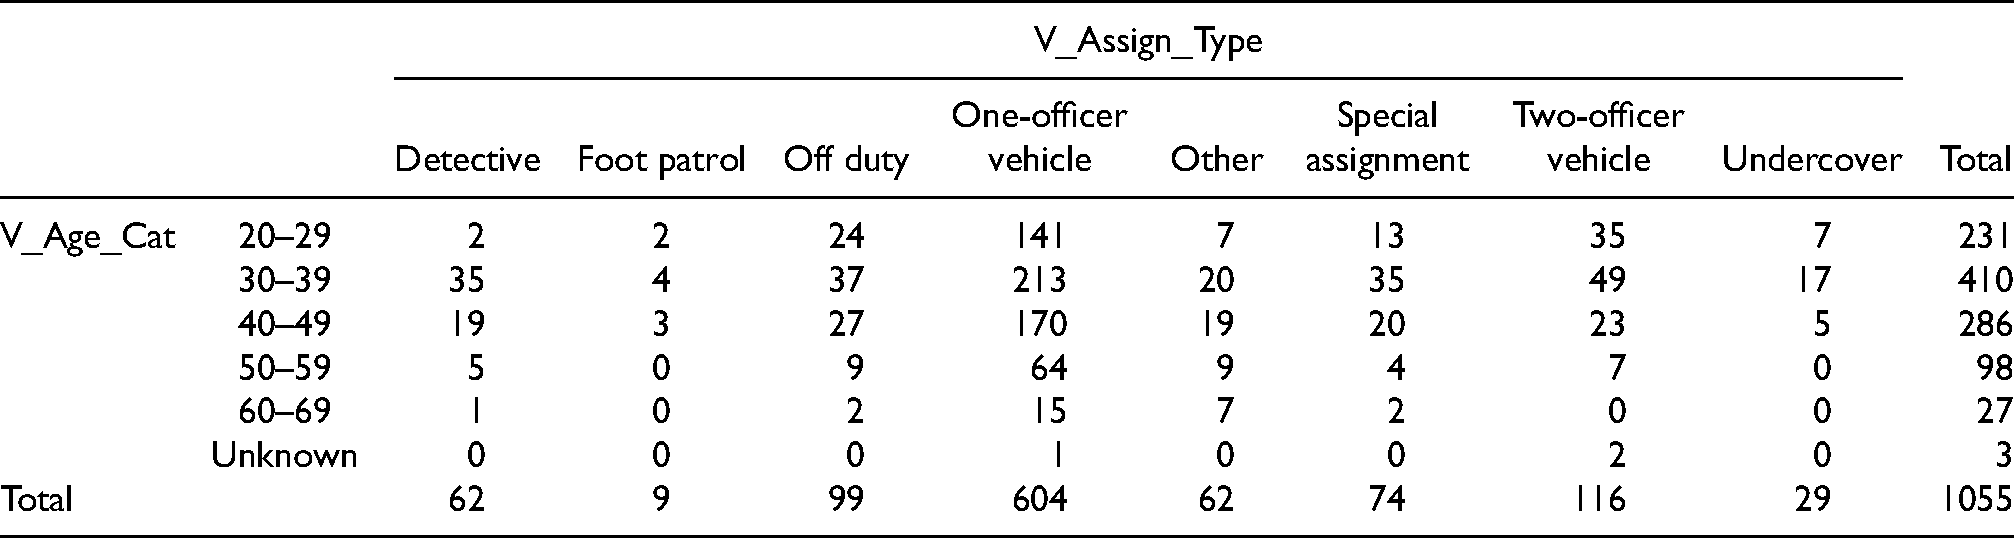
In Table 3 type of assignment was compared with age and followed a similar pattern to that from the previous study. Overwhelmingly, one-officer vehicle patrols resulted in the most officer deaths because over half of all officer deaths in this time frame resulted from that assignment. Within the deaths related to one-officer vehicle patrols, the 30–39 year age range had the highest frequency of death with 213 officers killed. Interestingly, this was followed by the 40–49 year age range with 170 officers killed. Third in frequency in one-officer vehicle patrols was the 20–29 year age range with 141 officers killed. Two-officer vehicle patrols followed a slightly different pattern with the 20–29, 30–39 and 40–49 age ranges showing 35, 49 and 23 deaths, respectively. Within these data, and this category, the highest frequency of death was among officers in the 30–39 year age range in a one-officer vehicle patrol. A two-way contingency table analysis found a significant relationship when age was paired with assignment (χ2 = 76.403, p < .001).
Frequency of officer deaths by age and type of assignment.
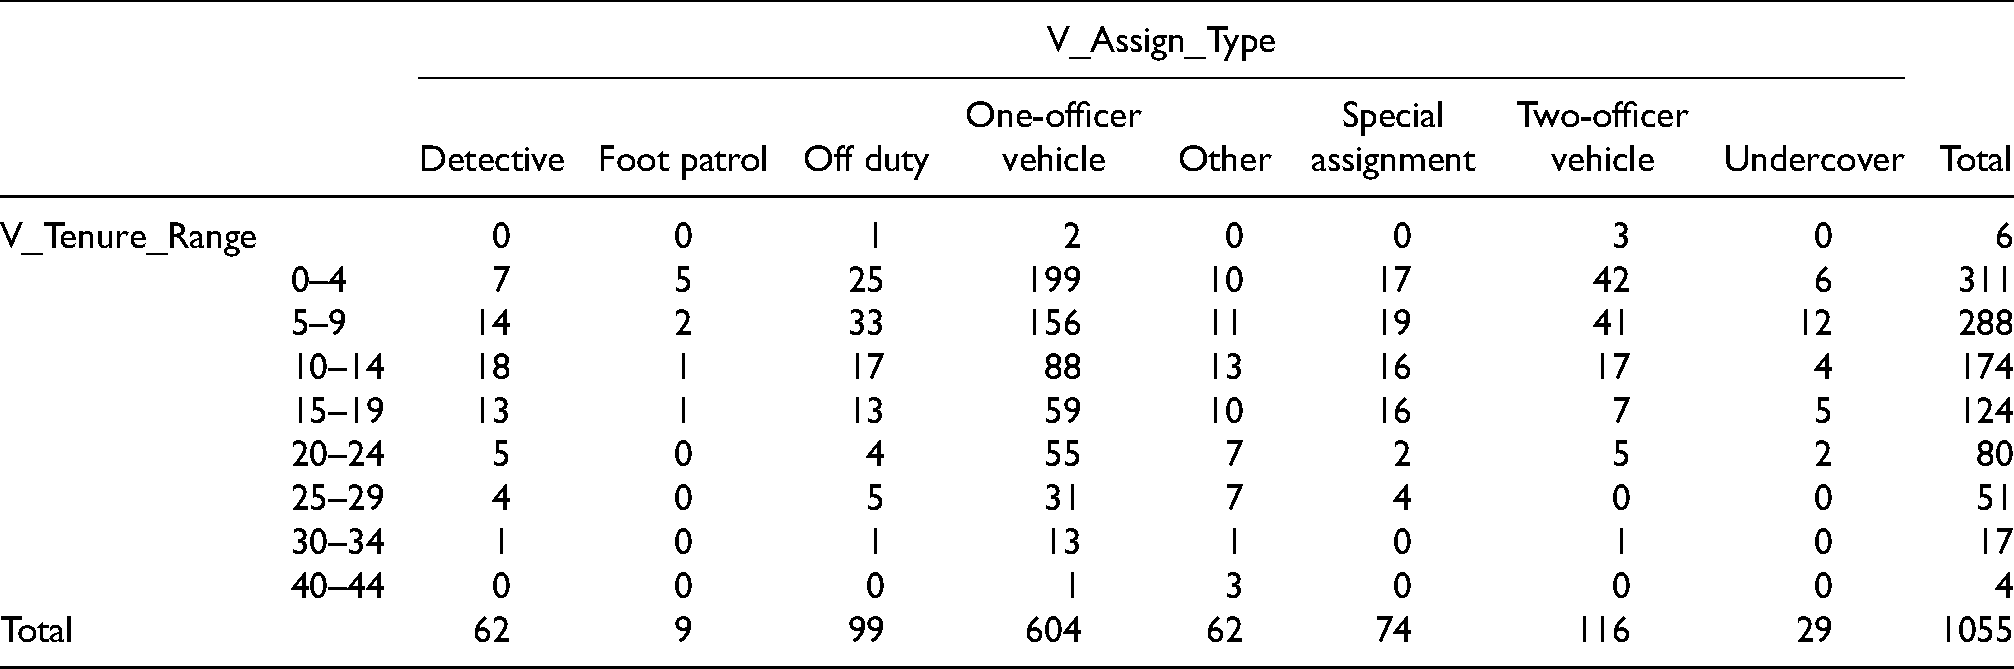
In Table 4, type of assignment was compared with years of experience increments. Again, this category followed the pattern established in this article and the previous study, showing the highest frequency of deaths (199) among officers with 0–4 years of experience in one-officer vehicle patrol assignments. This is followed by the 5–9 years of experience category with 156 deaths in one-officer vehicle patrols. These two frequencies combined are over twice as high as any other measured full category of assignment. Clearly, the deadliest combination of years of experience and assignment are 0–4 and 5–9 years in a one-officer vehicle patrol assignment, with 355 deaths of the total 1,055. When a two-way contingency table analysis was used to evaluate whether there was a significant relationship between officers’ years of experience at the time of death and assignment, a significant relationship was found (χ2 = 127.794, p < .001).
Frequency of officer deaths by experience and type of assignment.
The final comparison was the impact of age and tenure on an officer being killed with his or her own weapon. Interestingly, this category did not follow the established pattern with regard to age. The age range of 40–49 years had the highest frequency of officers killed with their own weapon, with 22 fatalities. This was followed by the 30–39 years age range with 19 fatalities. The 20–29 year age range was third with 15 fatalities.
When the killed with own weapon field was compared with years of experience, a slight deviation from the existing pattern in this article and the previous study was again observed. For most comparisons given, the years of experience measurement increment with the highest fatality frequency has been 0–4 years. In the killed with own weapon category, the 5–9 years of experience increment matched the 0–4 years of experience increment with 20 fatalities each. Conjecture would suggest that skills built in basic police training with regard to weapon retention may develop more effectively with years of experience gained than with actual initial training, because deaths by an officer's own weapon decrease quickly as years of experience increase. A two-way contingency analysis shows a significant relationship between years of experience and whether the officer was killed with his or her own weapon (χ2 = 68.092, p < .0010).
Discussion
This article followed up on a previous study looking at the impact of age and tenure on the data contained within the LEOKA summary data sets obtained from the FBI Criminal Justice Information Services Division (Tucker-Gail et al., 2010). The data fields compared included year (1995–2015), month of death, time of day, presence of a uniform, presence of a bullet-resistant vest, type of assignment, and whether an officer was killed with his or her own weapon.
The purpose of this article was to reassess previously studied patterns in the data for application within law enforcement when considering training needs over the life cycle of an officer's career. Two prevalent patterns were emphasized by the previous study within the comparison of the data to age and tenure: the age range with the highest frequency of death was 30–39, and the years of experience with the highest frequency of death was 0–4. Both held true throughout most comparisons. The previous study (2010) assessed the suggestions that complacency and/or carelessness among officers of this age is a potential contributor to their vulnerability (POST, 2001). With the literature suggesting mixed results in the relationship between one- and two-officer patrol cars as related to officer deaths (Dart, 1989; Kaplan, 1979; Larson and Rich, 1986), this study supports the findings that lone officers are more vulnerable with the highest frequency of death of officers. Simply stated, the suggestions are that officers either forgot their training or were overconfident in their abilities.
However, although the pattern of the 30–39 age range showing the highest frequency of officer deaths may marginally support such a notion, the second pattern of the lowest amount of experience (0–4 years) also showing the highest frequency of deaths suggests that other factors are likely at play. The previous study suggested that this may be due to departments across the nation experiencing high demand for officers and raising the maximum hiring age as a result (Tucker-Gail et al., 2010). This would help explain the odd deadliest combination of age 30–39 years and only 0–4 years of experience. However, as noted before, one of the biggest limitations with these data is the lack of information about individual officers' total experience, rather than only experience with their current agency at the time of their death. This makes it impossible to know for sure whether these officers are actually inexperienced yet older than most recruits, or whether these officers are slightly experienced overall but had transferred between departments.
The current study found similar patterns after including a much wider time span of 1995–2015. In fact, analysis of the data actually represents an even stronger pattern overall for the same deadly combination. However, the chi-squared analyses also show a stronger and more consistent overall pattern that as years of experience and age rise, lower frequencies of deaths occur within the comparisons tested. The difference in patterns between age and experience, however, may have a few important implications; the lowest amount of experience resembled the highest frequency of officer deaths, and chi-squared tests show linear relationships with experience, yet the linear relationships with age are broken owing to the 30–39 and 40–49 age ranges. First, the changes in hiring alluded to in the previous study actually occurred in 2007 (Associated Press, 2007), which is fairly close to the median of the years utilized in the current study, and coupled with these findings, may reinforce the idea of departments hiring older recruits. Second, these findings may again reinforce the previous study's suggestion that transfers between departments are affecting these patterns, which may imply that factors such as unfamiliarity with new jurisdictions and an officer's social “fit” within a new department may have effects on performance and tendencies to stumble into dangerous situations. Third, these findings may suggest that, regardless of the actual reason behind the differing patterns for age and experience, experience on the job is more effective in officer development than early training programs.
Limitations and future research
Comparable with the previous research, the main limitation of this study is the lack of additional data on each individual officer as well as the overall officer population for the country. As previously mentioned, data such as individual officers' total tenure rather than tenure with their agency at the time of death would be beneficial to understand the odd relationship between age and tenure shown in our findings. For instance, if the relationship of overall years of experience for officers matched more logically with their age, it could be implied that transfers to new departments led to a higher chance of dangerous and deadly situations for officers, and policies and procedures could be adjusted accordingly.
The limitation of the lack of data on the overall officer population makes our analyses difficult to validate. Statistically, it would be far preferable to analyze these relationships using rates of officer deaths per numbers of officers within each category rather than just the counts of officer deaths. Because we are limited to counts of officer deaths, it is impossible to rule out the effect of differing numbers of police officers overall within each age or experience category on their relationships to officer deaths.
Another limitation that has remained since the previous study is the lack of other research on the subject of officer death. This represents a lack of established patterns to test or build upon. This article, in addition to the previous study, helps to establish a pattern of officers in their 30s with the least experience being the deadliest combination. However, outside these studies, as shown in the literature review, it seems that most studies that are not outdated on this subject have been dedicated to officer circumstances, such as whether the officer was responding to a domestic violence call. Studies such as those by Gibbs et al. (2014) show promise of academic expansion within this subject area, because they study more unique yet helpful aspects of officer deaths such as officers’ social investment.
Larger-scale collection of data on the national population of police officers is again recommended for the sake of research in multiple areas involving police officers. As recommended previously, a census of police officers integrated within their certification process could improve academic research on police officers exponentially. Of critical importance is the inclusion of data that track and record detailed information related to officers who transfer and/or leave for other departments. Also of key importance is the exploration of officer assignment related to officer deaths, particularly one- versus two-officer vehicle patrols. This is important for the sake of better understanding of the various circumstances surrounding police work, as well as improving training programs.
The findings in this research related to experience and uniforms support future research related to officer deaths. Associated variables such as rank, gender, population, circumstance, and call for service all deserve a much more detailed review outside the scope of this article but could offer valuable insight through future study. In addition, a more comprehensive look at geographical location, department size, and urban versus rural population analysis would offer potentially impactful insights. Further, the implications of the findings in this article also reveal a great need for the future evaluation of police training programs. Because police department training programs often vary greatly, large-scale national data on training may not be appropriate for a study similar to that represented in this article. However, program evaluation methods could help to understand why felonious deaths occur so much more frequently for officers with fewer years of experience. They could also lead to important improvements in training practices to aid in protecting police officers’ lives. In the effort to ascertain whether training for officers transferring between departments could help in the development of skills necessary for officers to stay safe, Krause’s (1996) ideal evaluation method of the Solomon Four Group Design might be possible depending on the current practices of different departments. Testing for the evaluation would be focused on essential skills for an officer in self-defense and situational awareness, de-escalation and use of force, as well as their familiarity with their new jurisdiction. Two departments that do not have training programs for transferred police officers could be compared with two departments that either already have such a program in place, or that could develop them. Such program evaluations may lead to essential developments in training practices for transferred officers that lower their likelihood of victimization and increase safety for community members.
Based on the possibility of greater danger for less-experienced officers, evaluation of the training programs for newly recruited officers would also be beneficial. Because the findings of this study show that greater amounts of experience are related to lower victimizations, it is possible that officer training programs have room for improvement in developing the necessary skills that keep officers safe. Of course, testing training programs for newly recruited officers does not include a natural control group, and newly recruited officers must complete their required training programs. However, even single-group evaluations including pretests and post-tests could aid in the assessment of current training practices on their ability to develop necessary and retainable life-saving skills for police officers with the lowest amounts of experience. Yet, with the variability in police officer training across the country in mind, it is also again recommended that police practice, technology, academic research, and community input are continuously merged and updated in the effort to improve the work, service, and safety of police officers and community members.
Footnotes
Declaration of conflicting interests
The author(s) declared no potential conflicts of interest with respect to the research, authorship, and/or publication of this article.
Funding
The author(s) received no financial support for the research, authorship and/or publication of this article.