
Abstract
Recent studies investigated the effect of e-campaigning on the electoral performance. However, little attention has been paid to the content of e-campaigning. Given that political parties broadcast minute-by-minute the campaign messages on social media, this comprehensive and unmediated information can be useful to evaluate the impact of different electoral strategies. Accordingly, this article examines the electoral campaign for the 2013 Italian general election to assess the effectiveness of positive and negative campaigning messages, measured through content analysis of information published on the official Twitter accounts of Italian parties. We evaluate their impact on the share of unsolicited voting intentions expressed on Twitter, measured through an innovative technique of sentiment analysis. Our results show that negative campaign has positive effects and its impact is stronger when the attacker is meanwhile under attack. Conversely, we only find a circumstantial effect of positive campaign related to clientelistic and distributive appeals.
Keywords
Introduction
The growing number of citizens using Internet and social media has attracted the interest of politicians and political parties, up to the point that, nowadays, they use their social media accounts to broadcast the whole electoral campaign and report minute-by-minute the public declarations delivered by party leaders and candidates in party rallies, meetings, or television debates (Elmer, 2013). As a consequence, the role of Internet in providing voters with information on electoral campaigns and stimulating their political engagement is becoming increasingly relevant (e.g. Vergeer et al., 2013).
The comprehensive and unmediated nature of e-campaigning can also provide useful information to analyze the dynamics of electoral campaign (Ceron et al., 2014b, 2015) and to evaluate the impact of different strategies (Druckman et al., 2010; Evans et al., 2014). Scholars started to evaluate the effectiveness of e-campaigning showing that politicians’ engagement online positively affects their electoral performance (e.g. Gibson and McAllister, 2011, 2014; Sudulich and Wall, 2010). The content of e-campaigning messages, however, has so far attracted little attention (for an exception based on experimental data, see Wu and Dahmen, 2010).
This article examines the electoral campaign for the 2013 Italian general election and exploits content analysis of information published on the official Twitter accounts of Italian parties to evaluate the relative effectiveness of different electoral strategies, with a special focus on positive campaigning (PC) and negative campaigning (NC). In particular, we start from the findings provided by the literature on electoral campaigns and generate hypotheses that will be tested on Internet users, in the context of e-campaigning.
The impact of electoral strategies is assessed measuring the propensity of users to express unsolicited voting intentions on Twitter. The share of unsolicited voting intentions toward each of the eight main Italian parties is estimated, day-by-day, from the beginning of the campaign until the election day, through an innovative technique of text analysis that allows measuring the political preferences of Twitter users by means of supervised sentiment analysis (SA) (Ceron et al., 2013; Hopkins and King, 2010).
The analysis of different data (politicians’ and voters’ tweets) coming from the same source (Twitter) gives us the opportunity to link the daily variation in voting intentions to the political messages delivered by each party during the campaign. By doing this, we can test hypotheses on the power of two strategies intended to mobilize voters: negative campaign and distributive/clientelistic policy promises.
This article is organized as follows. Section “The nature and the effects of (web) campaigning” summarizes the literature on electoral campaign and e-campaigning. Section “Positive or negative campaign: what matters most?” discusses the potential impact of alternative electoral strategies and states our hypotheses. Section “Data collection” presents the data, describing the different strategies adopted by Italian parties in the 2013 election as well as the method used to measure voting intentions. Finally, sections “Empirical analysis and results” and “Discussion” discuss the results of the statistical analysis.
The nature and the effects of (web) campaigning
The question of whether electoral campaigns matter has long been debated (e.g. Enns and Richman, 2013; Lau and Pomper, 2004; Wlezien and Erikson, 2002). While there is some agreement on the overall impact of campaigns on electoral outcomes (although with effects that could be predictable, minimal, or limited to the short run), scholars disagree on which strategy is more rewarding.
The analysis of electoral campaigns has recently been extended to scrutinize the impact of e-campaigning. Scholars have initially focused on the politicians’ engagement on the web showing that it enhances the likelihood of electoral success (e.g. Gibson and McAllister, 2011, 2014; Sudulich and Wall, 2010). The content of e-campaigning messages, though, has been rarely taken into account (Wu and Dahmen, 2010).
Although measuring the effect of e-campaigning is interesting per se, the literature on this topic debates whether online and offline campaigns convey the same messages to the same audience or not. Some scholars claim that e-campaigning follows different patterns when compared to traditional campaigning, while others support the “normalization thesis,” arguing that there is no difference between the political parties’ usage of the web or traditional media (e.g. Schweitzer, 2008). The debate is still open (Gibson and McAllister, 2014), although several studies suggest that the Web 1.0 distributed the same information available offline (Druckman et al., 2010; Ku et al., 2003).
Things might have changed after the rise of social networks sites in the interactive Web 2.0, where users can more easily generate own content through social media and candidates can potentially develop personalized and targeted messages, different from the party’s official campaign (e.g. Vergeer et al., 2013). While some works attest a change (Strandberg, 2013), others provide support for the normalization thesis (Vergeer and Hermans, 2013), even in contexts where intra-party competition should provide candidates with the incentive to enact tailored e-campaigns (Vergeer et al., 2013: 496).
If the Internet is “nothing more than an extended tool to distribute the same information used in offline campaigning” (Vergeer et al., 2013: 482), the analysis of the effects of e-campaigning can also allow to catch the dynamics of the whole campaign (Druckman et al., 2010; Evans et al., 2014) and evaluate the effectiveness of alternative strategies.
Positive or negative campaign: What matters most?
The literature usually classifies campaign messages according to their content and distinguishes between NC and PC. Negative campaign consists in attacking rival parties/candidates and criticizing their policy platforms or personality traits. Positive campaign consists in self-promotion messages that emphasize own qualities and proposals.
On the one hand, scholars interested in party competition posit that parties try to subtract votes to their opponents and, in this light, negative campaign can be a rewarding strategy. The spatial theory of voting (Downs, 1957) suggests that voters’ utility decreases along with the distance between their preferred policy program and the platforms proposed by rival parties. Voters will support the party whose policy position is closer to their ideal point. As such, parties with similar electoral platforms will compete against each other. By adopting negative campaign against its opponent, a party can signal that (all else being equal) the rival party is less suitable to run the country. This will decrease the voters’ utility to vote for it, thereby increasing the votes share of the party that enacts NC.
In multiparty systems, like Italy, negative campaign is rewarding only when addressed to rival parties with a similar ideological position on the left–right scale (Curini and Martelli, 2010, 2013): if a party attacks a rival located far away on the ideological spectrum, voters will not necessarily shift from the target to the attacker because they can choose among several alternatives closer to their own ideological position. Accordingly, they will rather opt for another party, closer to the target on the political spectrum, which is not victim of NC. For this reason, parties have a strong incentive to attack adjacent rivals whose potential voters are more likely to shift their preferences in support of the attacker (Curini, 2011; Walter, 2014).
H1a. NC increases the voting intentions expressed toward the attacker when it is made against a rival party that is adjacent on the left–right dimension.
On the other hand, some studies suggest that negative campaign is an effective strategy because it mobilizes and rallies partisan voters in favor of the attacker (Ansolabehere and Iyengar, 1995). In a meta-analytic review of the literature, Lau et al. (2007) claim that attacking is not “an effective way to bolster one’s own image relative to that of one’s opponent” (p. 1183). However, they conclude that NC seems useful to mobilize and stimulate partisans to get out and vote. 1
The mobilization effect of negative campaign strategies is likely to be particularly relevant in the context of Twitter, due to the homophiliac nature of social networks (e.g. Conover et al., 2011) and the selective exposure of Twitter users who tend to follow and read the content published by like-minded peers (Feller et al., 2011). Therefore, we assume that messages broadcast online will more easily reach “partisan” audiences (i.e. followers) who are more inclined to mobilize after being exposed to NC. 2 Accordingly, we expect that, by mobilizing partisan voters, negative campaign messages will increase online support (i.e. expressed voting intentions) for the attacker party.
The incentive to adopt NC, however, need not be constant across the campaign, and its impact can be moderated by the general tone of the electoral competition. Going negative could be in fact the best reply to an attack (Lau and Pomper, 2004). When a party responds to an attack, the backlash effect dwindles since voters will not blame it for defending itself and the party will have an incentive to strike back. As such, the use of negative campaign strategies becomes (increasingly) rewarding when the party is under attack.
H1b. NC increases the voting intentions expressed toward the attacker when it responds to someone else’s attacks.
PC is the other side of the coin. It consists in broadcasting the values, virtues, and policies of the party. However, we contend that not all positive messages are equally mobilizing. Taking the cue from the literature on clientelism (Kitschelt and Wilkinson, 2007; Piattoni, 2001), we split PC according to its content and focus on messages presenting distributive and clientelistic policies. Promises that involve distributive policies are expected to convey economic benefits to a well-defined subset of voters. As a consequence, when a distributive policy promise is made, its potential recipients have a stronger incentive to react and mobilize online to sustain the fulfillment of such promise by expressing support toward the party making the promise. 3 As such, we argue that distributive and clientelistic policy messages can be, overall, a good strategy to mobilize voters’ support, and we analyze their effect net of other positive messages.
H2a. Distributive promises increase the voting intentions expressed toward the party making the promise.
Clientelistic and distributive promises, however, also imply some costs: while targeting promised benefits to certain categories, such electoral claims can alienate the consent of others, like middle-class voters (Weitz-Shapiro, 2012) or skilled individuals (Calvo and Murillo, 2004). Although distributive policies give any party the chance to transfer resources to their constituencies, this strategy helps mobilizing some types of voters more than others; therefore, not all parties benefit equally from them (Calvo and Murillo, 2004). Strategies based on distributive promises are more effective when there is a match between the demands of voters and the ability of parties to meet them through policies (Piattoni, 2001).
H2b. The effect of distributive promises and its magnitude is conditional on the party making the promise.
Data collection
Italian elections 2013: a (social media) campaign
In the 2013 general election, Italian parties made an extensive use of social media, particularly Twitter. 4 They organized and advertised the events of the campaign but also published online all the statements made by party leaders during rallies, interviews, or television debates. The analysis of parties’ official Twitter accounts then allows to describe the dynamics of the campaign and to compare the alternative strategies adopted.
To do that, we collected and analyzed all the tweets posted in the official Twitter accounts of the eight largest Italian parties and their leaders: Pier Luigi Bersani (Democratic Party, PD; Twitter accounts: @pbersani, @pdnetwork), Nichi Vendola (Left Ecology and Freedom, SEL; @NichiVendola, @sinistraelib), Angelino Alfano (People of Freedom, PDL; @angealfa, @ilpdl), 5 Roberto Maroni (Northern League, LN; @maroni_leganord, @LegaNordPadania), Mario Monti (Civic Choice, SC; @SenatoreMonti, @scelta_civica), Pier Ferdinando Casini (Union of Christian and Centre Democrats, UDC; @EstremoCentro, @Pierferdinando), Beppe Grillo (Five Star Movement, M5S; @beppe_grillo, @Mov5Stelle), and Antonio Ingroia (Civil Revolution, RC; @AntonioIngroia, @rivcivile).
Per each party and for each day between 16 January, when the campaign started, and 22 February, when the campaign ended, 6 we collected and analyzed all the 15,053 tweets published on these accounts (396 tweets per day). To perform a time series analysis, these data have been aggregated, per each party, on a daily level. Accordingly, the whole dataset consists of 304 observations (i.e. eight parties monitored for 38 days),
Political messages have been hand-coded and each meaningful tweet has been included in one of the following categories. To test our hypotheses, we assessed whether tweets perform negative campaign or positive campaign based on distributive promises. Therefore, we distinguished between (a) NC, which records all the attacks made against another leader/party (we also reported the party against which the negative campaign was made), and (b) PC based on distributive/clientelistic promises (PC/Distr) that denotes a message in which the party advocates clientelistic or distributive policies conveying economic benefits to a well-identifiable category or group of voters (e.g. home-owners, unemployed, entrepreneur, taxi drivers). 7 In addition, we also gathered information on two control variables and classified tweets in different categories when they express (c) other types of PC (PC/Others), such as nondistributive policy pledges or any other type of nonclientelistic positive campaign, or (d) populist statements (POP), that is, messages written to criticize the political class as a whole. A number of tweets (around 62%) were related to the organization of the campaign or were written to make generic appeals to support the party without making use of any specific strategy and have not been classified into any category.
The work has been done by two trained coders. Inter-coder reliability is 0.89. Here are some examples of tweets: “Berlusconi is always making promises. This is a bad way of doing politics and will damage the country #WithMontiForItaly” is an example of NC (made by Monti against Berlusconi); the statement “we will suppress the IMU tax on the primary residence and give back the unfair amount that the Italians have already paid” falls in the category PC/Distr, while “our platform contains my thirty-year experience as entrepreneur” is considered as PC/Others (both declarations were made by the PDL); finally, “Those who made such a disaster are now on TV to explain how to get out. They’d better go home #tsunamitour” is an example of populist tweet, written by the M5S.
The largest share of tweets (16.8%) has been written to criticize the opponent, mainly by the PDL, while the party of the incumbent Prime Minister (SC) reports the lowest level of negativity, and this result is consistent with the literature on the propensity to adopt NC, which is tiny for incumbent parties (e.g. Druckman et al., 2010; Walter, 2014). Overall, 19.6% of messages convey PC; here, we can distinguish between distributive promises (8.6%), where the PDL, again, has the lion’s share, and other positive messages (11%), mostly used by the PD. Only 1.5% of tweets retain a populist content (almost all of them belong to the M5S).
Figure 1 displays the evolution of the different strategies across the campaign. The number of negative campaign messages rises in January, when the PD was involved in a scandal related to the Monte dei Paschi di Siena (MPS) bank and was then criticized by all runner-up parties. Conversely, in the first decade of February, we observe an increase in tweets advocating distributive policies. This peak seems related to the pledge taken on 4 February by Silvio Berlusconi, who promised to give back the house tax (called Imposta Municipale Unica [IMU]) to the home-owners tax-payers, if elected.
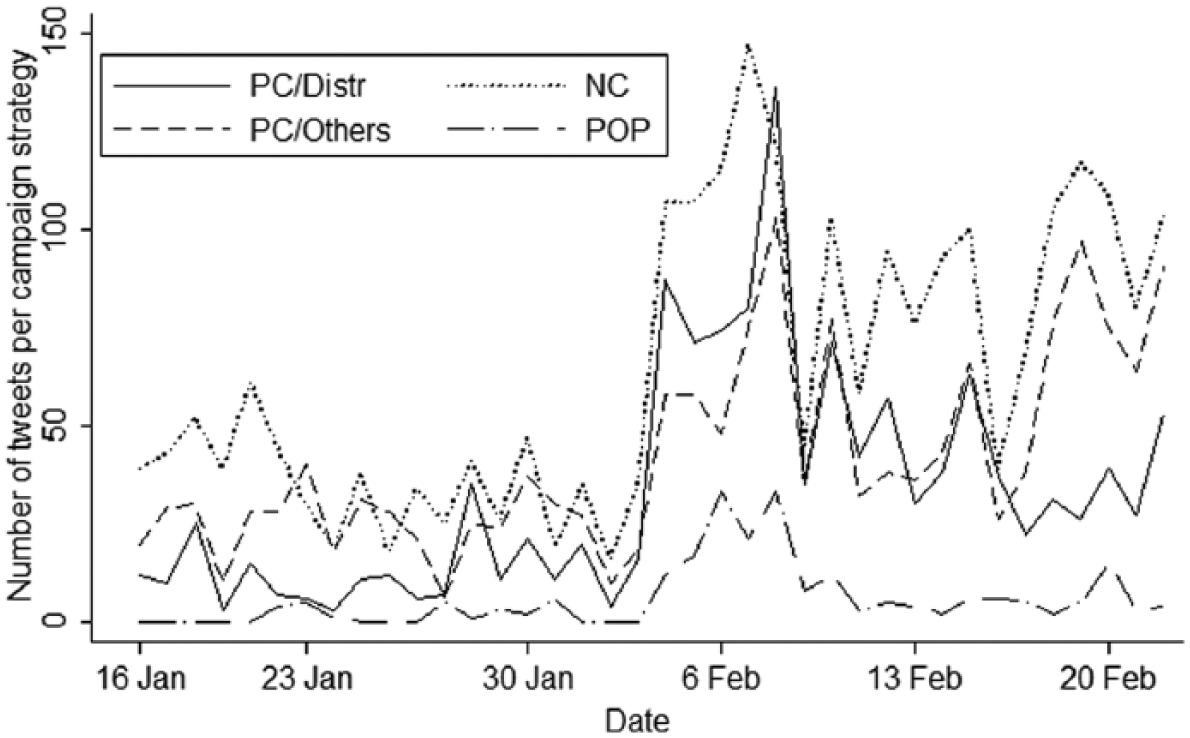
Evolution of the different strategies across the campaign.
Tracking the stream of voting intentions on social media
Voters widely used Twitter writing millions of messages to express their opinions throughout the campaign. By analyzing this user-generated content, we can estimate the percentage of unsolicited voting intentions expressed online, on a given day. For this purpose, we employ a method recently proposed by Hopkins and King (2010). This method differs from traditional techniques of SA because it performs a supervised aggregated sentiment analysis (SASA; see Ceron et al., 2014a).
Traditional SA adopts automated procedures based on pre-defined ontological dictionaries but fails in correctly classifying ironic or paradoxical sentences, 8 in recognizing strategic behavior, 9 or in appreciating all of the nuances of language (e.g. specific jargons or neologisms) and its evolution over time. Conversely, the SASA relies on a semi-automated two-stage process that allows to overcome these drawbacks. In the first step, human coders read and code a subsample of the documents downloaded from the web to create the training set. Manual coding is more effective than ontological dictionaries in recognizing the peculiarity of the language discussed above. Furthermore, human coders can also solve (or minimize) the ever-present problem of noise and spam. In the second step, through an automated statistical analysis, the SASA algorithm employs the information provided by manual coding to analyze all the unread documents. The algorithm then provides accurate estimates of the distribution of the opinions in the whole population of comments (not just a sample), at the aggregate level. 10
The analysis of data from social network sites (SNS) is particularly intriguing for our purpose. Sampling an unknown population, like that composed by social media users, is a problematic task. By using SASA, we can skip this problem given that we try to evaluate directly the whole population of unsolicited opinions related to a particular topic, delivered in an environment in which users are free to express themselves. We focused on Twitter data for several reasons. To start with, Twitter is a relevant arena, being the second most used SNS in Italy. Moreover, it is largely used to discuss political issues (Vaccari et al., 2013). Finally, contrary to other SNS, Twitter content is freely available and is therefore widely adopted in the literature on social media and electoral forecasts (e.g. Ceron et al., 2014a, 2015).
From 16 January until 25 February, when the election was held, we tried to download the whole population of tweets, written in Italian, commenting on the elections. Tweets were retrieved from public accounts through the Twitter application programming interface (API) using a wide number of keyword search queries (see Appendix 1). Overall, we downloaded 7,782,490 tweets, that means roughly 195,000 per day. 11 The percentage of the voting intentions expressed on Twitter toward Italian parties was estimated, daily, on these tweets.
In our analyses, each tweet is considered as an expression of voting intention only if at least one of the following three conditions is satisfied: (a) the tweet includes an explicit statement related to the intention to vote for a leader/party; (b) the tweet includes a statement in favor of a leader/party together with an hashtag connected to the electoral campaign; and (c) the tweet includes a negative statement opposing a leader/party together with an hashtag connected to the electoral campaign of another leader/party. Considering the use of hashtag jointly with positive/negative statements allows to focus on signals that are more “costly” (and therefore more credible) in terms of self-exposition by the user (see the literature on signaling games; e.g. Banks, 1991). Moreover, these conditions allow to reduce the arbitrariness in the manual stage of the analysis. 12
We applied the same reasoning to all the re-tweets (i.e. messages posted by one Twitter users that are shared by another user) that satisfy these conditions. Although the choice to re-tweet a comment does not necessarily convey an “endorsement,” it becomes a costly act (for the same reasons discussed above) when the re-tweet contains an explicit intention to vote for a given leader/party or an identifiable hashtag connected to a leader/party.
This method has been repeatedly adopted to forecast the outcomes of several elections held in 2012 (Ceron et al., 2014b, 2015). Across different countries and types of election and political systems, the estimates of votes share were close to the voting intentions registered by survey polls and to the actual results of the elections, with a mean absolute error (MAE) around 2% (Ceron et al., 2013, 2014a).
The final prediction was issued on the 25 February to be compared with the actual results. The MAE of our estimates is very low: 1.62. 13 Despite the fact that Twitter users are not representative of the whole population of Italian voters, our aggregate estimates of voting intentions are in line with the actual behavior of the electorate and predictive of the outcome of the election. In addition, the estimates are strongly correlated with survey polls (0.87). 14
Figure 2 displays the aggregate voting intentions for the main coalitions. From the top to the bottom, we find the center-left (CSX), the center-right (CDX), the M5S, the Monti’s coalition (MPI), and RC.
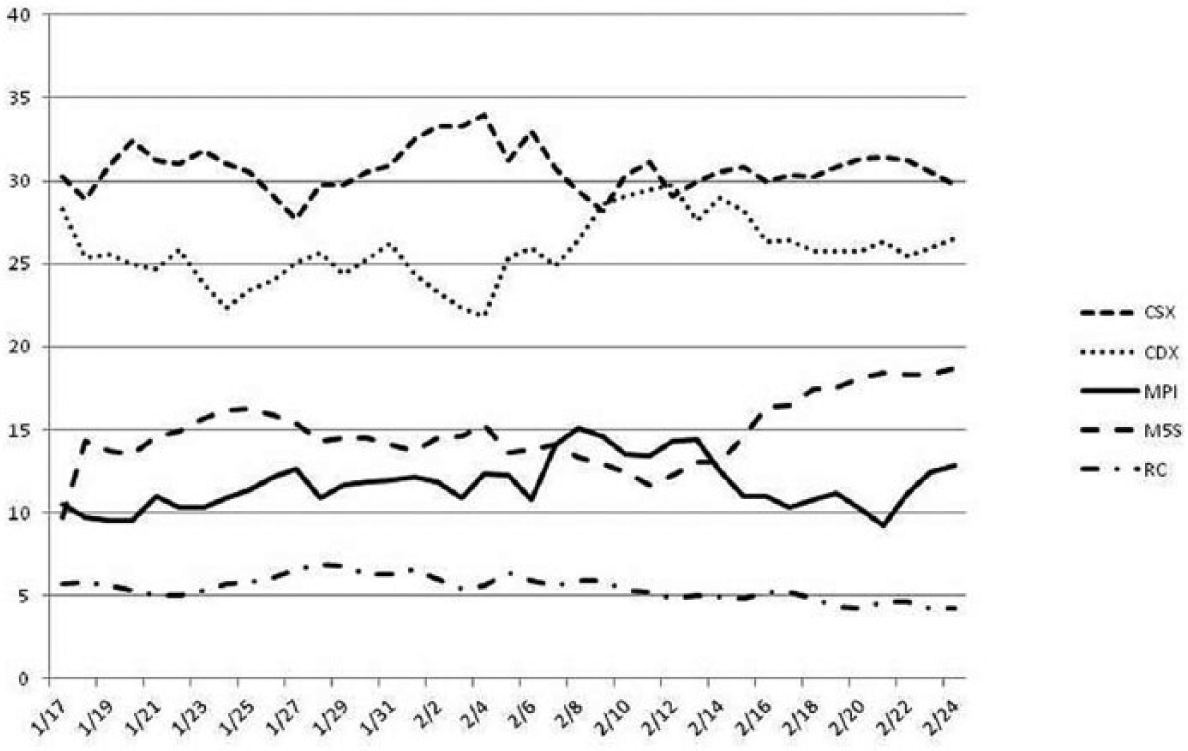
Aggregate share of voting intentions for the main coalitions expressed day-by-day on Twitter.
The picture sketches the daily variation of voting intentions in the last month of campaign and shows some patterns worth discussing. We observe the rise of the M5S and the fall of the centrist coalition in the last 2 weeks before the election, as well as the decline of the center-left coalition at the end of January, probably due to the MPS scandal. Around mid-February, another corruption scandal related to the Finmeccanica company damaged the rating of the center-right coalition. The right-wing PDL, however, largely benefited from Berlusconi’s promise to give back the IMU tax (4 February) and witnessed another increase in voting intentions at the end of the campaign, when this promise was renewed. 15
Data and variables
We measure the effect of several independent variables related to e-campaigning messages delivered on a certain date (t) on the voting intentions expressed via Twitter in favor of party i on the following day (t + 1). We lose some of the 304 original observations due to the inclusion of the lagged value of the dependent variable. 16
The dependent variable is the Share of voting intentions in favor of party i. Residuals categories (that account for minor lists and undecided voters) have been excluded; hence, the cumulative votes shares of the eight parties included in the analysis do not sum up to 100. Conversely, it varies between 73.5%, in late January, and 90.5% in the last days before elections. This avoids the problem of dealing with “compositional data” and simplifies the statistical analysis. 17
The main independent variables, related to the different campaign messages described in section “Data collection,” are the following. Negative campaign toward rivals, which records the number of messages per day written against the closest rival parties along the left–right scale, and Negative campaign suffered, that is, the daily number of attacks received from rival parties, will be used to test hypotheses H1a and H1b. 18 Distributive/clientelistic promises measures the daily number of appeals made to provide distributive and clientelistic policies that benefit a well-identifiable group of voters and will be used to test hypotheses H2a and H2b.
To account for the fact that some parties may send more messages than others and for variations in the overall volume of campaign messages, we include other time-varying controls, such as Party tweets (the daily number of tweets sent by party i) and Total tweets (the total number of tweets sent by all parties on the same date). We also control for the lagged value of the Share of voting intentions and the number of tweets related to other campaign strategies or events such as Positive campaign, which includes all the positive campaign messages written each day and unrelated to clientelistic and distributive policy promises, or Populism, which accounts for the daily number of populist messages, and Btp–Bund Spread, which records the difference in the interest rate paid by the 10-year Italian Btp and German Bundesbank bonds. These two latter control variables capture two topics, populism and the spread, which have featured prominently in the Italian political debate over the year preceding the elections. 19
Empirical analysis and results
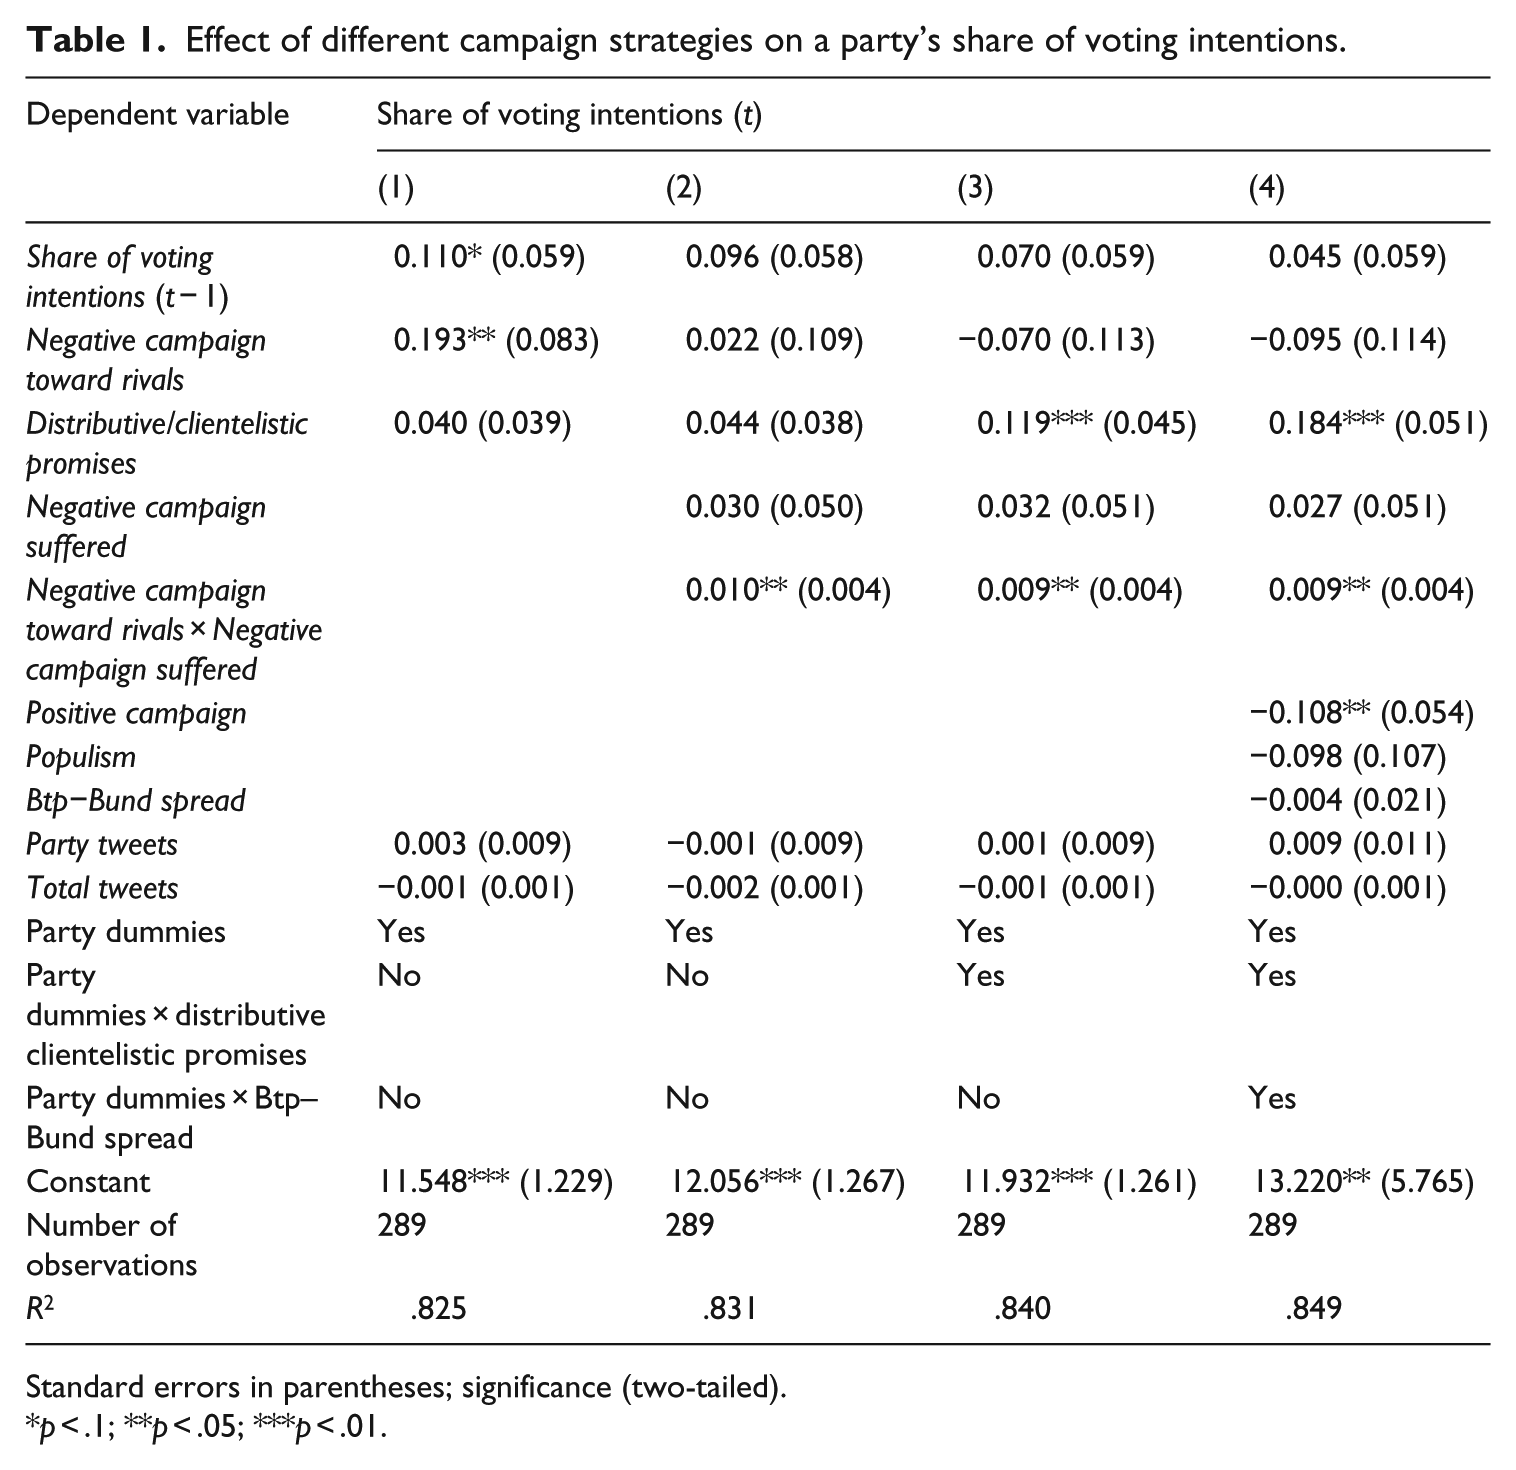
Regression results are presented in Table 1. Four models are displayed. All the models are estimated through a pooled linear regression, which includes party dummies to account for the fact that we have repeated observations nested by party. 20 In Model 1 we test H1a, while in Model 2, we include the interaction term between Negative campaign toward rivals and Negative campaign suffered, to test H1b. In Model 3, we replicate Model 2 adding the interaction between Distributive/clientelistic promises and party dummies. Finally, Model 4 includes the control variables related to positive campaign, populism, and Btp–Bund spread.
Effect of different campaign strategies on a party’s share of voting intentions.
Standard errors in parentheses; significance (two-tailed).
p < .1; **p < .05; ***p < .01.
Model 1 shows that negative campaign has a positive effect on a party’s share of voting intentions (H1a). This result is in line with the existing literature (e.g. Curini and Martelli, 2010, 2013) and confirms that, in a multiparty setting, attacking the rival adjacent party increases the support for the attacker. 21 Any additional attack made against rival neighbors shifts voters’ preferences toward the author of the attack and increases its share by 0.19%. 22
What is more, the impact of NC is conditional on the number of attacks suffered, in line with H1b. Figure 3 displays the marginal effect of Negative campaign toward rivals conditional on the magnitude of Negative campaign suffered.
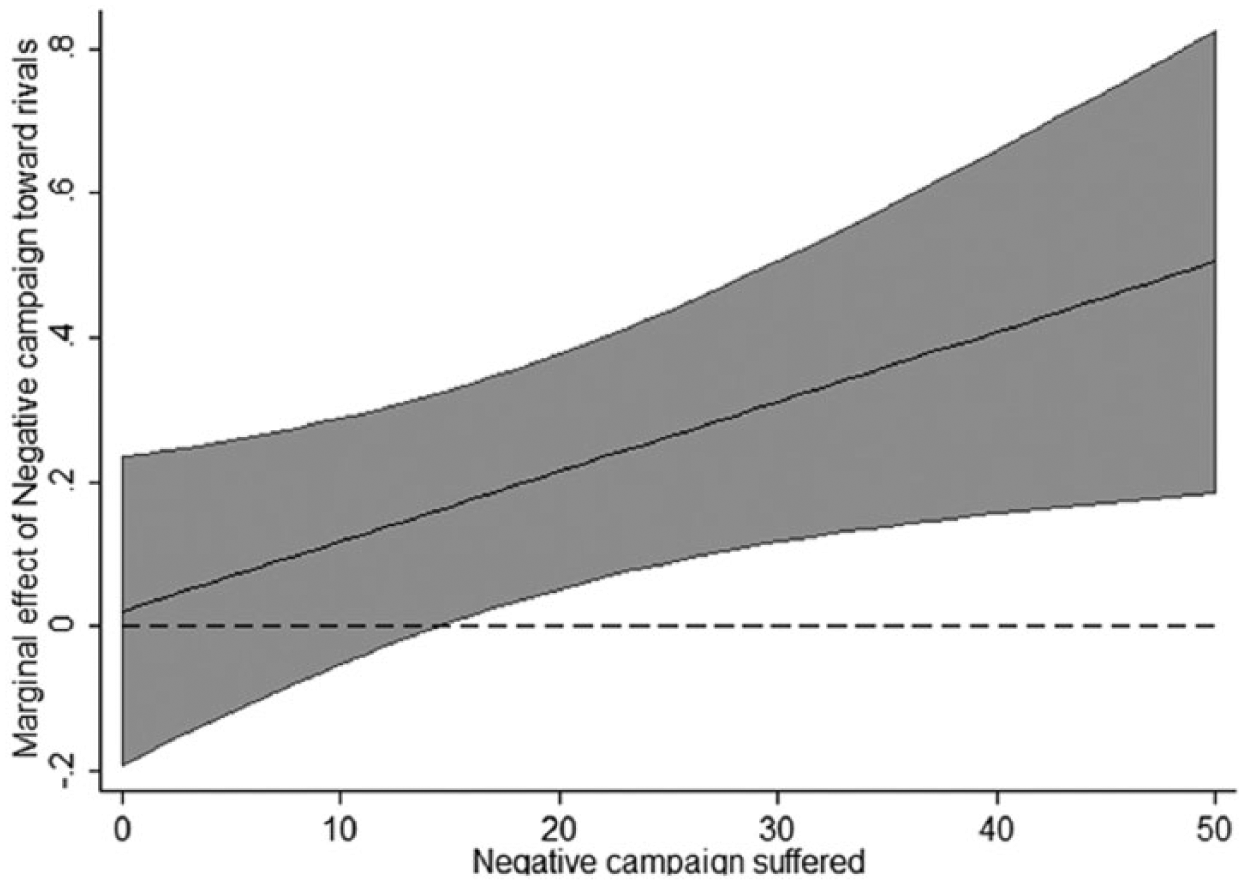
Marginal effect of Negative campaign toward rivals conditional on the magnitude of Negative campaign suffered (with 95% confidence interval).
NC increases voting intentions only when the party is considerably under attack and adopts this strategy to answer back. Moreover, the more a party is subject to attacks from other parties, the higher the returns from negative campaign. While negativity seems to matter, we only find a circumstantial effect of distributive and clientelistic policy promises that are effective, though not for all parties, as shown in Figure 4.
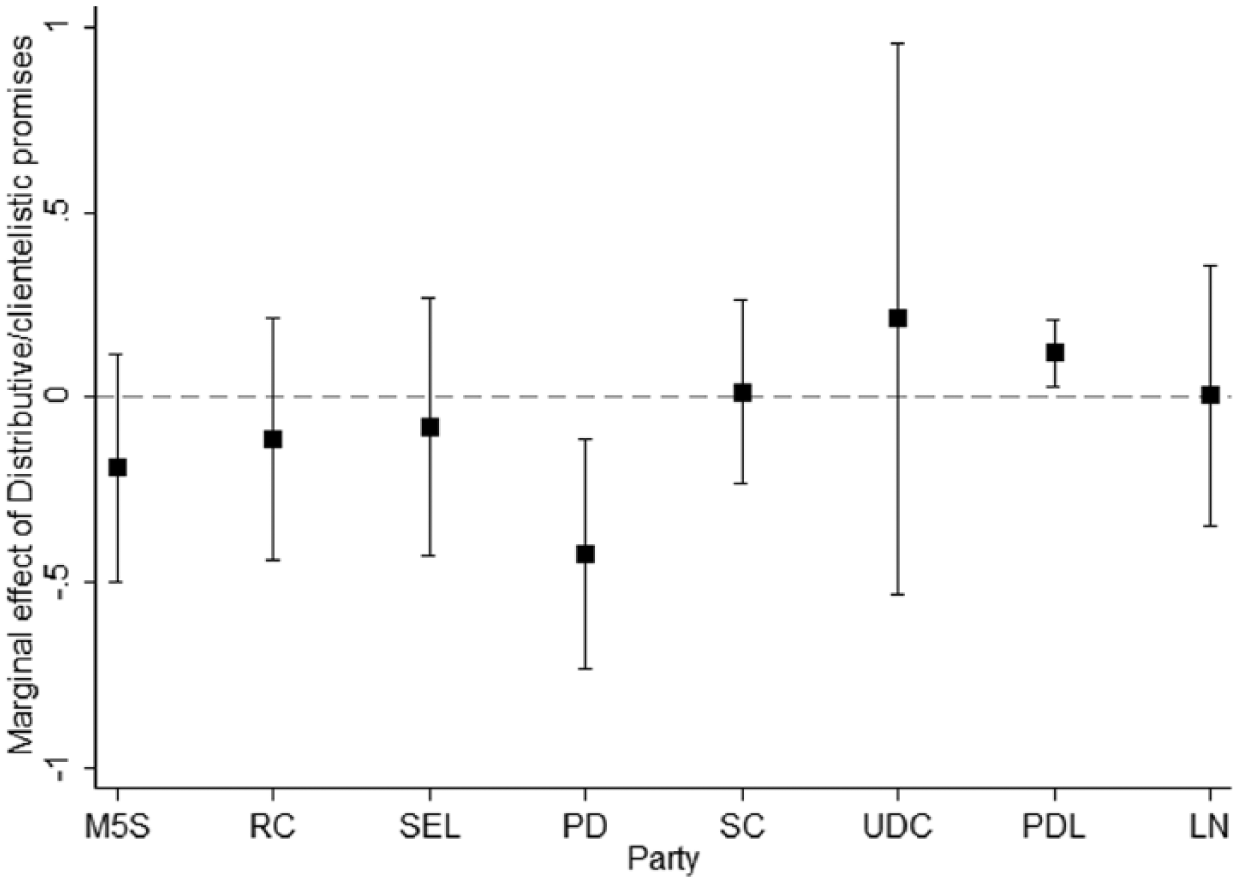
Marginal effect of distributive/clientelistic policy promises conditional on the party making the promise (with 95% confidence interval).
In fact, the coefficient of the marginal effect tends to be positive for right-of-center parties, while it is negative for the left. However, only the votes shares of PD and PDL are significantly affected by distributive promises. The PD is damaged by each announcement (−0.42%), while the PDL has a positive return (+0.12%). Such difference will be explained in the next section.
Finally, in Model 4, we show the robustness of previous results to the inclusion of other control variables (i.e. populism and spread) deemed relevant for the campaign. All the main findings hold. Populist messages have no effect, 23 while the spread seems to play a role although only for two parties: any 10-point increase in the difference Btp–Bund lowers the voting intentions toward the PD by 0.52%, while the M5S share grows by 0.37%.
Discussion
This work analyzed the effect of online electoral campaign messages on the propensity of Internet users to express unsolicited voting intentions on Twitter. By doing so, this work represents the first attempt to test hypotheses about the effect of the content of campaign messages, drawn from the literature on electoral campaign, and applied to Internet users in a context of e-campaigning.
In order to test these hypotheses on the mobilizing power of negative campaign and distributive/clientelistic policy promises, we tried to monitor, through a recent technique of SASA, the whole population of unsolicited voting intentions expressed toward main Italian parties, day-by-day, by Twitter users.
The campaign styles adopted by different parties have been measured through content analysis of tweets published by the Twitter official account of each party and party leader, which tended to report all the public declarations delivered during party rallies or television debates, as well as to comment on the events of the campaign.
The statistical analysis reveals that negative campaign seems to matter (Wu and Dahmen, 2010), while positive campaign wields only circumstantial effects. This is in line with the expectations raised by social psychologists who provide several reasons to explain why negative information could be more persuasive than comparable positive information (e.g. Martin, 2004; Pratto and John, 1991). On the one hand, people pay greater attention to negative messages rather than to positive ones, and the perception of fear generated by negativity can also stimulate interest in the campaign. On the other hand, a negative “flame” also signals voters that the race is tight and this will bring partisan voters to mobilize and participate.
Our results show that negative campaign can have a double effect. On the one hand, we confirm earlier studies (Curini and Martelli, 2010, 2013) and show that, in a multiparty setting, negative campaign is effective when targeted against a rival adjacent party, bringing “indifferent” voters (spatially close to both parties) to support the attacker rather than its opponent. On the other hand, we find that the impact of negative campaign is stronger when the attacker is meanwhile under attack: when the party rebuts to an attack, any potential “backlash effect” dwindles because voter will not blame it for defending itself. Being both the source and the object of negative campaign attracts attention and increases a party’s prominence in the political agenda boosting its exposure in the daily debate (online as well offline). Moreover, being under attack forces partisan voters to close ranks and support their party, although we observe this effect only when the party is able to reply, rallying the troops and providing them with arguments useful to answer back. In light of this, we could argue that negativity can also help to mobilize voters who are already ideologically close to the party. If this is true, during the electoral campaign parties may quarrel against each other and originate “flames” to activate partisans and sympathetic citizens to get out and vote (Norris, 2003; Vaccari, 2008). The idea of electoral campaigns as flames could be confirmed by the fact that negativity has been beneficial for the two largest poles, PD and PDL, who transformed the campaign in a fight to mobilize support.
Conversely, campaign strategies based on distributive policy promises only have circumstantial effects. In particular, we find differences between the PD, which is hurt by this strategy, and the PDL, which benefits from it. Why does this happen? A possible explanation deals with the idea that the supply of distributive policies needs to match the demand (Piattoni, 2001). The distributive promises related to tax cut plans (including the restitution of the IMU) made by the PDL were perfectly targeted to match its constituency’s priorities and mobilize own voters, while the PD seems to have committed to proposals that were not rewarding for the party. For instance, the Democratic Party promised a reduction in IMU tax as well, but this offer was probably not deemed pivotal by its voters who may have preferred reforms related to welfare spending or tax cuts of another kind. By doing so, the PD may also have invaded the area of the political space reserved to the PDL, alienating the support of its partisans (Aldrich, 1983), which becomes costly in terms of expressed voting intentions. This result can be explained also by the “issue ownership” theory of voting (e.g. Budge and Farlie, 1983), which suggests that voters identify the most credible party that advocates a particular issue and vote for that “issue owner,” which in this case was the PDL rather than the PD.
It is not surprising that only the PDL benefited from distributive pledges as other case studies show that right-wing parties may have higher returns from patronage (Calvo and Murillo, 2004). This is confirmed if we consider that clientelism alienates the consent of middle-class and skilled citizens (Calvo and Murillo, 2004; Weitz-Shapiro, 2012), who are traditionally overrepresented among PD voters (e.g. Maraffi et al., 2013) and underrepresented within the PDL. 24
One potential weakness of our analysis is related to the fact that social media users are not representative of the electorate (Bakker and De Vreese, 2011; Vaccari et al., 2013). They tend to be young and highly educated males. These differences appear less relevant when focusing only on people who express political opinions (Bakker and De Vreese, 2011) or when considering their political views. Italian Twitter users who commented on the electoral campaign were slightly skewed to the left side of the ideological spectrum, although at the expense of non-attached users who were underrepresented when compared to the Italian population. However, we find little differences between Twitter users and the whole population when focusing on the percentage of center-left, centrist, center-right, and right-wing citizens (Vaccari et al., 2013). 25 The nonrepresentativeness of Twitter, though, does not affect the analysis and the regression results because we will evaluate the impact of e-campaigning messages precisely on those who are active online.
Even so, the generalizability of our findings may be questioned on the grounds that Twitter users are not equal to offline voters, and, given the homophiliac nature of Twitter (e.g. Conover et al., 2011), our results could apply mainly to partisan voters who either mobilize or not depending on the appeals launched by parties they are sympathetic with.
However, the fact that we analyzed the whole population of comments makes these results interesting per se. On the one side, Twitter users may act like opinion-makers who are able to influence (and anticipate) the preferences of a wider audience (O’Connor et al., 2010). On the other side, Twitter discussions on specific issues can be representative of larger streams of conversations (Jensen and Anstead, 2013). These two aspects are even more relevant if we consider that during the campaign for 2013 Italian election the political information and discussion on Twitter were “important drivers of face-to-face conversations about politics and […] online content circulates in offline discussions” (Vaccari et al., 2013: 402). 26 Since political active Twitter users are also more engaged in offline conversations and diffuse the information available online, the content of e-campaigning can reach and influence a wider audience of voters. As such, evaluating the effect of (web) campaign messages on the share of unsolicited voting intentions expressed online can supplement traditional offline polls becoming a useful device to monitor (and adjust) the effectiveness of different campaign strategies.
Footnotes
Appendix 1
Acknowledgements
The authors wish to thank the University of Birmingham for support and Voices from the Blogs (![]() ) for sharing data. An earlier version of this article was presented at the ECPR General Conference (Bordeaux, 4–7 September 2013). The authors acknowledge all participants for their useful comments. They also thank Alessandra Cremonesi for her help with data collection and two anonymous referees for their helpful remarks.
) for sharing data. An earlier version of this article was presented at the ECPR General Conference (Bordeaux, 4–7 September 2013). The authors acknowledge all participants for their useful comments. They also thank Alessandra Cremonesi for her help with data collection and two anonymous referees for their helpful remarks.
Funding
This work was supported by the Italian Ministry for Research and Higher Education (Prin 2009, prot. 2009TPW4NL_002).