
Abstract
Algorithmic decision-making systems are ubiquitous in digital media, but the public has been largely unable to negotiate the role of algorithms in society. Building from the concept of attitude-behavior consistency for political behavior, we develop a framework for fostering algorithmic literacy to develop well-informed attitudes toward algorithms. As algorithms are increasingly relevant to broad societal effects, an integrative approach is needed for a full account of how the public makes sense of algorithms and their role in society. We designed and tested a novel intervention that combines algorithmic literacy with personalized user experiences to see how each component influenced attitudes toward algorithms. We found these methods jointly informed attitudes, but the intervention’s efficacy was dependent on participants’ individual differences in technology use.
Keywords
An algorithm is a set of instructions a computer follows, and an algorithmic designer defines the steps a computer executes. These are the definitions presented to computer scientists in their introductory textbooks (e.g. Downey, 2015). However, this simplification belies the myriad of social, ethical, economic, and political complexities embedded in algorithmic design. Writing an algorithm requires a multitude of choices that each have the potential to shape algorithmic consequences. As algorithmic systems—collections of algorithms working in concert—proliferate, it becomes increasingly important for the public to recognize and be able to effectively evaluate and respond to the designs of algorithms in society.
People have begun to question the potential harms of algorithmic systems, and the public’s opinion of these systems has declined over time (Smith, 2018). Especially in the context of social media, reactions to the Cambridge Analytica scandal in 2016 provide anecdotal evidence of public-level critique of the design of social media algorithms. However, most people are unaware of how algorithms function and how algorithmic systems affect real-world outcomes (Eslami et al., 2016). These systems can be extraordinarily complex. For example, more than 20 million lines of code are used to organize social media content (Metz, 2015).
A large body of research on how people understand algorithmic systems has focused on the concept of transparency. When people do not understand algorithmic systems, they tend to have more negative attitudes toward these systems (Diakopoulos and Koliska, 2017). Research has attempted to find methods that increase the transparency of algorithmic systems in the hopes of increasing understanding (Liao et al., 2020; Polack, 2020), improving product design (Eiband et al., 2018; Kizilcec, 2016), and improving attitudes toward those systems (Anik and Bunt, 2021; Eslami et al., 2019). Some research shows that when the actions and implications of algorithmic systems are successfully explained, people do report higher trust in the decisions these systems make (Bitzer et al., 2021; Kizilcec, 2016) and are more motivated to leverage control over algorithmic systems (Eslami et al., 2017; Jhaver et al., 2019).
Other research suggests increasing transparency is insufficient to motivate constructive public engagement with algorithmic systems (Ananny and Crawford, 2018; Kizilcec, 2016). An algorithmic system may be transparent, but not the motivations of the algorithmic designer or the purpose of the system. Transparency may foster a better understanding of a system, but it is insufficient to promote full realization of the complex role of algorithmic systems in society if the public cannot critically evaluate its operation and ground those judgments in their daily experience with algorithmic decision-making systems. As such, algorithmic literacy has been promoted as a desirable goal to complement the call for transparency (Kim and Moon, 2021; Shin et al., 2021).
Algorithm literacy is defined as “being aware of the use of algorithms in online applications, platforms, and services, knowing how algorithms work, being able to critically evaluate algorithmic decision-making as well as having the skills to cope with or even influence algorithmic operations” (Dogruel et al., 2021: 4). An ideal algorithmically literate public can establish informed and critical attitudes—positive or negative—which enables policy that protects public and private values and holds algorithmic designers accountable for their decisions (Zuboff, 2019).
In the following pages, we build a framework for understanding how people establish attitudes toward algorithmic systems. We integrate prior work on transparent system design and developing literacy in other contexts to identify potential pathways to promote algorithmic literacy. We apply this framework to test an algorithmic literacy intervention that demonstrates the multiple factors that influence a person’s attitudes toward algorithmic systems.
Literature review
Algorithms in digital media
The world’s Internet users have produced over a zettabyte of data (Barnett, 2016). To manage the vast amount of digital media available online, technology companies have built algorithmic systems to store, categorize, and retrieve pieces of media and rank the usefulness and relevancy of content to individual users. As an author from Google (n.d.) states, “these ranking systems are made up of a series of algorithms that analyze what it is you are looking for and what information to return to you” (para: 2). However, algorithmic systems are built for a variety of purposes beyond ranking (see Latzer et al., 2016 for a typology of algorithmic systems).
Many algorithmic systems attempt to meet multiple concurrent goals. The newsfeed algorithms on social media platforms shape user experiences by curating the “flow of content, ideas, and sociability” (Rieder et al., 2018: 51) using algorithms that determine what posts are presented to users. Instagram’s newsfeed algorithm relies on users’ past behavior, previous social interactions, past preference in content, and relationships with others to produce satisfactory individualized content feeds (Constine, 2018). Algorithms are also optimized to meet the goals of the organizations that design them. Instagram applies algorithmic systems to create personalized advertising content for each user (Trifts and Aghakhani, 2019), thus increasing revenue from advertisements.
The degree to which the goal of user satisfaction conflicts to increase advertising revenue presents algorithmic designers with important choices. They must weigh the relative value of competing outcomes and implement these weights through the code and structure of the algorithmic system. As social media platforms have become an integral part of modern society (Gillespie, 2010), these comparative value judgments have far-reaching effects.
A framework for establishing attitudes toward algorithms
Zuboff (2019) suggests it is difficult for members of the public to critically and politically engage algorithmic systems. The concept of attitude-behavior consistency suggests this may be because the public does not yet hold strong, accessible attitudes that sufficiently motivate political behaviors (Fazio et al., 1982). Before acting, an individual must form attitudes toward an object. When objects are new and unfamiliar, attitudes can be formed through both exploration—experience with the object—and direct learning about the object (Fazio et al. 2004). When attitudes are weak or a person is ambivalent about an object, political behavior motivated by thoughtful engagement is unlikely (Basinger and Lavine, 2005). As such, attitude formation about algorithmic systems is a necessary first step before any public action can be expected.
Algorithmic systems are relatively novel objects, and the public needs to develop algorithmic literacy to effectively interrogate and form attitudes on how algorithmic systems implement competing motivations. We argue algorithmic literacy can be attained through two routes. First is, simply, building a foundational knowledge of the goals prioritized by algorithmic designers and their impact on society. Second is for individuals to examine the technical aspects of algorithmic systems. These are both substantial undertakings for any member of the public. Thankfully, prior research offers direction. Research has been conducted on literacy campaigns for other complex social systems, like media, but has not been systematically applied to algorithmic literacy. There is also a large body of research on developing a technical understanding of algorithms. This work has historically focused on system transparency, trust in decisions made by algorithms, and individual-level differences in perceptions of technology. These two bodies, together, offer steps for algorithmic literacy interventions.
Route one: information on algorithmic goals and social impact
To understand attitudes toward complex, socially salient systems, research on literacy campaigns provides some direction. Specifically, media literacy interventions are designed to increase knowledge about, develop informed attitudes toward, and encourage best practices when engaging with media systems. By dissecting the production process and motivations of media content creators, particularly for news and advertising content, scholars have been able to understand attitudes toward media and predict media behaviors. For example, effective media literacy interventions can demystify glamorized media content and promote more healthy media use (see Pinkleton et al., 2008, 2012). These interventions consist mostly of providing new and corrective information in various formats. We expect that clear information on algorithmic systems should fill knowledge gaps and provide a starting point for algorithmic literacy. However, the most efficacious literacy interventions provide information about media selection (e.g. strategies used in advertisements and scripts often used in storytelling) and let the audience experience the process of media creation (e.g. by creating counter advertisements) (Austin et al., 2005). Increased media literacy develops a more nuanced understanding of media systems in society.
Literacy interventions have been explored for information, computation, and data systems, and there is growing interest in algorithmic literacy programs. Lloyd (2019) argues black-box algorithms are best addressed by examining the broader cultural implications of algorithmic systems. Valtonen et al. (2019) similarly call for a literacy approach to help the public gain, “basic skills and knowledge for recognizing and evaluating the impact of new technology” (p. 33) including recommender systems, tracking, and attention engineering.
There have been few attempts to create such interventions and we find none that evaluate what makes the intervention successful. Glotfelter (2019) interviewed YouTube content creators and asked how they gain literacy of the platform’s content algorithms. The participants reported a tactile process of experimentation and discovery that improved the performance of their channels. Jenson and Droumeva (2016) taught middle school students basic computer programming and asked them to build their own games using the skills they learned as part of the intervention. Students reported having higher confidence in general computer use, specifically computer programming, but attitudes were not studied. DiFranzo et al. (2019) designed a social media simulator that allowed educators to give lessons on safe social media practices. Through experiencing simulated social media interactions, students were found to hold greater knowledge about how to safely represent themselves on social media, but no attitudes were reported.
Learning about algorithms can also be initiated by the user. Through their daily use of the system, users can increase their algorithmic literacy (see Dogruel, 2021 for a review of algorithmic systems and folk theories). For instance, beauty vloggers have tried to share “algorithmic gossip” about YouTube as part of their strategies to maintain visibility on the platforms (Bishop, 2019: 2590). Facebook users develop theories as to why they see certain content on their newsfeed (Eslami et al., 2016) as do YouTube users (Alvarado et al., 2020). DeVito et al. (2018) suggested people build folk theories about algorithms with their own experiences within the platform, such as patterns of who and what appears in their feeds. Siles and Meléndez-Moran (2021) found TikTok users would experiment with their engagement of the For You page to understand how the app’s algorithms curate personalized content and compared their experience against Facebook, Twitter, Instagram, and Vine.
Limits of literacy
Literacy approaches to attitude development are limited by two factors. First, media literacy interventions only describe the state of media systems and offer little direction to media professionals on how to improve their systems. Second, in our current information ecosystems, digital media literacy attempts may have added confusion to people’s media attitudes instead of helping them develop more informed attitudes (boyd, 2017, 2018). Boyd argues literacy interventions are interpreted through someone’s social context and epistemological priors. By failing to account for individual-level expectations, some media literacy interventions may have damaged attitude formation rather than helped to build an informed democratic society capable of holding social systems accountable. As boyd proposes, personal outlooks and context likely play a role in other literacy domains.
Route two: technical transparency
Research on attitudes toward algorithmic systems has generated recommendations to increase transparency through design interfaces, feedback structures, and system communication. Several operationalizations of transparency have been deployed in the literature. Diakopoulos and Koliska (2017) operationalized transparency as “the disclosure of information about algorithms to enable monitoring, checking, criticism, or intervention by the interest parties” (p. 3). Shin and Park (2019) emphasized transparency as “understanding the relationship between the input to the system and output” which allows users “to start a predictable and effective interaction with the system” (p. 280). Rader et al. (2018) identified three types of mechanisms that enhanced transparency: (1) repeated use of the system where users become more “knowledgeable about the algorithmic outcomes”; (2) explanations for how automated decisions were made; and (3) a third party algorithm audit which answers both questions of how the algorithm works and its impact (p. 1). Part of fostering algorithmic literacy is in reducing the black boxes of inscrutable computational processes and code hidden from the average user. Ososky et al. (2014) address these black boxes when they broadly define transparency as “seeing through and seeing into” (p. 2) systems. We adopt this general definition of transparency as a target for increasing algorithmic literacy.
Even with the critiques of black-box algorithms, these are the norm for social media algorithms. Although some details are made public by social media platforms in their About pages or help centers, most aspects remain purposely obscure (Bucher, 2012). Beer (2017) warns that low transparency increases the risk that the public may “misjudge [algorithms’] power, to overemphasize their importance, to misconceive of the algorithm as a lone detached actor. . .” (p. 3). Eslami et al. further explain modern algorithmic systems “rarely include a clear enough feedback mechanism for users to understand the effects of their own actions on the system. Without such feedback, it can be difficult to assess the influence of either algorithm knowledge or ignorance” (Eslami et al., 2015: 153).
Attempts to increase algorithmic system transparency have shown convincing but limited results. Seeing a diagram of an algorithmic decision-making process helps users develop mental models which increase their understanding of how interactions are processed (Springer and Whittaker, 2019). These models, when accurate, successfully predict system outcomes and help users manage their expectations of the system. In other work, Oduor and Wiebe (2008) found when users were provided text explaining how automated decisions are made, their perceived reliability and understandability of automation increased. These authors suggest, “users tend to trust automation if its algorithm can be understood and is a feasible means of achieving the user’s goals in a given situation” (Oduor and Wiebe, 2008: 305).
However, the effect of transparency on attitudes is limited as more transparency does not always correlate with attitudes toward a system. There seems to be an optimal level of transparency, such that too much and too little transparency does not influence a user’s trust in the decisions of an algorithmic system (Kizilcec, 2016). Cheng et al. (2019) found that although they could improve understanding of algorithmic systems, this understanding did not inform attitudes toward algorithmic systems. Increased transparency has also been shown to motivate attempts to control algorithms (Eslami et al., 2017; Jhaver et al., 2019), which suggests stronger attitudes toward a system. In open-ended responses, participants explained various value judgments, contextual issues, and hesitations that explained why a transparent system did not necessarily correlate with their attitudes. Lloyd (2019) calls these a “multiplicity of entanglements” (p. 1483) that confound the relationship between transparency and the attitudes a person holds toward an algorithmic system.
Transparency is also difficult to conceptualize for multiple algorithmic systems. Even on a single social media platform, the algorithmic system to populate a news feed may be fairly transparent while the system to target advertisements may not be. How do these differences inform the attitudes someone holds about the entire combination of a social media platform’s algorithmic systems? Ananny and Crawford (2018) present an additional, comprehensive critique of the limits of transparency and concludes transparency alone is insufficient to hold algorithmic designers accountable for their social responsibilities. We believe the body of evidence shows transparency plays a role in forming attitudes toward algorithms but leaves out the important route of attitude formation.
For the purpose of this study, we operationalize social media algorithms as the algorithm system with full acknowledgment that they are algorithmic systems used for purposes of policing and financing, which is outside of the realm of social media.
Attitudes not trust
Much of the research conducted on algorithmic transparency has focused on trust in the decisions made by algorithmic systems as a key dependent variable. Trust in a decision has become an important concept when algorithmic systems decide mortgage rates, credit applications, and punitive sentencing guidelines. Trust has been measured through perceptions of fairness (Lee and Baykal, 2017; Wang et al., 2020) and confidence in algorithms to make the right choice (Dietvorst et al., 2015). This concept of trust seems to be conflated with individual-level expectations. Wang et al. (2020) found that perceptions of fairness were triggered by whether people agreed with the decision made by an algorithm, not necessarily knowledge of the algorithmic process and error rates. Users’ perceived understanding of a system, regardless of whether their understanding is accurate or not, can increase trust in the decisions made by a system (Dzindolet et al., 2003).
Algorithmic literacy does not necessarily relate to trust in algorithmic systems. We think the normative concept of trust is too limited in scope and thus not helpful in understanding how people form broader attitudes toward algorithms in society. Instead of trust, we follow qualitative studies that show people make sense of algorithms and their role in society through affective processes. Swart (2021) found interviewees talk about how algorithms make them feel and the wide range of emotional responses to algorithmic systems. Their responses weigh corporate motivations, data privacy, and sense of agency. Hargittai et al. (2020) found asking questions about algorithms prompted attitudinal responses that ranged from positive to negative, apathetic, and normative. As such, attitudinal measures may capture people’s evaluations of algorithmic systems better than measures of trust.
Individual traits and expectations for technology
Individual differences consistently predict how people understand and use technology (Zhong, 2013). Research has shown that some demographic differences have recreated a digital divide in understanding algorithmic systems (Cotter and Reisdorf, 2020; Gran et al., 2020). These differences have been characterized as barriers to psychological access (Newhagen and Bucy, 2003), and can affect people’s willingness and ability to engage and productively use new technologies (Warschauer, 2003). Researchers have developed a concept called power usage to characterize a spectrum of perceptions and approaches to technology (Marathe et al., 2007). Although some have proposed that power usage may vary from device to device (Kang and Shin, 2016), other researchers maintain that power usage is a stable trait that determines how people interact with technology (Marathe et al., 2007; Sundar and Marathe, 2010). As Sundar and Marathe (2010) put it, power users are “self-motivated learners who commit greater effort to discovery and experience frustration if restricted or given little learning autonomy. They are known to . . . navigate through complex situations that require them to act and communicate in parallel” (p. 305).
Power users expect they are able to easily control technology, personalize system interfaces, easily use technology, and report high expectations for algorithmic decisions (Chen and Sundar, 2018). Power users feel comfortable with personalized services due to their expertise and experience with technology. This leads to more favorable opinions of the interface and higher engagement than nonpower users (Chen and Sundar, 2018). Sundar and Marathe (2010) report power users express more positive attitudes toward systems they can personalize while nonpower users prefer systems that do not require their input. So far, we find no research that connects power usage directly to attitudes toward algorithmic systems, however, Wang et al. (2020) found that participants with lower computer literacy, which is negatively related to power usage, perceived algorithms as less fair. Lee and Baykal (2017) report evidence that computer programming knowledge can moderate perceptions of algorithmic fairness. Recent evidence suggests that higher knowledge and comfort with computers leads to more advanced folk theories of algorithmic systems (DeVito, 2021), which offers an explanation for why power users may hold different attitudes toward technical devices and systems than nonpower users. Another study on folk theories found that people who believed algorithms were powerful tended to have more positive evaluations of algorithms (Liao and Tyson, 2021). Perhaps, power users, due to their general technical expertise, familiarity with technology, and high expectations for technology may have different evaluations of algorithmic systems which may inform their attitudes differently from nonpower users.
An integrative framework
We present these two routes for developing algorithmic literacy, not to prioritize one over the other, but to integrate two bodies of research into a single testable process of attitude formation. We see that both the informational route and technical-individual route prioritize two concepts and one moderator that consistently inform attitudes. The first integrative concept is increasing understanding through explanatory information. Throughout the literature presented above, the most consistent correlation with attitudes is providing details on how systems work and the motivations of system designers. Informational interventions can be conducted through a wide variety of formats and require no alteration of algorithmic systems, which are often under tight control.
H1: Exposure to information about social media algorithms will alter attitudes toward algorithms.
The second integrative concept is experiential engagement. By interacting with algorithmic systems, people are able to discover facets of the system and test and retest their mental models of algorithmic processes. Whether through feedback loops incorporated in transparent designs or in interactive workshops like those used in literacy interventions, hands-on personal experiences are likely to deepen understanding of algorithmic systems and inform attitudes. Although people now experience algorithmic systems daily, novel, carefully crafted experiences may prompt individuals to think more deeply about their attitudes toward algorithmic systems.
H2: A novel experience with social media algorithms will alter attitudes toward algorithms.
Each of these two concepts has the potential to inform attitude development, but prior research shows the limits of each concept. One may inhibit or bolster the effect of the other on attitude formation. As such, we explore the interactions between these concepts.
RQ1: Does information and a novel experience interactively inform attitudes toward algorithms?
Both routes of our framework suggest that individual-level traits likely shape expectations of algorithmic systems and inform attitudes. The concept of power usage seems especially likely to associate with the attitudes people hold toward algorithms. Prior work on power usage does suggest that those high on the power usage scale will hold more favorable attitudes toward algorithmic systems than those lower on the power usage scale.
H3: Power usage will positively associate with attitudes toward algorithmic systems.
We explore an interaction based on this integrative framework. Because individuals bring their expectations to their use of technology, we expect those who experience an algorithmic system will adjust their attitudes according to their satisfaction with that experience.
RQ2: Does a satisfactory novel experience of algorithmic systems improve attitudes toward algorithms?
Finally, we note the importance of individual traits for attitude formation processes. Power usage may alter how individuals develop their attitudes in response to information and experiences.
RQ3: Does power usage moderate the effect of information and a novel experience on attitudes toward algorithms?
Methods
Inspired by the work of Jenson and Droumeva (2016) and DiFranzo et al. (2019), we designed and tested an algorithmic literacy intervention. We sought to understand how information, a novel experience, and the individual trait of power usage inform the development of attitudes toward algorithmic systems. We rely on a randomly assigned 2×2 experimental design so that we can determine the main and interaction effects of each concept. An abundance of qualitative research provided the foundation for our proposed framework. To broaden the methodological approach often applied in this field, we apply quantitative methods to further test the ideas proposed.
Sample
Respondents were recruited from Amazon’s Mechanical Turk (MTurk). Care should be taken when generalizing from MTurk data, and a robust set of data cleaning and validation measures were applied. This process can be found in full in the protocol provided in the supplemental materials. An MTurk HIT has created that requested respondents from the United States, who were at least 18 years of age, and had access to their personal Instagram account which was required for the experiential portion of the intervention. A pretest, exposure to the experimental conditions, and posttest were administered to HIT respondents through Qualtrics. The HIT was completed by 545 people between October 14 and 21, 2019. After the data cleaning procedure, 388 participant responses remained. Finally, two responses were removed for incomplete answers to the measurement instruments.
Demographics
Prior research has shown MTurk convenience samples tend to include younger and more educated participants than national samples (Huff and Tingley, 2015) and perform at least as well as student, laboratory-based, or representative national samples on behavioral assessments (Casler et al., 2013; Snowberg and Yariv, 2018). Respondents who identified as female made up 66% of the final sample. The mean age was 38 years (SD = 10.83, min = 20, max = 75). The sample skewed toward higher education levels with 40% having completed a 4-year college degree. The sample was overwhelmingly white (77%). Respondents leaned more liberal in their political views (40%) than conservative (15%). We suspect the features of this sample reflect the requirement to have an Instagram account. According to a 2019 Pew Research survey (Perrin and Anderson, 2019), Instagram users are more likely to be women and between the ages of 18 and 49. However, the racial diversity of Instagram users is not reflected in our data. These demographic variables had no significant effect on the outcome variables of interest.
Design and procedure
Respondents were presented with a digital consent form and asked to complete a pretest survey that measured the control variables, power usage score, and preintervention attitudes toward algorithms. Respondents were then randomly assigned to one of the four experimental conditions of the 2 (Informational: 0 = control condition, 1 = treatment condition) × 2 (Experiential: 0 = control task, 1 = treatment condition) factorial design. An illustration of this 2×2 factorial design is provided in the supplemental materials.
Educators have long found the positive influence of infographics in various learning outcomes ranging from greater academic achieving such as knowledge gain as well as long retention of knowledge, to self-efficacy for continuous learning (see Elaldı and Çifçi, 2021). The effectiveness of infographics is even more evident in translating science concepts that are abstract and complicated to the public (Barlow et al., 2021). We choose to develop an infographic to strengthen the intervention. The information factor levels exposed participants to an infographic about social media trends (control) or an infographic with content about social media algorithms (treatment).
We chose a distraction task for the control conditions so the amount of time between pretest and posttest would not introduce a confounding variable. The infographics are presented in the supplementary materials and high-resolution versions are available from the authors by request.
The experience factor levels either asked respondents to access their Instagram profile, go to the Explore page, and describe the first five posts on the page (control) or access their personal “Instagram Ads Interests” data (treatment). Once viewing their ad information, respondents completed an algorithm satisfaction measure discussed below. Accessing the ad interest data required users to go to their profile security settings and select the option to view their ads interests. Images with these steps were provided for both mobile and desktop devices. Whether respondents accessed Instagram through a desktop/laptop or mobile device/tablet was also accounted for in the data analysis (access device: 0 = desktop, 1 = mobile device). The steps for each interface were only slightly different. A user’s ad interest is connected to their account, so the data do not vary by device. These directions and prompts are provided in supplemental materials with high-quality and animated versions also available from the authors by request. After the intervention, a posttest survey was used to measure attitudes toward algorithms and demographic data. Participants were then paid for their participation in accordance with the MTurk HIT description. This study was determined to be exempt by our university’s Institutional Review Board.
Measures
Attitudes toward algorithms
Respondent’s attitudes toward algorithms were measured before and after the intervention using nine items developed from interviews of experts in algorithmic systems conducted by Rainie and Anderson (2017). The measure included items like, “Algorithms are fair” and “Algorithms are helpful to me.” Responses were recorded on a seven-point scale (0, strongly disagree; 6, strongly agree). The instrument was deemed reliable and responses were averaged across items where higher scores represent a more positive attitude (pretest: M = 3.11, SD = .97, α = .84; posttest: M = 3.10, SD = 1.03, α = .86). Participants’ pretest attitude score was subtracted from their posttest attitude score to create a change in attitude measure that served as the primary outcome variable for this study (M = −.01, SD = .59). Scale development, validation, and the full text for the measure are provided in the supplemental materials.
Power usage score
Respondents answered 12 items on a seven-point scale (0, strongly disagree; 6, strongly agree) developed by Sundar and Marathe (2010). Example statements include “I think most of the technological gadgets are complicated to use.” “I make good use of most of the features available in any technological device” etc. A single score for respondents’ power usage was calculated by averaging across items such that a higher score identified power users (M = 4.19, SD = .91, α = .87). Although this mean is above the midpoint of the seven-point scale, this is consistent with results reported by Sundar and Marathe (2010) for a student sample.
Satisfaction
Only participants who were assigned to the treatment condition of the experiential factor (N = 184) were able to evaluate their satisfaction with the algorithmic categorization of their ad interests. As no suitable scale has been previously validated to measure satisfaction of algorithmic ad categorization, a five-item scale was derived from Grawitch et al. (2013) work/nonwork life satisfaction scale. Grawitch et al.’s (2013) scale uses the question stems, “I am satisfied with . . .,” “I would change almost nothing . . .,” and “ . . . is close to ideal.” We used these stems and changed what the items refers to. The resulting items read, “There is nothing I would change from Instagram’s ad interest list” and “I am happy with how Instagram has identified my interests.” Responses were recorded on a seven-point scale (0, strongly disagree; 6, strongly agree). A single satisfaction score for each respondent was calculated by averaging across items such that a higher score identified higher satisfaction with the Instagram ad categorization algorithm (M = 2.61, SD = 1.59, α = .91).
Control variables
As it was not clear from the prior literature whether control variables would influence responses to the intervention or attitudes toward algorithms, we collected several common measures. These were familiarity with social media platforms, need for cognition, Internet skill level, online discussion frequency, and a battery of questions about algorithms to measure knowledge. Of these, only frequency of online discussion significantly associated with the study variables and as such was included as a control in the predictive models. For this measure, participants were asked to report on a seven-point scale (0, not at all often; 6, very often) how frequently they performed 10 behaviors like commenting or liking content on social media. A single score for online discussion frequency was calculated for each respondent by averaging answers to each item such that a higher value was associated with more frequent online discussion (M = 3.52, SD = 1.08, α = .86).
Analysis strategy
To evaluate the research questions and hypotheses posed, the data was analyzed using OLS regressions conducted in R (R Core Team, 2016). A hierarchical regression fit the control variables in Step 1, main effects in Step 2, two-way interaction terms in Step 3, and three-way interaction terms in Step 4. Using the subset of participants who were exposed to the experiential factor treatment condition, a separate hierarchical regression model was fit to assess RQ2. Throughout the analysis process, a graphical framework was used to check for deviations from model assumptions and outliers/nonnormality (Fife, 2020). No concerns for assumption violation were raised through this process. All figures were generated using the ggplot2 package for R (Wickham, 2009) and provided in the supplemental materials.
Results
A visual analysis of univariate and bivariate distributions showed no obvious deviations from normality, outliers, or systematic skew in the data. We present full model results in Table 1.
Results of hierarchical regression model predicting change in attitudes toward algorithms.
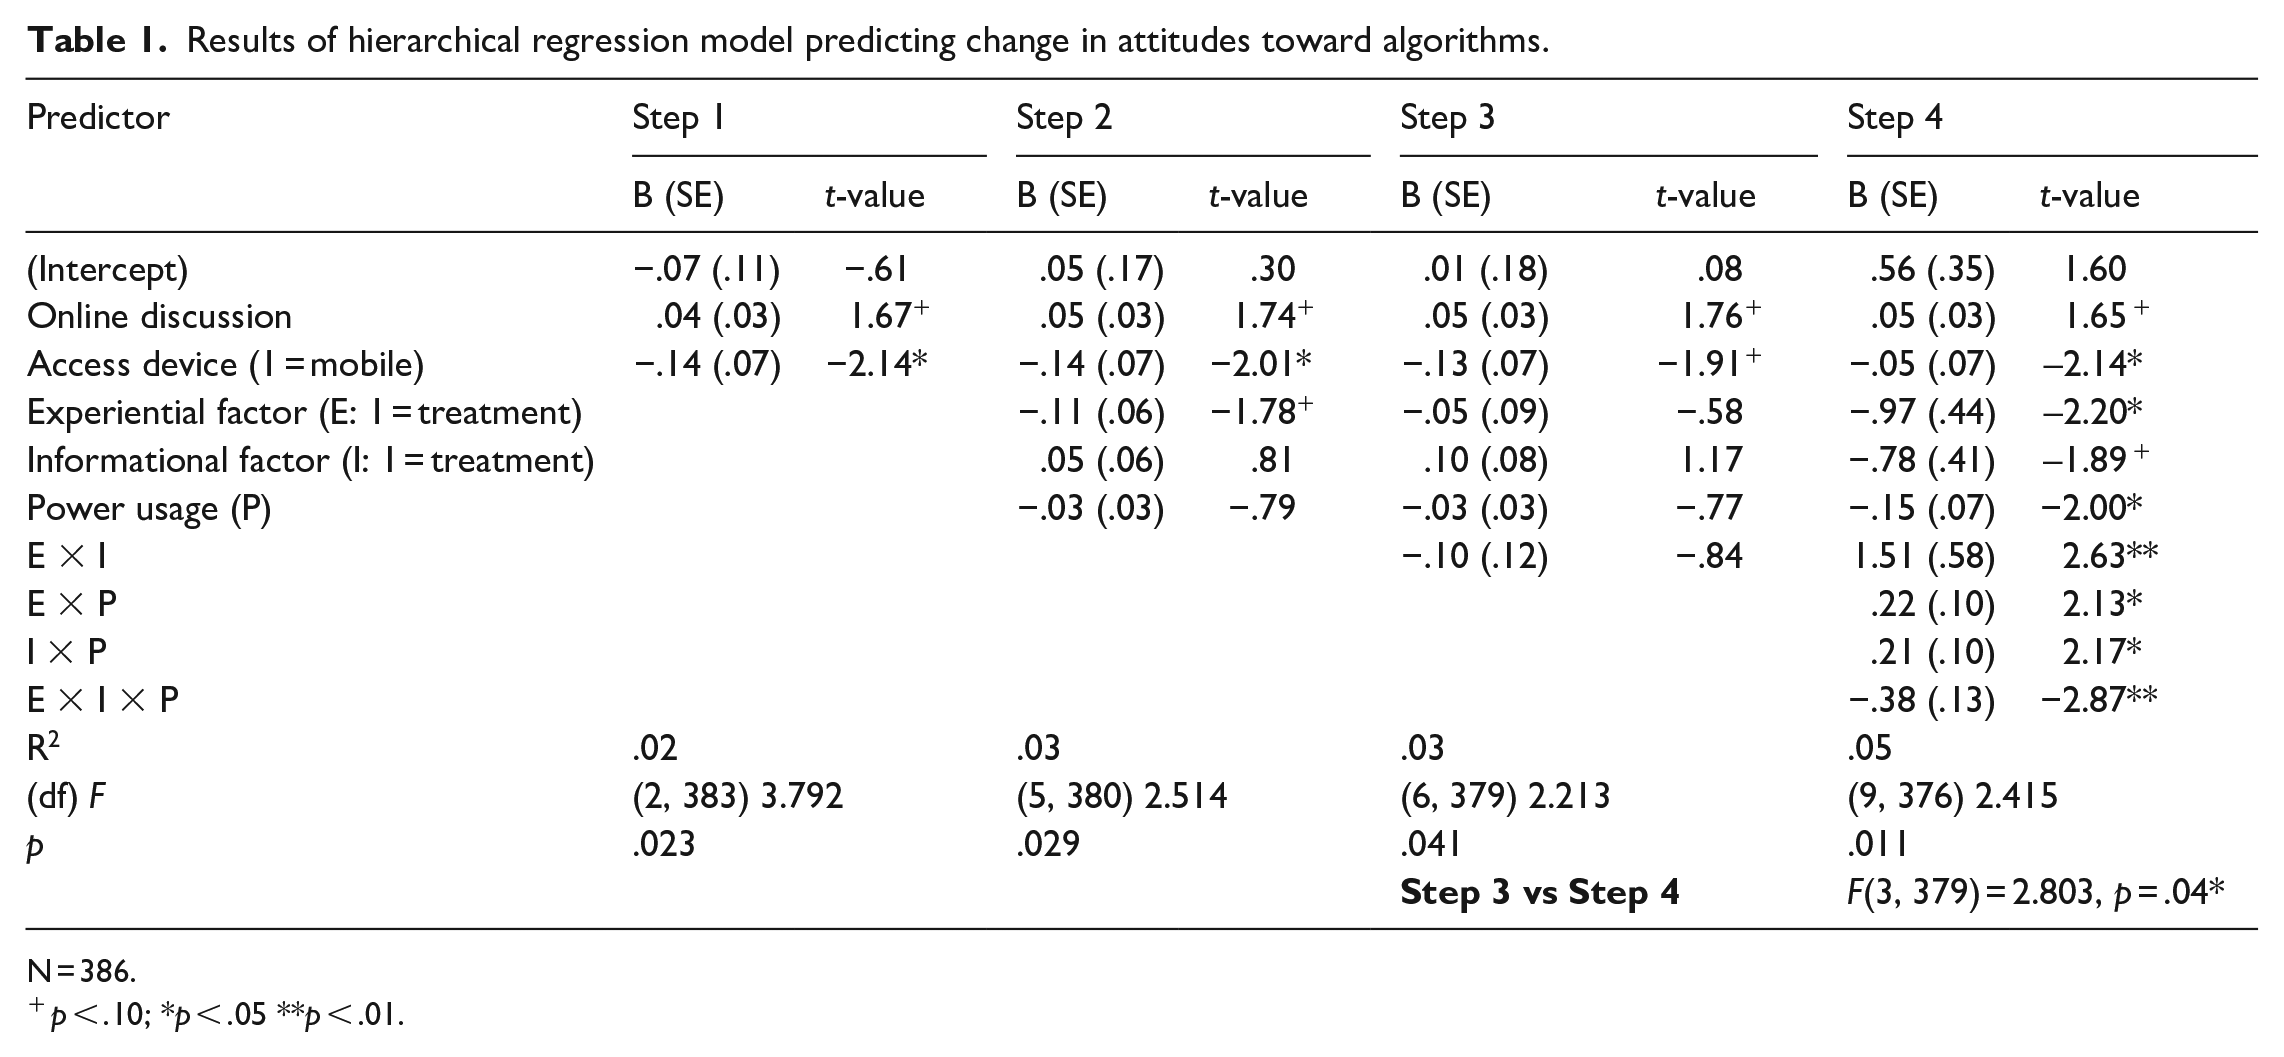
N = 386.
p < .10; *p < .05 **p < .01.
Hierarchical regression: step 1
In Step 1 of the hierarchical regression model, change in attitudes toward algorithms was predicted by online discussion frequency and the type of device used to access Instagram. This model accounted for a significant amount of the total variance in attitude change, F(2, 383) 3.791, p = .023. Participants who engaged in more frequent online discussions, in general, had a more positive attitude toward algorithms after the study (B = .046, SE = .028, p = .095). Accessing Instagram through a mobile device lowered participant’s attitude toward algorithms (B = −.143, SE = .067, p = .033) compared to those who used desktop browsers.
Hierarchical regression: step 2
In Step 2 of the hierarchical regression, power usage score and the experimental conditions were added to the Step 1 model to predict change in attitudes toward algorithms. This model also accounted for a significant amount of variance in attitude change, F(5, 380) = 2.514, p = .029. The parameters for power usage (B = −.026, SE = .034, p = .430) and the informational factor (B = .049, SE = .060, p = .416) were both nonsignificant. From this result, we reject H1 and H3. Information and power usage scores alone do not appear to explain changes in attitudes toward algorithms. The parameter for the experiential factor of the intervention was negative but not significant (B = −.106, SE = .060, p = .076), so we reject H2. A personalized experience of an algorithm alone does not explain changes in attitudes.
Hierarchical regression: step 3
In Step 3, a two-way interaction term was added to the model predicting changes in attitudes toward algorithms. Although the model still predicts a significant amount of variance in attitude change, F(6, 379) = 2.213, p = .041, the two-way interaction term was not significant (B = −.102, SE = .121, p = .399). This suggests a negative response to RQ1. Neither information nor experience, separately or together, seems to predict changes in attitudes.
Hierarchical regression: step 4
Finally, the three-way interaction between the two experimental conditions and power usage score was added to the model to assess RQ3. This model explained a significant amount of variance in attitude change, F(9, 376) = 2.415, p = .011, and was an improvement over Step 3, F(3, 379) = 2.803, p = .04. The three-way interaction term was statistically significant (B = −.383, SE = .133, p = .004). Residual versus fitted, normal Q-Q, and residual versus leverage plots were reviewed for model diagnostics, which showed no indication that the model deviated from assumptions. These figures are presented in the supplemental materials.
This result shows the effects of the experimental conditions on attitudes toward algorithms depend on an individual’s power usage score, controlling for online discussion frequency and access device. In other words, the two-way interaction between the experience and information conditions was moderated by power usage. In general, attitudes toward algorithms change as power usage scores increase, but the direction of such change is contingent on the experimental conditions. Participants with the highest power usage scores had more negative attitudes toward algorithms after viewing algorithm information and experiencing algorithmically generated advertising labels than power users who did not experience the advertising algorithm. The amount of attitude change is small at less than half a point difference on the scale. However, the 95% confidence intervals show consistent effects in some conditions. We present point estimates and confidence intervals of attitude change by condition and by power usage score in Table 2.
Point estimates for attitude change by condition and power usage score.

When we account for the power usage interaction, the two-way interaction between conditions becomes clear. The violin plot in Figure 1 displays the distribution of predicted attitude change scores by experiment condition. We see differences between the centers of the distributions and the variances. The experience factor conditions had opposite effects, but only for participants who were exposed to information about how algorithms work (violins 3 vs violin 4). Violin 3 shows an average increase in attitudes toward algorithms, while violin 4 shows an average decrease in attitudes toward algorithms. We see a similar negative attitude change in violin 2, but no consistent change in violin 1.
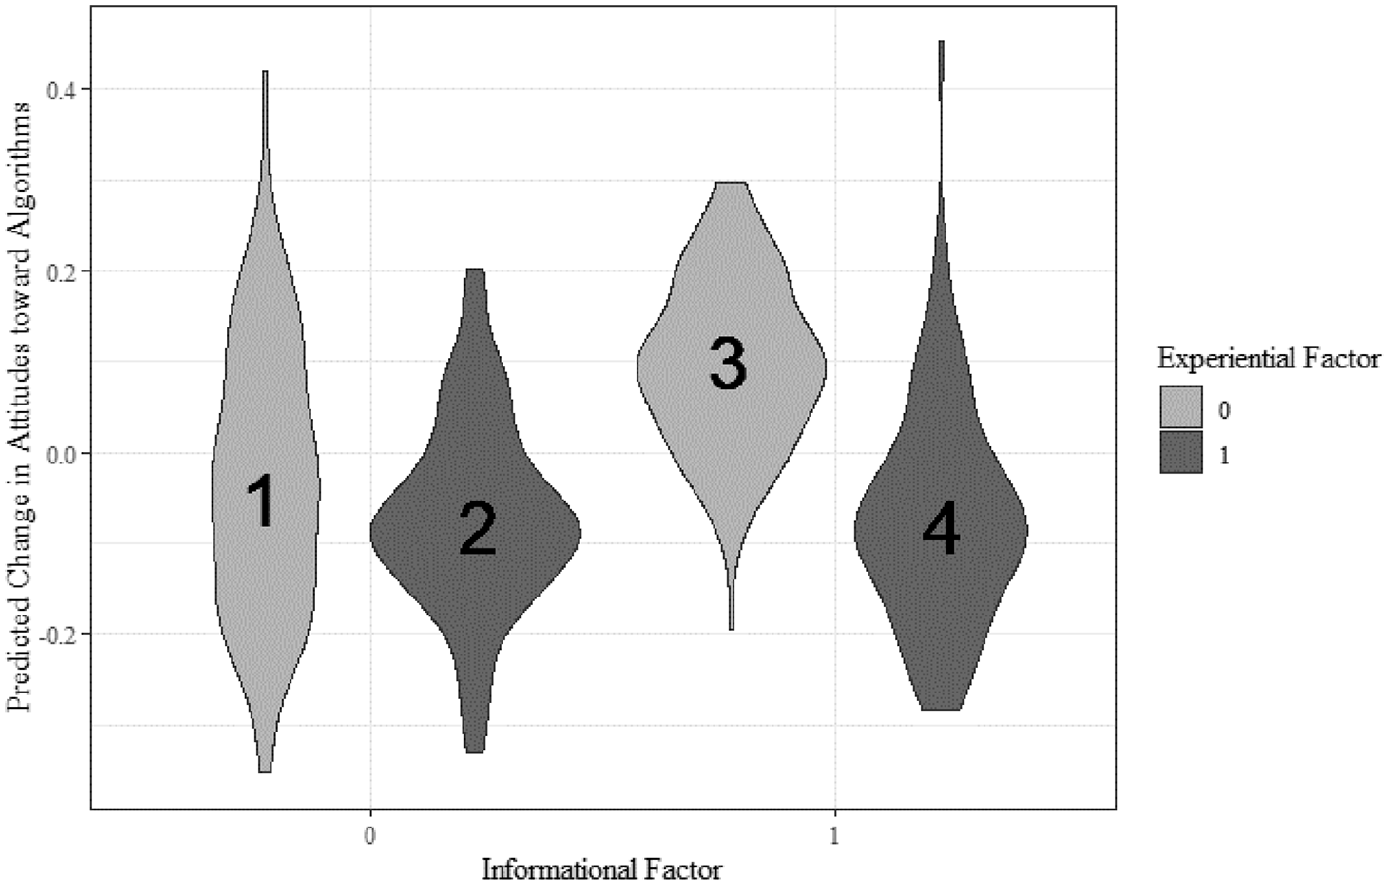
Predicted attitude change by experiment conditions (Step 4 model).
To further decompose the three-way interaction, we plotted the predicted attitude change for those in the informational treatment condition by power usage score (Figure 2). This lets us zoom in on the variance shown in violins 3 and 4 and shows that as power usage scores increase, attitudes changed depending on the experience they had. Those who engaged in the control task (experiential factor = 0) and were highest on the power usage scale reported more positive attitudes toward algorithms than they reported before exposure to the condition. Those who were assigned to the experience treatment condition (experiential factor = 1), by engaging with the Instagram ad categorization algorithm and viewing their personal ad interests, show an opposite effect—their attitudes toward algorithms more consistently worsened the higher they scored on power usage.
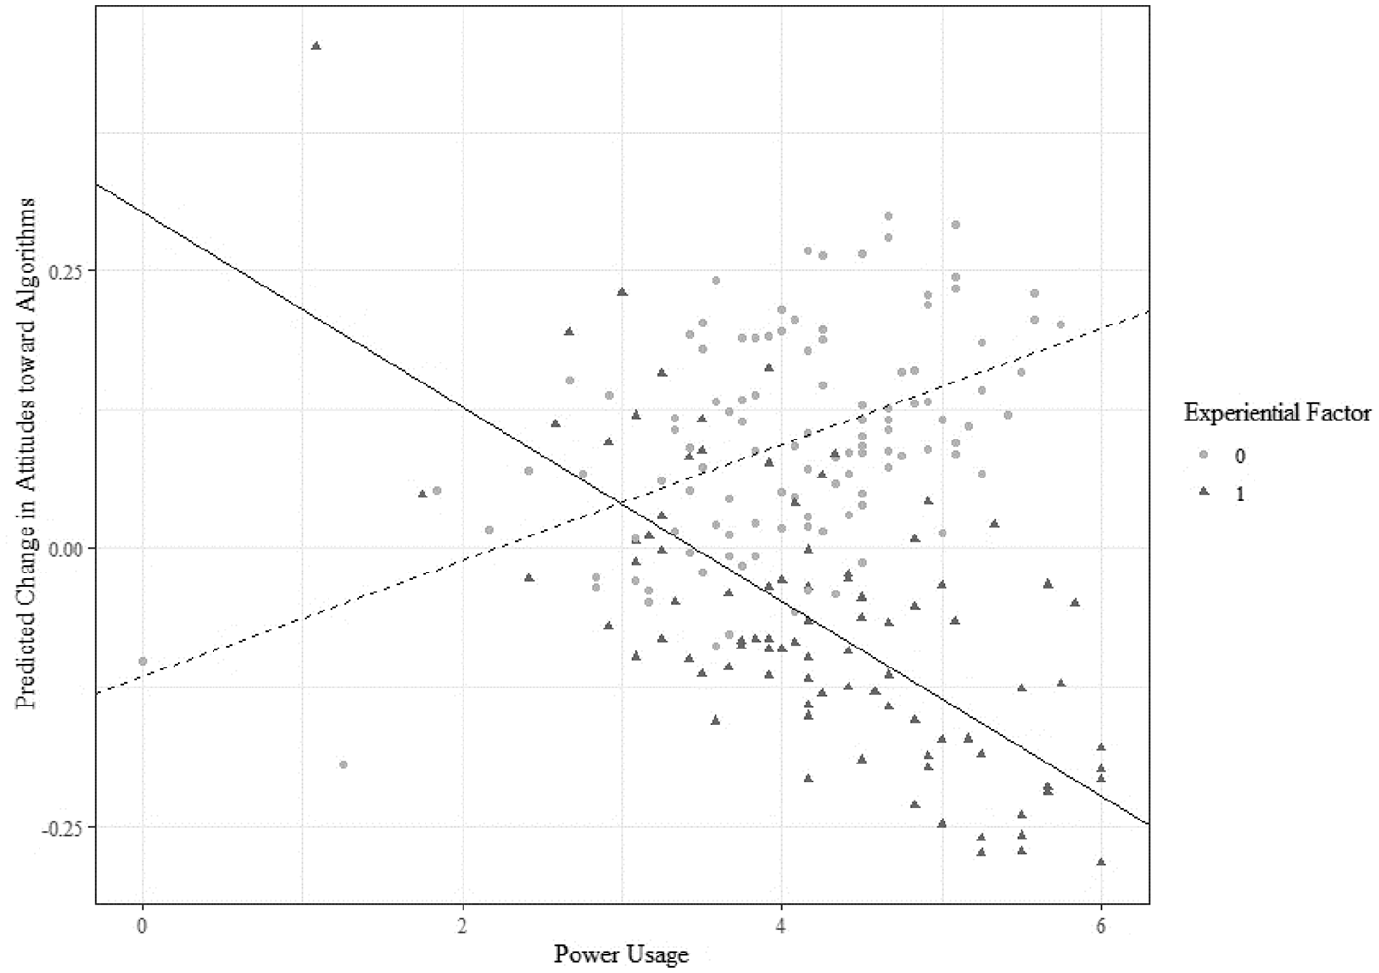
Scatter plot of predicted attitude change by power usage in informational treatment conditions by experiential factor.
Satisfaction with attitude change
Because the experiential factor relied so heavily on the Instagram categorization algorithm, we sought to determine whether satisfaction with Instagram’s ad interest results predicted attitude change in addition to the experimental conditions and individual traits already assessed (RQ2). Step 1 of this hierarchical regression model predicted a change in attitudes toward algorithms by the controls in the previous model and the two-way interaction between the informational factor and power usage. Only those participants in the experiential factor treatment condition were used in this second analysis (N = 184), so no three-way interaction is possible. Step 1 shows an overall poor fitting model, F(5, 178) = 1.072, p = .38. In Step 2, satisfaction with Instagram’s ad interest categorization was added. This change drastically improved model fit, F(6, 177) = 2.2, p = .045, and the parameter for satisfaction on attitude change was significant (B = .081, SE = .029, p = .006), such that as satisfaction increased attitudes toward algorithms improved. Power usage scores did not significantly correlate with satisfaction, Pearson’s r (182) = −.077, p = .3. Full model results are presented in Table 3.
Results of hierarchical regression model predicting change in attitudes toward algorithms by satisfaction.
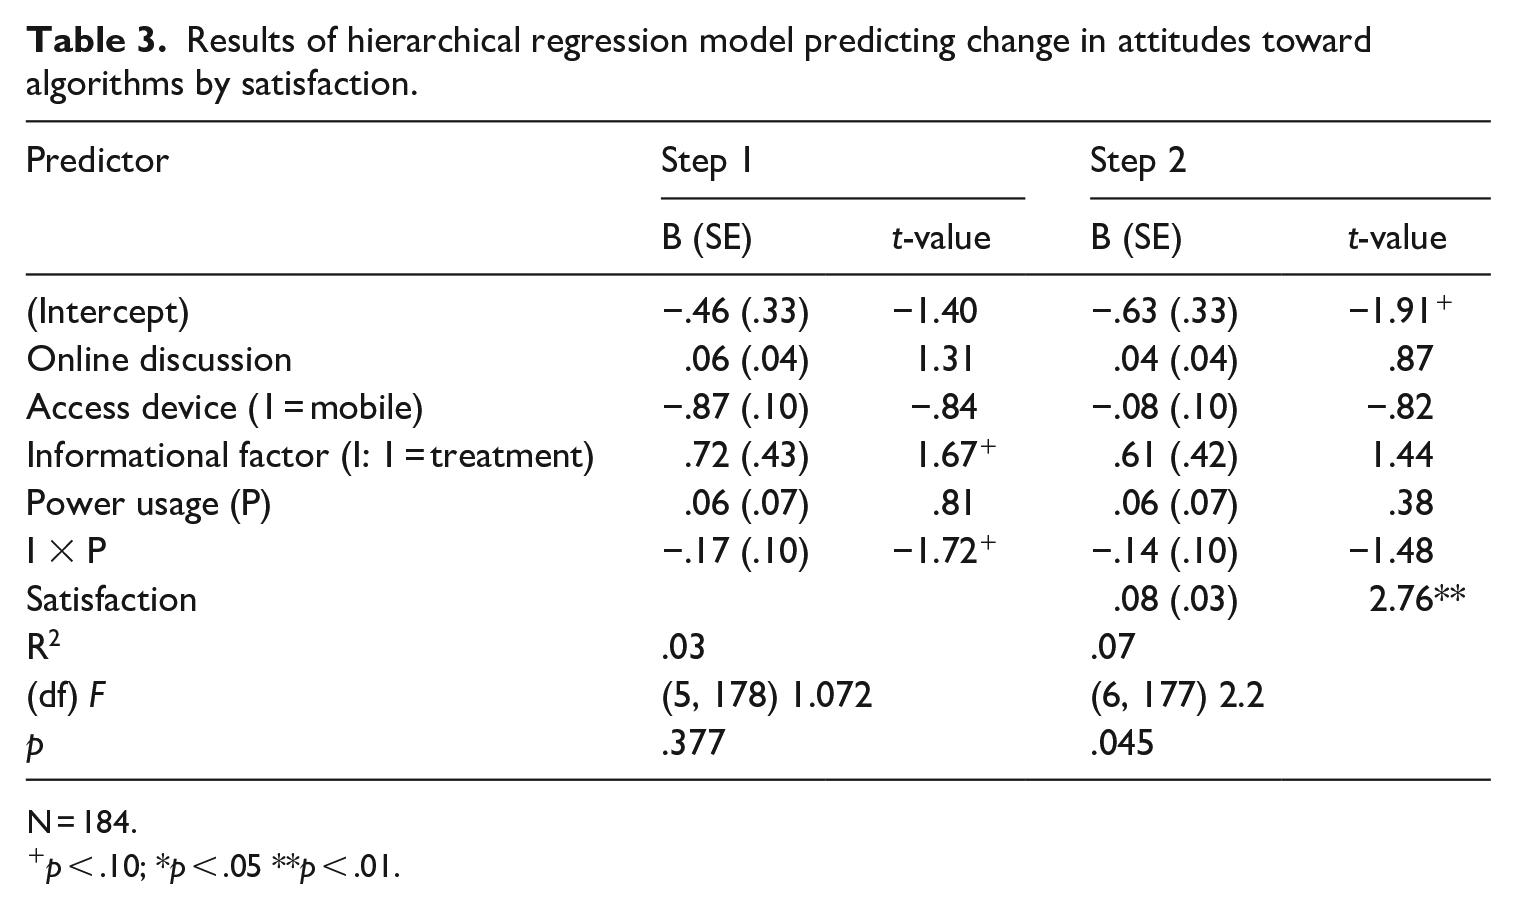
N = 184.
p < .10; *p < .05 **p < .01.
Discussion
To summarize the results of the experiment we employed, it must be first noted that for most participants, their attitudes toward algorithms were highly stable. However, when we observed attitudes change we find information can inform attitudes toward algorithmic systems, but we do not reveal the direction of these effects unless we also examine additional factors. Similarly, a novel experience with a platform’s interface and satisfaction with the results of algorithmic categorization also can inform and change attitudes, yet also dependent on an individual’s perception of technology.
These findings lend support to the integrative framework we propose. Attitudes toward algorithms are informed by information and experiences but depend on individual perceptions and expectations of technology. Providing information about algorithms and interacting with the algorithmic categorization through firsthand experience are insufficient to foster attitude formation. Power usage, by itself, also has no significant relationship with attitudes toward algorithms, contradictory to what was found in Chen and Sundar (2018). The data presented here show all three factors influence and, in some instances, even canceled out the effects of each other. We interpret these results as further support for an integrative framework that recognizes the multiple facets that inform attitudes toward complex, socially salient systems.
It is important to note that most participants in this study experienced no meaningful attitude change. As such, only a small amount of variance is accounted for by the model predicting change in attitudes toward algorithms (R2 = .05). Perhaps in our current information ecosystems, attitudes toward algorithmic systems are already fairly stable. This was a single exposure intervention, so even though we see some meaningful results, a stronger or repeated treatment may yield greater effects. We also find power usage frames people’s experiences of algorithms within the broader context of their view of technology. This trait moderates the effects of our intervention. As boyd (2018) proposes, personal outlooks and context likely play a role in other literacy domains. Perhaps, power usage is relevant in other digital contexts, while other traits still need to be identified for other literacy domains.
One alternative interpretation not addressed in this study is the potential that privacy violations may have influenced attitude change. Specifically, the power users in our sample, when seeing how their social media accounts were categorized, may have reacted negatively to the idea that Instagram made decisions from personal data. Kang and Shin (2016) found power users were discouraged from sharing personal information through mobile devices when their experiences were tailored to their locations. We can only partially rule out this interpretation. We measured two items from Fletcher and Nielsen (2018) after the intervention that assessed comfort with algorithms using personal and social data to filter news content. Responses to both were indicated on a seven-point scale (0, strongly disagree; 6, strongly agree) such that a higher score indicates greater comfort with algorithm’s use of each type of data (Use of personal data: M = 2.81, SD = 1.65; Use of social data: M = 2.37, SD = 1.65). We found no significant correlation between these variables, our conditions, and power usage scores. However, these items did positively associate with attitudes toward algorithms. This suggests privacy concerns are not the difference between power users and those lower on the scale. It is more likely Instagram’s algorithm is not satisfactory to those who expect a high level of customization and control over their technology, which lowered attitudes toward algorithms.
Implication and future research
Algorithmic literacy interventions
We contribute to the work on algorithmic literacy and accountability by establishing a framework that integrates two distinct bodies of literature through common concepts of information and experiences. Attempts to explain social media content ranking systems by texts and graphics may only advance understanding for some. A novel experience allowed more technically savvy participants to make sense of the algorithmic computation process. Above all, these results emphasize the importance of avoiding a one-size-fit-all approach when assessing the factors that influence attitude formation as all effects were moderated by the individual-level trait of power usage.
Algorithmic accountability through attitudes
Recent legislative actions, like the 2018 General Data Protection Regulation (GDPR), have prioritized transparency as a “right to an explanation” (Wachter et al., 2018). It requires that a data controller gives “individuals specific information about the process” and gives “individuals rights to challenge and request a review of the decision” (De la Torre, 2019). To meet these standards, successful algorithmic literacy interventions and system designs must provide a way for individuals to make sense of algorithms. We approached the idea of “explanation” intuitively and combined information with a personalized activity to help our respondents better grasp the concept of algorithms. However, the design of Instagram buries these algorithmic decisions behind many unintuitive menus and steps. It is unlikely that the two concepts used in this study meet the mandates of the GDPR.
We show black-box algorithms that do not satisfy users’ expectations lowered our participants’ attitudes toward the system. This practice is bad for Instagram but may benefit the broader debate on algorithms in society. We hope to facilitate broader discussion that triggers better-informed attitudes toward algorithmic systems. We believe interventions that help the public develop nuanced attitudes toward complex social systems better positions them for purposeful individual and civic behaviors.
Eslami et al. (2017) advocated for “actionable transparency” (p. 70) to address the concern of lack of transparency in algorithm system design. Ananny and Crawford (2018) go further and suggest transparency itself is insufficient to hold algorithmic systems and their designers accountable for their creations. Our intervention invited people to peek into a “black box” algorithm which may have afforded the opportunity to understand the process; this understanding may open the door for deeper engagement. However, revealing Instagram’s process may have unique effects that do not transfer to other platforms. These results may prompt companies to explore ways to operationalize “actionable transparency” in daily user experience strategies while also recognizing the effect of personal traits and society’s knowledge and perception of algorithms as a whole.
Limitations and conclusion
This was a one-time intervention with attitudes measured immediately after exposure. Long-term attitude change was not measured and so the effects reported may differ if measured on a different timeline There was a potential self-selection bias introduced by recruiting from MTurk which could explain the high average power usage scores in the sample. No national studies have provided benchmarks of this variable for comparison, but our sample mean aligns with other published experiments. The sample was also skewed toward white females with high education levels, therefore limiting the generalizability of the study results. Additional data collection and replication are required to further test these findings. Finally, this intervention relies on users’ Instagram data and ad categorization. Using a real platform increases this study’s ecological validity and strengthens the individualization of the experience, but also introduces potentially confounding variables such as participants’ prior attitudes toward Instagram. We rely on random assignment to conditions to reduce systematic error. There is also the potential that the lack of a main effect of experimental conditions is due to a weak manipulation between the control and treatment conditions. In pilot testing, we identified that very few people had viewed their ad preferences justifying this task as a novel experience while many people used the Explore tab on Instagram. Algorithms used to determine loan rates or credit card approval could be fundamentally different from algorithms used on Instagram; algorithms used on Facebook and TikTok are also different from what was implemented on Instagram, thus until interventions are tested using other platforms, social media, or else, these results should not be generalized to those systems.
We developed a measure of attitudes toward algorithmic systems to address the nuanced nature of perception beyond a negative-positive attitudinal spectrum. We use a general measurement of attitude to capture the potential impact of social and current events on attitudes, although this was not part of the current study. We present how this measure is validated in the supplemental materials, but it still requires further tests of reliability.
In conclusion, this article proposes an integrative framework for developing attitudes toward algorithms and tests this framework with a real social media platform. Results suggest that the effectiveness of the intervention is largely dependent on an individual’s power usage, which is in line with our integrative conceptualization of attitude formation. The potential for algorithmic decision-making systems has increased alongside computational advancements, and the public must be engaged in evaluating these processes. Journalists, researchers, public officials, and educators all seek to accurately describe algorithms to raise awareness of bias in algorithmic decision-making and to hold institutions accountable for their decisions. However, we cannot expect information alone to have consistent and predictable effects. Instead, clear, accurate, and nontechnical communication is required to explain intricate processes, and systems must be designed in a way that shows their processes and limitations. These systems are interpreted through a combination of processes, and we must recognize each of those processes to predict and explain attitudes toward algorithms.
Supplemental Material
sj-docx-1-nms-10.1177_14614448221098042 – Supplemental material for Facets of algorithmic literacy: Information, experience, and individual factors predict attitudes toward algorithmic systems
Supplemental material, sj-docx-1-nms-10.1177_14614448221098042 for Facets of algorithmic literacy: Information, experience, and individual factors predict attitudes toward algorithmic systems by David E Silva, Chan Chen and Ying Zhu in New Media & Society
Footnotes
Authors’ Note
Chan Chen is now affiliated to Hunan Normal University, China.
Funding
The author(s) received no financial support for the research, authorship, and/or publication of this article.
Supplemental material
Supplemental material for this article is available online.
Author biographies
References
Supplementary Material
Please find the following supplemental material available below.
For Open Access articles published under a Creative Commons License, all supplemental material carries the same license as the article it is associated with.
For non-Open Access articles published, all supplemental material carries a non-exclusive license, and permission requests for re-use of supplemental material or any part of supplemental material shall be sent directly to the copyright owner as specified in the copyright notice associated with the article.