
Abstract
The Coronavirus pandemic has created new vulnerabilities and deepened existing ones. In Ghana, the overall headcount poverty decline has disguised a large group of vulnerable households now threatened with falling back into poverty given the effects of the COVID-19 pandemic. This article draws on new household panel data to analyse transient poverty, the drivers of vulnerability before and since the COVID-19 pandemic and provides implications for social protection. Using poverty transition matrices, we first measure poverty episodes which help to not only track the movements in and out of poverty but also to identify and categorize households into distinctive groups. We then apply logistic regression to examine the determinants of vulnerability to poverty before evaluating COVID-19 vulnerabilities in the context of social protection in Ghana. We find that a large group of struggling households exist between the poor and the stable middle classes that have been overlooked by cash transfer programmes. We characterize this group and show that current vulnerability measurements and social protection design need adjustments. We also find that poverty and vulnerability to it is no longer a rural phenomenon as the transient poor since the COVID-19 pandemic are mostly located in urban areas and largely not covered by current social protection systems. Both vertical and horizontal expansion of social policy is required to reach these new groups and new locations. For reducing poverty and limiting vulnerability in developing country contexts, our findings imply that (a) new measurements and targeting may be required, (b) vulnerable informal groups in urban areas need to be included, and (c) new types of social protection for struggling households are required to prevent their falling back into poverty in the event of aggregate shocks.
I. Introduction
Vulnerability to poverty and its drivers over time are challenging to identify due to the research challenges in measuring episodes of transient poverty, assessing the degree of household vulnerability and capturing the practical impact of this vulnerability on households’ livelihoods. These challenges are significantly exacerbated by the way in which contextual factors and household characteristics mediate changing vulnerability. It is therefore not surprising that social policy thus far has mainly focused on reaching the poor without systematically addressing these complexities around vulnerability. As the impacts of the COVID-19 pandemic are becoming clearer, there is still the tendency to focus mainly on the poor rather than consider vulnerability in a more complex and dynamic way, including a recalibration of social protection programmes.
In many low- and middle-income countries, additional social protection programmes have been set up, or existing programmes adapted, to cushion the socioeconomic effects of the pandemic on poverty (Gentilini et al., 2020). The effects of the COVID-19 pandemic have been heterogeneous and impact households via various channels beyond income and labour such as through health and education (Afriyie et al., 2020; Bukari et al., 2021; Dzigbede and Pathak, 2020). As the pandemic and other economic shocks, such as the current high inflation, will continue to affect livelihoods for some time, it is critical to understand if new vulnerabilities to poverty differ from the previous ones, and how social protection policies need to change to incorporate new dimensions of vulnerability. For instance, youth mental health (Bauer et al., 2021) and disability considerations (Banks et al., 2021) are already being discussed for inclusion in redesigned social cash transfer programmes. To our knowledge, a more general assessment of vulnerability before and since the COVID-19 pandemic, and the implications for social protection programmes are still missing.
This article argues that the vulnerability and social protection debate since the emergence of COVID-19 needs to be broadened to include the ‘missing middle’ in social protection (Bacil and Soyer, 2020) as well as systematically target the urban vulnerable and poor. The ‘missing middle’ is a potentially large group in between the permanently or very poor and the established middle classes, who are neither eligible for measures aimed at the ultra-poor nor do they have access to social protection via formal employment. Specific policy measures for this struggling group are required. Taking the case of Ghana, we show that there is substantial reason to believe that vulnerability is not only driven by, but exacerbated by COVID-19 effects, possibly jeopardizing previous poverty reduction successes.
Ghana is an interesting case, as it used to count as a success story of global poverty reduction, but recent developments indicate that the overall positive numbers may have masked a large share of people living in vulnerability to poverty (Appiah-Kubi and Oduro, 2005; Cooke et al., 2016; GSS, 2014, 2018; Novignon et al., 2012; Zereyesus et al., 2017). While the poverty rate was still declining in Ghana, the probability that non-poor households fall (back) into poverty has increased (Awuni, 2019). So, over time, whilst more poor households were able to cross the poverty line, fewer of these were able to escape poverty permanently. Existing studies primarily measure cross-sectional vulnerability (Appiah-Kubi and Oduro, 2005; Awuni, 2019; Novignon et al., 2012; Zereyesus et al., 2017), and it is still empirically unclear what drives vulnerability to poverty over time in Ghana, both before and since the pandemic.
If vulnerability to poverty in Ghana had already increased before COVID-19, and transient poverty was becoming more common, then this implies that current social protection policies are not sufficient even in the absence of a pandemic. If the non-poor or vulnerable become poorer, then social protection programmes such as the Livelihood Empowerment Against Poverty (LEAP) need to be expanded horizontally. If the already poor become poorer, then we may need vertical expansion. For a suitable expansion and targeting, the drivers of vulnerability need to be understood.
This contribution uses novel data to address three research gaps. First, we track movements in and out of poverty using poverty transition matrices. We then categorize households into various groups based on their poverty mobility. We further estimate household vulnerability to poverty dynamically and use logistic regression to identify the drivers of pre-COVID-19 vulnerability to poverty using new panel data. This closes an empirical research gap and is the main empirical contribution of the article. Second, we compare vulnerabilities before and since the COVID-19 pandemic, combining the panel data with information gathered during the pandemic to find out whether the poor or the non-poor are becoming more vulnerable. This helps to show whether a vulnerable group of strugglers has been overlooked this far and what characterizes it. We also provide a differentiated picture of general and current COVID-19 trends. Third, we discuss the implications for social protection policies and develop concrete suggestions for addressing the different vulnerable groups, based on a mapping of their characteristics. We discuss whether reform is required to counter the effects of the pandemic and decrease vulnerability to poverty in a way that addresses the needs of the struggling, transient households in between the poor and the stable middle classes.
The article is structured as follows. Section II summarizes relevant literature on vulnerability to poverty and social protection in Ghana as well as the state of knowledge on COVID-19 effects. Section III presents the data, namely the panel survey, and describes the methodology. Section IV presents the results whereas the last section discusses the policy implications and the conclusions.
II. Literature Review
Vulnerability to Poverty and Social Protection in Ghana
Understanding and anticipating households’ vulnerability to poverty implies an acknowledgement of the multi-dimensional and dynamic nature of poverty. The debate on the measurement of poverty, and vulnerability to it, is extensive (for an overview, see Grimm, Waibel, and Klasen (2016)). Traditional, unidimensional poverty measures of income or consumption are straightforward to interpret across and within countries over time, which explains their popularity among policymakers. Studies analysing households’ vulnerability to monetary poverty then primarily look at the deprivation of income or consumption (Calvo and Dercon, 2005; Chaudhuri et al., 2002; Zereyesus et al., 2017), low expected utility of consumption (Ligon and Schechter, 2003) and exposure to unexpected risk (Dercon, 2005; Skoufias and Quisumbing, 2005). Current multi-dimensional measures of poverty take indicators on education, health and standard of living (Alkire et al., 2017) or work, education and health (G-CSPI, Burchi et al., 2022) into account. If poverty is multi-dimensional, then, in consequence, vulnerability to poverty has multiple dimensions as well. As a working definition, a household could be considered vulnerable from a multi-dimensional point of view if it is deprived (i.e., below threshold indicators) in one or more of these dimensions. Overall, both unidimensional and multi-dimensional approaches are subject to a range of estimation and threshold choices (Hulme and Shepherd, 2003).
Beyond those households in chronic poverty, many others go through periods of poverty or are constantly threatened to fall back into poverty. Transient, dynamic poverty of individuals (and their households) over time has received less attention in the literature than chronic or static analysis of poverty. This is partly due to a lack of adequate panel data and partly due to the overarching debate about suitable indicators and methodologies. This far, sudden financial shocks, market failures, insufficient capacities to cope with risks, household size and geographic location (e.g., remote, difficult access to services) have been identified as factors that make households fall back into poverty (Addison et al., 2008; Baulch and Hoddinott, 2000; Schotte et al., 2018).
Especially in Sub-Sahara Africa, households moving out of poverty are not automatically part of the economically stable middle classes. In addition, from an empirical perspective, the size and characteristics of the emerging middle classes are controversial (Banerjee and Duflo, 2008; Kharas, 2017; Knauss, 2019; López-Calva and Ortiz-Juarez, 2014; Neubert and Stoll, 2018; Ravallion, 2010; Schotte et al., 2018; Shimeles and Ncube, 2015). Irrespective of terminology, the socioeconomic groups or strata that have just moved out of poverty require closer analysis. Birdsall et al. (2014) have called this group ‘strugglers’, defined as having $4–10 income per capita per day. In Latin America, median adults in struggling households are usually characterized by not having completed secondary education, working in informal or semi-formal sectors and are more likely to be employees than self-employed (Birdsall et al., 2014). For Sub-Sahara Africa, there are hardly any studies that analyse these vulnerable and potentially up-and-downwardly transient groups in detail. However, this could be crucial for a prevention strategy in poverty and social policies. In Ghana, income and multi-dimensional household poverty has declined in the past 20 years, albeit at different rates, while the vulnerability to poverty has remained fairly high. Exact numbers depend on the type of measurement and dataset used. Table A1 shows an overview.
The aims of social protection policy are to reduce poverty and vulnerability by either smoothing out consumption or income fluctuations or preventing households from falling into poverty in the first place. Ghana’s social protection efforts thus far have targeted households that are clearly below the national poverty line with the key instruments being the LEAP cash transfer scheme, school feeding and school fees exemption programmes. Beneficiaries of the LEAP are extremely poor individuals above 65 years of age, persons with severe disabilities with no productive capacity and caregivers of orphans and vulnerable children. The programme combines conditional and unconditional cash transfer elements, following a basic needs approach (Sackey, 2019). In addition, beneficiaries are enrolled in the National Health Insurance Scheme. In the absence of up-to-date vulnerability data, LEAP relies on headcount poverty and Ghana’s official poverty line for targeting. Evaluations of the scheme so far have found positive effects on education, paid employment, and health (Handa et al., 2013; Mochiah, Osei et al., 2014; Owusu-Addo et al., 2018). Nonetheless, LEAP implementation suffers from perceived inclusion errors, missing data on households’ poverty status, a lack of transparency in handling procedures and partly irregular payments (Agbenyo et al., 2017).
The National Health Insurance Scheme, implemented since 2003, can count as a general instrument to prevent a fall (back) into poverty. It is mandatory for formal workers and voluntary for informal workers, thereby, addressing to some extent the social policy gap around non-poor informal workers. Despite the successful registration of 40% of the population in the scheme (also through LEAP, as explained above), current challenges include contributions that are unaffordable for many informal workers, registration difficulties and the low quality of health services provided (UNDP, 2021). Yet, the extent to which a broader policy perspective on vulnerability could improve Ghana’s social protection, and in turn, reduce the risks of transient poverty has hardly been researched.
Effects of COVID-19
The external shock of COVID-19 has had adverse effects on poverty reduction. It has increased the vulnerability of various socioeconomic groups in Ghana via different channels. The main effect of the lockdown was felt through decreased income from labour, particularly for workers in lockdown areas. Simulations and rapid phone surveys suggested that the economic impact has been worst in the country’s two largest cities, Accra and Kumasi, which underwent a partial lockdown for over three weeks in April (Schotte et al., 2021). But a recent study (Egger et al., 2021) showed that the negative effects were felt nationwide. Bukari et al. (2021) indicate that previous vulnerabilities such as a lack of stable income were amplified in rural areas, but also significantly exacerbated in urban ones. Meanwhile, current social protection systems do not reflect the distinct vulnerabilities of the urban poor, who face higher living costs and more precarious employment, and are not reached by social insurance schemes that are designed for formally employed workers (Devereux and Cuesta, 2021, p. 340).
Several studies simulate rough estimations of poverty impacts. Using a social accounting matrix model, Amewu et al. (2020) estimate that the lock-down measures in April 2020 could imply a drop in national GDP by 27.9% and cause around 3.8 million Ghanaians to become temporarily poor. The World Bank (Mahler et al., 2020) takes an arbitrary measure of 5% consumption losses to estimate the effects of COVID-19 on poverty reduction, with an increase of extreme poverty of 1 percentage point. Dzigbede and Pathak (2020) also calculate long-term economic effects with a 5% consumption loss and estimate the number of poor households to increase by 1.1 to 1.5% compared to the baseline. These overall figures may give some rough indications, but do not tell us about drivers of vulnerability and potential targeted pathways out.
The first studies using household surveys and real data have also been published. Based on an online and telephone survey, Bukari et al. (2021) find that COVID-19 increased poverty and decreased living standards, especially concerning decreasing cash inflow due to job losses (62% of surveyed households affected), access to medicine or medical treatments (52%) and access to clean water (50%). These findings are in line with Egger et al. (2021), who add that just 22% of households have received NGO or government support. According to a survey by the Ghana Statistical Service (GSS, 2020), more than 22 million Ghanaians have been affected by a reduction in their household income since COVID-19 restrictions were first introduced. About 9% of the households reported that they had received some form of assistance, especially free food. Therefore effects were significant, but comparable to studies for other countries (Alon et al., 2020; Suryahadi et al., 2020).
Livelihoods connected to the informal economy are likely most affected (Schotte et al., 2021). Mobility restrictions associated with the COVID-19 pandemic are likely to have devastating and lasting impacts on informal sector workers and small-scale businesses (Maiti and Locke, 2021). A study based on data from a phone survey in Ghana estimated that the three-week lockdown had a large and significant immediate negative impact on employment in the lockdown districts, particularly among workers in informal self-employment. Despite the effect becoming smaller, the nationwide impact on labour market outcomes was persistent (Schotte et al., 2021). In terms of sectors, the primary sector was the one suffering the least from closures. The reason for this is that farmers, for example, were allowed to continue their activity due to the critical necessity of food. 1
In terms of gender, COVID-19 seems to have impacted more women than men. In an urban Ghana survey, women were more likely to stop working due to COVID-19, especially due to caring responsibilities for family members, and because women in Ghana are overrepresented in informal self-employment and underrepresented in formal wage employment. Young adults (18–24 years) were more likely to be adversely impacted than older age groups because they were more likely to be earning less before the pandemic, and because of already high rates of youth unemployment (12%) and underemployment (50%).
Finally, the possibility of working from home has vulnerability implications, especially if some sectors and workers are disrupted for longer periods (Daniel et al., 2020). Whereas some economic activities may not be significantly impacted by mobility restrictions, others are gravely affected. For example, agricultural activities such as household farm businesses which were allowed to continue were less impacted. Conversely, elementary occupations, plant and machines workers, and service and sales faced higher risks of income loses or greater exposure to infections because these workers were least likely to be able to work from home.
Increases in social protection programmes may have buffered some of the aforementioned welfare losses. The social policy responses to COVID-19 by the Ghanaian government,
2
represented by the Coronavirus Alleviation Programme (CAP), included the following: increasing financial support for the National Health Insurance Agency, distributing food packages and hot meals to people in need, paying water and electricity bills for households in restricted areas for three months (Danquah et al., 2020) and setting up temporary public health infrastructure for containment. In addition, LEAP provided an additional one-off round of cash transfers to beneficiaries in May 2020 (
The heterogeneous effects of COVID-19 on livelihoods indicate that social protection systems may need to adapt to address new vulnerabilities more systematically in the medium to long term. While some argue for the expansion of the existing programmes, including in Ghana and elsewhere (Gentilini et al., 2020), such as LEAP, we note that existing programmes were conceived to tackle specific vulnerabilities. As COVID-19 impacts seem to concern primarily the labour market, an expansion beyond the current focus on poverty, the elderly, disabled and households with vulnerable children may be required. This links to the issue of the ‘missing middle’: workers not poor enough to qualify for social assistance, but not yet secure enough to benefit from social insurance.
In the next section, we first outline the data used for the pre-COVID-19 vulnerability analysis, then our approach to constructing poverty transition matrices and identifying eligibility for LEAP, before discussing the results in section four.
III. Data and Methods
Data for Pre-COVID-19 Vulnerability Analysis
The data we used in the pre-COVID-19 vulnerability to poverty analysis was obtained from the Ghana socioeconomic panel survey (GSOEP) rounds one (2009–10) and two (2012–13). 3 The GSOEP 4 is a comprehensive multi-level nationally representative survey implemented by the University of Ghana’s Institute of Statistical Social and Economic Research (ISSER) in collaboration with the Economic Growth Centre at Yale University. 5 The main purpose of the survey is to ‘provide a new database for carrying out a wide range of studies on the medium- and long-term changes, or lack of changes, that take place during the process of development’ (Aryeetey et al., 2011, p. 1). Most of the existing data sets are short-term, cross-sectional and limited in scope. The GSOEP is, however, comprehensive and follows many individuals over time thereby filling a huge data gap. The baseline survey covered 5,009 households. In our analysis, we use 4,107 households who were successfully followed in the second round.
Due to the rareness of panel data in developing countries including Ghana, poverty and vulnerability to poverty in Ghana has traditionally been estimated using cross-sectional data, mainly the Ghana Living Standard Survey (GLSS). The GLSS though also nationally representative, is not panel data but rather repeated cross-sections with the first round (GLSS 1) carried out in (1987–88) and the latest round (GLSS 7) collected over the period (2016–17). Even though this dataset is more recent than the GSOEP, the GLSS allows for measuring variation across space but not time. We take advantage of the panel data, which although relatively old, allows the study of the same households over time providing a better assessment of household welfare. It allows for validating the results from cross-sectional studies and also, helps to show how both economy-wide and micro shocks affect household welfare.
Methodology for Pre-COVID-19 Vulnerability to Poverty Analysis
Our approach to examining pre-COVID-19 vulnerability to poverty in Ghana is similar to López-Calva and Ortiz-Juarez (2014) and Dang et al. (2014) in that we measure vulnerability as poverty episodes using poverty transition matrices. This helps us to not only track the movements in and out of poverty but also identify and categorize households into distinctive groups. For policymakers, it is useful to distinguish the chronic from the transient poor to design more targeted policies. However, because panel data is rare, existing studies on Ghana fail to examine the real movements into and out of poverty. Our analysis using real panel data facilitates a better understanding of the pre-COVID-19 vulnerability to poverty in Ghana.
We construct a poverty transition matrix from the panel data using (adjusted) national poverty lines 6 of GH¢ 1186.312 ($830) per (capita) adult equivalent consumption for time 1 and GH¢ 1492.415 ($754) for time 2). We thus classify households into four categories: chronic poor—households poor in both periods; entered poverty (transient poor)—non-poor households in the first period that entered poverty in the second period; exited poverty (strugglers)—previously poor households that moved out of poverty in time 2, and never poor (stable class)—non-poor households in both periods.
More formally, let Cht represent the per-adult-equivalent consumption expenditure for household h, at time t, Zt1 represent the poverty line in time 1 and Zt2 be the poverty line in time 2. The proportion of households whose consumption fell below the poverty line in the previous period but above in the current period—the degree of movement out of poverty—is represented by Equation (1).
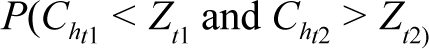
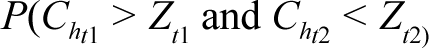
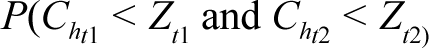
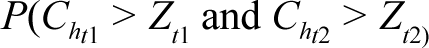
Equation (2) also represents the fraction of households that were not poor in time 1 but fell into poverty in time 2—the degree of movement into poverty. Whereas Equations (3) and (4) capture the immobile groups: the share of households that stayed poor and those that remained safe from poverty, respectively, in both periods. We construct a set of dummy variables for each category, with the values 1 if a household belongs to a group, for example, chronically poor, entered poverty, just exited poverty, or stayed safe, and 0 otherwise.
Our vulnerability estimate implies an aggregation of (1), (2) and (3) forming the total share of households that experienced at least one episode of poverty. To examine the determinants of vulnerability, we then apply logistic regressions.
Let the outcome variable Vulnerability, Vd, take one of two values:
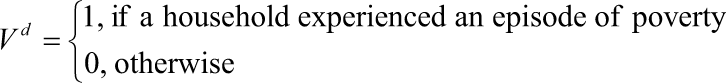
In the binary model, we estimate
where Xht denotes a vector of observable household characteristics including sociodemographic characteristics, location, and employment variables at time t and βt represents a vector of model parameters. In a similar approach, López-Calva and Ortiz-Juarez (2014) include in their outcome variable households that identify as chronic poor or entered poverty. However, there may be systematic vulnerability differences between these groups and, moreover, those who have recently exited poverty are likely to be pushed back into poverty by even small shocks. We therefore examine the vulnerability of these three groups - the chronically poor, the transient poor and the strugglers - separately.
Identifying Eligibility to LEAP
Unfortunately, the panel household survey used in the vulnerability to poverty analysis does not have information on the recipients of the LEAP programme. Therefore, to assess the impact of the programme, we follow the main methodologies used in the literature to estimate eligibility (Adu-Ababio et al., 2018; Harris et al., 2018).
To include the bottom 20%, we use a poverty line of GH¢ 553.443 ($99). 7 Apart from being in poverty, we also use the other categorical targeting criteria explained in section two. In terms of benefits, we also follow the GHAMOD 8 method and assign (based on the 2017–19 benefits estimated by GHAMOD) the minimum monthly benefits/cash amounts received as follows: a single beneficiary: GH¢ 64.00 ($12); two beneficiaries: GH¢ 76.00 ($15); three beneficiaries: GH¢ 88.00 ($17); four or more beneficiaries: GH¢ 106.00 ($20).
Our study is not without some limitations. One main limitation is that we have not considered the fiscal implications of the increase/expansion of social protection. This has been touched on in other papers (Dzigbede and Pathak, 2020) and can be better addressed with micro-simulations, which is beyond the scope of our study. With the effects of COVID-19 likely to persist, these research questions will need further exploration with new data. Also useful, but beyond the scope of our article, would be an investigation of the role of the elderly and current retirement schemes in large struggling and transient households.
IV. Results
Vulnerability to Poverty in Ghana (Pre-COVID-19)
The majority (62%) of households matched across the two rounds of the GSOEP survey are located in the rural areas, particularly in the rural savanna (24%) and the forest (29%) ecological zones (see Table A2). In terms of household composition, female heads generally form about a third in both periods, but the share is higher in urban areas (38% in 2010 and 41% in 2014) than in rural areas (28% in 2010 and 32% in 2014).
In examining poverty vulnerabilities, understanding the dynamics of household welfare over the two periods becomes imperative. On average, household welfare improved as per adult-equivalent consumption increased by over half (51.4%) from the base period. However, there exists a huge rural–urban welfare differential within and across time. In 2010, mean urban household consumption was almost twice that of rural households. This gap however diminished by about 12% in the second period. A gender-welfare disparity also exists, which tend to favour female heads.
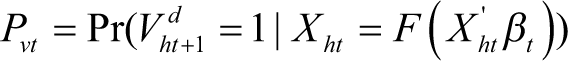
The results presented in Table 1 show household mobility, immobility and total vulnerability estimate using a poverty transition matrix. Mainly, four groups of households can be identified: (1) the chronic/permanently poor, (2) those falling into poverty (transient poverty), (3) strugglers (those who just exited poverty) and (4) the never poor (the stable class). Overall, more than half of households (51%) are vulnerable to poverty. The vulnerable households are composed of the first three groups which are most important for social policy because they have each experienced at least one episode of poverty. This implies that vulnerability to poverty can be defined as being vulnerable to falling into poverty or vulnerable to remaining and being in poverty.
Poverty Transition Matrix and Vulnerability to Poverty.
The first group of chronic poor consists of 17% of households as shown in Table 1. These are the poor households from the base period that remained poor in the second period. The second group of those falling back into poverty (11% of households) are the transient poor. They were previously non-poor but relapsed back into poverty due to various micro shocks such as a job loss, loss of a breadwinner, illness, disability, or macro shocks such as economic downturns, or other unforeseen events. These estimates are relatively high when compared to those of Awuni (2019, p. 63). However, this can be attributed to differences in data and the period analysed. Awuni developed a synthetic panel from repeated cross-sectional data in Ghana (GLSS6 and GLSS7) and used it to estimate poverty transitions. 9
Remarkably, over a fifth of households (who were previously poor) moved out of poverty. This translates into a reduction of the poverty rate at the base period by over half (see Table A3). This third group of struggling households is important for public policy because they neither belong to the stable middle class nor can they benefit from public interventions targeting the poor. They have recently exited poverty and they bear an ever-present risk of falling back into poverty. Following Birdsall et al. (2014), we consider the strugglers, along with those who entered poverty and the chronic poor, as being vulnerable.
As above, Birdsall et al. (2014) used the term ‘strugglers’ to describe households (in Latin America), who per international standards would not be classified as poor, yet lack the means necessary to secure themselves against poverty. They also refer to them as the ‘vulnerable’, based on the ever-present risk of these households falling into poverty in the event of shocks. Our analysis for Ghana, using a somewhat different identification method, also shows that struggler households are significantly distinct from the stable ones (see Table A4). They have a mean per adult-equivalent annual consumption of approximately GH¢ 2957 ($1493) which is less than twice the poverty line (GH¢ 2984 or $1507) and 26% less in comparison to their ‘stable’ counterparts (GH¢ 3996 or $2018).
On average, the struggler-households 10 are larger, have older heads, more children and aged people, and less educated heads compared to the stable middle class-households. 11 Also, the share of households in rural areas that are struggling (31%) is over twice as high (75%) as the share that is stable as shown in Table A4. Interestingly, the strugglers are not equally widespread in the rural areas (see Table A3). They are concentrated in rural-forested areas (37%) as compared to rural-savanna areas (32%), whereas the rural-savanna rather has a larger share of the chronically poor (40%) than in the rural-forested areas (16%). A possible explanation is that the vegetation and soil fertility are more favourable for farming in the forested than the savanna areas. This perhaps also explains why all the regions in the Northern part, largely rural and Savanna (i.e., Northern, Upper East and Upper West), have a generally higher incidence of both the chronically poor and strugglers than the Southern parts, largely urban, forested, and coastal.
Vulnerability to poverty in Ghana is high—higher than previously thought (see results in Tables A1 and A3). More than half of households (51%) are vulnerable to poverty. This estimate is about 5 and 8 percentage points less than Novignon et asl. (2012) and Zereyesus et al. (2017) 12 respectively but about 15 percentage points higher than the more recent study, Awuni (2019). All these previous studies applied the Feasible Generalized Leased Squares to different waves of the GLSS repeated cross-sectional datasets. The disparities could therefore be attributed to differences in data, methodology and time. That notwithstanding, pre-COVID-19 vulnerability to poverty is evidently more widespread among male-headed households (55%), households with non-educated heads (56%), rural households (71%) particularly those located in the rural-savanna (82%) and the northern half of the country, a finding that is consistent with Zereyesus et al. (2017) and Awuni (2019).
For effective policy targeting, it is important to examine the characteristics that distinguish vulnerable households from those that are considered free from poverty. Table A5 shows that the vulnerable households are statistically significantly different from the stable non-poor ones. The vulnerable households have a mean per capita adult-equivalent consumption of approximately GH¢ 1880 ($950) which is less than half of their stable counterparts (GHS 3996 or $2018) and only about 26% more than the poverty line. Like the struggling households, the vulnerable households 13 have older heads, larger household sizes, more children and aged people and are less educated compared to the stable households.
Determinants of Vulnerability to Poverty
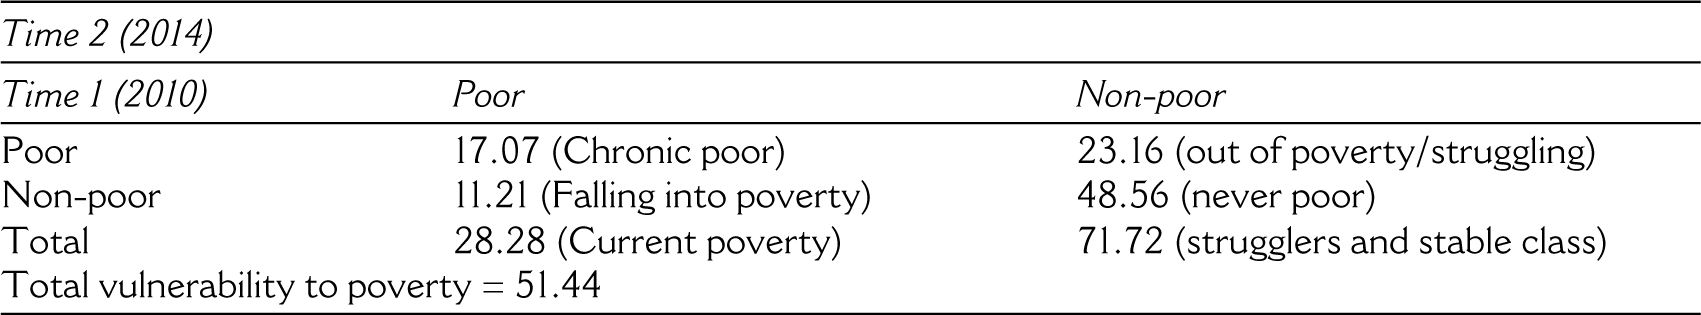
In the previous section, we showed that the various groups of households—the chronically poor, the transient poor and the strugglers—are distinct form one another. They have systematically different characteristics implying that they have systematically different social protection needs. In this section, we examine the statistical determinants of each of these. We first estimate a logistic regression where we use as the dependent variable a binary variable taking on the value 1 if the household experienced at least one episode of poverty during the period considered, and 0 otherwise. We then decompose vulnerability into its various components: chronic poor, transient poverty, strugglers and then similarly examine their determinants separately. The results presented in Table 2 are the logits whereas those in Table A6 are the marginal effects. For the ease of interpretation for interdisciplinary readers, we focus on the general direction (mathematical + or −) and significance of effects, rather than discussing the (odds ratio) coefficients.
Determinants of Vulnerability, Strugglers, Falling Into Poverty and Chronic Poverty.
Reference categories—Marital Status (Married); Education (No Formal Education); Location (Greater Accra Metropolitan Area (GAMA)).
We find that (see Model 1) age of the head, household size, sex of the head, education and location are statistically significant determinants of vulnerability in general (i.e., the probability that a household experiences an episode of poverty). More specifically, older household heads have higher odds of being more vulnerable to poverty, consistent with Novignon et al. (2012) and Zereyesus et al. (2017). Larger households also have higher odds of being vulnerable, in line with Torche and Lopez-Calva (2013). Also, expectedly, the higher the number of officially unemployed household members (i.e., number looking for work), the higher the probability that the household is vulnerable to poverty.
Meanwhile, engaging in non-farm enterprises, having at least one member in formal employment, or having a female as household head reduces the likelihood of vulnerability to poverty in general. Perhaps non-farm economic activities provide higher payoffs that bolster household consumption in comparison to farm activities, and formal employment guarantees a household of stable income. However, the inverse relationship between the female-headed households and vulnerability to poverty is staggering. In Ghana, both Novignon et al. (2012) and Zereyesus et al. (2017) who examined the determinants of vulnerability did not include the sex of the household head in their analysis. However, in Chile, Mexico and Peru, López-Calva and Ortiz-Juarez (2014) found that male-headed households were less likely to fall into poverty compared to female-headed households, contrary to our finding. Though established empirical literature may associate female-heads with higher vulnerability to poverty than their male counterparts, the dynamics of poverty and vulnerability to poverty presented in our analysis shows that this may not be a generalizable conclusion. Poverty and vulnerability to poverty are higher among males than females in our sample and, in terms of location, is higher for rural compared to urban areas (Table A6).
We now turn to specific vulnerable groups and how they differ from each other. The key differences between strugglers on the one hand, and transient and chronic poor on the other hand are in terms of the effects of rural–urban location, household size and having elderly in the household; and the effect of having one more person with non-farm employment in the household. Interestingly, these factors reduce the probability of being struggling or chronic poor but increase the probability of entering poverty. The latter results points towards the different impacts of concrete types of employment, as Addai et al. (2022) find regarding the role of petty trading and of engagement in arts and crafts on vulnerability to food poverty in Ghana. Household characteristics have mixed effects on all groups. In the following paragraphs, we discuss in more detail what this means for each of the three groups that are vulnerable to poverty.
For the group of struggling households (see Model 2), firstly, many determining factors overlap with the drivers of vulnerability: the number of children, household size, gender of the head, education (from basic up to secondary level), and locality (partly). This underlines the role of household structure, education, location, and employment for poverty dynamics. Secondly, household characteristics, such as the age of the head, number of household members in paid employment, and formality of employment, deviate. For example, the number of household members in paid employment significantly reduces the likelihood of struggling. On the one hand, these deviations reinforce the systematic differences among the different groups suggesting that additional targeted social policy support addressing retirement schemes and employment structures or saving schemes that allow for buffering consumption fluctuations due to variations in paid employment may be required. On the other hand, these results do not necessarily mean those characteristics play no role in the vulnerability of the strugglers at all. For instance, the significant negative effects of paid employment could imply that for struggling households, the remuneration from such employment outside the household leads to increased household resources and aids households in consumption expenditures.
Our findings further show that households falling into poverty (the transient poor) are also systematically different from households who are still vulnerable, but have recently moved out of poverty (strugglers). Whereas more members of struggling households are more actively looking for work, this effect is not statistically significant among the transient poor. Gender, education of the head, urban versus rural locality, employment status, and formal employment do not influence the probability of being transient poor in a statistically significant way. The main effects here are about location and non-farm enterprises. In relation to the former, being in rural areas has a much lower and even insignificant effect (see Table A7) on the probability of being a transient poor. In relation to the latter, having a non-farm enterprise is positively and statistically significantly associated with higher probability of falling into poverty. This underlines again that the transient poor are mainly urban workers that may have no protection against shocks. The number of children, household size, rural-forest locality, and household farm enterprises are significant determinants (see Model 3 in Tables 2 and A6) but the effects of these factors are opposite for those who are strugglers: For example, one more child raises the probability of entering poverty by 1.7% (positive direction) and decreases the probability of being a struggling household by 4.3% (negative direction).
For the chronic poor (see Model 4 in Tables 2 and A6), the effects of age and gender of the head, household size, education, locality, and non-farm economic activities also match the pattern of determinants of overall vulnerability. Unemployment, however, deviates. The higher the number of household members looking for a job (formally unemployed), the less likely the household is to be chronically poor. A potential explanation could be that, though household members may be formally temporarily unemployed, they may add to farm labour or engage in other household activities that serve to improve household consumption, hence reducing the likelihood that the household becomes poor. Additionally, engaging in multiple economic activities seems to be a driver of poverty for the chronically poor but not for strugglers and the transient poor. Perhaps for the chronic poor, engaging in multiple economic activities is a consequence of their extremely inadequate household consumption resources. However, it does not salvage their situation due to pre-existing disadvantaged characteristics such as low/no education, among others.
The key findings from these analyses on vulnerability have some implications for social protection policy already. First, there are three distinct groups that require social protection; one of them, the transient group is of particular policy relevance as it refers to the people falling into poverty (implying a lack of social protection coverage), with different characteristics from the strugglers and the chronic poor. Second, in terms of these distinct characteristics of the transient poor, they are geographically not so strongly concentrated in rural areas (as, e.g., the chronic poor) as in urban areas. Therefore, both findings indicate already that a comprehensive horizontal expansion of social protection is required (new group of strugglers, new location of transient poor). We are now interested in what happens at the occurrence of an aggregate shock, focusing especially on those people that enter poverty, turning from struggling or even stable middle class into transient poor as this group has been distinct from the other groups before the shock.
Vulnerability to Poverty, LEAP and COVID-19: Implications for Social Policy
The above analysis of the vulnerability to poverty relied upon the longitudinal panel data of the GSOEP for (2010–14). We have used the same data to estimate which households are eligible to receive LEAP (see the section ‘Identifying Eligibility to LEAP’ for the methods used), as the original data does not have information on actual LEAP beneficiaries. In this section, to begin with, we compare our findings on households that are vulnerable to poverty (previous section), focusing on the transient poor, with households that are eligible for LEAP in order to assess how far LEAP may be addressing vulnerability to poverty of the transient. Next, we compare LEAP eligibility with existing studies (reviewed in Section II) on the effects of COVID-19 in order to assess how far LEAP may have supported those most badly affected by COVID-19. These two steps will shed light on whether current social protection policies do address vulnerability to poverty; and whether crises such as COVID-19 require an adjustment of such policies.
Geographically speaking, whilst around 4% of the urban population is eligible for LEAP, the number increases to around 25% in rural areas. This is also the consequence of the fact that the programme was conceived for, and started in, rural areas and expanded into urban areas in 2014; nonetheless this expansion did not have a specific approach towards working in urban areas, resulting in under-coverage (Pop, 2015). 14 In particular, this under coverage in urban areas compared to rural ones stems from the use of social networks in rural communities for outreach initiatives, while underperformance of the PMT in urban communities and subsequent low eligibility was a result of using survey data to identify indicators for the proxy means (Pop, 2015). In addition, LEAP benefits do not reflect urban costs of living. 15
Returning to the characteristics of the estimated LEAP eligible, they are female in the majority; this is in part because of the targeting towards poor families with pregnant women and infants.
We now turn to the employment characteristics of those households who we estimated to be eligible for LEAP. LEAP does not have a targeting mechanism based on employment status and, regrettably, not much literature has addressed the employment profile of the eligibles to LEAP. 16 However, this is critical as the effects of COVID-19 were mostly through job losses due to lockdowns and reduced economic activity.
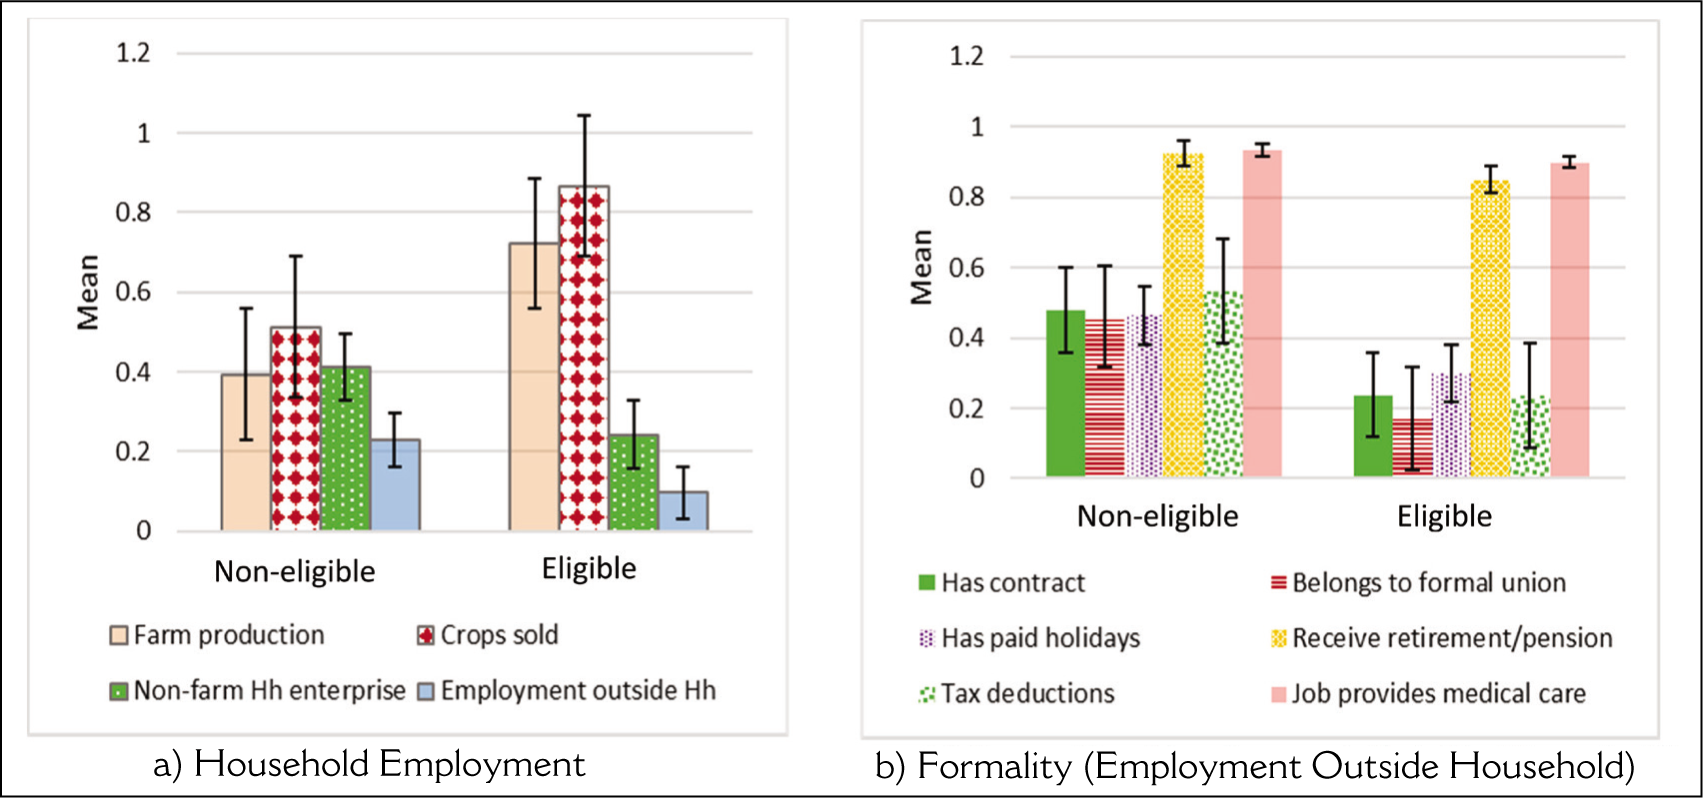
Also due to the concentration in rural areas, LEAP-eligibles are more engaged in farm enterprises and agricultural activities (family businesses). 17 In terms of formality of employment, LEAP eligibles are the ones with slightly fewer registered non-farm enterprises. But the informality divide appears more striking if we look at employment outside the household. Those who are not eligible for LEAP have much higher formality (see Figure 1b), especially in terms of having a contract and being formally affiliated to a union whereas those who are LEAP-eligible have low levels of formal employment. This finding is even more alarming recognizing that we considered values at the household level, meaning that if just one worker has formal employment, the entire household is recorded as having formal employment. Less than half of employment outside the household is informal if we consider the use of a formal contract; if we consider the variable related to paid sick leave or the one linked to the pensions scheme the indicator improves.
Comparing this with our previous estimates of vulnerability to poverty, in the case of informality, LEAP targets the households who are most vulnerable, that is, the ones with no formal employment. In fact, our estimates of vulnerability also found that non-farm enterprises and formal employment lower vulnerability. A positive message can also come from the fact that LEAP is mainly focused in rural areas, where we found vulnerability to be much higher compared to urban areas, particularly in the savannah. On the other hand, while we found that households with a female head are less vulnerable, we found that the majority of LEAP beneficiaries are females; but it is worth remembering that LEAP only targets pregnant women in the lowest income brackets. Overall, LEAP seems to reach the ones that are most vulnerable to chronic poverty. But the picture changes if we look at the transient poor, characterized by less rural concentration and more employment in non-rural household businesses/enterprises. In this case, LEAP did not reach the people that fell into poverty, which may also be a reason for their transition into poverty. This can be an important indication to argue for the expansion of LEAP especially in urban areas and households with (informal) own businesses.
We now use our estimation of LEAP beneficiaries and their characteristics to examine whether the programme’s current targeting reaches individuals suffering from negative effects arising from COVID-19 (as described in Section II). These individuals suffering from COVID-19 can strongly be linked to the transient poor, as both groups (the transient poor and the ones suffering from COVID-19) experience a decrease in incomes.
Geographically (see Figure 1A), we conclude that there seems to be no systematic link between the spatial distribution of COVID-19 effects 18 and the spatial distribution of LEAP beneficiaries. In fact, while the former has been felt country-wide, coverage of LEAP is more regionally focused, in line with pre- COVID-19 poverty and vulnerability dynamics. For instance, in the two most urbanized and populated regions (Greater Accra and the Ashanti) where partial lockdowns were implemented, the reach of LEAP is low. Yet, employment effects are highest in these areas.
A more interesting result is obtained when we compare urban and rural areas instead of administrative regions. Whilst LEAP beneficiaries are concentrated in rural areas, the effects of COVID-19 are estimated to be severe in urban areas (but also significant in rural and already poorer areas). From the urban-rural pattern, LEAP does not seem to currently capture the most COVID-19 affected.
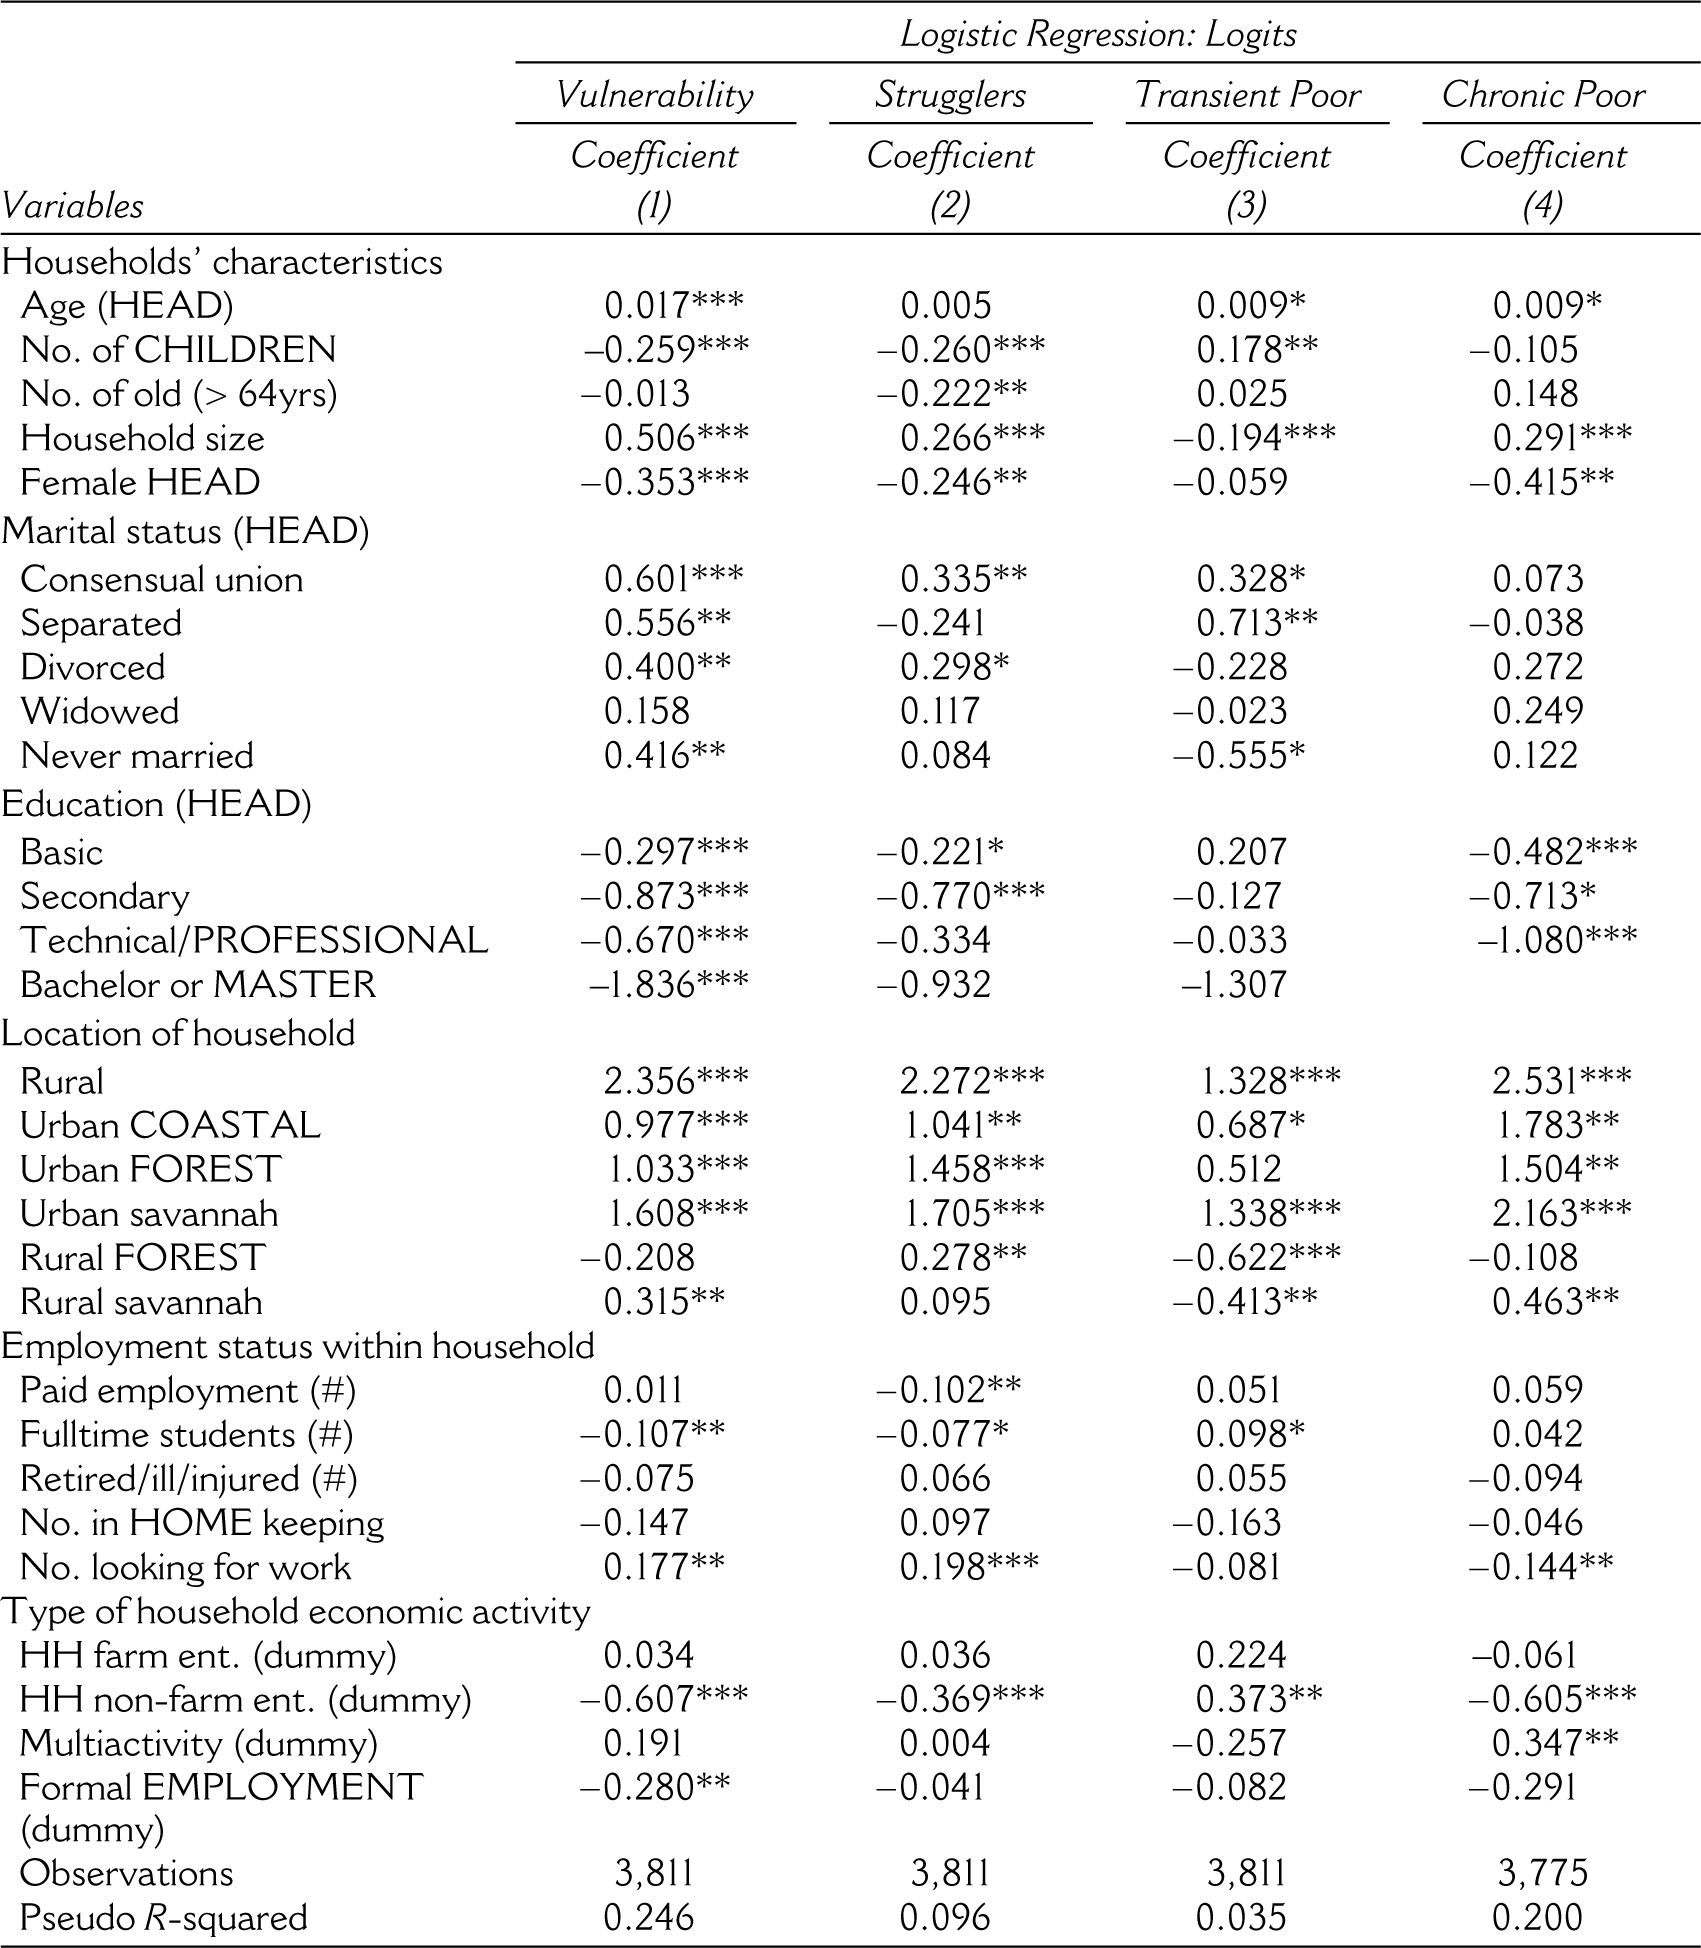
In terms of sectors, Figure 1a shows that LEAP-eligibles are more engaged in farm enterprises and agricultural activities (family businesses). 19 On the other hand, households excluded by LEAP are more involved with non-farm family businesses and with employment outside the households. The LEAP-eligible may thus suffer less from COVID-19 as agriculture is one activity that is not significantly impacted by the current pandemic.20–21
Characteristics of LEAP Eligibles.
In summary, the picture is mixed and complex (see Table 3 for a summary). In the section ‘Determinants of Vulnerability to Poverty’, we have identified the age of the head, household size, sex of the head, education and location as determinants of vulnerability. But we have also shown that the transient poor was a distinct group.
Summary of COVID-19 Versus Estimated LEAP.
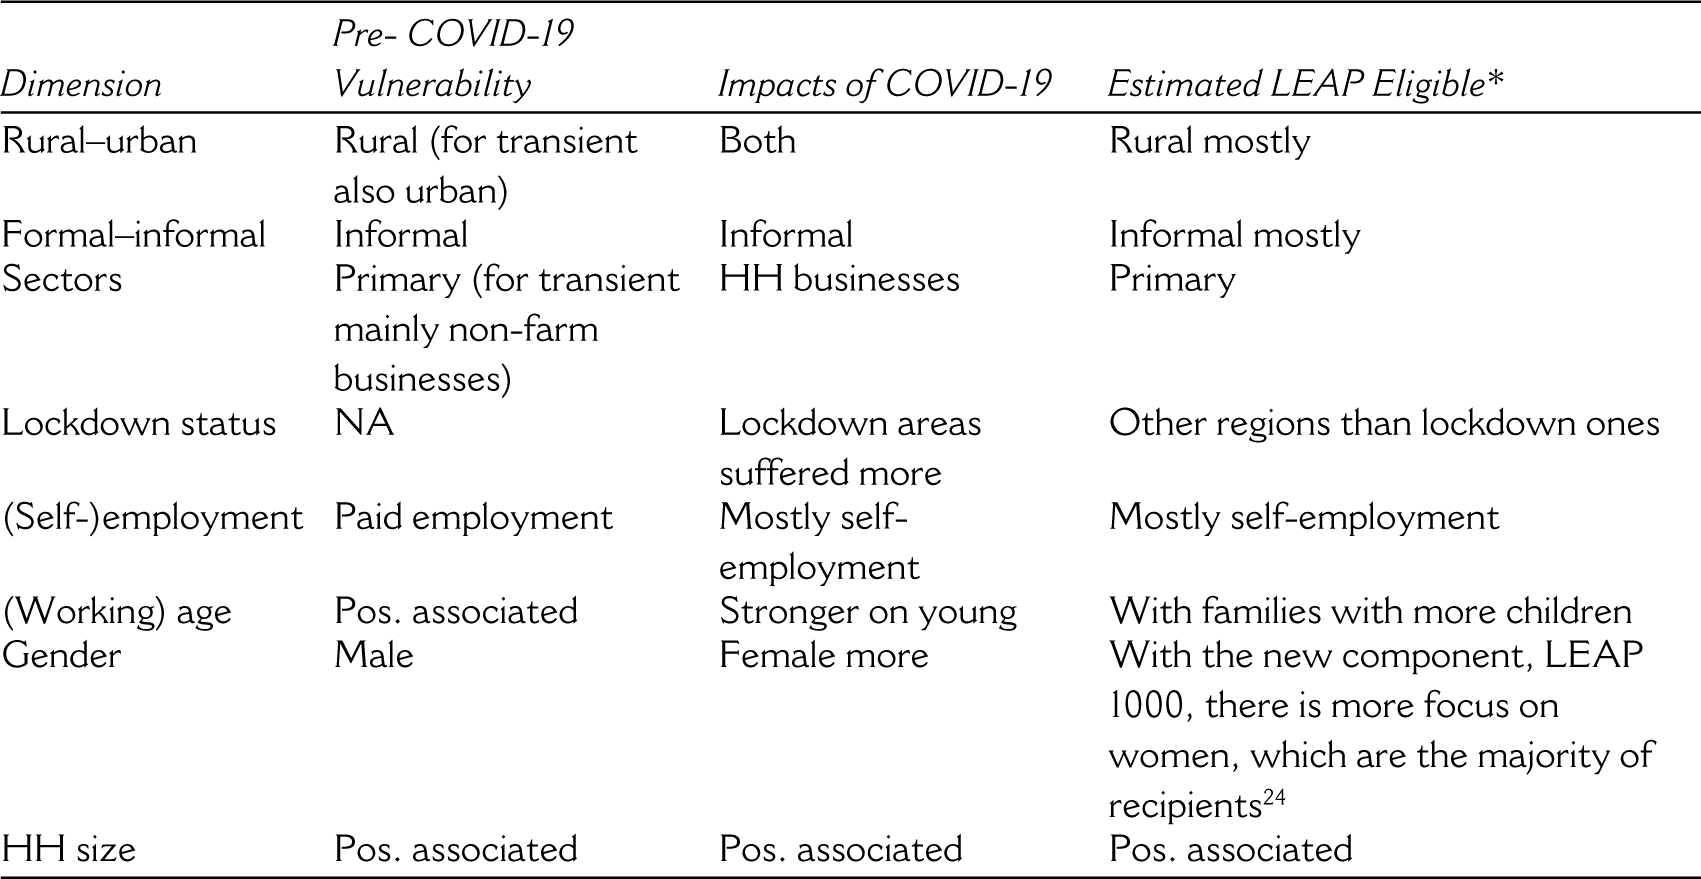
Given this distinction between groups, on the one hand, LEAP does a decent job in reaching the vulnerable overall and the chronic poor, even though some gaps remain (such as the disconnect between the gendered focus of LEAP and the statistical evidence of the greater vulnerability of male-headed households). On the other hand, our findings show that LEAP does not do a good job of reaching the transient poor. This group is not explicitly considered by current social protection policies including LEAP. This finding is all the more important since COVID-19 has worsened vulnerabilities and increased the likelihood of transient households falling into poverty. While losses from COVID-19 are spread across urban and rural areas, LEAP beneficiaries/eligibles are more in rural areas. Therefore, urban areas may be less protected. Similar reasoning can be applied to the sectors of employment: those who are LEAP eligible are more engaged in the sectors least vulnerable to COVID-19 losses, namely farm enterprises and agricultural activities (family businesses). 22
Therefore, it is important to complement LEAP, which was doubled in the COVID-19 period, with other safety nets. This is particularly true for the ‘missing middle’, meaning informal households that are not poor enough to be eligible for LEAP but are at the risk of poverty and with low job security. In this sense also LEAP could, alongside the registration in the national health insurance, be more strongly linked with jobs. More generally, the main adjustment needed for LEAP and social assistance as a whole is for the urban poor. This point is underlined by the fact that poverty in Ghana can no longer be viewed as a predominantly rural phenomenon. Data shows that between 2006 and 2013 the number of rural poor fell by over one million people, while the urban poor increased by over 360,000. And while LEAP also started to incorporate urban areas in 2014, it does not have a defined approach towards working in urban areas and in providing benefits for the urban poor, leading to under-coverage of the urban poor and inadequate programme implementation (Pop, 2015). For instance, LEAP and NHIS use the same targeting approach in both rural and urban areas.
Given this background, there is also the need for vertical expansion, meaning that the relief provided by LEAP needs to be deepened especially for urban areas. Particularly, the amount of money offered to beneficiaries need to be adjusted upwards. This is necessary because the current transfer amounts instituted since 2015 have significantly declined in purchasing power due to inflation. 23 For example, currently, a one-eligible-member household receives GHS 64 ($18 in 2015, $12 in 2019, but less than $5 in 2022). With year-on-year inflation in Ghana also at 37% as of September 2022, the LEAP payments are woefully inadequate in providing the needed relief to beneficiary households.
One important step in the right direction is the development of the Ghana National Household Registry, under the Ministry of Gender, Children and Social Protection, with the mandate to create a single registry to facilitate the administration of social programmes such as LEAP.
V. Conclusions and Policy Implications
The article explored and connected three main issues to infer critical policy implications.
First, we estimated pre-COVID-19 vulnerability to poverty in Ghana. Our findings reveal that vulnerability to poverty is higher and affects more diverse groups in Ghana than previously assumed. There is a substantial group of struggling households that may still go through transient phases of poverty (23% of the population). Also, a substantial group of households (11%) in both rural and urban areas had already begun to fall back into poverty before the COVID-19 pandemic. Meanwhile, both the struggling, and especially the transient poor households need to be better understood by social policy. We confirm previous studies in finding that the age and education of the household head drive vulnerability. However, our study differs from previous studies in its findings around the relationship to vulnerability to poverty of labour market variables, such as the sector of employment and the role of informality, as well as around gender and location. In particular, our study adds new insight into the ambivalent influence of gender on household vulnerability as found in different countries with its finding that male-headed households in Ghana are relatively more vulnerable to poverty than female-headed ones. We also highlight that the characteristics of the transient group are different in many respects from other vulnerable groups, especially in relation to the urban-rural divide and the sectors in which they are employed. We find that transient and struggling households with their distinct characteristics were, for the most part, not served by current social protection policies, including LEAP, because they target the chronic poor.
Second, we explored the implications of COVID-19 in terms of changes to vulnerability to poverty. The results show that COVID-19 has exacerbated existing vulnerabilities, and also created new ones, especially through the labour market. We find that urban areas with lower pre-COVID-19 poverty and vulnerability rates are affected more heavily by the economic downturn. Women, who the pre-COVID-19 vulnerability analysis suggested were facing lower vulnerability rates are heavily impacted by the COVID-19 pandemic thereby significantly increasing their vulnerabilities. This may be due to the overrepresentation of women in informal sector and underrepresentation in formal wage employment as well as their normative responsibilities in terms of family care. Overall informal workers and the self-employed are also more affected, due to labour income losses, hence, accentuating pre-existing inequalities. Workers who were ex-ante in less stable forms of employment are hit hardest by the crisis. Current social protection measures are very limited in coverage of those groups that we found to be most affected by COVID-19 and this makes the gaps that we have identified in social protection even more relevant.
Third, considering our findings altogether, there is the need for horizontal expansion, meaning that coverage of social protection programmes needs to be widened beyond the extremely poor to include both previous and new vulnerable groups, especially the urban ‘missing middle’. This particularly applies to Ghana’s main social assistance programme, LEAP, as it has been slow to reaching strugglers and the transient poor who are most vulnerable to slipping back into poverty. We also show that there is the need for vertical expansion, meaning that the size of relief provided by LEAP to each household needs to be deepened, particularly for urban households facing higher living costs.
The results from our analysis have implications beyond Ghana, especially in relation to the need for social protection to capture the urban ‘missing middle’. Poverty is becoming more urban and strictly linked to the urbanization process and, consequently, social protection policy needs to be reshaped to consider informal sector workers, small scale businesses, and vulnerable or shock-affected households. Protection is needed for people that are not currently poor but can potentially fall back into poverty more permanently due to aggregate shocks like COVID-19. Characterising the heterogeneous groups of strugglers and the transient poor who remain vulnerable to poverty in other developing countries, particularly in Sub-Saharan Africa, is crucial for reshaping and effectively targeting social protection policies post-COVID-19.
In terms of the design and effectiveness of social protection, several steps need to be taken. First of all, programmes that started in rural areas need to be better adapted to urban contexts in terms of both reach and transfer size. This was done effectively in Mexico’s PROGRESA programme (Behrman 2012; Nino-Zarazua, 2011). Moreover, social assistance programmes that are universal in terms of national coverage (such as a universal old-age pension) need to be more accessible to urban residents, including, for example, finding ways to reach highly mobile urban migrants. This is urgent given that many countries are experiencing the rapid urbanization of poverty. Second, there needs to be better link between social protection, social assistance and labour market policies. Whilst the longer term aim may be to push for formalization (and a move to social insurance), in the medium term there is a very large role for social assistance for those at the bottom of informal labour markets. This can be done through linking social assistance to labour markets; positive examples can be found in Latin America (see Alzate 2019; Wilson 2018). COVID-19 and its ongoing affects have dramatically revealed the need to review our entire social protection architecture in view of existing vulnerabilities and emerging threats. In particular, it has made clear that formal insurance programmes urgently need to be expanded to cover informal sector workers
In terms of COVID-19 and future pandemic preparedness, future containment policies will need to be coupled with protective measures that address the needs of those at risk of being left behind in the crisis, especially the transient poor. In order to meet this challenge in Ghana, and in many other countries, an adjustment is required not only of the current (LEAP) programme but also the entire social protection architecture. The COVID-19 pandemic not only exposed tremendous weaknesses of existing social protection policies, but also showed that the income losses suffered by urban households in an aggregate shock can push previously non-poor households into poverty. This experience underscores the significance of universal reliefs such as water and electricity bills, temporary tax reliefs and the provision of one-off consumption and income buffers or preferential access to loans and credits in times of aggregate shocks. Apart from these, research elsewhere has shown how effective responses to an emergency like COVID-19 can go beyond the formal social protection system when states are willing and able to coordinate with CSOs and the private sector to offer highly localised solutions that are particularly well targeted to those who are most in need (Duvendack and Sonne, 2021).
Finally, our results have implications for how we think about and analyse vulnerability to poverty in a developing country context. The patterns of vulnerability and what drives them are changing and becoming more complex and more dynamic. The share of struggling groups and the urban poor is large in countries beyond Ghana—and in many cases has been growing for some time. The strugglers (missing middle) have not securely escaped poverty and remain vulnerable, especially in the face of external shocks, so they are not success stories yet. We need adequate vulnerability measurements to address them and their vulnerability systematically in social protection systems. The same applies to the urban, transient poor. In the event of a shock, both groups face an increasing risk of falling (deeper) into poverty due to their instability. Updating vulnerability concepts and measurements needs to feed into adapting social protection policy mixes and their targeting accordingly.
Footnotes
Declaration of Conflicting Interests
The authors declared no potential conflicts of interest with respect to the research, authorship and/or publication of this article.
Funding
The authors received no financial support for the research, authorship and/or publication of this article.