
Abstract
Objective:
To quantitatively measure and report bone density of maxilla in the interradicular (alveolar and basal bone) and infrazygomatic crest (IZC) region in various growth patterns among Dravidian individuals.
Design:
This was a retrospective spiral computed tomography (CT) study.
Setting:
The study was conducted at the Department of Orthodontics, Saveetha Dental College and Hospital, Tamil Nadu, India.
Methods:
Sixty CT scans (24 men, 36 women; mean age = 25.3 years and 23.8 years, respectively) divided equally into three groups based on vertical facial proportions were included. Bone density measurements in Hounsfield units (HU) were performed using Philips and RadiAnt DICOM viewers. Buccal cortical, palatal cortical and cancellous bone regions were analysed in a Philips DICOM viewer and IZC region was analysed in a RadiAnt DICOM viewer. Statistical analysis with one-way ANOVA and post-hoc Tukey HSD test was done.
Results:
The hypodivergent group had a significantly higher bone density at the buccal cortex in posterior region (P < 0.05) when compared to the normodivergent and hyperdivergent groups. Buccal basal bone was denser than buccal alveolar bone (P < 0.05) in all three groups. In the IZC region, hypodivergent groups had significantly higher density values when compared to the normodivergent and hyperdivergent groups (P < 0.05).
Conclusion:
The present study concluded that cancellous bone density in the interradicular regions was greatest in the anterior sites and was not influenced by growth pattern. Hypodivergent groups tend to have higher density in the posterior regions (buccal and palatal cortical bone) and at the IZC region compared to normodivergent and hyperdivergent groups.
Keywords
Introduction
Orthodontic mini-implants (OMIs) have recently gained considerable popularity owing to their ability to provide absolute three-dimensional anchorage and are relatively easy to place and maintain (Holm et al., 2012). Studies investigating the stability of OMIs give varying conclusions because of their higher failure rate compared to the conventional osseointegrated implants used as prostheses (Papageorgiou et al., 2012). Multiple factors related to OMI failure such as placement site, operator experience, oral hygiene, bone thickness and bone density have been studied in the literature (Park et al., 2006). Chang and Tseng (2014) reported a close association between bone density and anchorage potential of the site. Moreover, the primary stability of OMIs in sites with deficient cortical bone thickness appears to be influenced by the cortical anchorage provided by bone density (Kravitz and Kusnoto, 2007). When bone quality as a factor is assessed, tissue reaction in the periodontium and existing bone thickness are the primary considerations rather than bone density (Asiry, 2018). Technical limitations in the accurate determination of bone density also affect its reliability as a clinically useful diagnostic aid. Different regions within the bone show varying compositions and density levels. Knowledge about bone density in various regions may help us to identify and assess different clinical scenarios offering alternative treatment solutions (Pan et al., 2019).
The growth pattern of the individual plays an important role in treatment planning, rate of space closure, anchorage demand and ensuring treatment stability (Assi et al., 2020). Individuals can be classified into hypodivergent, hyperdivergent and normodivergent groups based on the vertical growth of the maxilla and mandible (Alabdullah et al., 2015; Tung and Lagravère, 2019). Moon et al. (2010) analysed outcomes associated with growth patterns and bite force of individuals. Patients with hypodivergent growth patterns and convergent jaw bases have deeper bites and higher occlusal forces than other growth patterns. Similarly, patients with hyperdivergent growth patterns and divergent jaw bases present with apertognathia and lower bite forces. Braun (2002) proposed that malocclusions presenting in the vertical dimension are most susceptible to relapse after correction.
In the present study, quantitative assessment of bone density of maxilla in various growth patterns was performed considering its potential role in improving stability of OMIs. The stability and pull-out strength of OMIs depend upon the thickness and density of the existing cortical bone (Ardani et al., 2019; Elibol et al., 2020). Cancellous bone was also assessed in the present study adding to the literature available on the role of cancellous bone in the primary stability of OMIs (Ohiomoba et al., 2017; Sugiura et al., 2018). The point of difference in this study was using computed tomography (CT) to evaluate bone density at different interradicular regions as well as in the infrazygomatic crest (IZC) region considering the higher diagnostic capability of CT images (Ohiomoba et al., 2017). In addition, there are no studies evaluating levels of bone density in different growth patterns in the Dravidian population. Racial differences, lifestyle changes and dietary habits could influence the bone density pattern in different ethnicities (Park et al., 2008). Hence, the aim of the present study was to measure and report the cortical and cancellous bone density of interradicular sites at the alveolar and basal bone levels and the IZC region in individuals with different growth patterns using CT. Bone density levels were measured in Hounsfield units (HU).
Materials and methods
CT scans of patients referred to the Department of Radiology in Saveetha Medical College were included based on the selection criteria. The CT scans obtained had been taken for medical diagnostic purposes before the study. The criteria for study sample selection were: South Indian ethnic population in the age range of 18–30 years and presence of all permanent teeth in both quadrants of the maxilla (excluding third molars). Records of patients with pathologic bone loss, history of any lesions or bone disorders affecting bone density, medications affecting bone density or underlying cysts were identified and excluded from the study.
CT scans of individuals satisfying the selection criteria were classified into three groups based on vertical facial proportions as assessed by measurement of SN/Go-Me angle of lateral cephalometric view derived from the CT slice. The total sample consisted of 60 CT scans divided equally into three groups: (1) hypodivergent if the angle was < 27°; (2) normodivergent if the angle was in the range of 27°–37°; and (3) hyperdivergent if the angle was > 37° (Ricketts, 1960).
The power calculation was done from a similar study conducted by Park et al. (2008). The sample size required to achieve a power of 85% was 15 in each group with an alpha error of 0.05 and effect size of 0.97.
Out of the total 60 CT scans, 24 were of men (mean age = 25.3 years) and 36 were of women (mean age = 23.8 years). Ethical clearance for the study protocol was obtained from the institutional review board (SRB/SDC/ORTHO-1803/18/04).
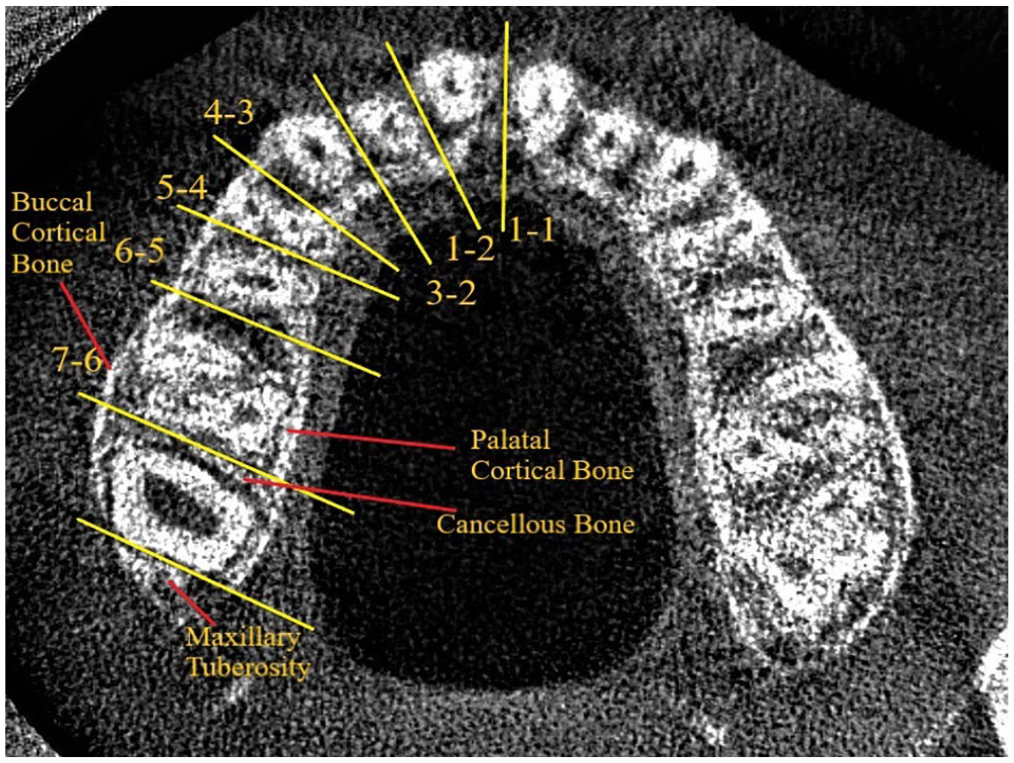
Both cortical and cancellous bone densities at the interradicular regions were evaluated: between two central incisors (1-1); between central and lateral incisor (1-2); between lateral incisor and canine (2-3); between canine and first premolar (3-4); between first and second premolars (4-5); between second premolar and first molar (5-6); between first and second molars (6-7); and in the tuberosity region (MT) (Figure 1). When assessing cortical bone density, an ellipse with a radius of 1 mm uncovering its centre was taken as a standard for all scans. For cancellous bone density, an ellipse placed midway between the buccal and palatal cortices was taken at the trabeculae (Figure 2).
Computed tomography slice taken at the alveolar bone level to identify bone density in the marked regions. Basal bone slice is taken with five slices before this (slice thickness = 0.9 mm).
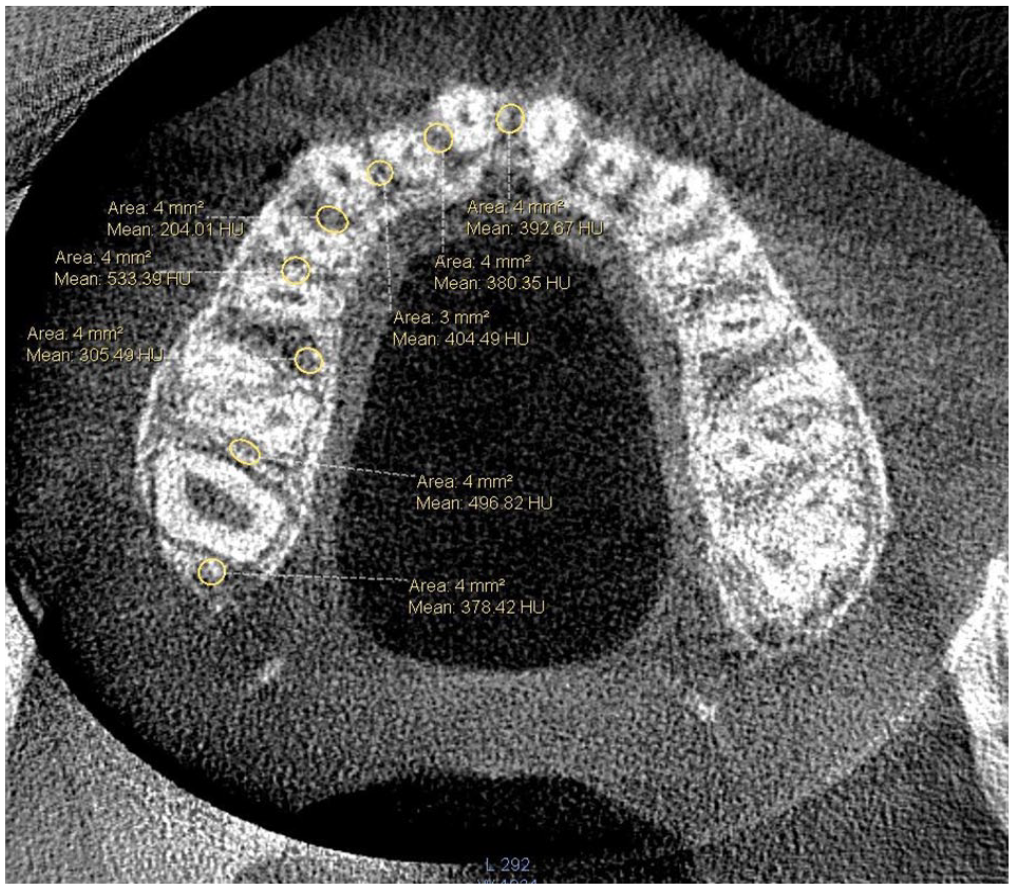
Bone density levels at different interradicular sites with measurements derived from inbuilt software.
For measuring bone density at the IZC region, coronal sections of the scans were used. After locating the most appropriate slice, bone density was assessed in the cortical and cancellous regions adjacent to the region of maxillary first molars (Figure 3). An ellipse (radius = 1 mm) covering the centre of the cortical plate and centre of the cancellous trabeculae was taken for assessing bone density. Measurement of bone density at all sites except IZC was done in HUs using bone mineral density software incorporated in a Philips DICOM Viewer R3.0-SP14 (Eindhoven, Netherlands) (Figure 4). The CT slices were oriented with reference planes perpendicular to the maxillary and mandibular incisors in the sagittal section (Figure 5). For evaluating bone density at the IZC, a RadiAnt DICOM Viewer (Poznan, Poland) was used. Multiplanar reconstruction is possible with this DICOM Viewer and coronal sections were used for determining the most suitable slice after alignment with reference planes passing through the incisive foramen and posterior nasal spine (Figure 6). All the CT scans were taken with standardised technical protocols: spiral CT scanner; 120 kV; 100 mAs; field of view (FOV) = 220 mm; slice thickness = 0.9 mm; pitch = 0.40; ultra-high resolution; and 0° gantry angulation. Scanner calibration was done at periodic intervals to obtain standardised values. Axial tomograms were used to determine the level of the alveolar and basal bones in the Philips Viewer and coronal tomograms were used to determine the level of the IZC in the RadiAnt Viewer.
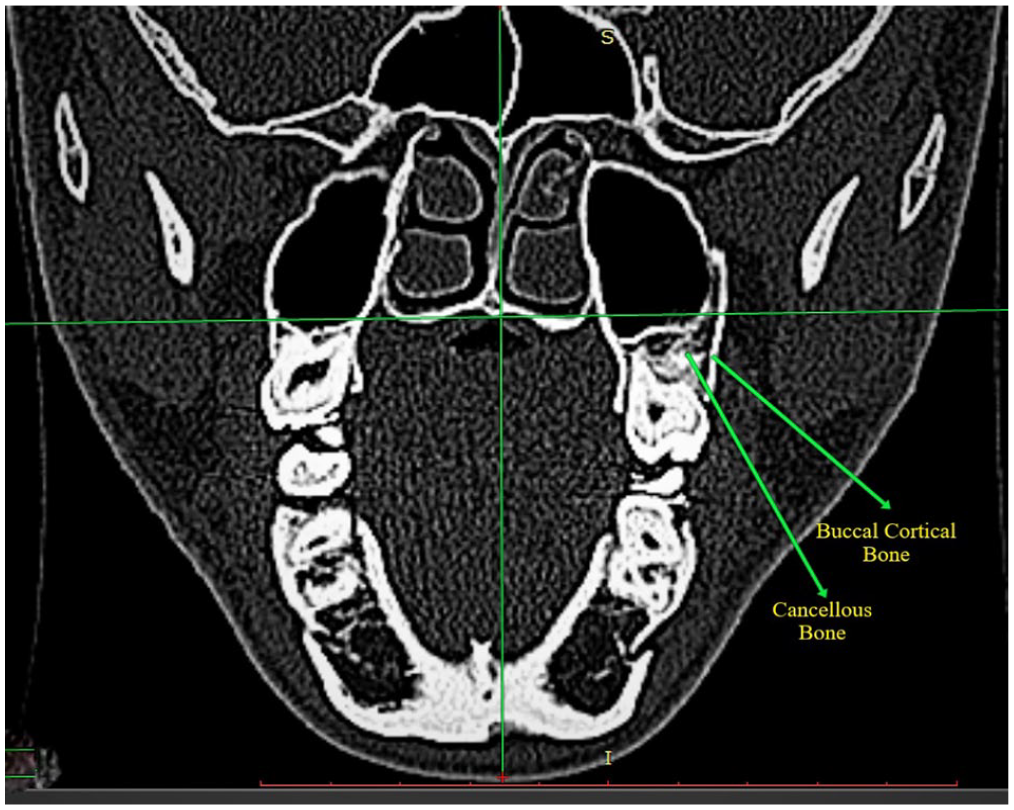
Cortical and cancellous bone located at the infrazygomatic crest region using incisive foramen and posterior nasal spine as reference planes.
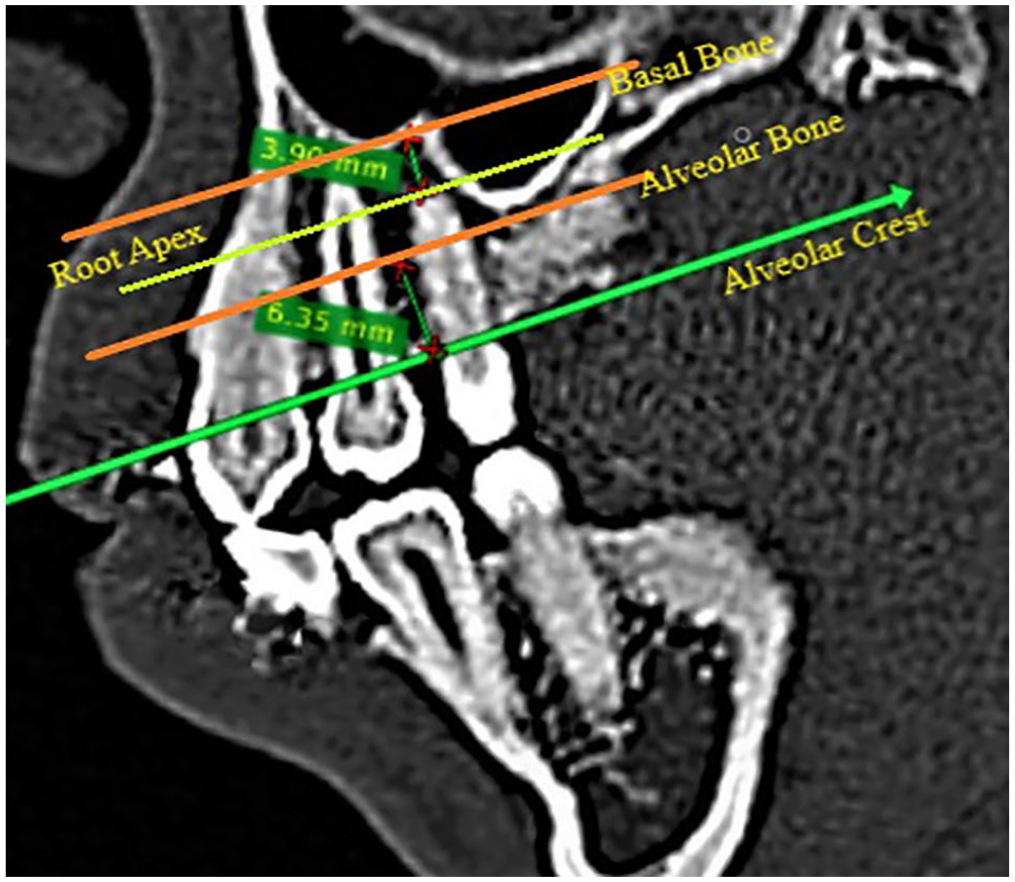
Measurement areas for the assessment of bone density (alveolar bone and basal bone levels). The alveolar bone level is measured 5–7 mm from the alveolar crest and the basal bone level is taken 2–5 mm from the root apex.
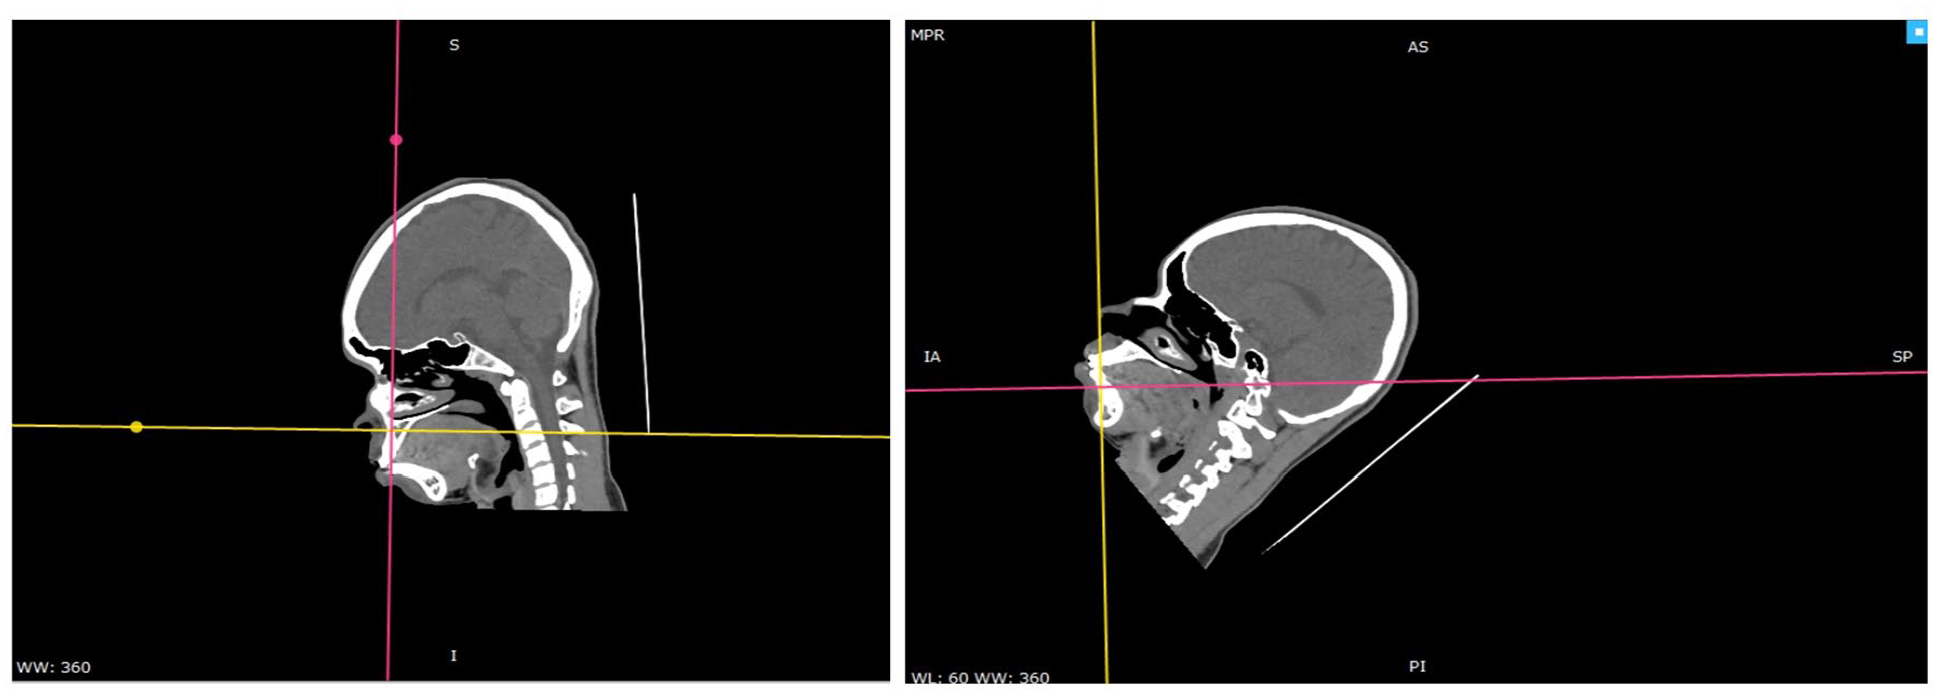
Orientation taken with reference plane perpendicular to maxillary and mandibular incisor for slice generation.
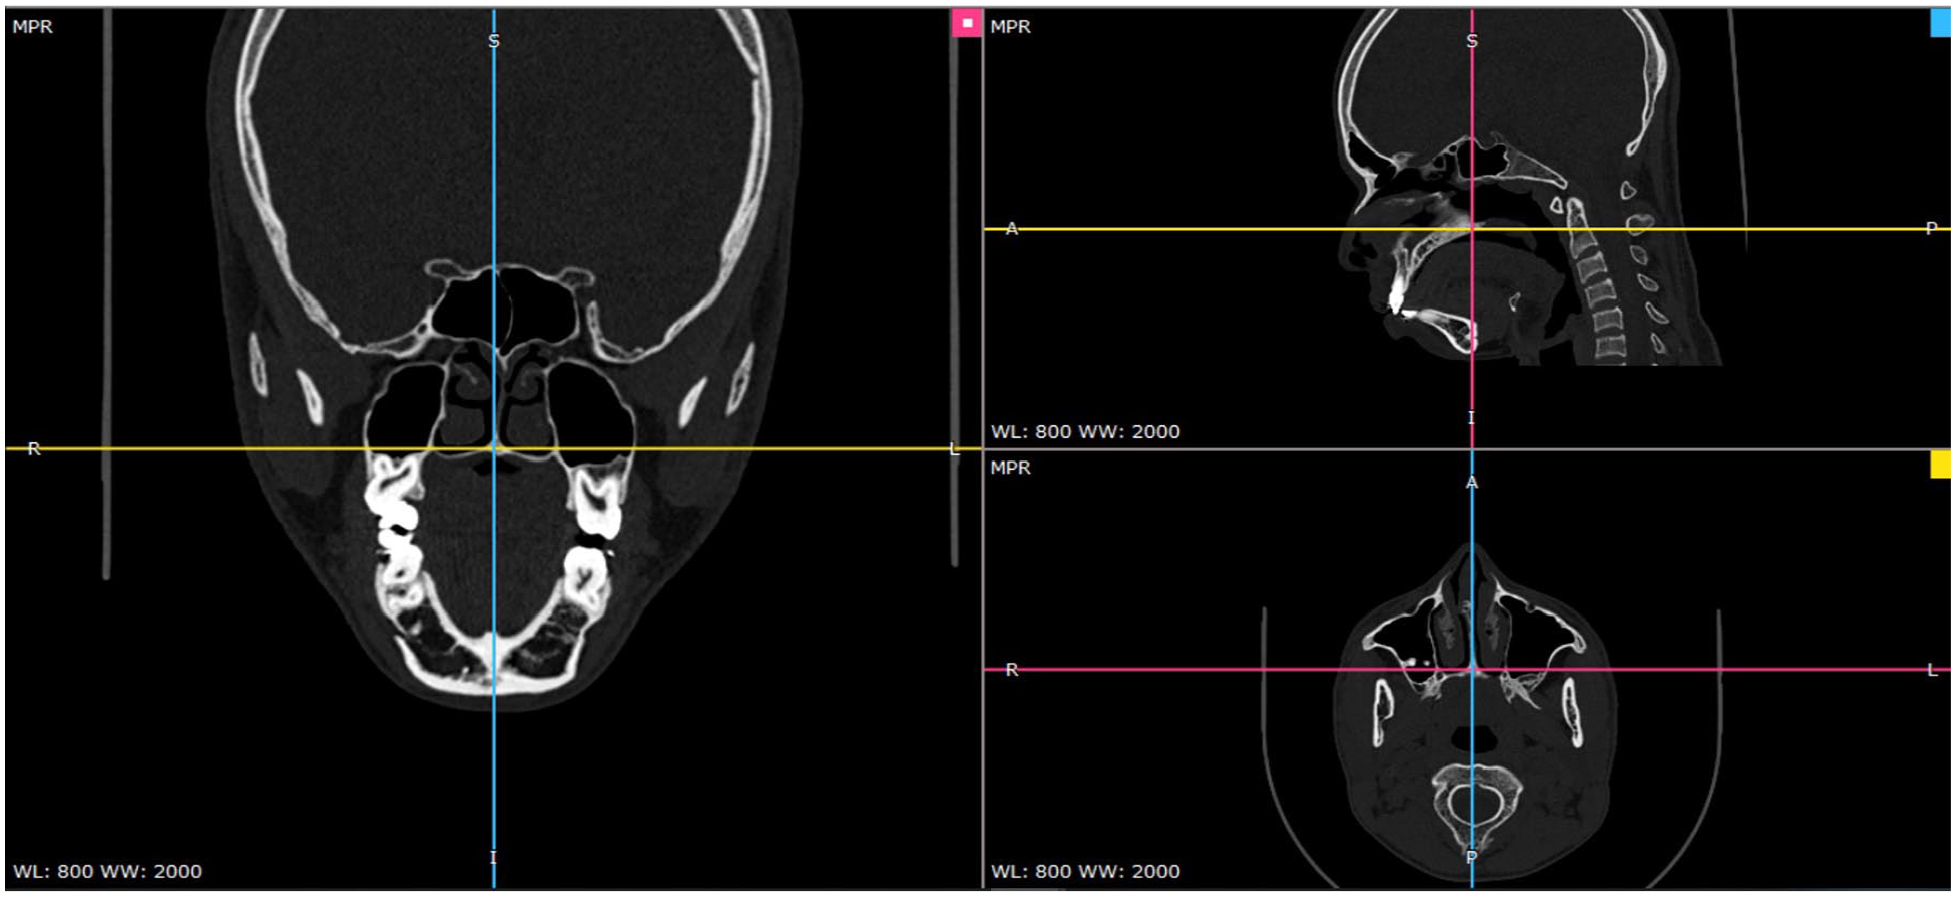
Horizontal and vertical reference lines taken at incisive foramen and posterior nasal spine as guide for orientation of computed tomography slice to locate infrazygomatic crest region.
To measure bone density in various interradicular regions, CT sections (axial images) were taken at two levels: alveolar bone proper and basal bone. Localising alveolar bone levels was done by taking a slice of 5–7 mm from the upper ridge of the alveolar process in the maxillary first molar region. Slices with highest resolution were chosen for evaluation. To locate basal bone levels, another section 2–5 mm apical to the root apex of maxillary first molar was selected. At the alveolar level, the region of the buccal cortices, palatal cortices, and central cancellous bone was evaluated. At the basal level, the buccal cortex and cancellous bone were evaluated.
The scans were divided into three groups based on the vertical facial proportions and the investigator (PR) who performed the measurements was blinded. The investigator (PR) assessed the bone density at each region bilaterally and their mean was taken to signify the bone density at a particular area. Statistical analysis of the data obtained was then carried out using IBM SPSS Software Version 20.0. One-way ANOVA test of variance followed by Tukey HSD test was carried out to determine variations in bone density levels between different growth patterns in both interradicular and infrazygomatic regions.
Results
Bland–Altman plots were done to determine intra-operator and inter-operator reliability in measurements. For intra-operator assessment, the values for alveolar cortex density assessment were carried out by the same principal investigator after two weeks, and for inter-operator assessment, two authors of the study (PR and RKJ) assessed the density values independently from the scans obtained. The intra-operator assessment indicates good reproducibility with fair levels of agreement with the results obtained with the mean difference (9.344). The mean coefficient for the test was –0.109, indicating no proportional bias (Figure 7). The inter-operator assessment indicates moderate to good reproducibility with acceptable levels of agreement with the mean difference (–2.11). The mean coefficient for the test was –0.177, indicating no proportional bias (Figure 8).
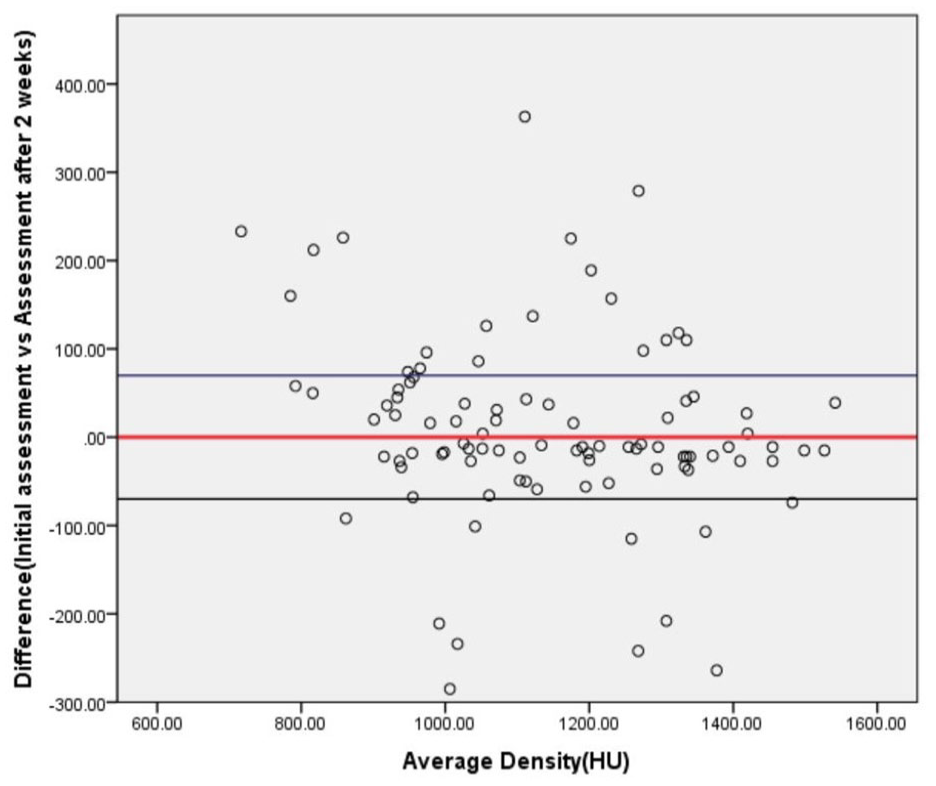
Bland–Altman plot of differences in alveolar cortex bone density (HU) measurements between the same operator at initial assessment and after two weeks (intra-operator assessment). Limits of agreement (reference range for difference = –285 to 363 HU), mean difference = 9.344, 95% CI = –12.187 to 30.874, linear regression analysis, R square = 0.038, mean coefficient = –0.109.
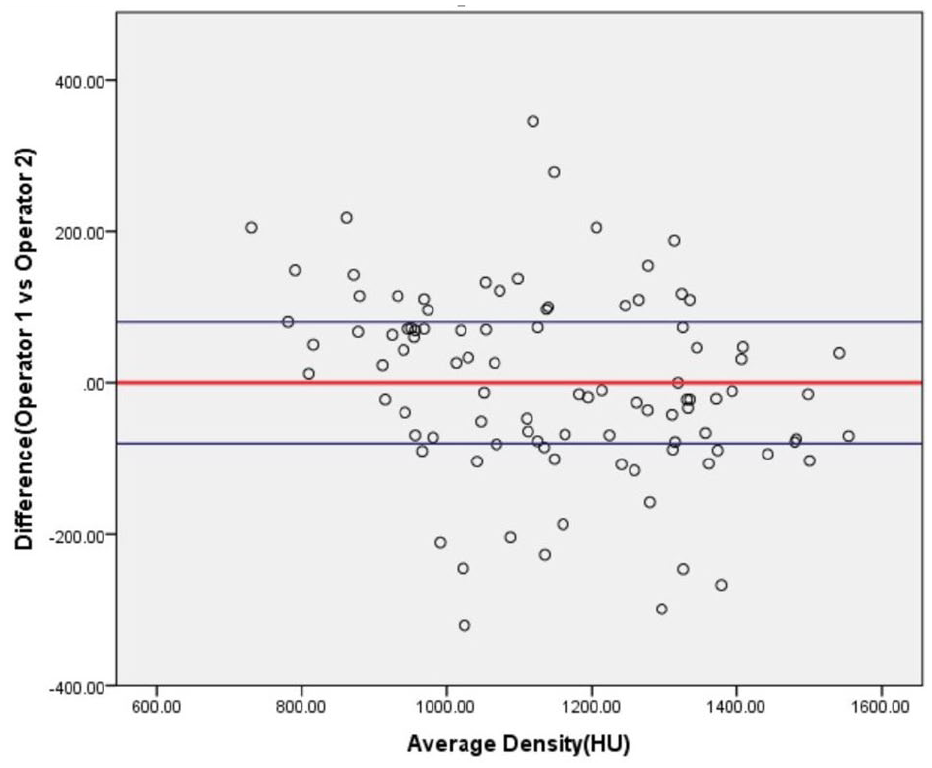
Bland–Altman plot of differences in alveolar cortex bone density (HU) measurements between two operators (inter-operator assessment). Limits of agreement (reference range for difference = –321 to 346 HU), mean difference = –2.11 (95% CI = –26.927 to 22.945), linear regression analysis, R square = 0.079, mean coefficient = –0.177.
ANOVA test of variance followed by Tukey HSD test was done to determine the presence of significant difference in bone densities between groups at different sites.
Alveolar buccal cortical bone
In Group 1, maximum cortical density was seen in the 6-7 regions (1453 HU). In Groups 2 and 3, maximum cortical bone density was seen in the 5-6 regions (1377 and 1329 HU). Maximum cancellous bone density was seen in the 1-1 region in all three groups. The maxillary tuberosity region showed the least cortical and cancellous bone density in all three growth patterns (Tables 1–3).
A statistically significant difference in cortical bone density values was noted in the 4-5 region between Groups 1 and 3, and Group 1 had higher density values (P = 0.006).
A statistically significant difference in cortical bone density values was noted in the 5-6 region between Groups 1 and 3 (P = 0.029) with a higher density in Group 1.
A statistically significant difference in cortical bone density values was noted in the 6-7 region between Groups 1 and 3 (P = 0.000) and Groups 1 and 2 (P = 0.011), with more density in Group 1 and when comparing Groups 2 and 3 (P = 0.000); Group 2 reported a higher density.
Alveolar palatal cortical bone
Maximum cortical density was seen in the 6-7 region in all the three groups (Hypodivergent- 1467 HU, Normodivergent- 1520 HU and Hyperdivergent-1460 HU). The maxillary tuberosity region showed least cortical and cancellous bone density in all three growth patterns [Tables 1, 2 and 3].
Mean bone density values (in HU, right and left) of the interradicular regions (alveolar and basal bone levels) of the maxilla in hypodivergent groups.
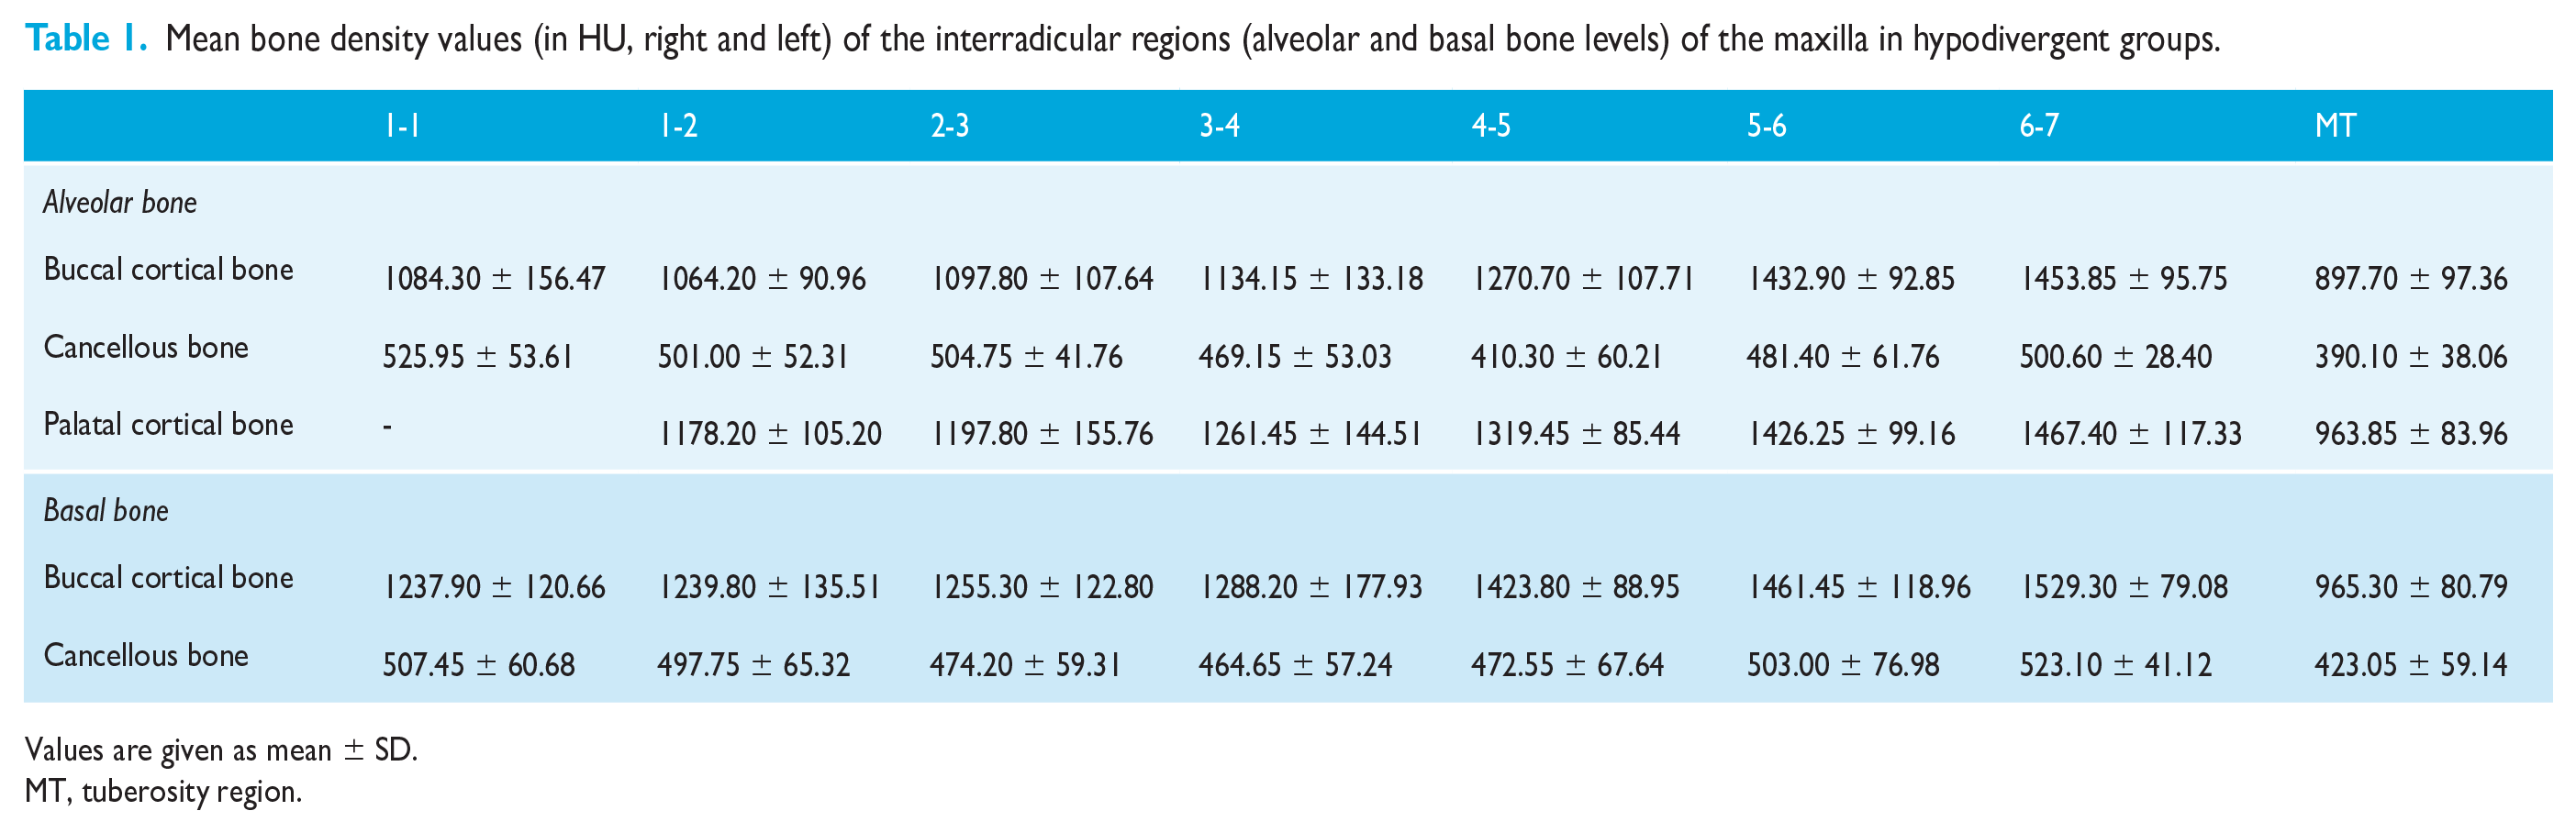
Values are given as mean ± SD.
MT, tuberosity region.
Mean bone density values (in HU, right and left) of the inter-radicular regions (alveolar and basal bone levels) of the maxilla in normodivergent groups.
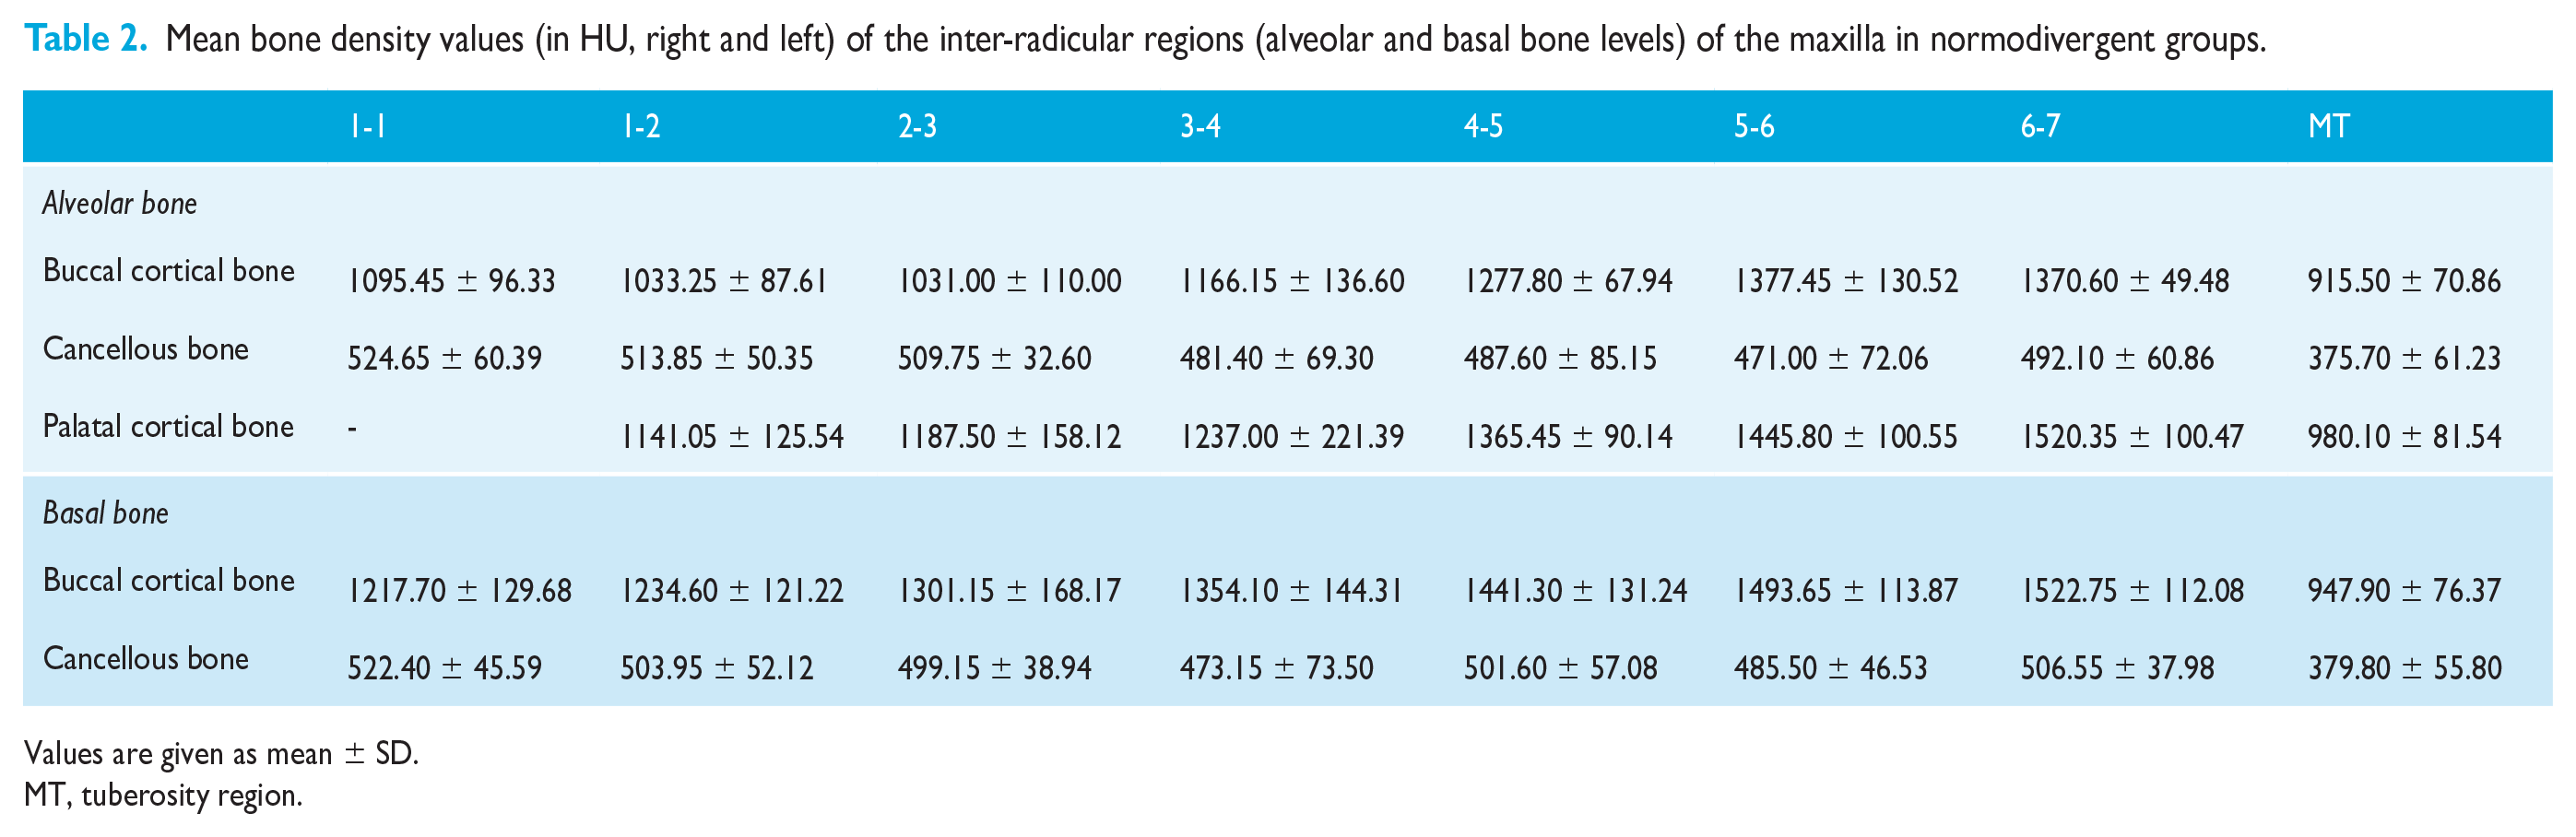
Values are given as mean ± SD.
MT, tuberosity region.
Mean bone density values (in HU, right and left) of the inter-radicular regions (alveolar and basal bone levels) of the maxilla in hyperdivergent groups.
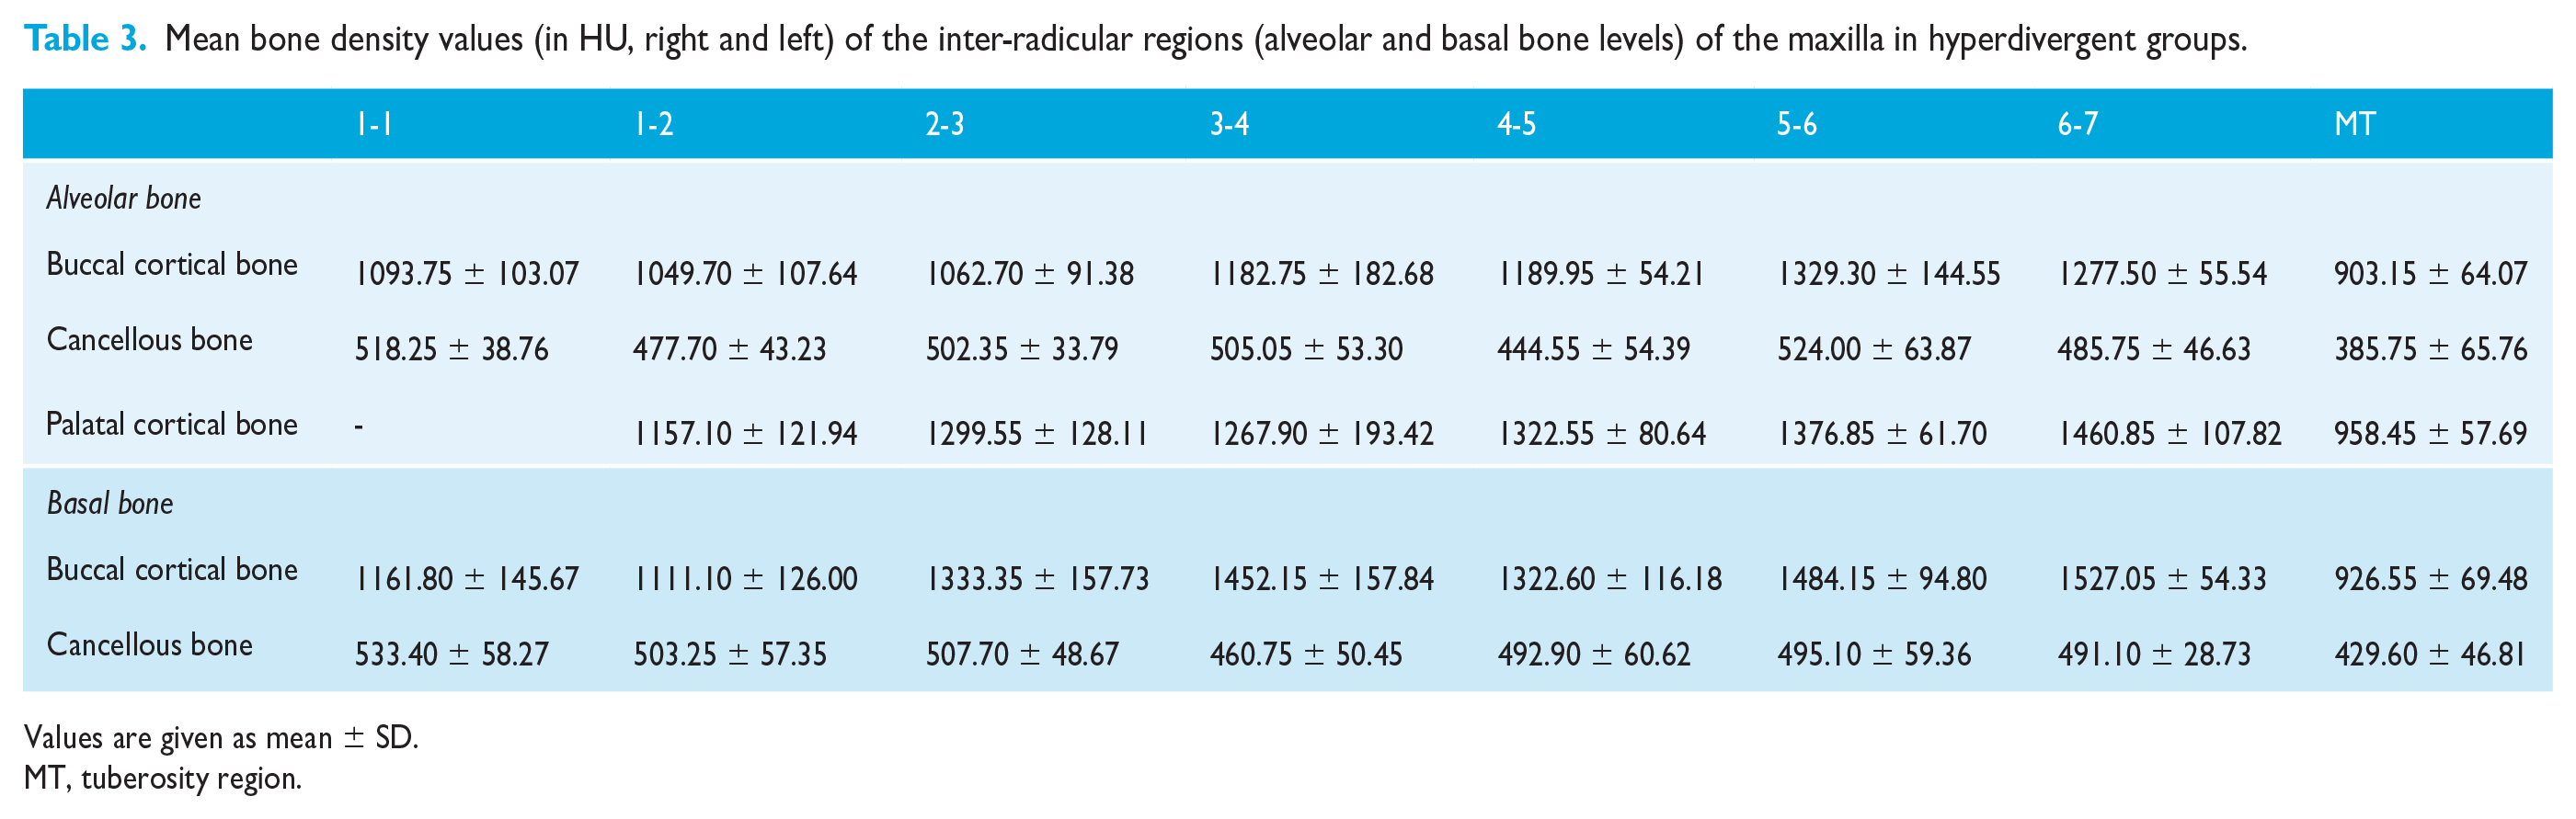
Values are given as mean ± SD.
MT, tuberosity region.
Statistically significant difference in cortical bone density values was noted in the 5-6 region between Groups 2 and 3 (p-value=0.045) with higher density in Group 2.
Basal buccal cortical bone
Maximum cortical density was seen in the 6-7 regions in all the three groups (hypodivergent = 1529 HU, normodivergent = 1522 HU, and hyperdivergent = 1527 HU) . In Group 1, the maximum cancellous bone density was seen in the 6-7 regions. In Groups 2 and 3, maximum cancellous bone density was seen in the 1-1 regions. The maxillary tuberosity region showed the least cortical and cancellous bone density in all three growth patterns (Tables 1–3).
A statistically significant difference in cortical bone density values was noted in the 3-4 region between Groups 1 and 3, with Group 1 having higher density values (P = 0.005).
A statistically significant difference in cortical bone density values was noted in the 4-5 region between Groups 2 and 3, with Group 2 having higher density values (P = 0.004), and Groups 1 and 3 (P = 0.017), with more density in Group 1.
Infrazygomatic crest
Cortical bone density was highest in Group 1 and there was a statistically significant difference between the groups (1601 HU; P < 0.05). Cancellous bone density was highest in Group 1 but there was no statistically significant difference between the groups (532 HU) (P > 0.05). The cortical and cancellous bone density in men were higher than in women but the difference was not statistically significant (P > 0.05) (Table 4).
Mean bone density values (right and left) of the infrazygomatic crest region of the maxilla in the three growth patterns.
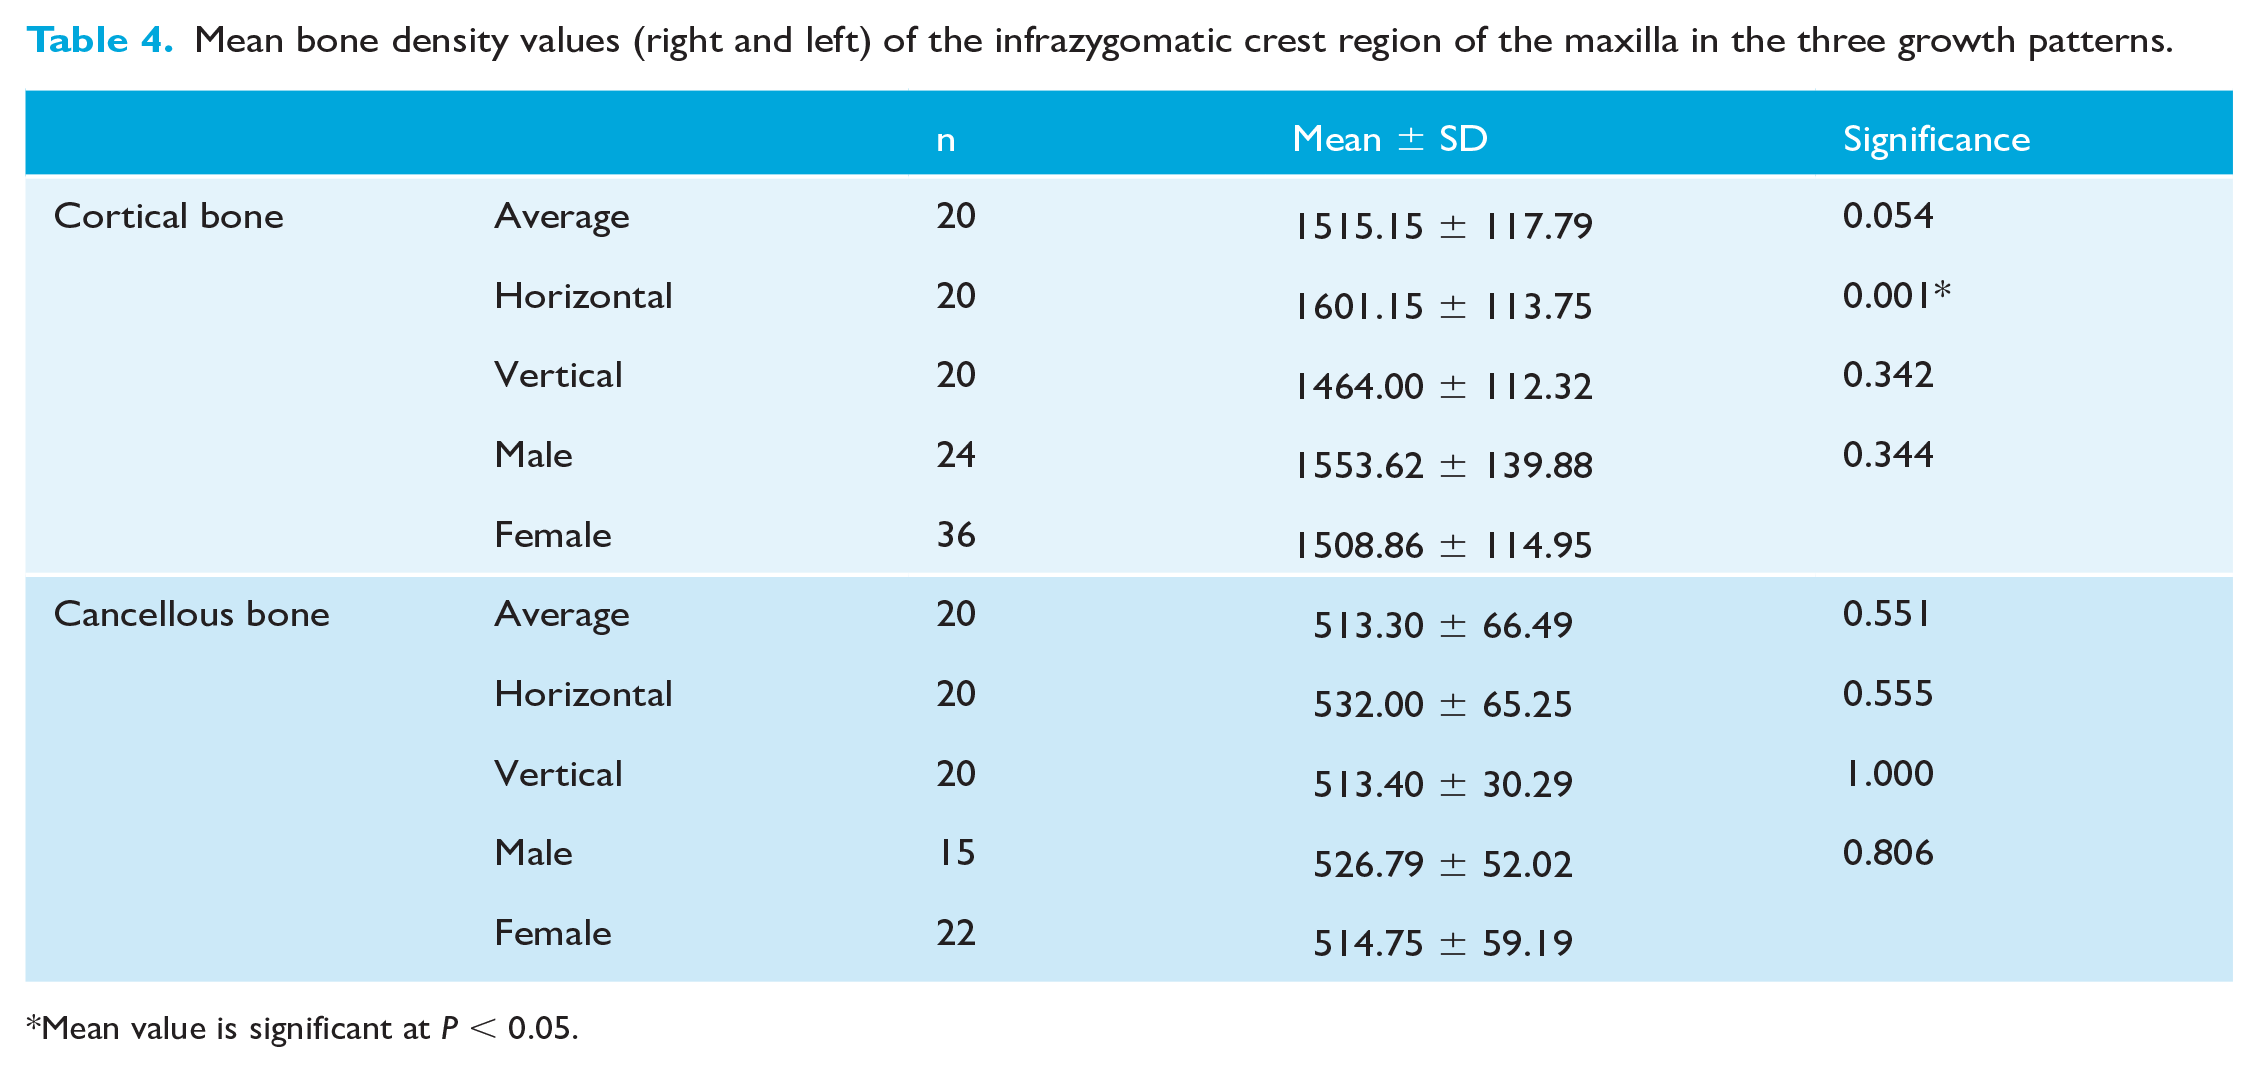
Mean value is significant at P < 0.05.
Discussion
The advent of OMIs has made it easier and predictable to perform complex tooth movements. OMIs provide safe and reliable anchorage for carrying out desired movements and are economical (Choi and Park, 2020; Papadopoulos and Tarawneh, 2007). Their ease of placement facilitates utility at different anatomical sites but factors such as available bone thickness and density should be considered before placement (Chun and Lim, 2009). Therefore, this study was carried out to locate the ideal sites for placement of OMIs based on the available bone density in individuals with different growth patterns. Bone thickness and density are interrelated factors affecting the stability of implants and hence it is vital to assess bone density at different regions of the maxilla to assess the prognosis in different skeletal patterns (Nucera et al., 2019). Patients with higher biting forces and shallow mandibular plane angles tend to have higher bone density in the molar regions (Moon et al., 2010; Sato et al., 2005). Trabecular remodelling could also occur with the transmission of masticatory forces. Similar results have been given by Miyawaki et al. (2003) who stated better stability of implants in hypodivergent groups.
The results of the present study report greater cancellous bone densities in the region between the central incisors (1-1) in all three growth patterns when compared to other sites. Anterior midline implants are commonly placed at two sites: the region between the central incisors and the region between the lateral incisors and canines (bilaterally).The quality of cancellous bone in the anterior region might determine the ideal site of placement of OMIs since in regions with poor cortical bone density, occlusal stresses are equally distributed to the cortical and cancellous bone whereas in areas with higher cortical bone density the stresses are concentrated heavily in the cortical bone (Marquezan et al., 2014; Pan et al., 2019). Ozdemir et al. (2014) proposed that increased cancellous bone density may improve the primary stability of implants in the anterior regions.
Another point of significance noted from the results of the present study is that the cancellous bone densities in the region between lateral incisor to canine (2-3) were higher than the consequent posterior regions. In consensus with our study, Chugh et al. (2013) reported higher cancellous bone density in the region between the central incisors. The significance of reporting cancellous bone density as an indicator of primary stability has, however, been overlooked in multiple studies (Ohiomoba et al., 2017; Park et al., 2008). As observed from the findings of the present study, cancellous bone density values were approximately half of the adjacent buccal and palatal cortical plate values in the anterior regions pertaining to all three growth patterns.
The present study reports higher bone density at the alveolar buccal cortex between the second premolar and first molar (5-6) in Groups 2 and 3 and between the first and second molars (6-7) in Group 1; these findings are clinically relevant as the buccal interradicular site between the maxillary second premolars and first molars is the most common site of placement of OMIs. Cancellous bone density values were approximately one-third of the corresponding buccal and palatal cortical plate values in the posterior sites assessed. Bone density in different growth patterns was studied by Ozdemir et al. (2014) in a Korean population who reported higher values in the canine-first premolar region. They reported higher bone density values in hypodivergent groups compared to normodivergent and hyperdivergent groups and it was a cone-beam CT (CBCT) study. Hyperdivergent groups showed the least magnitude of density values, which was similar to the results obtained in the present study. It is more pertinent to assess the variations in overall density at a particular region rather than the magnitude of the values at a particular site. Differences in slice acquisition and window images generated may influence the values obtained. This observation was also noted by Park et al. (2008), who determined bone density values in interradicular regions in a Korean population. The distribution of density reported was similar to the results reported in the present study (though they were of lesser magnitude); however, the region of maximum density in the buccal cortical plate was between the canine and first premolars, unlike in the present study where maximum density was noted in the 5-6 (hypodivergent and normodivergent groups) and 6-7 (hyperdivergent) regions. Greater cortical bone density observed in the posterior sites could be the reason for increased proportion between cancellous to cortical bone density in the posterior regions (one-third) compared to the anterior regions (half). Results similar to the present study were reported by Ohiomoba et al. (2017), who concluded that bone density in the region between the first and second molars was highest. Chugh et al. (2013) also reported similar findings to the abovementioned study.
The palatal cortex had higher bone density values than the buccal cortex in both the anterior and posterior regions. This finding has also been reported by many authors in the past (Choi and Park, 2020; Moon et al., 2010; Ozdemir et al., 2014). This finding has clinical relevance regarding the suitable site of placement of implants on the palatal side for en-masse anterior retraction. While the region between the first and second molars has the highest bone density, the lack of sufficient interradicular space combined with root divergences could limit accessibility. Molar intrusion is another clinical modality, which requires placement of OMIs in the palatal cortex between the maxillary first and second molar. Cousley (2010, 2014) proposed placement of OMIs in the palatal region between the maxillary first and second molars for molar intrusion anchorage, partly on the basis of optimal cortical bone density at this site. This has been shown to produce favourable molar intrusion in cases of anterior open bite (Hart et al., 2014) and is supported by the relative density findings of the current study. In addition, the difference between the buccal and palatal cortical bone densities in the inter-molar (U6-7) site was most pronounced in Group 3 (hyperdivergent group), which is clinically relevant for molar intrusion. Chugh et al. (2013) also reported higher palatal cortical bone density in the maxillary posterior regions. These results, however, conflict with those of Ozdemir et al. (2014), who reported significantly greater palatal density values in the canine-premolar region when compared to the posteriors. In the present study, the hypodivergent group had higher cortical bone density values when compared to other groups at all palatal sites.
Higher cortical bone density at the region of the first and second molars at the basal bone level could be attributed to the presence of the zygomatic buttress. The maxillary tuberosity was the region of least bone density at both the alveolar and basal bone levels. The presence of porous bone, no mechanical stimulation, and site of pterygomaxillary junction could explain this (Lopes et al., 2015). In the tuberosity site, the ratio between cancellous to cortical bone density was 1:3 due to the low cortical bone density values. These findings support the tuberosity region as a potential site for placement of extra-alveolar screws for maxillary arch distalisation in patients where the IZC region is too dense and necessitates pre-drilling. Placement of implants in the tuberosity region may also help in creating parallel force vector levels at the site of force application improving biomechanical efficiency. However, its limitations include difficulty in obtaining access to the site and adequate bone levels, which may influence treatment considerations.
The density of the basal bone was higher compared to the alveolar bone in all three growth patterns. Basal bones are load-bearing by nature and bite force levels transmitted through the teeth should help in remodelling its cortices. This is more accentuated in maxilla among hypodivergent groups who present with thicker jaws and higher biting forces (Moon et al., 2010). The increased stress transmission can result in higher bone density values, which are exhibited in the present study as well. Hypodivergent groups reported a higher cortical bone density level at the alveolar and basal bone levels when compared to normodivergent and hyperdivergent groups.
Bone density in the IZC region was greater when compared to alveolar and basal bone levels. The most accurate site of the IZC has been contested in the literature by different opinions given by Chang et al., 2019. Studies about the IZC region have mostly reported only on bone thickness (Liou et al., 2007). A study by Lee et al. (2013) reported increased bone thickness at the IZC region in men compared to women. To our knowledge, no studies have reported bone density values of the IZC region in different growth patterns. In the present study, hypodivergent groups had the maximum cortical and cancellous bone density followed by normodivergent and hyperdivergent groups. Men had a higher mean cortical bone density than women. Cancellous bone density values were approximately one-third of the cortical density values in all three growth patterns.
The present study showed substantial intra-observer agreement but moderate to good inter-observer agreement. Difficulty in demarcating boundaries, selecting appropriate slices based on chosen reference planes and visual difficulty in judging the grey-white values between cortical and cancellous bone could be factors responsible for this. Ozdemir et al. (2014) assessed cortical bone densities in different growth patterns using CBCT. However, they used comparative values for grey-scale values and Hounsfield units (HUs) based on studies done using appropriate artifacts (Cassetta et al., 2014; Lagravère et al., 2006). Moreover, they compared regions across the maxilla and mandible rather than individual anatomic locations. In addition, scatter radiation, artifacts caused by beam hardening, can affect the accuracy of the measured HUs (Ohiomoba et al., 2017). Hence, CT is the preferred technique for determining specific region densities.
Prospective trials to verify bone density or thickness by CT scans are practically impossible as well as unethical considering the invasive nature of the scans. Well-defined study groups with adequate samples as part of retrospective studies can provide valuable diagnostic markers that may improve patient acceptance and treatment outcome. While the relevance of the findings obtained in the present study may not immediately translate into better treatment outcomes, it can enable us to understand why implant failure rates are higher in certain bone microstructures. This may be especially useful in the maxillary anterior regions where implants are placed for intrusion. Assessing the preoperative cancellous bone density will ensure sufficient stability of OMIs in the anterior maxilla. Bone density is one of the important factors determining stability but not the only deciding factor since the success of OMIs is multifactorial. Understanding the biological limitations imposed by the individual’s growth pattern can further clinical acumen and success. In addition, the present study was carried out in one particular ethnic population and hence caution must be exercised before extrapolating these values to other populations.
Conclusion
Cancellous bone was most dense in the anterior region between the two central incisors and was not influenced by the vertical facial proportions.
Highest cortical density in the interradicular region (buccally) was seen between the second premolar and first molars in the normodivergent and hyperdivergent groups and between first and second molars in the hypodivergent group. The hypodivergent group had highest bone density in the buccal cortical (alveolar, basal) and palatal cortical sites compared to the normodivergent and hyperdivergent groups.
The bone density levels at IZC sites were highest in scans obtained from hypodivergent individuals when compared to normodivergent and hyperdivergent individuals.
Supplemental Material
sj-docx-1-joo-10.1177_14653125211020015 – Supplemental material for Computed tomography assessment of maxillary bone density for orthodontic mini-implant placement with respect to vertical growth patterns
Supplemental material, sj-docx-1-joo-10.1177_14653125211020015 for Computed tomography assessment of maxillary bone density for orthodontic mini-implant placement with respect to vertical growth patterns by Prasanna Arvind TR and Ravindra Kumar Jain in Journal of Orthodontics
Supplemental Material
sj-docx-2-joo-10.1177_14653125211020015 – Supplemental material for Computed tomography assessment of maxillary bone density for orthodontic mini-implant placement with respect to vertical growth patterns
Supplemental material, sj-docx-2-joo-10.1177_14653125211020015 for Computed tomography assessment of maxillary bone density for orthodontic mini-implant placement with respect to vertical growth patterns by Prasanna Arvind TR and Ravindra Kumar Jain in Journal of Orthodontics
Supplemental Material
sj-docx-3-joo-10.1177_14653125211020015 – Supplemental material for Computed tomography assessment of maxillary bone density for orthodontic mini-implant placement with respect to vertical growth patterns
Supplemental material, sj-docx-3-joo-10.1177_14653125211020015 for Computed tomography assessment of maxillary bone density for orthodontic mini-implant placement with respect to vertical growth patterns by Prasanna Arvind TR and Ravindra Kumar Jain in Journal of Orthodontics
Footnotes
Acknowledgements
I would like to acknowledge the efforts of my co-author along with my Department Head for encouraging us to get involved in interdisciplinary research topics involving matters of concern for orthodontic purposes.
Availability of data and materials
Preoperative CT scans of patients reporting to the Department of Radiology at Saveetha Medical College were included in the study after they satisfied the inclusion criteria accordingly.
Declaration of Conflicting Interests
The author(s) declared no potential conflicts of interest with respect to the research, authorship, and/or publication of this article.
Funding
The author(s) received no financial support for the research, authorship, and/or publication of this article.
Supplemental material
Supplemental material for this article is available online.
References
Supplementary Material
Please find the following supplemental material available below.
For Open Access articles published under a Creative Commons License, all supplemental material carries the same license as the article it is associated with.
For non-Open Access articles published, all supplemental material carries a non-exclusive license, and permission requests for re-use of supplemental material or any part of supplemental material shall be sent directly to the copyright owner as specified in the copyright notice associated with the article.