
Abstract
Objective:
To investigate the accuracy of full arch scans taken using the iTero Element 2® under clinical settings.
Design:
Prospective clinical study.
Methods:
A customised upper removable appliance (URA) with four spheres (A–D) was fabricated from a maxillary arch iTero® scan for a 24-year-old patient. Six linear values were measured on the URA using a high-accuracy coordinate measuring machine. A total of 60 intra-oral iTero® scans were taken by two operators (HA and AS) with the test URA inserted to the participant’s maxillary dentition at T1 and T2. Geomagic Control X software was used to measure the six linear distances between the reference spheres (1–4) in all scans. Comparisons between distances on full arch scans to true distances on the URA were made to evaluate accuracy.
Results:
The median distance to the prepared bench top URA mean was significantly away from zero for each operator and timepoint across all measurements except AD versus 14 and BD versus 24. Statistically significant, although clinically non-significant, differences in median linear distances in relation to the prepared benchtop URA were observed between evaluators in segments AB versus 12 (operator 1 −0.021 mm vs. operator 2 −0.06 mm) and AC vs. 13 (operator 1 −0.044 mm vs. operator 2 −0.167 mm) at T1.
Conclusion:
The accuracy of scanners is defined as the trueness and precision of the captured scans to the dental arches. The accuracy of iTero Element 2® is acceptable for diagnosis and treatment planning in orthodontics. Length and location of the scanned segment and scanning sequence ‘protocol’ affect accuracy.
Introduction
Despite the advantages of using intra-oral scanners over conventional techniques in producing digital models, they have limitations related to learning curves, overall scanner cost and, primarily, concerns related to the scan path (Zimmermann et al., 2015). Scan path is defined as ‘the movement of the scanner according to a specific well-established pattern to obtain the greatest possible accuracy of a digital model’ (Zimmermann et al., 2015). The limited field of view for these scanners and the multiple small three-dimensional (3D) datasets acquired, once superimposed and integrated make it more likely for precision errors to occur (Kuhr et al., 2016). Various clinical and in vitro studies showed the effect of scan paths on the accuracy of data (Ender and Mehl, 2011, 2013, 2015). Moreover, accuracy errors can be introduced due to the restricted humid oral environment and the presence of anatomical structures, such as the tongue, which hinders the ease of acquiring scans (Lee, 2018).
Accuracy is the ability of the scanner to capture a scan that closely resembles the dental arch (Abduo and Elseyoufi, 2018; Park et al., 2018; Patzelt et al., 2014). Reliability (precision) is how closely a repeated pair of scans between different participants resemble each other (Aragón et al., 2016; Ebeid et al., 2017; Goracci et al., 2016). Research has compared the accuracy and reliability of different types of scanners using direct measurements on conventional models (Yılmaz et al., 2019), or scans of plaster models made from conventional impressions (Jacob et al., 2015; Nalcaci et al., 2015) as a standard for comparison. Other studies have used industrial scanners for comparison assuming that their dimensional accuracy is higher (Kwon et al., 2021). However, all these methods carry risks of inaccuracy. Therefore, it is imperative to establish a reliable reference when investigating the accuracy of intra-oral scans.
This is the first study to investigate accuracy of clinical full dentition scans taken by the iTero Element 2® under clinical settings. It is the only scanner whose function is based on the confocal laser scanning microscopy principal and offers a powder-free work field. For this purpose, we utilised a contact type, high accuracy, coordinate measuring machine to form reliable reference values from linear distances measured on a customised upper removable appliance (URA).
Materials and methods
This pilot prospective study was approved by the Institutional Board of UCONN Health – Farmington – Connecticut (IRB no. 19-069-2). A 24-year-old woman was recruited with a completely healthy permanent dentition, well aligned teeth and good oral hygiene. A detailed explanation of the methodology was given to her and written informed consent was obtained for participation in the study.
First, an intra-oral maxillary dentition scan was captured for her maxillary dentition to fabricate a customised URA using the iTero Element 2® according to the manufacturer’s recommendation. Specifically, scanning started from the occlusal surface of the maxillary left second molar and continued to the occlusal surface of the maxillary right second molar. Next, the scanner tip rolled to the lingual surface of maxillary teeth and scanning started from the right quadrant and continued to the left quadrant. After that, scanning of the buccal surfaces of maxillary teeth was initiated starting from the left second molar to the midline, and then from the right second molar back to the same midline. In the final step, the incisal edges of the maxillary anterior teeth were scanned. The image could be continuously viewed on the screen during the scanning to ensure that no areas were missed.
The first scan was sent to Align Technology™ and made available for download as a stereolithography (STL) file ready for processing. Using the digital model, a customised URA, incorporating four spheres (A–D), with retention from Adams clasps on the first permanent molars and a labial bow in the upper labial segment, was fabricated for the participant (Figure 1). The acrylic baseplate, incorporating four stainless-steel spheres (with a mean diameter of 5 ± 0.005 mm), was made of dental acrylic/PMMA. Two anterior spheres were placed palatal to the maxillary canines (B and C) and two posterior spheres were placed palatal to the maxillary second molars (A and D) (Figure 1). The distances between the spheres were regarded as a reference for the measurement of the linear distances captured by the iTero® scanner. Six linear distances, between the spheres, were measured on the test appliance using a high-accuracy coordinate measuring machine (CMM) Sheffield Discovery II CMM (Hexagon, Stockholm, Sweden). These machines measure the height, width and depth (X, Y, Z) of any point using coordinate processing technology. They measure the target, record the data and automatically obtain Geometric Dimensioning and Tolerancing (GD&T) measurements to communicate to the manufacturing team the required level of precision and accuracy for manufactured parts. Their advantage is that they measure items that are difficult to measure with other measuring machines and with extremely high accuracy by locating their 3D coordinates (Vermeulen et al., 1998). The CMM’s URA measurements were captured five times and a mean value was obtained (Appendix 1).
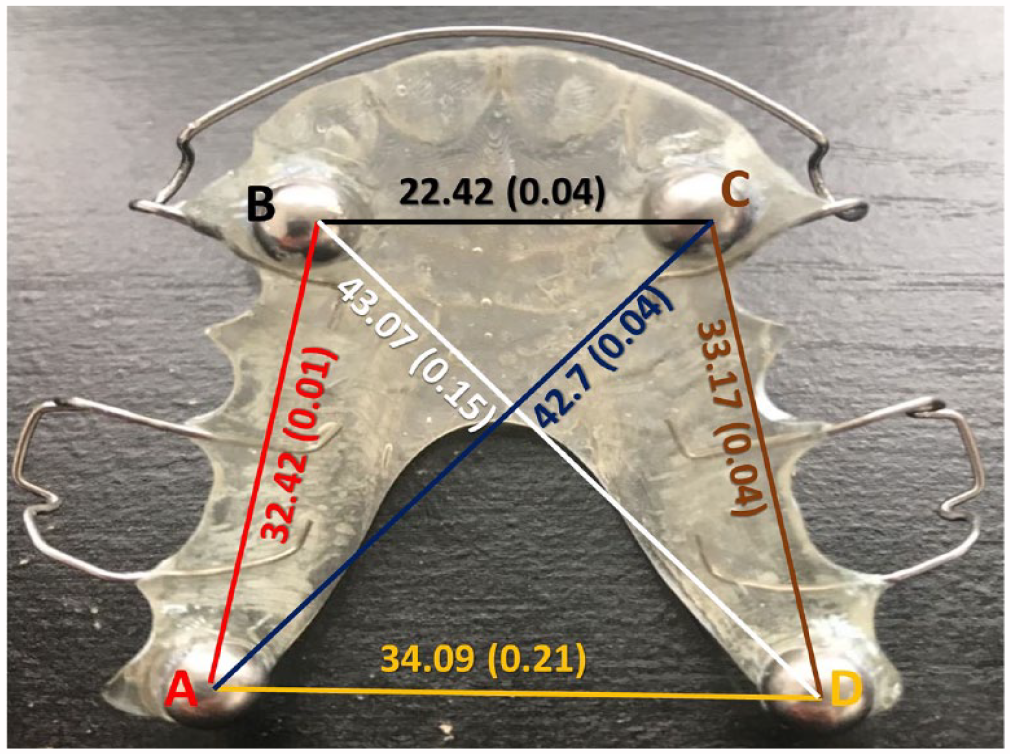
Fabricated upper removable appliance with four target spheres with linear measurements (mean ± SD) by CCM.
After its fabrication, the customised URA was fitted into the participant’s maxillary teeth. A total of 30 intra-oral iTero® scans were taken by two operators (orthodontists) of the test appliance when inserted into the participant’s mouth, at T1 and T2. In total, 15 scans were taken by operator 1 (HA) and 15 by operator 2 (AS) at T1. Two weeks later, in the second visit (T2), another 30 full dentition scans were retaken in the same previous technique and scanning sequence. Operators were sufficiently trained to use the iTero Element 2® and the scans were performed in the same room under ambient light conditions. The captured scans at T1 and T2 (total of 60 scans) were sent to Align Technology™ for analysis. The scanned data were saved and exported in the standard tessellation language (STL) file format for analysis.
The same linear distances were measured between the spheres (1–4) from the captured iTero® scans using the Geomagic Control X software (version 2018.1.1, Bielsko-Biala, Poland) (Figure 2), which represents a reference to the original stainless-steel spheres of the URA (A–D). The linear measurements were recorded for each scan in a similar fashion to those recorded for the URA as follows:12, 23, 34, 14, 13, 24 (Figure 2). The direct linear distances measured from the reference URA were used as true reference data (Figure 1). The measurements taken of the appliance by the CMM and from the iTero® scans were then compared.
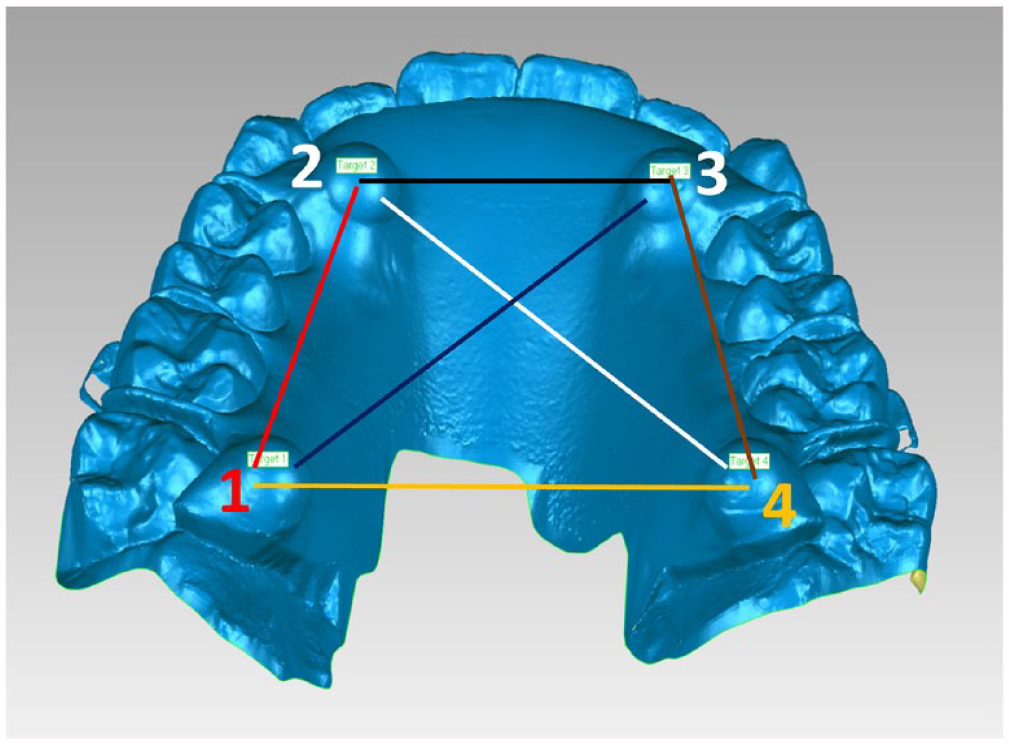
Target spheres on maxillary arch scans.
Statistical analysis
A descriptive analysis was conducted to summarise linear distances between targets (centres of the spheres) as measured directly on the URA and those measured on scans. Deviations between scan results and the mean of URA measurements (very close to the median) (Table 1) were summarised per linear distance between targets by median, minimum and maximum to be robust to outliers (Figure 3). Outliers based on Tukey (1977) are those lying outside the range of the first quartile minus 1.5 times the interquartile range, and the third quartile plus 1.5 times the interquartile range.
A descriptive summary of the linear distances between the targets as measured directly on the URA.
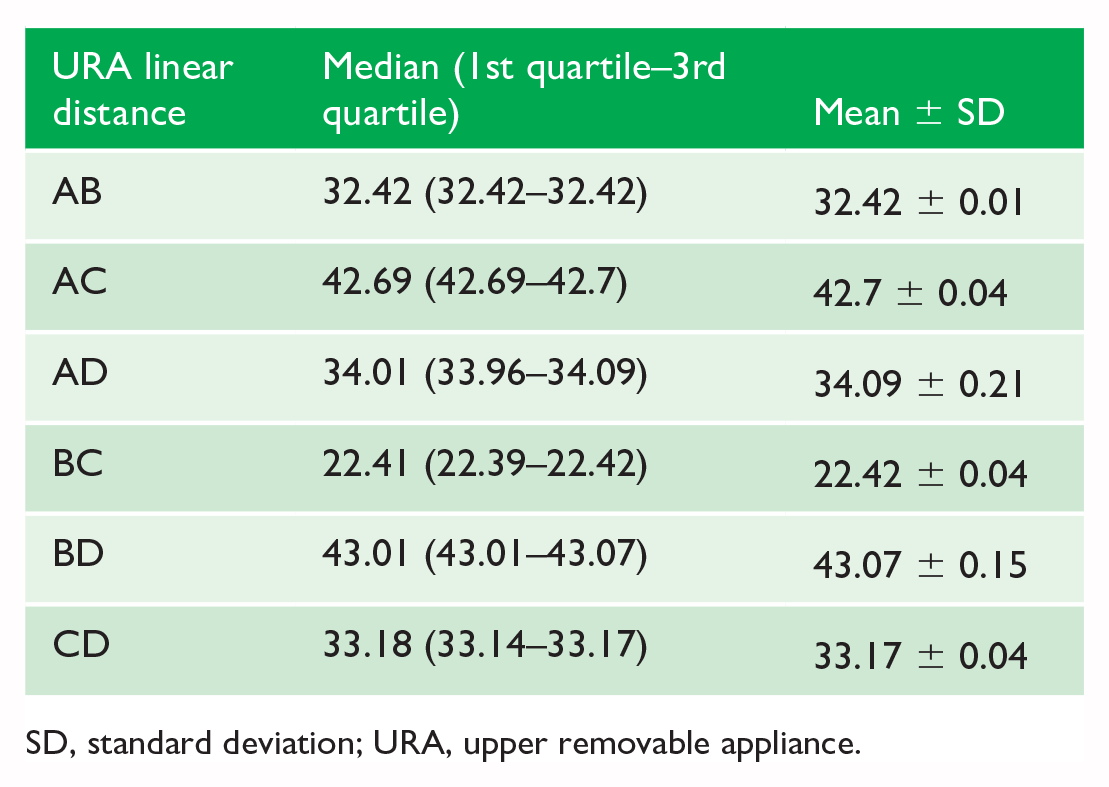
SD, standard deviation; URA, upper removable appliance.
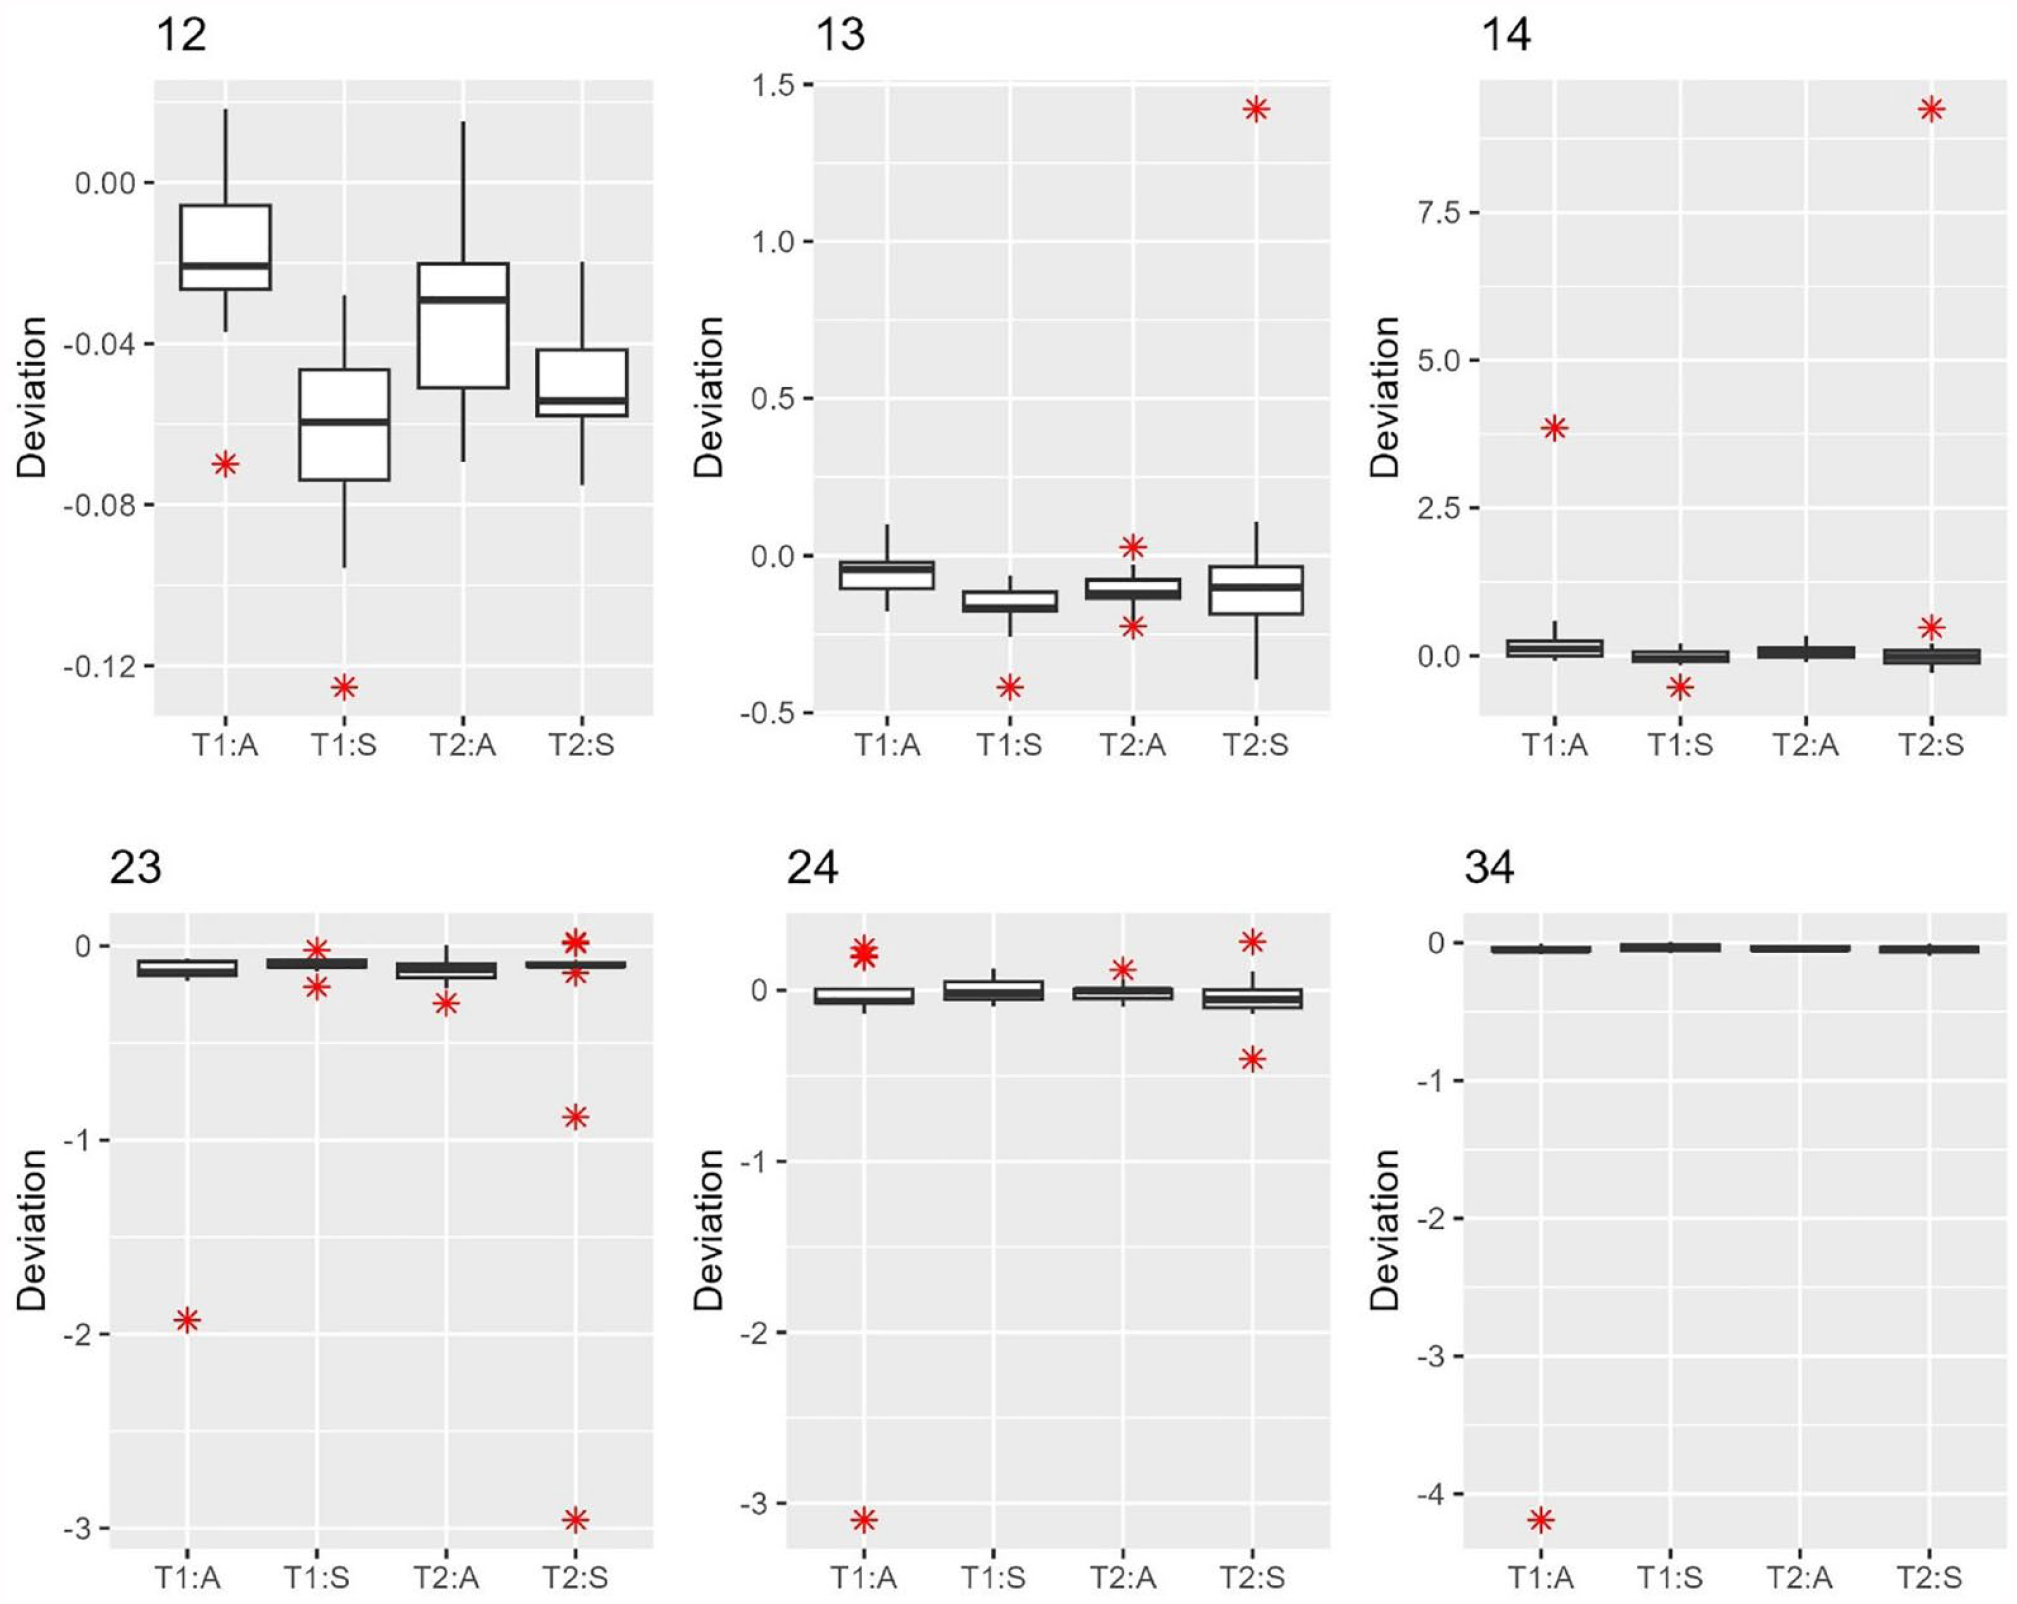
Deviations in linear distances between targets measured on scans and the mean distance measured directly on the URA by operator and timepoint for each segment. Operator 1, HA; operator 2, AS; T, timepoint; URA, upper removable appliance.
Due to the high dependency of data from repeated measurements, the distribution of the median deviation is not known in theory, and we resampled the data, preserving the dependency among data points to derive the sampling distribution to facilitate the calculation of the 95% confidence interval (CI). We implemented a bootstrapping method for statistical inference. A total of 1000 bootstrap resampling samples for each operator and timepoint were used to estimate the 95% CI for the median deviation from the mean of the URA measurement (fixed). P values were reported for the following null hypotheses by operator and timepoint:
(1) The median deviation in linear distance between targets measured on scans and the mean distance measured directly on the URA equals zero;
(2) There is no difference in median deviation between operators.
P values <0.05 were considered statistically significant. All statistical analyses were performed using R version 4.2.2.
Results
A descriptive summary (median [1st quartile–3rd quartile]) and mean ± SD of the linear distances between the targets as measured between the spheres on the URA (AB, BC, CD, DA, AC, DB) are presented in Table 1. Descriptive statistics of the linear distances between the target spheres as measured on the scans (12, 23, 34, 41, 13, 42) are shown in Table 2. Regarding the accuracy of the scanner, the median distance between the linear measurements of scan results and the prepared benchtop URA mean was calculated for operators (1 or 2) and measurement time (T1 or T2) (Table 3). Scans tended to under-measure the linear distances, but the absolute median deviation was not larger than 0.17 mm. The associated P values were statistically significant, partly due to the small variation among the repeated measurements within operators at a given time (Table 3).
A descriptive summary of the linear distances between the targets measured on the scans.
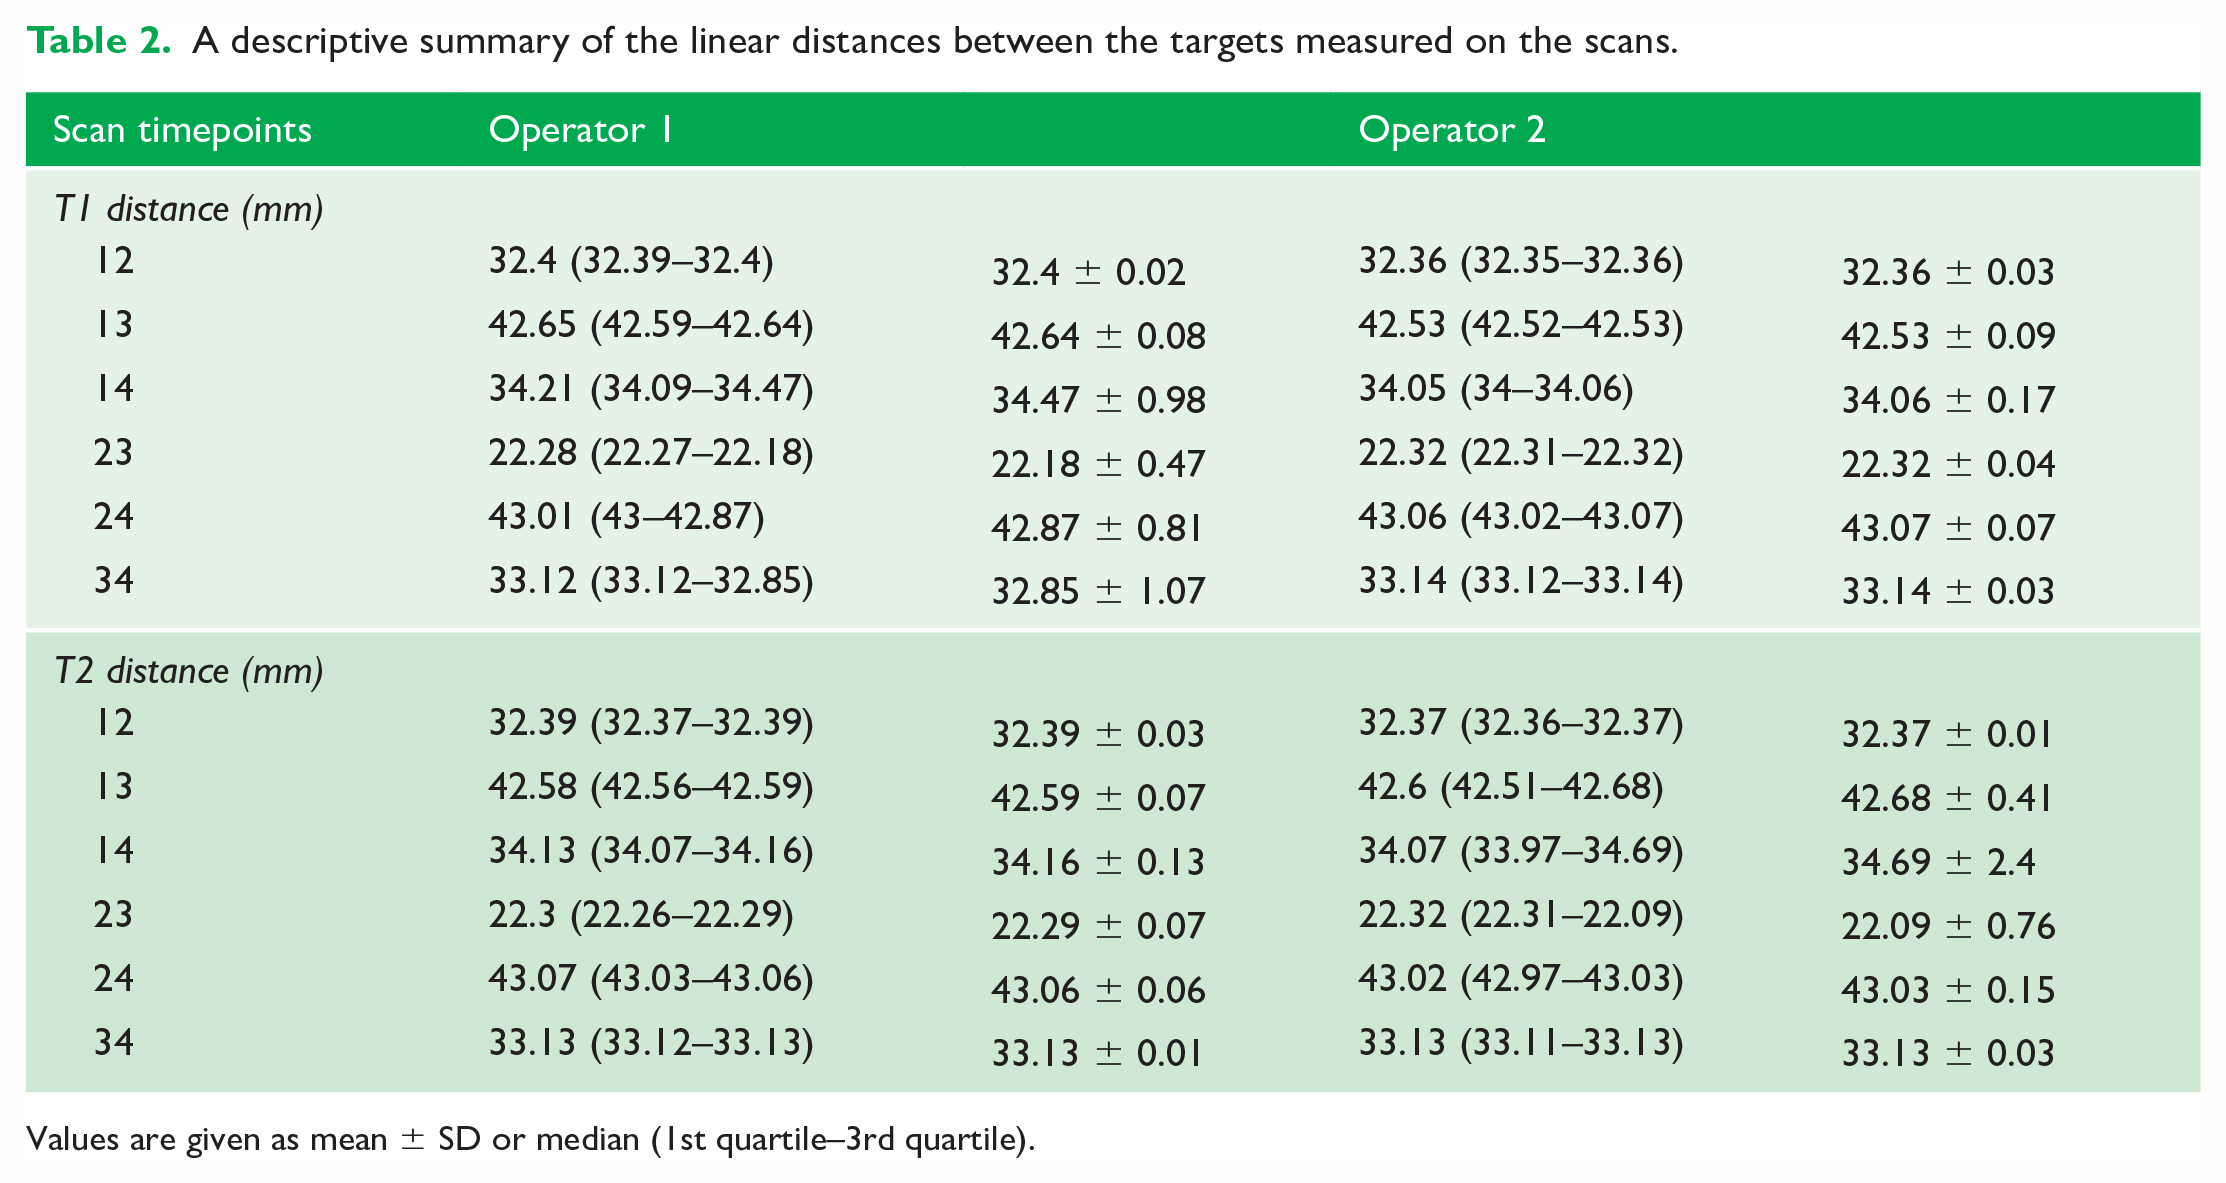
Values are given as mean ± SD or median (1st quartile–3rd quartile).
Median difference (mm) between scan results and the prepared benchtop measured URA mean by the operator (1/2) and measurement time (T1/T2).
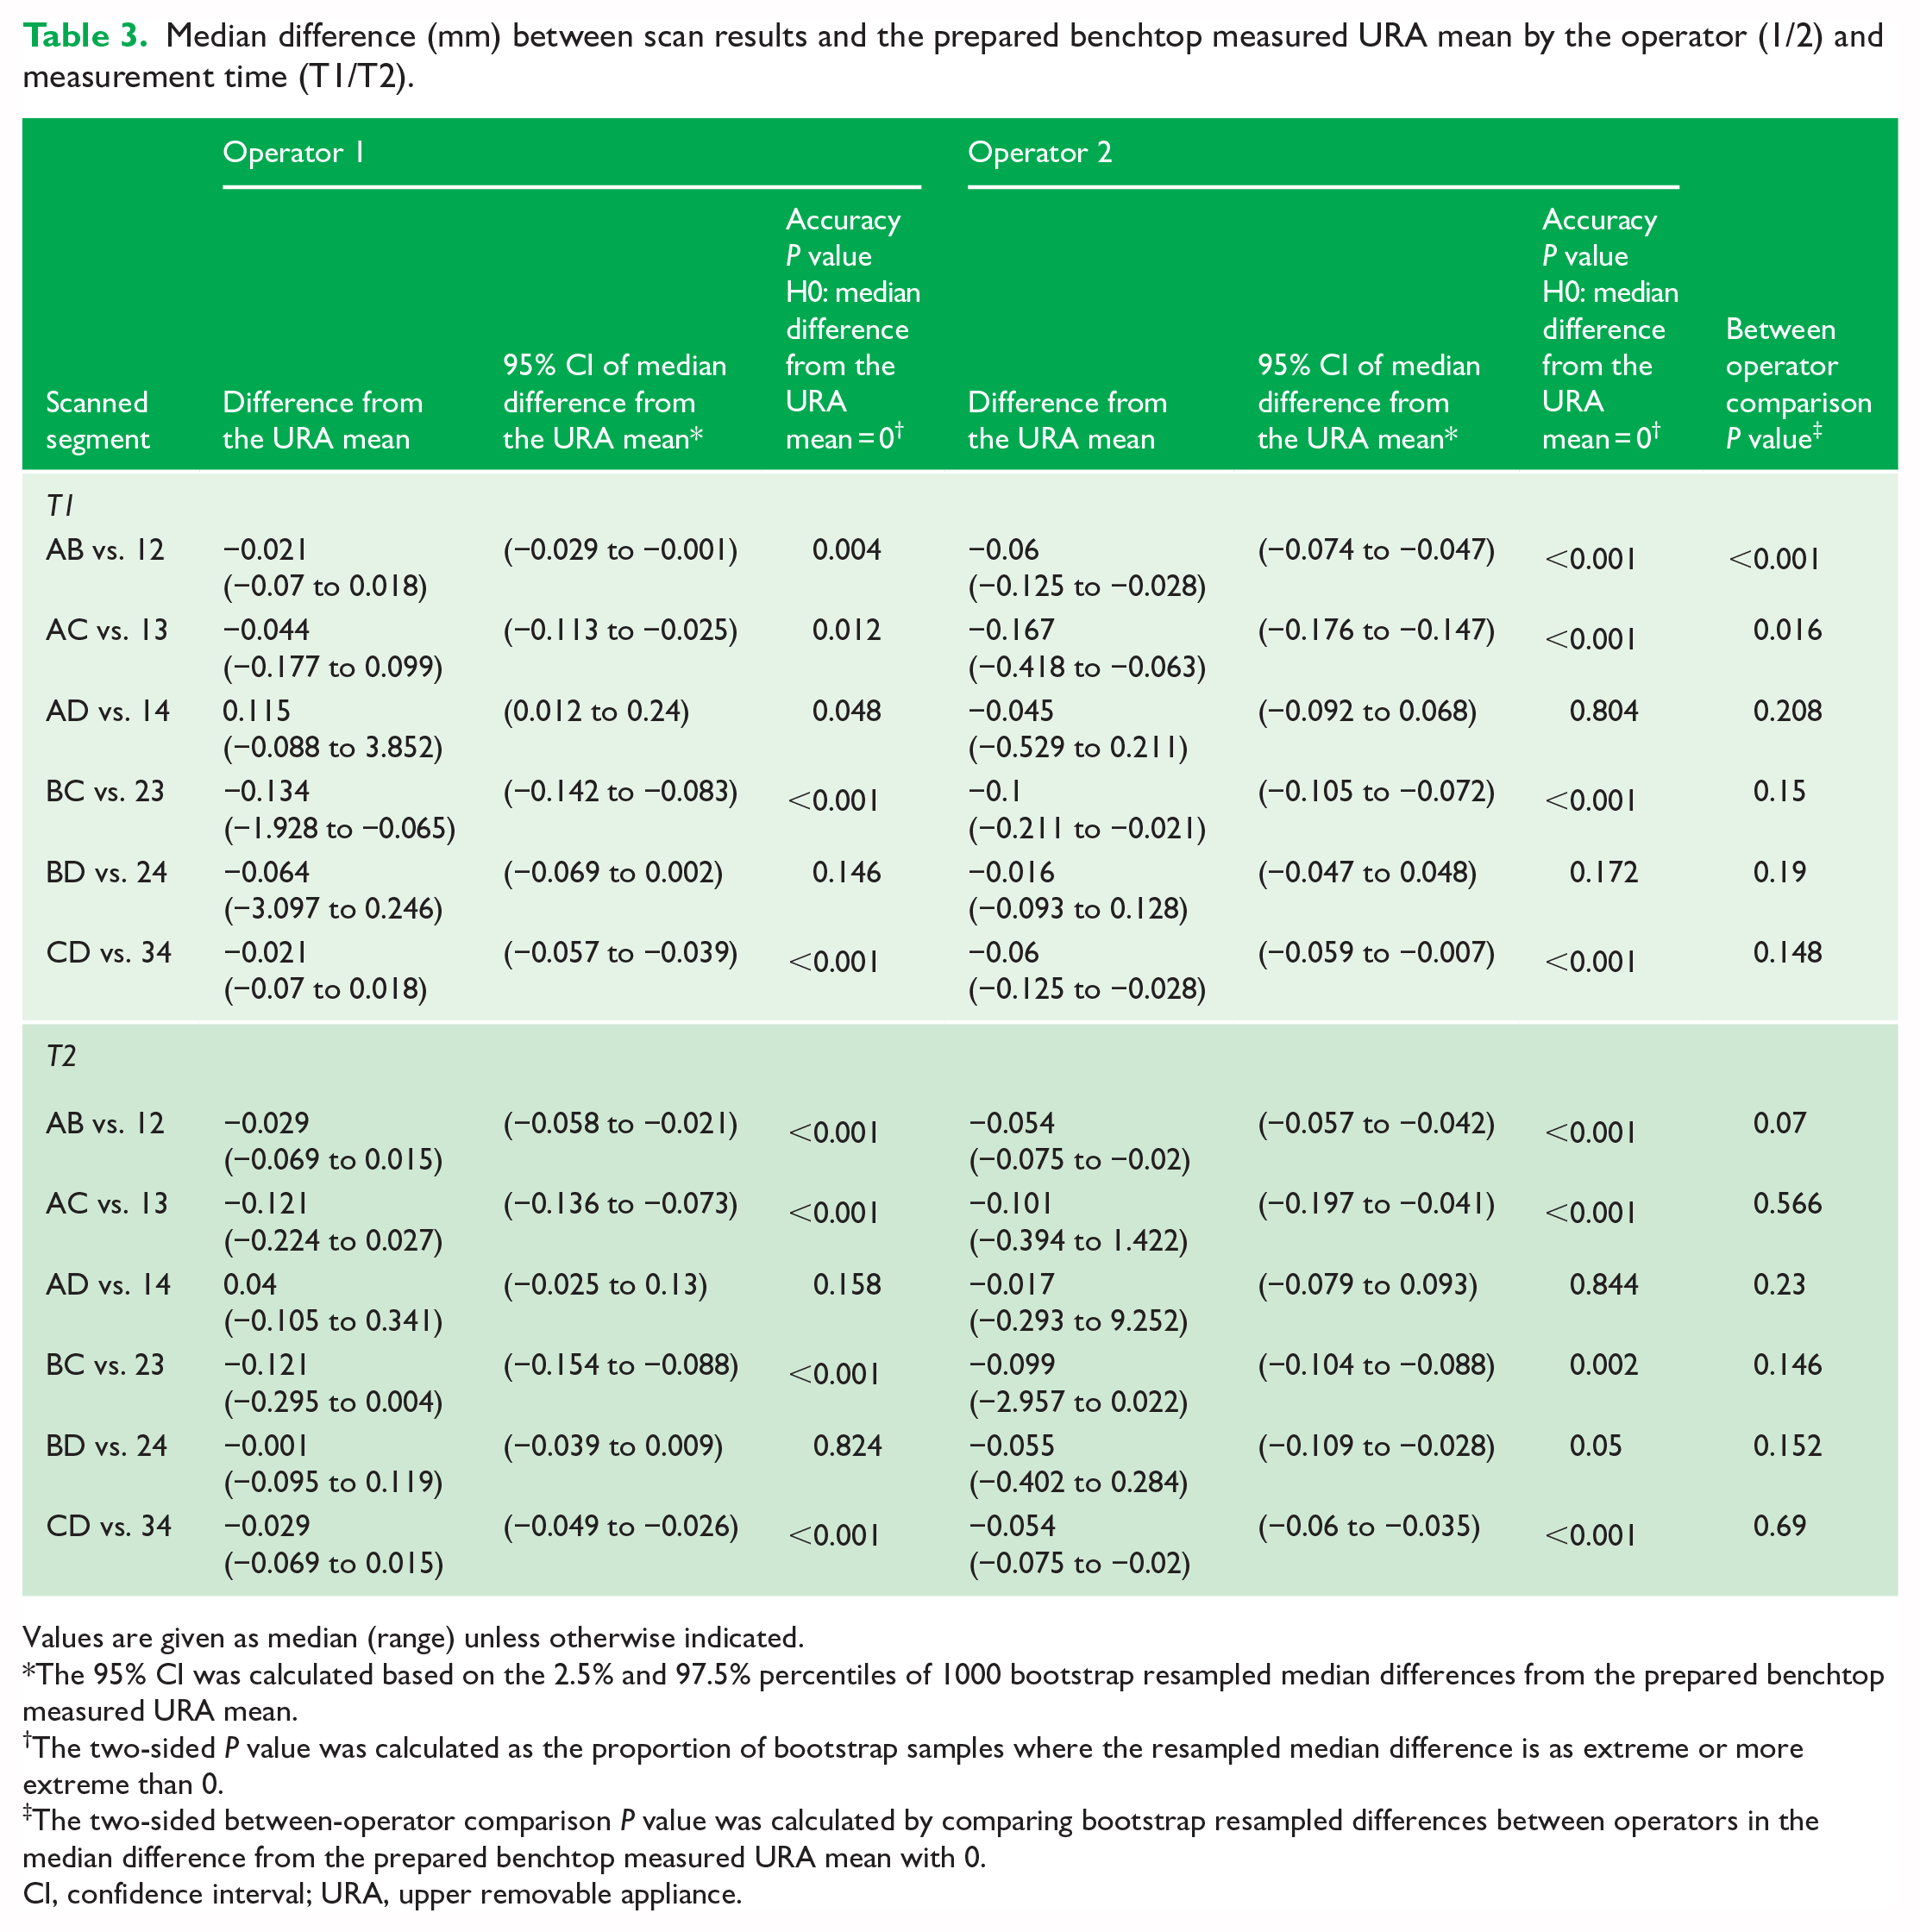
Values are given as median (range) unless otherwise indicated.
The 95% CI was calculated based on the 2.5% and 97.5% percentiles of 1000 bootstrap resampled median differences from the prepared benchtop measured URA mean.
The two-sided P value was calculated as the proportion of bootstrap samples where the resampled median difference is as extreme or more extreme than 0.
The two-sided between-operator comparison P value was calculated by comparing bootstrap resampled differences between operators in the median difference from the prepared benchtop measured URA mean with 0.
CI, confidence interval; URA, upper removable appliance.
We noted that the 95% CIs revealed the median distance to the prepared benchtop URA mean to be significantly smaller than zero across operators and timepoints except AD to 14 and BD to 24 (operator 1 at T1, was marginally statistically significant for AD to 14). Although statistically significant (P < 0.05), these distances did not exceed 0.17 mm, a magnitude deemed non-clinically significant.
Statistically significant differences between the operators (1 and 2) in median distance to the prepared benchtop URA mean were observed between AB and 12 (operator 1 −0.021 mm vs. operator 2 −0.06 mm) and between AC and 13 (operator 1 −0.044 mm vs. operator 2 −0.167 mm) at T1; however, the between-operator differences were clinically insignificant.
Discussion
Summary and generalisability
Scanned data are influenced by oral environment, equipment, calibration status, time between measurements and operator error (Jedliński et al., 2021; Mack et al., 2017). A unique aspect of this study is the establishment of a reliable reference ‘benchtop URA’ to evaluate the accuracy of digital data. Linear distance measurements between the spheres on the URA measured by high accuracy (CMM) were set as a reference and compared to linear scanned distances measured by two operators. Previous studies investigating the accuracy of scans in orthodontics relied on comparing measurements between plaster models and digital models created by different scanners (Deferm et al., 2018; Kim and Lagravére, 2016; Lee, 2018; Yılmaz et al., 2019), the use of scans from high-efficiency industrial scanners as a reference (Kwon et al., 2021; Wesemann et al., 2017; Winkler and Gkantidis, 2020), comparisons of intra-oral scanners to bench scanners (Flügge et al., 2013) or comparisons between different intra-oral scanners (Jung et al., 2016; Song and Kim, 2020). Naidu and Freer (2013) reported excellent reliability between tooth width measurements on digital models using the OrthoCAD® system and calliper measurements on stone models. Al Jabri et al. (2021) compared calliper measurements of teeth on plaster casts to software measurements of teeth on extra-oral iTero® scans for study models and their results indicated that dental measurements can be performed more precisely on scanned dental models. One study compared extra-oral scans from iTero® to intra-oral scans of other scanners and concluded that iTero® scans were more accurate compared to other intra-oral scans (Treesh et al., 2018). Therefore, methods used to assess accuracy varied, making comparison between studies difficult, and having a reliable reference would certainly reduce the risk of inaccuracy.
CMMs have been used extensively as a standard measuring tool to establish reliable references in the prosthodontics literature assessing the accuracy of intra-oral scans (Kihara et al., 2020). In orthodontics, these machines have been utilized in research evaluating tooth movement (Owman-Moll et al., 1995), bracket positioning (Nouri et al., 2015) and cone-beam computed tomography (CBCT) measuring software accuracy (Lagravère et al., 2008). Therefore, this is the first study in orthodontics that employs a reliable reference based on linear distances obtained from the highly accurate CMM to evaluate the accuracy of the iTero® scanner. Moreover, it was reported that, unlike superimposition methodologies, investigations using reference geometries enable the evaluation of linear and angular deviations in all three dimensions (Peroz et al., 2022).
Interpretation
The iTero Element 2® produces images by stitching, based on assembled images for every tooth to construct a virtual model for the jaw. Its stitching algorithm is still unknown, which might be a source for systematic errors (Galovska et al., 2012). In orthodontics, these scanners were precise in capturing intermolar and intercanine width on study models (Park et al., 2016). Crowding and linear measurements were also captured with accuracy using the iTero® scanner (Akyalcin et al., 2013). In a recent systematic review (Goracci et al., 2016), only one study evaluated the accuracy of iTero® and proved that iTero® intra-oral scans are less accurate than extra-oral scans and models digitized by iTero® were less accurate than those produced by desk scanners (Flügge et al., 2013). Hence, the lack of clinical studies evaluating the accuracy of iTero Element® scans. The null hypothesis that no significant statistical differences in the median distance from the prepared benchtop URA for linear measurements captured by the scanner was rejected. We found statistically significant differences in accuracy depending mainly on the location of the measured distance and length of the span scanned. The greatest error in accuracy was observed for the linear distance (AB vs. 12) in the upper right quadrant, which is the last segment scanned, and the linear distance (AC vs. 13) also showed a statistically significant difference. These differences might be related to factors affecting the accuracy of intra-oral scanners, including scan path, length of span, full dentition and quadrants scanned, orientation of scanner head, use of scanner clinical setting and size camera head (Abduo and Elseyoufi, 2018).
Scan path has an influence on the accuracy of captured data, clinical and in vitro (Ender and Mehl, 2013, 2015). Segments 12 and 13 indicate the terminal scanned segments, 12 being in the upper right quadrant area and 13 crossing the dentition. Insufficient data volume might have been generated in these two segments due to crossing the dentition to complete the scan path. Su and Sun (2015) reported that a half-arch scan had double the accuracy of a full-arch scan. Renne et al. (2017) reported that the iTero® scanner was among the least affected scanners with the increased span length. Generally, there is a sequence of reduction in accuracy as the length of the segment increases. Ender et al. (2016) concluded that scanning of a quadrant had comparable precision to casts produced from conventional impressions, unlike full dentition scans. Substrate scanned and tooth morphology have an influence on accuracy. In the prosthodontics literature, scanning edentulous segments had less accuracy than scanning dentate segments (Kim et al., 2017) and scanning interproximal areas had a negative influence on accuracy (Ender et al., 2016). Therefore, distances that have crossed the palatal region in our study and those with more teeth were more prone to error than those in the dentate segments and with fewer teeth in the segment.
The distance AD to 14, representing the posterior segment of the scan for operator 1 at T1, was marginally statistically significant but clinically non-significant.
This suggests that the segment location plays a role in scan accuracy. The greatest distortions are often observed in the posterior segments (Flügge et al., 2013), whereas the anterior segments display greater accuracy (Ender et al., 2016).
Flügge et al. (2013) evaluated a single participant with 10 consecutive scans and compared the accuracy of these iTero® scans with polyether casts. The casts were scanned extra-orally by an extra-oral scanner, and the intra-oral iTero® scans had the lowest accuracy. This study had statistical errors and did not have a reliable standard to evaluate accuracy.
Despite the statistically significant median distance to the prepared benchtop URA mean for some linear distances between targets (P < 0.05), the observed median distance did not exceed 0.17 mm (Table 3). Given this minimal actual difference, these findings are not clinically significant. Previous research supports this conclusion (Grünheid et al., 2014; Naidu and Freer, 2013; Wiranto et al., 2013). Therefore, the iTero scanner can be considered reliable for orthodontic diagnosis and treatment planning, producing accurate 3D representations of the dentition.
Limitations and recommendations
One limitation is the use of a single participant and a single scanner with repeated scans captured by two operators. This was a pilot study; future studies should assess the accuracy of other intra-oral scanners used in orthodontics clinically and compare them to iTero®. Accuracy of digital impressions is essential for the fabrication of various orthodontic appliances and retainers; therefore, upcoming research should take into consideration the accuracy of 3D-printed models compared to their digital models.
Conclusion
Within the limitations of this study, for diagnostic purposes and full dentition orthodontic scans, the accuracy of the iTero Element 2® is acceptable for diagnosis and appliance fabrication. The length and location of scanned segment and the scanning sequence ‘protocol’ have a great influence on accuracy of scanning with iTero®. There are some indications that smooth and regular dentate surfaces are easy to capture.
Supplemental Material
sj-docx-1-joo-10.1177_14653125241268755 – Supplemental material for Accuracy of full arch scans using the iTero Element 2® intra-oral scanner: A clinical study
Supplemental material, sj-docx-1-joo-10.1177_14653125241268755 for Accuracy of full arch scans using the iTero Element 2® intra-oral scanner: A clinical study by Sarah Abu Arqub, Amirtha Hariharan, Sina Banankhah, Lucas Da Cunha Godoy, Perian Liu, Chia-Ling Kuo and Flavio Uribe in Journal of Orthodontics
Supplemental Material
sj-xlsx-2-joo-10.1177_14653125241268755 – Supplemental material for Accuracy of full arch scans using the iTero Element 2® intra-oral scanner: A clinical study
Supplemental material, sj-xlsx-2-joo-10.1177_14653125241268755 for Accuracy of full arch scans using the iTero Element 2® intra-oral scanner: A clinical study by Sarah Abu Arqub, Amirtha Hariharan, Sina Banankhah, Lucas Da Cunha Godoy, Perian Liu, Chia-Ling Kuo and Flavio Uribe in Journal of Orthodontics
Footnotes
Acknowledgements
We would like to thank Jesse Lim at Align Technology for his help in providing data analysis.
Declaration of conflicting interests
The authors declared no potential conflicts of interest with respect to the research, authorship, and/or publication of this article.
Funding
The authors disclosed receipt of the following financial support for the research, authorship, and/or publication of this article: Align Technology.
Data availability
The data underlying this article will be shared on reasonable request to the corresponding author.
Supplemental material
Supplemental material for this article is available online.
References
Supplementary Material
Please find the following supplemental material available below.
For Open Access articles published under a Creative Commons License, all supplemental material carries the same license as the article it is associated with.
For non-Open Access articles published, all supplemental material carries a non-exclusive license, and permission requests for re-use of supplemental material or any part of supplemental material shall be sent directly to the copyright owner as specified in the copyright notice associated with the article.