
Abstract
The increasing willingness to travel as well as the increasing number of airlines create a strong competitive market in the air transport industry. In such circumstances, paying attention to the market needs is the prerequisite of the success and profitability of the company. Hence, nowadays, airlines endeavor to provide their customers with appropriate services and incentives to maintain the existing customers and attract new ones. The importance of providing appropriate incentives, on the one hand, and lack of resources, on the other, have led to airlines’ incapacity to provide good services for all of their customers. A logical solution in such a situation is to determine strategies to provide services for customers based on their value. The value model developed in this study is based on a combination of four variables, namely, relationship Length, Frequency, Distance and Recency, which is named LDcFR model. Using these variables along with the imperialist competitive algorithm clustering technique and Markov chain will determine the value of each passenger. The results of the study indicate that the LDcFR model is useful for determining the passenger value.
Keywords
Introduction
Nowadays, the passengers are the most important asset of an airline. No bright future can be thought for an airline without satisfied passengers who will remain loyal and develop their relationship. In today’s complex and competitive environment in transportation industry, airlines tend to create programs to increase the level of satisfaction, maintain the current customers and attract new ones. Customer relationship management (CRM) has been developed for this purpose. The main goal of CRM is to create a long and profitable relationship with customers. This issue has been taken into consideration by many academic and practitioner researchers, and many industries have invested in this domain (Bohling et al., 2006; Sharma and Iyer, 2007). CRM is composed of a set of processes and enabling systems which support a business strategy to build long-term, profitable relationships with specific customers (Ling and Yen, 2001; Ngai et al., 2009). This process and system can lead to an increase in customer’s satisfaction and their loyalty, which in turn can result in retaining the existing customers and attracting new ones.
Implementation CRM is more important, especially, in service industries. This is because of the fact that in these industries, customer retention is far more important than customer attraction. Due to increasing the number of the travel service providers, customer satisfaction measurement is becoming an important strategy for many companies to achieve competitive advantages.
CRM suggests organizations to constantly monitor market needs to retain the existing customers and attract new ones. Furthermore, it offers new products or services based on the market needs. By providing new products or services based on customer needs, customers will be satisfied, and this satisfaction will make them loyal customers. It is noteworthy that the organizations cannot meet the needs of all customers. To solve this problem, the customers’ clustering according to their value is employed. In this case, the organization calculates customer’s value by using their features and records, and then clusters them. The best customers of any organization are the most valuable ones whom the organization endeavors to preserve. The organization identifies the most valuable class of its customers along with their needs and determines its future strategies and goals based on the respective needs. One of the most widely used methods for determining the customer value is using the Recency, Frequency, Monetary (RFM) model.
The rest of this paper is arranged as follows: Section “Literature review” provides an overview of the related literature, Section “Methodology” presents the proposed methodology, Section “Case study” states the experimental results of the study conducted in a real environment and the last section presents the conclusions.
Literature review
In this section, the CRM-related literature including RFM and the clustering technique will be summarized. Furthermore, imperialist competitive algorithm (ICA) and its application in customer clustering will be briefly described.
RFM
RFM model.

According to the above definition, the lower the value of “Recency” and the higher the values of “Frequency” and “Monetary” are, the more valuable the customer would be.
The RFM model measure is not persistently fixed and may be changed based on the specific characteristics of every industry and may become customized. For instance, in order to determine the customers’ values in the telecommunications industry, Cheng and Sun (2012) removed R from the RFM model and expanded the TFM (Time, Frequency, Monetary) Model (Huang et al., 2012). In another study, the development of RFM model has been used to classify the patients in a dental clinic. In this paper, the variable M is removed since monetary value (i.e. the cost of hospital service) to all patients is the same and instead the LRF model is presented. Variable L, expressing length of customer relationship, is the time of first visit to the last visit.
Consequently, nowadays, this model is used in various industries such as telecommunications, medicine, textile, health & cosmetics, financial institutions, etc. to calculate customer value (Chen et al., 2012; Cheng and Sun, 2012; Khajvand and Tarokh, 2011; Li et al., 2011; Wei et al., 2012; Yeh et al., 2009).
In transportation industry, the RFM model is also used to determine the value of passengers. Chiang (2012) developed FPDN model to determine the value of passengers in air transport industry. The measures of FPDN model include: Frequency, Price Discount, Destination and No-Show. Moreover, Chiang (2014) offered FMCN model to determine the value of airline passengers. The measures of FMCN model include: Frequency, Monetary, Cancelations and Number of family members. Furthermore, in some articles like Wong and Chung (2007) and Abbasi et al. (2010), simple RFM model and clustering algorithm have been utilized to determine passenger’s value.
Clustering
Clustering is one of the data mining techniques (Ngai et al., 2009) used for grouping data with homogeneous characteristics (Niknam et al., 2011). The goal of clustering technique is to incorporate the data with the most similarity into the same group (Akhondzadeh-Noughabi et al., 2013; Berry and Linoff, 2004; Niknam et al., 2011). Generally, there are two types of methods, namely, unsupervised and supervised, for clustering items and data. In the supervised method, the number of needed clusters is determined at the beginning of the procedure, whereas in the unsupervised method, no specific information is provided for the algorithm at the beginning of the phase. One of the most well-known supervised methods is the K-means, and one of the most renowned unsupervised methods is the Self Organizing Map (SOM). The K-means method is widely used for data clustering because of its simplicity, power, and speed (Chang et al., 2010; Niknam et al., 2011). In this method, the Euclidean is usually used to determine the distance.
Despite its simplicity and power of the clustering, K-means algorithm suffers from certain problems among which the following instances can be enumerated (Ho et al., 2012; Niknam and Amiri, 2010; Niknam et al., 2011; Zhongding et al., 2009)
Its dependency on the choice of initial centers. Being influenced by the outliers.
Because of these problems, nowadays, evolutionary algorithms are used along with K-means. Due to the innovatory nature of the revolutionary algorithms, they can eliminate the above mentioned problems. A new evolutionary algorithm with high accuracy and speed is ICA that has been widely used in clustering processes.
Imperialist competitive algorithm
ICA is a kind of evolutionary algorithms that was introduced by Atashpaz-Gargari and Lucas (2007). ICA is inspired from the socio-political process to solve optimization problems in the real world (Gargari et al., 2008; Kaveh and Talatahari, 2010; Niknam et al., 2011; Rajabioun et al., 2008; Roshanaei et al., 2008). By emulating the countries’ social, economic and political process of evolution and by mathematically modeling of this process, this algorithm presents regular operators in the form of algorithm that can help to solve the complex problems of optimization.
Like other evolutionary algorithms, ICA algorithm also begins with forming a set of initial potential answers. In ICA, each of the initial answers is called a “country.” ICA aims to improve the countries and find the optimal answers. To achieve this goal, a specific process will be carried out within the algorithm. The main functions of this algorithm are assimilation policy, imperialist competition and revolution.
Niknam et al. (2011) combined ICA and K-means algorithm and developed a new approach (K-MICA) for clustering in which the problems of K-means algorithm have been resolved.
By comparing the results obtained from the developed algorithm with those of the other available algorithms, Niknam et al. (2011) showed that the K-MICA algorithm is faster and more accurate than the other algorithms. Hence, in this paper, the same method will be used in customers clustering.
Markov chain
A Markov chain is a probabilistic process that used to represent correlations between successive observations of a random variable. This sequence analysis process is a form of time-series modeling and was introduced at the beginning of the 20th century by Andrej Markov. Markov chain process has the memoryless property. Memoryless property in Markov chain means that the predicted state of the system only depends on the current state and earlier does not depend on the states. Equation (1) shows Markov chain Forgot property

One of the main applications of Markov chain is the probability of transition from one stage to the next step in the process. This chain, with review the past state of process, estimates the future possible states.
Methodology
In this section, a new methodology is presented based on RFM attributes and ICA to achieve the effective management of passengers in the airline industry. This framework is composed of three parts. In the first step, the RFM model is developed based on the characteristics of the transport industry, and in the second step, the clustering process will be carried out. In the last step, the Markov chain will be used in determining the passengers’ prospective value.
RFM model development
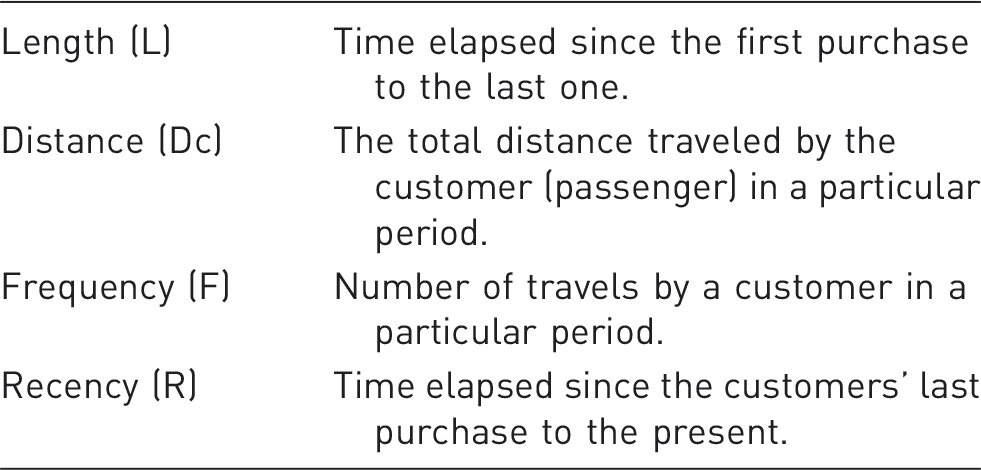
LDcFR model variables.
As the definitions of the LDcFR model indication (Table 2), the monetary variable has been removed from the set of the RFM variables. Instead, Dc and L variables are replaced. The reason for this omission is the dynamicity and instability in the price of the ticket sales. Dynamicity and instability in price of airline ticket sales may be appeared in two forms:
Price dispersion in similar flights: Similar flights those that have the same origin and destination, but they can be done in various dates. In such conditions, the ticket price is subject to different factors such as “fuel price,” “degree of demand,” “seasonal conditions,” “market conditions,” etc. (Bisignani, 2010; Fedorco and Hospodka, 2013). Price dispersion in the same flight: The “A flight price dispersion” refers to the non-uniformity of ticket prices for passengers during a specific flight. This instability of price in a flight can occurs due to different factors such as “difference in value of the passengers,” “capacity constraints,” “time of ticket purchasing,” etc. (Alderighi et al., 2011; KNEWS, 2013; Lindenmeier and Tscheulin, 2008).
There are also some other strategies for determining the ticket price which are used by different airline companies with respect to their particular circumstances. For instance, Samoa Air Airline Company determines its ticket prices according to the weight of the passengers and their luggage.
In such conditions, not only the prices vary from one airline to another but also the prices are different within an airline in different situations. Considering such conditions, it seems that the monetary variable cannot be an appropriate criterion for determining the value of passengers.
An important factor that can have a significant effect on the value of passengers is distance criterion. This criterion represents the distance traveled by passengers using the airline. Higher values of “Distance” indicate that the passenger is more valuable. What is important is the impact of flight’s class in calculating distance criteria. Class of travel is a term that refers to the amount of services provided and the passenger’s comfort during the trip. Class of travels are different from one another based on different factors such as the space of seats, number of flight attendants, flight attendants’ ability and commitment, the hospitality, entertainment services, etc. The more the level and quality of service offered and the more convenience provided to the passengers, the more expensive the ticket price would be. Thus, in order to normalize the travel distance with the effect of travel class, in present study, Dc measure is suggested as combination of distance and class of travel. Consequently, the “Dc” variable is calculated as follows

On the other hand, one of the problems of the RFM model is that it cannot distinguish the new customers from the regular ones (Reinartz and Kumar, 2000). The length variable means: “The days from the first visit date to the last visit date” (Reinartz and Kumar, 2000). Failure of considering the length (L) of the customer’s relationship with the organization caused problems in results of regarding the customer value. Such problems can induce more failures mainly in transportation industry where receiving services is not permanent. Thus, in most studies conducted on customer value, the length variable is also used along with other variables.
At the end of this section, it is worth mentioning that due to the specific characteristics of the transportation industry, LDcFR model is more comprehensive than the other models.
Clustering
Determining the variables L, Dc, F and R for each passenger cannot making sense for the respective airline company. Airlines are always seeking to identify groups of target customers for whom they can provide appropriate services. To achieve this goal, customer clustering has been introduced as effective and commonly used technique. As stated previously, the most popular and widely used algorithm for clustering process is K-means. Due to K-means problems, nowadays, this algorithm is used along with evolutionary algorithms. Since ICA is one of the fastest and most accurate evolutionary algorithms, it will be used for the purpose of passenger clustering in the present study.
Value extraction
Although RFM model has a great deal with determining the value of customers, this model works based on customers’ past transactions. RFM model cannot be a useful model in determining the value of customers unless the customer’s future behaviors are similar to their past behaviors. Accordingly, in order to determine the prospective valued customers, their future must be specified.
One of the most widely used methods in predicting the future behaviors of customers is Markov chain. Markov chain is a discrete random spatial process with a memoryless property. Memoryless characteristic of the Markov chain is indicative of the fact that: the prediction of the future states merely depends on the current states of the system and not on the past sequence of events and states. In what follows, the procedures of using Markov chain method in predicting variables of distance (Dc), frequency (F), Recency (R) and length (L) are explained.
Passenger’s Past transactional data are clustered with K-MICA algorithm, and cluster centers are determined. The transition matrix is made with the placement of the cluster centers as transitions in matrix. The transition matrix is formed:
3-1. All matrix elements are made zero. 3-2. Passenger’s new transactional data are clustered. 3-3. For each change in the status of each passenger in the new clusters compared to the old clusters, one unit of value is added to the corresponding element in the matrix. The matrix is normalized in order to determine transition probabilities. The future state of LDcFR variables is be predicted for each passenger. The future value of each passengers is calculated based on the weighted RFM method (equation (3)).

In equation (3), the w1, w2, w3 and w4 are the weights of each of variables that are calculated using techniques such as analytic hierarchy process (AHP) and Technique for Order Preference by Similarity to Ideal Solution (TOPSIS), etc.
The expected value of each customer is calculated using the equation (4).

In equation (4), “value” refers to the weighted RFM value, “P” represents the transition probabilities, “δ” is the yearly discount rate and “t” is the horizon (in years).
Based on above descriptions, the final framework is shown in Figure 1.
Final framework.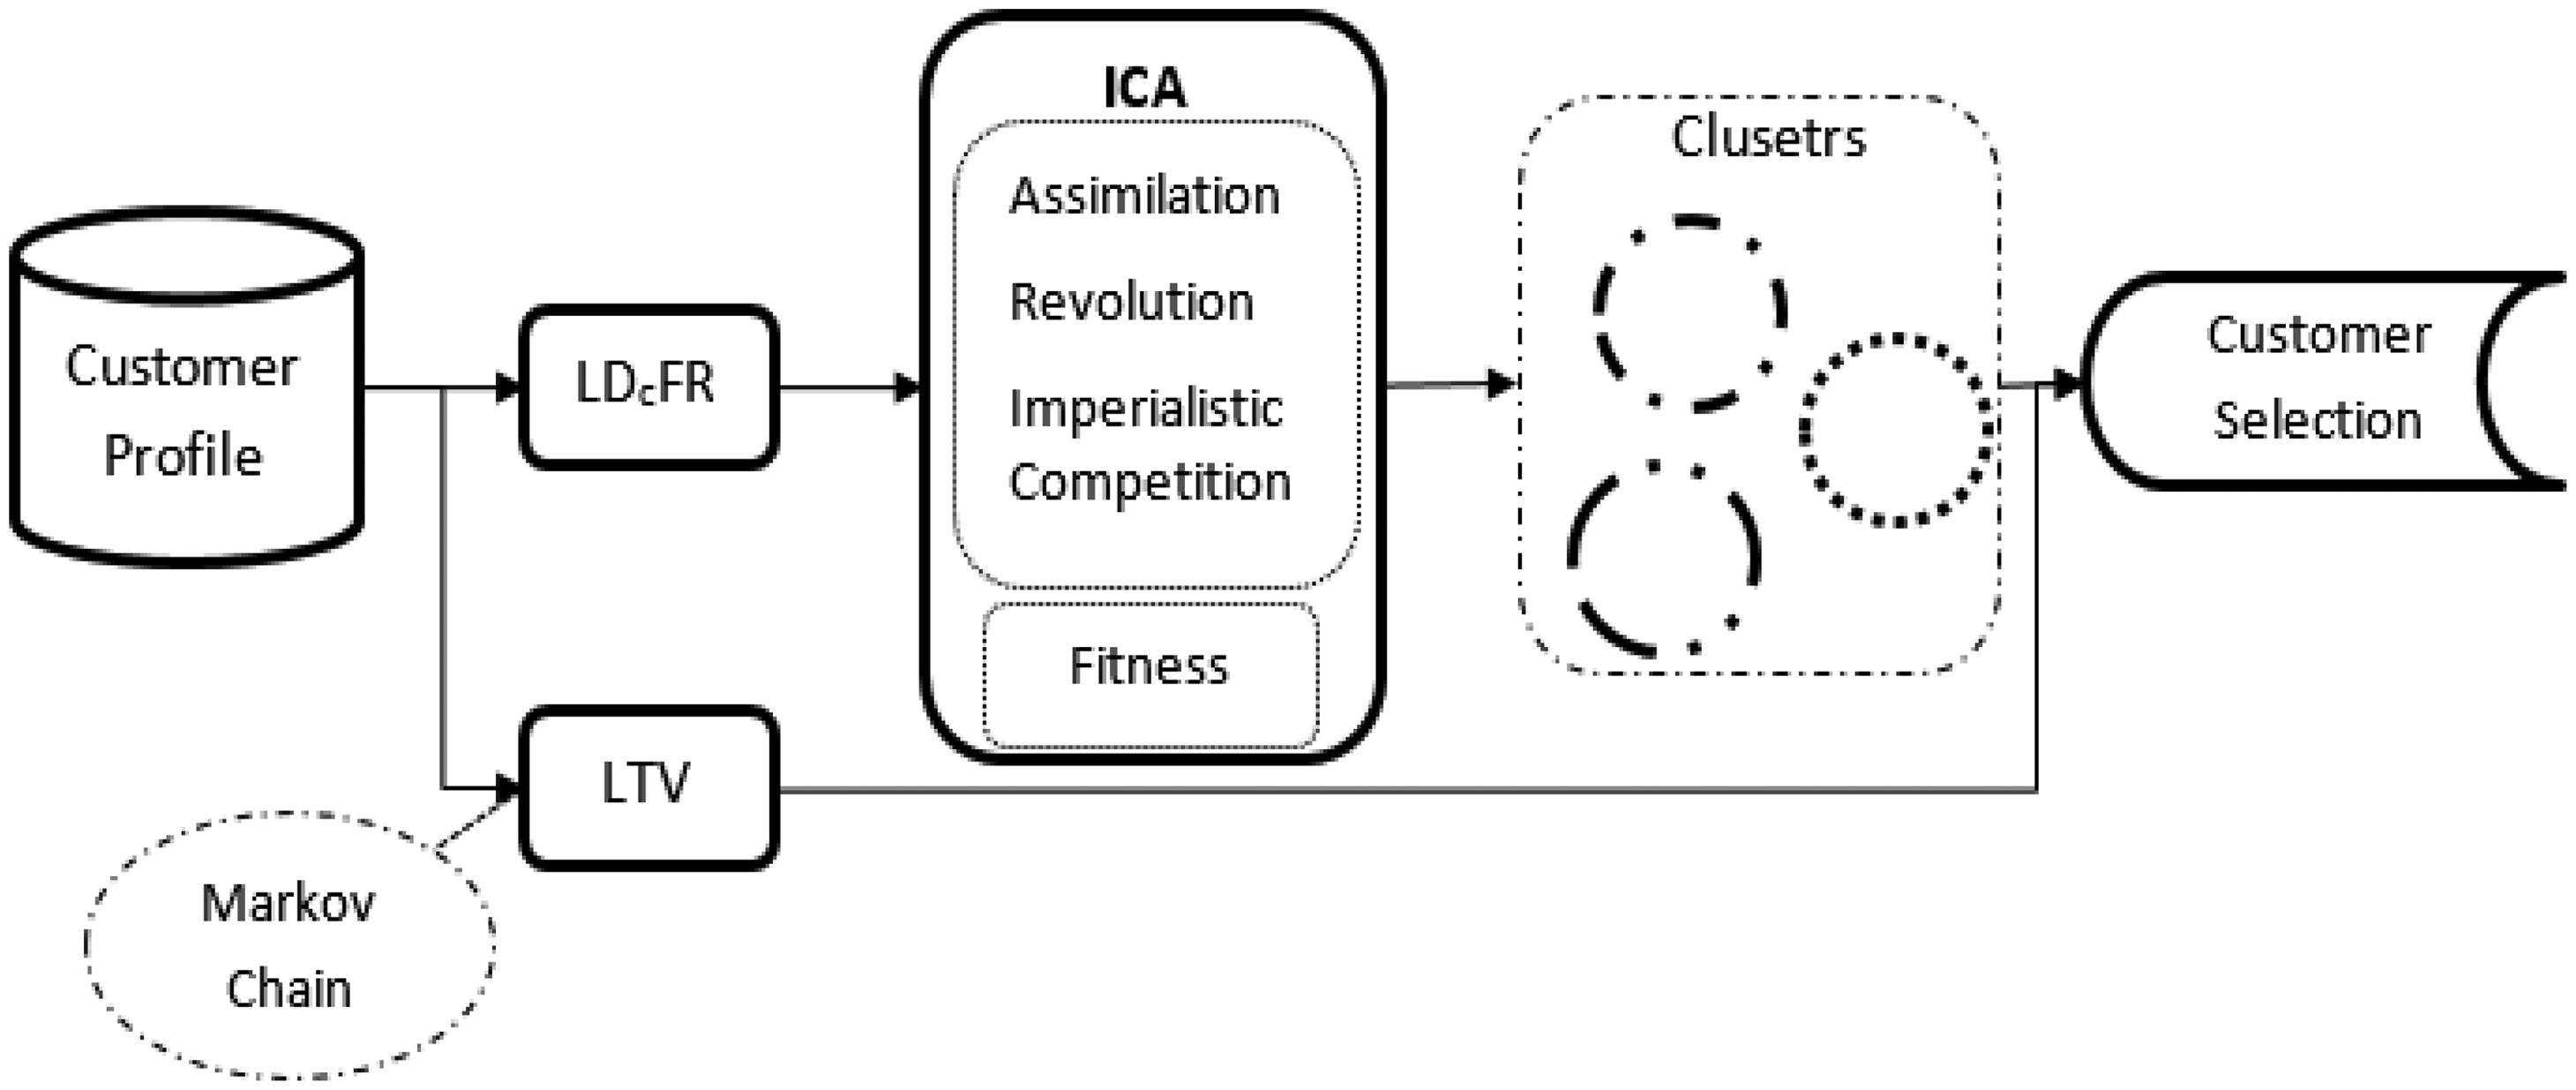
Case study
The proposed methodology was applied to the case of southwest airline’s passenger. The application of the methodology and results are summarized in this section.
Data description
The respective dataset consisted of 37 felids and 32,157 transaction records from 1369 Southwest airline’s passengers in 2011 and 2012.
Data selection and preprocessing
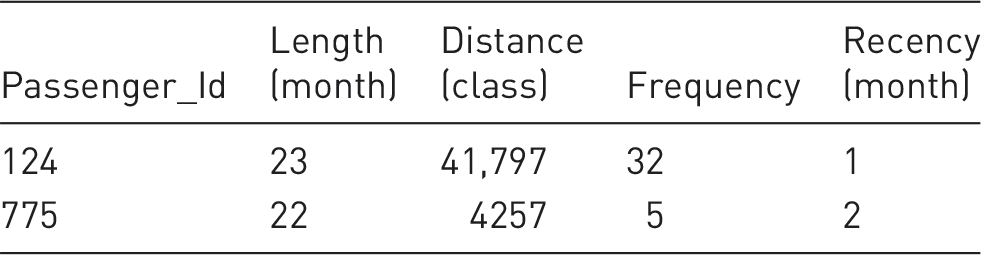
An example of the selected data.
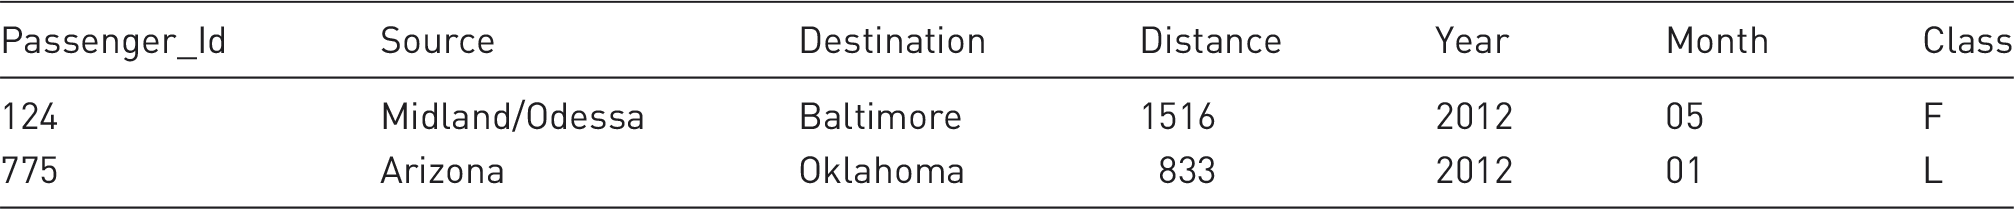
From this dataset, passengers’ transaction data in 2012 were separated and determined as the original data in calculating passengers’ value process and passengers’ transaction data in 2011 were used in building the transition matrix.
Data preparation
Calculating method model variables.
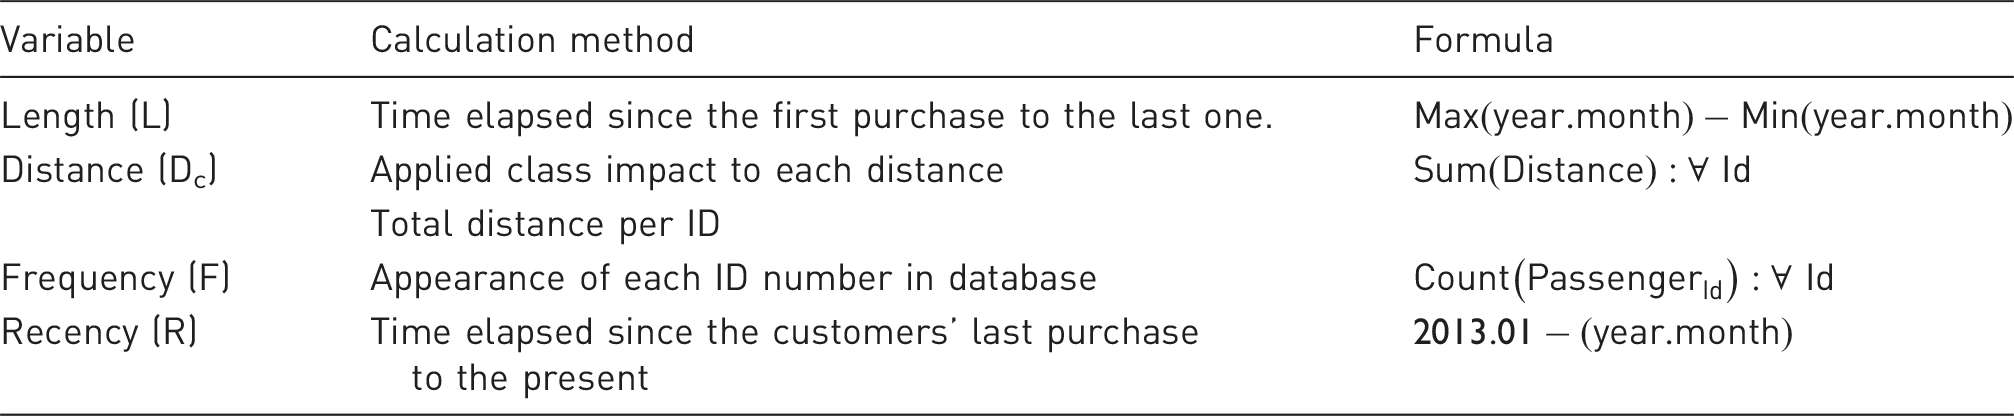
In calculating the Recency, since the time interval was defined between January 2012 and December 2012, the January 2013 was considered as the present date, and Recency value per customer was calculated by subtracting this date from the last purchase.
Clustering process
The purpose of this section is to demonstrate the clustering process with K-MICA methods and explain the results.
Knowing the number of clusters in the clustering process is very important. Determining the number of clusters is possible with both methods, namely, expert opinion and statistical indicators. In this study, to determine the exact number of clusters, the Silhouette index
1
(statistical index) was used. The results of calculating Silhouette index for 3 to 10 clusters are illustrated in Figure 2. As shown in Figure 2, the index value in four clusters is greater than other numbers, thus the optimal number of clusters was set to 4.
Comparison of the Silhouette width for different number of clusters.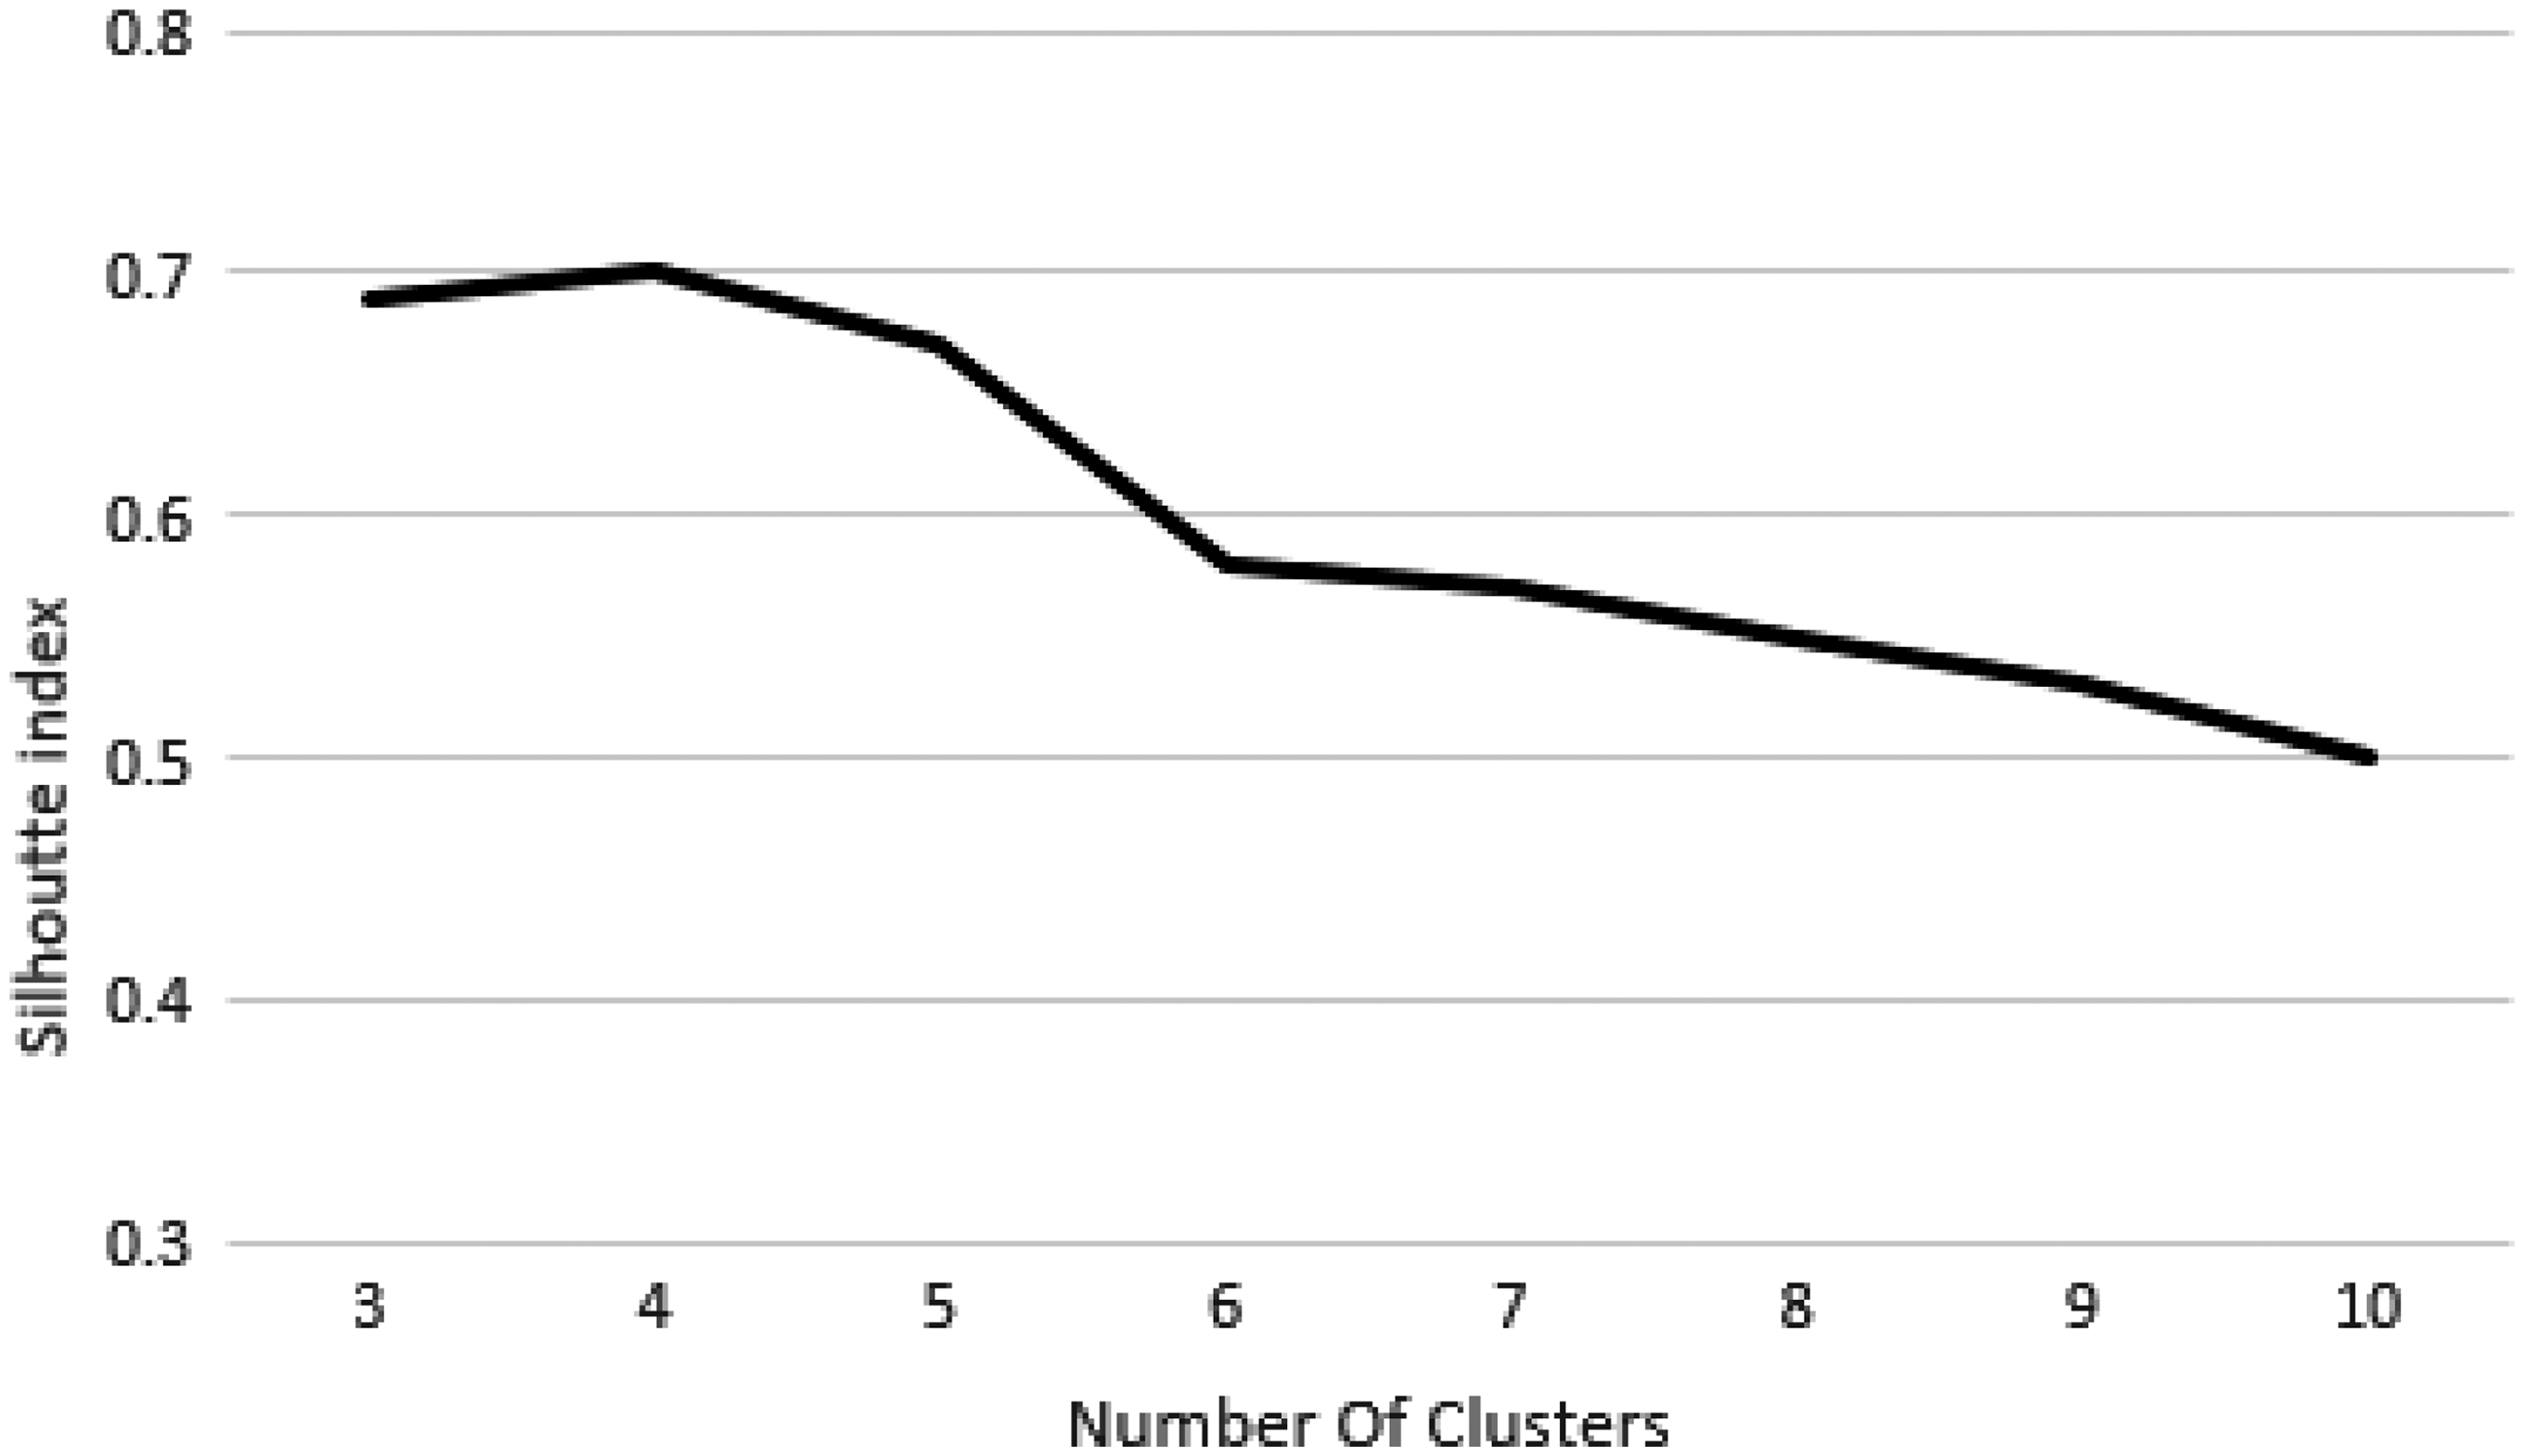
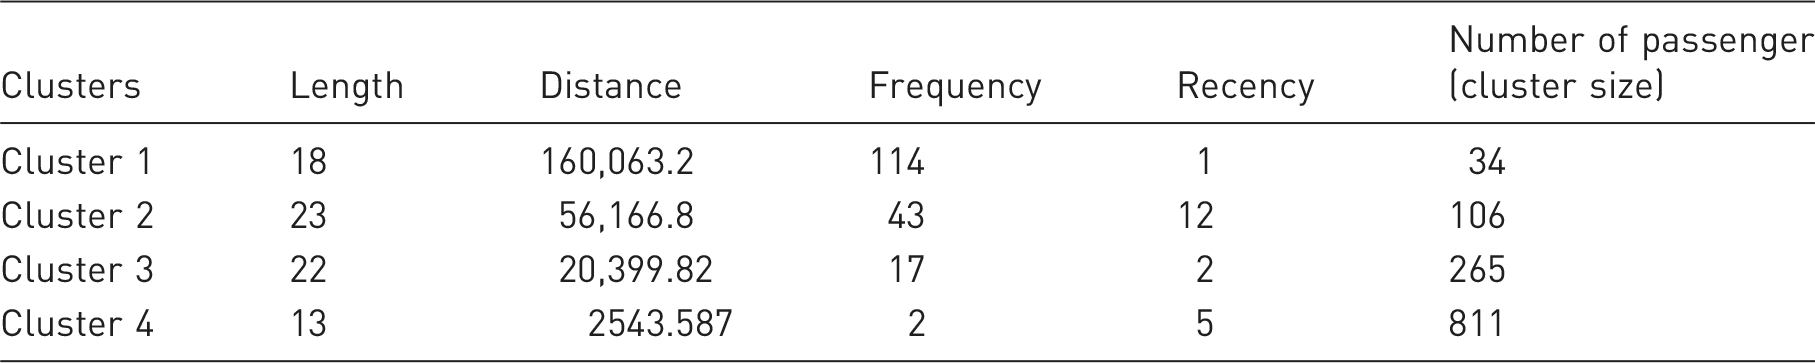
The centers of clusters.
Expected value
The transition matrix.
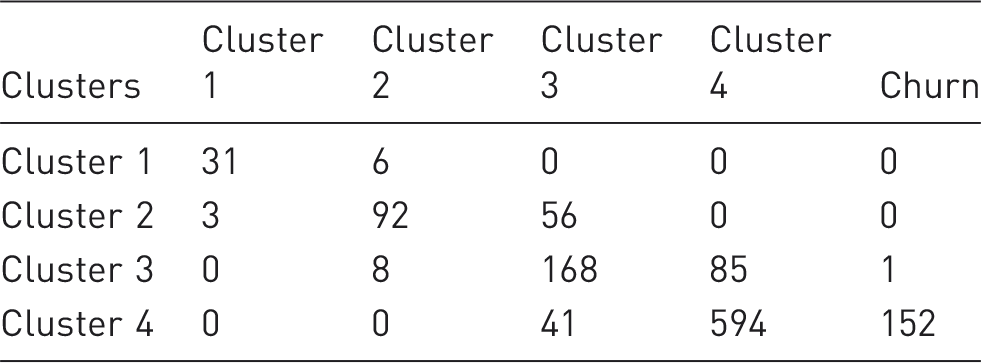
For instance, Table 7 indicates that three passengers who were in cluster 2 of the clustering transactions in 2011 have shifted to cluster 1 of the clustering transactions in 2012. With normalized results are shown in Table 7, the transition probabilities will be determined. The normalized results are shown in Figure 3.
The transition probabilities.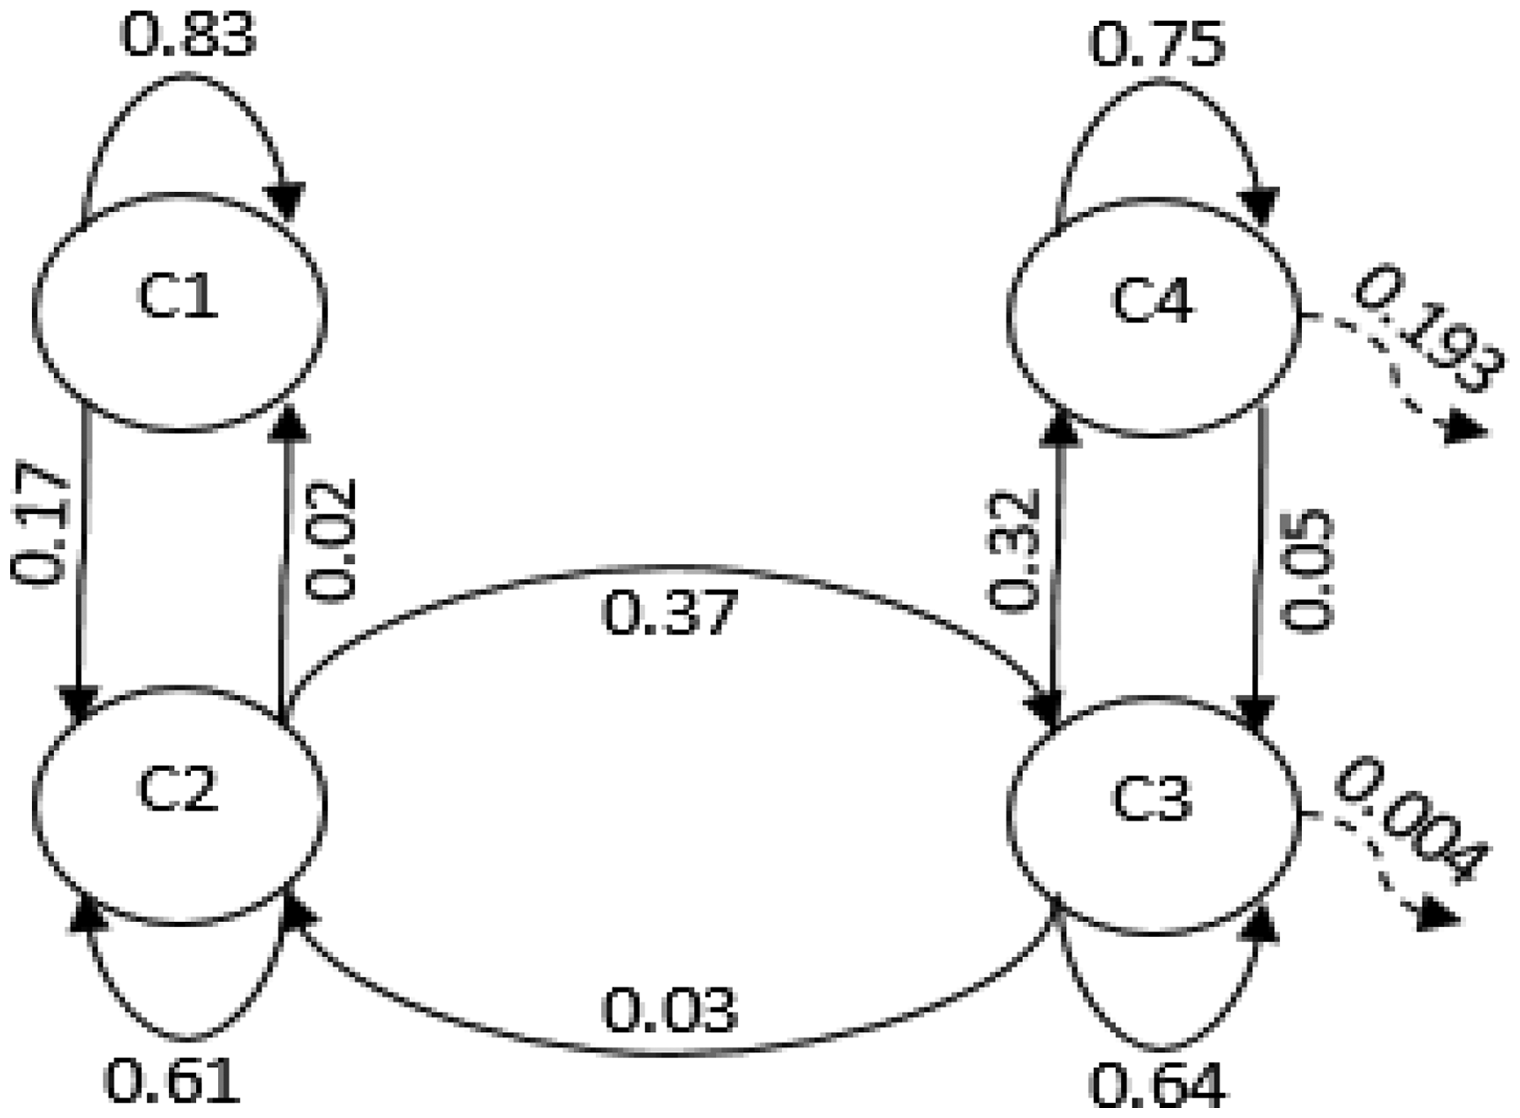
Variable weight based on AHP.
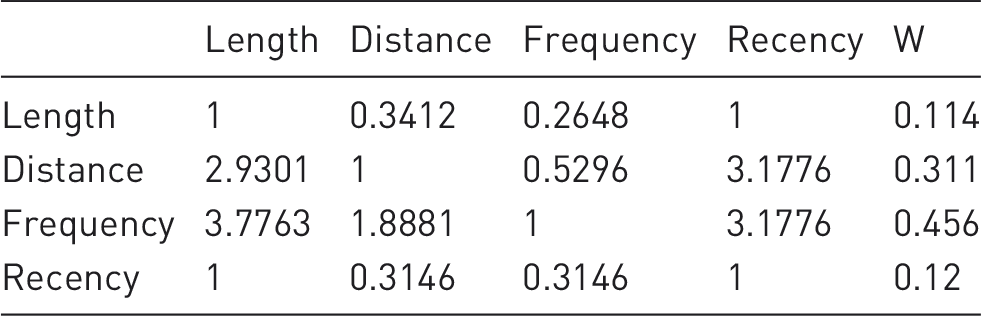
As shown in Table 8, from the perspective of airlines managers, the “Frequency” is the most valuable factor, and the “Distance” is the second important factor.
Practical implementation
Ranking the clusters.
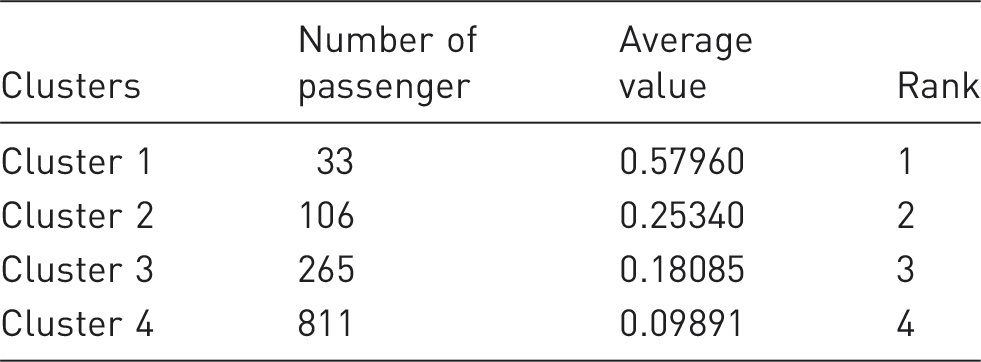
As shown, 33 passengers in cluster 1 are among the most valuable airline passengers for whom guarding strategies should be designed to protect them. This cluster of passengers will be highly profitable in the future. Passengers in clusters 2 and 3 are relatively valued, thus the company should pay more attention to them in order to increase their loyalty and profitability. More attention to these passengers can improve the airline’s position in the competitive market.
Validating the model
Clusters pattern.
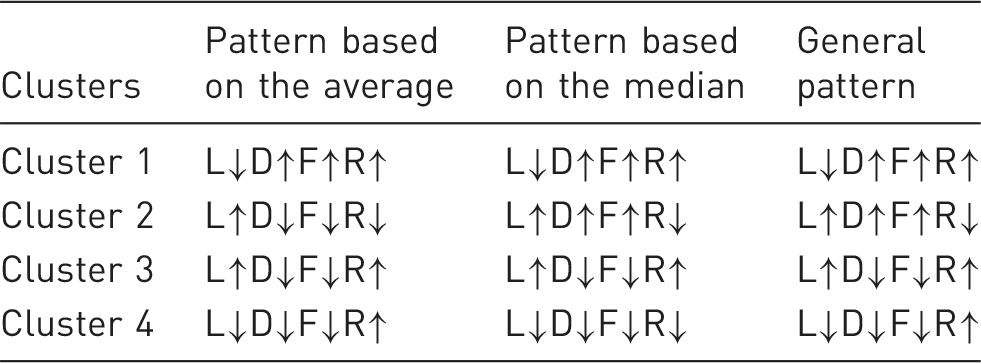
According to the patterns shown in Table 10, it can be concluded that the expert opinions regarding the value of the passengers have been approved in clusters results, which verify the proposed model.
Conclusion
The main purpose of this paper was to propose a comprehensive model to determine the value of customers in transportation industry. The value-prediction model developed in this study was made based on the combination of four variables, namely, “Length,” “Frequency,” “Distance” and “Recency” that has been named as LDcFR model. Unlike the other RFM-based models, in LDcFR, the “monetary value” is not directly used; because of dynamicity and instability in price of the ticket sales.
Although RFM model is one of the most well known and popular models in determining the customers’ value, using this model independently cannot be of great help to industry. This is due to the tendency of companies to develop limited strategies. Accordingly, in this paper, the ICA was used in clustering process of passengers. The rationales behind using ICA have been its high speed and accuracy.
Although RFM model has a great deal of power in determining the value of customers, this model works based on customers’ past transactions. Accordingly, in order to determine the prospective valued customers, their future behaviors must also be taken into account. Therefore, Markov chain was employed in the present study to predict the future transactions of the passengers. The expected value of each customer was calculated based on this prediction. Validity assessment results demonstrate the accuracy and correctness of developed method.
The aggregated results of the study are indicative of the fact that LDcFR model enjoys a high degree of accuracy. In addition to its accuracy, this model has higher speed compared to the other models, which is due to using ICA.
Footnotes
Declaration of conflicting interests
The author(s) declared no potential conflicts of interest with respect to the research, authorship, and/or publication of this article.
Funding
The author(s) received no financial support for the research, authorship, and/or publication of this article.