
Abstract
The gas-phase structure of protonated β-methylaminoalanine was investigated using infrared multiple photon dissociation spectroscopy in the C–H, N–H, O–H stretching region (2700–3800 cm−1) and the fingerprint region (1000–1900 cm−1). Calculations using density functional theory methods show that the lowest energy structures prefer protonation of the secondary amine. Formation of hydrogen bonds between the primary and secondary amine, and the secondary amine and carboxylic oxygen further stabilize the lowest energy structure. The infrared spectrum of the lowest energy structure originating with harmonic density functional theory has features that generally match the positions of the experimental spectra; however, the overall agreement with the experimental spectrum is poor. Molecular dynamics calculations were used to generate a gas-phase infrared spectrum. With these calculations a reasonable match with the experimental spectrum, especially in the high-energy region, was obtained. The results of the molecular dynamics simulation support the density functional theory calculations, with protonation of the secondary amine and the formation of a hydrogen bond between the protonated secondary amine and the primary amine. This work shows the importance of accounting for anharmonic effects in systems with very strong intramolecular hydrogen bonding.
Keywords
Introduction
β-methylaminoalanine (BMAA, Scheme 1) is a naturally occurring, nonproteinogenic amino acid and has been speculated to be a contributing factor in amyotrophic lateral sclerosis, Parkinson's disease, and other related forms of neurological diseases.1–5 BMAA has been the topic of much research, as some studies show it may be produced by cyanobacteria. These organisms are ubiquitous in most environments and have the potential to cause harm to human populations.6–11 BMAA is also thought to bioaccumulate and may be found in animals or fish commonly eaten by humans.3,4,12,13
B-methylamino-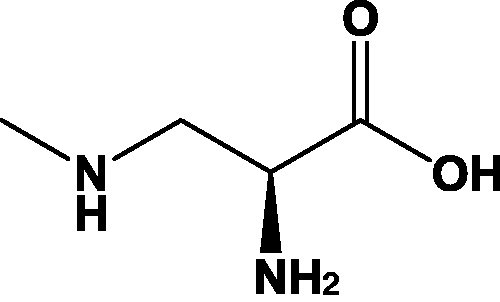
While many early studies on BMAA have found it in a wide variety of environments and tissue samples, including human nervous tissue, research has also shown that BMAA detection is complicated by several factors, most notably separation of BMAA from its isomers and complications due to the sample matrix.11,14–19 This may result in false positives, leading to the thought that BMAA is more relevant in neurological disorders than it actually is. In marine environments, BMAA was also found to be produced by diatoms and can be found commonly in shellfish that feed on these diatoms.14,20–22 Conflicting analytical data likely arise due to methodology and a lack of understanding of the physical properties of BMAA. While progress has been made on better methods for BMAA analysis, there has been little work done on its basic structure or energetics. Some work on eliminating matrix effects in BMAA detection, such as cleanup methods using solid-phase extraction and differential mobility spectrometry for isotope separation, has been conducted.14,15 The effects of metal ions, such as sodium or zinc, in the sample matrix have also been examined, though this work did not fully examine the gas-phase structures or chemistry of the observed complexes. 23 These studies show that there can be problems with detection of BMAA due to the interference of other isotopes or metals in the sample matrix which have not been fully explored.
Mass spectrometric techniques are widely used to elucidate the gas-phase structures and energetics of many different systems and have been very successful in biologically relevant systems. Spectroscopy can also be coupled with ion trap mass spectrometers for structural analysis by generating a vibrational spectrum using a tunable infrared laser. The hydrogen bonding environment of the molecule is of interest, as these interactions are important for relatively strong bonding in biological systems.24–28 Additional use of computational techniques has been used to find possible structures of systems with proton bonding, as well as their energetics. While normal harmonic approximation methods usually work for infrared spectra comparison, problems can arise in systems that have strong anharmonic interactions, such as in the case of a strong hydrogen bond. These can be better represented by using molecular dynamics (MD) calculations which have been shown to give accurate representation of such strongly proton-bound systems.29–32 In this work protonated BMAA complexes are studied in the gas phase by infrared multiple photon dissociation (IRMPD) spectroscopy in both 2700–3800 and 1000–1900 cm−1 regions, sustained off resonance irradiation collision-induced dissociation (SORI-CID), and computational methods. Comparison of the IRMPD spectra with calculated IR spectra is used to identify the most likely structures.
Methods
Experimental
Experiments were performed on two different Bruker Apex Qe7 FTICR mass spectrometers, one in the Laboratory for the Study of the Energetics, Structures, and Reactions of Gaseous Ions at Memorial University of Newfoundland (MUN) and one at the Centre Laser Infrarouge d'Orsay (CLIO), in France. Ions were generated by electrospray ionization of a dilute aqueous BMAA solution in a 50/50 methanol/water (18 MΩ cm Millipore) solvent prepared using 100 µl of 10 mM BMAA diluted to 1 ml. The spray capillary was 150℃ and desolvated ions were transferred to the hexapole where they were accumulated for 2 s prior to being transferred and isolated in the FTICR. Low-energy SORI-CID under the presence of argon gas (∼10−6 mbar) is used to elucidate the unimolecular chemistry of these ions.
Structural information is obtained from IRMPD spectroscopy in the 2700–3800 cm−1 range using an optical parametric oscillator (OPO) laser (LaserSpec, 500 mW) at MUN, which can be tuned from 1.4 to 4.5 µm over 2 cm−1 intervals with an irradiation time of 2 s. In the 1000–1900 cm−1 range, spectra are acquired using the CLIO free electron laser (FEL), scanned at 5 cm−1 intervals with 1 s irradiation times. The CLIO FEL laser power was on average 1 W over the fingerprint region. The experimental spectra were obtained by plotting the IRMPD efficiency versus the laser radiation wavenumber. The IRMPD efficiency is defined as
Computational methods
Computational work was done using the Gaussian 09 package. 33 Structures were optimized and their infrared spectra were computed using density functional theory (DFT) with the B3LYP functional and 6-311++G(d,p) basis set. 298 K enthalpies and Gibbs energies, relative to the lowest energy structure found, are derived from the electronic energies as well as unscaled thermal components from the frequency calculations. Computed harmonic frequencies were scaled by 0.955 and 0.975 in the 2700–3800 and 1000–1900 cm−1 regions, respectively, to improve the harmonic approximation prediction of the vibrational spectrum and generate a better match with experimental results. Spectra were convoluted with a Lorentzian profile with full width at half max of 10 cm−1.
MD
Car–Parrinello MD 34 simulations were performed using the BLYP functional with library Troullier–Martins pseudopotentials. 35 A cell with 18.0 Å 2 was used along with the typical options for an isolated molecule, in particular, the Poisson equation solver for an isolated system was enforced using the method by Martyna and Tuckerman. 36 The MD trajectory was divided into two parts: the first part was obtained in NVT conditions (constant number, volume, and temperature), using a Berendsen thermostat at 300 K and was propagated for 16 ps with 2.0 a.u. timestep (1 a.u. = 0.0242 fs). The second part was performed in the NVE ensemble (constant number, volume, and energy), for total simulation time of 12 ps with 3.0 a.u. timesteps. The dipole of the molecule during both portions of the dynamics has been calculated using the Wannier centers and the positive charges of the ions. The dipole as a function of time was autocorrelated and the result was Fourier transformed to obtain the IR spectrum. In the following, the IR spectrum as obtained from the NVE portion of the trajectory is presented. In order to account for the well-known effect due to the massive Car–Parrinello electrons, the theoretical spectra have been blue-shifted by 90 cm−1. 37 The plane-waves cutoff was 110 a.u. in the CPMD simulations.
We have propagated the dynamics of three different initial structures: a minimum structure corresponding to the protonated primary amine, a minimum structure corresponding to the protonated secondary amine, and a third conformer that was chosen to represent a structure without N–H···N hydrogen bonding.
Results and discussion
Experimental results
The only observed fragmentation pathway from SORI-CID for [H(BMAA)]+, m/z 119, is the loss of 17 Da (NH3) producing an ion at m/z 102 (Figure 1). When irradiated with the OPO laser, the loss of NH3 was also observed. Depending on the frequency of the laser, a secondary loss of 18 Da (H2O) forming m/z 84 was also observed. The m/z 84 ion is formed during IRMPD activation with 3560 cm−1, O–H stretching, since the fragment at m/z 102 also absorbs at this frequency; it is not observed during IRMPD activation with 3420 cm−1 because this is the NH2 antisymmetric stretch of the primary amine and m/z 102 has lost this functionality. The m/z 84 ion is also not observed during SORI-CID since only m/z 119 is activated in the process and the m/z 102 fragment is formed without enough energy to undergo further dissociation. The loss of NH3 from [H(BMAA)]+ is consistent with observations for low-energy collision-induced dissociation performed by other groups.14,15 The other low intensity signals in the mass spectra between 70 and 110 are artifacts and are always present.
Comparison of the SORI-CID mass spectrum and the IRMPD (3560 and 3420 cm−1) mass spectra. IRMPD: infrared multiple photon dissociation; SORI-CID: sustained off resonance irradiation collision-induced dissociation.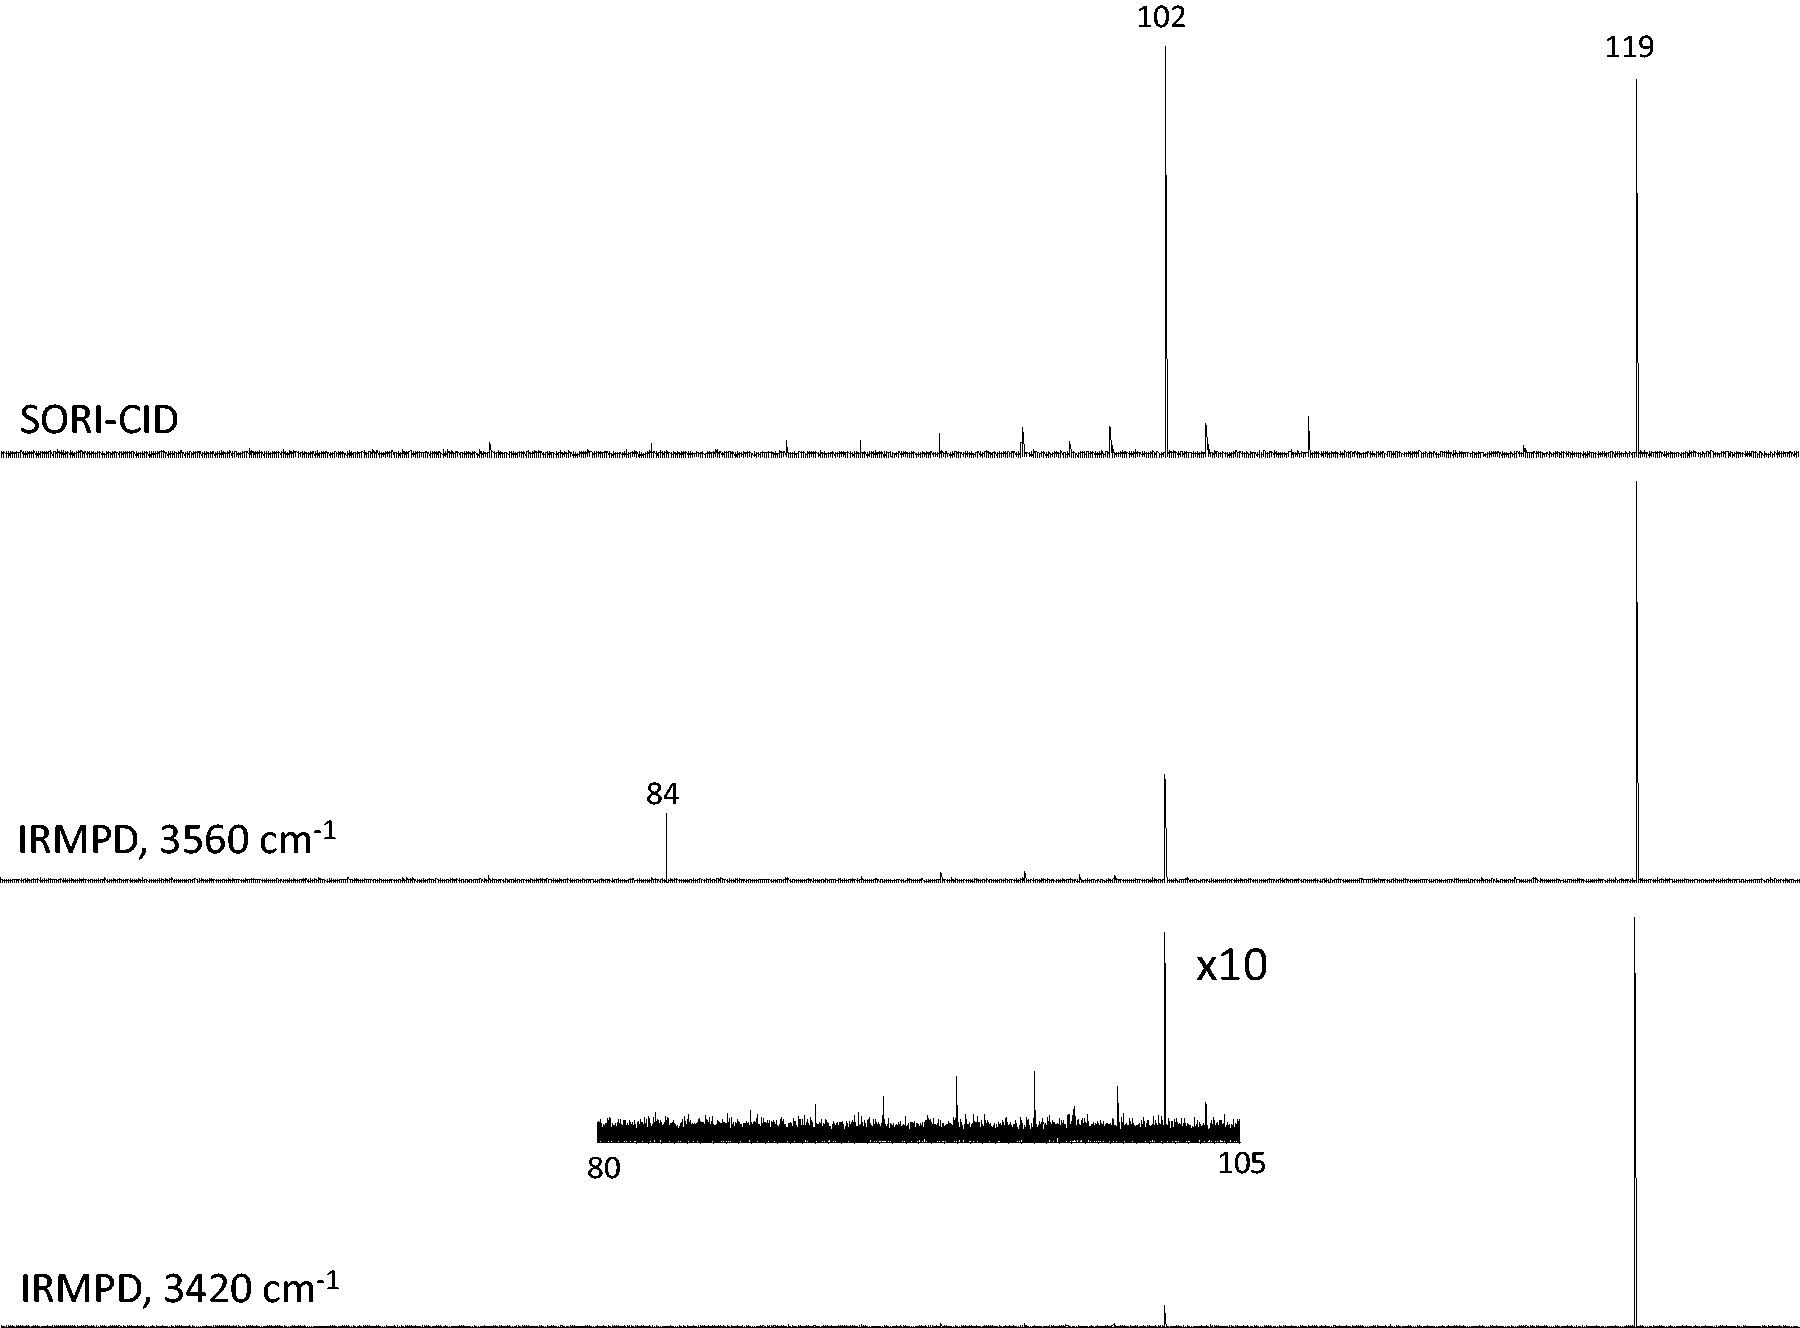
The experimental IRMPD spectra of [H(BMAA)]+ in the 2700–3700 cm−1 region and the 1000–1900 cm−1 region are shown in Figure 2, the top traces. A strong O–H stretch is observed around 3560 cm−1 while resolved N–H antisymmetric stretching is observed at around 3430 cm−1.
38
There is also a very broad absorption spanning the 3360–3000 cm−1 region indicating strong intramolecular hydrogen bonding.
39
The IRMPD spectrum in the 1000–1900 cm−1 range shows weak bands at 1755 and 1412 cm−1, as well as a strong band at 1150 cm−1.
Comparison of the experimental IRMPD spectra with the calculated spectra of the four lowest energy structures from Figure 3. The top traces are the experimental spectra, the calculated spectra are ordered from lowest to highest energy, top to bottom. IRMPD: infrared multiple photon dissociation.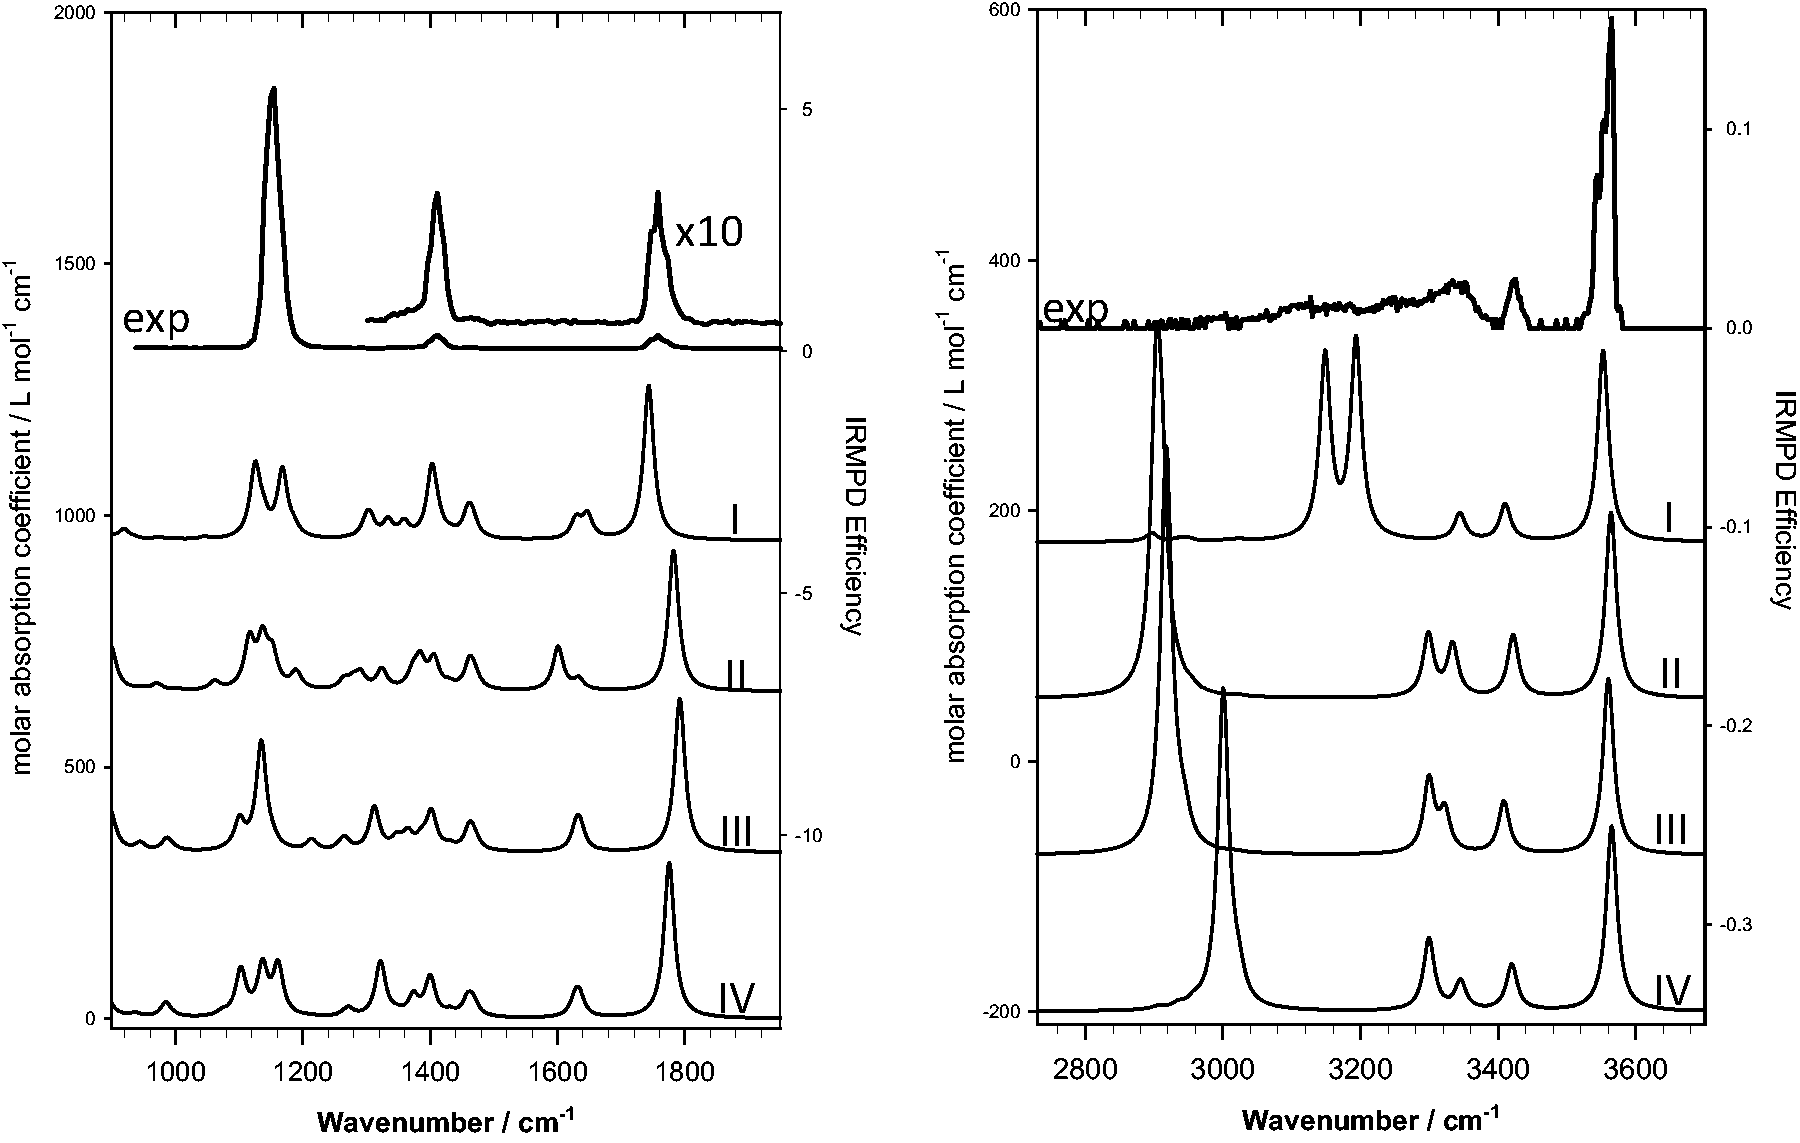
Calculated structures of [H(BMAA)]+
Figure 3 shows the six lowest energy structures found for [H(BMAA)]+. Of the 12 unique structures obtained from our calculations (see also Figure S1), the four lowest energy structures are within 13 kJ mol−1 in Gibbs energy. All but five of the 12 structures are protonated at the secondary amine, including the four lowest energy structures. In the lowest energy structure (I), both hydrogens on the protonated secondary amine are taking part in intramolecular hydrogen bonds: one with the primary amine, and one with the carbonyl of the carboxylic acid group. In the second lowest energy structure (II), the carboxylic acid group has been rotated so that instead of hydrogen bonding with the secondary amine it is hydrogen bonding with the primary amine. This change results in a structure that is 11.8 kJ mol−1 higher in energy (10.4 kJ mol−1 higher in Gibbs energy) than the previous structure. Structure III is computed to be only 1.0 kJ mol−1 higher in energy (0.4 kJ mol−1 in Gibbs energy) than II and only differs by a change in the NCCN dihedral angle simply resulting in a change in the secondary N–H that is the hydrogen bond donor to the primary amine. Structure IV is related to structure III, with the carboxylic acid group rotated resulting in an interaction between the hydroxyl oxygen and a primary amine hydrogen and is higher in energy by 4.0 kJ mol−1 than III (2.1 kJ mol−1 in Gibbs energy).
Comparison of the six lowest energy structures of [H(BMAA)] + from DFT calculations using the B3LYP functional and 6-311++G(d,p) basis set. Relative 298 K enthalpies and Gibbs energies are in kJ mol−1 relative to the lowest energy structure, I.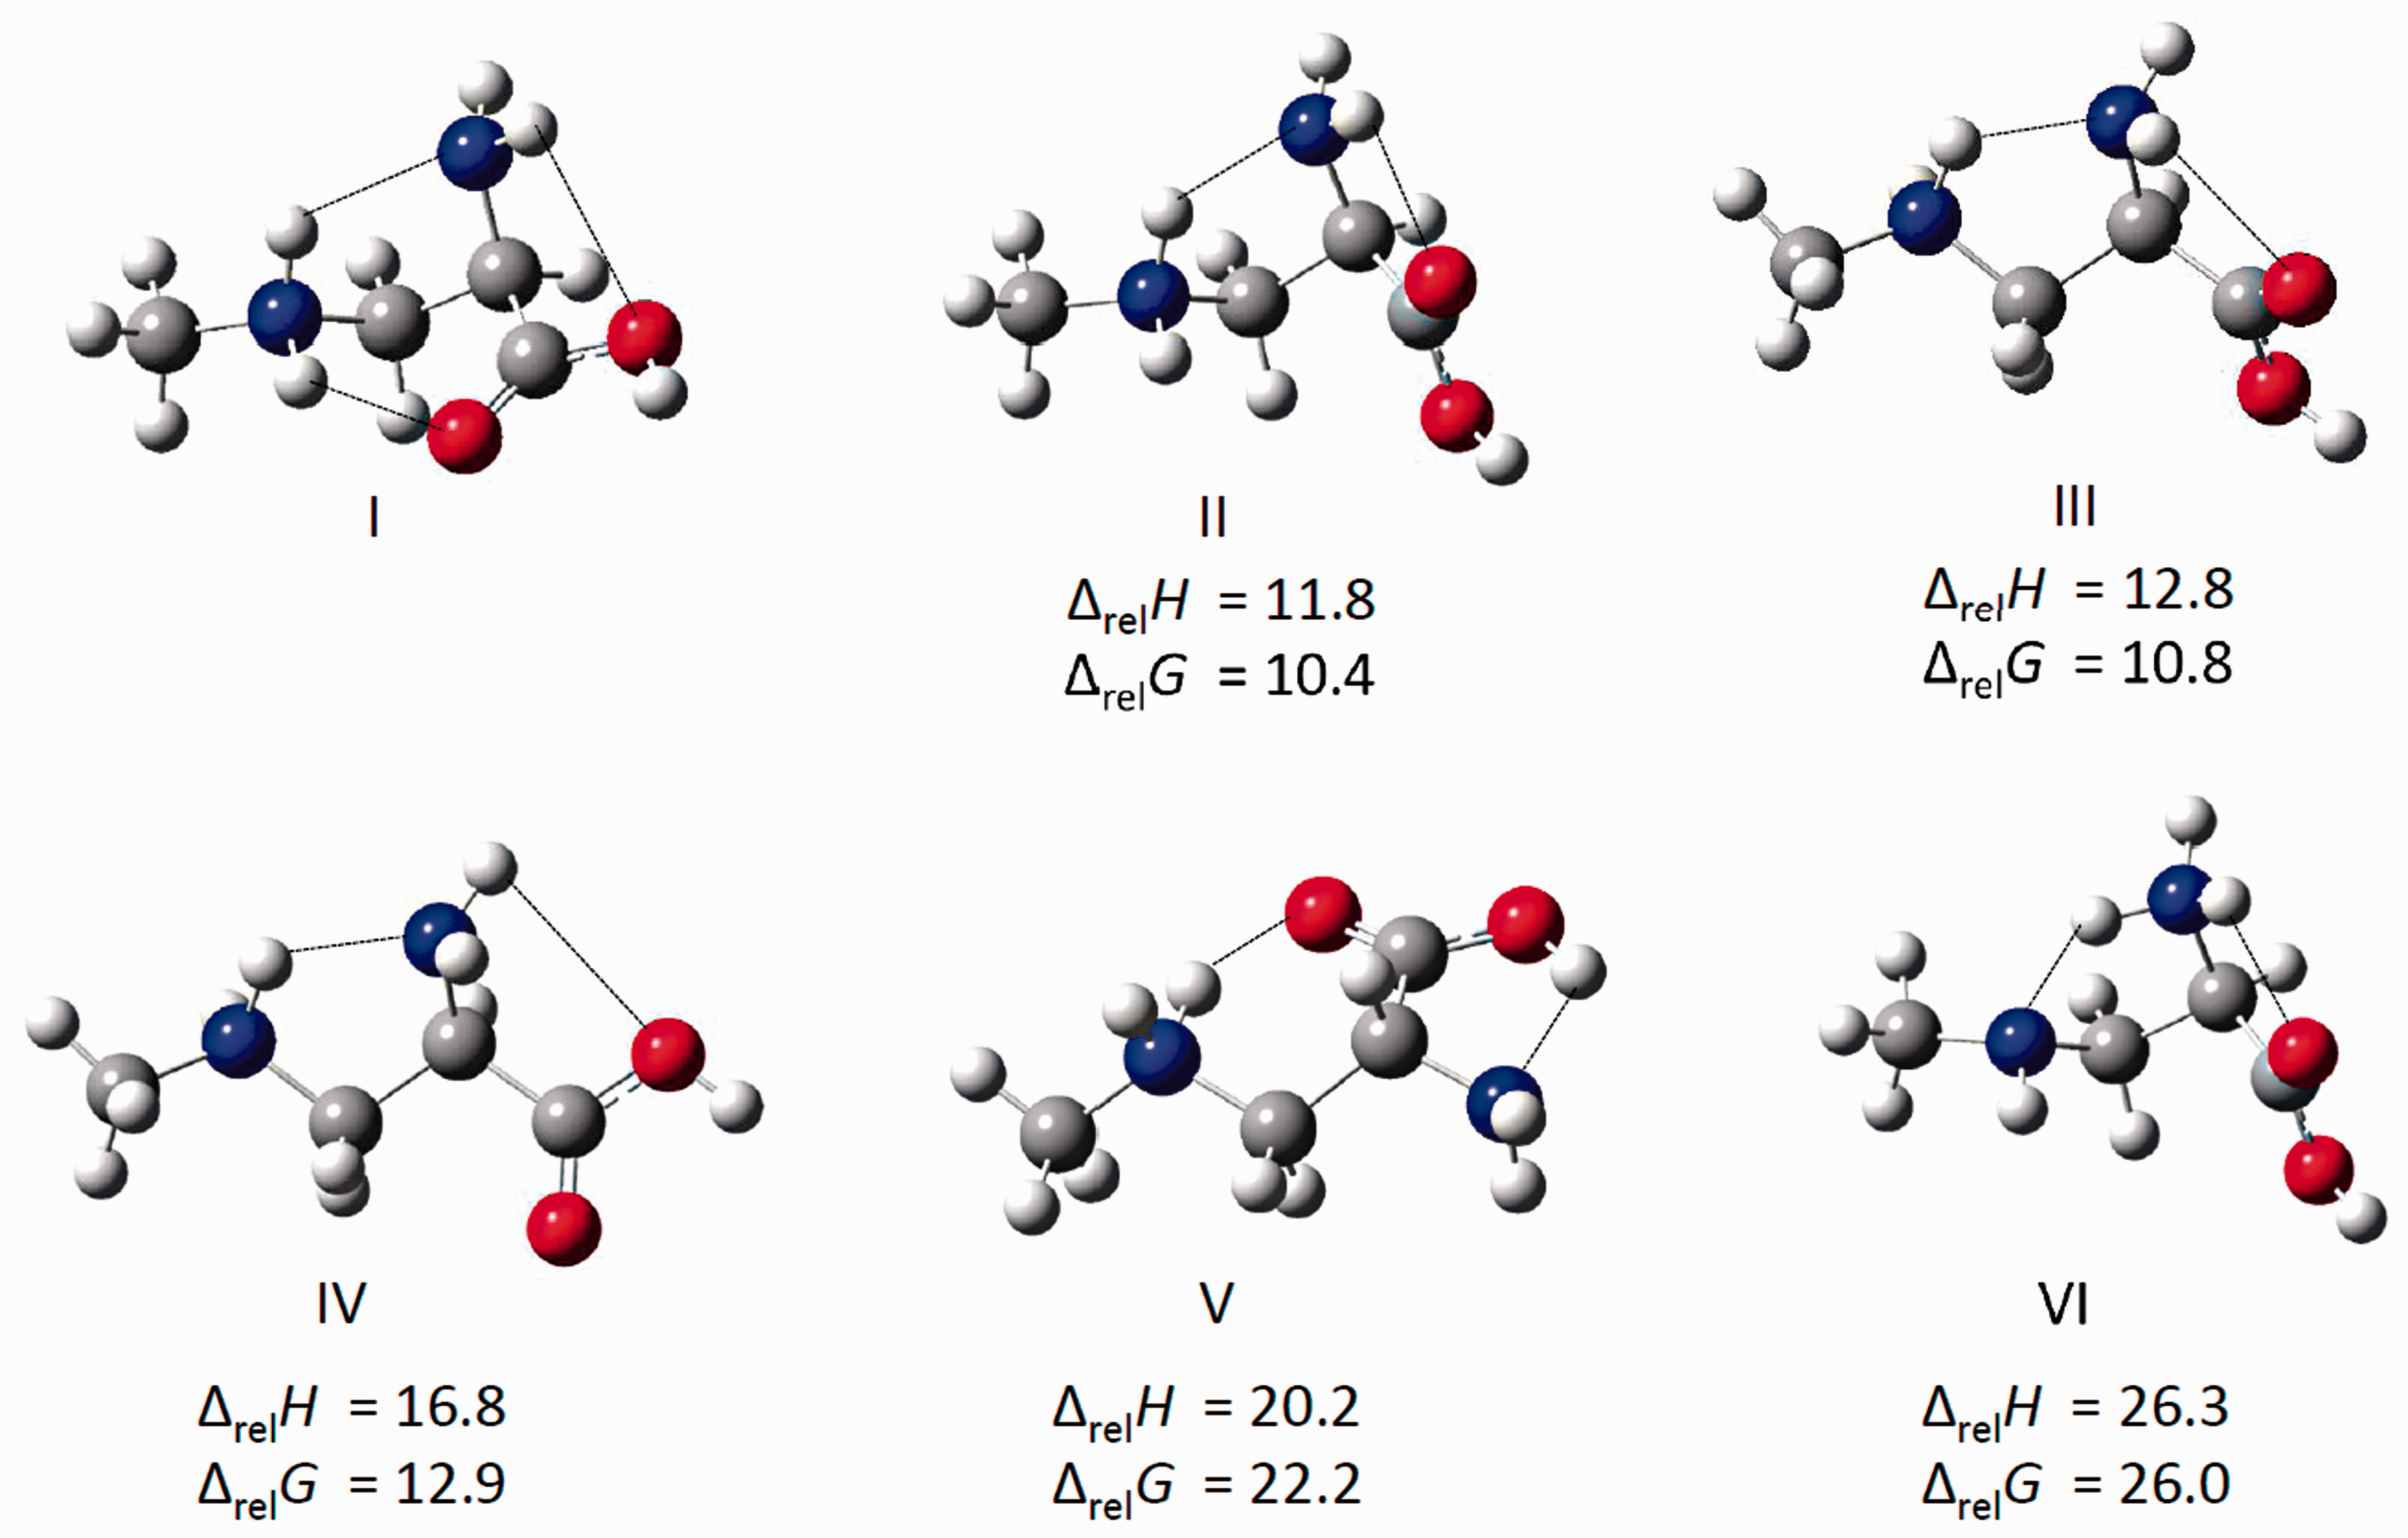
Structures where protonation is on the primary amine (VI, VII, VIII, IX, and XII) are also significantly higher in energy (Figures 3 and S1), between 26.3 and 38.7 kJ mol−1. Structures where there is no hydrogen bond between the secondary amine as the hydrogen bond donor and primary amine as the acceptor (V, X, and XI) are between 20 and almost 60 kJ mol−1 higher in energy than I and can be seen in Figures 3 and S1.
Comparison of experimental IRMPD spectra with the DFT-computed IR spectra
The calculated IR spectra (harmonic approximation) for the four lowest energy structures of [H(BMAA)]+ are compared with the experimental IRMPD spectrum in Figure 2. In the 2700–3700 cm−1 region, a free O–H stretch is predicted for all four structures at about 3560 cm−1 which matches the experimental feature at 3560 cm−1. The O–H stretch is slightly higher in energy for structures II–IV, as the hydrogen bond with the primary amine is expected to be slightly weaker compared to the secondary amine hydrogen bond observed in the lowest energy structure such that the O–H bond is slightly weaker for structure I. The band computed at 3415 cm−1 in the calculated spectra all correspond to the antisymmetric NH2 stretch of the primary amine, which can be associated with the 3425 cm−1 feature in the experimental spectrum. In the lowest energy structure there is a band predicted at 3335 cm−1 due to the symmetric NH2 stretch of the primary amine. This absorption is predicted in all of the lowest energy structures and the intensity maximum of the very broad feature at 3340 cm−1 corresponds well with the computed position. For structures II, III, and IV an absorption is predicted at about 3300 cm−1 and belongs to the nonhydrogen bonded N–H stretch of the secondary amine. In the lowest energy structure, the secondary amine N–H stretching bands are predicted to occur at 3150 and 3190 cm−1, red-shifted from their normal positions due to the strong hydrogen bond with the primary amine nitrogen and carboxylic oxygen, respectively. For structures II, III, and IV, the very red-shifted bands predicted below 3100 cm−1 are the secondary amine N–H stretch that is hydrogen bonded to the primary amine N. The broad feature in the experimental spectrum belongs to these very anharmonic hydrogen bonded N–H stretches and are obviously not well reproduced by the harmonic calculated positions.
In the 1000–1900 cm−1 region, all the lowest energy structures have similar predicted features and a comparison with the experimental spectrum cannot be used to rule any of them out. In the lowest energy structure, the band calculated at 1740 cm−1 is the carboxyl C = O stretch and the 1755 cm−1 observed in the experimental spectrum is assigned to this mode. The C = O stretch for the lowest energy structure is predicted to occur between 30 and 40 cm−1 lower in energy than that computed for the other three structures. This is again due to a stronger hydrogen bond between the secondary protonated amine and the carboxylic oxygen compared to the primary amine–carboxylic oxygen hydrogen bond. The stronger hydrogen bond in the lowest energy structure results in a weaker C = O bond and therefore absorbs at a lower energy. The predicted absorptions from about 1550 to 1690 cm−1, NH2 scissoring, is not observed in the experimental spectrum. The band observed at 1400 cm−1 could be associated with NH2 wagging and at 1150 cm−1 may be assigned to a band with primarily COH bending and CH2 wagging as predicted by the calculations. The intensities of the calculated bands do not match well with the experimental spectrum. In particular, the C = O stretch is much less intense in the experimental work than calculations would suggest; as well, the C = O stretch is usually the most prominent band in vibrational spectra of molecules with a carbonyl group. On the contrary, the band at 1150 cm−1 is very intense in the experimental results but this is not predicted to be so. Overall poor agreement between the experimental and calculated spectra in the fingerprint region suggests that a different method of predicting the vibrational spectrum is required.
Vibrational spectrum from MD calculations
Poor agreement between the experimental IRMPD spectrum and the calculated harmonic IR spectra has been observed especially in the high-energy region, and the broad, mostly featureless absorption can be attributed to a hydrogen bonding environment, resulting in anharmonic effects.29–32,39,40–43 In structure I for [H(BMAA)]+ a strong hydrogen bond is formed between the protonated secondary amine (donor) and the primary amine group (acceptor), causing significant N–H stretch broadening in the experimental spectrum which cannot be matched using harmonic calculations. However, MD simulations can be used to generate an infrared spectrum which naturally accounts for the anharmonicity effects at finite temperature. This can be used to interpret the experimental spectrum more accurately.
As we mentioned above, the dynamical calculations have been performed for three different initial conformers. The first has a starting geometry which is essentially the one of compound I of Figure 3. The second trajectory has a starting point which is essentially structure VI. The last conformer explored has an initial configuration which resembles structure V. By inspecting these structures, it is clear that the geometry of compound V cannot form a hydrogen bond between the two nitrogen atoms unless we provide enough energy to overcome the torsional barrier between the two adjacent aliphatic carbons. During the limited time span of our NVT simulation such rotation does not take place and the conformer remains trapped in a structure which is unable to form hydrogen bonds. This feature is shown in Figure S4, where the N—N and both the N—O distances as functions of time for the nonhydrogen bonded conformer are reported. Only in a very limited portion of the trajectory do the nitrogen atoms come close enough (less than 3 Å) to give rise to a hydrogen bonding interaction but their oscillations remain large and prevent the formation of a stable bond. In this conformer, an interaction exists between the primary nitrogen atom and the hydroxyl oxygen as shown by the red continuous data. The resulting IR spectrum extracted from this conformer dynamics is reported in Figure S5. The agreement with the experimental data is extremely poor and, as expected, the theoretical spectrum resembles the harmonic one of conformer V in Figure S2.
We now turn to the analysis of the trajectory data for the two H-bonded conformers. As mentioned above, one of them initially had the proton on the primary amine, but after just 100 fs, the proton is transferred to the secondary amine. This rapid proton transfer renders the dynamics of the two conformers to be essentially identical for the rest of the simulation time. The resulting IR spectrum has therefore been obtained as an average over these two dynamics. The results are reported in Figure 4 where we see a very decent agreement between the positions of the predicted and measured bands. The spectrum, in the fingerprint region, is similar to that of compounds I–IV of Figure 2; however, the “splitting” of 1150 cm−1 band has coalesced. In the higher energy region, between 3300 and 3600 cm−1, the experimental spectrum is reproduced quite well with the MD simulations and the overall shape of the experimental spectrum is better reproduced by the MD simulations.
Comparison of the experimental IRMPD spectra (top) with the calculated spectra generated using MD with the two H-bonded energy structure as the starting point (bottom). IRMPD: infrared multiple photon dissociation.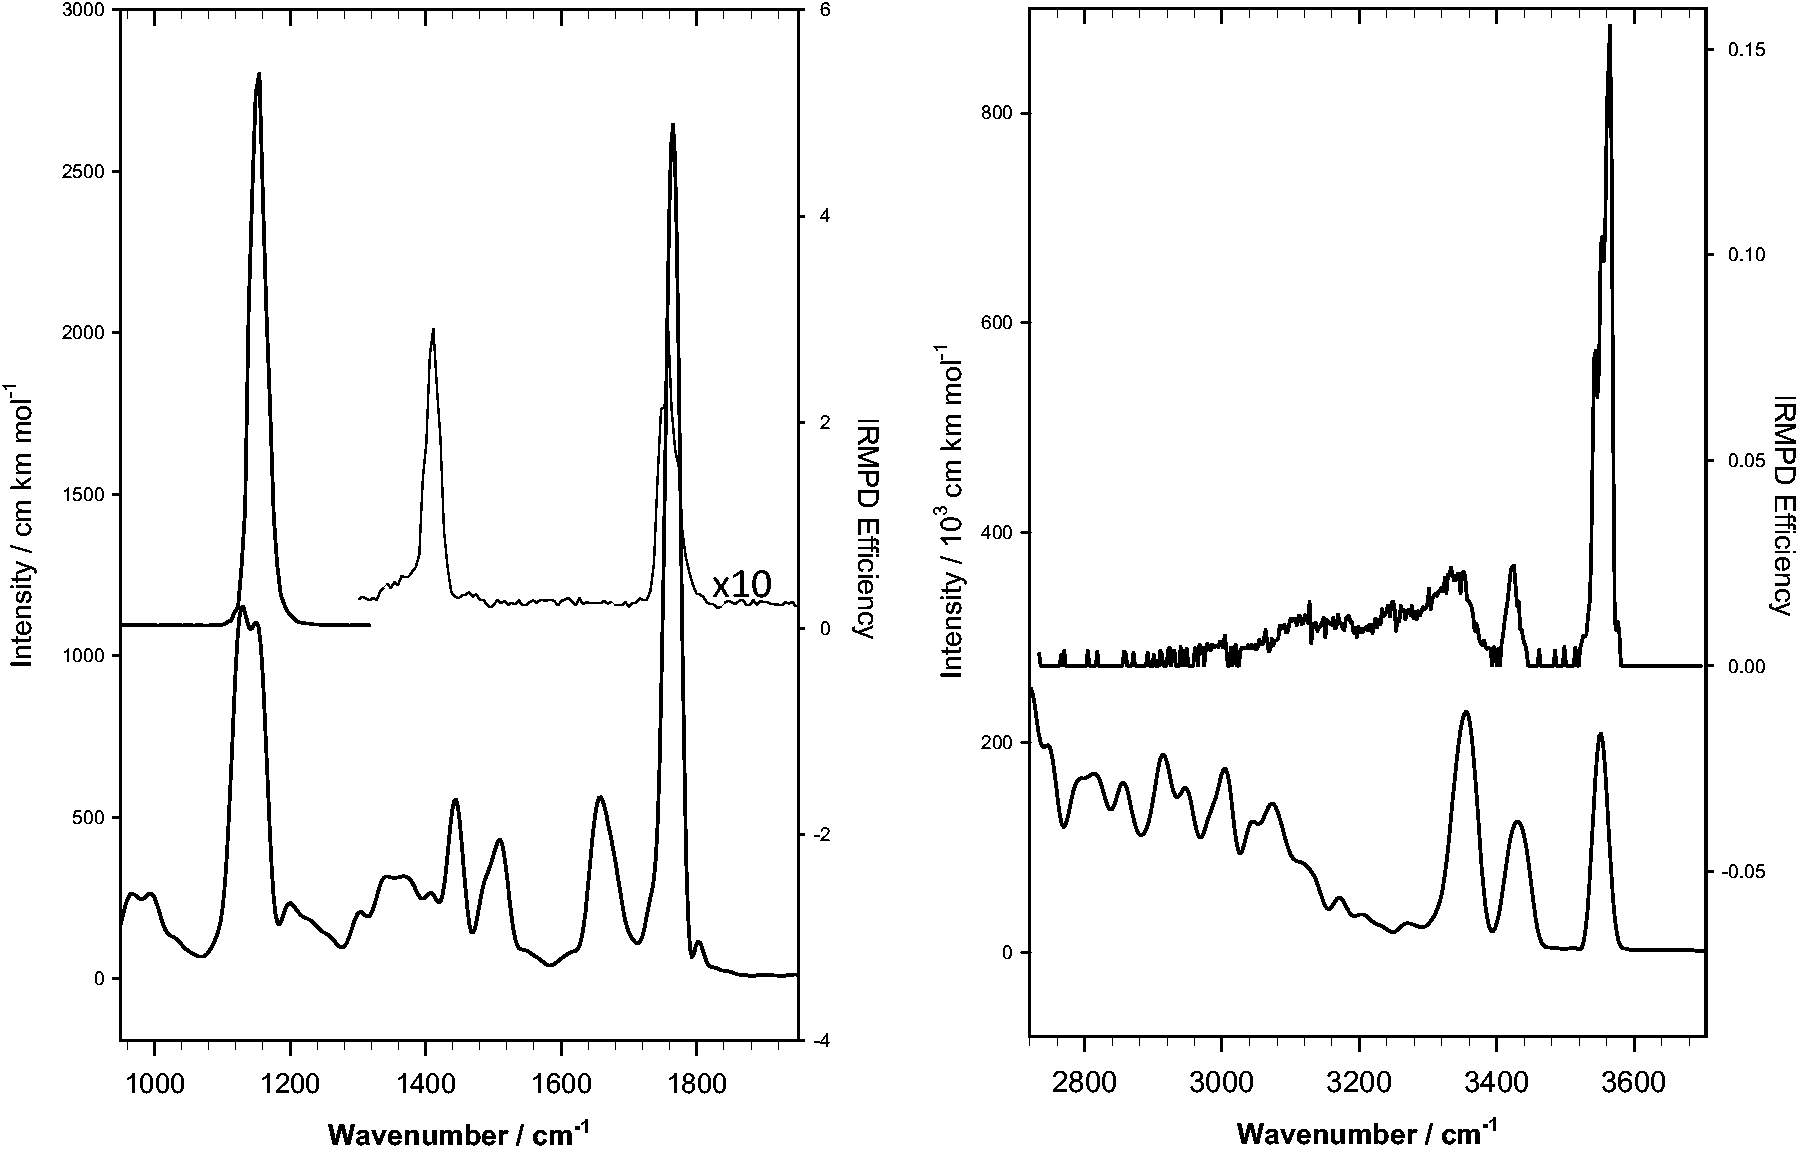
For the broad band that appears between 3000 and 3400 cm−1, the simulated band is significantly to the red of the experimental band. This could have two explanations. First, the laser power (see Figure S9) drops off linearly from about 800 mW at 4000 cm−1 to about 200 mW at 2700 cm−1. It could certainly be that below 3000 cm−1, the power becomes too low for this ion to absorb enough photons to affect dissociation efficiently. Also, as we shall show below, this broad band is due to N-H stretching motions and is broadened by the presence of the hydrogen bond. The discrepancy is due to the fact that BLYP is a generalized gradient approximation functional and therefore not as accurate for noncovalent interactions, and to the inaccuracies in the motion of the light nuclei (H) whose “oscillations” are treated classically so that they appear to absorb much more vibrational energy than they do in the real system.
MD does not provide “normal modes” as a harmonic analysis does; however, a tentative assignment can be performed based on the vibrational density of states (DOS) which can be obtained by performing a Fourier transform of the velocity autocorrelation function appropriately partitioned by the functional group. The analysis is illustrated in Figure S7. We have decomposed the total vibrational DOS into four contributions: the first one arising from the carboxylate (red), two others originating with the two NH2 groups (blue), and one from the aliphatic carbons and hydrogens. The high-energy region, in decreasing order, presents an absorption due to the O–H stretch of the carboxylate and two absorptions that are due to N–H stretching. The broad band between 2500 and 3000 cm−1 is clearly due to the hydrogen-bonded proton motions of the amine terminals. In the fingerprint region, we substantially confirm the findings of the harmonic analysis and we find that the two bands between 1600 and 1800 cm−1 are due to C = O and to NH2 motions and that the band at 1400 cm−1 is due to NH2 motions. Finally, the strong absorption at 1150 cm−1 seems to be induced by both the carboxylate and aliphatic chain motions.
From the dynamics, we conclude that, during the limited time span of our simulations, the conformer whose spectra match with experiments sees the two amino groups connected by an H-bond interaction that localizes the two N atoms at around 2.7 Å separation (see Figure S8), while hydrogen bonding interactions between the nitrogen and the carboxylate play only a minor role.
Conclusion
We have investigated the gas-phase structure of [H(BMAA)]+ using IRMPD in the 2700–3800 and 1000–1900 cm−1 region. Calculations using DFT methods show that the lowest energy structures prefer protonation of the secondary amine. Formation of hydrogen bonds between the primary and secondary amine, and the secondary amine and carboxylic oxygen further stabilize the structures. The IR spectrum of the lowest energy structure originating with harmonic DFT has features that generally match the positions of the experimental spectra; however, the overall match with the experimental spectrum is poor. Using MD calculations to generate a gas-phase IR spectrum, we have obtained a reasonable match with the experimental spectrum especially in the high-energy region. The results of the MD simulation support the DFT calculations, with protonation of the secondary amine and formation of a hydrogen bond between the protonated secondary amine and the primary amine. We have shown the importance of accounting for anharmonic effects describing the IRMPD spectra for systems with very strong intramolecular hydrogen bonding.
Supplemental Material
Supplemental material for Strong intramolecular hydrogen bonding in protonated β-methylaminoalanine: A vibrational spectroscopic and computational study
Supplemental Material for Strong intramolecular hydrogen bonding in protonated β-methylaminoalanine: A vibrational spectroscopic and computational study by Bryan D Linford, Andrea Le Donne, Debora Scuderi, Enrico Bodo and Travis D Fridgen in European Journal of Mass Spectrometry
Footnotes
Acknowledgements
Dr Philippe Maître and the mass spectrometry platform SMAS of the Laboratoire de Chimie Physique (Univ. Paris-Sud) are gratefully acknowledged. We thank Dr J. M. Ortega and the CLIO team for technical assistance. TDF wishes to acknowledge NSERC for their ongoing support. Computational support from Compute Canada, specifically WestGrid and ACE-Net is acknowledged.
Declaration of conflicting interests
The author(s) declared no potential conflicts of interest with respect to the research, authorship, and/or publication of this article.
Funding
The author(s) disclosed receipt of the following financial support for the research, authorship, and/or publication of this article: We acknowledge the CNRS TGE FT-ICR ((FR 3624) for supporting the 7T-FT-ICR in Orsay.
References
Supplementary Material
Please find the following supplemental material available below.
For Open Access articles published under a Creative Commons License, all supplemental material carries the same license as the article it is associated with.
For non-Open Access articles published, all supplemental material carries a non-exclusive license, and permission requests for re-use of supplemental material or any part of supplemental material shall be sent directly to the copyright owner as specified in the copyright notice associated with the article.