
Abstract
Mycobacterium tuberculosis infection results in more than two million deaths per year and is the leading cause of mortality in people infected with HIV. A new structural class of antimycobacterials, the diarylquinolines, has been synthesized and is being highly effective against both M. tuberculosis and multidrug-resistant tuberculosis. As diarylquinolines are biologically active only under their (R,S) stereoisomeric form, it is essential to differentiate the stereoisomers (R,S) and (R,R). To achieve this, tandem mass spectrometry and ion mobility spectrometry-mass spectrometry have been performed with 10 diarylquinoline diastereomers couples. In this study, we investigated cationization with alkali metal cations and several ion mobility drift gases in order to obtain diastereomer differentiations. We have shown that diastereomers of the diarylquinolines family can be differentiated separately by tandem mass spectrometry and in mixture by ion mobility spectrometry-mass spectrometry. However, although the structure of each diastereomer is close, several behaviors could be observed concerning the cationization and the ion mobility spectrometry separation. The ion mobility spectrometry isomer separation efficiency is not easily predictable; it was however observed for all diastereomeric couples with a significant improvement of separation using alkali adducts compared to protonated molecules. With the use of drift gas with higher polarizability only an improvement of separation was obtained in a few cases. Finally, a good correlation of the experimental collision cross section (relative to three-dimensional structure of ions) and the theoretical collision cross section has been shown.
Keywords
Introduction
Tuberculosis (TB) still ranks as one of the most deadly infectious diseases in the world, resulting in approximately two million deaths per year. It is estimated that one-third of the world population is latently infected with TB bacilli.
1
Diarylquinolines is a new structural class of antimycobacterials in which Sirturo™ (Bedaquiline, Figure 1) is the leader being highly effective against both Mycobacterium tuberculosis and multidrug-resistant TB.
2
As the molecules of the diarylquinolines family contain two chiral centers, the four isomers are distributed in a mixture of a couple of two diastereomers called (RS,SR) and (RR,SS). Only the couple of diastereomers named (RS,SR) is biologically active (Figure S1). It is therefore important to know the stereochemistry of these molecules and to differentiate the diastereomers. A conformational analysis of these stereoisomers has already been carried out by nuclear magnetic resonance and molecular modeling.
2
Structures of the (R,S) and (R,R) forms of bedaquiline. (a) Diastereomer anti and (b) diastereomer syn. The chemical group in blue is the “A position” and the chemical group in green is the “B position.”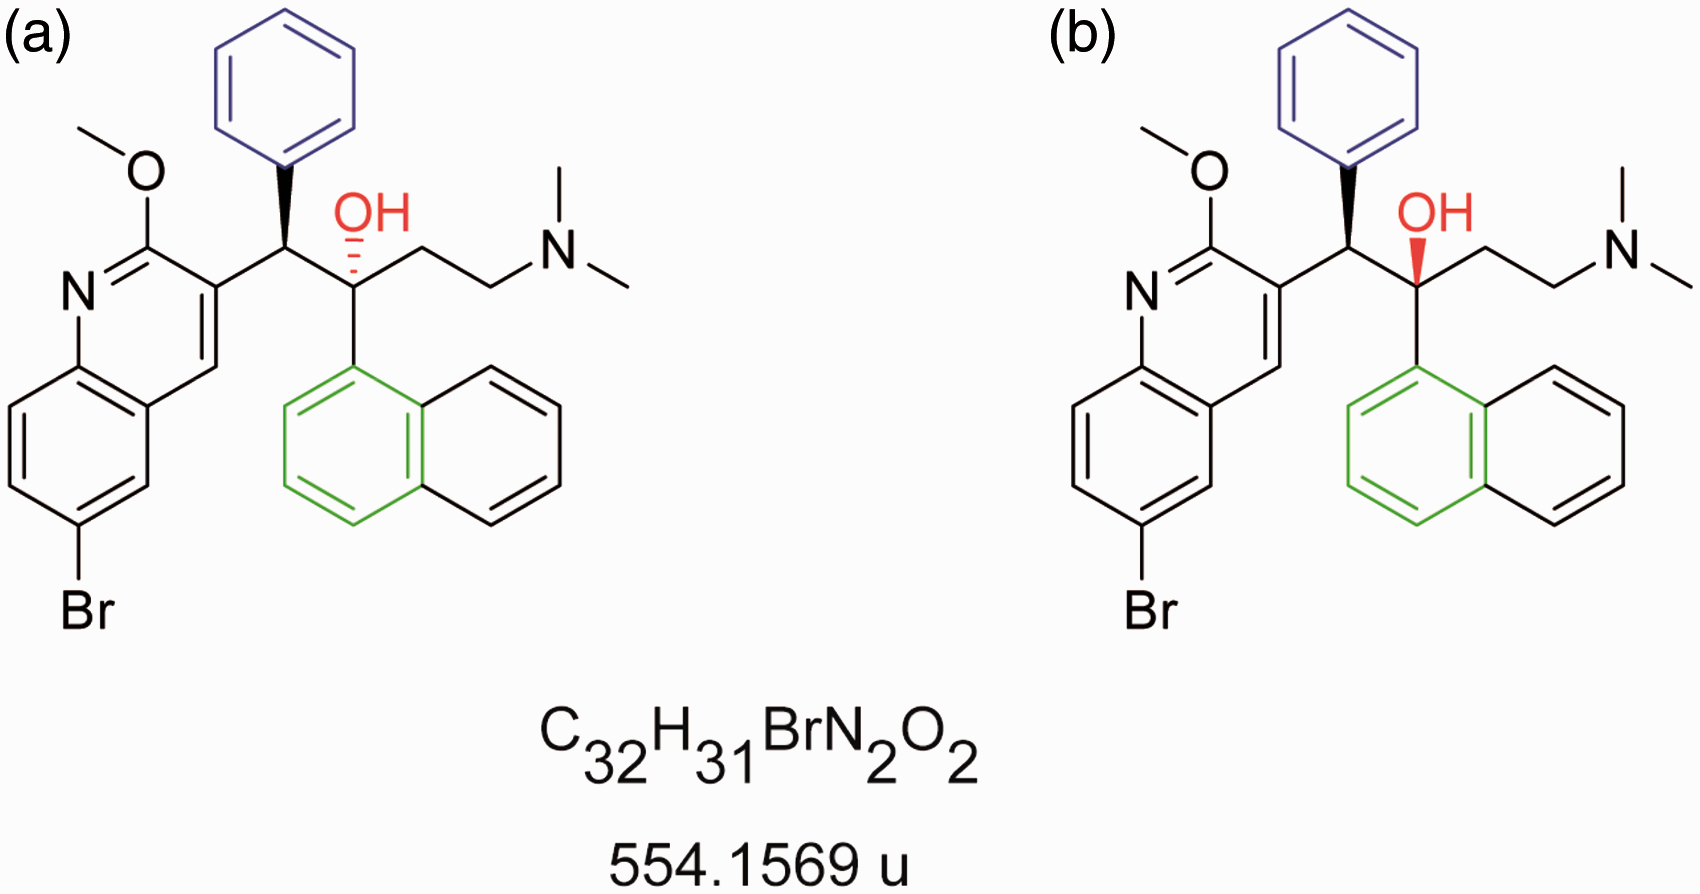
In order to obtain new and complementary information, we propose to perform analyses by tandem mass spectrometry (MS/MS) and ion mobility spectrometry-mass spectrometry (IMS-MS). Ion mobility spectrometry is a postionization separation method based on the drift of ions in a gas-filled cell under the influence of an electrical field. 3 The drift time, time taken by each ion to travel through the ion mobility cell, is in the millisecond range and depends on the ion mobility (K) of each ion. Ion mobility varies according to charge (z) and collision cross section (CCS: Ω) of the ions. CCS is representative of the three-dimensional structure of ions in the gas phase. Coupled to mass spectrometry, ion mobility adds an extra separation dimension and permits to obtain information about the conformation of ions in the gas phase via an experimental determination of the CCS. Ions with different CCS can be therefore separated thanks to IMS-MS even if they have the same m/z ratio. Traveling wave ion mobility spectrometry (TWIMS) is a type of IMS based on low-voltage waves pushing the ions across a gas-filled ion guide. 4 A TWIMS cell was recently incorporated in commercially available hybrid quadrupole/time-of-flight mass spectrometer. 5 TWIMS-MS has been successfully applied for the analysis of isomer differentiation.6–8 This coupling was also used for diastereoisomer differentiation.9–17
In this work, TWIMS-MS experiments have been performed on 10 diastereomeric couples (R,S) and (R,R) forms of the diarylquinoline family which have antibiotic properties under (R,S) form (Figure 2). In order to increase the stereoisomer differentiation, cationized species (with alkali cations) have been analyzed and different gases have been used.
11
For 3 of these 10 couples, experimental CCSs have been confronted to calculate CCS. This work, carried out on 10 diastereomeric couples with three different alkali salts and three different IMS buffer gases, allows to obtain a global view of the role of alkali metal cations on the CCS of a homologous series of molecules.
Structures of the 10 diastereomers couples of the diarylquinoline family. (a) Couple 1, (b) couple 2, (c) couple 3, (d) couple 4, (e) couple 5, (f) couple 6, (g) couple 7, (h) couple 8, (i) couple 9, and (j) couple 10.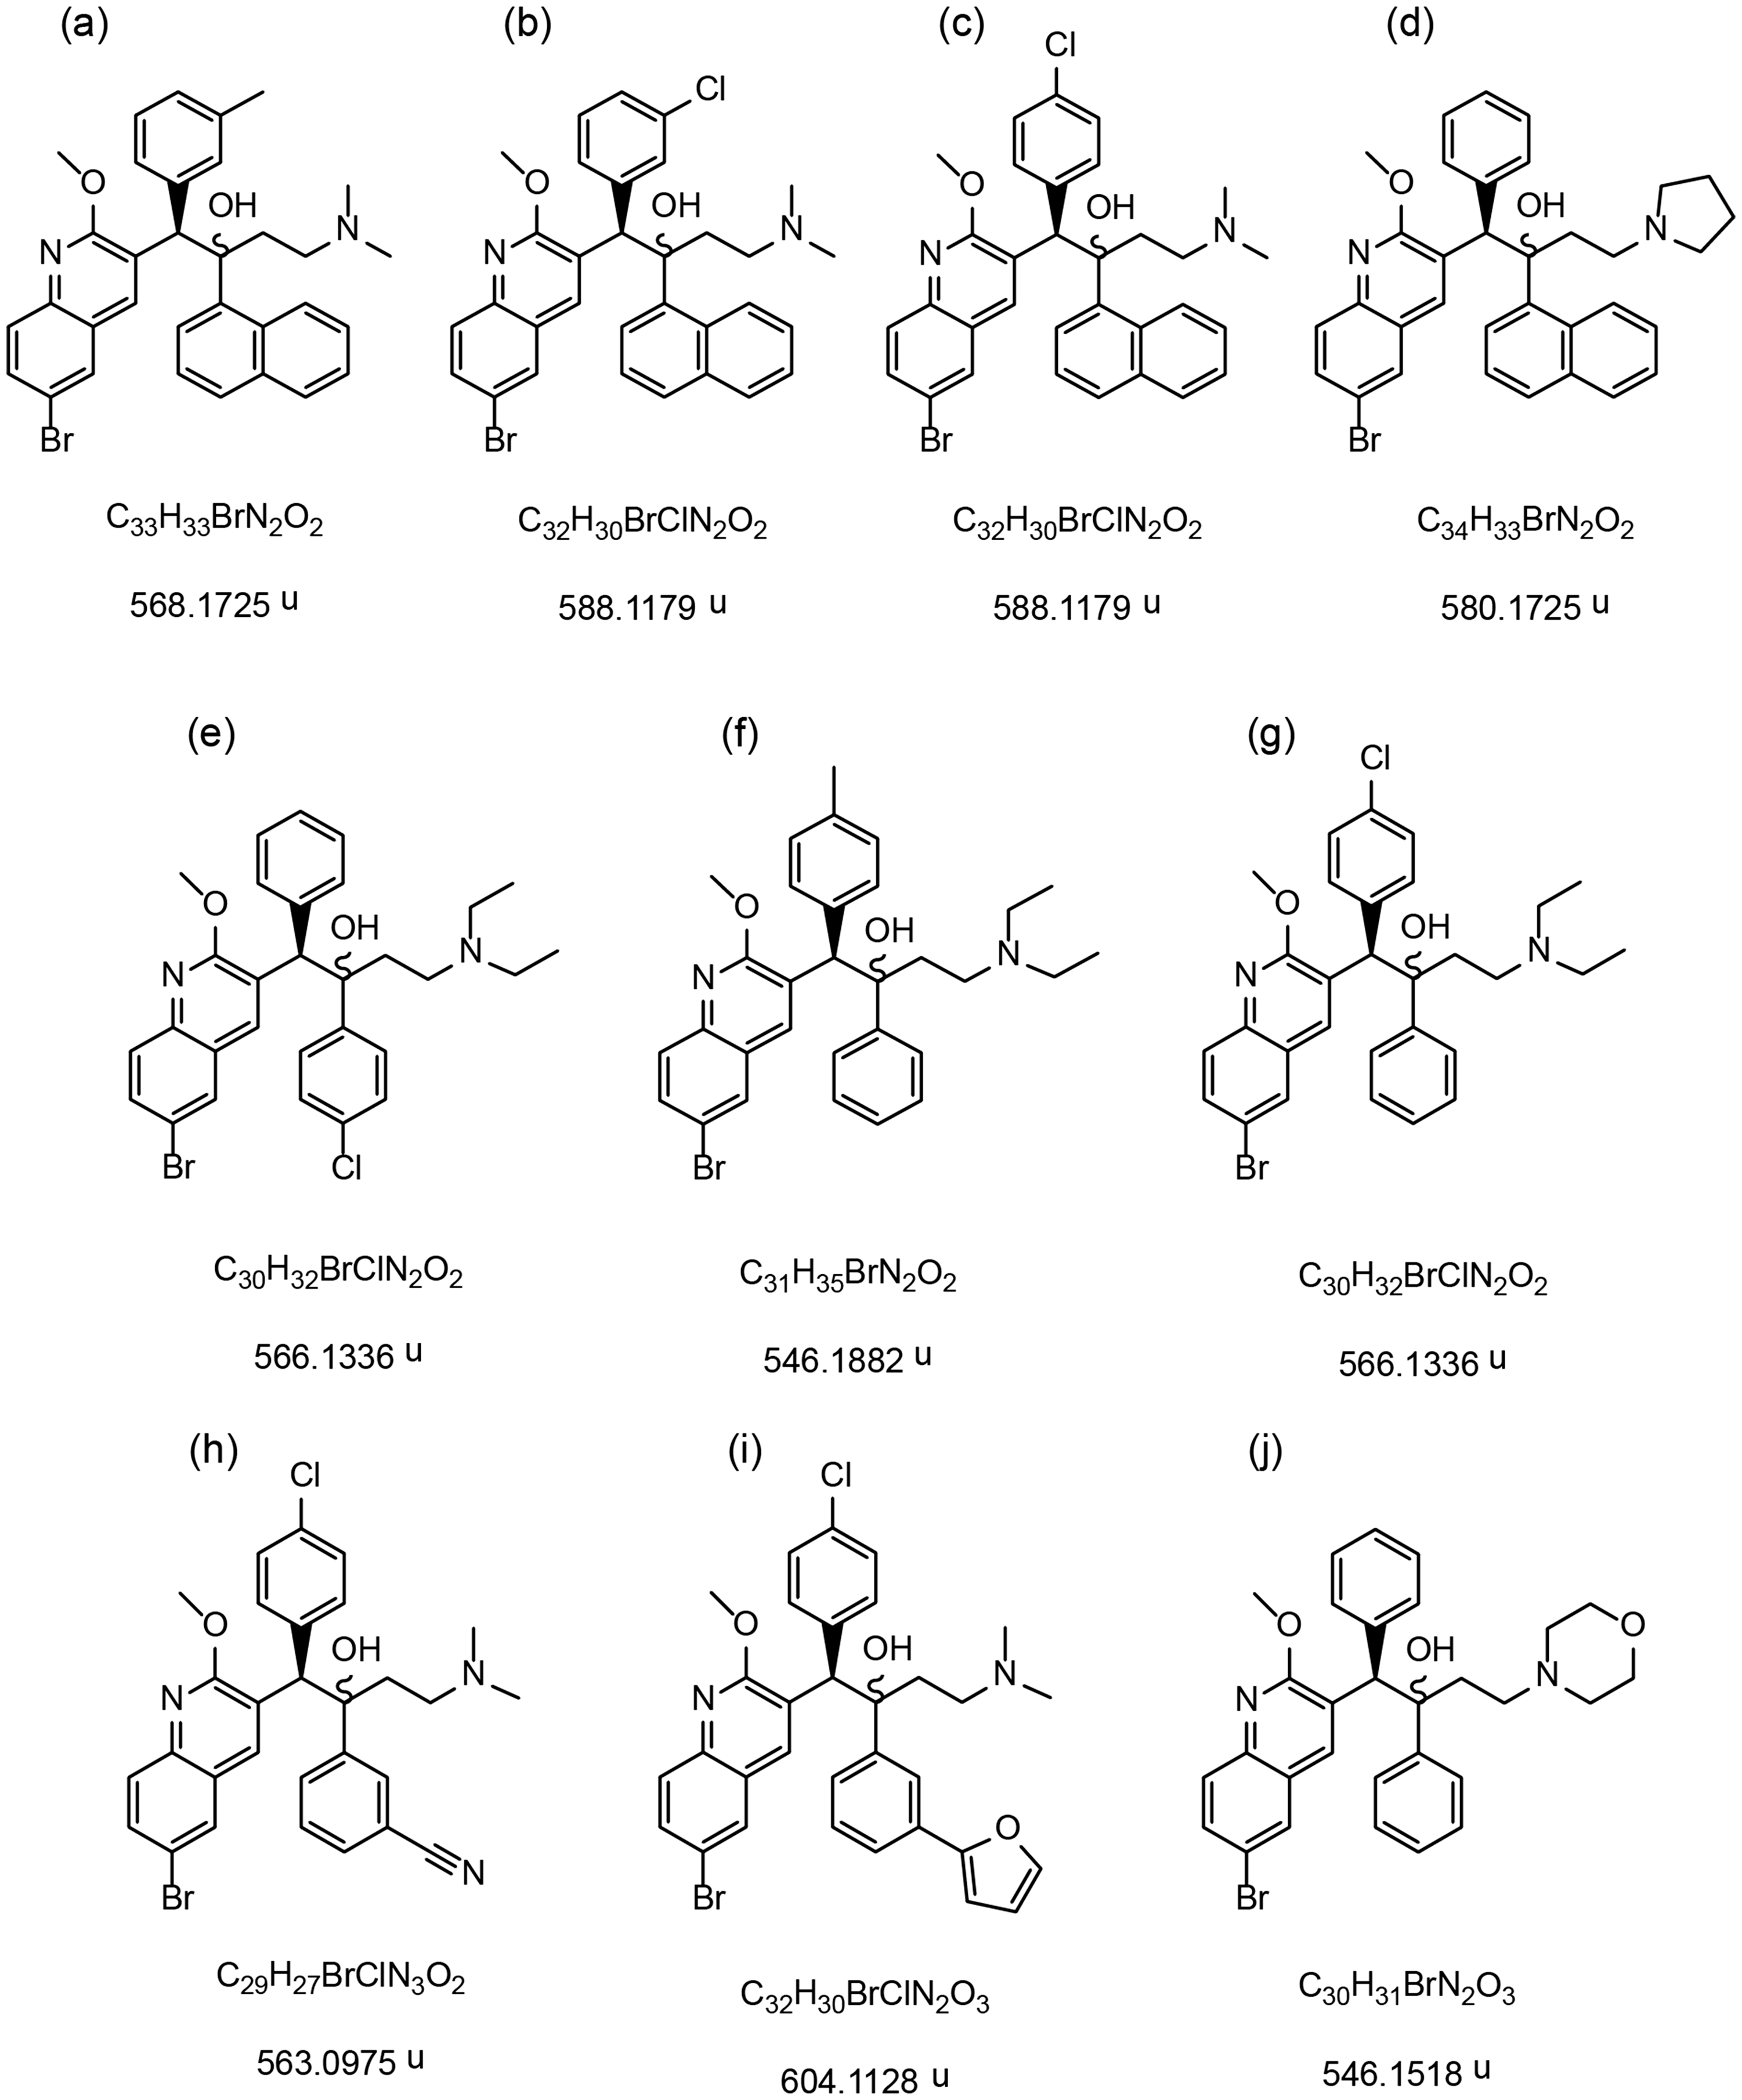
Experimental
Chemicals
The diarylquinoline diastereomers have been synthesized by pharmaceutical group Johnson & Johnson. 2 They were dissolved separately in methanol to prepare a stock solution with a concentration of 1 mg ml–1. Aqueous solutions of alkali salts (LiI, NaI, and KI) were prepared with a concentration of 1 mgml–1. For ESI–IMS-MS experiments, each stock solution of diastereomer is diluted with alkali salts in methanol to obtain a final solution of 20 µM of the diastereomers and 100 µM of alkali metal.
MSn analyses
MSn experiments were performed using a quadrupole ion-trap mass spectrometer (Bruker HCT Ultra ETD II; Bremen, Germany) equipped with an ESI source. The optimized ESI parameters were the following: capillary, end plate, and skimmer 1 voltages, set at −4 kV, –3.5 kV, and 47.7 V, respectively. The nebulizer gas (N2) pressure, drying gas flow rate (N2), and drying temperature were 10 psi, 5 l min–1, and 300℃, respectively. Helium flow in the ion trap was set in order to obtain a pressure of 1.2 × 10⁻⁵ mbar in the gauge located outside the ion trap cell. Spectra were acquired in the positive mode over the m/z 50–600 range. The number of ions entering the trap was automatically adjusted by controlling the accumulation time using the ion charge control mode (target 200,000) with a maximum accumulation time of 50 ms. The values of spectra and rolling averages were five and two, respectively. For MS/MS experiments, the precursor ion was selected with an isolation width of 1 m/z unit and was excited by a voltage of 0.6 V.
ESI–TWIMS–MS
TWIMS-MS analyses were carried out on a Synapt G2 HDMS (Waters, Manchester, United Kingdom). This instrument is a hybrid quadrupole/time-of-flight mass spectrometer, which features TWIMS. The instrument and the T-Wave device have been described in detail previously.4,5 Experiments were performed by direct infusion of samples at 10 µl min–1 flow rate into the ESI source of the instrument, with capillary and sampling cone voltages fixed between 2.8 and 3.2 kV and 20–30 V, respectively, under a nitrogen flow of 500 l h−1 heated at 250℃. For all experiments, IMS-MS spectra were acquired in a positive mode over the m/z 50–600 or 50–1200 range. Helium cell gas flow was set at 180 ml min−1. IMS gas flow (N2) was set at 70 ml min−1 of 2.96 mbar for IMS cell pressure; traveling wave height and velocity in the IMS cell were set, respectively, at 40 V and 600 m s−1. CO2 was used as drift gas with the following conditions: IMS gas flow was set at 70 ml min−1 of 2.00 mbar for IMS cell pressure, traveling wave height and velocity in the IMS cell were set, respectively, at 40 V and 300 m s−1. N2O was also used as drift gas in the following conditions: IMS gas flow was set at 60 ml min−1 of 2.00 mbar for IMS cell pressure, traveling wave height and velocity in the IMS cell were set, respectively, at 40 V and 400 m s. Data acquisition and mass spectra processing were carried out using the MassLynx v4.1 software (Waters, Manchester, United Kingdom).
For ion mobility spectra, a Gaussian fit of each peak was carried out with Origin® v9.1 software (OriginLab). Gaussian fitting of the IMS data was required in order to improve the precision of the drift time measurements as the ion mobility spectra obtained from the instrument present a relatively low number of data points per peak. 12 IMS cell calibration was carried out with polyalanines at the concentration of 10 ng µl–1 as described by Smith et al. 18 Polyalanines CCS values used for calibration come from Pr. Clemmer CCS database. 19 All masses and m/z reported in the manuscript correspond to monoisotopic values.
Computational details
Prior to the QM geometry optimization, the MMFF94x FF was used to carry out low mode MD 20 simulations of the different isomers, in MOE. 21 Conformers were rejected when ΔE was greater than 10.0 kcal mol−1 from the global minimum. Conformational sampling was terminated when 100 consecutive attempts failed to generate any novel conformation, resulting in around 17 conformers per isomers.
Optimized geometries were calculated for the different isomers with a B97-D3 DFT method of theory using the LACVP++ basis set for bromine, and 6–31 G++ for other atoms, implemented in Jaguar. 22
Geometry optimizations included solvation effects using the self-consistent Poisson–Boltzmann reactive field 23 with a dielectric constant of 33.62 (default parameter for probe and density) to simulate methanol.
The CCSs were calculated on the protonated molecule using the MOBCAL software.24–26 Collision integrals are calculated by the following three ways: the projection approximation (PA), the exact hard sphere scattering (EHSS), and trajectory method (TM). Default parameters were used except the imp parameter that was set to 500.
Results and discussion
It is known that product ions of diastereomers can present different intensities.
27
An ESI–MS/MS experiment was therefore carried out on the [M+H]+ ion for each diastereomer (R,S) and (R,R) forms called, respectively, anti and syn. MS/MS spectra obtained from the syn and anti protonated molecules are significantly different. In both cases, a water molecule loss is detected. However, in the case of the anti compound, another abundant product ion is observed corresponding to a methanol molecule loss. An example of this difference of fragmentation is shown for the couple 1 in Figure 3 (MS/MS spectra for other couples are given in Figure S2). Thus, MS/MS analyses enable to obtain information on the stereochemistry of the diarylquinolines when they are analyzed separately. However, to know the proportion of each diastereomers in mixture by MS/MS, it would be necessary to measure the relative abundance of each product ion from the pure isomeric species. This approach was in particular proposed by Tao et al.
27
IMS-MS has been considered as an alternative method to facilitate diastereomer differentiation.
ESI-MS2 mass spectra of the couple 1. (a) Anti compound (R,S form) and (b) syn compound (R,R form).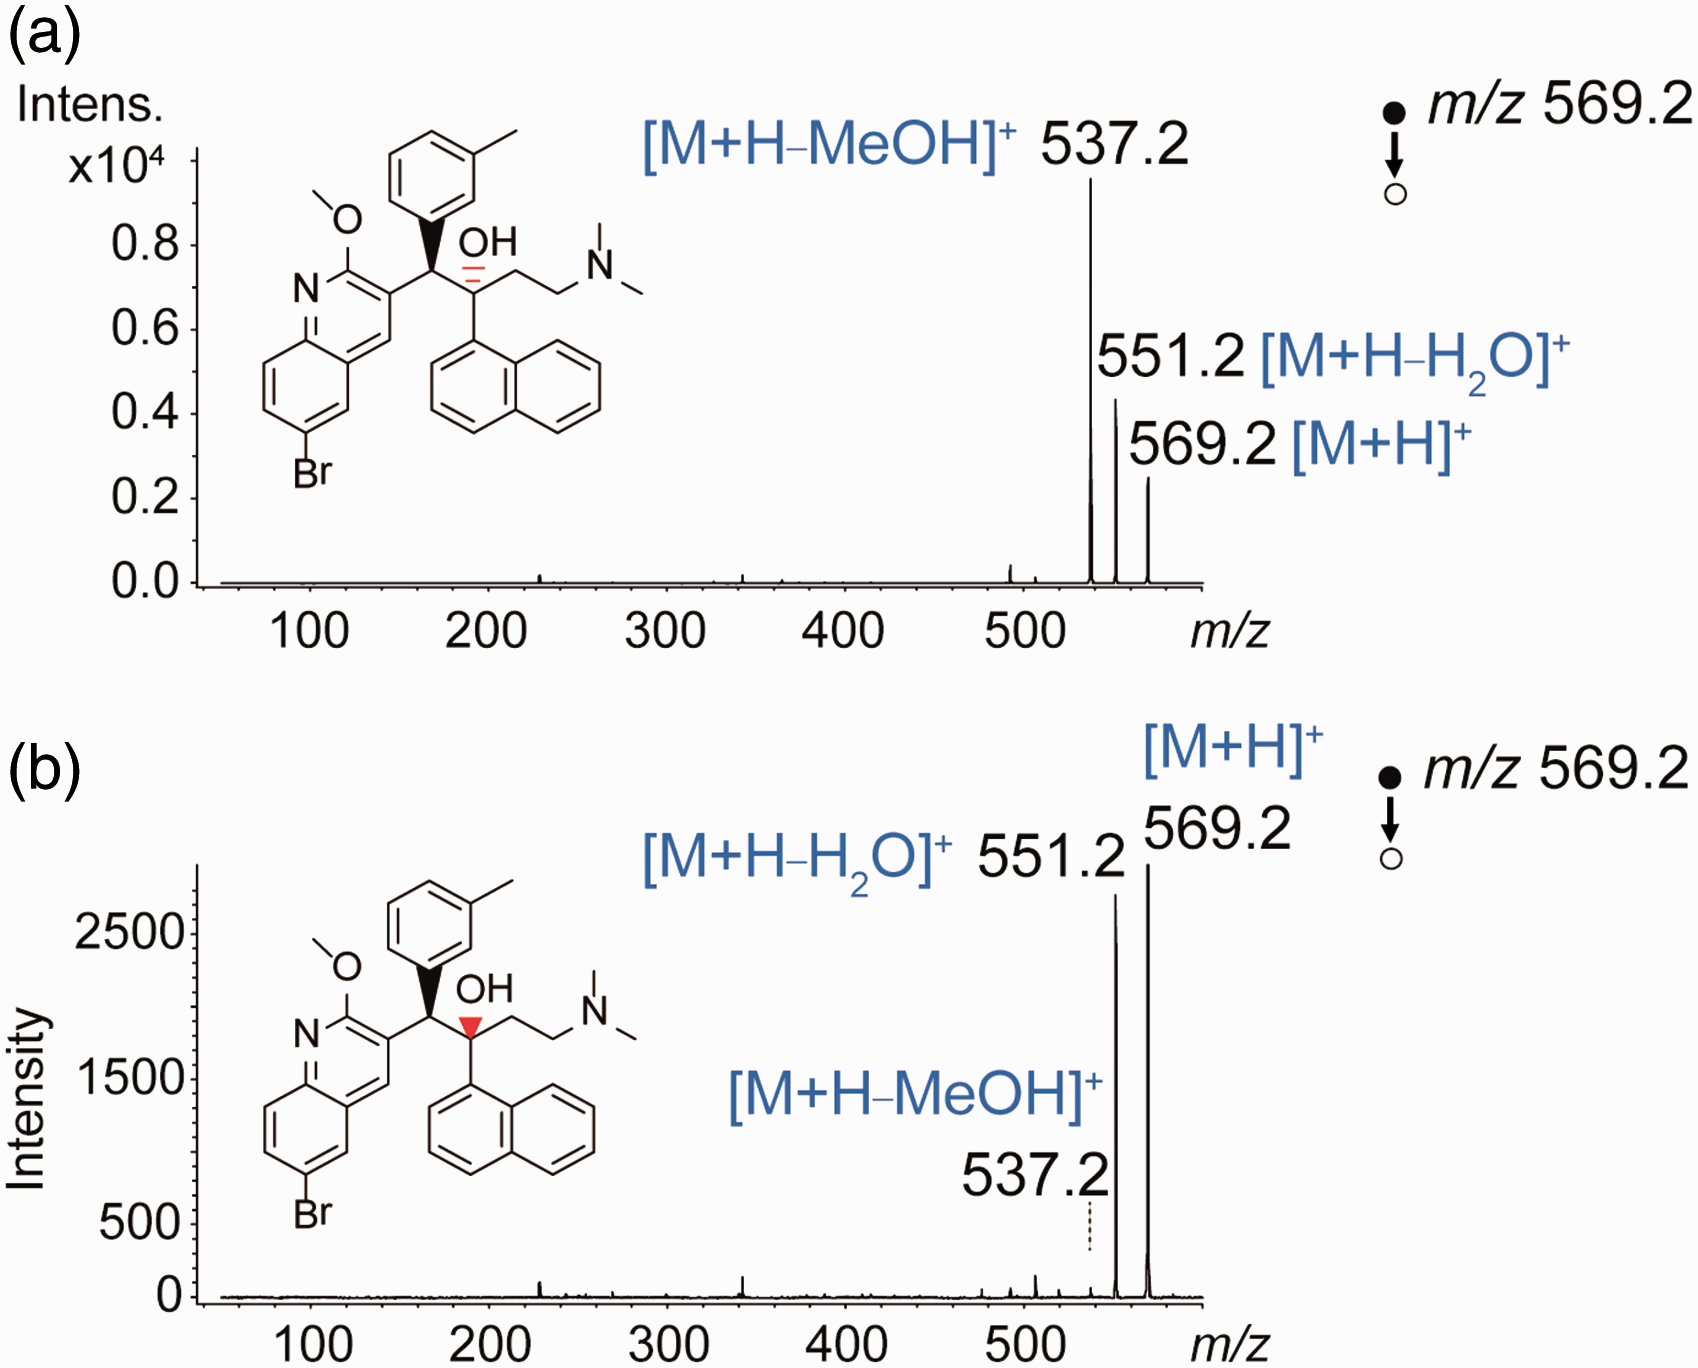
IMS-MS analysis of the [M+H]+ ions
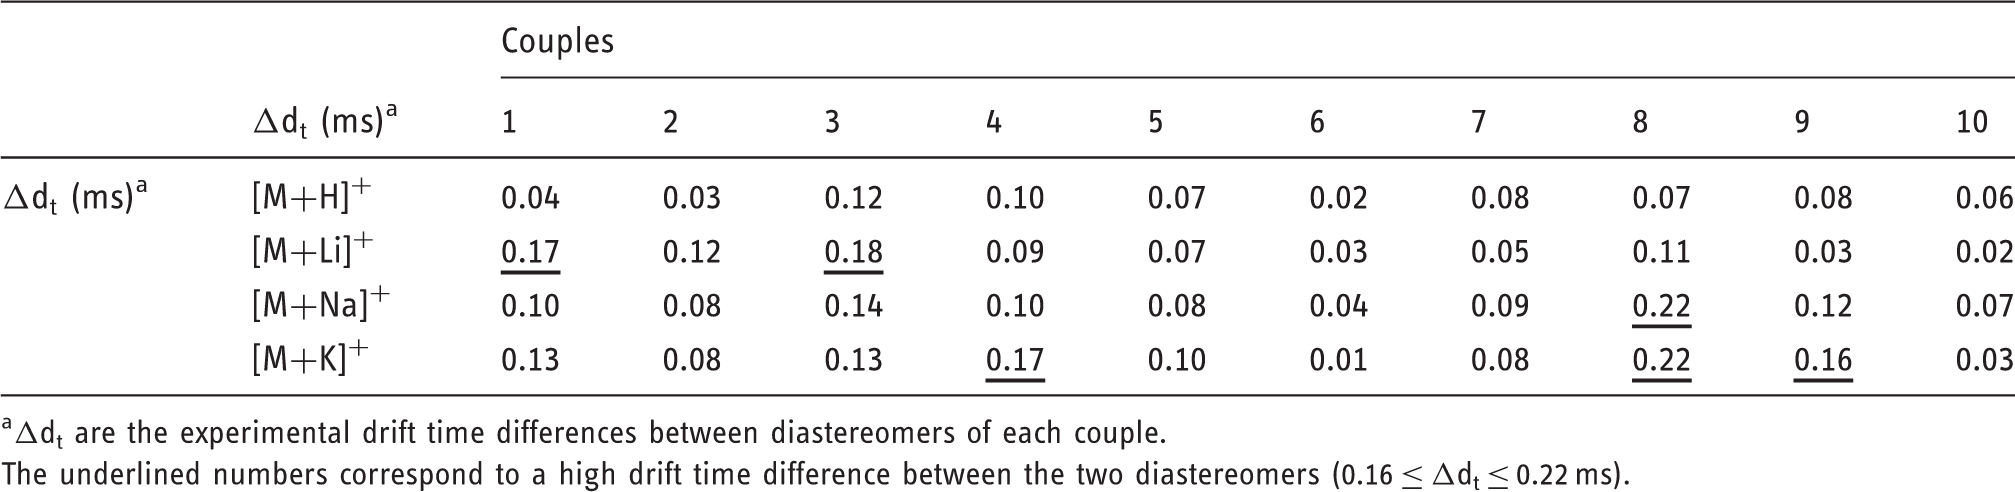
IMS-MS analyses have been first carried out on the protonated species of each diastereomeric couple. The drift time differences between the two diastereomers are given in Table 1 (these values correspond to the mean value obtained from 10 analyses). Although the structure of each couple is close, three behaviors could be observed. First, a very small drift time difference between the two diastereomers (Δdt: 0.02–0.04 ms) is observed for the couples 1, 2, and 6. Second, a medium drift time difference between the two diastereomers (Δdt: 0.06–0.07 ms) is obtained for the couples 5, 8, and 10. Finally, a large drift time difference between the two diastereomers (Δdt: 0.08–0.12 ms) is observed for the couples 3, 4, 7, and 9. An example of each of these behaviors is given Figure 4. It should be noted that the smallest drift time is always obtained for the syn form. In the third case, although the drift time difference is significant, it is not sufficient to obtain the separation of the two diastereomers in mixture (data not shown). However, because of the reproducibility of the drift time measurement, it is possible to estimate the amount of isomeric species by procedures described previously.11,12 In fact, only unresolved peaks are obtained when a mixture of diastereomers is analyzed. In order to increase the drift time difference between the two diastereomers, a study of cationized species has been carried out.
Overlay of ion mobility spectra for [M+H]+ ions of diastereomers showing drift time difference values in milliseconds and recorded using N2 as drift gas. Solid lines: ion mobility spectra for syn form. Dotted lines: ion mobility spectra for anti form. Drift time differences obtained for the [M+H]+, [M+Li]+, [M+Na]+, and [M+K]+ ions between diastereomers of each couple. Δdt are the experimental drift time differences between diastereomers of each couple. The underlined numbers correspond to a high drift time difference between the two diastereomers (0.16 ≤ Δdt ≤ 0.22 ms).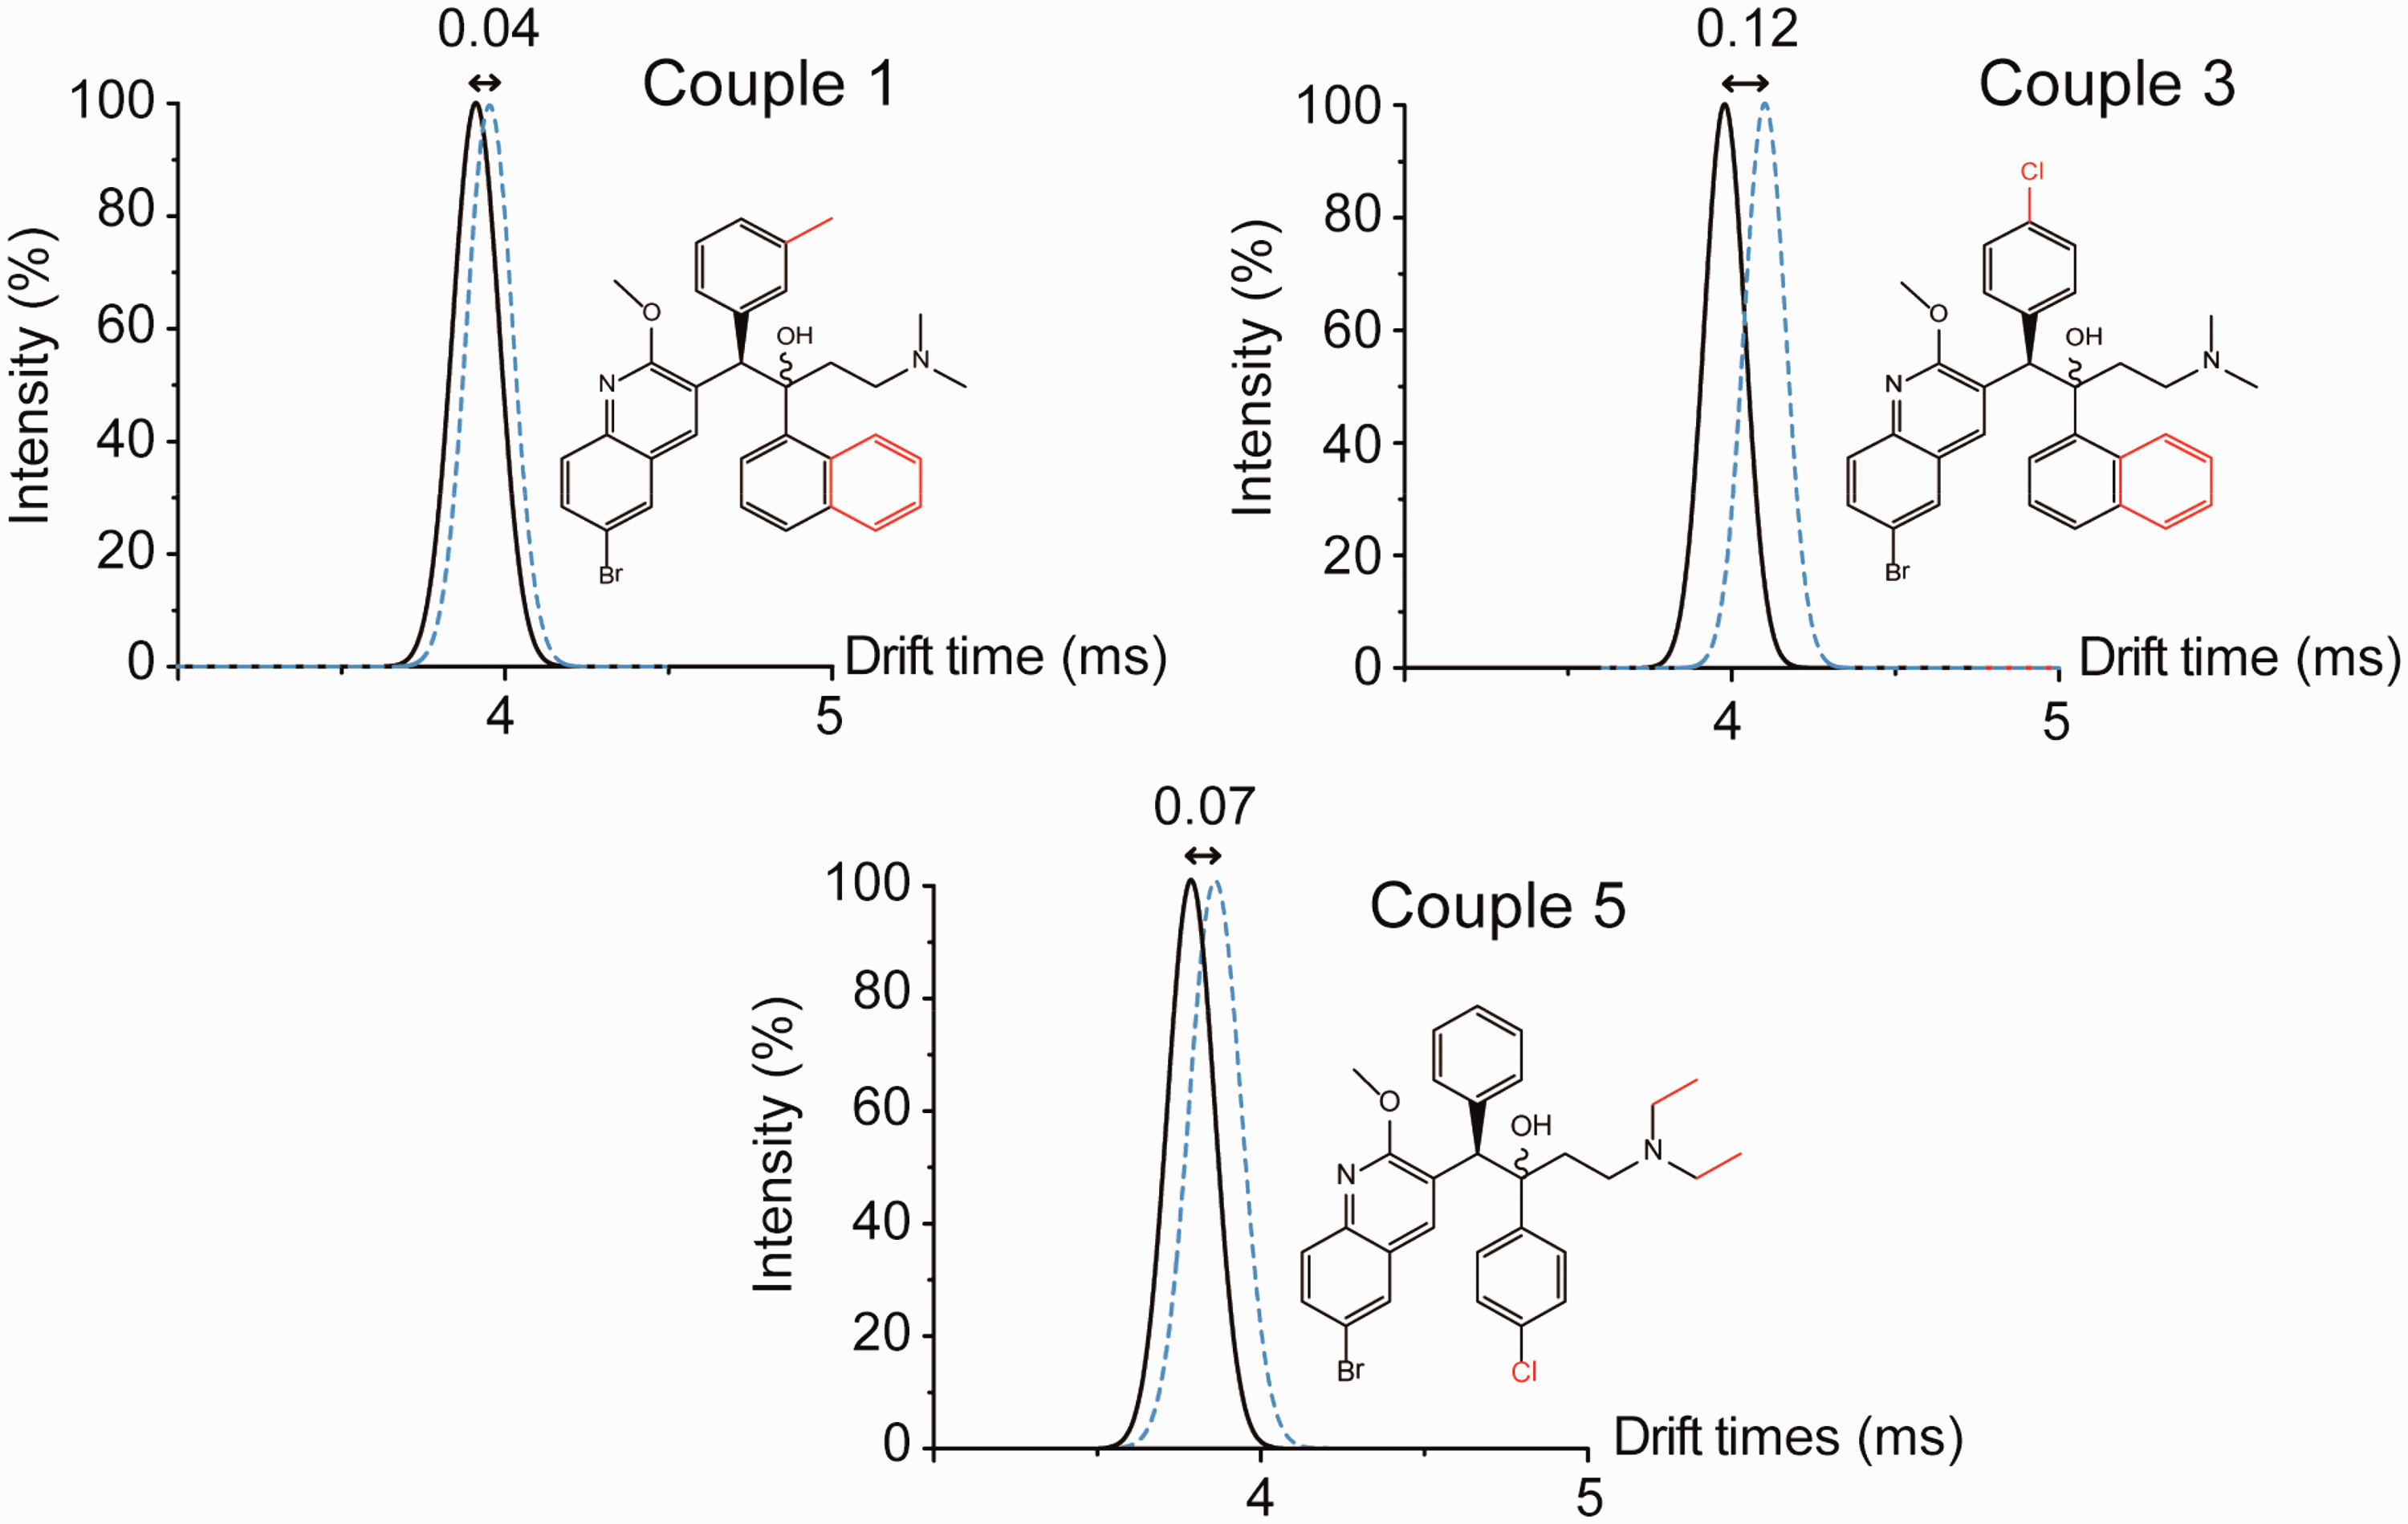
IMS-MS analysis of the [M+X]+ ions (X: Li, Na, and K)
Studies reported in the literature have shown that the use of cations increases the drift time difference between isomers.12,28,29 Cationized diastereomers have been therefore analyzed by IMS-MS for each diastereomeric couple. Drift time differences between diastereomers obtained for the 10 couples are given in Table 1 (these values correspond to the mean value obtained from 10 analyses).
First, for each couple, the cationization with alkali metal allows an increase of the drift time difference between the two diastereomers. In most cases, the increase of the drift time difference is significant: increase of 0.07–0.15 ms compared to the protonated molecules (this is the case for the couples 1, 2, 3, 4, 8, and 9), which present a phenyl or a naphthyl group in the B position (cf. Figures 1 and 2). However, in four cases, for the couples 5, 6, 7, and 10, there is no significant improvement of drift time difference between the two diastereomers with alkali metal compared to the protonated species.
Second, the effect of the cationization is different between different diastereomeric couples. The greatest drift time difference between diastereomers is obtained with the lithium for the couples 1, 2, and 3. For these three couples, the phenyl in A position is substituted and a naphthyl group is in the B position. The sodium allows the best differentiation for the couples 6, 7, 8, and 10. For the couples 4, 5, 8, and 9, the greatest drift time difference between the two diastereomers is obtained with potassium.
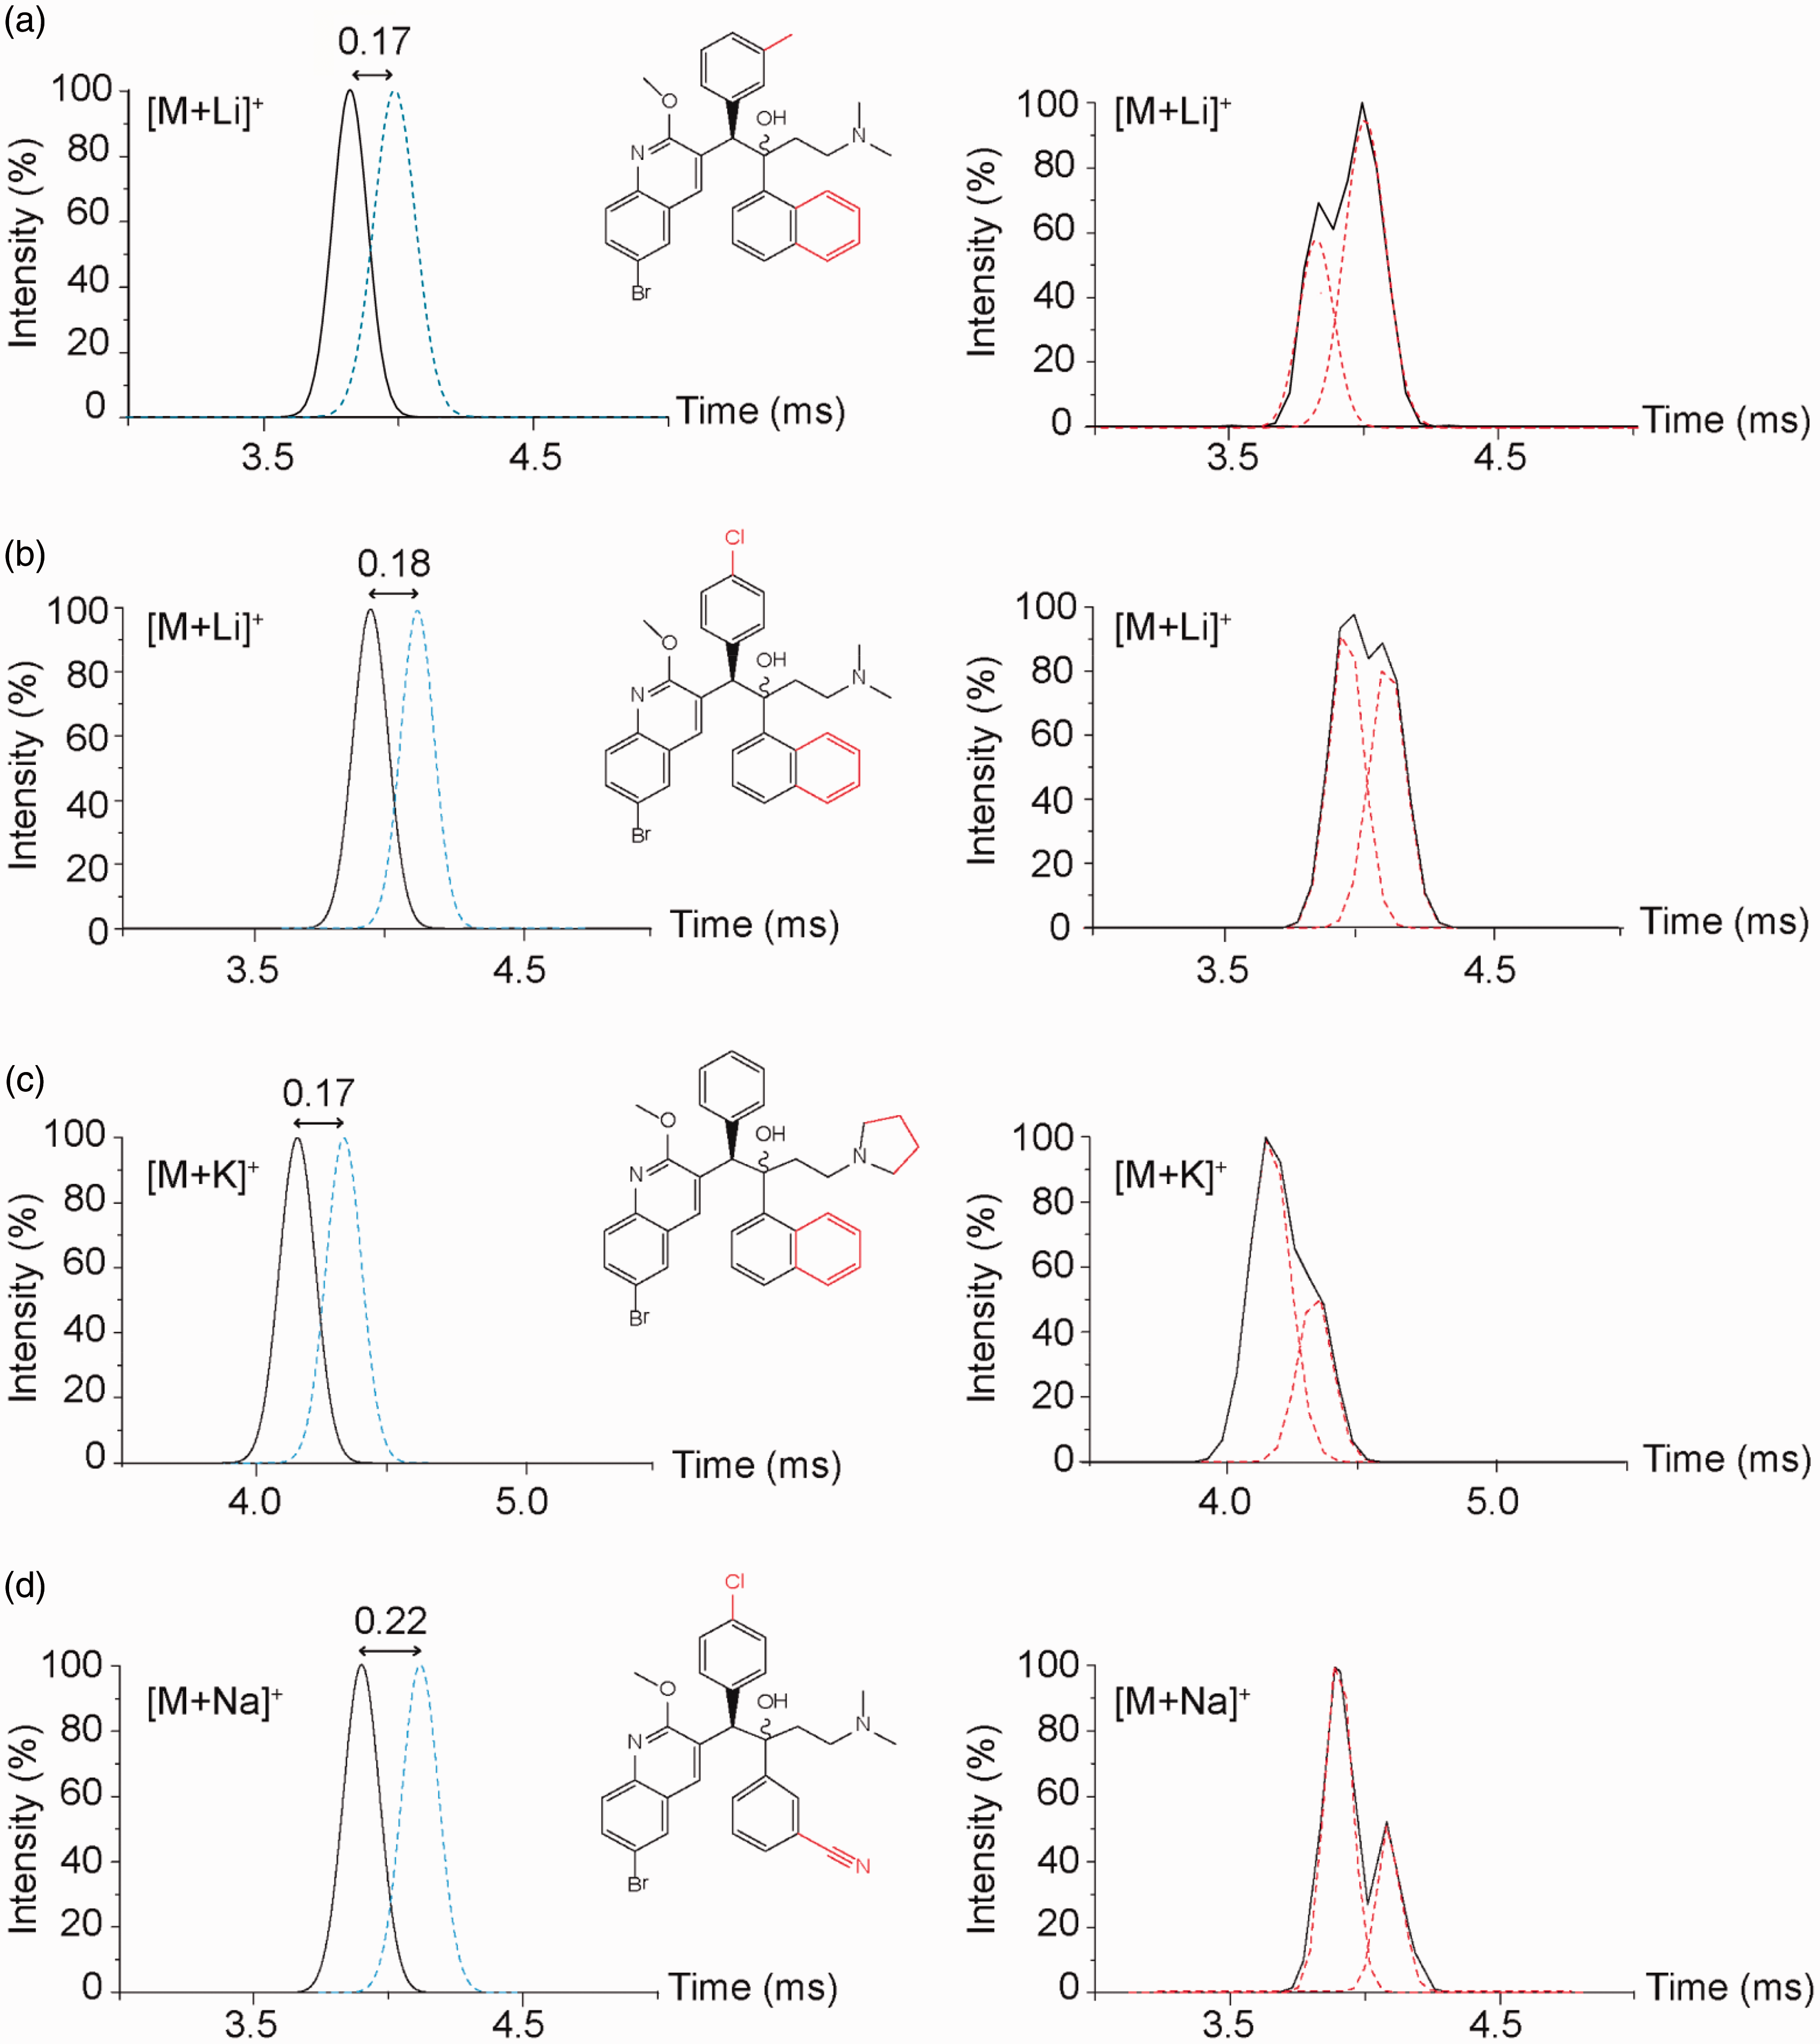
Third, thanks to the alkali metal cationization, three behaviors in ion mobility separation are noticed and are represented Figure 5. In the first zone, the drift time difference between diastereomers is higher than 0.16 ms and a separation in mixture is possible, as shown in Figure 6. In the second zone, Δdt is situated between 0.11 and 0.16 ms. In this case, the proportion of each diastereomer in a mixture solution can be determined by the drift time measurement via a calibration curve. Indeed, mixtures with various proportions of syn and anti compounds were analyzed using TWIMS-MS and the drift times of the [M+Li]+ ion (for couple 2) and the [M+K]+ ion (for couple 9) were determined. Figure S3 shows the results obtained for these mixtures from 0 to 100% of the syn form. These analyses showed a good correlation between the syn/anti ratio and the drift time of mixture. The data were sufficiently accurate and reproducible to obtain a linear calibration curve with R2 = 0.98. Therefore, the proportion of each diastereomer in a mixture solution could be easily determined by the drift time measurement of the [M+X]+ ion.
Representation of the drift time differences between diastereomers for each couple depending on the studied adducts: [M+H]+, [M+Li]+, [M+Na]+, or [M+K]+. Zone 3: 0.01 ≤ Δdt ≤ 0.10 ms; Zone 2: 0.10 < Δdt ≤ 0.16 ms; Zone 1: Δdt > 0.16 ms. Ion mobility spectra obtained for diastereomers couples. On the left: ion mobility spectra obtained for each diastereomer analyzed separately (solid lines: ion mobility spectra for syn form. Dotted lines: ion mobility spectra for anti form). On the right: ion mobility spectra obtained for an analysis of diastereomers mixture. (a) couple 1, (b) couple 3, (c) couple 4, and (d) couple 8.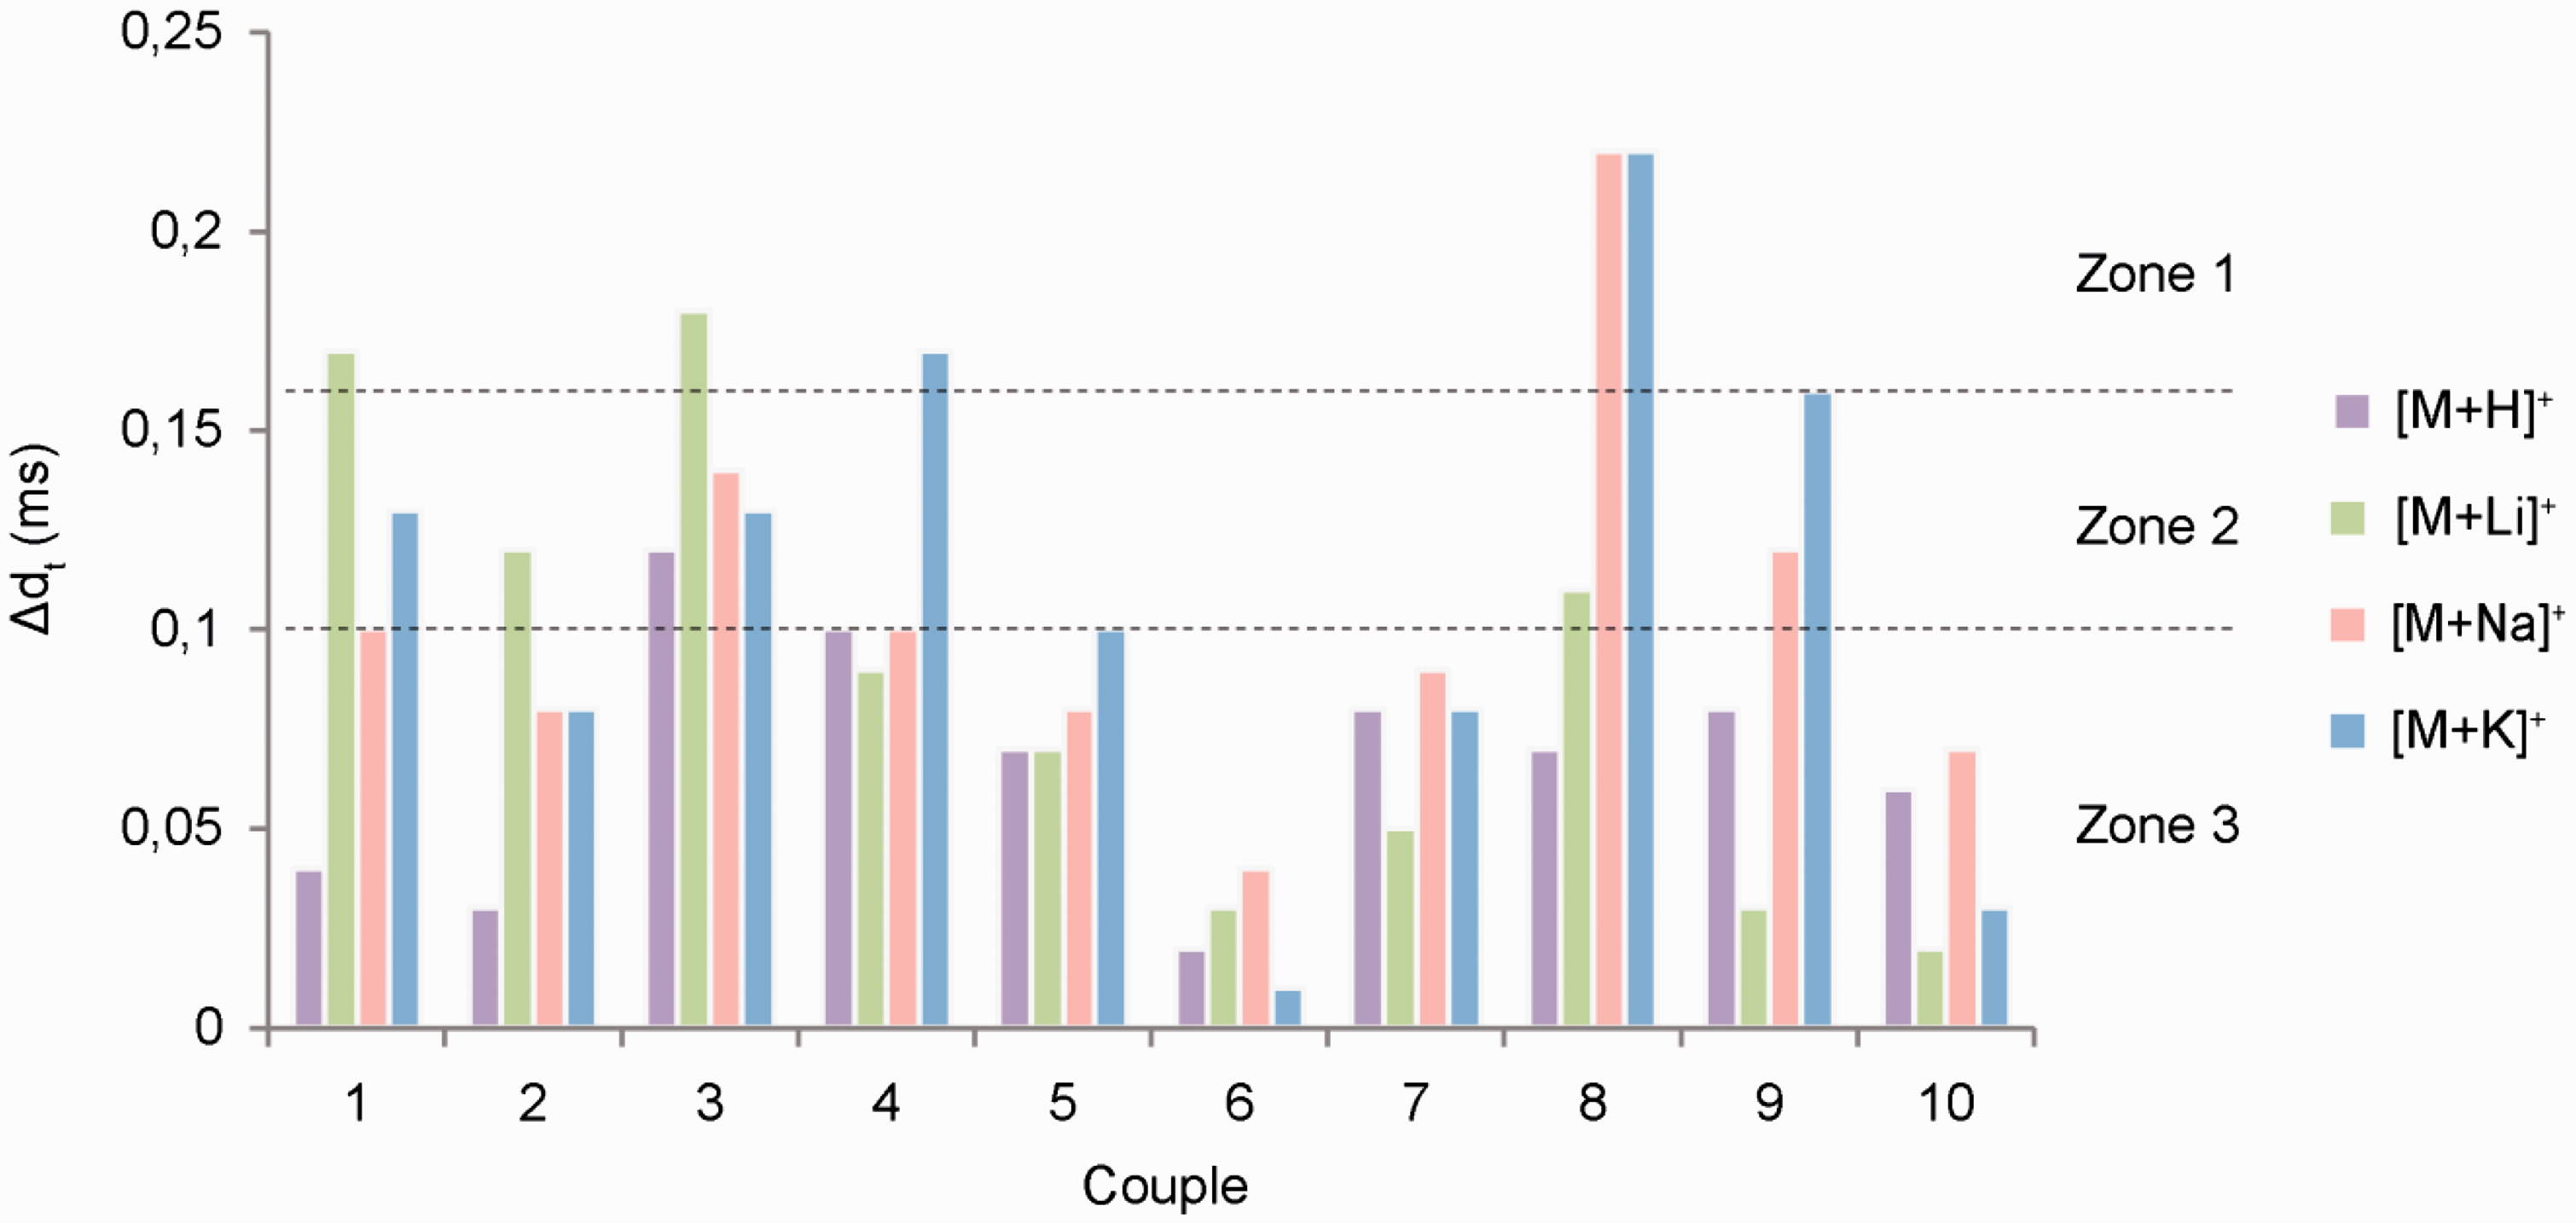
Finally, in the third zone, Δdt is situated between 0.01 and 0.10 ms. In this case, the drift time difference is significant but the determination of proportion of each diastereomer via a calibration curve, or the separation in mixture, is not possible. In order to increase the drift time difference for these couples (5, 6, 7, and 10), the buffer gas in the TWIMS cell has been modified.
IMS-MS analysis of the [M+X]+ ions (X: Li, Na, and K) with other buffer gases
Drift time differences obtained for the [M+H]+ and [M+X]+ ions (X: Li, Na, K) between diastereomers of couples 5, 6, 7, and 10 for different IMS gases.
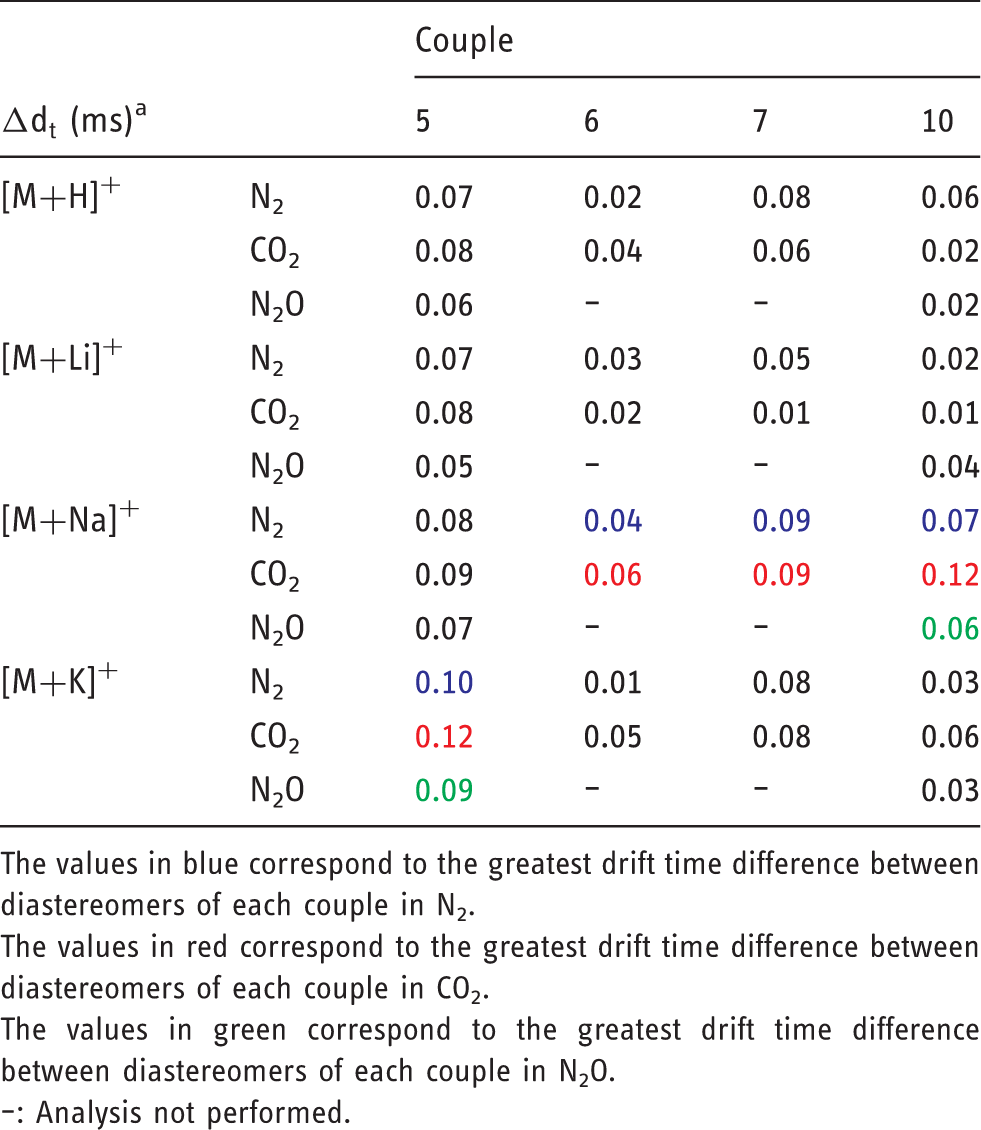
The values in blue correspond to the greatest drift time difference between diastereomers of each couple in N2.
The values in red correspond to the greatest drift time difference between diastereomers of each couple in CO2.
The values in green correspond to the greatest drift time difference between diastereomers of each couple in N2O.
: Analysis not performed.
CCS exp versus CCS theo
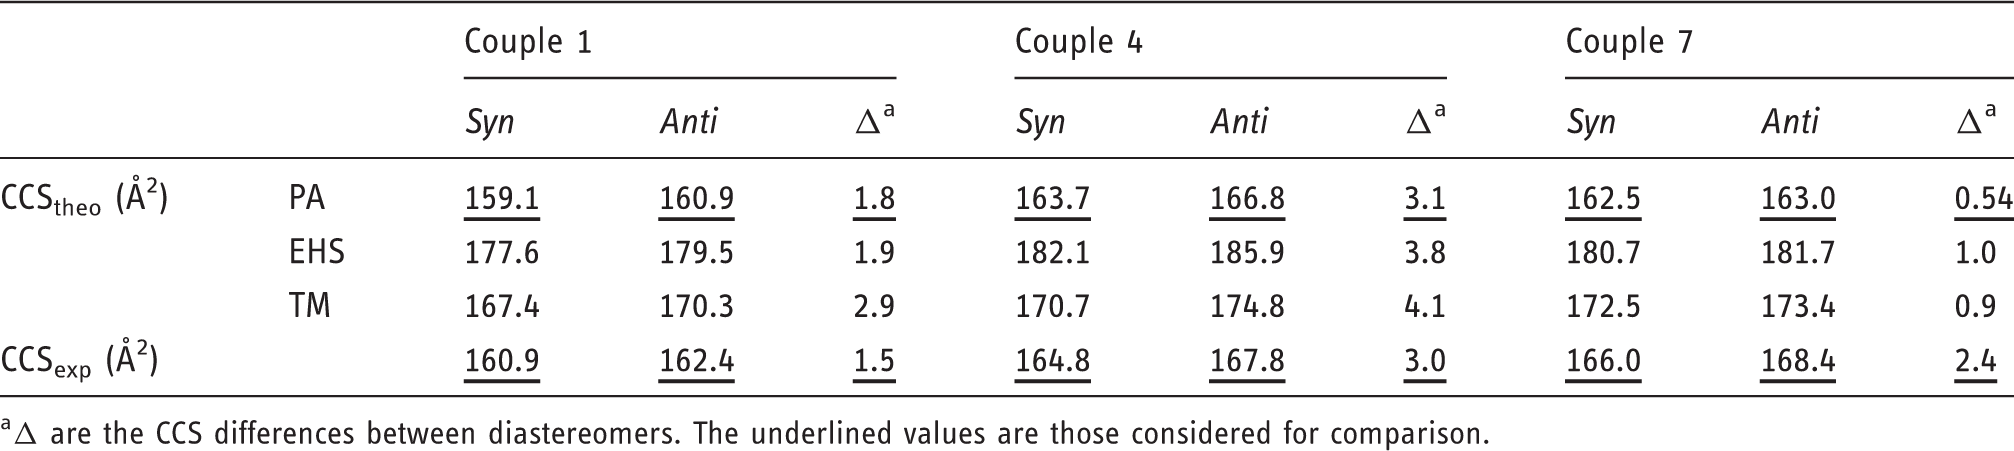
In order to attribute a three-dimensional structure to each diastereomer based on the IMS-MS data, DFT calculation was carried out on three diastereomeric couples: couple 1 (Δdt for the [M+H]+: 0.04 ms), couple 4 (Δdt for the [M+H]+: 0.10 ms), and couple 7 (Δdt for the [M+H]+: 0.08 ms). To achieve this, the most stable conformation of the protonated molecule has been determined by DFT for each diastereomer. Then, theoretical CCSs have been calculated using MOBCAL with the different methods: PA, EHSS, and TM.24,25 These results, compared to the experimental CCS (determined via a calibration of the TWIM cell with polyalanine), are shown in Table 3. The best correlation between experimental and calculated CCS values was obtained with the PA method. In all cases, syn species displayed smaller CCS values than those calculated for anti species. Thus, as expected, the syn species present the most compact structures. The tridimensional structures of couples 1 and 7 could be also compared as their masses are very close. The couple 1 showed the smallest CCS values indicating the most compact structure. As an example, the tridimensional structures of syn and anti species of couple 1 are presented in Figure 7. With the syn configuration the two bulky bicyclic aromatic rings are very close which yield a more compact structure compared to the anti structure. Finally, these results showed a good correlation between experimental and theoretical CCS. The best correlation was obtained with the PA model.
Tridimensional structures for protonated couple 1. (a) Syn and (b) anti. Comparison of the theoretical and experimental CCS for the couples 1, 4, and 7 in the protonated form. Δ are the CCS differences between diastereomers. The underlined values are those considered for comparison.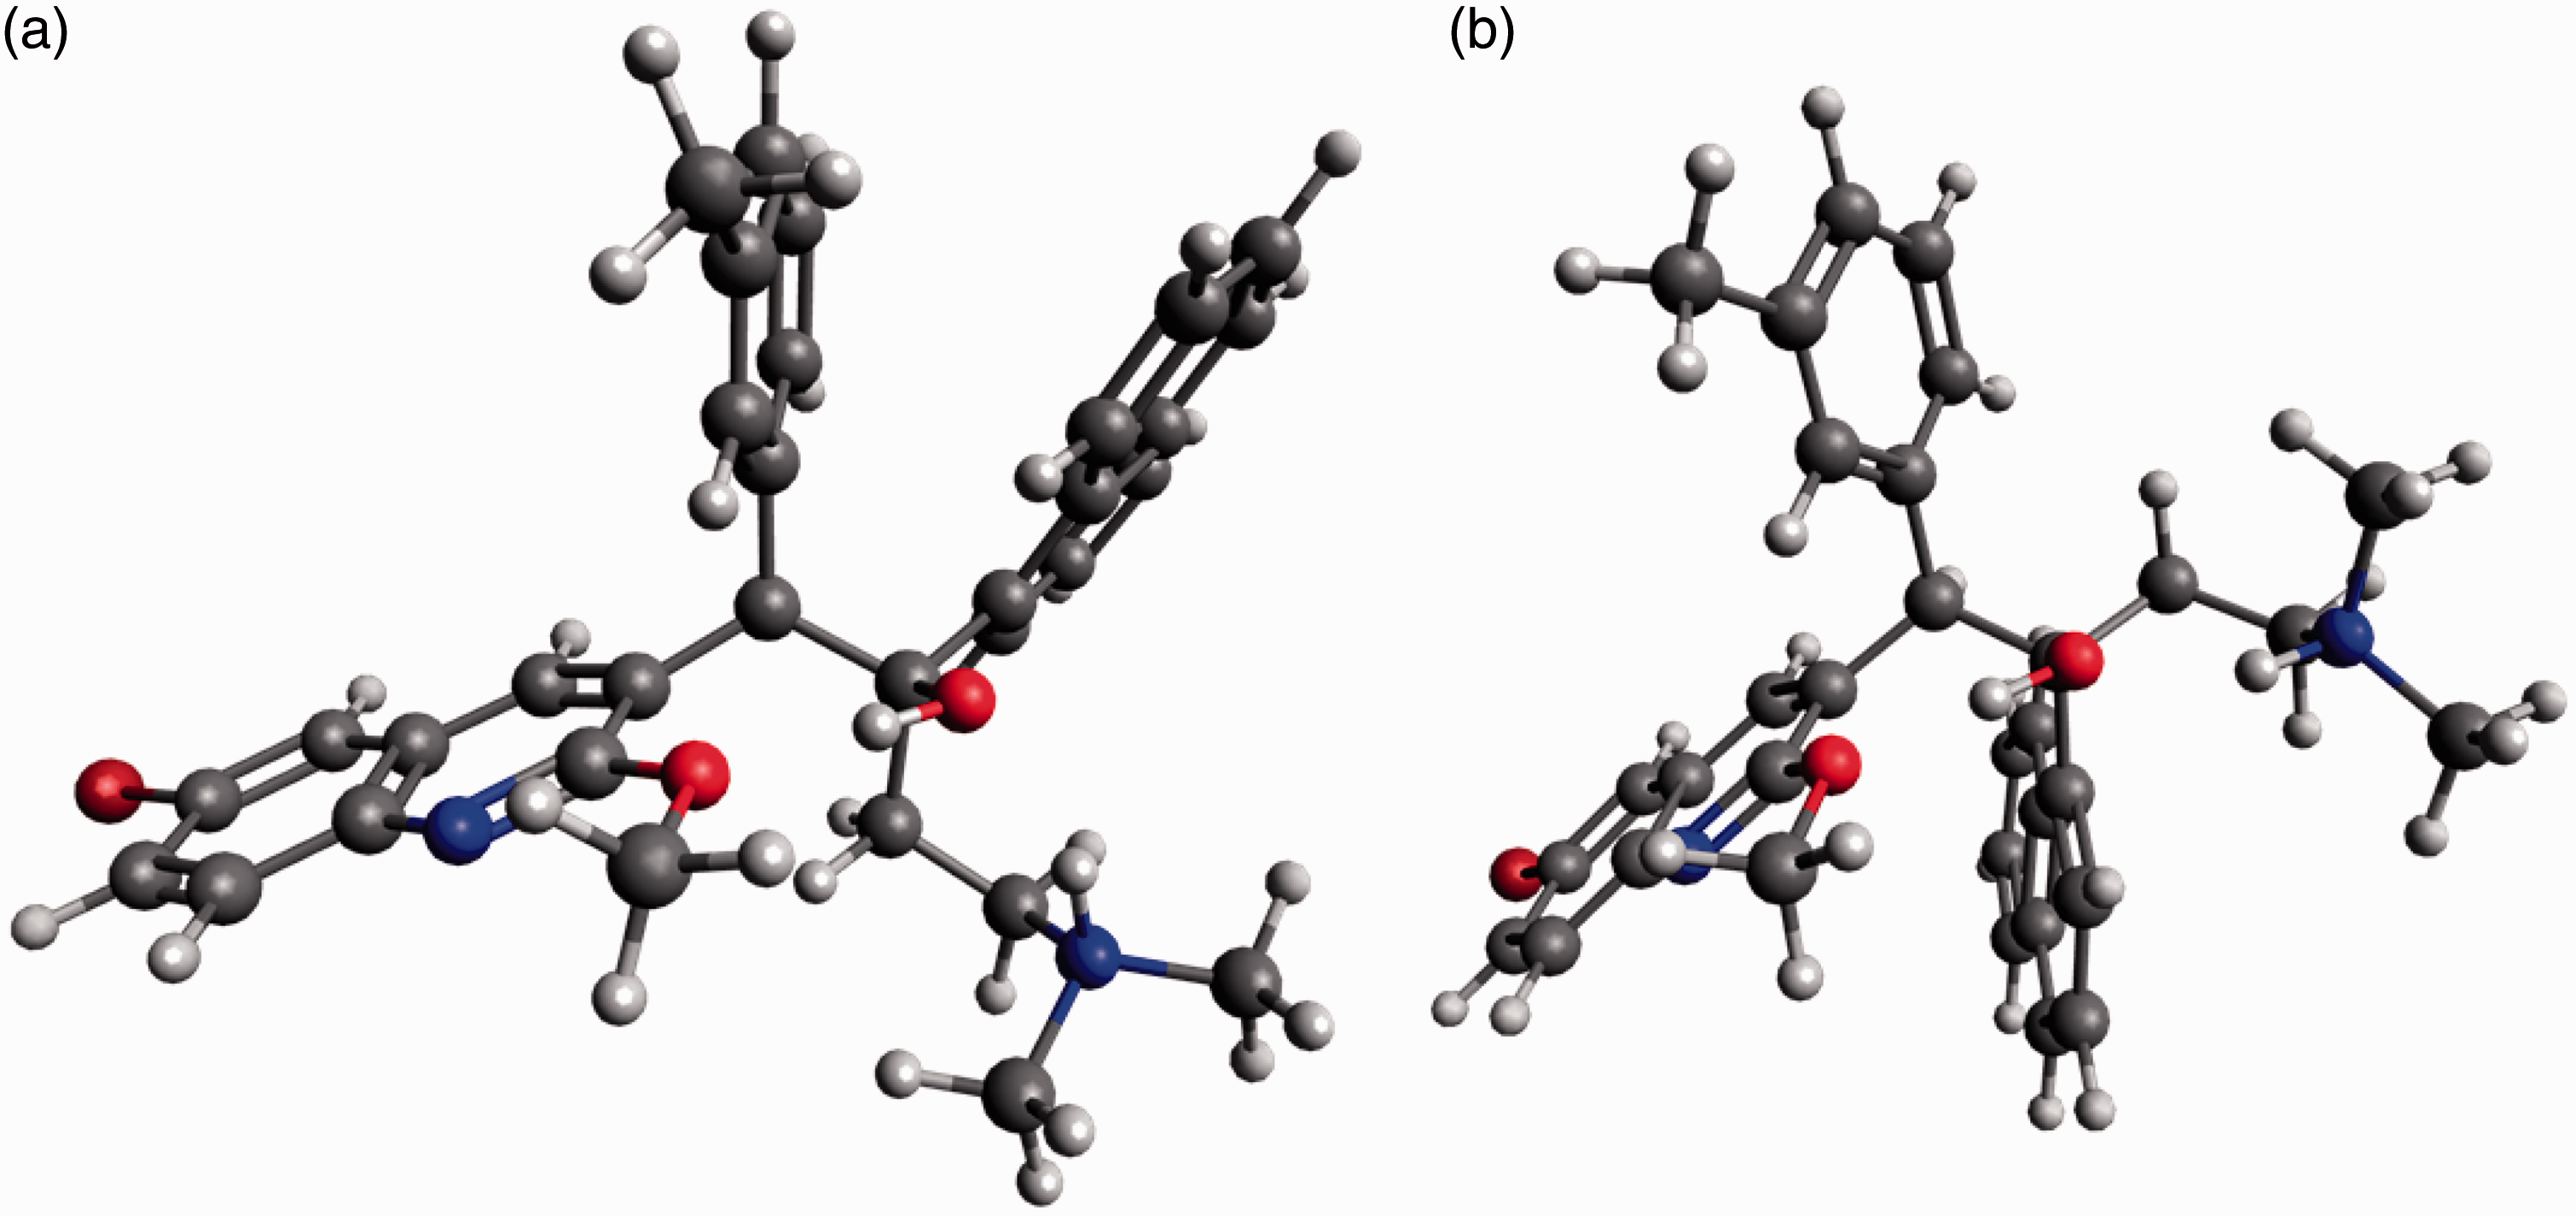
Conclusion
This work reported the evaluation of IMS-MS for the differentiation of a large series of diastereomers with therapeutic properties. For this, the influence of both cationization and drift gas has been studied showing significant drift time differences. Contrary to conventional MS/MS analyses, a diastereomer differentiation from mixtures is easily obtained in few minutes by IMS-MS. Although the structure of each diastereomer is close, several behaviors could be observed concerning the ion (protonated or cationized) and the type of drift gas. Indeed, some diastereomers present a small drift time difference for the [M+H]+ while for others the drift time difference is higher. However, for all cases a significant increase of diastereoisomeric differentiation was obtained with the alkali metal adducts compared to the protonated molecules. The extent of improvement is, however, very dependent on the molecule and type of metal ion without clear relationship as in some cases Li yielded the best differentiation whereas in other cases Na or K yielded the best differentiation. The use of drift gas presenting higher polarizability yielded improvement of separation only in a few cases.
Although the IMS-MS appeared as a powerful approach for diastereomers separation, we cannot explain and predict the behavior of each ion in the ion mobility cell, even for molecules that present very close structure. Consequently, testing different cations and different buffer gases in order to increase the diastereomer differentiation is necessary.
Supplemental Material
Supplemental material for Ion mobility-mass spectrometry analysis of diarylquinoline diastereomers: Drugs used for tuberculosis treatment
Supplemental Material for Ion mobility-mass spectrometry analysis of diarylquinoline diastereomers: Drugs used for tuberculosis treatment by Virginie Domalain, Marie Hubert-Roux, Laurence Quéguiner, Dany JD Fouque, Eric Arnoult, David Speybrouck, Jérôme Guillemont and Carlos Afonso in European Journal of Mass Spectrometry
Footnotes
Declaration of conflicting interests
The author(s) declared no potential conflicts of interest with respect to the research, authorship, and/or publication of this article.
Funding
The author(s) disclosed receipt of the following financial support for the research, authorship, and/or publication of this article: The authors gratefully acknowledge the Region Haute-Normandie (CRUNCh network), the Labex SynOrg (ANR-11-LABX-0029), the European Regional Development Fund (ERDF 31708), and Janssen Company for financial support.
Supplemental Material
Supplemental material is available for this article online.
References
Supplementary Material
Please find the following supplemental material available below.
For Open Access articles published under a Creative Commons License, all supplemental material carries the same license as the article it is associated with.
For non-Open Access articles published, all supplemental material carries a non-exclusive license, and permission requests for re-use of supplemental material or any part of supplemental material shall be sent directly to the copyright owner as specified in the copyright notice associated with the article.