
Abstract
Irreversible protein footprinting is a mass spectrometry–based approach in which solvent-accessible sites of a protein are modified to assess high-order protein structure. Structural insights can be gained by determining the position and extents of modification. The usual approach to obtain the “footprint” is to analyze the protein through bottom-up LC-MS/MS. In this approach, the proteins are digested to yield a mixture of peptides that are then separated by LC before locating the modification sites by MS/MS. This process consumes substantial amounts of time and is difficult to accelerate for applications that require quick and high-throughput analysis. Here, we describe employing matrix-assisted laser desorption/ionization (MALDI) in-source decay (ISD) to analyze a footprinted small test protein (ubiquitin) via a top-down approach. Matrix-assisted laser desorption/ionization is easily adapted for high-throughput analysis, and top-down strategies can avoid lengthy proteolysis and LC separation. We optimized the method with model peptides and then demonstrated its feasibility on ubiquitin submitted to two types of footprinting. We found that MALDI ISD can produce a comprehensive set of fragment ions for small proteins, affording footprinting information in a fast manner and giving results that agree with the established methods, and serve as a rough measure of protein solvent accessibility. To assist in the implementation of the MALDI approach, we developed a method of processing top-down ISD data.
Keywords
Introduction
Recent advances in new biophysical tools have fueled progress in understanding protein structure and interactions. Among them, irreversible footprinting is playing an increasingly important role in deciphering protein systems.1–8 Compared to the established reversible footprinting method of hydrogen–deuterium exchange, irreversible labeling allows more efficient and more effective sample handling and analysis, even repeated analysis, after the labeling, opening new opportunities to many biological challenges not addressable previously.
In irreversible protein footprinting, reactive labeling reagents modify solvent accessible amino acid side chains. Some footprinting techniques can label a broad variety of targets. For example, fast photochemical oxidation of proteins (FPOP) generates hydroxyl radicals by an excimer laser (KrF at 248 nm) irradiation to oxidize theoretically up to 14 of the 20 side chains 9 of the common amino acids. Other slower footprinting methods specifically modify certain amino acids; an example is glycine ethyl ester (GEE) labeling that footprints carboxyl side chains of Asp and Glu after the side-chain carboxyl groups are activated by 1-ethyl-3-(3-dimethylaminopropyl)carbodiimide (EDC, commonly used as a zero-length crosslinker) followed by reaction with the nucleophilic GEE. 10 The extent of the labeling is determined by target “chemical accessibility” governed by the chemical reactivity and the solvent accessibility. The modifications made in a protein footprinting experiment can thus “encode” the structural information of interest.
Bottom-up peptide mapping after enzymatic digestion coupled with matrix-assisted laser desorption/ionization (MALDI)-based mass spectrometry represents one of the first applications of MS-based footprinting done by Michael Przybylski and his students.11–14 We are honored to contribute this article to honor the memory of Professor Przybylski and his significant and early contributions to protein mass spectrometry and footprinting.
With advances in instrumentation, bottom-up, electrospray ionization (ESI)-based LC-MS/MS analysis has replaced the MALDI method pioneered by Professor Przybylski to become the prevalent approach for protein footprinting because it achieves good sequence coverage and locates accurately the positions of modification.
Nevertheless, bottom-up LC/MS/MS is relatively time-consuming, and the time of the MS analysis has not significantly improved despite breakthroughs in other fields. LC-MS/MS bottom-up analysis is inherently limited in speed because it requires (1) lengthy digestion procedures, (2) time-consuming HPLC gradient and re-equilibrium times, and (3) chromatographic methods for desalting proteins. All these downsides may hinder a broader adoption of footprinting particularly in routine applications such as high-order structure monitoring in protein quality control.
Previously, we demonstrated that MALDI can be used to facilitate the bottom-up protein footprinting analysis. 15 In the present work honoring Michael Przybylski, we appropriately employed MALDI but now with in-source decay (ISD) to increase the throughput and information content from the MS analysis for protein footprinting. We also describe a spectrum analysis method to find and quantify each peak in the ISD mass spectrum.
In the ISD process, the proteins are fragmented in the mass spectrometer source region, following pulsed laser irradiation and before ion extraction. All ions in the source are submitted to ISD without mass limitation—a desired feature for analyzing biomolecules like proteins. Previous work confirmed that MALDI (ISD) can produce protein fragments with high sequence coverage.16–18 Investigators showed that the technique can be used to de-novo sequence a protein up to 13 kDa. 19 In-source decay offers an alternative solution that avoids the lengthy proteolysis/desalting/LC process by analyzing the intact footprinted proteins in a “top-down” fashion, thus radically reducing the analysis or instrument time. The approach can build on previous and extant MALDI approaches developed for automated high-throughput analysis.20–23
We optimized and tested the ISD approach on model peptide and a small protein subjected to either residue-specific footprinting or fast unspecific footprinting. We found that MALDI ISD, a top-down approach, can effectively increase the speed of analysis, while still reporting the protein solvent-accessible surface area (SASA) information that constitutes a footprint.
Materials and methods
Materials
The ACTH 1-17,
Calibration
The model peptide ACTH 1-17 was fully oxidized by incubating 100 μM peptides with hydrogen peroxide at 1:1000 molar ratio for 6 h. The oxidation was quenched by 0.5 μL catalase (18 μM). To obtain the multiple calibration curve points, the peptides were mixed in ratios of oxidized/(wild + oxidized) at 0%, 5%, 10%, 20%, 50%, 75%, and 100% to yield a total concentration of 100 μM, before MS analysis.
Fast photochemical oxidation of protein
The protein sample of ubiquitin, 10 μM in PBS was incubated with 20 mM H2O2 and 500 μM histidine before injection into the FPOP tubing. The flow rate was adjusted to give ∼20% irradiation-excluded volume to avoid repetitive laser exposures. The laser beam was from a KrF excimer laser (GAM Laser Inc.), providing an excitation wavelength of 248 nM to yield hydroxyl radicals by H2O2 photolysis. After laser irradiation, the sample solution was collected in a tube containing 10 mM catalase and 20 mM Met to quench leftover H2O2 and prevent post-labeling oxidation. Samples of each state were subjected to FPOP in duplicate.
GEE labeling
For GEE labeling, GEE, 1-ethyl-3-(3-dimethylaminopropyl) carbodiimide (EDC) stock solutions were prepared fresh in PBS buffer. Glycine ethyl ester was added to each pre-equilibrated sample, followed by the addition of EDC. The final concentrations of protein, GEE, and EDC were 10 μM, 200 mM, and 50 mM, respectively. The reaction was carried out for 1 h, before quenching by adding an equal volume of 1 M ammonium acetate and by desalting with a Zeba column (Thermo Scientific, Rockford, IL).
MALDI sample preparation
For MALDI-based studies, a matrix solution of 1,5-DAN was prepared as 10 mg/mL in 70% aqueous acetonitrile. Ten microliters of protein solution were desalted by a Zeba column following the manufacturer's instructions, before mixing with 10 μL of matrix solution in an Eppendorf tube and vortexing for at least 60 s. For the fructose-spiked matrix solution, fructose was made to a final concentration of 10 mg/mL. Aliquots (2 μL) of the mixture were spotted onto the MALDI stainless steel target plate and air-dried.
Mass spectrometry
A Bruker Daltonics UltrafleXtreme MALDI TOF/TOF mass spectrometer (Bremen, Germany) equipped with a Smartbeam-II laser was used to acquire MALDI-based mass spectrometry data. The instrument, equipped with a reflectron that was used for these experiments, was operated in the positive-ion mode. The Ion Source 1 was supplied with 20 kV acceleration voltage, and 17.65 kV was applied to Ion Source 2. The pulsed ion extraction delay was set to 130 ns. The Smartbeam-II Laser parameters were as follows: global attenuator offset, 20%; attenuator offset, 40%; attenuator range, 40%; and the laser spot size was set to “3_Middle.” The laser was operated at 1000 Hz for data acquisition. The laser fluence was defined as 100% laser power minus laser beam attenuation that was controlled by the instrument operator. For MALDI ISD, the laser fluence was set to twice the threshold. Ion signals from 10000 consecutive laser shots were summed to give an averaged spectrum. Ion signals below m/z 500 were suppressed to avoid matrix interference.
Spectrum analysis
For the identification of the fragment ions in the lower mass range where isotopes could be individually resolved at one half peak maximum, the monoisotopic mass was used; in the higher mass range where isotope clusters could not be resolved, the average mass was used. The fragments ions were considered identified when the signals were within 0.2 Da of their theoretical m/z, and the isotopic pattern agreed with theory, especially in the low m/z range.
For quantification of the fragment-ion signal intensities, a custom peak-modeling and noise-subtraction process was developed to counter the interferences observed in the MALDI spectrum. The process used exported text spectra profiles of mass and intensity, not mass centroid and intensity. The profile spectra showed isotopic patterns of fragments from ISD including one of mass shift of +85 in the GEE footprinting and another one of +16 for FPOP footprinting of ubiquitin.
The process makes use of two methods for the overall protocol (“peak method” and “profile method"). The objective of the peak method was to find and quantify each peak, fit the series of spectral peak intensities with a model peak intensity series that is a superposition of a scaled isotopic peak intensity series calculated from the ion molecular formula. This method was used for fragment ions c'7 through c'35. The objective of the profile method was to mark off peak isotope clusters by using an approximation of the unresolved isotopic pattern profile and then fit the cluster spectral profiles with model profiles from a superposition of scaled isotopic profiles calculated using Gaussian peak models that used the molecular formula of the fragment. This method was used for c'35 through c'75.
The mass spectral processing was controlled by two parameters: an estimate of the peak width at half height and the peak detection threshold signal-to-noise ratio (sigma). For the peak method, the peak width at half height was set as one would expect, whereas for the profile method, the peak width at half height was set to an estimate appropriate for an unresolved component isotopic pattern. The spectrum analysis began with dual basis functionals for a model Gaussian function, linear and constant functions centered at each spectrum point being computed. The dual basis functional for the Gaussian applied for each spectral point gave an estimate of the amplitude of the Gaussian peak that could be centered at that point irrespective of baseline and slope. If the estimated Gaussian amplitude was less than a predetermined fraction of the difference between the local maximum and minimum, the spectral point was marked as noise. The dual basis functional for a Gaussian was applied to a noise spectrum constructed by random resampling the noise points. “Sigma” times the standard deviation of the functional output gave the threshold for the functional output for a detected peak. Shifted versions of the applied Gaussian dual basis functional were used as approximate models for the probability of the beginning and end of peaks in the arbitration for marking the interval for each spectrum peak or unresolved isotopic profile.
The peak method proceeded separately as follows for a spectrum window around each unmodified c-ion. The spectrum was corrected by using an estimated baseline for each peak interval as the highest level or line that does not produce a negative difference in the neighborhood of the peak ends. For each peak interval, the intensity sum, m/z centroid, second moment were calculated. This was followed by the calculation of the amplitude of a model Gaussian with the same centroid, second moment, and intensity sum when sampled at the spectrum profile m/z values in that interval. This step mitigated artifacts caused by the discrete representation of the spectrum profile (e.g., “picket fence” errors and different number of points per peak). These amplitudes were used as the peak intensities. Peaks that had centroids that were close to those of the theoretical model, calculated by using crude component intensity estimates, were listed as a column vector left of an equal sign. This was followed by the construction of a linear matrix problem in which each right-of-the-equal-sign matrix column represented the theoretic isotopic intensities of a fragment from a table of molecular formulae of possible modifications of the unmodified c-ion that might appear in the spectrum. The right most row matrix corresponded to a list of the solved overall isotopic pattern intensities. The matrix problem was solved using a singular value decomposition method to obtain isotopic pattern signal intensities so that the linear combination of the isotopic patterns gave the column of peak intensities. For GEE labeling, where the spectra show a “peak at every mass,” the least local maximum was subtracted from the peak intensities in the column list for the matrix problem. The least local maximum was computed over all intervals of peaks that contain the same number of peaks that account for 95% of the total theoretical isotopic intensity of the unmodified c-ion.
The profile method proceeded separately as follows for a spectrum window around each unmodified c-ion. In the profile method, the estimated full width at half height was set to correspond to that of the isotopic pattern envelope of the unmodified c-ion, not that of an individual isotopic peak. The calculated peak intervals then marked off the profile clusters of peaks corresponding to isotopic patterns of fragments. First, for the interval that contained the unmodified c-ion and for all possible modifications listed in a table with significant signal intensities in that interval, a model profile that was a superposition of Gaussian peaks with relative peak intensities appropriate for each isotope was fitted. The centroids of the Gaussian peaks were shifted by a searched parameter “mof” to align the model profile with the input spectrum profile. The Gaussian peak full width at half height was a searched parameter “gbwdth” to match the model to the spectrum profile. The parameters “mof” and “gbwdth” were fixed for further processing. Second, a superposition of all the listed possible modification isotopic pattern profiles was fitted to the spectrum profile covered by the found intervals with only the model overall isotopic pattern profile intensities for each modification varied in the fitting. In each interval, the model profile was superimposed on the linear function with the interval end values varied to model a baseline that provided the best model profile fit.
For the spectrum of ubiquitin modified by FPOP, the unmodified c' fragment and the +16 modified c’ fragments were included in the list of possible modification molecular formulae. For analysis of ubiquitin labeled by GEE, the c’ fragment without modification and the GEE-modified c’ fragment were included in the list of possible components. The fitted targeted modified and unmodified fragment intensities were used to calculate the modification fraction (MF) in each case. The calculations were performed in Mathcad 15 (Parametric Technology Corporation, Needham, MA).
Results and discussion
MALDI ISD of ubiquitin: In addition to bottom-up, a top-down approach can greatly increase the throughput of an analysis by avoiding lengthy proteolysis. MALDI ISD is a fragmentation method that qualifies as top-down and produces high sequence coverage for peptides and proteins through careful choice of a matrix. 24 Some matrices are “hot,” and their use allows transfer of internal energy to the protein ion. Compared to other top-down fragmentation methods, MALDI ISD is easy to conduct and does not require any instrument modification or sample treatment. All those features are desired for a fast and high-throughput analysis method for protein footprinting.
Another advantage of MALDI ISD is that it has a high theoretical mass limit for the sample peptides/proteins even though the charge of the precursor ion is much lower than in ESI. However, the ISD method provided by the manufacturer of the MALDI instrument used here has the sensitivity optimized for the m/z range below 8000. To match that m/z range, we chose ubiquitin, a small protein with 76 amino acids residues and a MW of ∼8650 Da, as the model protein for the following ISD experiments.
We first examined the fragmentation efficiency of ISD on wild type ubiquitin. The resulting mass spectrum (Figure 1) shows that ISD generates a nearly complete c'-series 25 of product ions from c'7 up to protein's [M + H]+ ion. The missing fragments include the first five c'-series ions (c'1 to c'5), which all fall below m/z 800, a region where strong interferences from matrix ions dominate; also missing are c'37 and c'38, where the N-Cα cleavages do not break the peptide chain owing to the proline ring. All other c'-series ions are observed at their theoretical m/z with +1 charge, and they cover 91% of the protein's sequence, illustrating the good fragmentation efficiency of the MALDI ISD, at least for this small protein (Scheme 1).
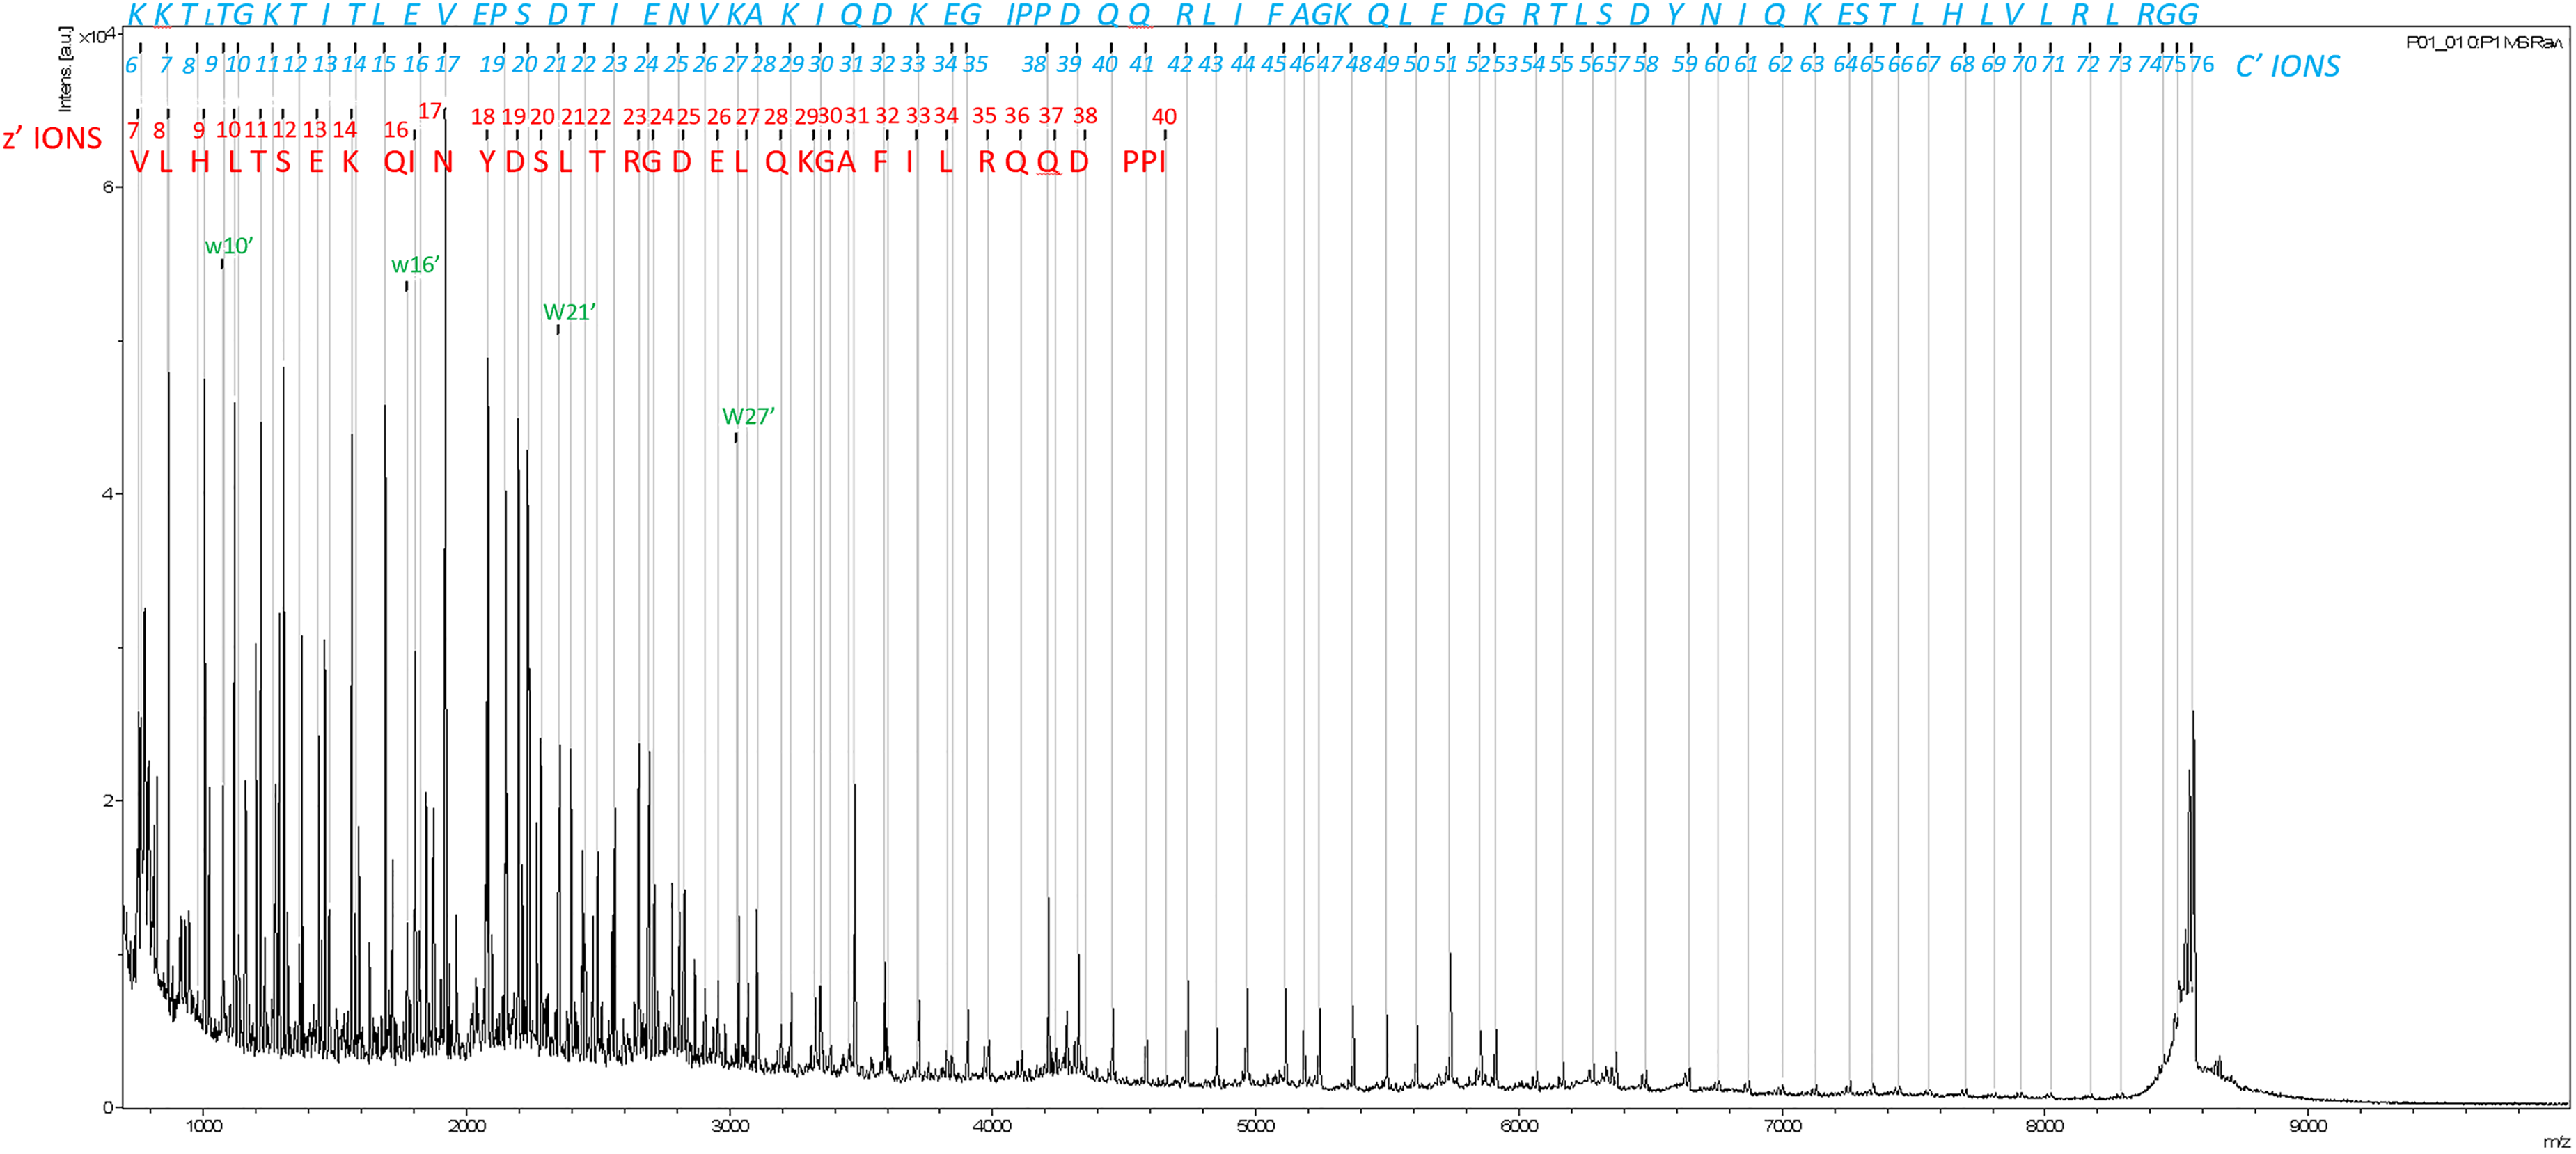
MALDI ISD spectrum of ubiquitin taken over a mass range of m/z 800 to 10,000. The m/z range lower than 800 suffers from extensive matrix interference. The c' (in italics for journal copy, blue for on-line copy), z' (in normal font for journal copy, red for on-line copy) and W ions (designated as “w” in the spectrum, green for on-line copy) cover 91% of the protein's sequence and are overlayed on the spectrum. The letters designating each fragment include the additional amino acid added to the lower mass fragment of same series.
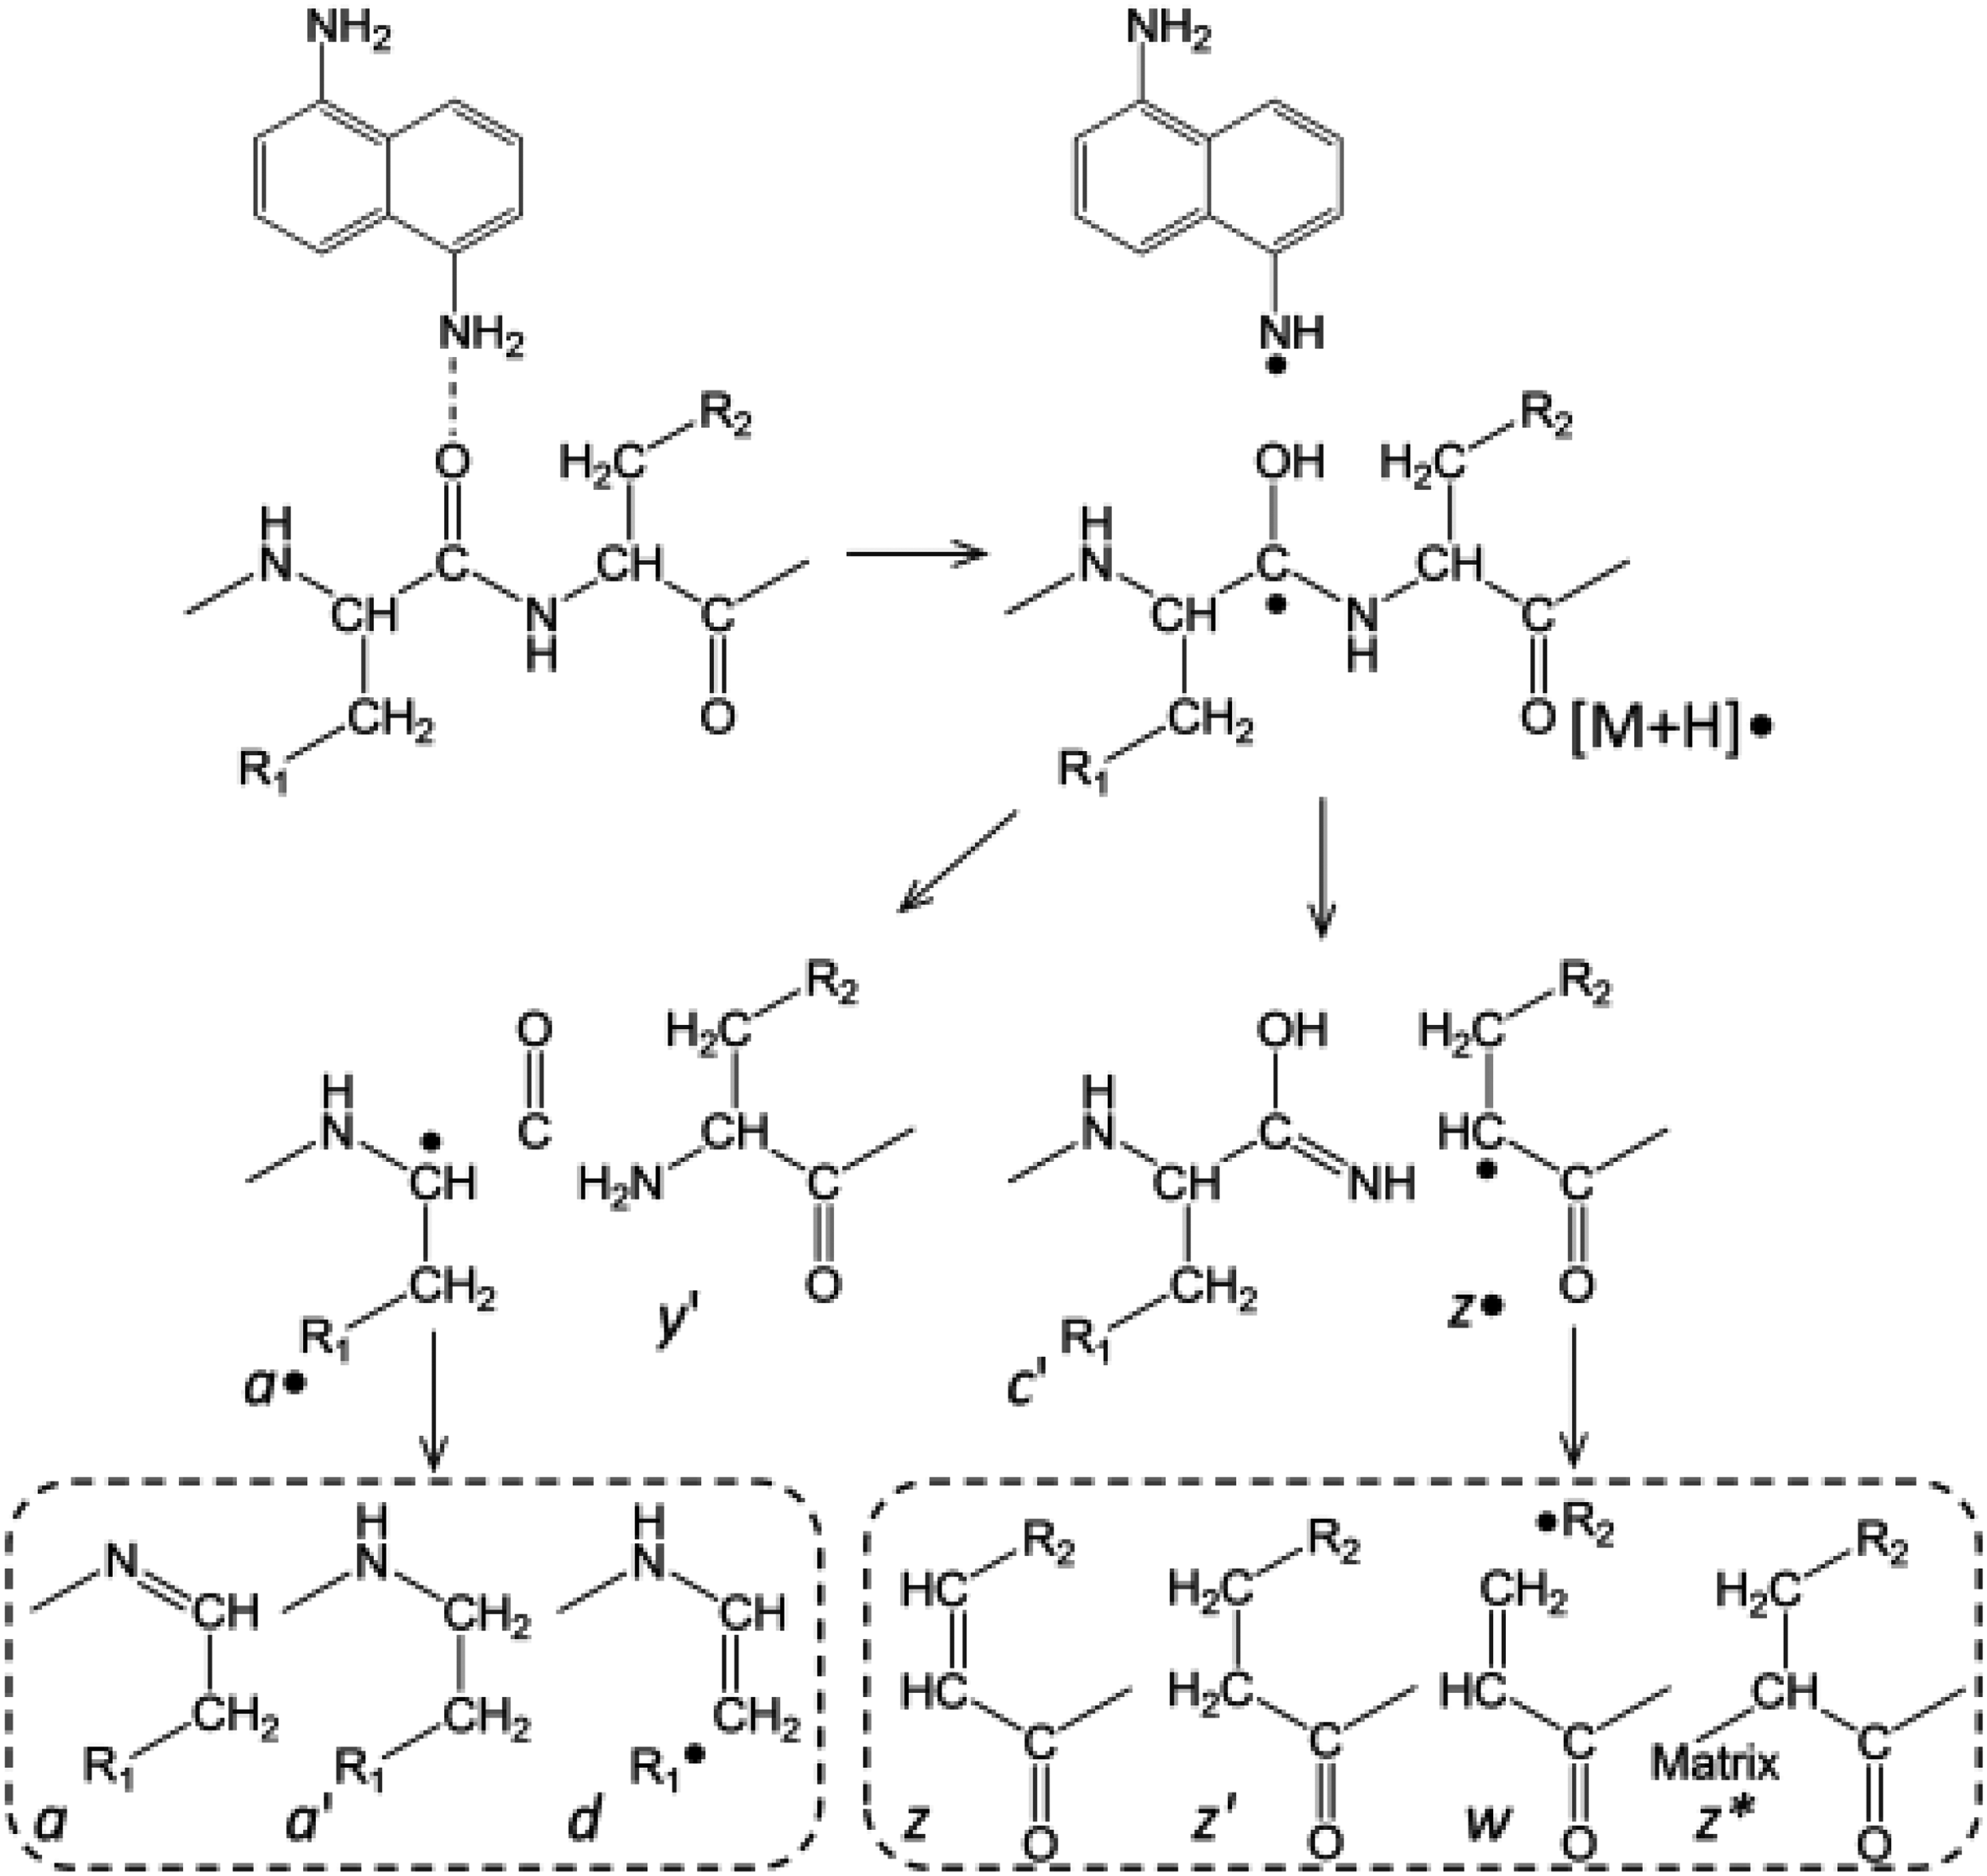
Pathways for fragmentation in MALDI-ISD with 1,5-DAN as matrix. Reused with permission from Ref. 25.
Observed also are z’ fragments, although their sequence coverage is not nearly as complete as those of the c’ series, and their signals decrease in intensity as the m/z increases. Although the c'/z• fragment pairs are generated simultaneously in ISD, 26 the greater prevalence of c'-series ions is usually observed, except when multiple acidic residues are present near the N-terminus.
Calibration Curve for MALDI ISD: We conducted a calibration curve analysis with wild/oxidized ACTH 1-17 as a model to evaluate the ability of MALDI ISD to allow quantification of modifications. In the top-down method, the MF on a single residue i (MFi) is inferred by taking the MF difference between the fragment ion (f) that contains the target modified residue, and the fragment ion (f’) that contains every modifiable residue on f except residue i, so that the increase on MFf from MFf’ is solely contributed by the MF on residue i. Because there may be multiple f/f’ pairs from several spectra that were used to calculate MFi, the result is averaged by the total number of such calculations, as expressed by equation (1):

The calibration curves for individual fragments ions (Figure 2A) show that the calculated MFs vary depending on the choice of fragment ions. Generally, different fragment ions will show similar modification levels. But in extreme cases, the difference in MF based on different fragment ions can be as large as ∼0.2, such as when the modified peptide fraction is 50% and 75%.
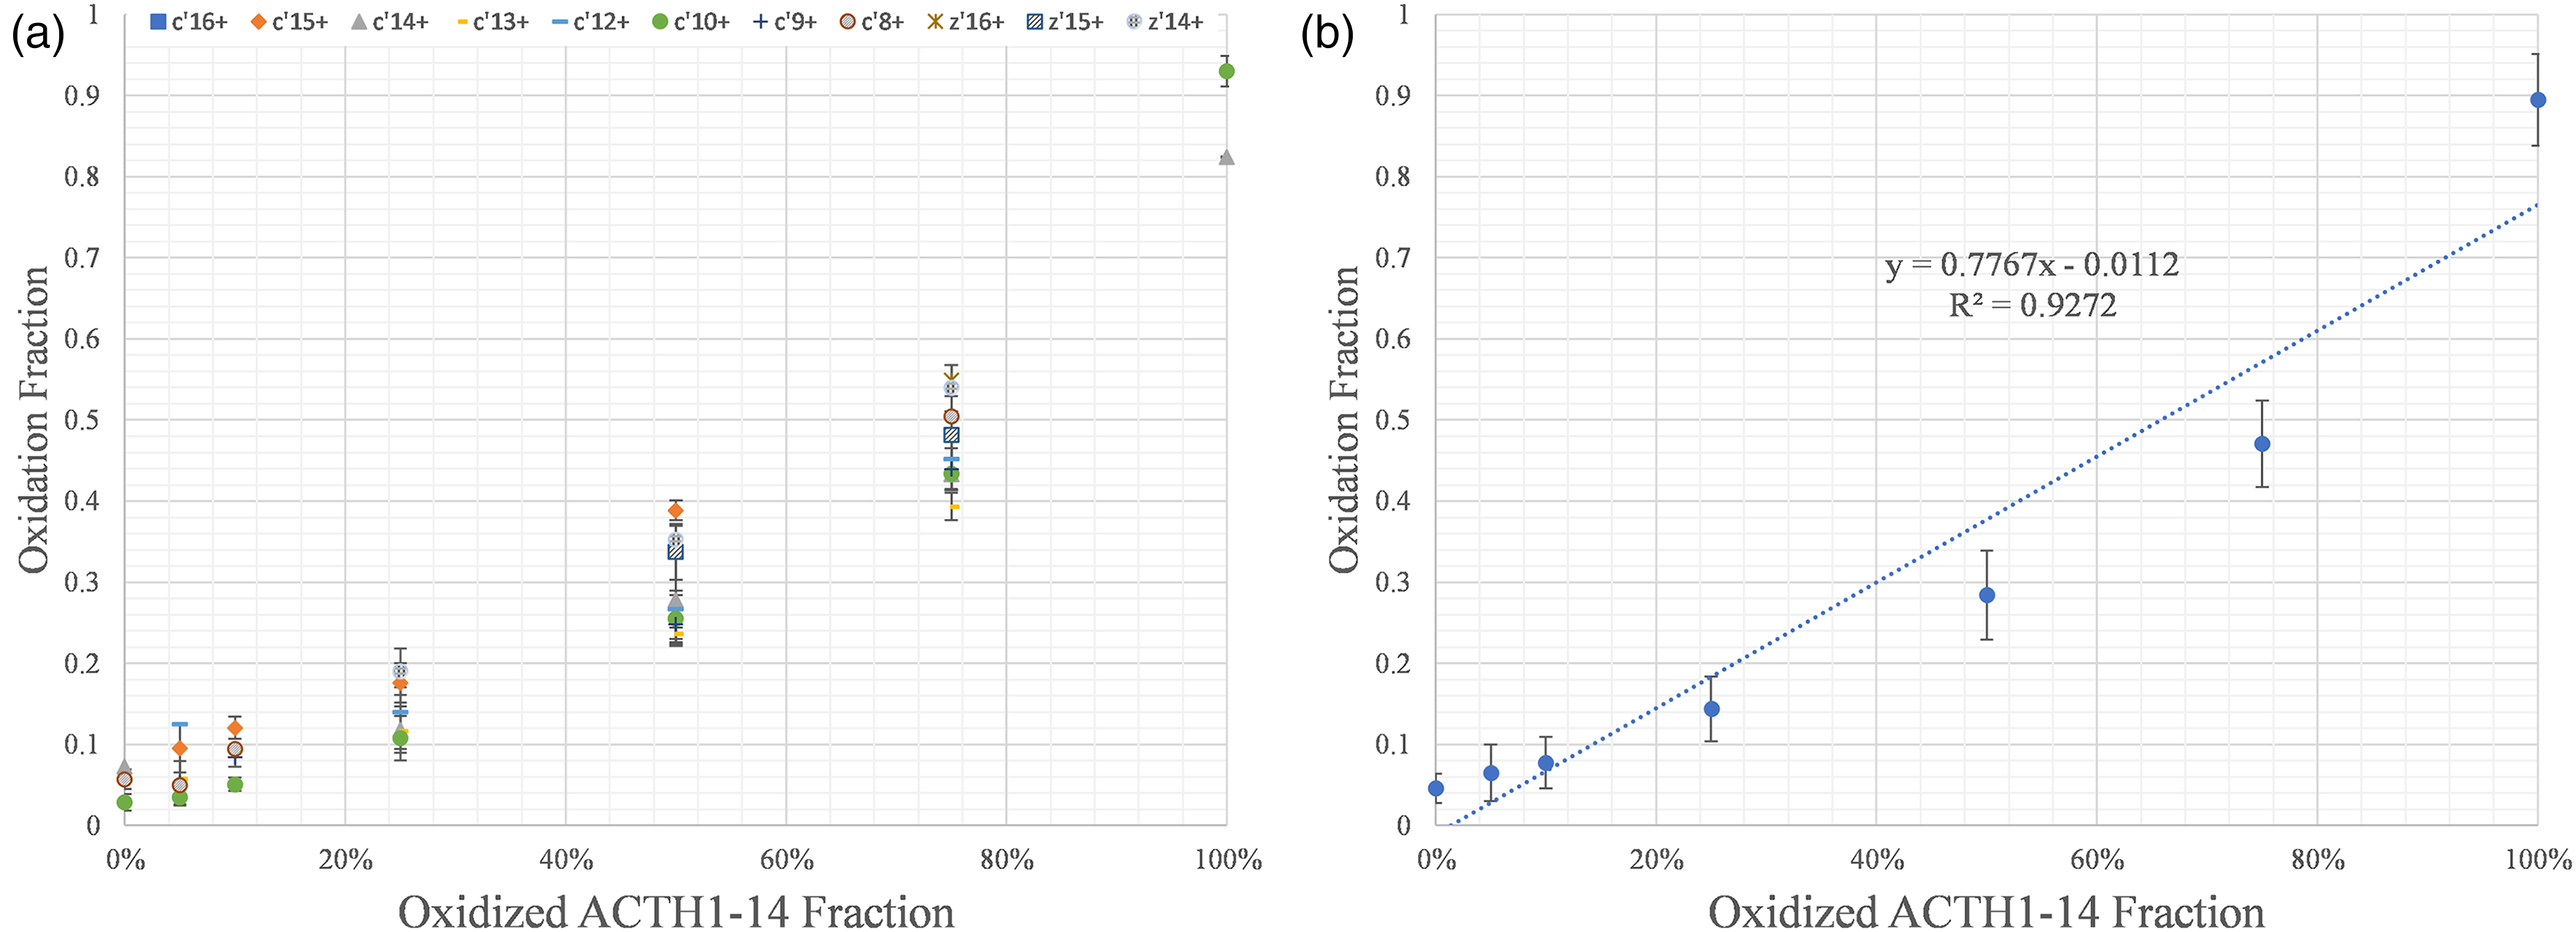
MALDI ISD calibration curve based on signals for oxidized/unoxidized ACTH 1-17 peptide; (A) the calibration curve based on several different fragment ions; (B) calibration curve based on the average of all fragment ions. The squares (in blue for on-line version) for c'16; diamonds (in orange for on-line version) for c'15; the triangles (in gray for on-line) for c'14; the 0.25-sized rectangles (in gold for on-line) for c'13; the half rectangles (in blue for on-line) for c'12; the circles (green for on-line) for c'10; the + for c'9; the cross-hatched circles for c'8; the * for z'16, the cross-hatched squares for z'15; the hatched circles for z'14. (B) calibration curve based on the average of all fragment ions.
The difference in MF is likely due to interference signals from MALDI chemical noise or from peak overlaps. The nature and origin of the MALDI chemical noise is not fully understood, making difficult the prediction of positions and magnitudes of interferences, making it difficult to correct for distortions of the calculated MF.
The calibration curve possesses acceptable linearity (R-square of 0.93, Figure 2B) for the analysis of the extent of protein footprinting. Given that interference effects on the fragment ion signals are random, averaging all fragments ions may minimize interferences or compensate for data that are extremely deviant, affording more accurate and precise results that can better report a protein's solvent accessibility at a footprinting site.
MALDI ISD analysis of footprinted ubiquitin
We chose two footprinting methods, residue-unspecific FPOP, and D/E-specific GEE, to modify ubiquitin and to test the capability to locate and quantify the modifications by MALDI ISD. Compared to native (unmodified) ubiquitin, extra challenges must be met for MALDI ISD mainly for two reasons. First, footprinting generates extra protein species that add to the complexity of signals from a protein sample, and this will be reflected in the MALDI ISD spectrum as increased chemical noise and peak overlaps. Second, the footprinting process will introduce footprinting reagents, radical scavengers, and quenchers into the system. These and other adventitious components are likely to be detrimental to MALDI analysis, as the morphology of the MALDI crystal is sensitive to the sample constitution. Even with purification approaches like Zeba® spin columns, unwanted chemicals in the MALDI matrix and sample affect the ability to produce trustworthy signals, and they may give a more heterogeneous crystal structure and decreased mass resolving power (Figure 3A, top-right inset image).
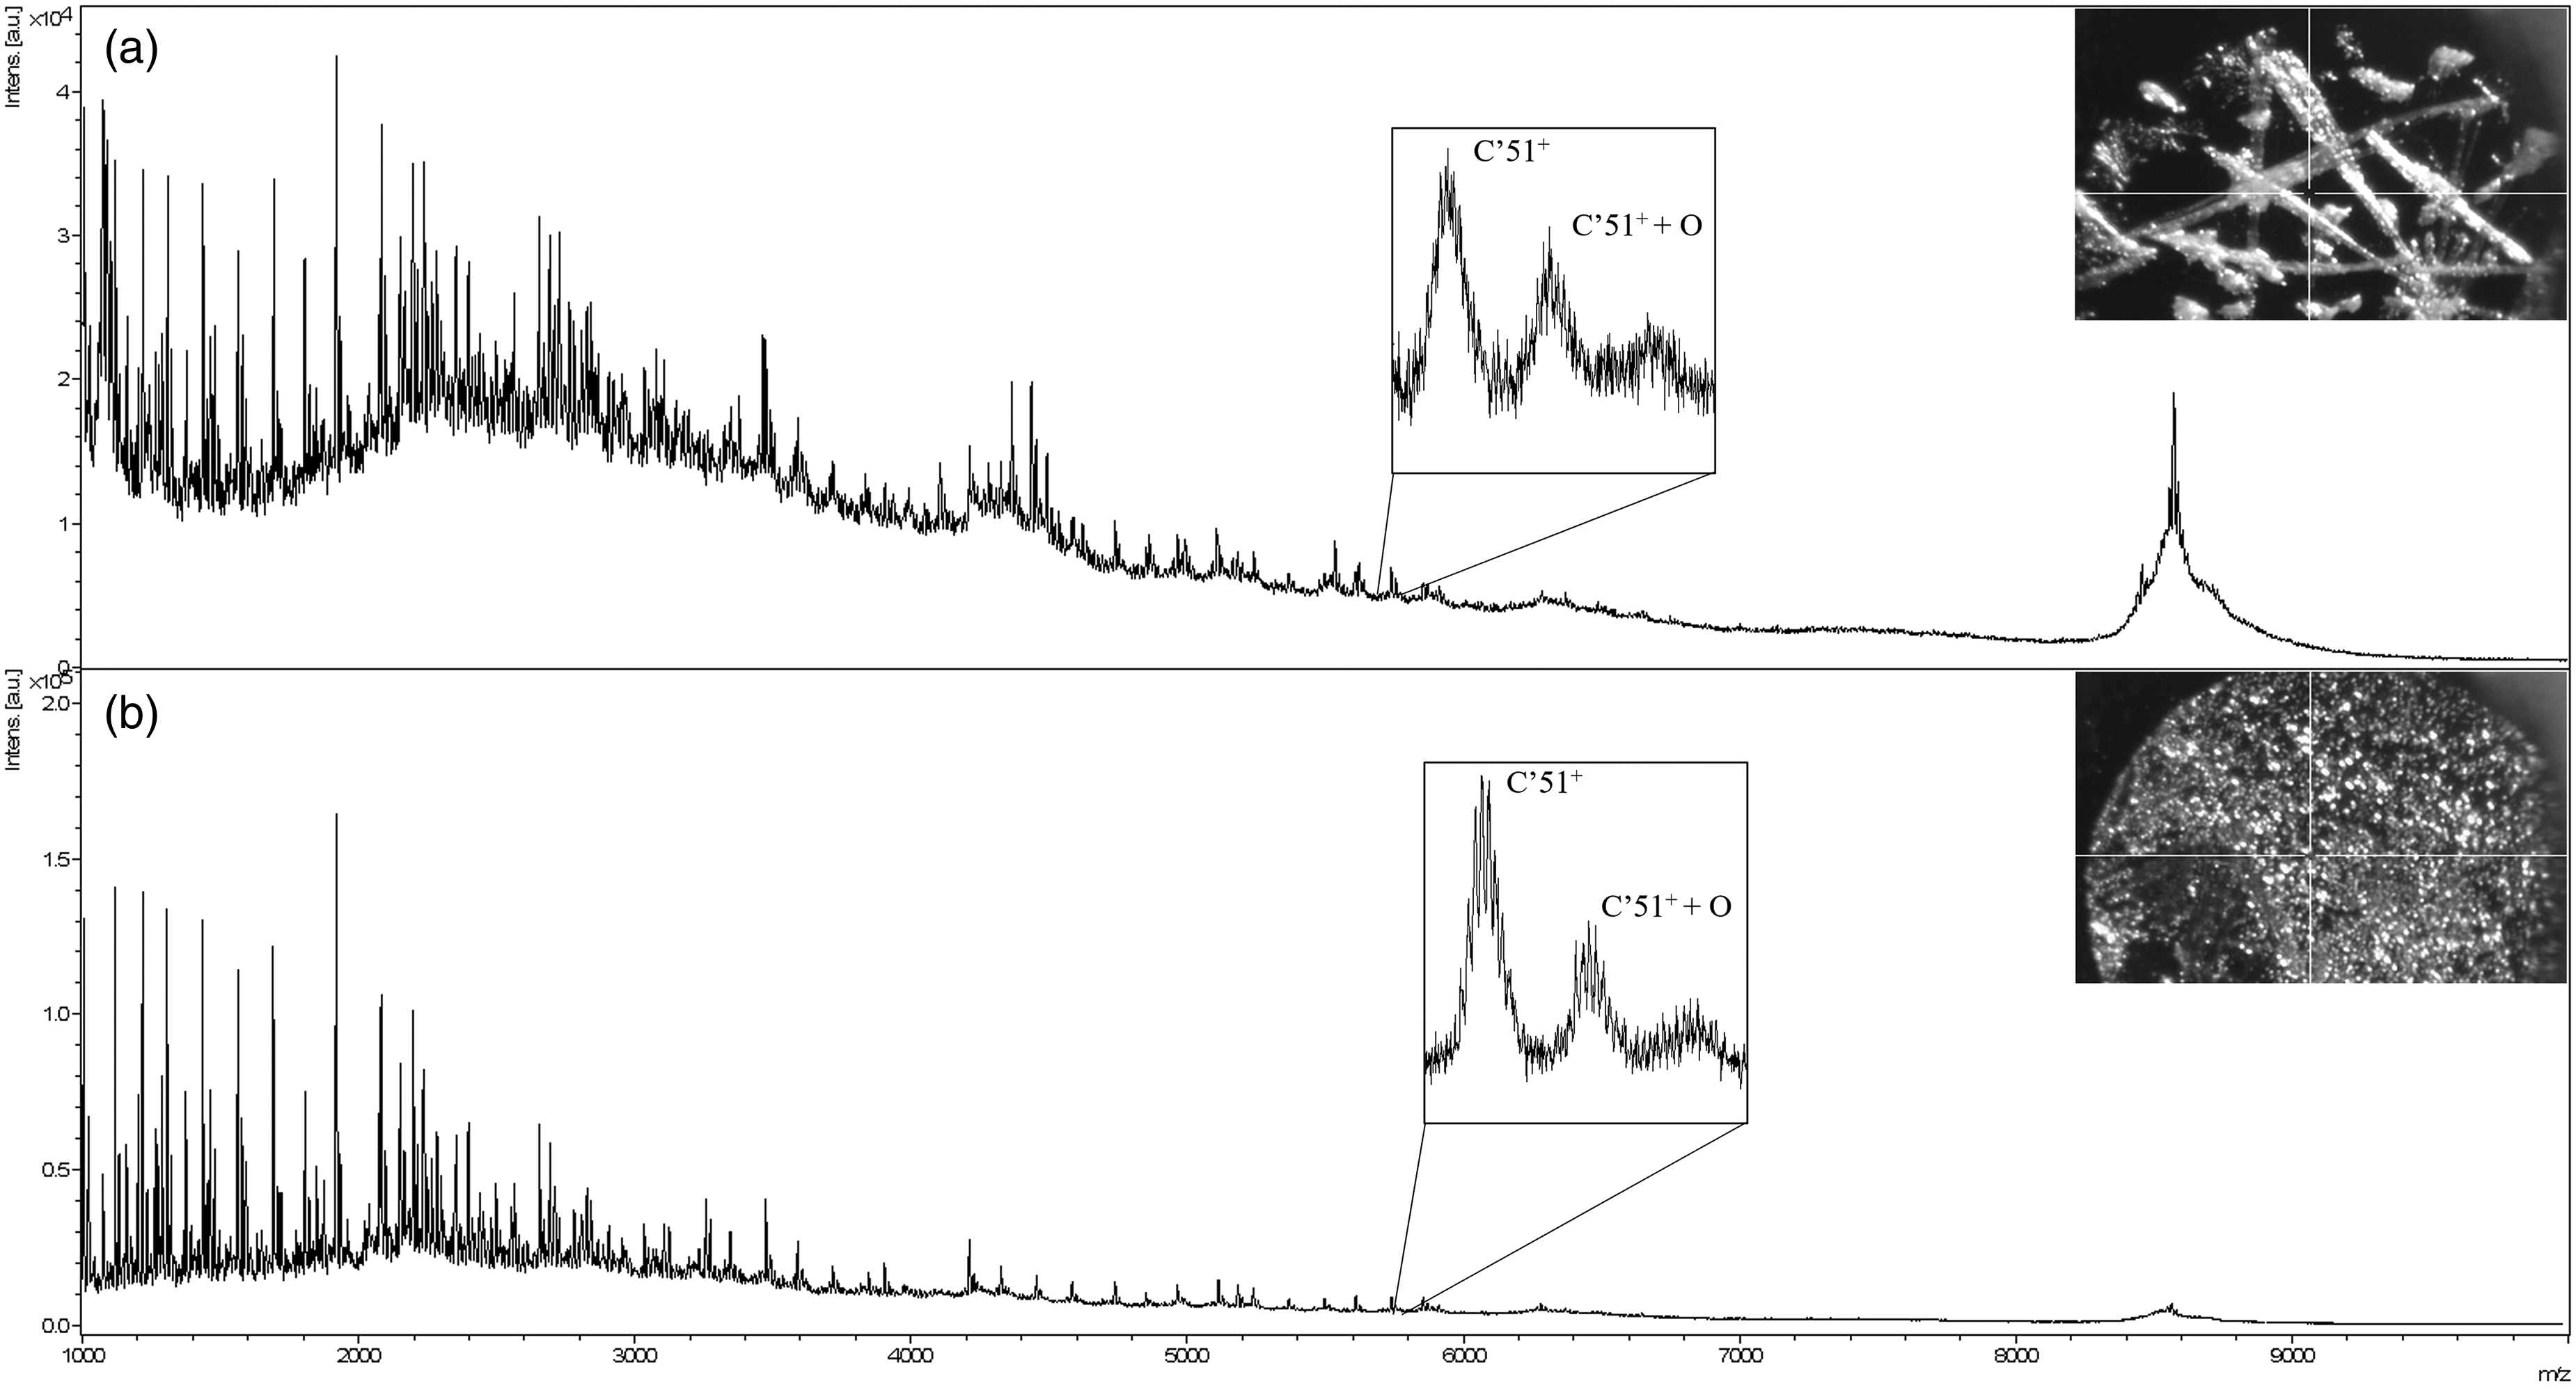
MALDI ISD spectrums of FPOP-labeled ubiquitin prepared with/without fructose spike. (a) Sample without fructose and its mass spectrum. The microscopic image of the 1,5-DAN matrix crystals is displayed on the top right inset. The heterogeneity of the crystal morphology and the increased peak complexity introduced through FPOP labeling significantly elevated the spectral baseline. The middle-inset zooms in on the from fragment ions c'51 and its mono-oxidation at m/z ∼ 5800, which is not isotopically resolved; (b) sample with fructose spike. The inset overlays are the same as in (a). The MALDI crystal in (b) is more homogeneous, the spectrum baseline is reduced, and the signals from c'51 are isotopically resolved.
As a result of increased sample complexity and decreased resolving power, the spectrum of FPOP-labeled ubiquitin shows a significantly elevated baseline (Figure 3A), hampering both the identification and quantification of the target fragments in ISD. Because the footprinted sample complexity is unavoidable, improving the MALDI mass spectral resolving power by forming more homogeneous matrix crystals is necessary.
In previous research, matrix-additives such as several simple sugars were shown to improve sample homogeneity and to increase mass resolving power, sensitivity, and reproducibility.27–30 Among these additives, fructose is one of the most effective. Therefore, we employed fructose for many of the MALDI ISD measurements.
Hypotheses have been forwarded to explain the role of matrix additives such as fructose in MALDI experiments. One possibility is that the incorporation of an extra component into the MALDI crystal minimizes variation of matrix-to-analyte ratio, leading to more homogeneous crystals. 31 Another explanation is that although sugars such as fructose share some structural features and have similar size as matrix molecules, they do not absorb laser light at 337 nm. The increase in non-absorbing components in crystal mixture (with concomitant decrease in the relative fraction of matrix) and the possible formation of gaseous CO2 and H2O upon laser-induced fructose decomposition enable collisional cooling of the gas-phase protein ions and reduce the internal energy of the system to suppress unwanted fragmentations. 32
The resulting sample crystals and the mass spectra show remarkable improvements. The addition of fructose assists in the formation of fine, homogeneous crystal grains (Figure 3B, top-right inset image), leading to substantial improvements of mass resolving power and reproducibility. As an example of the improved resolving power, the signals from fragment ions c'51 and its mono-oxidation product at m/z ∼5800 are isotope-resolved in the fructose-spiked samples, but not in the absence of fructose (Figure 3, middle inset in A and B). Furthermore, the baseline is significantly reduced, enabling more accurate quantification of the footprinted proteins.
We analyzed the FPOP-modified ubiquitin by MALDI ISD and calculated the MF for each identified fragment ion by using equation (1) (Figure 4).
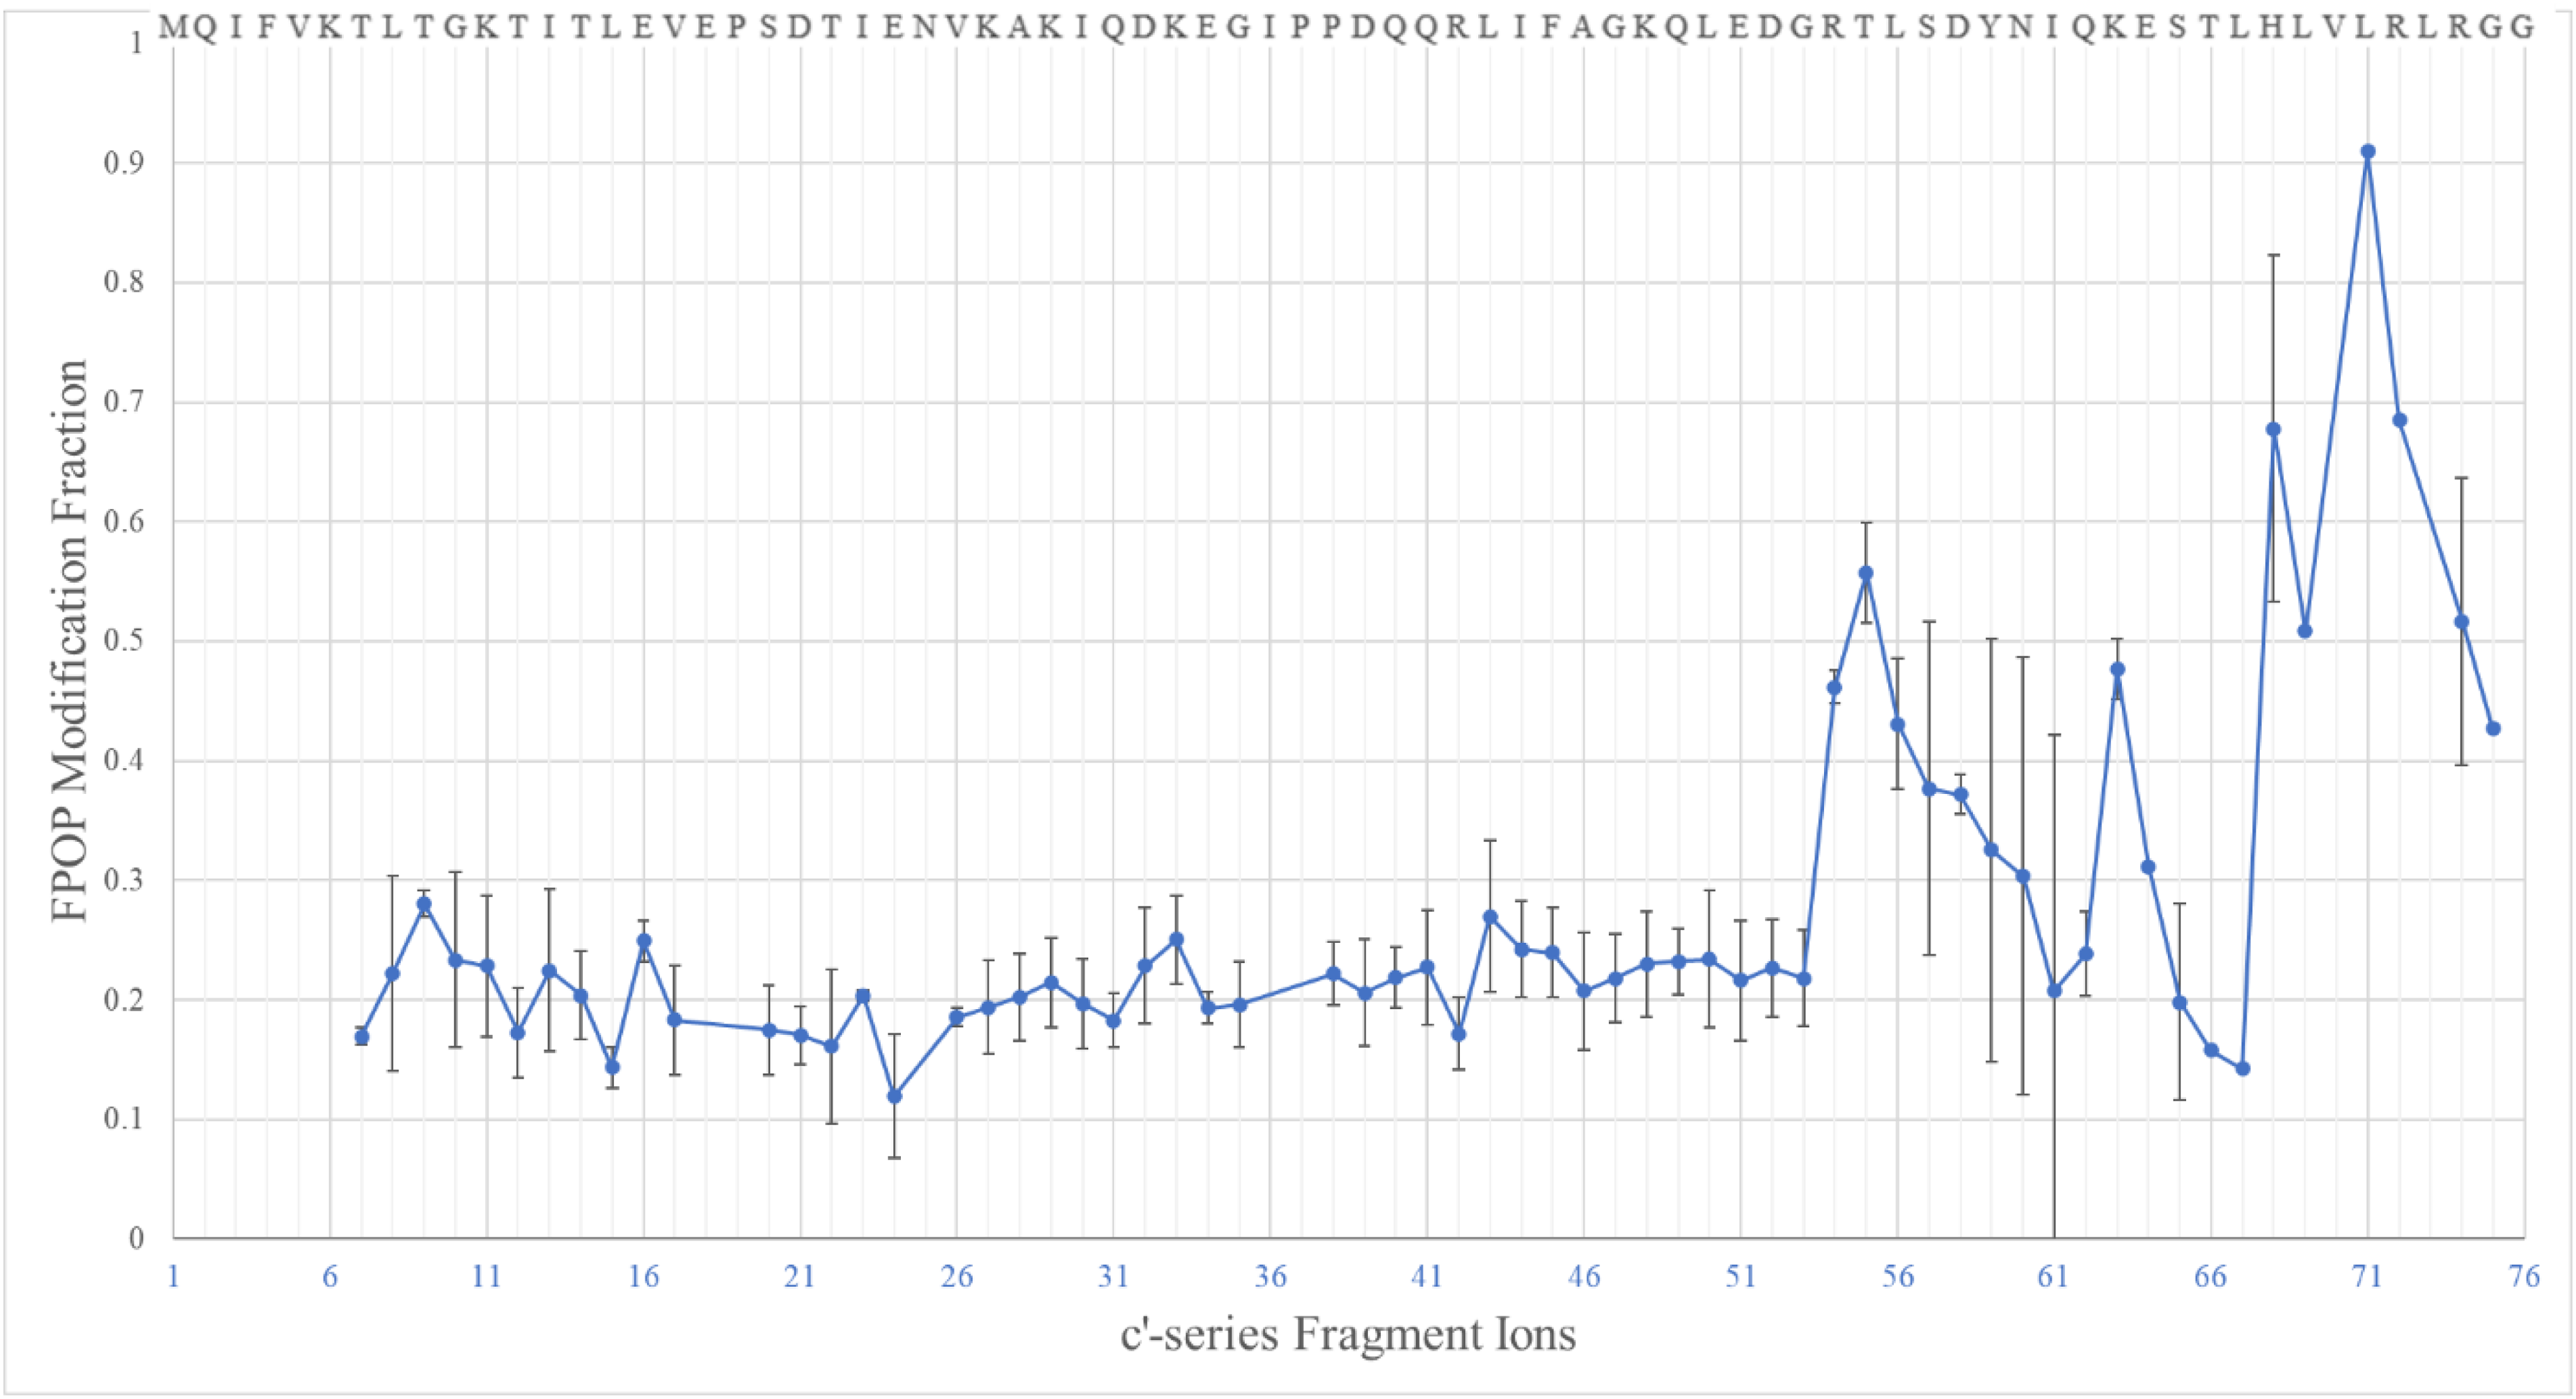
Calculated FPOP oxidation fractions of c'/z'-series ions from MALDI ISD of ubiquitin. The amino acids sequence of ubiquitin is displayed on top from the N-terminus (left) to C-terminus (right). The identified fragment ions represent 63% of the protein sequence.
As the length of the fragment ions increase and accumulate more oxidized residues, a clear trend of the growing oxidation can be observed at the protein level. Ideally, the curve should be a step function, with a rise (step) whenever a residue undergoes modification. On a more “local” (peptide) level, however, the oxidation fraction suffers, possibly from unpredictable interferences that prevent a faithful quantification of individual-level oxidation. The interferences are mainly caused by overlapping peaks or noise, especially when the target fragment ion signals are of low intensity. We observed a similar phenomenon for the ISD calibration experiment.
Such distortions of the expected plot lower the fidelity of the ISD quantitation analysis and make it difficult to identify sites of modification. To minimize this effect, as concluded in the ISD calibration curve analysis, the product fractions were averaged over multiple fragment ions, counterbalancing the extremes, and offsetting the deviations brought by random noise. FPOP, however, is a nonspecific method that targets multiple residues, leaving little room for error in averaging MFs for a single residue from multiple fragments. Furthermore, the oxidation extent induced by FPOP on most residues is relatively small (<5%), and for low intensity signals, the effects of noise or interference on the signal are amplified. Thus, MALDI ISD is limited when acquiring residue-level MFs in protein footprinting experiments when using a nonspecific labeling such as FPOP.
To see if this situation can be improved, we examined whether residue-level modification information can be obtained by ISD analysis for specific-residue footprinting. For this experiment, we conducted GEE labeling on ubiquitin; this approach limits the modification targets to only Asp and Glu residues. Furthermore, GEE labeling produces relatively high modification extents, rendering the ion signals more resistant to noise and interferences.
We carried out MALDI ISD analysis of GEE-footprinted ubiquitin and calculated the GEE MFs (Figure 5). Theoretical GEE modifications were also calculated based on the SASA of a modifiable D/E residue (calculated from PDB: 1UBQ) and the intact protein's GEE modification extents (0.645 from ESI intact analysis, data not shown), assuming each D/E residue will get modified in proportion to its SASA value (i.e., the intrinsic reactivities are constant and are only reduced by solvent accessibilities). Because the experimental results correlate better with the theoretical results than would be achieved with FPOP, we consider that the use of MALDI ISD to locate modifications is feasible and can augment the use of bottom-up MALDI for footprinting analysis as demonstrated by Michael Przybylski nearly 30 years ago.
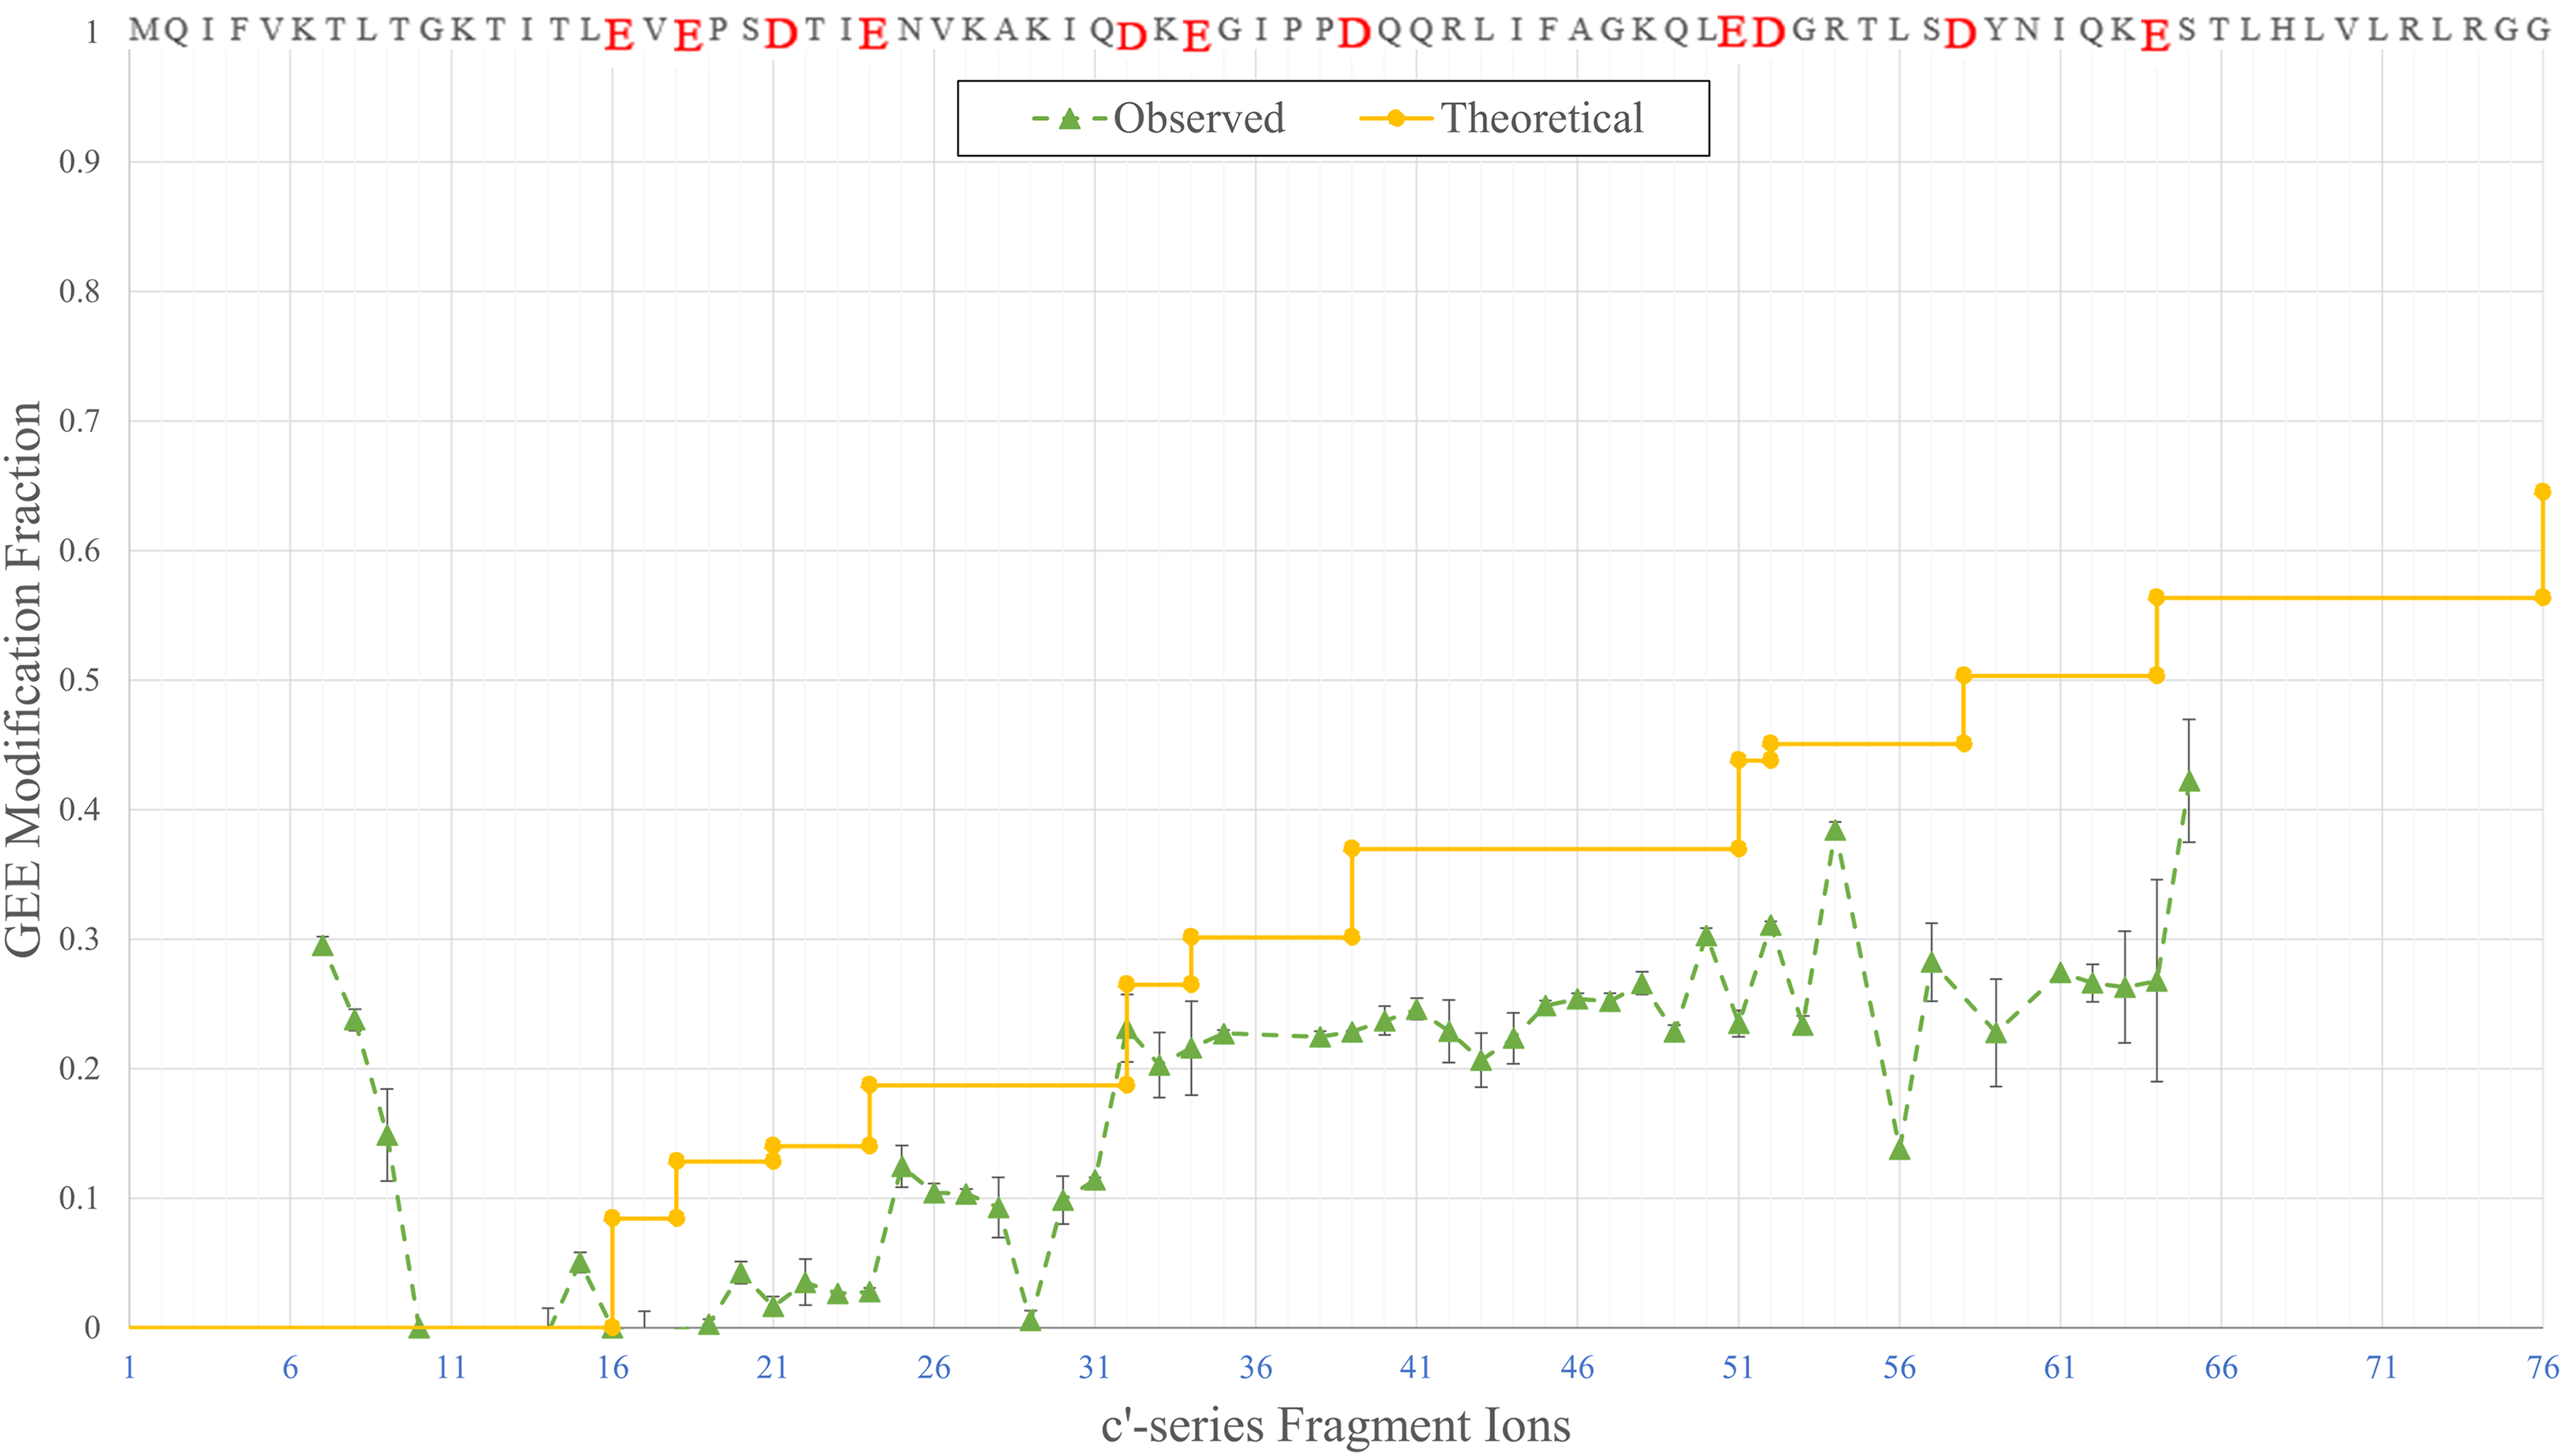
GEE modification fractions of the c'-series of fragment ions measured by MALDI ISD of ubiquitin. The amino acid sequence of ubiquitin is displayed on top, with GEE-targeted D and E residues enlarged (highlighted in red on-line). The solid (yellow on line) line is theoretical and is calculated by proportioning each D/E GEE modification fraction to its calculated solvent accessible surface. The dashed (green on line) line represents the experimental data.
Because no Asp or Glu residues exist within the first 15 residues from the N-terminus, one of the first c'-series ion that should be observed is c'20, whose MF represents the combined fractional modifications of E18 and E20. Following the modification line, each occurrence of an additional D or E elevates the MF to a higher plateau as it accumulates the additional modifications on all previous D and E residues. Although interferences still occur to scatter the data and diminish the agreement with a theoretical line, the lower S/N and multiple signals characteristic of FPOP are less likely to compromise the quantification of modifications at the residue level, giving experimental results that roughly follow the predicted results.
We calculated the residue-level modifications for GEE-labeled ubiquitin with equation (1) (Figure 6). The minimum sample pool size n was set as three, so certain residues such as E16 (n = 0), E18 (n = 2), and E51 (n = 2) do not have individual MFs but are instead joined with the next eligible residues in their fractional intensity.
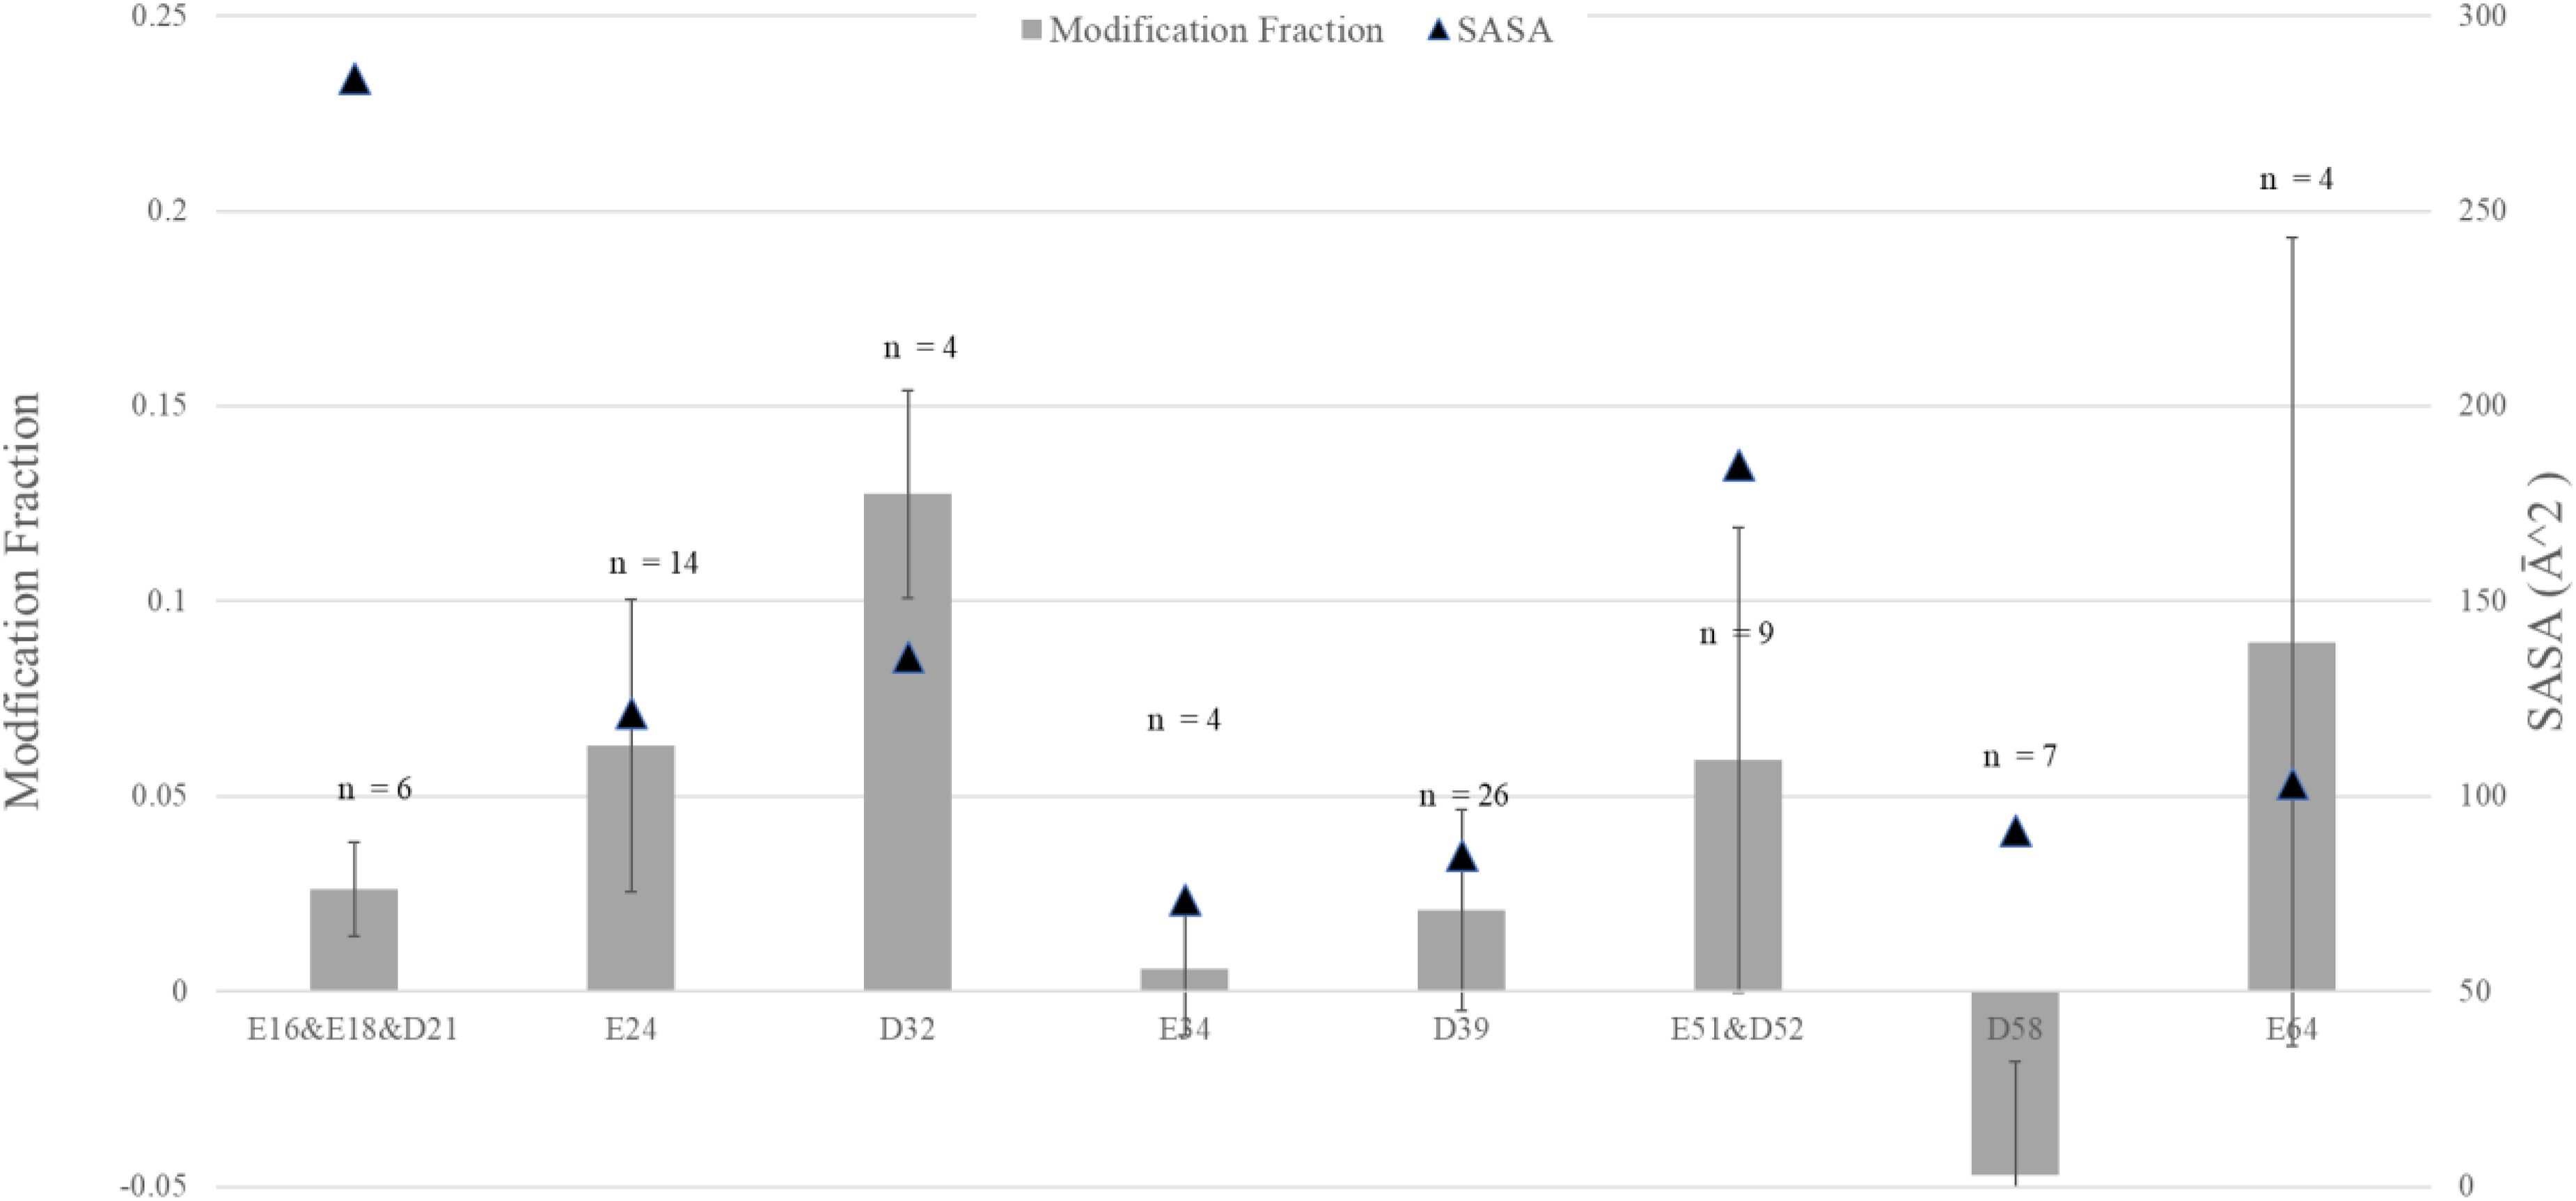
Calculated modification fraction for each carboxyl-containing residue from MALDI ISD experiment on GEE-footprinted ubiquitin. The number of fragments used in calculation for each residue is indicated on top; those residues with sampling less than three are omitted, and their fraction is joined with that of the next residue. SASA calculated from 1UBQ, RCSB PDB.
We also found that although the standard deviations are sizeable for certain residues, the MFs from the MALDI ISD analysis correlate reasonably with their theoretical SASA. Although some MFs for some fractions do not correlate well with their SASAs (the combined modification of E16/E18/D21 is noticeably smaller than their large theoretical solvent exposure), we postulate there could be other parameters at play other than SASA. For example, previous work by Przybylski et al. 33 showed that chemical reactivity can be lower or higher than mere solvent accessibility caused by the chemical microenvironment created by a 3-dimensional fold. In summary, we showed that the strategy of sampling multiple fragment ions can work, and the effects of MALDI ISD's random noise and interference can be minimized for non-specific footprinting. Clearly, more efforts are needed to improve the method.
Conclusion
To our knowledge, this is the first time that protein footprinting has been analyzed with a top-down MALDI ISD approach. The advantages are MALDI ISD only requires minimal instrument set up and sample handling, and it possesses high fragmentation efficiency. Our experiments show it has potential, at least for polypeptides and small proteins, to be an effective approach for future top-down and middle-down protein footprinting experiments.
We evaluated the top-down MALDI ISD as a novel analysis approach for protein footprinting. Calibration curve analysis suggests that MALDI ISD can be used for quantification. The subsequent test of MALDI ISD on ubiquitin showed excellent fragmentation efficiency, with almost every c’ ion identified above m/z 800. Although footprinting causes the baseline of the MALDI ISD spectrum to rise, owing to increased sample complexity, heterogeneous MALDI crystals, and matrix ions, use of fructose as a matrix-additive reduces the baseline and improves the homogeneity of the sample.
For FPOP-labeled ubiquitin, a detailed analysis to locate modifications for top-down data suffered from interference and noise because the extent of modification for various amino acids is small and distributed. The same analysis on the specific and more abundant GEE footprinting of ubiquitin showed that noise can be controlled to yield meaningful residue-level modification extents that correlate well with protein SASA.
Top-down MALDI ISD has potential to be developed for footprinting polypeptides and small proteins. It may also function as a means of estimating SASA of small proteins at the D/D residue level with good throughput.
In a middle-down format, MALDI ISD may serve as a means of fast turnaround in routine scenarios such as protein quality control or in epitope mapping where quality control checks are needed. The foci of future studies should be extension to larger, more complicated protein systems and improvement of the reproducibility of quantification.
Supplemental Material
sj-docx-1-ems-10.1177_14690667231202695 - Supplemental material for Toward a MALDI in-source decay (ISD) method for top-down analysis of protein footprinting
Supplemental material, sj-docx-1-ems-10.1177_14690667231202695 for Toward a MALDI in-source decay (ISD) method for top-down analysis of protein footprinting by Ruidong Jiang, Don L Rempel and Michael L Gross in European Journal of Mass Spectrometry
Supplemental Material
sj-zip-2-ems-10.1177_14690667231202695 - Supplemental material for Toward a MALDI in-source decay (ISD) method for top-down analysis of protein footprinting
Supplemental material, sj-zip-2-ems-10.1177_14690667231202695 for Toward a MALDI in-source decay (ISD) method for top-down analysis of protein footprinting by Ruidong Jiang, Don L Rempel and Michael L Gross in European Journal of Mass Spectrometry
Supplemental Material
sj-zip-3-ems-10.1177_14690667231202695 - Supplemental material for Toward a MALDI in-source decay (ISD) method for top-down analysis of protein footprinting
Supplemental material, sj-zip-3-ems-10.1177_14690667231202695 for Toward a MALDI in-source decay (ISD) method for top-down analysis of protein footprinting by Ruidong Jiang, Don L Rempel and Michael L Gross in European Journal of Mass Spectrometry
Footnotes
Declaration of conflicting interests
One author (MLG) declared he is an unpaid member of the scientific advisory boards of GenNeX and ProteinMetrics as potential conflicts of interest with respect to the research, authorship, and/or publication of this article.
Funding
The author(s) disclosed receipt of the following financial support for the research, authorship, and/or publication of this article: This work was supported by the National Institute of General Medical Sciences, (grant number P41GM103422, R01GM131008, R24GM136766).
Correction (March 2024):
Article updated with the addition of online material to supplement the contents of “Spectrum Analysis” section in Materials and methods.
References
Supplementary Material
Please find the following supplemental material available below.
For Open Access articles published under a Creative Commons License, all supplemental material carries the same license as the article it is associated with.
For non-Open Access articles published, all supplemental material carries a non-exclusive license, and permission requests for re-use of supplemental material or any part of supplemental material shall be sent directly to the copyright owner as specified in the copyright notice associated with the article.