
Abstract
This article describes the key achievements over the past 10 years in the microsecond pulsed glow discharge mass spectrometry applied to the analysis of solids and gaseous mixtures. The solid-state analysis allows studying solid materials with different conductivities, including direct simultaneous quantitation of light elements with high ionization energy (N, O, F, Cl, etc.), heavy elements (U, Th, etc.), and isotope analysis. Dielectric materials analysis is considered in details with special emphasis on sample preparation approaches. Particular attention is focused on a new application of the technique for detection of volatile organic and inorganic compounds in gas mixtures (model gas mixtures, ambient air and exhaled air). This approach has prospects for solving medical and environmental problems as well as for process gas monitoring. Several applications (He determination in deuterium, detection of VOCs, Xe and other inorganic compounds in air) are presented as examples. Using the high resolution (6000 for Pb, m/z 208) of Lumas PGD-301 time-of-flight mass spectrometer helps to eliminate most of the interferences and thereby improves the analytical performance. Combination of high energy electron ionization with soft Penning and other ionization mechanisms allows to detect almost all known elements and molecules.
Keywords
Introduction
The glow discharge (GD) was discovered more than a hundred years ago, and the most of works are devoted to its use for mass spectral analysis of solid samples.1–3 A systematic review of advances in glow discharge mass spectrometry (GD MS) has been presented in Refs.3–5 Over the past decade, new applications of GD have been emerged, analytical performance of the instruments improved, and new techniques developed. A pulsed GD with the time-of-flight (TOF) mass spectrometer (PGD-TOFMS) is the most interesting from our point of view. This method allows to use efficiently the processes occurring in the afterglow for analytical purposes. This combination of pulsed source and microsecond pulsed mass analyzer also turned out to be very useful, in particular, for the determination of elements with high ionization energy via specific ionization mode. 3 It should be noted that until recently the most of the works on GD MS were devoted to the analysis of solid samples. However, several years ago, it was shown that GD in the pulsed radiofrequency glow discharge time-of-flight mass spectrometry (RFGD-TOFMS) and PGD-TOFMS variants also can be used to determine volatile organic compounds (VOCs) and inorganic compounds in air and other gas mixtures.6–11
This review is focused on recent advances in the analytical use of the PGD-TOFMS method with a microsecond pulsed glow discharge (PGD).
The most detailed comparison of the GD MS method with other, well-established, highly sensitive methods is provided in a review by the authors of our research team.1,3 The absolute sensitivity, reproducibility, sample pre-treatment, analysis time, advantages and limitation of the GD MS with ICP-MS, TIMS, IRMS, SIMS and LA-ICP-MS have been compared in this research.1,3
Ionization mechanisms
Three ionization mechanisms are prevalent for GD: electron ionization (EI), asymmetric charge transfer (ACT), and Penning ionization (PI). All these three types of ionization are present in the direct current glow discharge (DC GD) and the radiofrequency glow discharge (RF GD). The ionization mechanisms of microsecond PGD are differed significantly from the continuous DC GD and RF GD.
In DC GD and RF GD, the excitation and ionization processes are largely determined by the tail of the electron energy distribution function, and an excess of fast electrons is observed in this function compared to the Maxwellian distribution.12–14 The source of fast electrons is the so-called “cathode dark space” in which there is a large gradient of electric field accelerating electrons emitted from the cathode.
Over the pulse time duration of several microseconds (µs) discharge parameters do not reach their equilibrium values. Initially, the discharge plasma is enriched with high-energy electrons that appear during the discharge development.
PI becomes the dominant ionization mechanism, because the concentration of electrons and ions (mainly electrons and ions of the discharge gas) drops by many orders of magnitude in a few microseconds after the pulse.
12
However, the ACT mechanism also takes place for several elements.
13
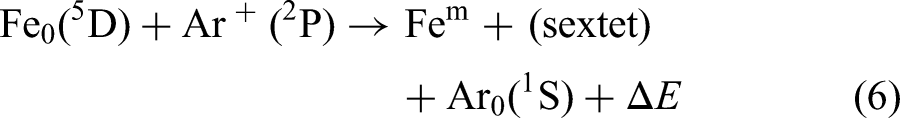
A mass spectrum of the PGD afterglow plasma mainly reveals the ions of elements sputtered from a cathode by ions or atoms of discharge gas. Sputtering atoms are formed in the charge-transfer reaction of high-energy ions, for example, the ions of Ar.
14
:

The high-energy argon ion transfers its charge to the argon atom while retaining its own vector


The concentration of the Ar* and N2* ions in the afterglow plasma is low since their primary ionization mechanism is EI, and the ionization process (2) is not realized due to the significantly higher ionization energy of the atoms or molecules of discharge gas in comparison with the energy of the corresponding metastable level. As a result, in the afterglow plasma of PGD conditions are created for the soft non-selective ionization of almost all elements of the Periodic Table and a wide range of VOCs with ionization energies lower than the energy of the metastable levels of discharge gas (11.6 and 11.7 eV for Ar and 11.1 eV for N2, respectively). As mentioned above, in this case gas component intensities (H3O+, Ar+, ArH+, etc.) can be relatively small for repelling pulse delay times of more than 150 μs.1,2,15
In addition to the soft Penning ionization, the PGD allows hard ionization of atoms and molecules by a short pulse high-energy electrons (with the energy about 100 eV and duration of 0.1–0.5 µs). These electrons appear at the leading edge of the discharge pulse. It is important to emphasize that the ionization process occurs not within the discharge cell but at the sampler outlet, and all formed ions move towards the orthogonal accelerator without collisions with atoms or molecules of the buffer gas with similar energies (about 30 eV).
This mode occurs with the TOFMS orthogonal accelerator operating at short times (several µs) of the repelling pulse delay relative to the discharge pulse. This system can be called “TOF-TOF system,” which allows to ionize the elements and compounds (He, N, O, F, Ne, Cl, Ar, CO2, CH4, D2, H2, etc.) with high ionization energy. 3
Ionization with ACT is a resonant process that is efficient when the following condition is met:

The condition of Equation (4) is universal and therefore it is correct not only for discharge gas, given here as an example.
The energy Em can be equal to zero. In particular, this situation is realized in the process of resonant ionization of toluene by the NO+ ion10,11:


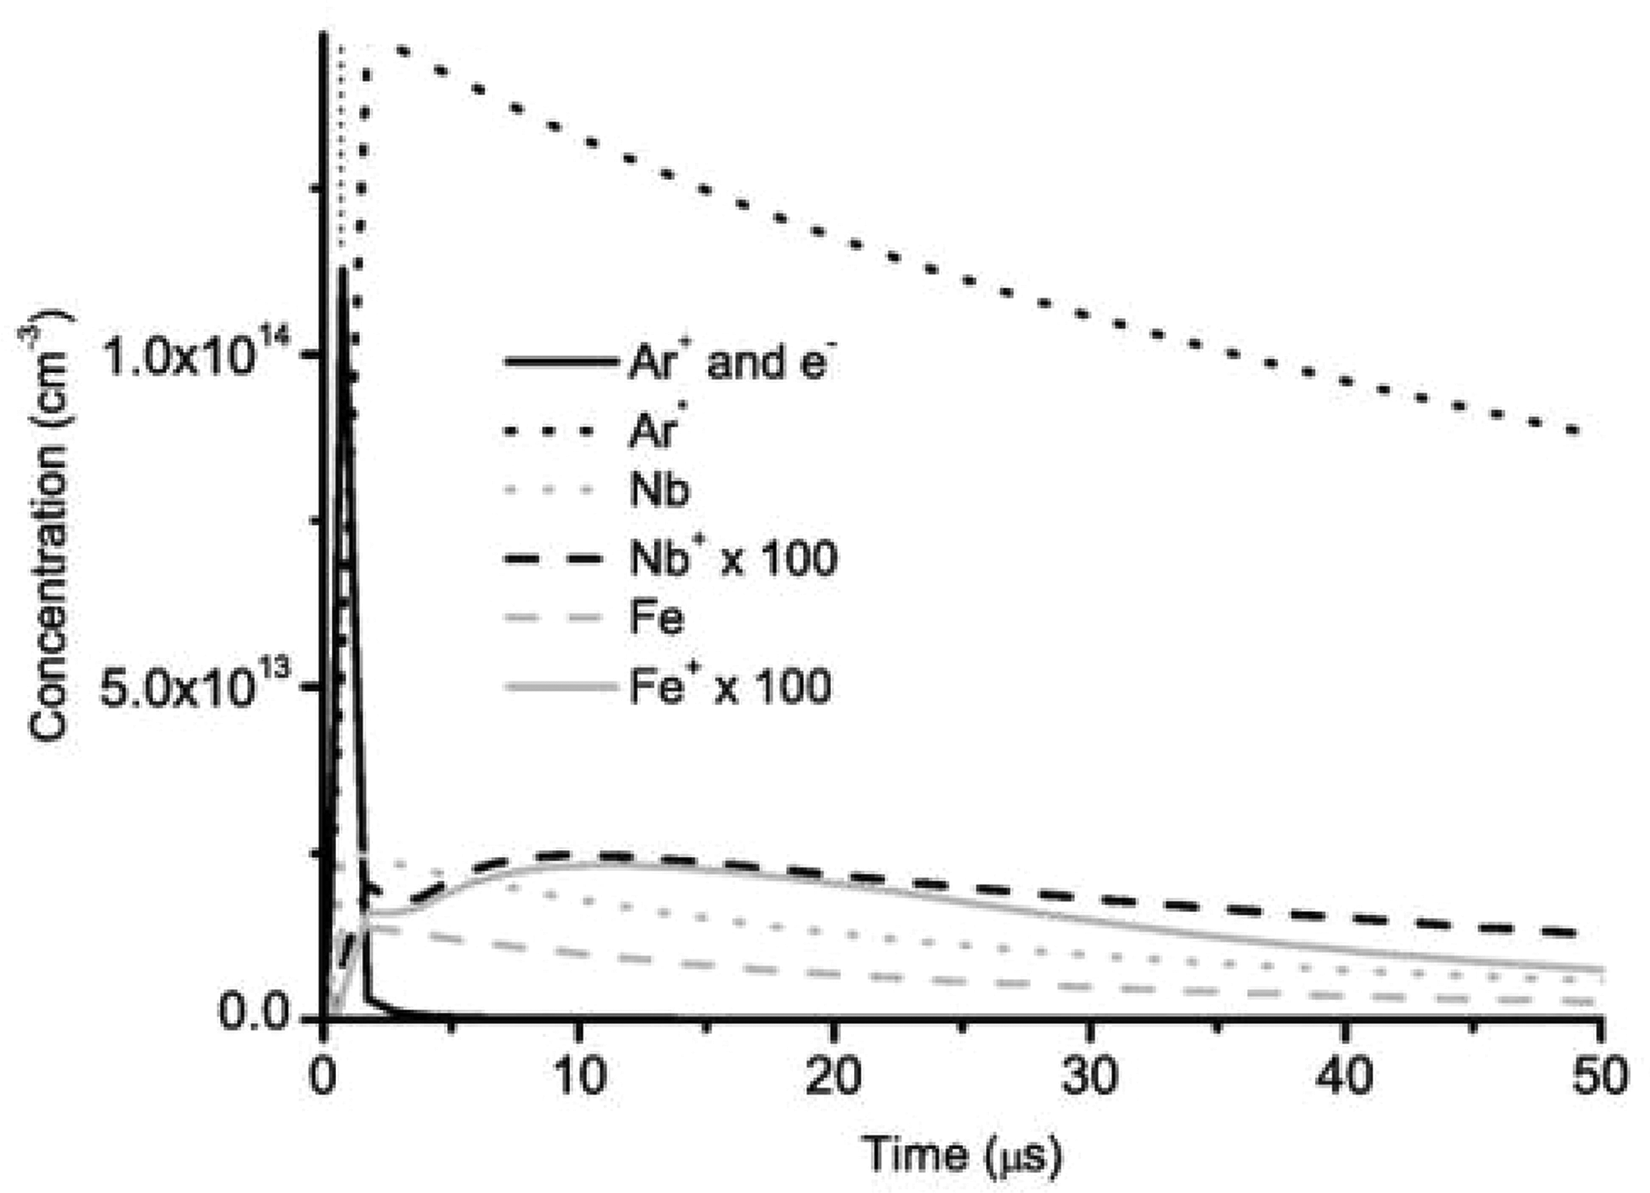
Calculated concentrations of miscellaneous particles in the discharge and in the afterglow. I = 2 A, U = 2 kV, Rb = 300 Ω, τ = 0.75 μs, p = 133 Pa, CHC.
We would like to emphasize that the microsecond PGD allows to create a slowly decaying reservoir of metastable excited atoms or molecules in conditions of extremely low concentration and energy of electrons. As a result, the only ionization mechanism for the elemental analysis is PI, which allows to realize a very soft and non-selective ionization. For this mechanism the ionization probabilities, both for different elements and for other compounds, are similar, and therefore the corresponding sensitivities are identical too. Such characteristic feature improves the analytical capabilities of the discussed approach.
In a pulsed discharge with a high-water content, in particular in a discharge in air, the proton transfer reaction (PTR) is added to the ionization mechanisms mentioned above that works effectively for VOCs ionization. Proton is formed from a water molecule interacting with electron according to Equation (10), or with metastable discharge gas atoms according to Equation (11):


However, protonation of VOCs can also occur in reactions with other water clusters (Equations (14)–(16)):


Instrumentation
Mass spectrometers with microsecond PGD can be used for the purpose of elemental analysis. In this case, this experimental approach is realized with two types of mass spectrometers: the Lumas-30 mass spectrometer with the resolution of 800 16 and the recently developed Lumas PGD-301 mass spectrometer with the resolution of 6000 (for Pb, m/z 208). The standard procedure for determining the resolution in TOFMS based on the peak width at half maximum is applying in Lumas PGD-301 that allows to reach the issue with the resolution of spectral interferences for accurate identification of many components. Both types of mass spectrometers are designed for the quantitative determination of the elemental composition of solid samples with various conductivities, as well as for the determination of volatile organic and inorganic compounds in ambient-, and exhaled air, and other gases.
The Lumas PGD-301 mass spectrometer (general view of mass spectrometer is shown on Figure S1 in Supplementary materials) consists of an aluminum vacuum chamber, the orthogonal accelerator, the detector, the griddles ion mirror, the ion-transfer interface, and a discharge cell with the combined hollow cathode (CHC) composed of two parts: a hollow cylinder with a flange and the analyzed sample in the form of a flat disk (cathode bottom).
The registration system consists of a microchannel plate detector and an analogy-to-digital convertor with a sampling frequency of 2 GHz. In addition to the CHCs, flat cathodes (without an auxiliary cylindrical cathode) are used for the gas analysis. Auxiliary cathodes with an inner diameter of 4–6 mm made of high-purity (99.9999%) metals (Ta, Al, Nb, Cu) were used.
The gas pressure in the discharge cell is stabilized by mass-flow controller with the aid of a pressure sensor with a proportional integral derivate controller being installed at the gas path of the discharge cell, the relative pressure fluctuations do not exceed 1%.
A distinctive dependence of intensity of detected sample ions on the delay time of the repelling pulse (τi) for a microsecond pulsed discharge is observed. Figure 2 shows such dependences for several elements with a large difference in masses, such as Mg+, Ni+, Pb+, and F+.
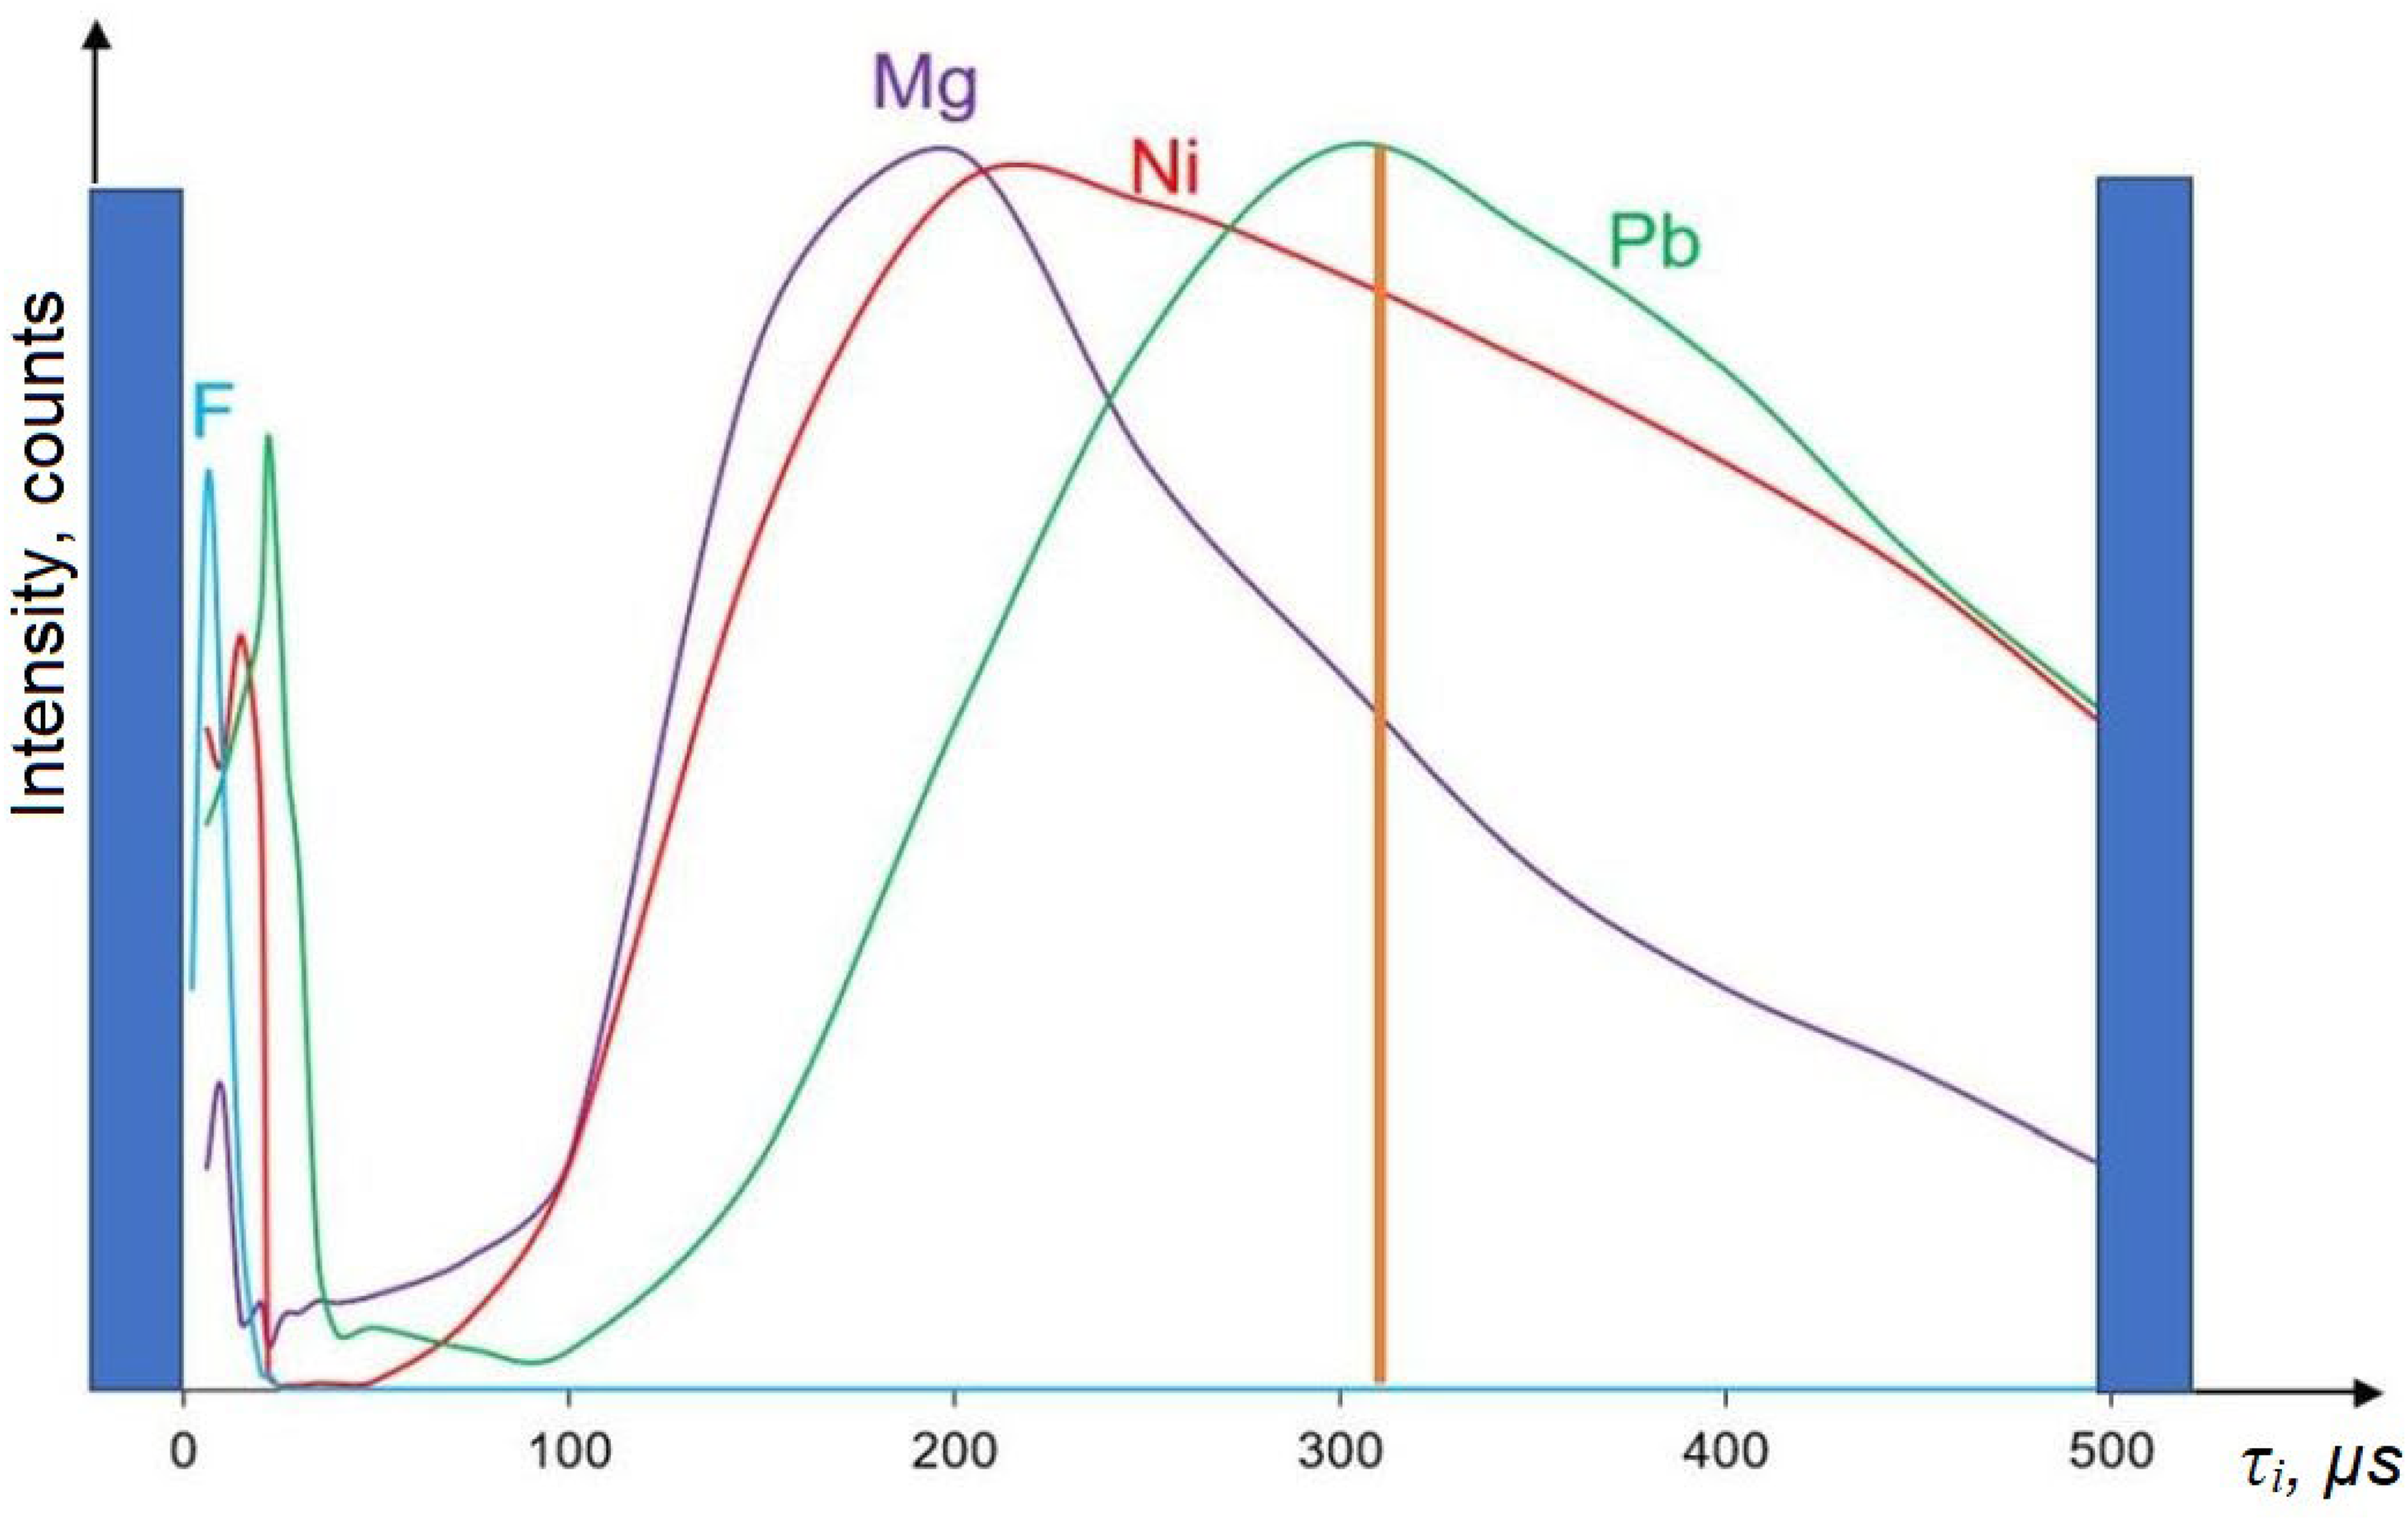
Diagram explaining the registration system operation. Blue bars – discharge pulses. Orange strobe – start of analog-to-digital convertor and repelling pulse. Violet, red, green and blue curves – dependences of the analytical signal intensities on the delay times for Mg+, Ni+, Pb + and F + ions, respectively.
There are two ionization mechanisms: PI and ionization by a packet of high-energy ions. The PI mechanism is observed for Mg, Ni, Pb at relatively large delays of the ejection pulse (100–500 μs), which are determined by the diffusion time of sputtered atoms from the sample to the sampler and the flight time of ions from the sampler to the TOFMS accelerator. However, it should be note, that the diffusion time significantly exceeds the flight time. The PI mechanism does not work for F, since its ionization potential (17.42 eV) significantly exceeds the energy of the metastable level of Ar (11.7 eV). Therefore, fluorine is ionized only by a packet of high-energy electrons at small delays of the ejection pulse, which are determined by the flight time of fluorine ions from the sampler to the accelerator. As can be seen from Figure 2, these delays are in the range of 5–10 μs.
The Lumas PGD-301 with the high mass resolving power (6000 at m/z 208) was used in described experiments. Changing the repelling pulse delay time (τi) provides the possibility for variation of the sensitivity to different components and prioritize the ionization mechanisms.
This dependence consists of three sections according to different repelling pulse delay times. The first section (τi = 3–20 µs) is associated with the EI of elements by the package of high-energy ions at the leading edge of the discharge pulse; the second (20–100 μs) is characterized by a depression of the detected components and this depression is associated with the formation of a space charge at the output of the discharge cell, which prevents the transport of ions; and the third section (100–500 μs) is associated with the process of PI (2).
Solid analysis
Capabilities of solid samples elemental analysis with the high-resolution mass spectrometer
As mentioned above, the mass resolving power of the Lumas-30 and Lumas PGD-301 are 800 and 6000, respectively. The higher resolution eliminates a considerable part of interference effects has occurred using the PGD. The several mass-spectrum ranges for the certified reference sample of Cu (SSS 11336-2019) are presented in Figures 3 and S2–S3, recorded with the Lumas PGD-301 mass spectrometer. As can be seen from these figures, the high mass resolution makes possible the actual elimination of mutual interference between the Te isotopes (mass values of Te isotopes are 124.9044, 125.9033, 127.9045, 129.9062) and Cu dimers (mass values are 125.8587, 127.8587, 129.8550) (see Figure 3), On Figure 4 different components for m/z = 28 such as 28Si+ (m = 27.9769), 12C16O+ (27.9949), 12C21H4+ (28.0308) are demonstrated. On Figures S2 and S3 in Supplementary materials 32S+ (m = 31.9715), 16O2+ and 26Mg+ (m = 25.9826), 12C21H2+ (m = 26.0151) are shown, respectively.
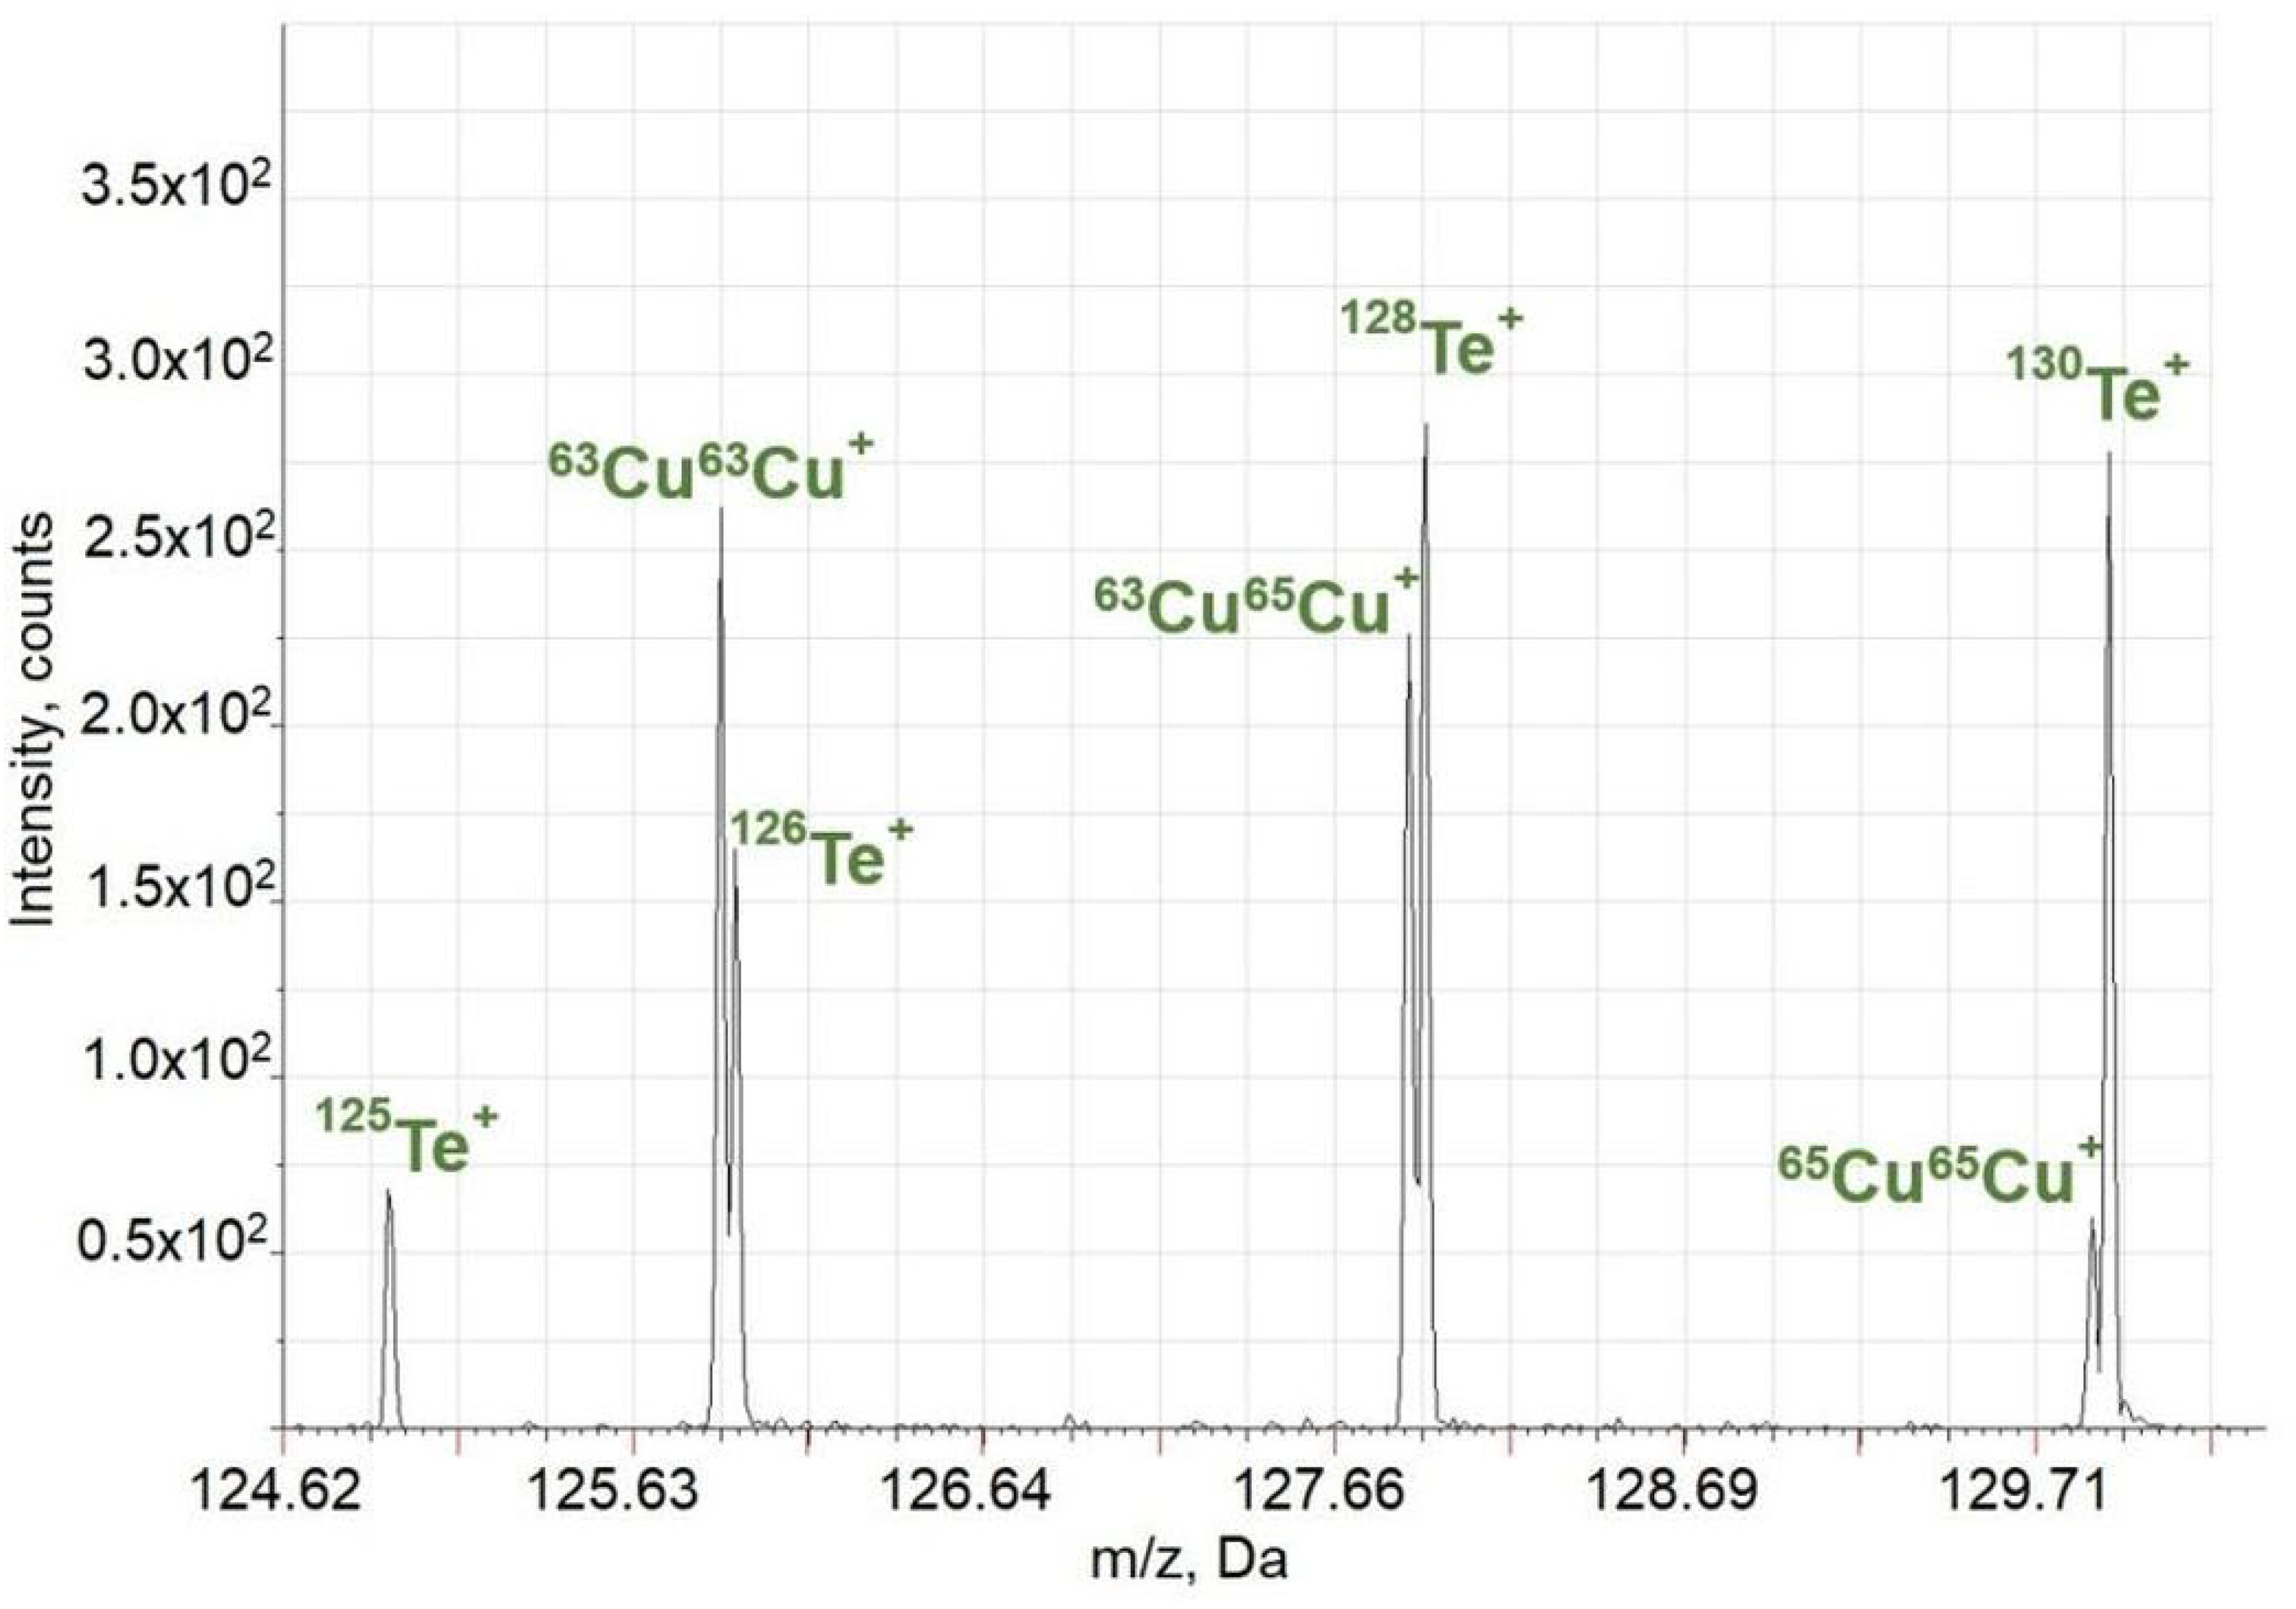
Mass spectrum of the state standard sample of Cu (SSS 11336-2019) in the range 124–130 Da, obtained with the mass spectrometer Lumas PGD-301 with Al CHC. The isotopes of Te (Te content is 289 ppm) are separated. Acquisition parameters are as follows: repelling pulse delay time—350 µs, pulse duration – 3 µs, pulse period – 400 µs, discharge pressure – 27 Pa.
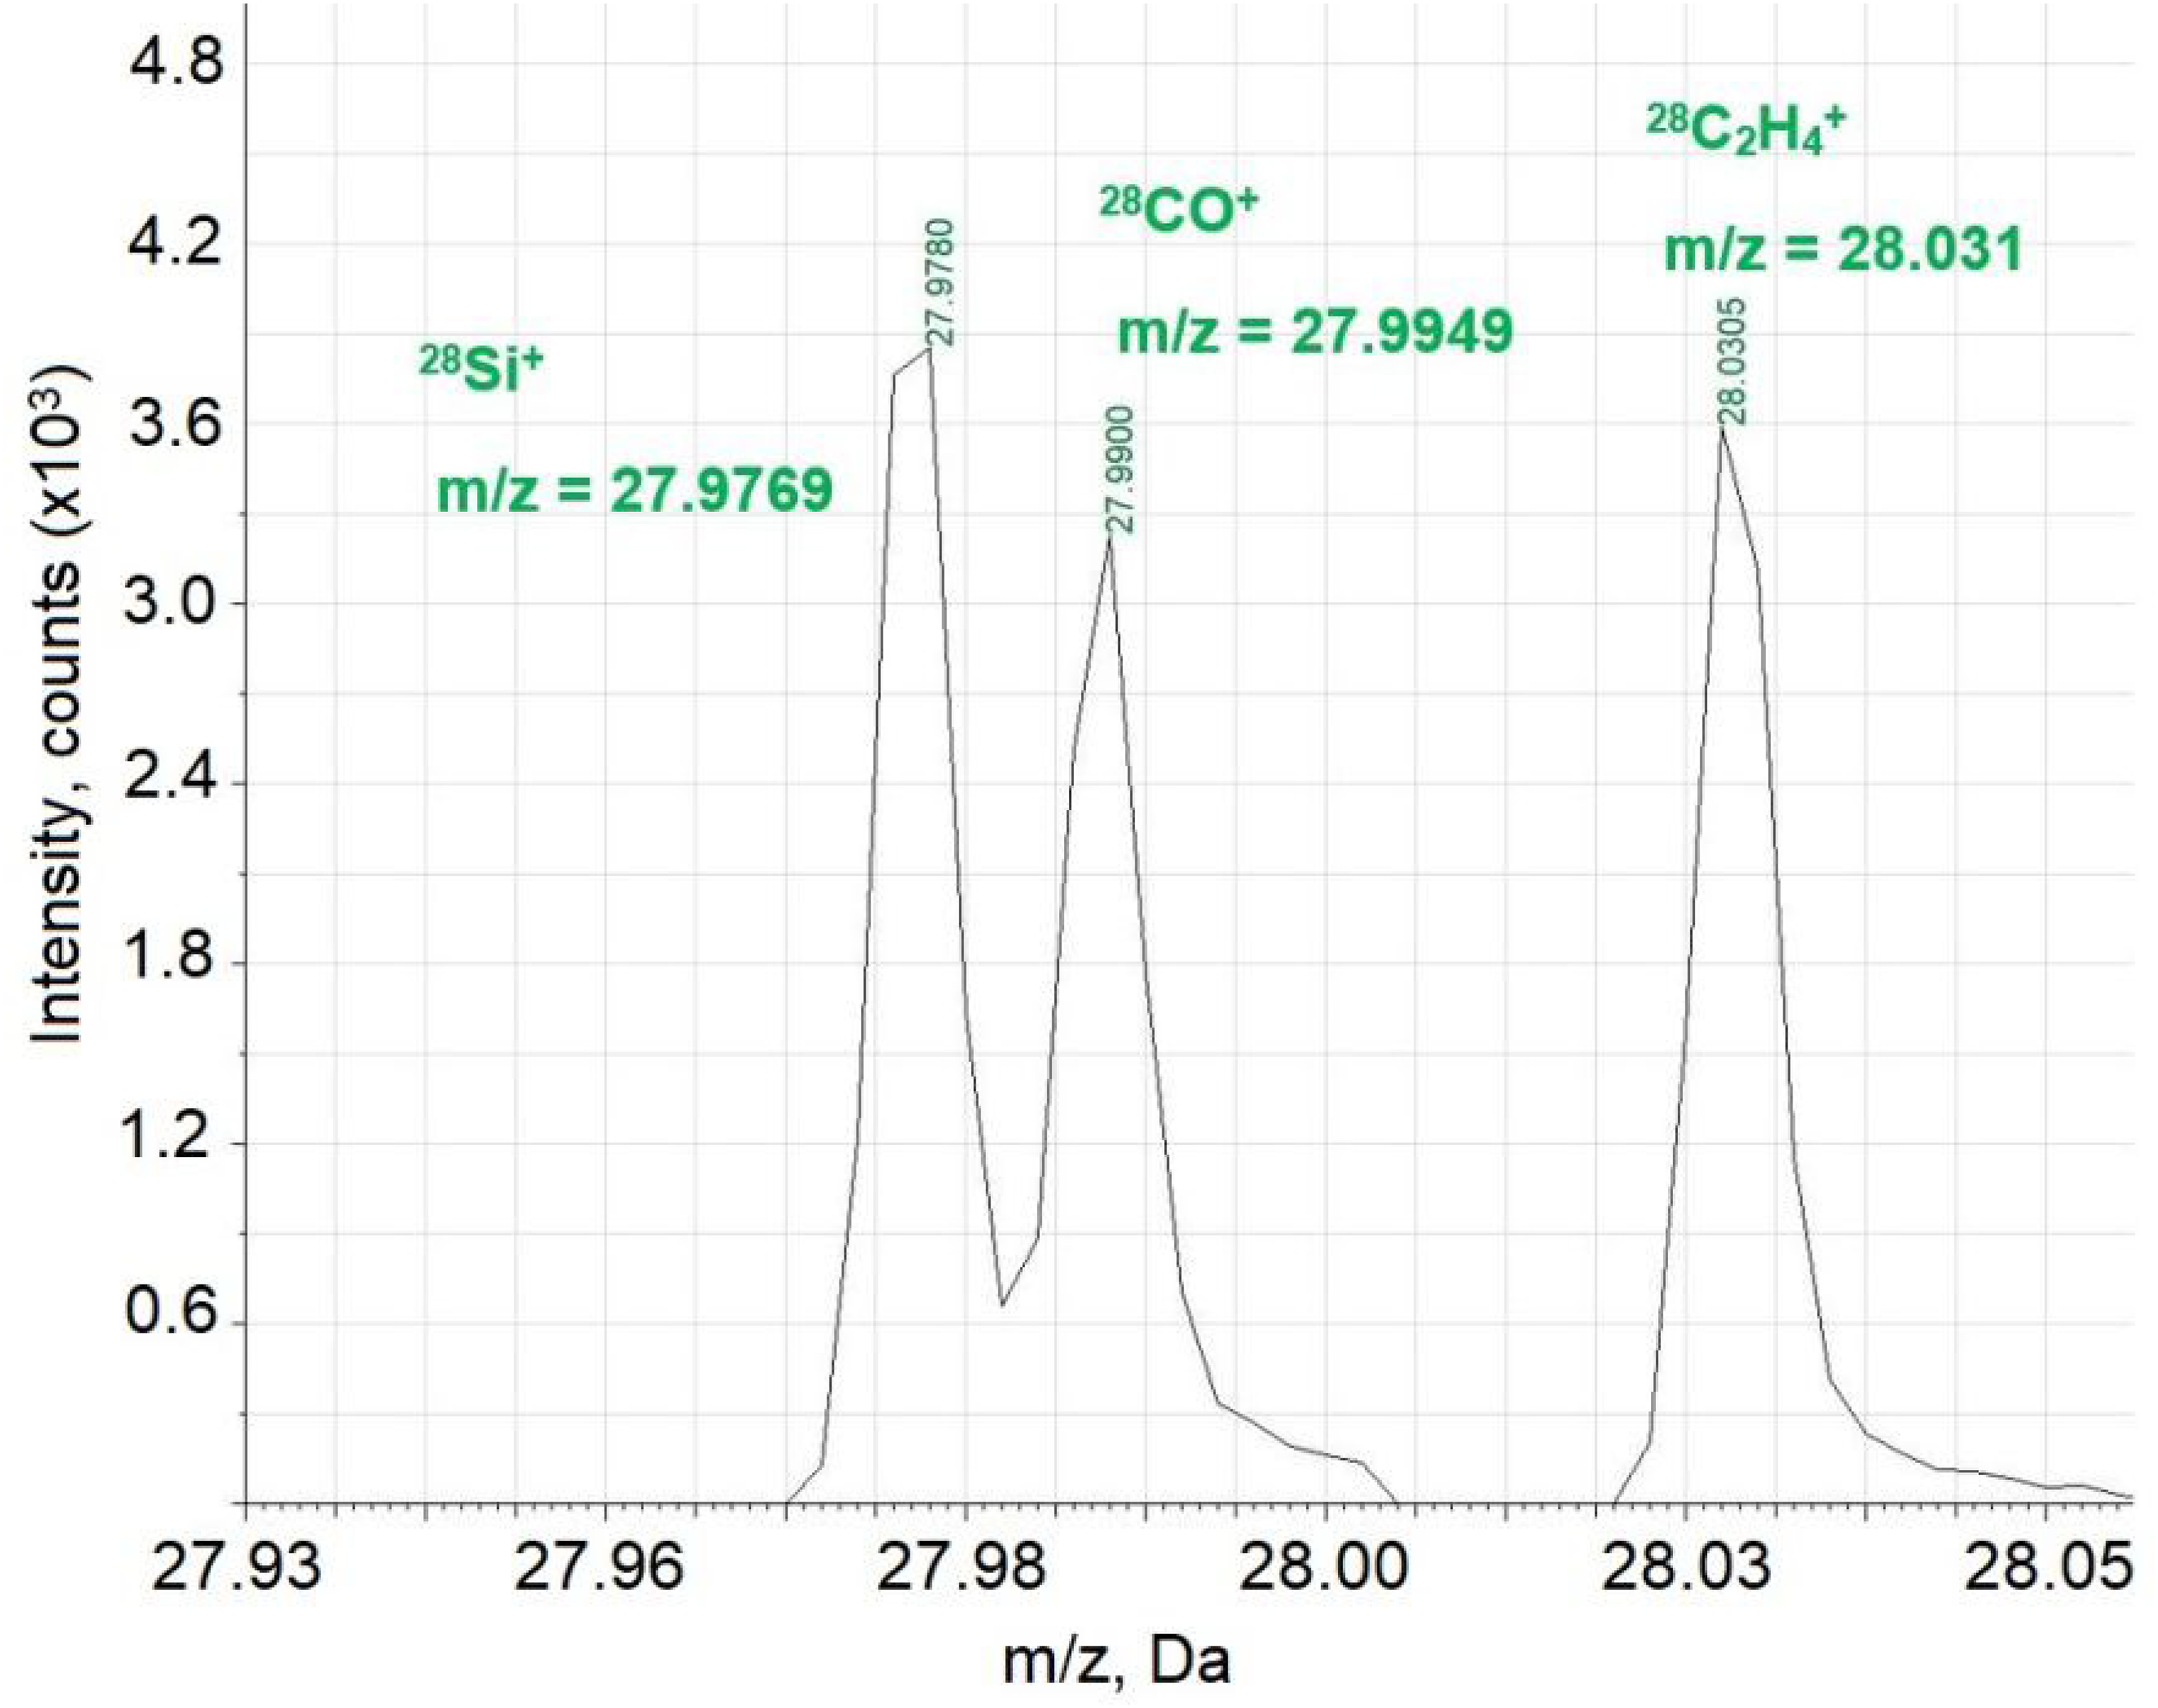
Mass spectrum of the state standard sample of Cu (SSS 11336-2019) in the range 27–29 da (different components for m/z = 28), obtained with the mass spectrometer Lumas PGD-301 with Al CHC. Acquisition parameters are as follows: repelling pulse delay time – 350 µs, pulse duration – 3 µs, pulse period – 400 µs, discharge pressure – 27 Pa.
Significance and application of the RSF-approach
It should be noted that values of RSFs (relative sensitivity factors) for different elements in the PGD-TOFMS system are pretty close. This specific feature is the favorable distinction of this system in comparison with DC GD MS and GD RF-TOFMS.3,28 The reason is greater contribution of Penning Ionization, as the main ionization mechanism for pulsed GD. Also, efficiency of PI for different elements are not significantly different. In addition, sputtering probabilities for all elements in the GD are almost the same. Both these factors allow achieving a relatively low spread in RSF values for different elements (Table 1). These values have been obtained for two types of the matrices, such as the copper and the steel. RSF values for different elements are within one order of magnitude that simplifying the calibration procedure significantly (Table 1). It should be noted, the difference in the RSF values can reach several orders of magnitude using other ionization sources. For example, in the secondary ion mass spectrometry, that is significantly impairs the capabilities of the quantitative analysis.3,28
Measured RSF values for the copper matrix and the steel matrix obtained with the Lumas PGD-301 mass spectrometer.
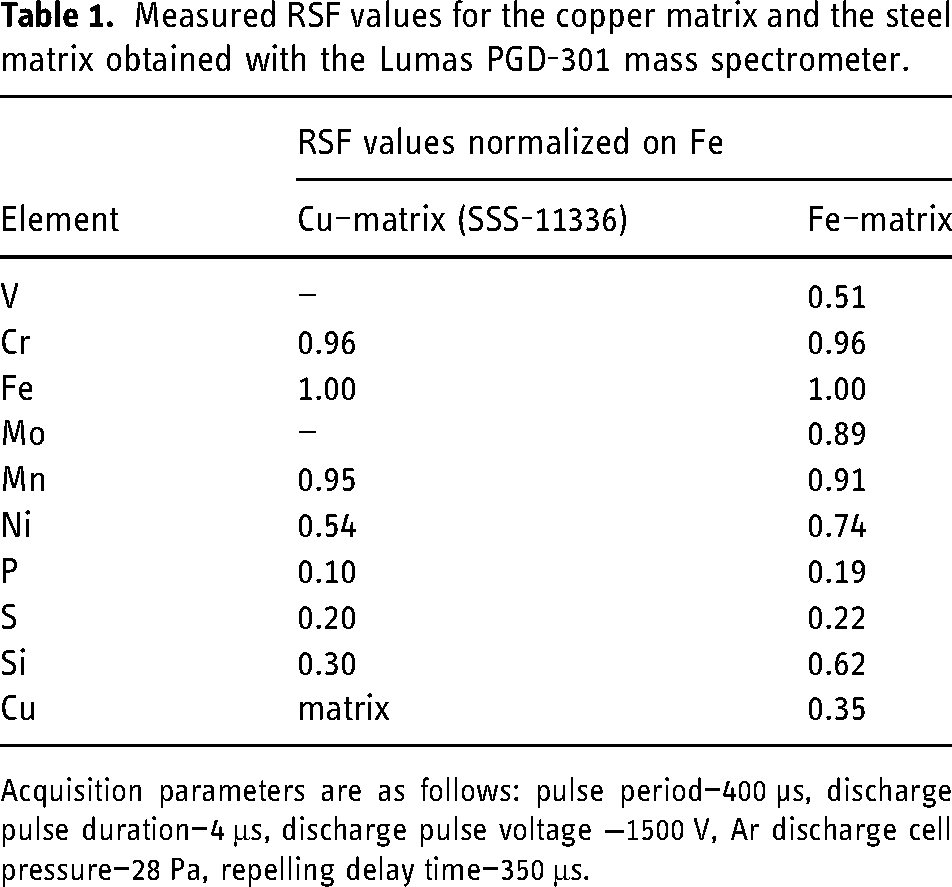
Acquisition parameters are as follows: pulse period—400 µs, discharge pulse duration—4 μs, discharge pulse voltage −1500 V, Ar discharge cell pressure—28 Pa, repelling delay time—350 μs.
Analysis of semiconductors and dielectrics
While the analysis of metals and alloys is a routine application of the GD MS, studying of semiconductor samples, and dielectrics, has unique features and limitations. The direct analysis of non-conductive samples in the direct current GD cells has some limitations. This requires either using an auxiliary cathode, or mixing with a conductive powder, or application of the RF GD.
Silicon
The quantum efficiency of solar-grade silicon is mainly conditioned by the concentrations of impurities of some elements, as Al, C, Mo, W, Ca, K, Cr, Ni, Ti, Fe, Li, O, Ba, Co, Mg, Cu, Zn, Mn. The following elements are admixed with silicon for forming the type of conductivity: B, P, As, Sb, Bi, so their concentrations in silicon used for manufacturing the solar cell wafers must be controlled. In order to meet the specified requirements, concentrations of doping impurities in metallurgical-grade silicon are limited and should not exceed tens of ppm.
Concentrations of doping impurities were determined in metallurgical samples and semiconductor-grade silicon. The wafers of metallurgical-grade silicon (3 mm thick) and semiconductor-grade silicon (0.3 mm thick) were not subjected to any additional sample preparation other than PGD pre-sputtering for 2–3 minutes. The absolute sensitivities for metal samples and silicon samples relative closeness implies that the sputtering of semiconductor silicon samples is carried out similarly to the sputtering of conductive samples. Provided, surface resistance of metallurgical-grade silicon is within the range of 4 × 10³ to 3 × 10⁴ Ohm and its surface has time to reach the cathode wall energy during the pulse duration, and, therefore, its and conductors sputtering processes are equivalent. At the same time the surface resistance of semiconductor silicon exceeds 107 Ohm. In this case, the sample effective sputtering is carried out already due to formation of the conductive surface layer. 17
The following discharge cells can be used for working with this type of samples, such as the discharge cell with the CHC that is being used in this work, the Grimm-type discharge cell with RF GD, 24 or with the auxiliary cathode.25,26 It is worth noting that not only widely used DC GD, but also the pulse DC discharge in Grimm-type discharge cells is inapplicable under such conditions due to the fact that the discharge ignition does not occur in this case.
Note that in spectra obtained in the PGD-TOFMS systems, there are almost no peaks pertaining to double-charged argon ion 40Ar2+. Its intensity does not exceed 10−6 of the intensity of single-charged argon ion 40Ar+. In this context, PGD beneficially differs from inductively-coupled plasma ionization, laser ablation with direct ion detection and DC GD. 18
The well-known effect of the mutual interference between the main argon isotope 40Ar+ and the main calcium isotope 40Ca+ occurs with Ar as a discharge gas. In this case, the calcium isotope 44Ca+ should be used for continuous-type discharges (DC GD, RF GD, and ICP), but sensitivity may decrease by 50 to 150 times. As a rule, even high-resolution MS does not allow to determine 40Ca+ due to a very high intensity of the 40Ar+ component. Another option is the use of a dynamic reaction cell that provides for capabilities for the selective suppression of 40Ar+ without any appreciable decrease in the intensity of 40Ca+. 19 However, the dynamic reaction cell is combined with ICP and not with GD because in the latter case it leads to additional interferences.
The use of PGD provides for a feasibility to appreciably reduce the 40Ar+ component intensity as compared to the 40Ca+ component through the time discrimination of the gas components.18,20 However, this reduction is not sufficient for the determination of 40Ca+ in the real samples.
Adding 0.3% of hydrogen to argon is used for more appreciable suppression of the gas components in the pulsed discharge.
20
In this case, the Ar+ component intensity decreases due to a very efficient reaction:
The data on metallurgical- and semiconductor-grade silicon analysis, obtained with PGD at the Lumas-30 time-of-flight mass spectrometer, demonstrate fairly good correspondence with the results obtained by other methods, such as ICP-OES and ICP-MS with sample dissolution, LA-ICP-MS, or the spark mass spectrometry 17 (Table 2).
The results of determining the content of elements in semiconductor-grade silicon, obtained using SSMS (JMS-01-BM2 (JEOL, Japan) and GD MS (Lumas-30); n = 5, t = 2.776, p = 0.95.
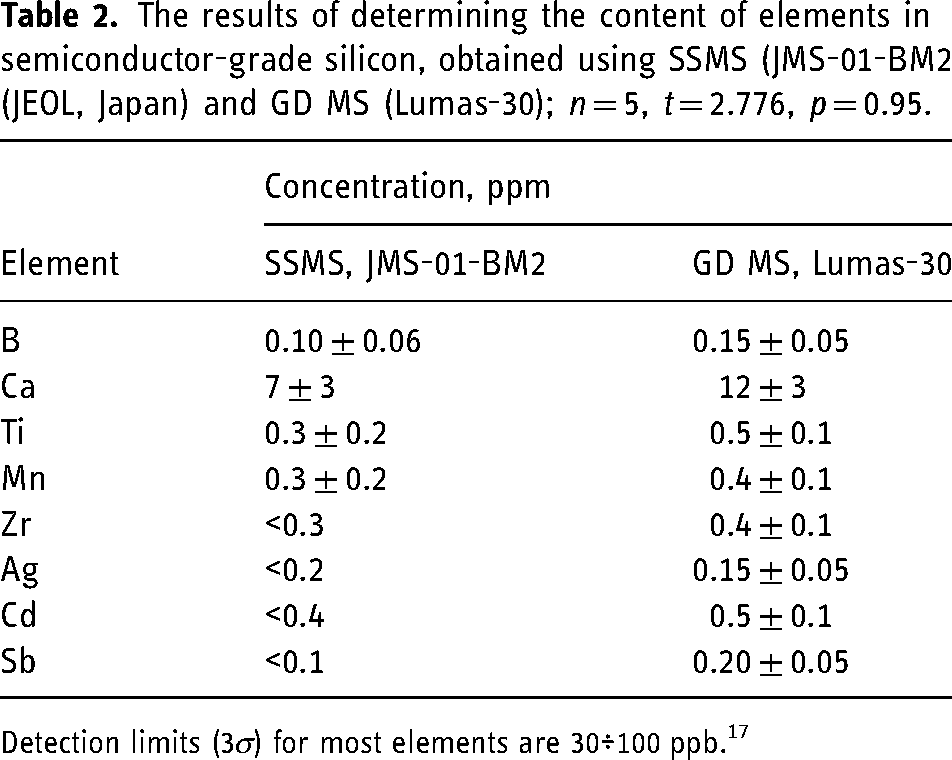
Detection limits (3σ) for most elements are 30÷100 ppb. 17
Silicon carbide
Silicon carbide (SiC) is a prospective material in electronics. Solid SiC in form of plates was efficiently sputtered, as well as metals, in the PGD-TOFMS discharge cell with a CHC. The high efficiency of SiC sputtering is associated with the formation of a conductive surface layer in the discharge, which sharply increases the sample sputtering rate.21,26
The qualitative and semi-quantitative determination of elements in range Li–U in five silicon carbide powder samples were carried out using mass spectrometer Lumas PGD-301. Sputtering of a powder sample pressed into aluminum substrate is significantly less effective, since in this case a stable conductive layer is not formed. Therefore, for effective atomization of SiC powder, it was mixed with 50% weight indium (99.9999%). Then, the mixed powder was pressed by a PGR-10 (LabTools, Russia). The concentration of elements in the Standard SiC BAM S-008 (BAM S-008) sample (Berlin, Germany) were detected with the additive method. Calibration curves have been created with the Standard BAM S-008 of ion solutions of the detected elements by six parallel measurements. Working solutions were prepared with the addition of 0–5 ppm, 1 ppm, 8 pmm, 16 pmm, 80 ppm, and 160 ppm for each element. SDs were calculated from the obtained data (Table 3). A fairly good convergence of the experimental results with the certified values is observed, as can be seen from Table 3. The concentrations of all elements, with the exception of N, were determined under Penning ionization conditions at long delays of the buoyancy pulse. Since N has a higher ionization potential than the energy of metastable atoms of the discharge gas Ar, the conditions for EI were optimized for it. EI was used operating at short delays (14 μs for N was) to determine elements with high ionization energy. 3
Concentration of elements in standard sample SiC BAM S-008.
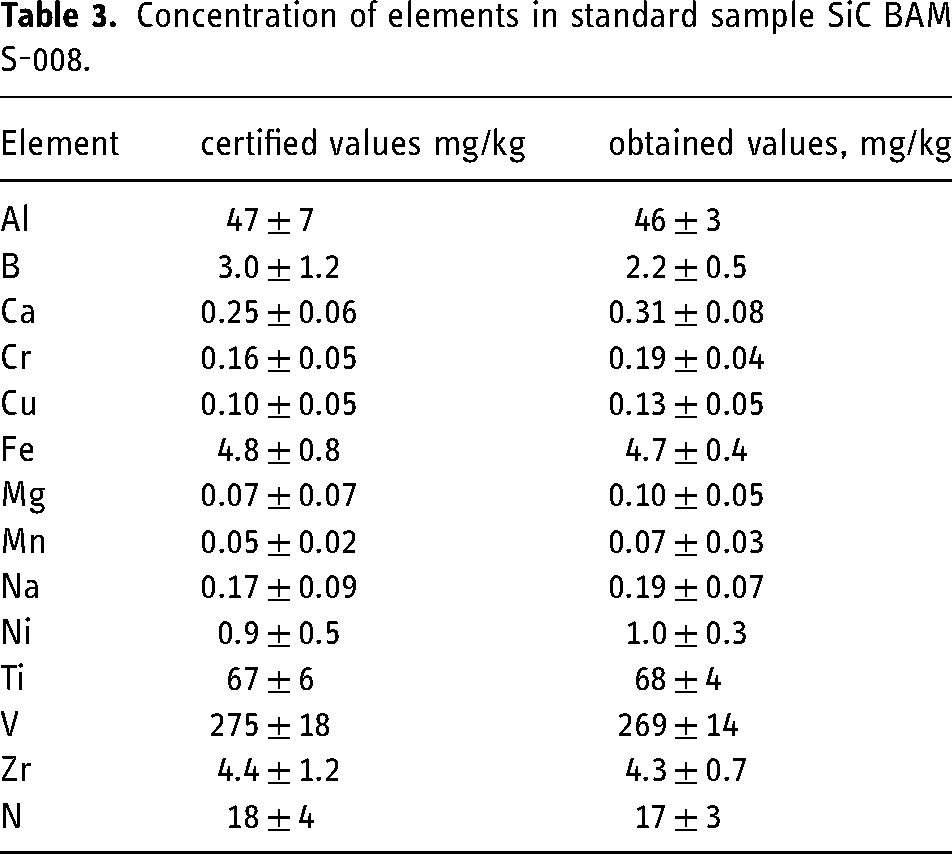
Detection limits for elements not presented in the table in the sodium–uranium range were in the range of 5–10 ppb.
GaN and Ge
Gallium nitride (GaN) is one of the most promising semiconductor materials for optoelectronics, power electronics, and microwave electronics.21,22 Visible and ultraviolet light-emitting diodes, laser diodes, Schottky diodes, and transistors are manufactured based on GaN.
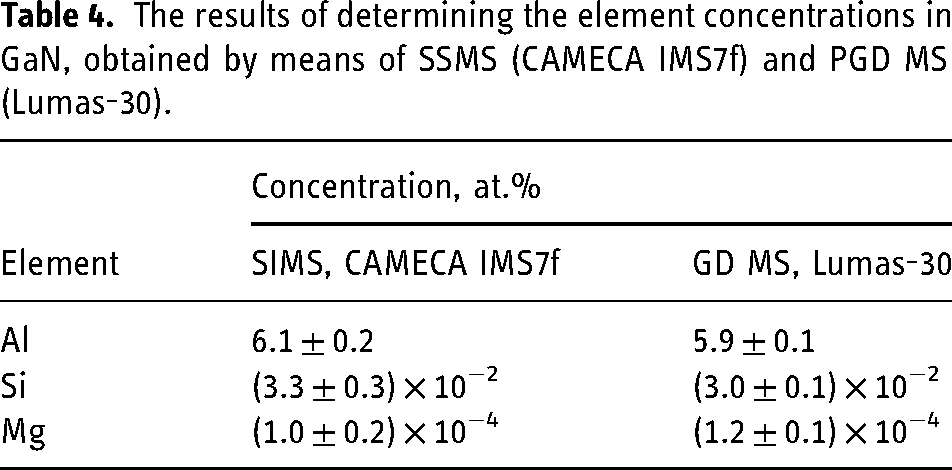
The aluminum cathode is replaced with tantalum, since the aluminum content needs to be determined. It should be noted that GaN has a lower tolerance to the temperature exposure in comparison with SiC and requires milder sputtering conditions. Figure 5 presents two sections of the GaN mass-spectrum. The obtained results are in a good agreement with the SIMS analysis data (see Table 4).
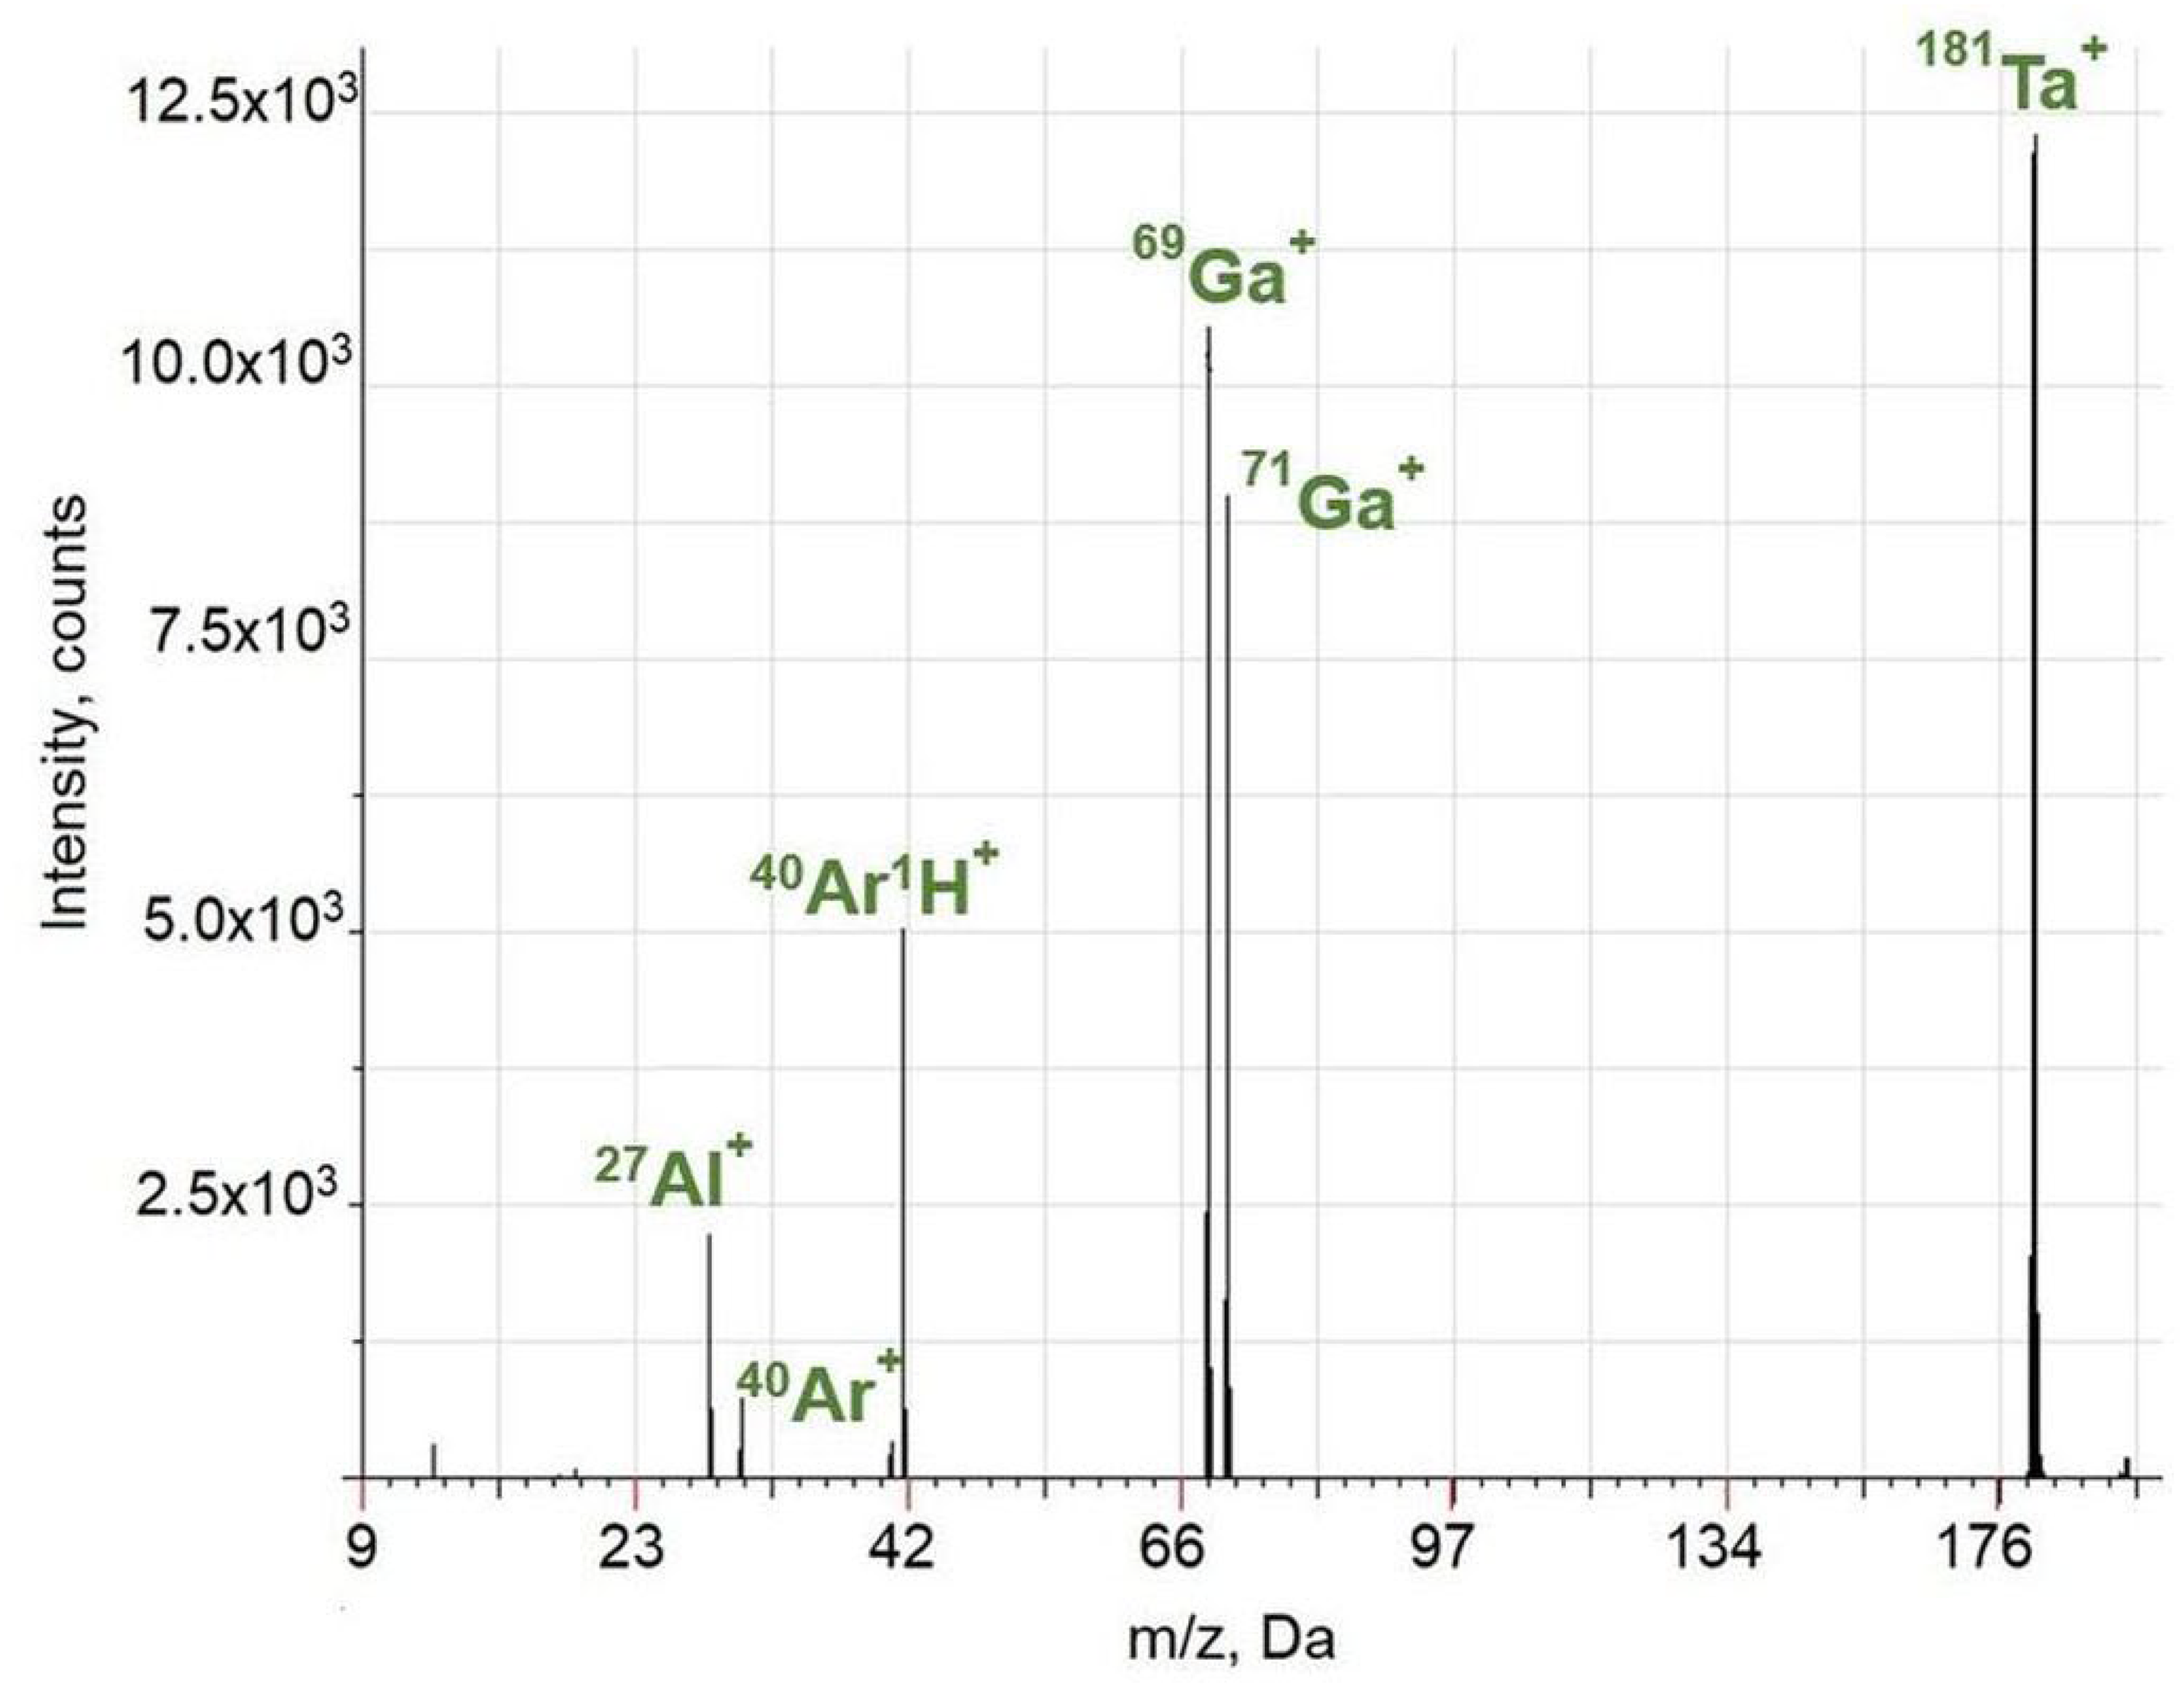
Mass spectrum of a GaN sample with Ta CHC in the range of 9–190 Da, obtained with the Lumas-30 mass spectrometer. Acquisition parameters are as follows: repelling pulse delay time – 250 µs, pulse duration – 3 µs, pulse period – 300 µs, discharge pressure – 38 Pa.
The results of determining the element concentrations in GaN, obtained by means of SSMS (CAMECA IMS7f) and PGD MS (Lumas-30).
It is worth noting that the surface conductivity formation is relatively easy and stable in case of semiconductor materials. As a result, time-of-flight mass spectrometry using the PGD-TOFMS in the discharge cell with a CHC can be successfully used for the direct determination of impurities in semiconductor materials using the similar sample preparation procedure as for conductive samples. The panoramic mass spectrum of Ge obtained with the Al CHC is presented in Figure S4, illustrated high sputtering efficiency of semiconductor germanium. Relative intensities of matrix components remain high when using the auxiliary cathode. Its values are noticeably higher than obtained with the different secondary cathodes (attempts to select materials or optimize dimensions did not lead to an increase of these values to more than 0.16–0.17).23–25
Moreover, as noted in Ref., 26 it is also necessary to choose between the best sample-to-cathode ratio and the highest value of the absolute analytical signal. Besides, every time it is required to find a balance between the processes of sample sputtering and deposition of the secondary cathode material. Thus, the real ratios are, on average, within the range 0.01–0.20. The proportions of the intensities of the main component of the semiconductor sample and the auxiliary cathode material obtained in CHC for different cathode materials are presented in Table 5.
Ratios of the intensities of the main component of the sample and the auxiliary cathode material obtained for different cathode materials.
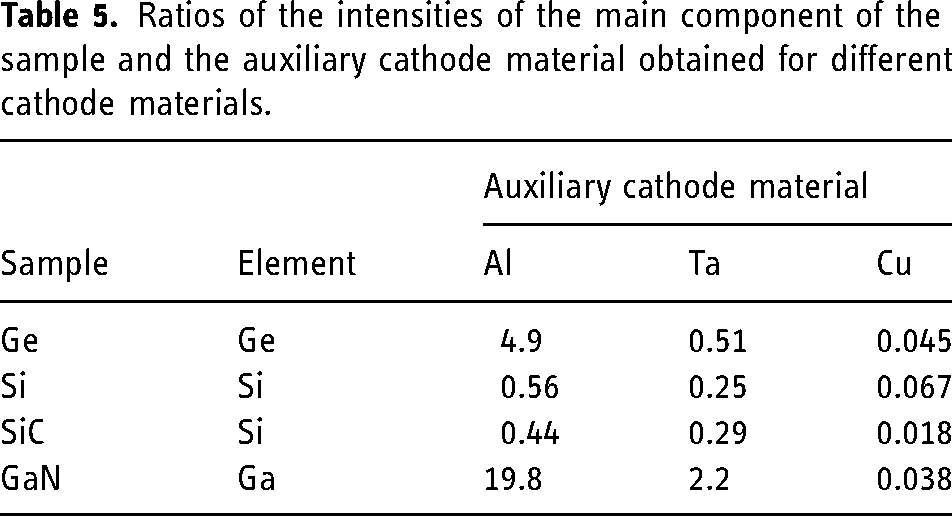
The Al CHC allows obtaining the highest values of absolute and relative intensities (Table 5). Therefore, it can be efficiently used for the analysis. The using of Al CHC for mass spectral analysis is due to Al being a monoisotopic element, not prone to the formation of oxide clusters and, characterized by minimal interference effects.
The Ta CHC is also a very effective cathode from the viewpoint of values of absolute and relative intensities of the sample ions. As well as, using the Ta CHC is promising due to the getter properties of Ta. It should be noted that the Ta CHC discharge is more stable when working with dielectric samples, compared to the Al CHC.
The Cu CHC is characterized by a rapid deposition of the sample surface with Cu, which makes sputtering of dielectric samples practically impossible. The Cu CHC provides very low relative intensities of the sample ions and, consequently, relatively low absolute intensities. That is the reason why only aluminum and tantalum cathodes were used for semiconductor analysis.
Analysis of dielectrics
Dielectric solid-state materials are used in various fields of science and technology. The unique properties of each material are conditioned by the content of the main components and impurities, both light and heavy elements, and their concentrations are at the level of ppm or below. 27 GD MS is a good tool for determining dielectric material composition over a wide range of concentrations by using various discharge (DC GD, RF GD, and PGD) and cathode options (flat cathode, secondary cathode, and combined cathode).3,16,26,28
In general, GD sources of DC-type and RF-type are similar in many respects, such as plasma properties and behavior, number of interferences in spectrum, and analytical characteristics. These aspects were studied in detail in the works by Harrison.35,36 Parameters and properties of PGD are rather different from those of DC GD and RF GD.3,28 These differences are discussed below.
The continuous/pulsed RF GD source, either with mass-spectrometric detection of ions or with an optical emission ion detector, are widely used in depth profiling of samples with thickness within a range from tens of nanometers to several micrometers.29–31 A considerable part of research activities on this subject was performed by the team of Lara Lobo et al., see Refs.32–34 These works provide descriptions of the effective procedure for analysing both conductive and non-conductive samples with relatively high mass resolution. For example, the research work 35 dealt with perovskite absorber layers deposited onto glass substrates and investigated them using the pulsed RF GD. It should be noted that using the pre-peak range in the pulsed RF GD 32 allows an efficient analysis of ultrathin layers (1–30 nm) because of the minimum number of polyatomic spectral interferences.
Despite of all the advantages of the RF discharge source, this method has limitations when analysing thick dielectric samples. These limitations arise from a high capacitive loss in dielectrics which, in turn, leads to the loss of sensitivity.8,26,36,37 The loss of the sensitivity can be compensated by increasing RF pulse power. However, this measure may cause a sample to overheat, which is implicate for easily-fusible or brittle samples. This issue can be partially solved by using the pulsed RF GD.38,39 For example, Bouza et al. 8 optimized parameters of pulsed RF GD ionization in such a way as to analyze the gold-coated (6-mm thickness) ceramics samples. The effective use of different pulse regions for quantification in depth profiling by PRF GD-TOFMS was presented. 40 The effect of the pulse duration to the depth profiling resolution is described in. 41 In particular, it significantly impacts processes occurring in the discharge during the sputtering of dielectrics and does not have such a strong effect on conductive samples. Thus, RF sputtering of non-conductive samples has significant advantages but is not suitable for all samples. In such cases, the microsecond PGD is a competitive option for both the depth profiling and analysis of dielectric samples.
The use of PGD reduces the surface charge accumulation through compensation with recombination of electrons in the course of plasma decay during the time interval between the pulses. 42 Moreover, as was noted above, the PGD is a highly-efficient ionization source that provides increased analyte intensities in comparison with the DC discharge.26,43 Sputtering of dielectric samples with the microsecond PGD requires formation of a conductive surface layer. 26 This layer can be formed on a sample by pre-coating its surface with a thin metal layer (Ag, Ta, etc.). The sputtering process is initiated on this metal coating and then proceeds to the sample. The sample sputtering is sustained due to formation of surface conductivity associated with easily-sputtered component depleted in the sample surface. 26
Secondary cathodes have been used for a long time and have proved their effectiveness in the analysis of dielectric materials when using the DC GD.23,44,45 A conductive layer is deposited as the mask of a required shape (e.g., with one round hole in the secondary tantalum cathode).23,44,45 Indium and silicone are also recommended for use as the materials for masks with several slits. 52 This is illustrated on the example of the analysis of sapphire and aluminum. It is shown that the signal intensities and matrix-to-mask signal ratios are higher than in the case of using the typical single-hole secondary tantalum cathode. However, the mask material does not effect on sensitivity as much as the discharge conditions.
Disadvantages of secondary cathodes should also be noted. Their using can induce a spectral pollution, as well as cause sample dilution and, as a result, increase detection thresholds and reduce repeatability. 45 Furthermore, it is worth noting that the uniformity of sputtering and the shape of the crater heavily depend on secondary cathode thickness and discharge conditions. However, secondary tantalum cathodes are quite pure ones and have specific gettering properties, 23 while silicon masks, cut by a laser from plates, have high repeatability and are not subject to contamination, 46 in contrast to sodium–indium cathodes, which require pre-processing with etching.
A CHC is a metal cylinder with a central round hole of a few millimeters in diameter. A bottom of this cylinder is an analyzed sample formed as a flat disk. The research of Gubal et al. 26 suggests that in case of microsecond PGD with CHC, two processes enable efficient sputtering of samples: (i) re-deposition of a CHC material on the sample surface and (ii) enrichment of the sputtering area with the sample elements having lower sputtering rates. Both of these processes are involved in formation of the sample surface conductivity required for efficient sputtering of the sample. It should be noted that the hollow cathode discharge cell, compared to the Grimm-type discharge cell, allows increasing the sputtering rate and ionization efficiency due to its cylindrical shape, forming a trap for fast electrons.26,47 Mechanisms of the dielectric material sputtering are described in detail in. 26
Analysis of geological samples
Direct determination of element concentrations in solid samples is one of the main tasks for GD MS. In particular, the DC GD MS is used for the direct analysis of various soils and minerals.
For example, analytical samples were prepared by grounding mineral into powder and depositing of indium. 48 However, only semi-quantitative data were obtained.
The determination of isotope ratios for uranium and thorium in various natural minerals by means of a mass spectrometer with the PGD in a discharge cell with the CHC is described in. 49 Grinded into powder minerals were pressed into the surface of high-purity aluminum cathode with nickel matrice to prepare the samples. Determination of relative sensitivity factors was carried out on a model sample: zirconium oxide with various content ratios of uranium, thorium, gadolinium, and lead. The measured RSFs of gadolinium and lead were used as the internal standards. In addition, detecting rare-earth elements was shown. The detection limits were 0.3 ppm for uranium and 0.5 ppm for thorium. 49
The method for the determination of 24 elements (As, B, Ce, Co, Dy, Fe, K, La, Lu, Mg, Mn, Na, Nb, Nd, P, Pr, Rb, S, Sb, Si, Sm, Th, Ti, and U) by means of the PGD MS in powder geological samples is presented in Ref. 50 During sample preparation, the powder is pressed into 10 mm diameter aluminum pellets. Eessexite gabbro SGD-1A and NIST SRM 2782 were used as reference standards. Detection limits for this method are within the range of 2–4 × 10⁻⁶ mass %, depending on the element. This method demonstrates high repeatability of the measured and specified concentrations of elements in a sample. 50
Figure 6 and Figure S5 in Supplementary Materials show the capabilities of the zircon crystal pressed into the Al substrate analisys. These figures show several regions of the zircon mass-spectrum. PGD-TOFMS system allows the efficient determination of both matrix components of zircon and impurities, including REE.
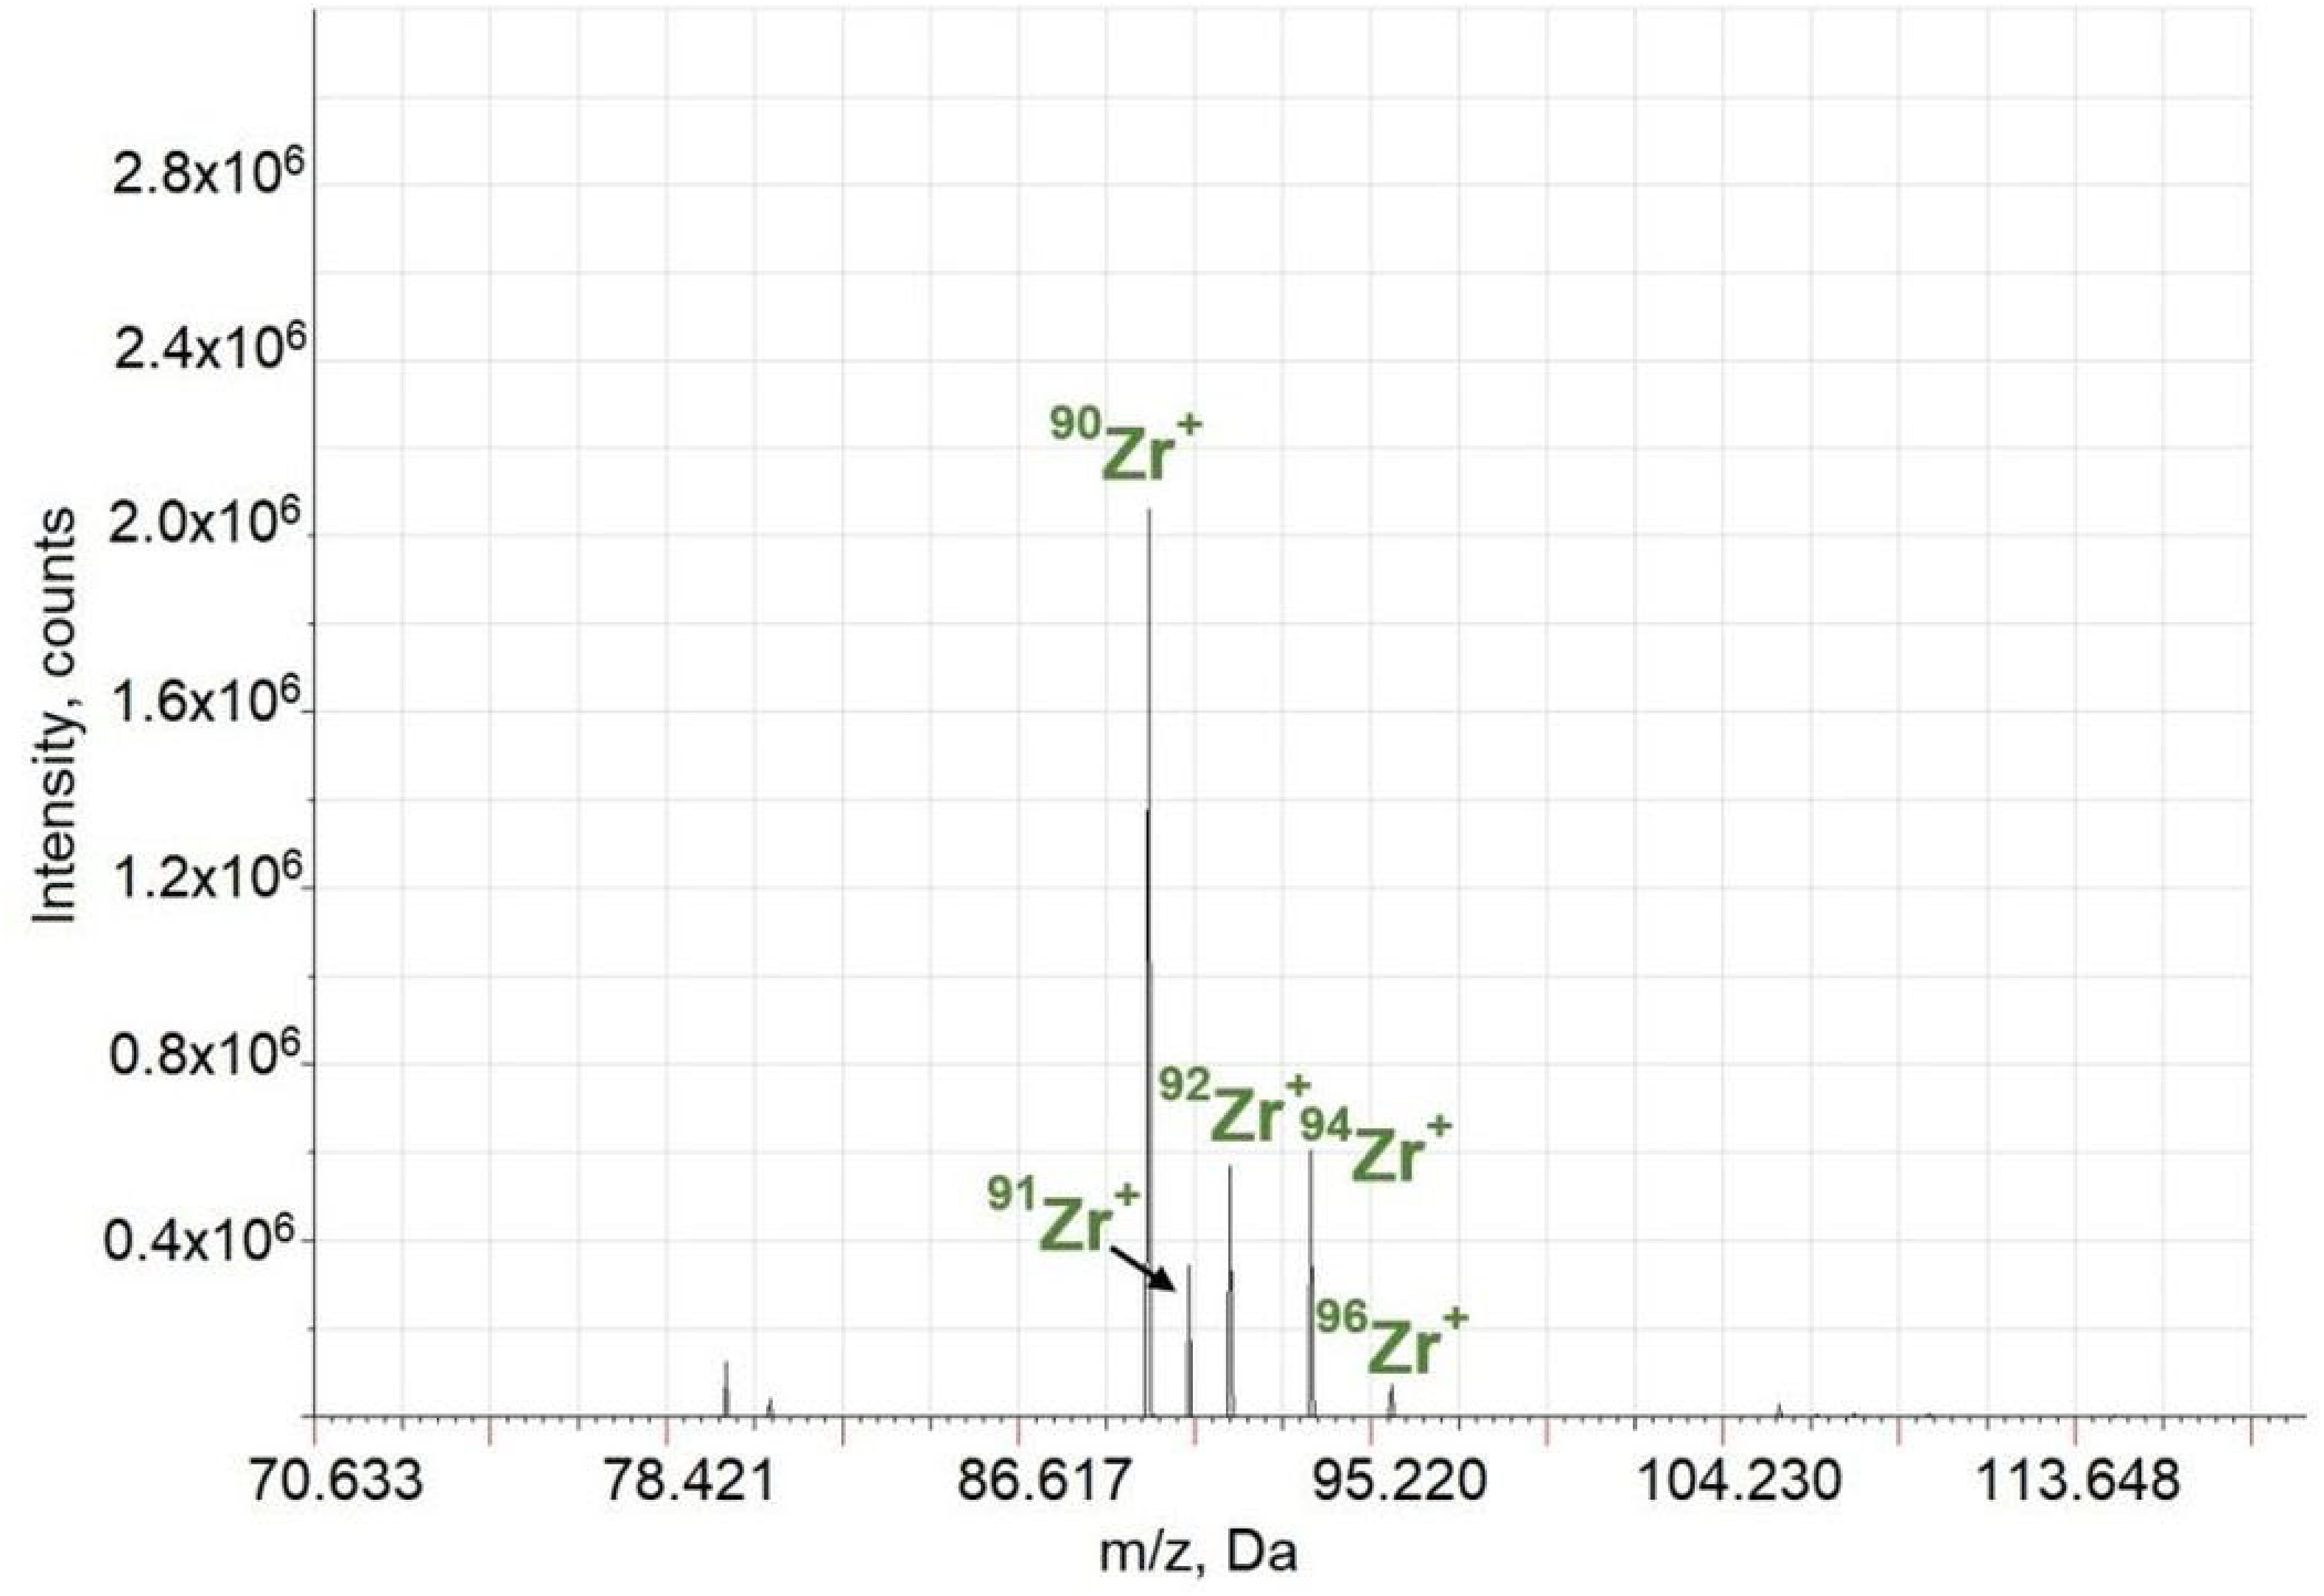
Mass spectrum of a zircon crystal pressed into Al substrate in the range of 70–120 Da (Zr isotopes), obtained with the Lumas PGD-301 mass spectrometer. Acquisition parameters are as follows: repelling pulse delay time – 350 µs, pulse duration – 3 µs, pulse period – 400 µs, discharge pressure – 27 Pa.
Analysis of nonlinear crystals
Dielectric materials were analyzed, such as a single crystal of sapphire (α-Al2O3 27Al+, transparent corundum) and quartz with the PGD-TOFMS system Lumas-30.51–53 We proposed to cover the sample surface with thin metal layers to achieve efficient and stable sputtering of dielectric material. 52 The effect of pre-deposited Al and Ta films of various thicknesses (30–200 nm) is described in Ref. 54 We used this approach for the depth profiling of glasses. 54
Single crystals of the potassium-titanyl-phosphate (PTP) family are subjects of many studies performed by the research team of Bodnar et al.27,51,53,55 In particular, the researchers suggested to use a suspension of silver in isopropanol. This technique does not require monitoring of the coating layer thickness, takes minimal time and does not require any specialized equipment. With this approach, the efficiency of sputtering the PTP crystals is close to the sputtering efficiency of conductive materials. This approach also allows analysing the distribution of the main components and impurities in the Rb-doped KTP crystals with a high accuracy and efficiency. 27
Determination of the elements with high ionization energy
Results of high-fluorine crystal analysis obtained by direct sputtering of the crystal are presented in. 51 Quasi-periodic change in the intensities of the crystal components was observed. This effect can be explained by the formation of ion currents in the samples, which causes a periodic change in the surface conductivity that significantly influences the sputtering rate and intensities of detected ions. Our team proposed a relatively simple and quick procedure for sample preparation to eliminate this effect. We achieved uniform sputtering of the crystals by applying a layer of the silver suspension (1–2 μm thick) over the entire surface of the crystal. Such preconditioning allows to eliminate the influence of the external field on the F+ ions mobility inside the crystal and to stabilize the intensity of the detected ions. 28 It should be noted that for the potassium gadolinium tungstate (KGW) crystals 55 we achieved efficient and stable sputtering without applying the silver layer.
PGD is found to be applicable for analysis of elements with high ionization energy, such as O, N, Cl, and F, in solid samples.
3
As was mentioned above, the package of high-energy electrons is formed at the leading edge of the discharge pulse. These high-energy electrons enable the ionization of elements that have ionization energies higher than the energy of metastable atoms or molecules of the discharge gas, see Equation (18)
56
:
The Penning ionization mechanism hardly works when Ar-plasma is used (EM* = 11.55 eV) for elements with high ionization energies, such as Cl (13.0 eV), O (13.6 eV), N (14.5 eV), and F (17.42 eV). The efficiency of the Penning ionization mechanism is very low for Cl determination. In addition, the chlorine isotope 37Cl interferes with 36Ar1H and (1H216O)21H+. On the contrary, using the EI mechanism is successful in the achievement of low LoD for Cl (30 ppb); for O and F, the LoD values are 10 ppm and 100 ppm, respectively, with Lumas-30 (resolution is about 800 at m/z of 20 Da).51,53 Since in the case of F, Ar2+ and hydronium ions H3O+ are revealed, LoD can be reduced by using a different discharge gas or a mass spectrometer with a higher resolution. As can be seen from Figure 7, using the Lumas PGD-301 mass spectrometer with the mass resolution of 6000 helps to get rid of interferences with Ar2+ and hydronium ions H3O+ when determining the F components. In this case, LoD for F were reduced to 1 ppm.
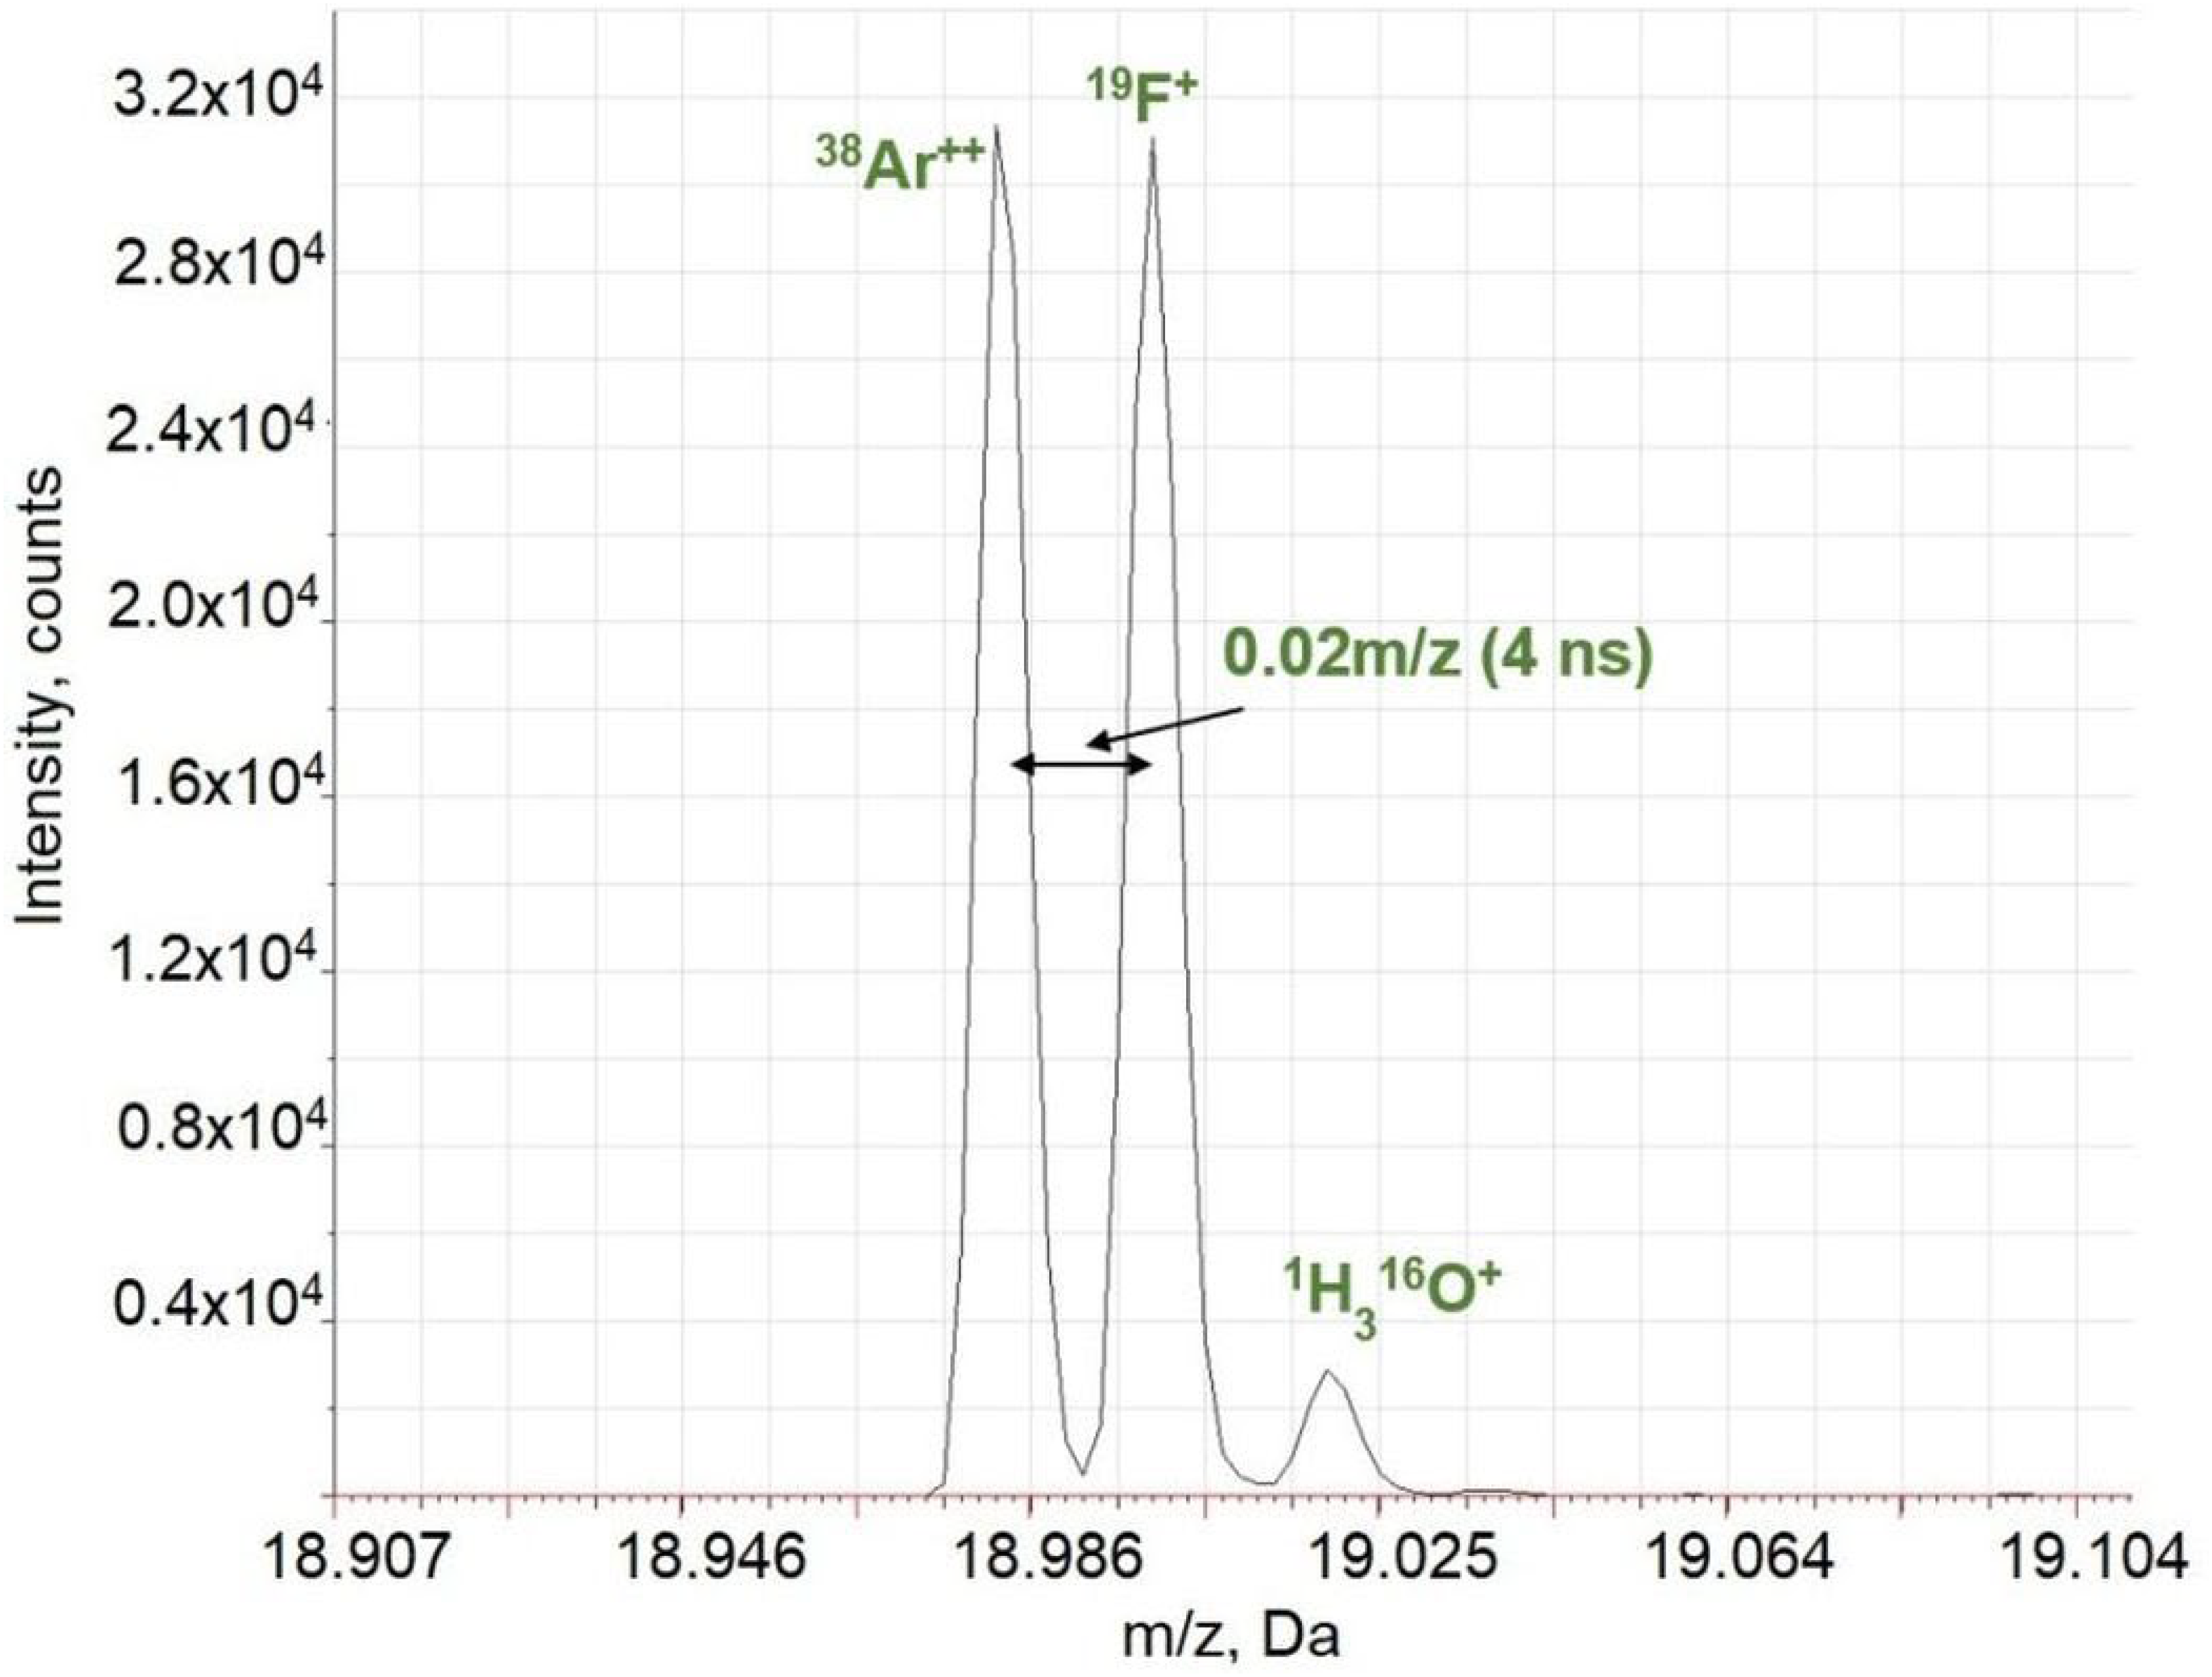
Mass spectrum of a reference standard SLG-1 in the range of 18–19 Da, obtained with the Lumas PGD-301 mass spectrometer, is shown with repelling pulse delay time of 14 µs. Fluorine concentration is 400 ppm. Acquisition parameters are as follows: repelling pulse delay time – 14 µs, pulse duration – 3 µs, pulse period – 400 µs, discharge pressure – 27 Pa.
Investigation of using different gases and gas mixtures like neon (E* = 16.6 eV) with higher energies of metastable atoms than argon described in Ref. 57 This value of the metastable level energy, in principle, allows using the Penning mechanism to ionize such elements as N (E = 14.5 eV), O (E = 13.6 eV), and Cl (E = 13.0 eV). The ionization energy of fluorine is 17.42 eV. We expected that fluorine is not able to be ionized with the Penning ionization process. In contrast, its ionization by the package of high-energy electrons under the condition of short times of the extraction pulse delay was very effective. The same reasons are valid for oxygen: the efficiency of oxygen ionization by the Penning ionization process is not very high—oxygen, like fluorine, is efficiently ionized only under EI conditions. LoD for O and F with Ne-plasma are appreciably lower than that with Ar-plasma and are 5 ppm and 2 ppm, respectively. Ganeev et al. 58 used discharge gas mixture (Ar (69.7%), He (30%), H2 (0.3%)) and microsecond PGD with Lumas-30 to determine nitrogen concentration in steel. In this case, argon also provides sputtering of the sample, and an addition of helium allows nitrogen to be ionized with the Penning ionization mechanism in the afterglow plasma of the PGD. The presence of a small amount of hydrogen helps both to suppress the intensities of interfering gas components and clusters existing in the discharge plasma (Ar+, ArH+, OH+, O+, CO+, etc.) due to ion-chemical reactions and to improve the analytical characteristics. Detection limit in 58 was relatively high (300 ppm) but sufficient for N determination in constructional steels.
Isotope analysis
PGD-TOF MS can be effectively used for direct isotope analysis of solid samples49,59 due to small number of interfering cluster components in mass spectra of such an ionizer. The high-resolution mass spectrometer is the most efficient instrument in this case, because it helps to eliminate the masking effect of even weak components interfering with the detected isotopes.
The isotope ratios for U obtained with the Lumas-30 mass spectrometer and also those obtained by means of the Thermo Element-2 ICP-MS are presented in Table 6. 59 The analyzed particles were pressed into the high-purity aluminum plate. 59 As you can see in Table 1, the obtained results demonstrate good compliance between these techniques.
Uranium isotopes quantification in Chernobyl specimens, acquisition time 5 minutes, τi = 250 μs, pressure 37 Pa, pulse duration 4 μs, pulse frequency 3.2 kHz. Lumas-30.
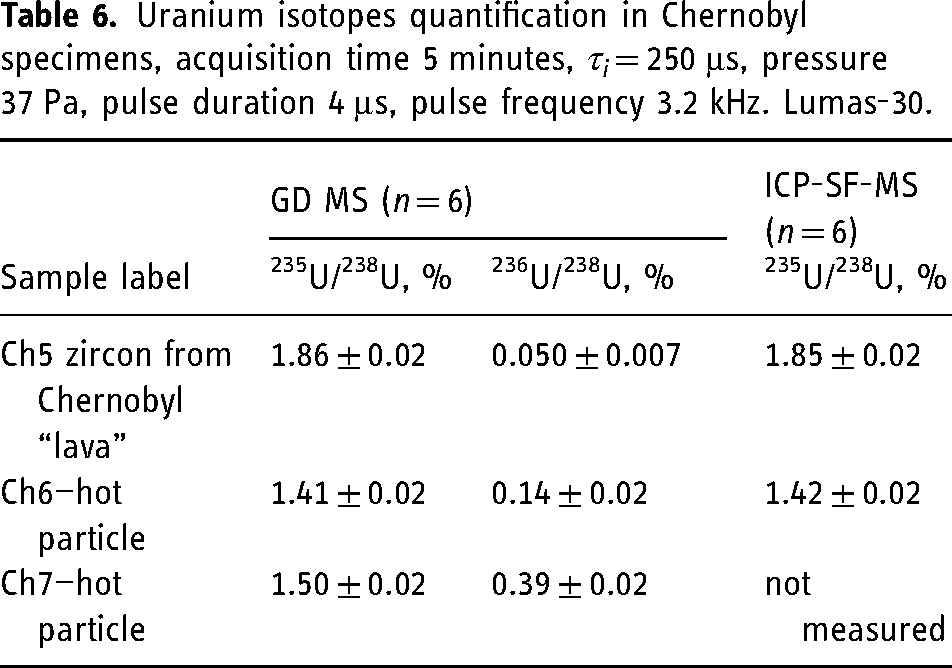
The accuracy of determination of the isotope ratios for time-of-flight mass spectrometry with PGD-TOFMS is within the range of 0.2% to 1%. It is governed both by the statistics of ion counts 59 and by isotope fractionation in the discharge.
It should be noted that there is no fractionation during sample sputtering because the sputtering rates in the GD are the same for all isotopes of an element.
Gas mixtures analysis
Determination of VOCs concentrations in air and gases, VOCs fragmentation
One of the most used VOC ionization methods in the modern practice is ionization by electrons with energies of 70 eV. This approach, despite its advantages (high repeatability, versatility, etc.), is characterized by a relatively high fragmentation rate of compounds, which complicates the analysis of multi-component mixtures. On the other hand, soft methods of chemical ionization are quite selective ones, and therefore, they cannot be applied for the analysis of many kinds of compounds. The use of PGD provides capabilities to analyze a wide range of compounds with a minimal destruction.
The PGD discharge cell of the Lumas-type spectrometers has been modified to analyze gas samples. Sampling was performed through a quartz capillary inserted into the argon channel. Injection of air samples from the sampling bag carried out directly to the Argon free PGD discharge cell volume through the quartz capillary (O.D. = 250 µm, I.D. = 140 µm) (see Figure 8). Outflow from the gas-sampling bag into the discharge cell is realized due to the pressure difference. The experimental system is described in more detail in Refs.10,60
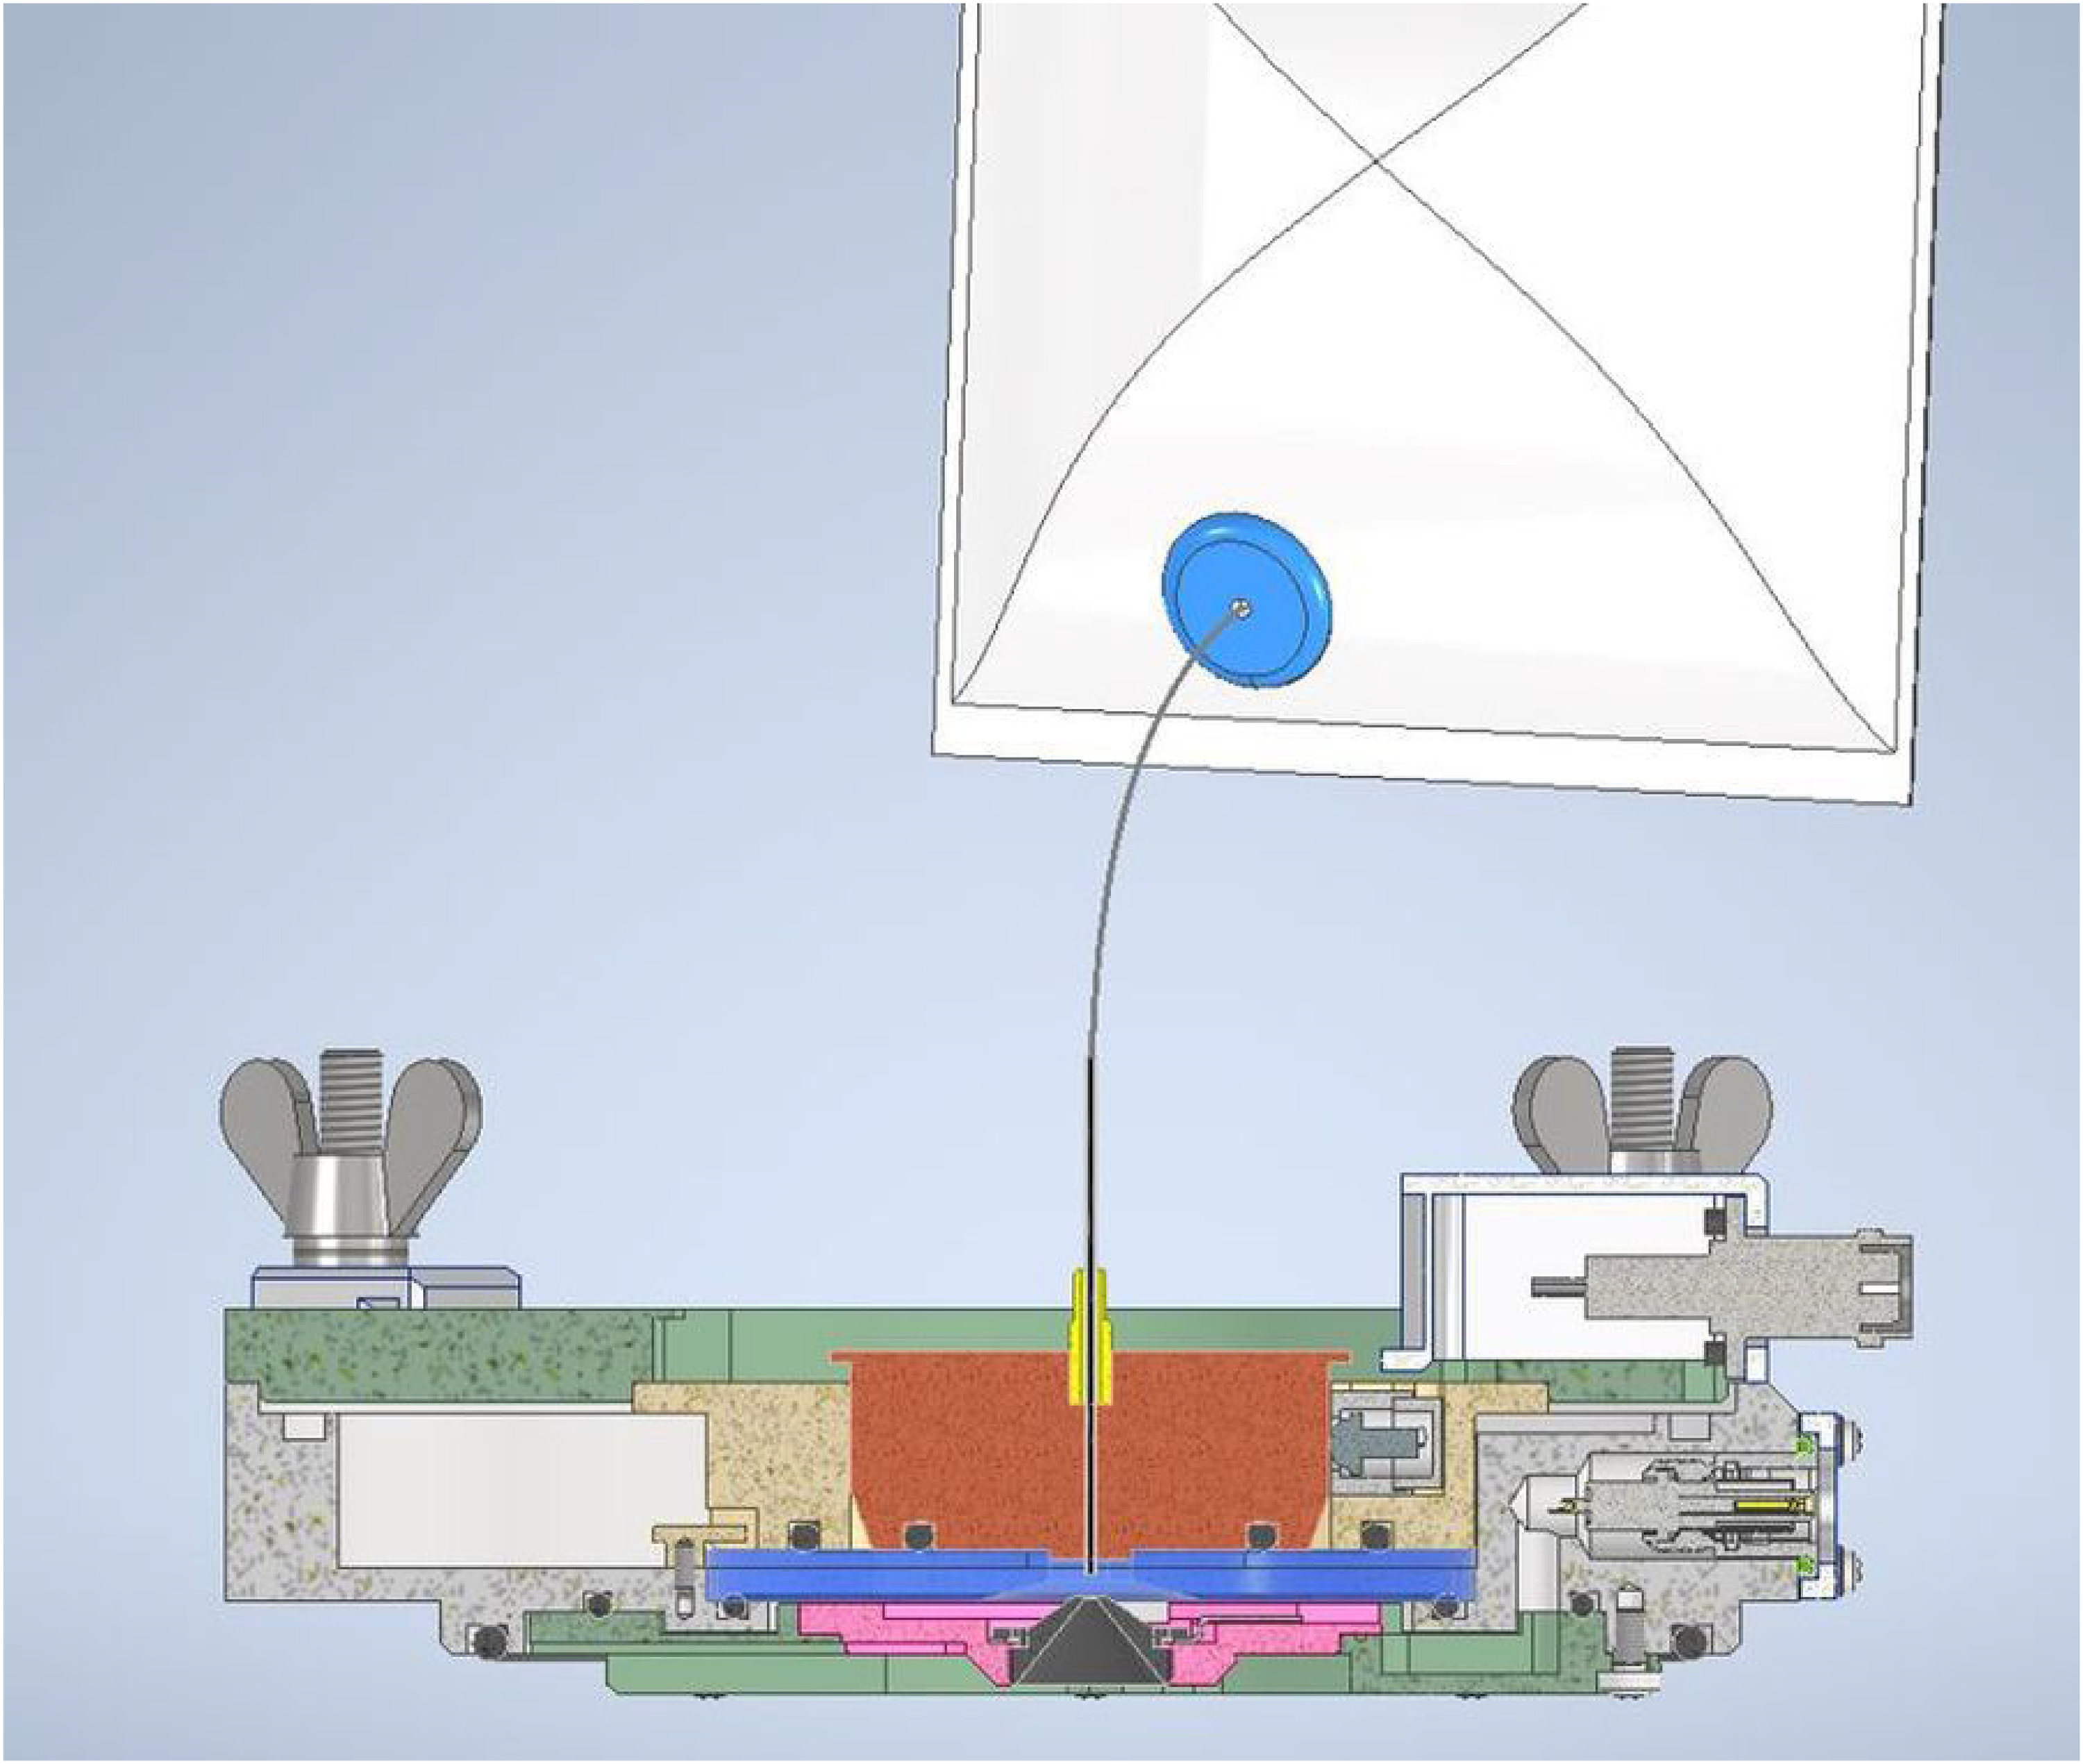
Injection of a gas sample into the discharge cell.
As noted above, in addition to the soft Penning ionization, the PGD allows to use other ionization mechanism, including the ACT. In this case, the sensitivities for various compounds may be appreciably different. This difference is the most obvious for compounds whose ionization energies are close to the ionization energy of NO, in particular, for toluene and benzene chloride. It should be noted that the role of NO in the processes of VOCs ionization with PGD in air is twofold. Due to the process of ACT, the NO+ ions can significantly increase the intensity of some compounds. The concentration of metastable nitrogen molecules (N2*) can be depressed due to the reaction of Equation (8). As a result, depress the intensities of VOCs, for which PI is the main ionization mechanism.
11

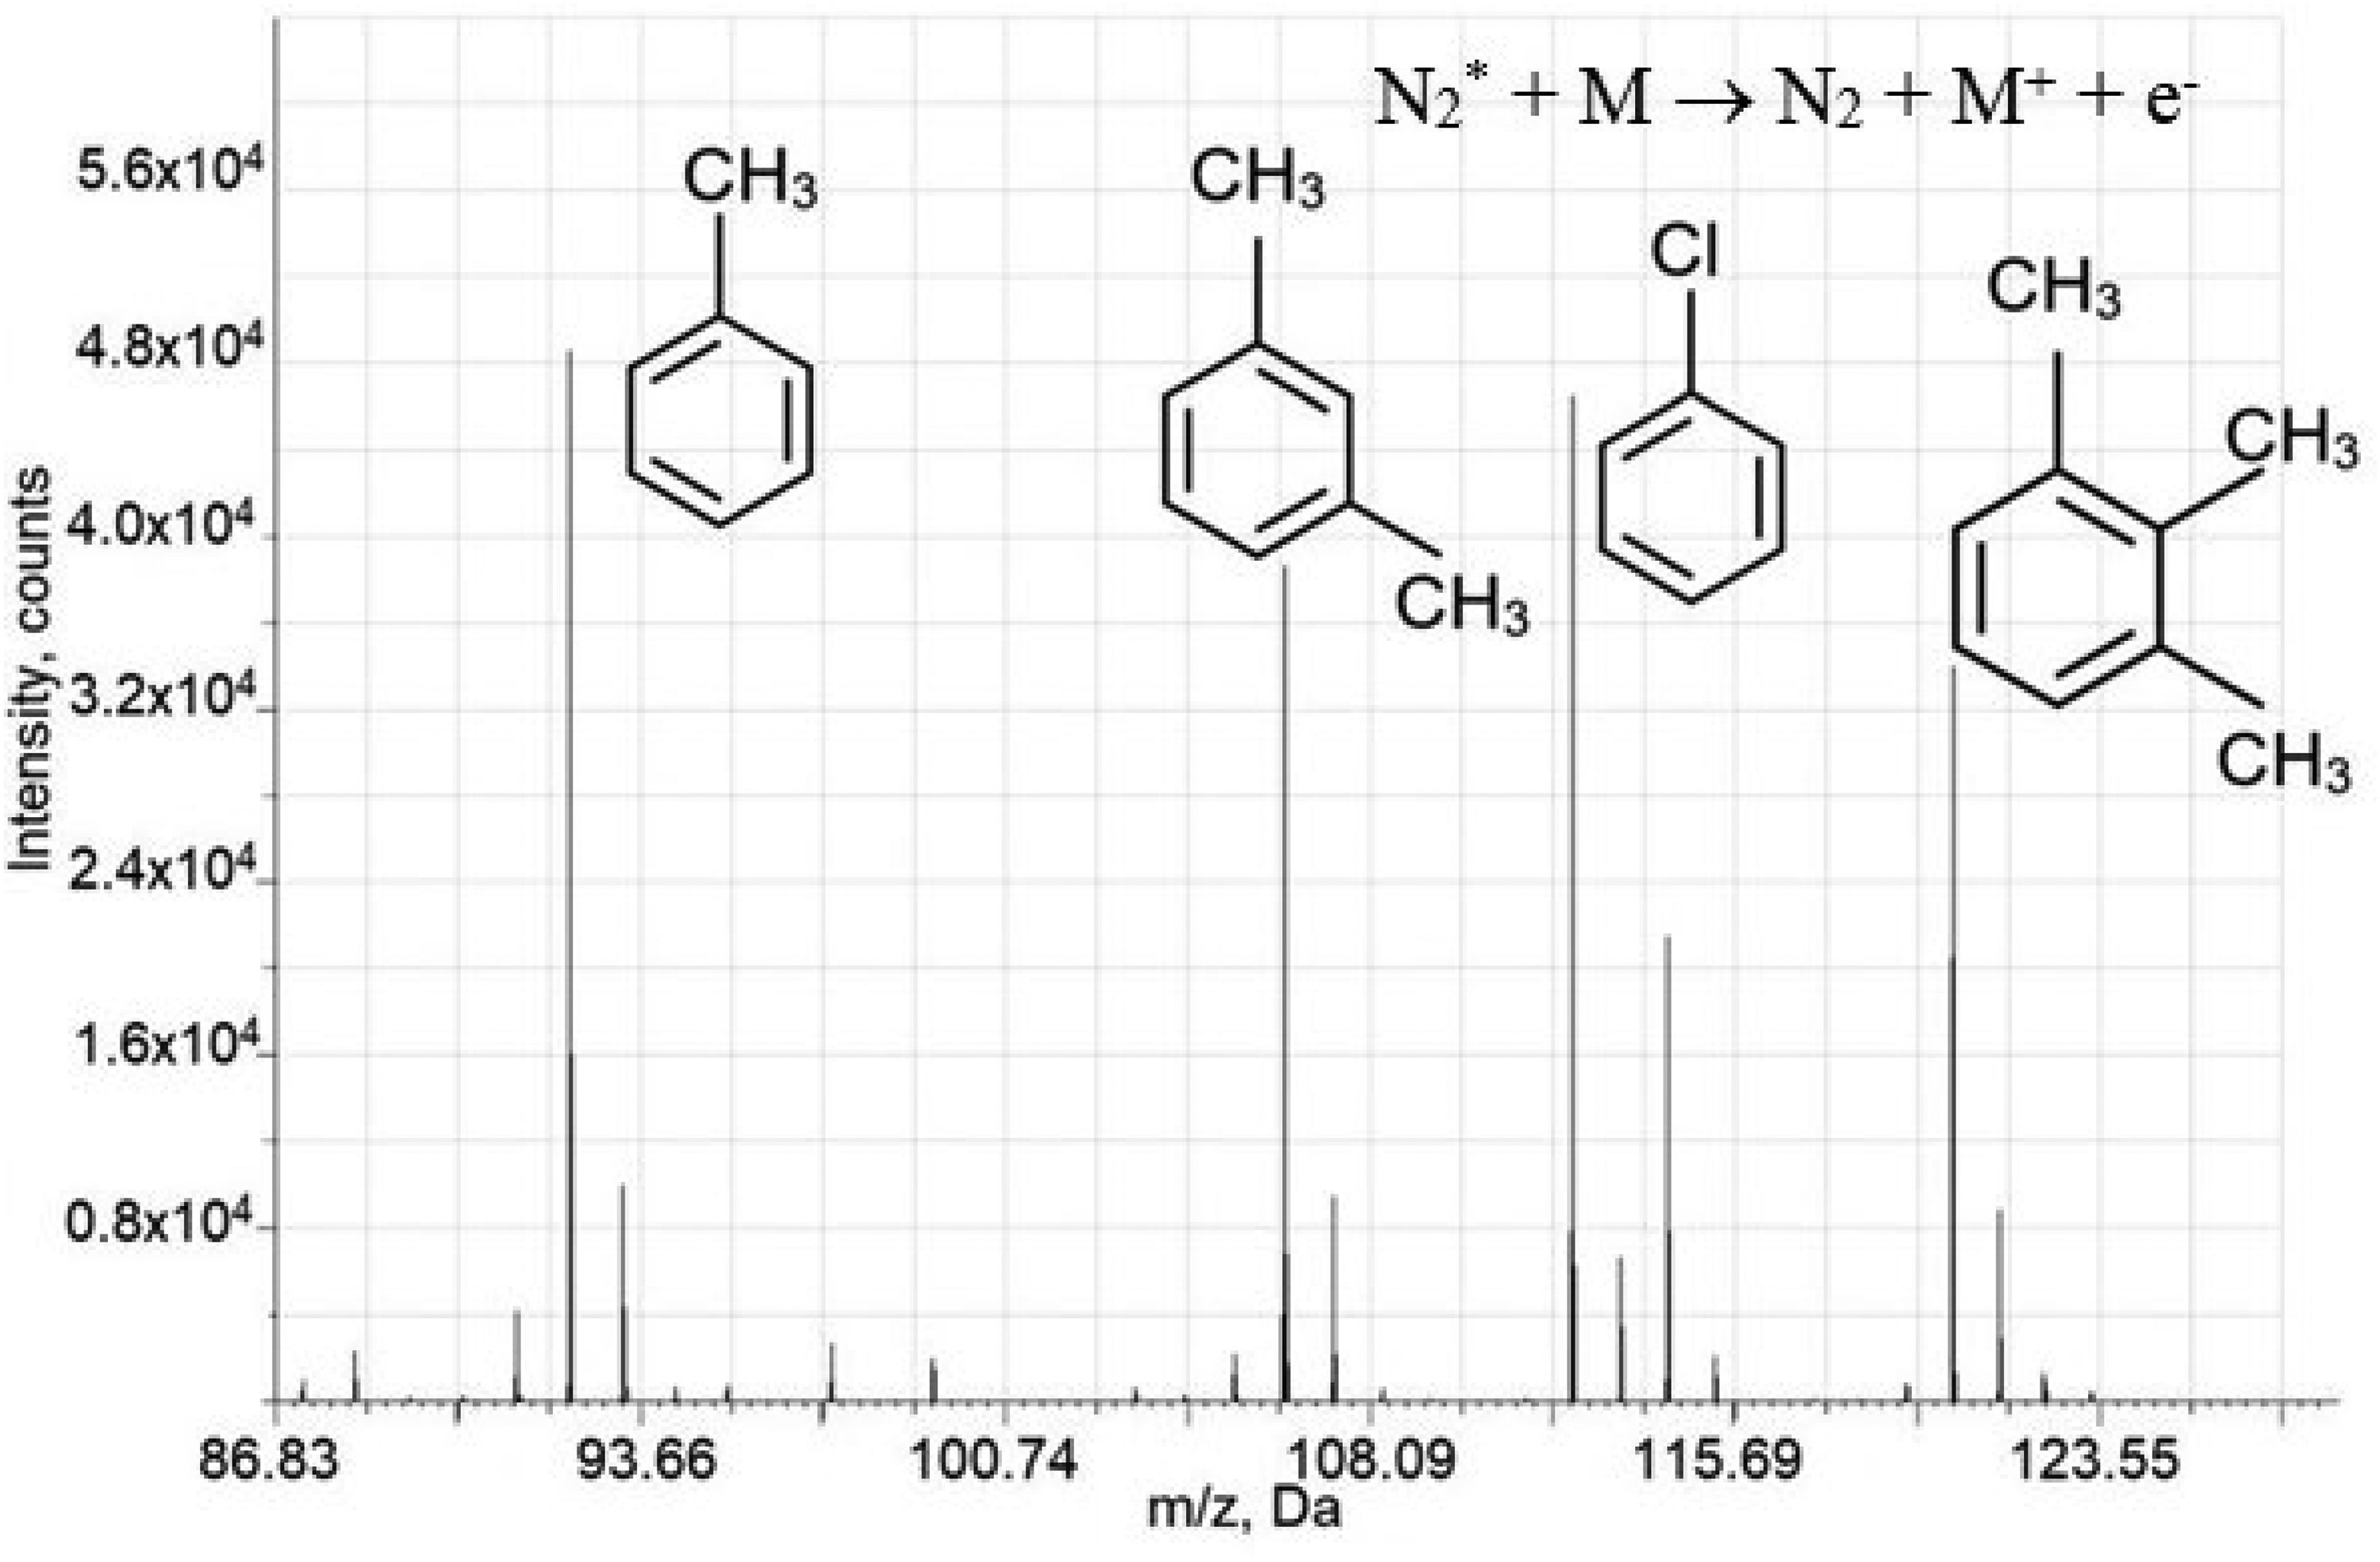
Pi with molecular nitrogen is shown (this produced molecular ions). Mass spectrum in the range of 86–130 Da for 4 VOCs (toluene, chlorobenzene, m-xylene, and 12,3-trimethylbenzene) obtained using a flat copper cathode. Acquisition parameters are as follows: repelling pulse delay time – 200 µs, pulse duration – 2 µs, pulse period – 1000 µs, discharge pressure – 213 Pa; the concentration of all VOCs is 15 ppm.
However, within this range, it is possible to satisfy contradictory requirements: a high efficiency of VOCs ionization and a low rate of sputtering and ionization of the cathode material at a low level of fragmentation of molecular ions, which in our case are target analytes.
PGD plasma ionization provides appreciably weaker fragmentation of VOCs compared to the electron impact ionization. The peak of their molecular/pseudo-molecular ions have low intensity or is absent with the EI, for most of VOCs (Figure 9). However, this peak is often the dominant one with the PGD ionization. For example, when ethyl benzene is ionized, only the peaks of the molecular ion, protonated ion, and [M-CH3 ]+ ion are present in the spectrum (see Figure S6). Likewise, for methylene chloride, the peaks associated with pseudo-molecular ions are the most intense (see Figure S7).
A choice of discharge gas also effects on the level of fragmentation. Argon is usually used for the Penning ionization of VOCs. 6 The energies of its two metastable levels are 11.57 eV and 11.72 eV, respectively. However, the ambient air can be used to analyze VOCs as well. In this case, nitrogen molecule with the metastable level energy of 11.1 eV acts as the discharge gas. At the same time, as binding energies of various groups of VOCs are within the range of 10.5–11.5 eV, so the level of fragmentation when using the ambient air is lower than that in case of argon-air mixture. For example, when the ambient air is used as the discharge gas, it allows appreciably increasing the relative intensity of the [CCl3]+ ions in the analysis of CCl4. However, the molecular ion is not retained in the spectrum (see Figure S8).
As already mentioned in the introduction, one of the special characteristics of ionization with GD is the formation of various associates of molecules. As it has been shown in case of mixture analysis with the use of a hollow copper cathode, the formation of the CuM+ associates can take place—see Equation (9). Note that for the realization of the process the average discharge power will be significantly increased. These processes are effectively realized under the following conditions: discharge pulse duration, pulse repetition frequency, and pressure are 3–4 µs, 3–4 kHz, and more than 250 Pa, respectively. The formation of analytes associated with gas macro-components can also take place. For example, the associates of the [M+NO]+ type and the [M+H2O]+ type are formed in the course of ionization of acids and their esters; and associates of the [M+N2]+ type are formed in the analysis of alcohols. 10
Formation of associates, on one hand, allows to relocate the molecular ion peak into the region of large masses that reduces the number of interferences; on the other hand, it leads to the appearance of interfering peaks in case of multi-component mixtures, which is described in detail in the work.61
Determination of inorganic gases
One of the special characteristics of the Lumas-30 and Lumas PGD-301 mass spectrometers are the capability to vary the repelling pulse delay time. This variation provides to determine of both inorganic compounds with high ionization energy (delay time is 2–50 µs)—Ar, Xe, CO2, etc., and VOCs (delay time is more than 100 µs) while keeping the relatively low fragmentation level for them (Figures S9–S11).
As mentioned above, the ionization with PGD can be realized through several mechanisms. The Penning ionization process is characterized by a low ionization energy. This high enough for VOCs analysis with a minimal fragmentation of molecules. However, the energies of metastable atoms of argon (11.57 eV and 11.72 eV) or nitrogen molecules (11.1 eV) are not enough to ionize many inorganic gases, such as SO2, CO2, CO, rare gases, etc., which can be easily ionized by high-energy electrons (Figure 10(a) and (b)). For performing analysis of these compounds, it is required to set the repelling pulse delay time to about 2–50 µs. For example in Figure 10(a) and (b), the dependencies of Ar/CO2 and Xe intensities from repelling pulse delay time and m/z in the air are demonstrated. As you can see on Figure 10(a), the most effective ionization of these components occurs at short repelling pulse delay time—20 µs, whereas the optimal repelling pulse delay time for Xe is 39 μs (Figure 10(b)).
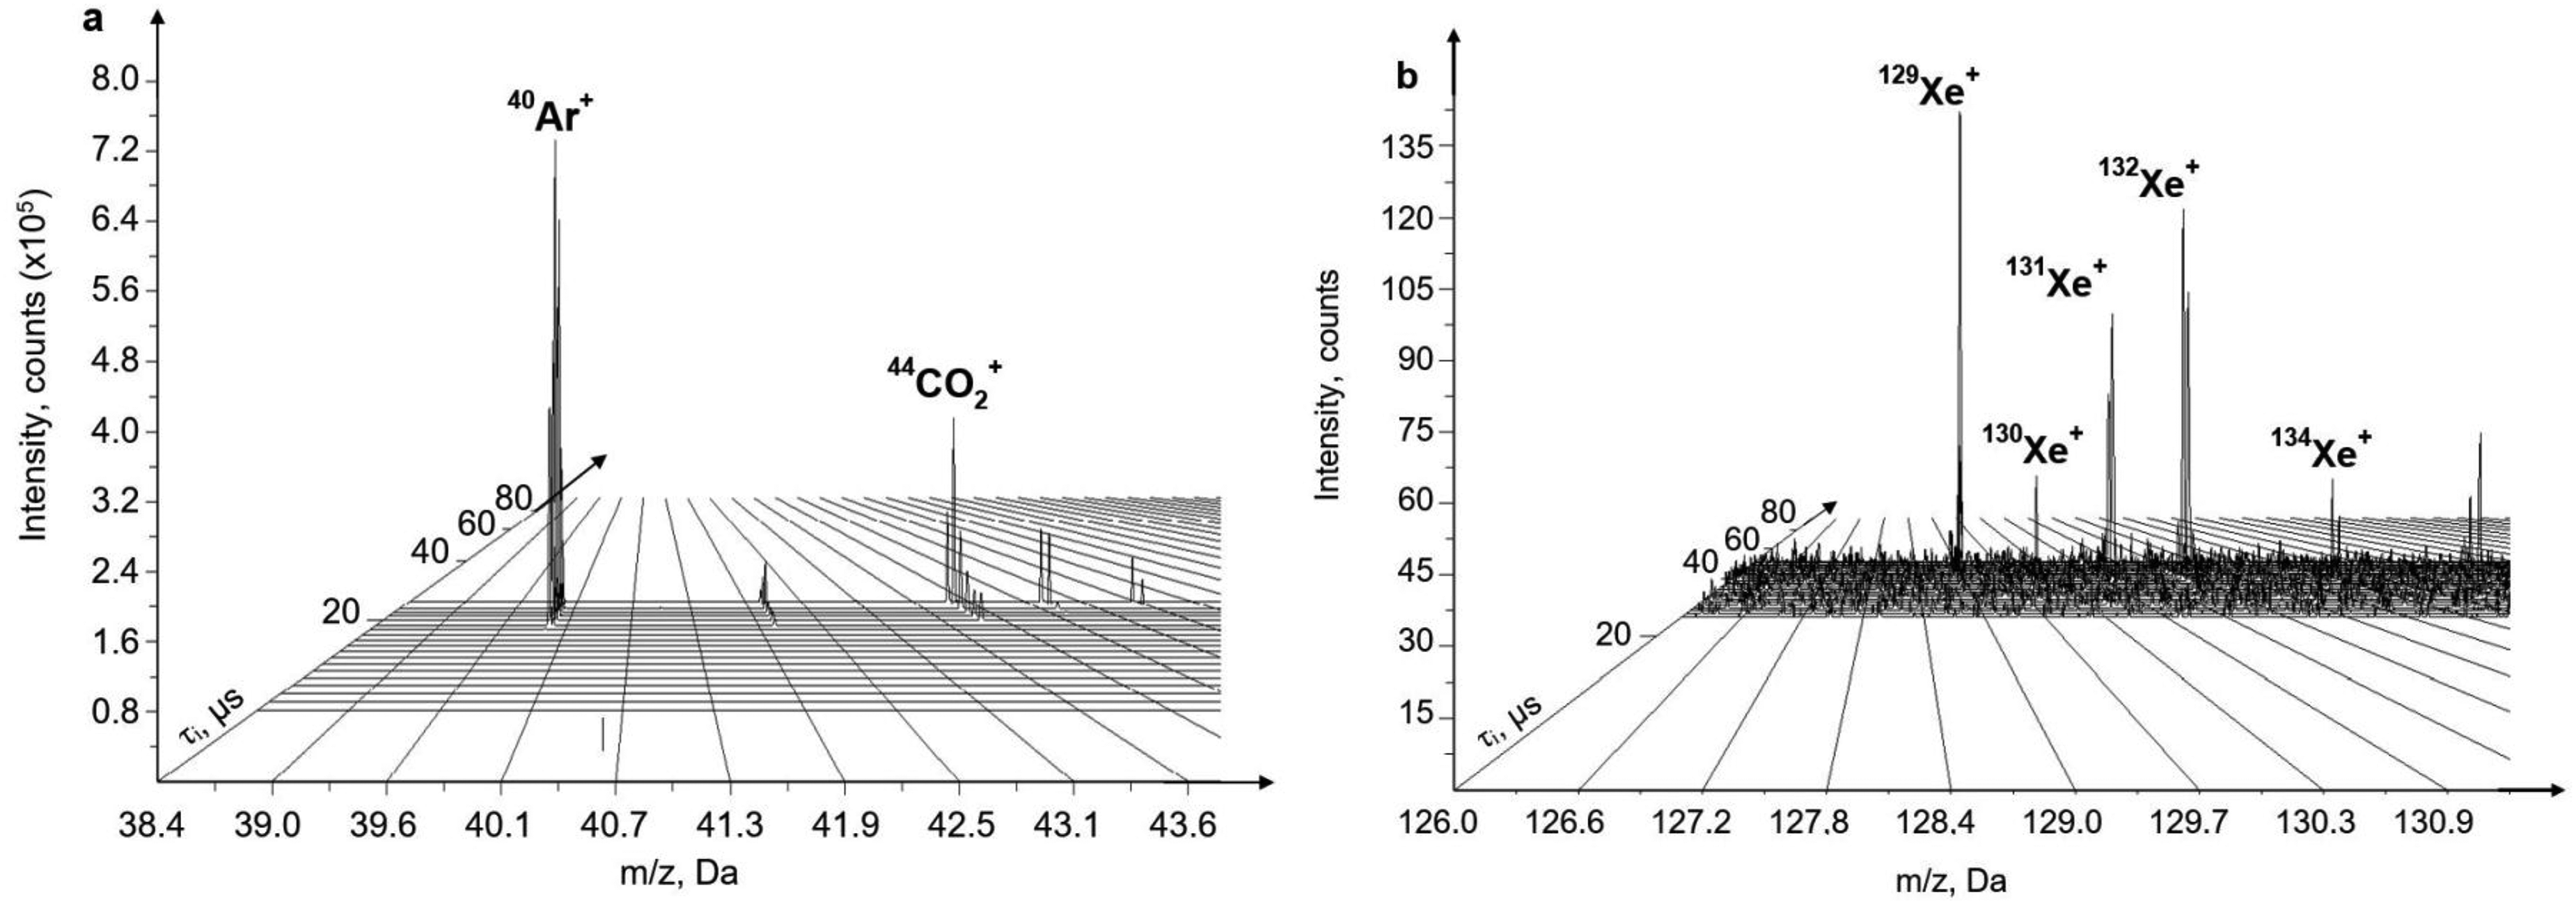
3D mass-spectra of laboratory air as dependencies of intensity from repelling pulse delay time and m/z: a – Ar (CAr = 1.292 mass. %) and CO2 (CCO2 = 460 ppm) in m/z range 38–46 Da, b – Xe isotopes (CXe = 85 ppb) in the m/z range 126–136. Acquisition parameters are as follows: pulse duration – 3 µs, pulse period – 500 µs, discharge pressure – 76 Pa.
Determination of He content in deuterium
One of the essential analytical tasks is detecting and identifying elements and compounds of light masses in the range of 1–6 m/z. In particular, the determination of helium in deuterium is a good example.
Ionization of atoms and molecules by high-energy electrons (with the energies of about 100 eV, pulse duration of 0.1–0.5 µs and the extraction pulse delay time of 6 µs) that appear at the leading edge of the discharge pulse enables effective ionization of molecular deuterium and atomic helium.
The following ions are present in the mass spectrum during deuterium ionization with PGD (Table 7).
Deuterium ionization with PGD.
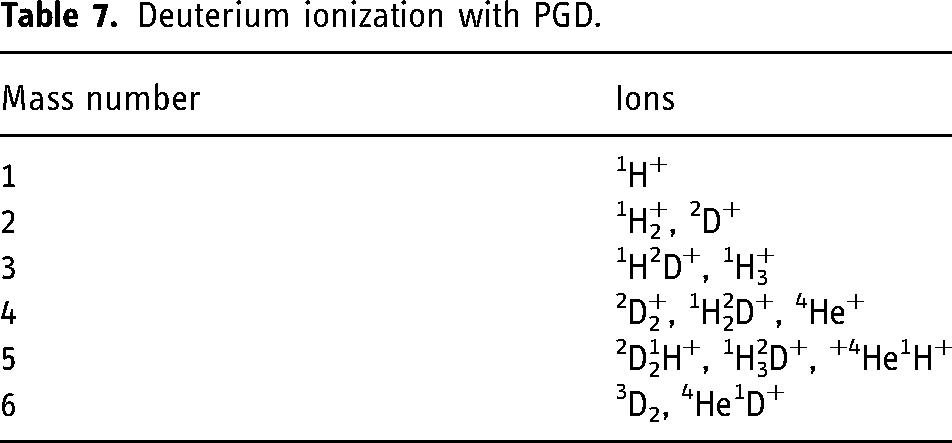
Hydrogen is an impurity gas. The presence of its components in the mass spectrum is associated with the presence of water residues in the gas. As a rule, the intensities of hydrogen components are small and can be ignored. 2D2+ intensity>>2D3 intensity>>4He1D+ intensity. In this respect, the helium content must be determined by the mass number 4. In this case, the mass spectrometer resolution of about 300 is required. The Lumas PGD-301 mass spectrometer for the mass number 4 has the resolving power of 1500, which is sufficient for efficient separation of the 2D2+ and 4He+ components.
The experiment for determination of helium content in deuterium caried out at the Lumas PGD-301 mass spectrometer. The Lumas PGD-301 operating parameters were as follows: discharge pulse duration, and the repelling pulse delay time are 1.5 µs and 6 µs, respectively. Helium was added to deuterium through the piezoelectric leak valve. The acquired mass spectra are shown in Figure 11. As can be seen from these figures, helium is well separated from molecular deuterium.
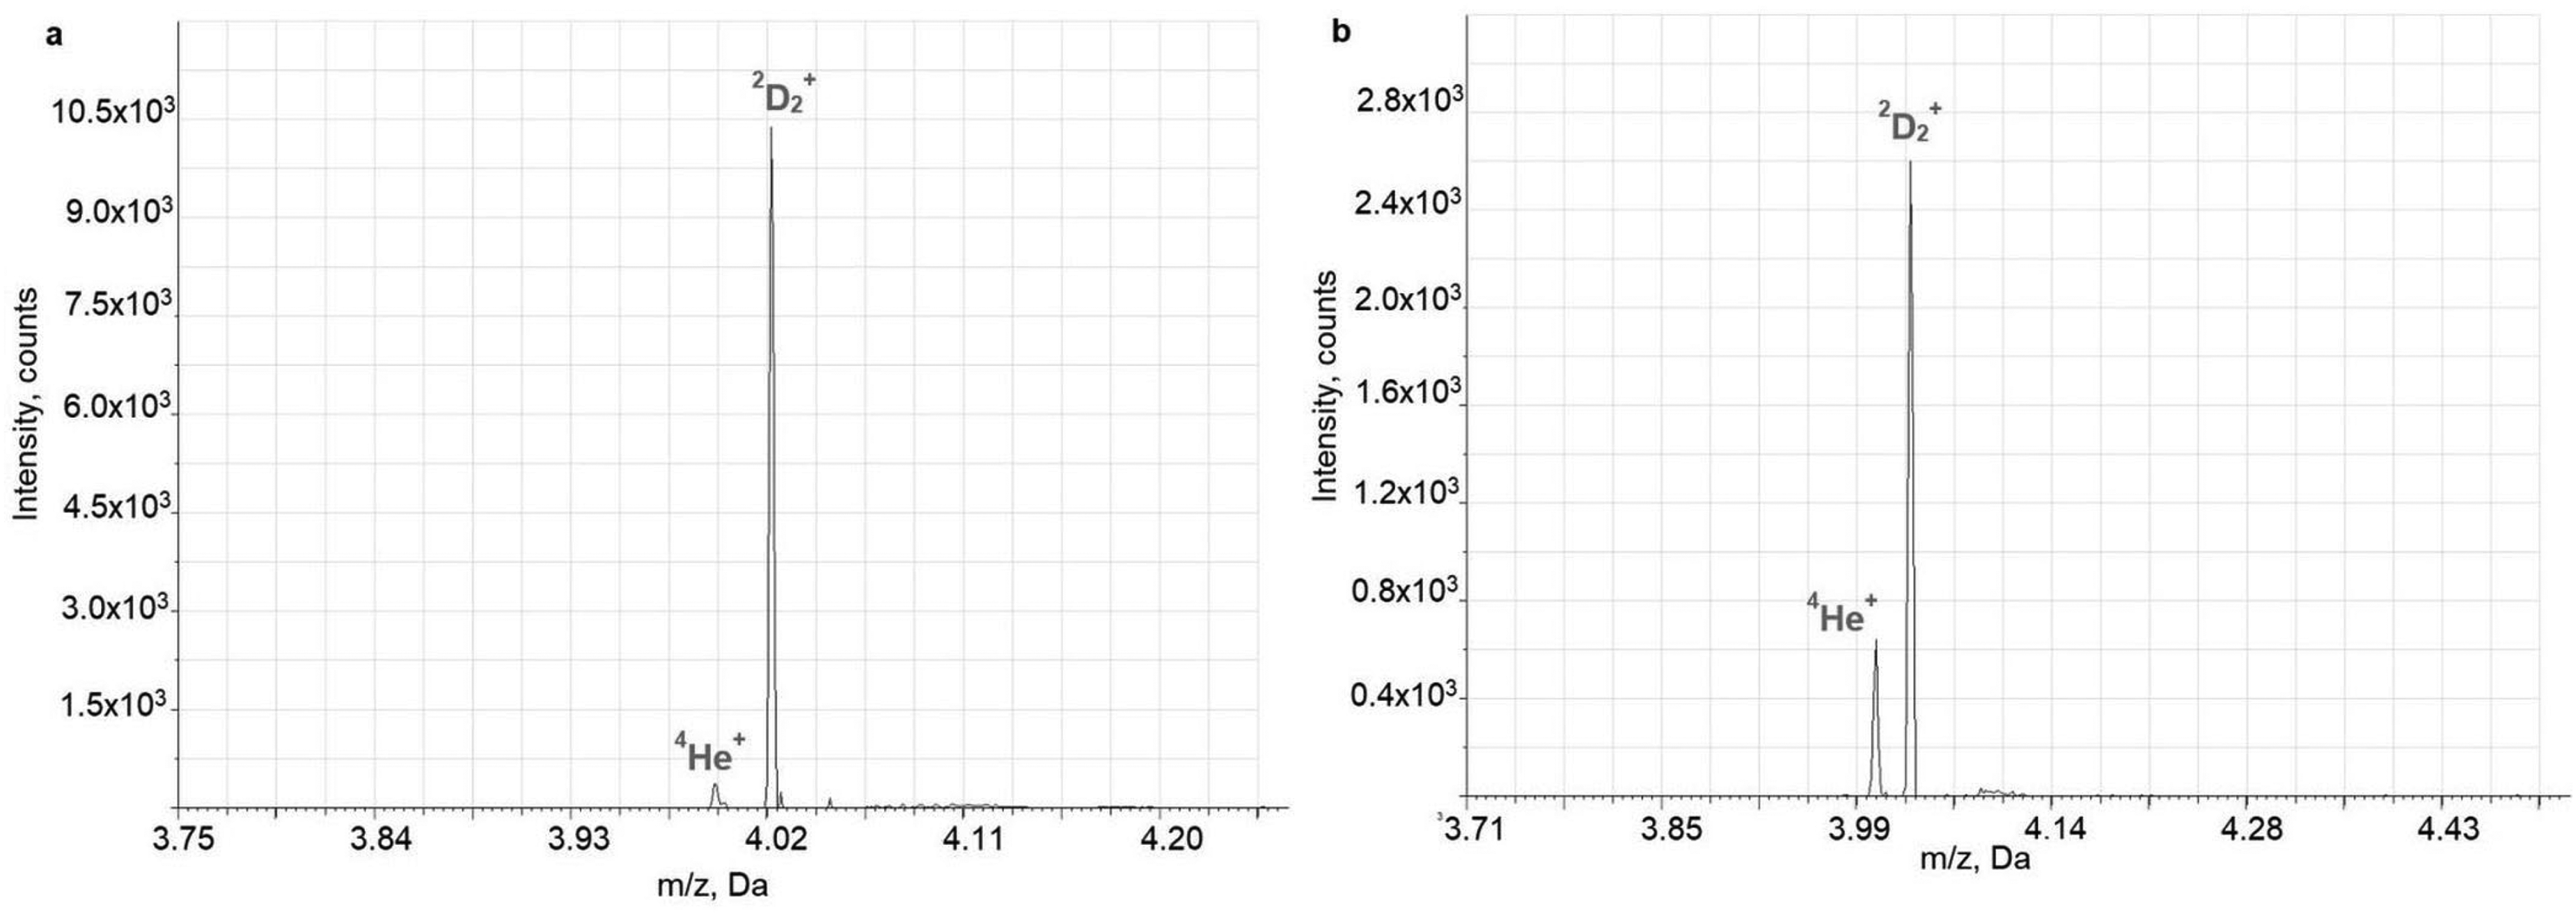
Determination of He concentration in deuterium. CHe∼1.5% – a; CHe ∼ 10% – b. Acquisition parameters are as follows: repelling pulse delay time – 6 µs, pulse duration – 1.5 µs, pulse period – 400 µs, discharge pressure – 213 Pa.
Conclusion
As we show in this research work, time-of-flight mass spectrometry with the PGD is a highly efficient analytical tool. Variety of ionization mechanisms enables determination of both inorganic and organic components either in gases or in solids (such as metals, alloys, semiconductors, and dielectrics). Combination of the PGD ionization with the high-resolution mass spectrometer increases mass accuracy and eliminates most of interferences.
In our opinion, despite the significant progress in the field of PGD mass spectrometry achieved over the past ten years, this technique still has high potential for further development. Let us note some further areas for technique improvement: using pulsed radio frequency discharge (for more effective sputtering of dielectric samples); introducing additional pumping of the discharge cell to detect a very weak component against a strong one. As well, PGD is promising as an ionization source for a wide range of organic compounds not only for direct method, as was shown above, but also for hybrid ones, for example GC-GD-TOFMS, GC-EI-GD-TOFMS.
Highlights
Development and achievements in the pulsed glow discharge mass spectrometry are presented Non-conductive samples preparation methods for its efficient sputtering with a glow discharge are systematized. Light elements detection is discussed. An effective ionization of inorganic compounds in air is shown. Ionization mechanisms of VOCs are investigated.
Supplemental Material
sj-docx-1-ems-10.1177_14690667251328836 - Supplemental material for Time-of-flight mass spectrometry with a pulsed glow discharge—A versatile tool in modern analytical chemistry: From elemental and isotopic analysis of solids to determination of VOCs and inorganic compounds in ambient air
Supplemental material, sj-docx-1-ems-10.1177_14690667251328836 for Time-of-flight mass spectrometry with a pulsed glow discharge—A versatile tool in modern analytical chemistry: From elemental and isotopic analysis of solids to determination of VOCs and inorganic compounds in ambient air by Alexander Ganeev, Victoria Chuchina, Anna Gubal, Denis Kravtsov, Evgenia Iakovleva, Mikhail Yavor, Alexander Berdnikov, Alexander Frolov, Mika Sillanpää, Qing Ye, Jin Han, Marat Myradimov and Alexander Stroganov in European Journal of Mass Spectrometry
Footnotes
Abbreviations
Declaration of conflicting interests
The authors declared no potential conflicts of interest with respect to the research, authorship, and/or publication of this article.
Funding
The authors received no financial support for the research, authorship, and/or publication of this article.
Supplemental material
Supplemental material for this article is available online.
References
Supplementary Material
Please find the following supplemental material available below.
For Open Access articles published under a Creative Commons License, all supplemental material carries the same license as the article it is associated with.
For non-Open Access articles published, all supplemental material carries a non-exclusive license, and permission requests for re-use of supplemental material or any part of supplemental material shall be sent directly to the copyright owner as specified in the copyright notice associated with the article.