
Abstract
A high-performance liquid chromatography-tandem mass spectrometry method has been developed for the quantification of ertugliflozin in human plasma, employing ertugliflozin D5 as the internal standard. Methyl tertiary butyl ether-based liquid-liquid extraction technique was employed, followed by chromatographic separation on Kromasil-C18 (100 × 4.6 mm, 5 µm) column using a mixture of methanol and 10 mM ammonium formate buffer (80:20, v/v) as the mobile phase at a flow rate of 1 mL/min. The mass transitions were observed from m/z 437.4 to 329.2 for ertugliflozin and from m/z 442.2 to 334.3 for ertugliflozin D5 by multiple reaction monitoring in a positive ion electro spray ionization source. The linearity was established in the concentration range of 1–500 ng/mL, with the correlation coefficient, r2
Keywords
Introduction
Ertugliflozin (EFZ) is a potent and highly selective drug used to treat patients with type 2 diabetes mellitus.1,2 Being the sodium-glucose transporter 2 (SGLT 2) inhibitor, it reduces the reabsorption of glucose by the renal proximal tubule and thereby reduces the blood glucose levels without inducing excess insulin secretion.3,4 EFZ is completely absorbed following the oral route of administration with 100% bioavailability. 5 It undergoes metabolism mainly through the glucuronidation pathway, and its excretion in unchanged form is negligible.5,6
As per the available literature, bioanalytical methods employing liquid chromatography-tandem mass spectrometry/mass spectrometry (LC-MS/MS) technique were applied to estimate EFZ individually2,4,7 or in combination with other drugs8–10 or metabolites 11 in animals2,7–10 and/or humans.4,11 However, the methods for the analysis of EFZ in animals are useful only for preclinical studies. The method reported by Kalgutkar et al. 7 to quantify EFZ in humans did not mention the procedure used for the extraction of the analyte from the plasma samples. Sahasrabudhe et al. 11 reported the method for simultaneous estimation of EFZ along with its two metabolites in human plasma, using the protein precipitation technique. Vikas et al. 4 studied the effect of rifampin on the pharmacokinetics (PK) of EFZ in healthy volunteers. It applied the LC-MS/MS technique to quantify EFZ in human plasma, using the protein precipitation technique. However, neither of these methods did not clearly described the sample extraction procedure. Moreover, protein precipitation may cause the phospholipids to accumulate on the column, which may be eluted in an unpredictable manner in subsequent analyses. 12
The present method describes the LC-MS/MS technique to quantify EFZ in human plasma, using the liquid-liquid extraction technique for the sample processing with a total run time of 3.0 min.
Materials and methods
Chemicals and reagents
Reference standards of EFZ and ertugliflozin D5 (EFZ-D5) were procured from Vivan Life Sciences Pvt. Ltd (Mumbai, India). HPLC grade methanol and water were acquired from RCI Labscan Ltd (Bangkok, Thailand). Analytical grade formic acid, ammonium formate, ammonium acetate, and methyl tertiary butyl ether (MTBE) were purchased from Merck Ltd (Mumbai, India). Analytical grade dimethylsulfoxide (DMSO) was supplied by Rankem (Gurugram, India). The control K2EDTA human plasma was procured from Deccan's Pathological Labs (Hyderabad, India).
Instruments and conditions
A Shimadzu LC-20AD liquid chromatography system was used for the analytical work. Separation was attained by a Kromasil-C18, 100 × 4.6 mm, 5 µm column at room temperature. A mixture of methanol and 10 mM ammonium formate (pH 6.5 ± 0.1) buffer (80:20, v/v) was used as the mobile phase at a flow rate of 1 mL/min. The injection volume was 20 µL.
Mass spectrometric detection was done by AB Sciex API 4500 triple quadrupole mass spectrometer (Foster City, CA, USA) with a Turboion SprayTM interface in positive ion mode. Multiple reaction monitoring (MRM) mode was used for quantifying EFZ and EFZ-D5 using the transition from precursor ion to product ion from m/z 437.4 to 329.2 and from m/z 442.2 to 334.3, respectively (Figure 1). All the data acquisition and the system control were done with Analyst Software Version 1.7.2.
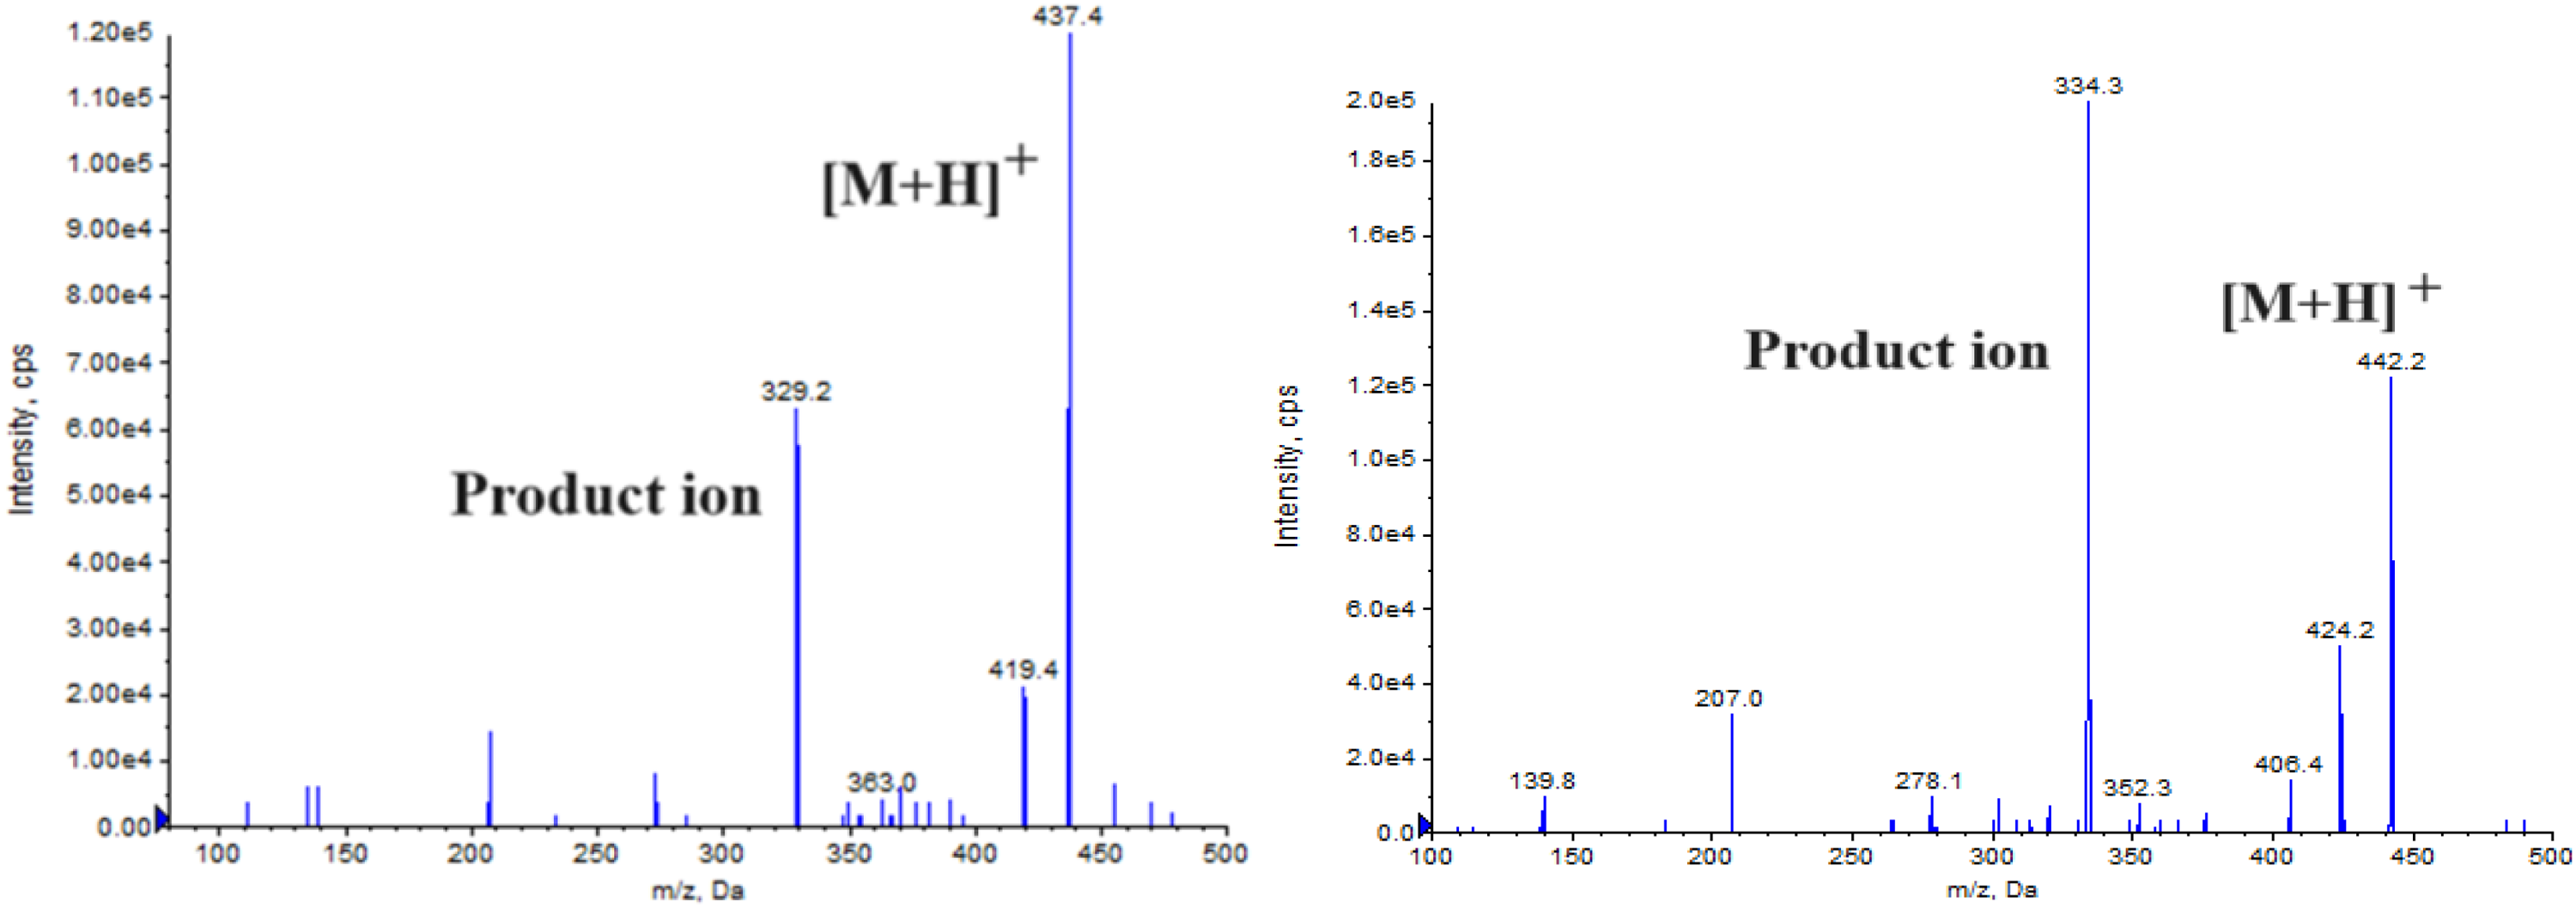
Product ion mass spectra of EFZ (left panel) and EFZ-D5 (right panel).
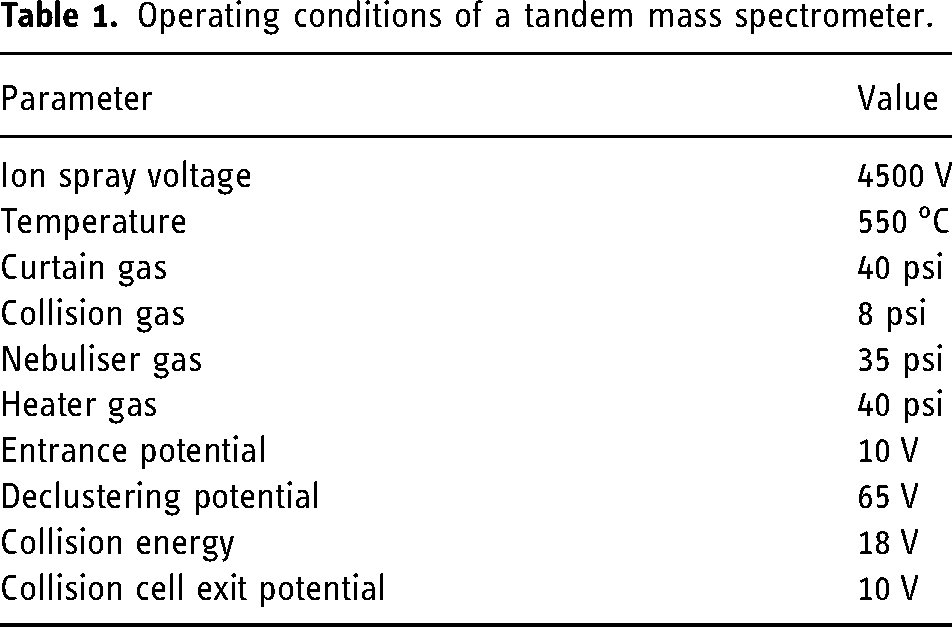
The source and compound dependent parameters maintained were summarized in Table 1. Unit resolution was maintained for both the quadrupoles 1 and 3, and the dwell time was 200 ms.
Operating conditions of a tandem mass spectrometer.
Preparation of calibration curve standards and quality control (QC) samples
Stock solutions of EFZ and EFZ-D5 (1 mg/mL) were prepared in DMSO. The stock solutions were further diluted separately using the diluent (mixture of methanol and water, 60:40, v/v) to prepare the working standard solutions of both EFZ and EFZ-D5 (500 ng/mL).
Working standard solutions of 50 µL were spiked into 950 µL of K2EDTA human plasma to prepare the calibration curve (CC) standards and the QC samples. The final concentrations of CC were 1.01, 2.02, 5.45, 14.58, 38.36, 100.94, 201.87, 301.30, 401.73, and 502.17 ng/mL and of the QC were 1.02 (lower limit of quantitation quality control, LLOQ QC), 2.87 (low quality control, LQC), 52.17 (medium quality control 1, MQC1), 235.00 (MQC2) and 391.66 ng/mL (high quality control, HQC). All the above prepared solutions were stored at −70 ± 10 °C until the analysis.
Sample preparation
Samples were extracted by the liquid-liquid extraction method. An internal standard (IS) working solution of 50 µL and 5 mM ammonium acetate buffer was added to a 200 µL plasma sample and vortexed. Then, 2.5 mL of MTBE was added, vortexed, and centrifuged at 4000 r/min for 5 min at 4 °C. The supernatant was collected, evaporated to dryness at 35 °C using nitrogen gas, and then reconstitution was done with 0.4 mL of the mobile phase. An injection of 20 µL was done into the instrument.
Validation of the method
The developed method was validated as per USFDA guidelines. 13
Selectivity was evaluated by injecting 10 lots of normal blank plasma and two lots each of hemolyzed and lipemic blank plasma samples. The linearity was assessed in the concentration range of 1–500 ng/mL by plotting the calibration curves of peak area ratios (y-axis) of the analyte to the IS against the concentration of the analyte (x-axis) with a weight factor of 1/x2. The LLOQ QC was considered to be the smallest concentration of CC with S/N > 10, having an accuracy of ± 20% and precision with % CV < 20%.
Matrix effect was evaluated at LQC and HQC levels by comparing the mean area response of post-extraction spiked samples with that of the aqueous samples. Extraction recovery at LQC, MQC2, and HQC levels was calculated by comparison of the mean area response of six sets of pre-extraction spiked samples with that of the aqueous samples.
Intra-day precision and accuracy were evaluated by injecting the six replicates within a single analytical run. Eighteen replicate measurements were done on three different days to assess the inter-day precision and accuracy.
The stability studies evaluated were namely bench top stability, wet extraction stability, re-injection stability, auto-sampler stability, freeze-thaw stability, short-term stability, and long-term stability.
The ruggedness of the method was assessed by the analysis of one precision and accuracy batch by different analysts on different instruments, using chromatographic columns and reagents of the same make but different batch numbers.
PK study design
A PK study of EFZ was performed on six healthy male volunteers according to the principles of the Declaration of Helsinki. The protocol was approved by the Institutional Ethics Committee, Vasavi Medical & Research Center, Vasavi Hospital, Hyderabad, and all the volunteers were given informed consent.
After overnight fasting for at least 10 h, a single oral dose of EFZ 15 mg tablet was administered and a total of 20 two blood samples were collected into K2EDTA vacutainer (5 mL) collection tubes (BD, Franklin, NJ, USA) at pre-dose (0 h) and 0.33, 0.67, 1.00, 1.25, 1.50, 1.75, 2.00, 2.33, 2.67, 3.00, 3.50, 4.00, 5.00, 6.00, 8.00, 10.00, 12.00, 16.00, 24.00, 36.00 and 48 h post-dose.
The plasma was separated by centrifugation at 4000 r/min at 4 °C and was stored at −70 ± 10 °C. The PK parameters were calculated after the analysis of the collected samples, applying the developed method employing the WinNonlin® Software Version 8.3 (Pharsight Corporation, USA) using a non-compartmental model.
An incurred sample reanalysis was also performed using a total of 12 samples, chosen two from each subject, one near the Cmax and the other at the elimination phase.
Results and discussion
Method optimization
The aim of the present work was to develop a specific and sensitive bioanalytical method to estimate EFZ in human plasma, which can be adopted to perform bioavailability and bioequivalence studies in humans. The LC-MS/MS technique was chosen because it has the ability to distinguish structurally similar compounds, reduce the impact of biological matrix, and perform high-throughput analysis with greater specificity.14–22
Trials have been carried out to attain the best chromatographic conditions with different C18, C8, and phenyl columns, and the mobile phase composed of methanol, acetonitrile in different ratios, along with the buffer solutions. Satisfactory separation was achieved on Kromasil-C18, 100 × 4.6 mm, 5 µm column with the mobile phase composed of methanol and 10 mM ammonium formate buffer (80:20, v/v) at a flow rate of 1 mL/min.
Tandem mass spectrometry conditions were optimized to obtain the detector sensitivity and the signal stability during the infusion of the eluents into the electrospray ion source. It was evaluated in both positive and negative modes, and the positive mode was selected due to its higher response.
The analyte, being lipophilic, was extracted by the liquid-liquid extraction technique. Organic solvents like diethyl ether, ethyl acetate, and MTBE were tried, and the recovery was reproducible with MTBE. The extraction efficiency was further improved by adding 5 mM ammonium acetate in water (w/v).
Selectivity
The selectivity of the method was determined on the blank plasma, plasma spiked with EFZ. The chromatograms showed no significant interference from the endogenous components at the retention time of EFZ and IS, that is, 1.66 min (Figure 2(a) and (b)).
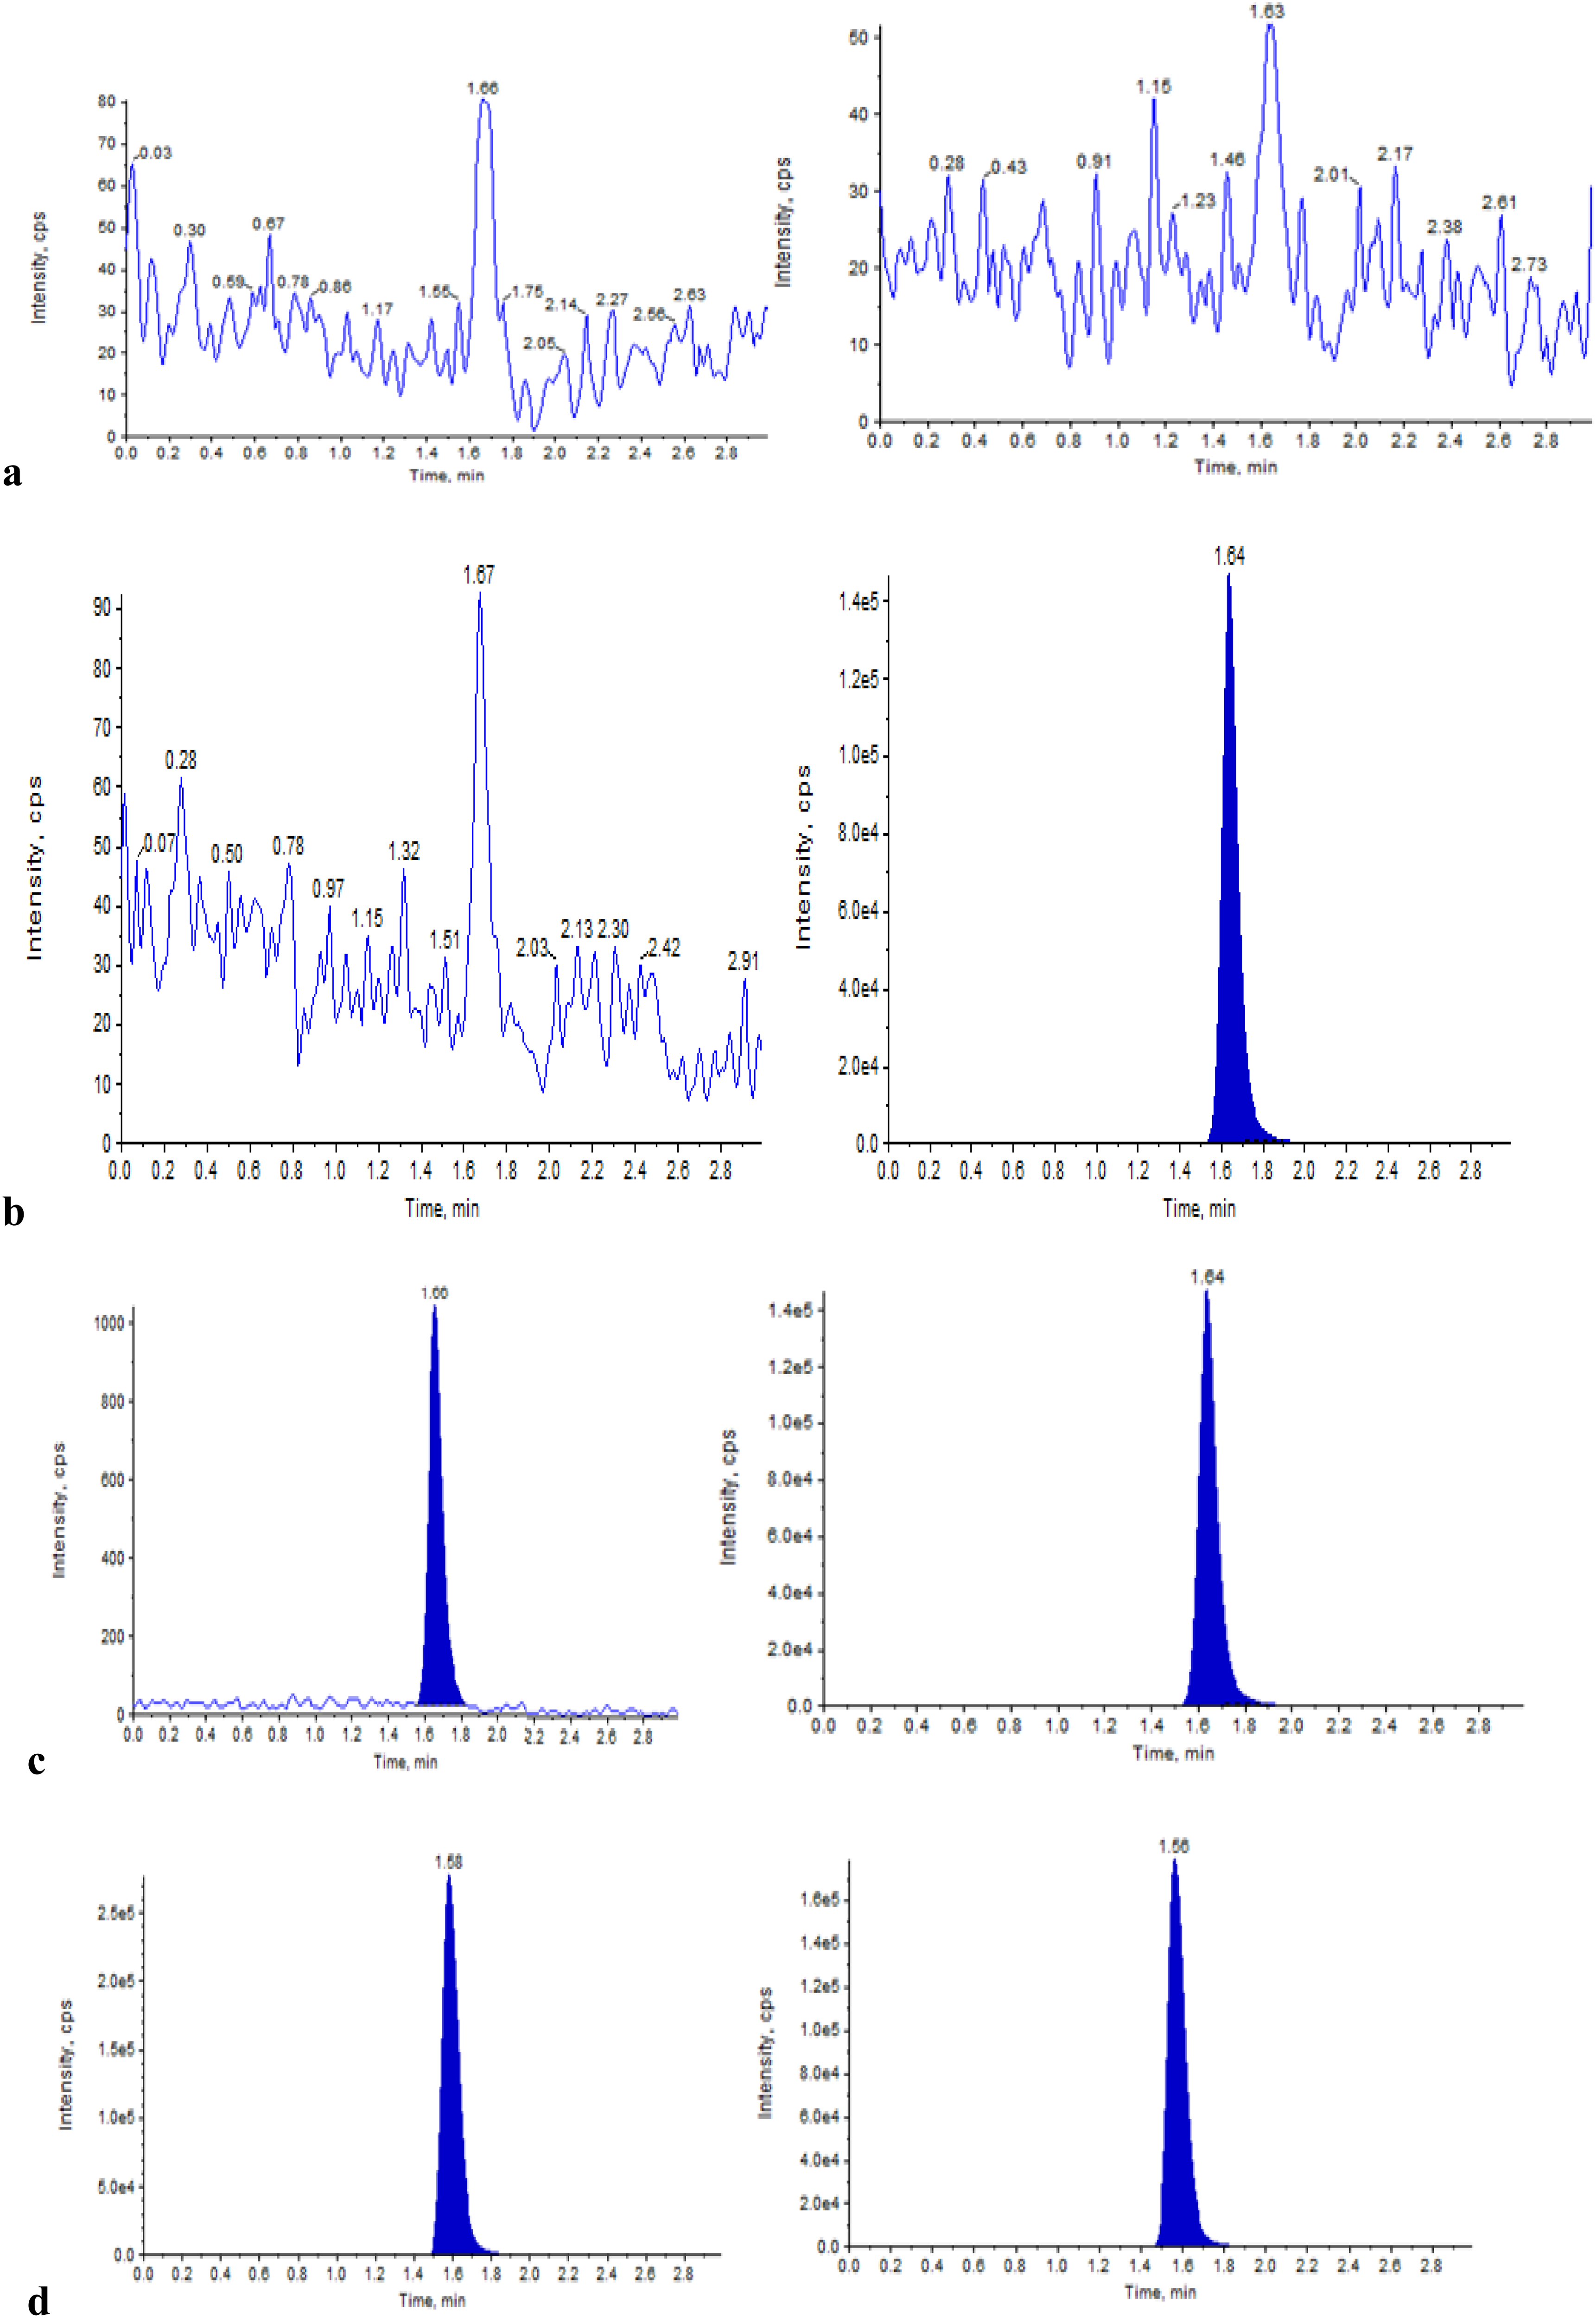
Typical MRM chromatograms of EFZ (left panel) and EFZ-D5 (right panel) in (a) double blank plasma, (b) blank plasma spiked with IS, (c) LLOQ QC sample, and (d) real subject sample after 2.0 h of administration of a 15 mg dose of EFZ.
Linearity and sensitivity
In the present study, the following is the equation obtained for the calibration graph: y = 0.00675x + 0.000488, r2 = 0.9996. EFZ with the signal-to-noise ratio of ≥ 10 demonstrated the sensitivity at the LLOQ QC concentration of 1 ng/mL (Figure 2(c)).
Matrix effect and extraction efficiency
No significant matrix effect was observed when the evaluation was done on several lots of plasma samples collected from different sources, including ten lots of normal plasma, two lots each of lipemic and hemolyzed plasma. The IS normalized matrix factor values were found to be 1.02 and 1.01, respectively, at LQC and HQC levels, with % CV of 2.09% and 0.97%.
Reproducible recovery of EFZ and EFZ-D5 was obtained using the optimized LLE technique. The % recovery at LQC, MQC2, and HQC levels was 79.67%, 81.96%, and 81.27%, respectively, with a mean % recovery of 80.97%. The % recovery for IS was found to be 81.44%. The results are shown in Table 2.
Recovery and matrix effect data.
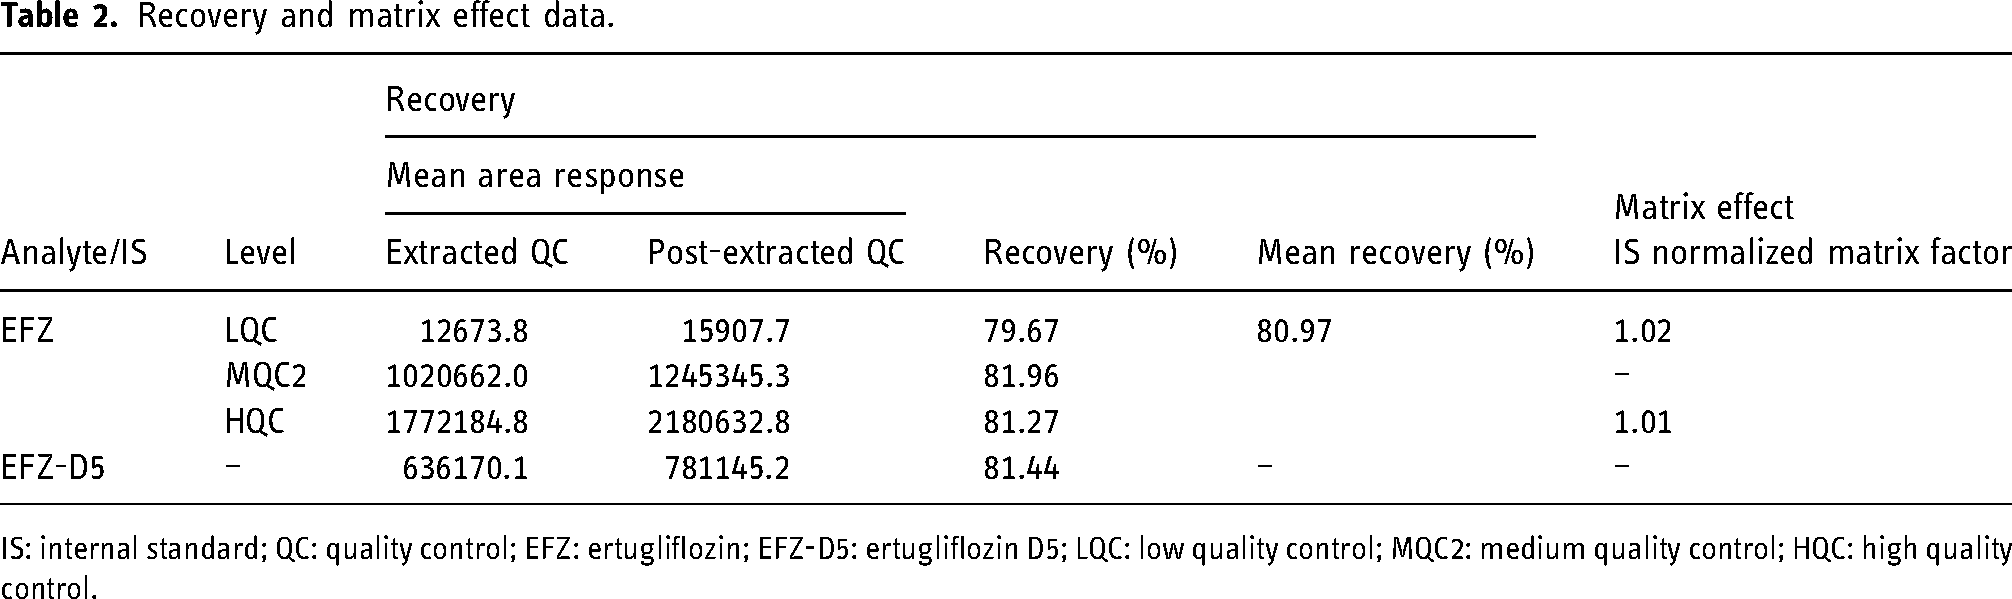
IS: internal standard; QC: quality control; EFZ: ertugliflozin; EFZ-D5: ertugliflozin D5; LQC: low quality control; MQC2: medium quality control; HQC: high quality control.
Accuracy and precision
The results of intra-day and inter-day accuracy and precision are shown in Table 3. The accuracy and precision (% CV) were in the range of 96.60%–100.47% and 1.37%–5.43%, respectively.
Intra- and inter-day accuracy and precision data.
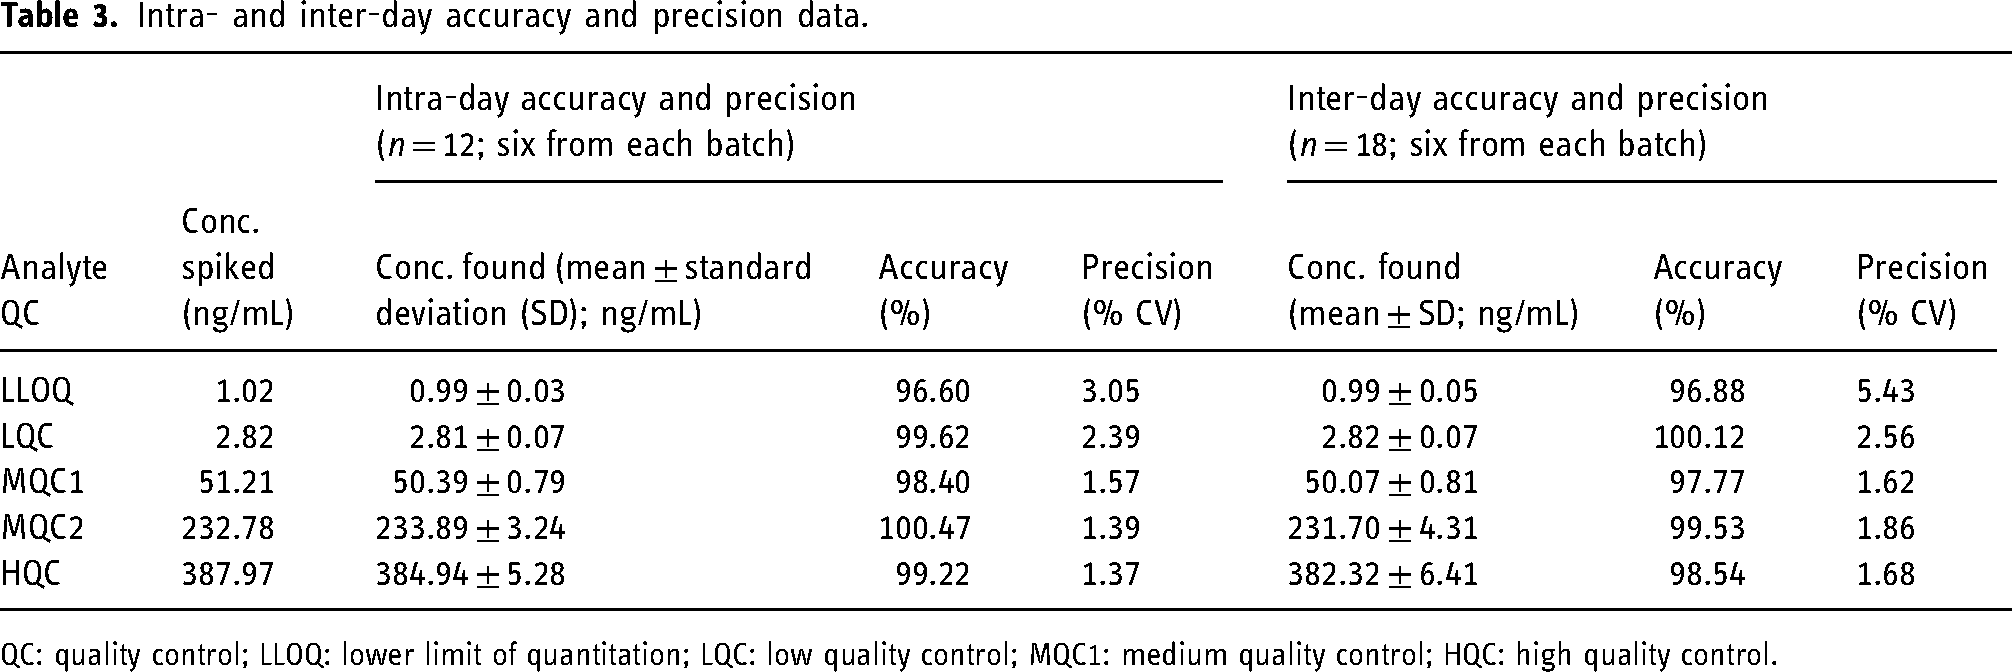
QC: quality control; LLOQ: lower limit of quantitation; LQC: low quality control; MQC1: medium quality control; HQC: high quality control.
Stability and ruggedness
The results of the stability studies performed at LQC and HQC levels are shown in Table 4.
Stability data (n = 6).
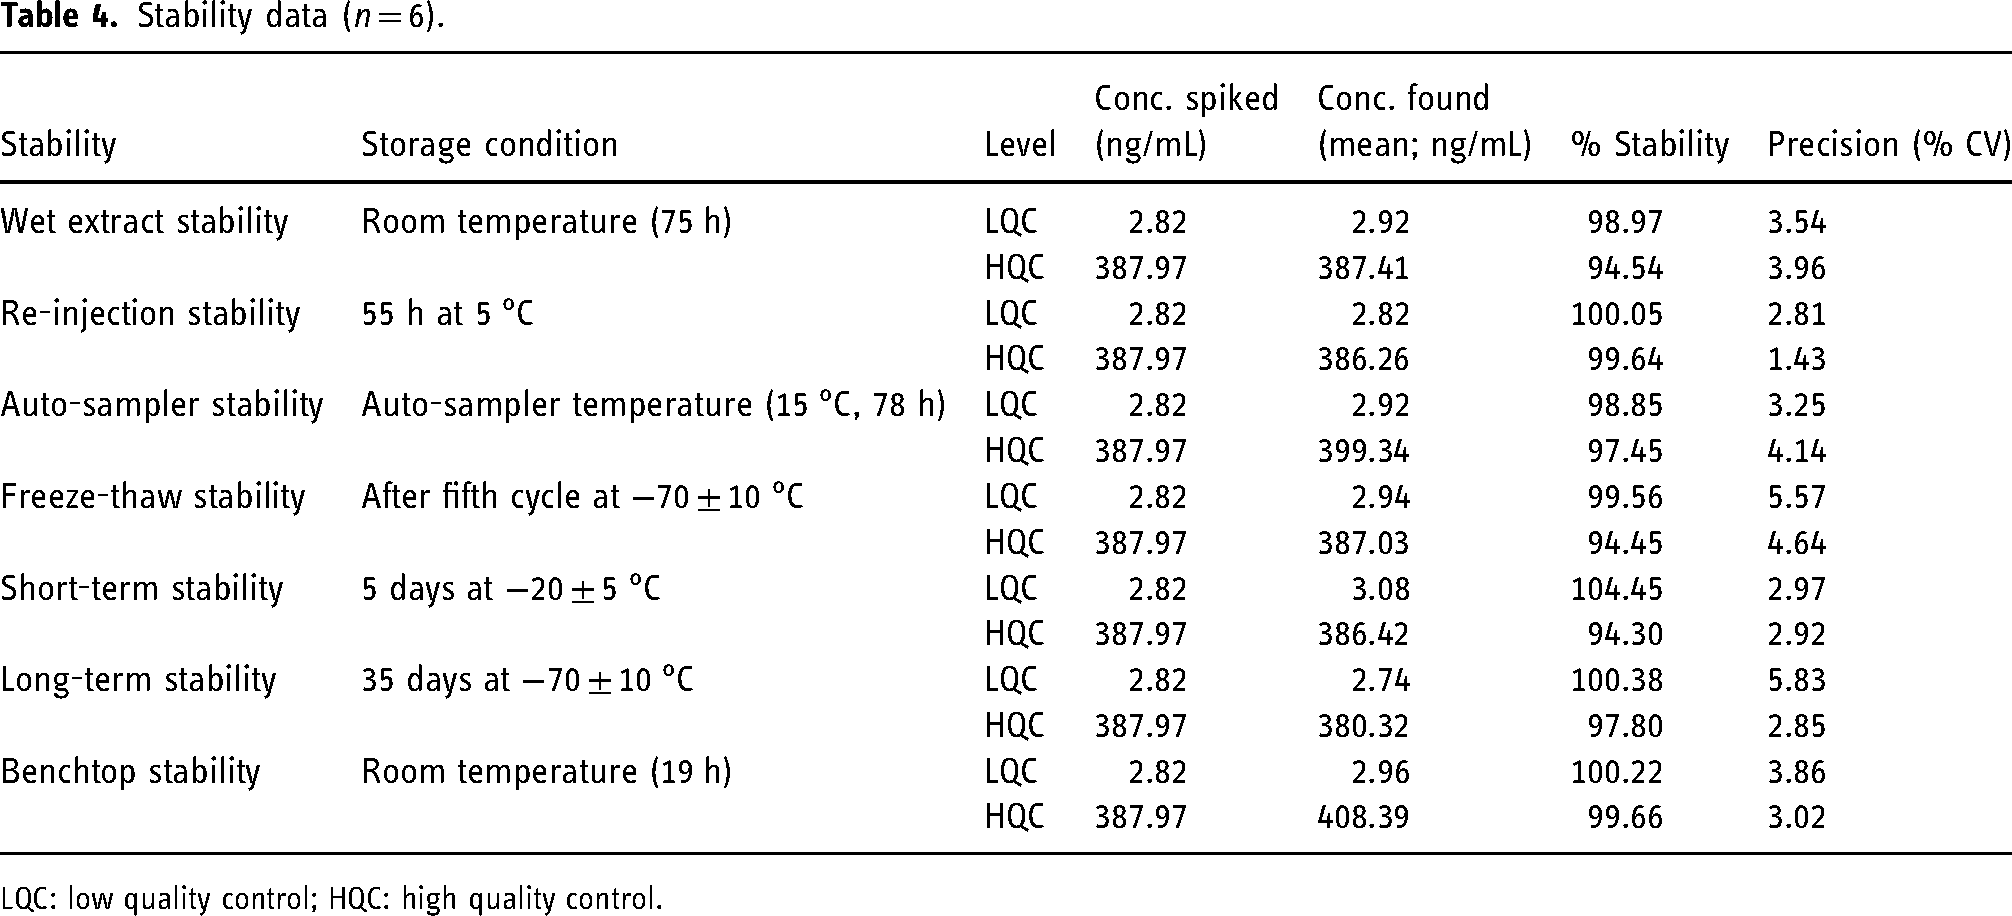
LQC: low quality control; HQC: high quality control.
The ruggedness of the method was established with the precision (% CV) and accuracy in the range of 1.95%–4.80% and 88.13%–99.10%, respectively.
Application to PK study
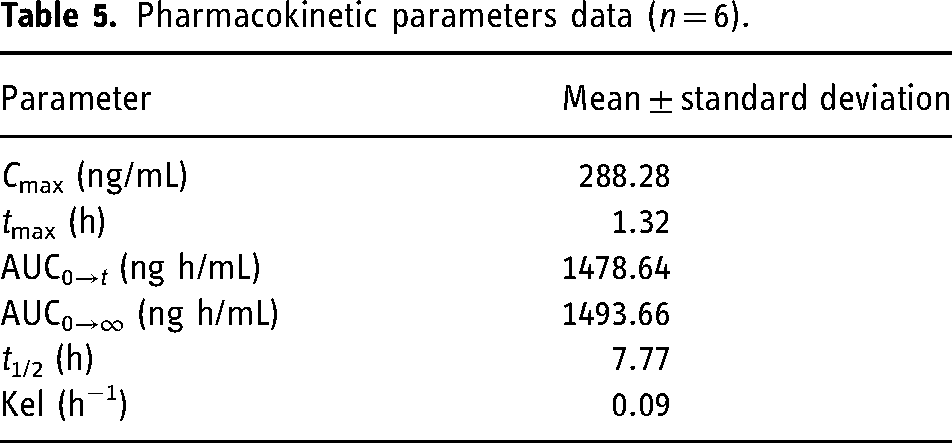
Healthy human volunteers were administered a single oral dose of EFZ, and the concentration of the analyte in the plasma samples collected at definite time intervals was quantified by the application of the developed method (Figure 2(d)). Mean plasma concentration–time profile of the study is illustrated in Figure 3. The PK parameters obtained are illustrated in Table 5 and are comparable to the previously reported results.4,5,11
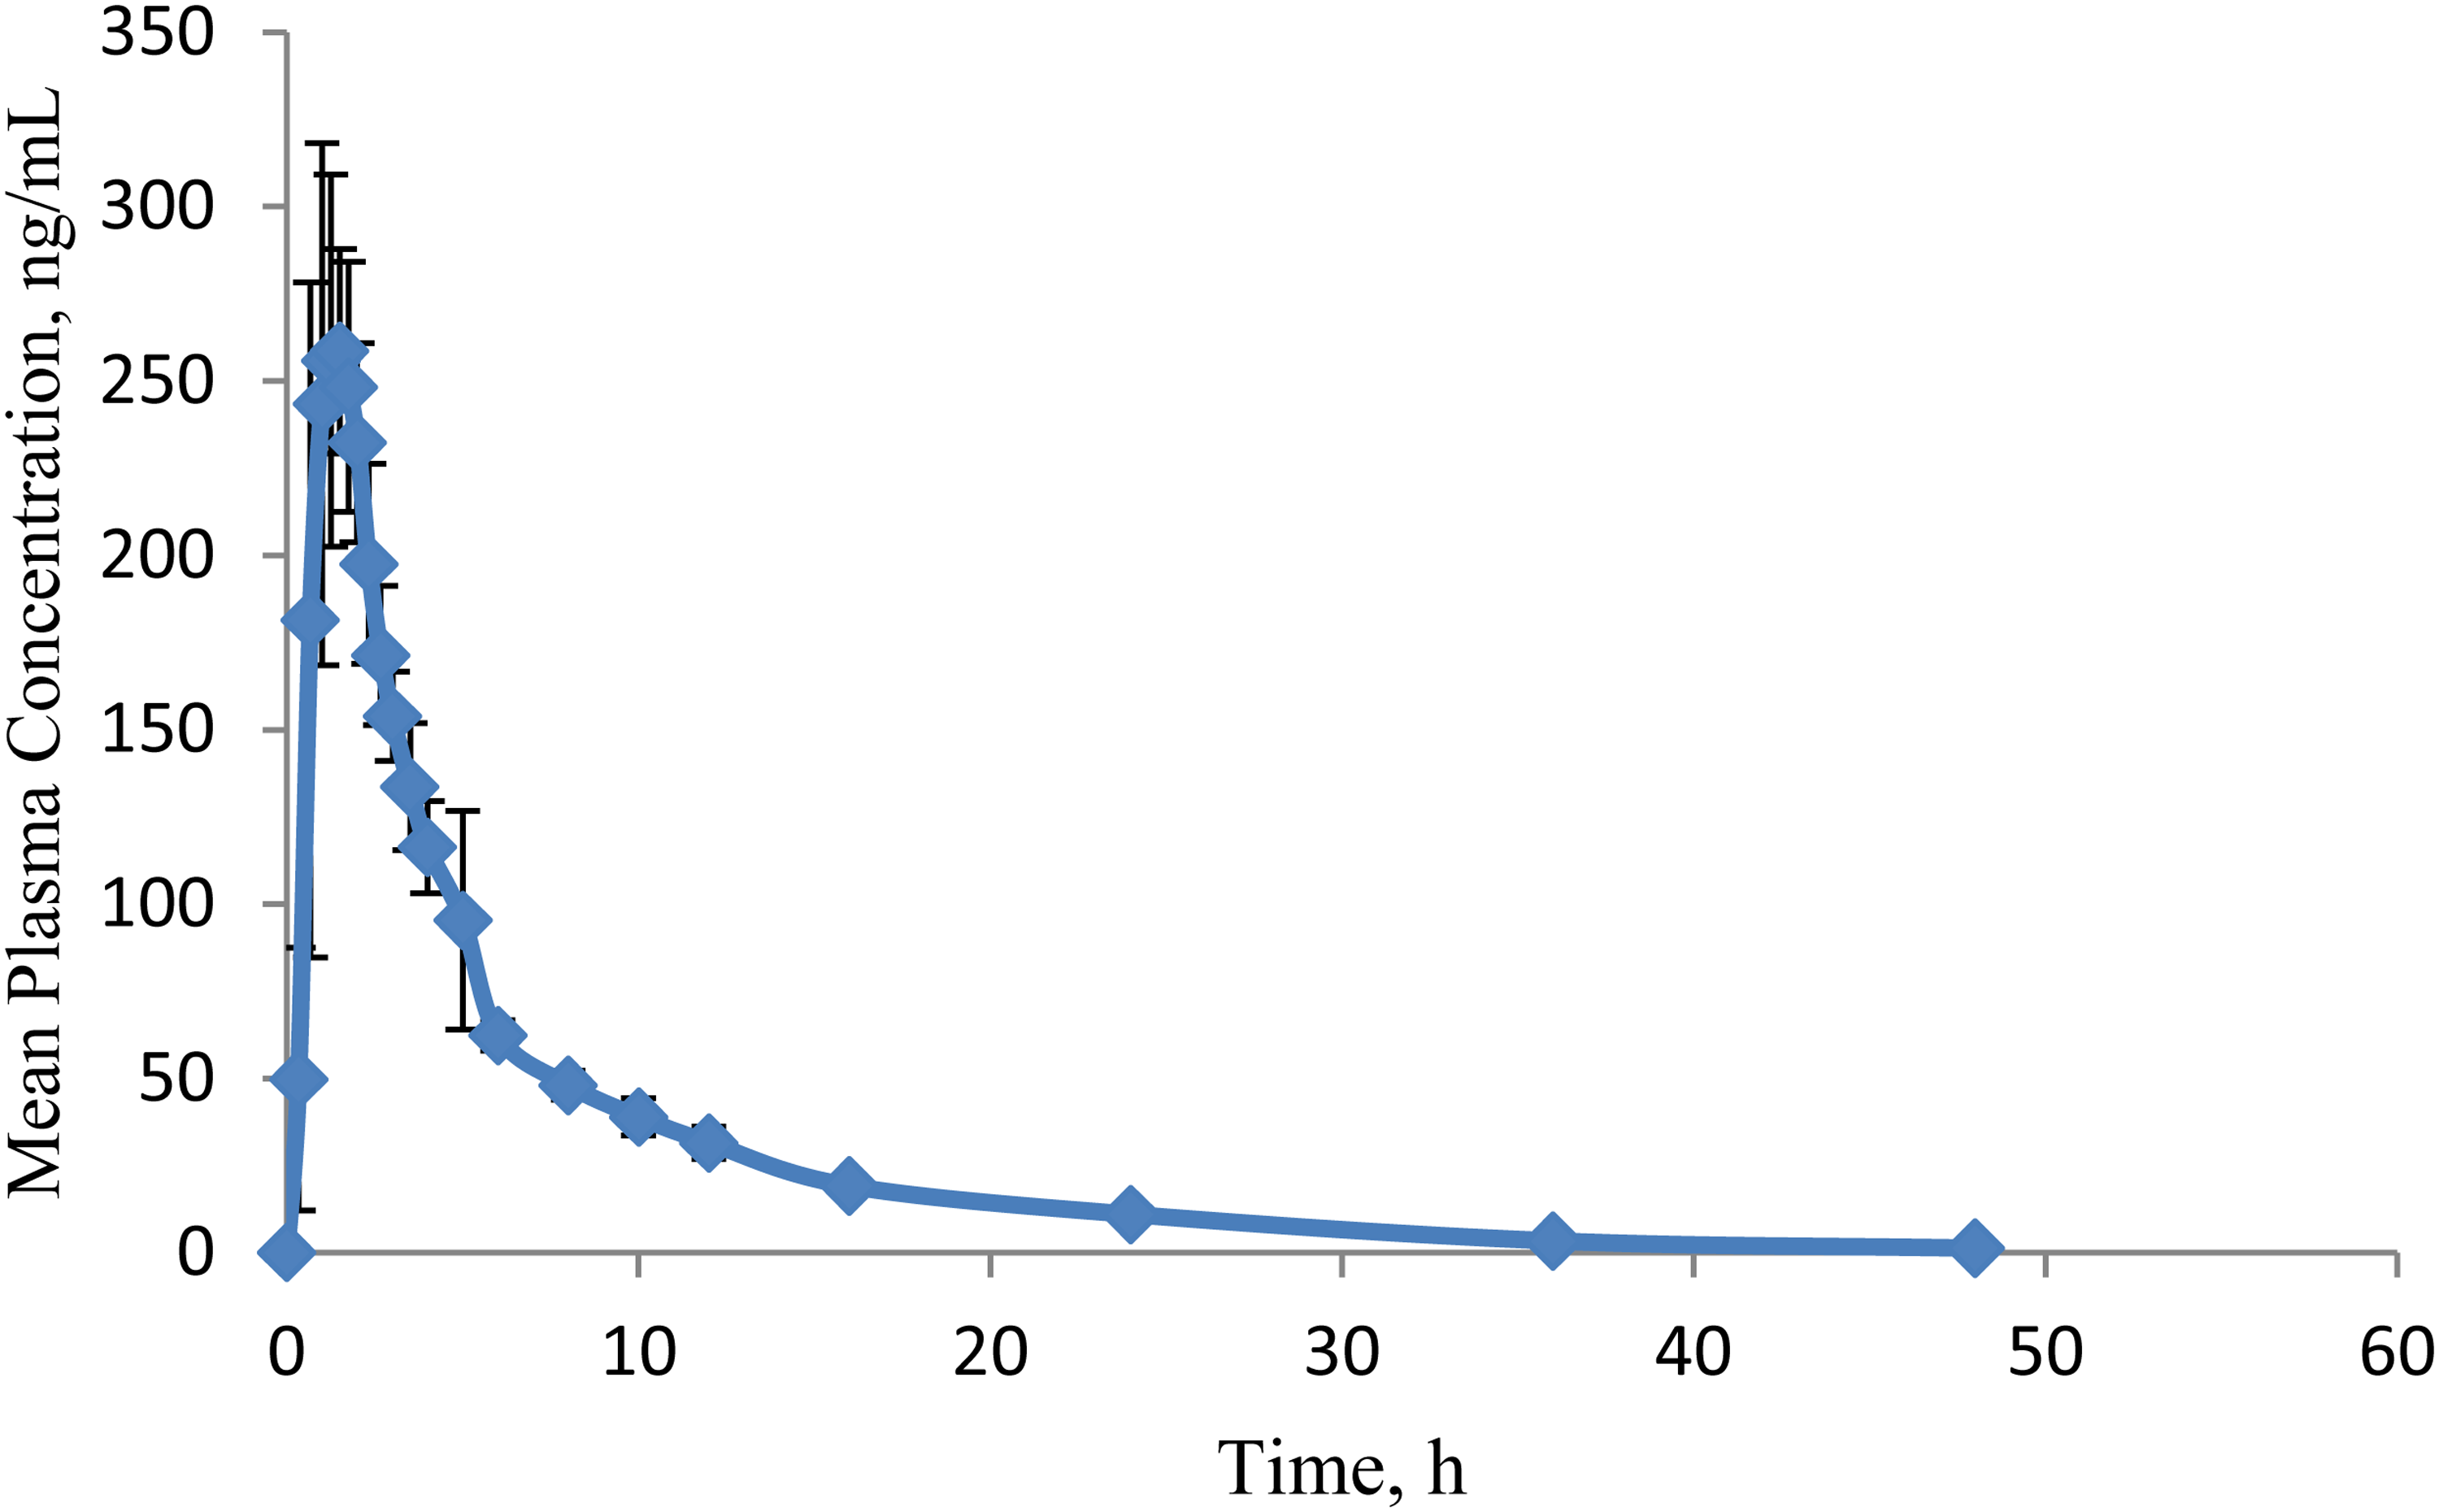
Mean (± standard deviation) plasma concentration-time profile of ertugliflozin (EFZ) after oral administration of a 15 mg dose.
Pharmacokinetic parameters data (n = 6).
Ruggedness of the method is confirmed by the incurred sample reanalysis data. The difference between the initial and the reanalysis results of the subject samples was found to be < 5%, which is within the acceptance limits of 20% as per USFDA guidelines (Table 6).
Incurred sample reanalysis data.
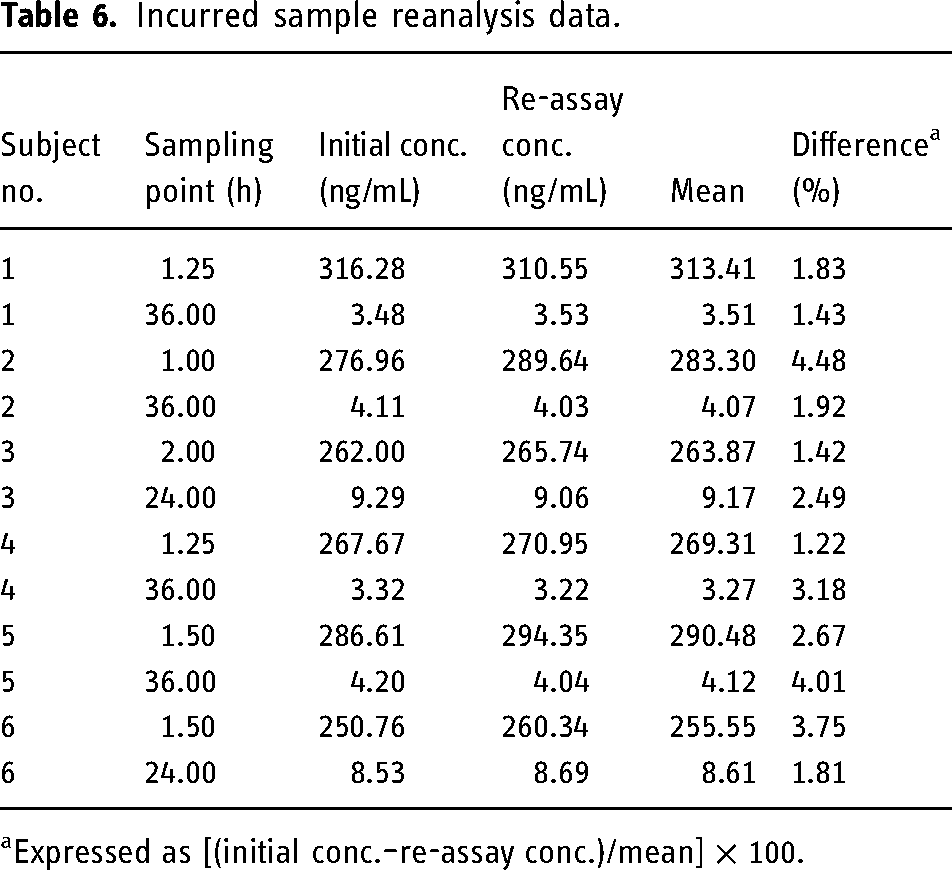
Expressed as [(initial conc.–re-assay conc.)/mean] × 100.
Conclusion
The LC-MS/MS-based bioanalytical method for the estimation of EFZ in human plasma is simple, rapid, and sensitive enough for bioanalytical studies. Usage of the deuterated analogue of the analyte, EFZ-D5, led to consistent, reproducible results with minimum variation in the recovery. Sample extraction using the LLE technique resulted in high and reproducible recovery of both the analyte and the IS. The applicability of the method was proven by a PK study followed by incurred sample reanalysis.
Footnotes
Declaration of conflicting interests
The author(s) declared no potential conflicts of interest with respect to the research, authorship, and/or publication of this article.
Funding
The author(s) received no financial support for the research, authorship, and/or publication of this article.