
Abstract
This article uses consumer research conducted in the early 1940s to interrogate and interpret a new dataset of daily box-office returns for 22 cinemas in the city of Philadelphia over 33 weeks traversing 1935–36. Our findings attempt to contextualize the observation made by the 1940s market investigators that just under half of cinema audiences were non-selective. It does this by a detailed analysis of the system of film distribution in which films were distributed in a hierarchical manner, from first-run through to fourth-run cinemas. Through an analysis of the variation in the performance of films at each level of the distribution hierarchy, and the impact that this variation had on the distribution of film revenues, we conclude that the impact of non-selective audiences on film outcomes was limited, irrespective of the relative importance of this audience component. We conclude by comparing and contrasting risk environments of the 1930s and contemporary film industries.
The movie business can be depicted as a giant ongoing laboratory in which both consumers and producers conduct experiments – consumers experiment because an inherent aspect of film consumption is the demand for novelty (Bianchi, 1998, 2002); producers do so because they can only have an incomplete idea of what it is that consumers want. This makes films quite unlike other forms of experience goods in that repeated consumption of the same film is not a consideration for the vast majority of filmgoers – that is not why they go to the cinema. Thus, the quest for novelty precludes the heuristic by which, once identified, consumers repeat consume their favourite brand (Nelson, 1970, 1974), or perversely seek variety in order to re-affirm the pleasure they derive from their favourite brand (Ratner et al., 1999). And, of course, the search for novelty in consumption is different from the manifestation of consumers as unique (Tian et al., 2001).
The purpose of this article is to revisit early market research of film audiences conducted in the 1940s (Handel, 1950), with a view to applying its most salient findings about consumer choice to a new rich dataset comprising the daily box-office returns of 22 cinemas located in the city of Philadelphia for a period of 33 weeks, traversing the years 1935 and 1936. In particular, it seeks to make sense of the division of audiences into non-selective, selective and follower categories and show how these categories can be fitted to the box-office returns of these cinemas through the time that films are on release, allowing us a much better understanding of film audiences and their motivations. However, while it is the case that a considerable proportion of the audience was more interested in films as a generic commodity (non-selective), they nonetheless do not contribute sufficient weight to the statistical distribution of box-office revenues to prevent the selective and follower audience portions from generating a long right tail distribution – that is, a distribution of film revenues that is dominated by a relatively small number of films generating very high revenues, with the remainder of the distribution consisting of films generating relatively modest revenues.
The audiences in this article are identified through microscopic quantitative data – they are counted. As far as the figures stand there is no sociology to them – of audiences, we do not know their age profile, gender divide, social class composition, nor occupational mix. Neither do we know where they lived, nor the distance travelled to the cinema, from either home or work. However, we do know the numbers that saw particular films at particular cinemas on particular days. From aggregating these data, it is evident that some films are very much more popular than others but also that the capacity of cinemas to screen films for lengths of time varies considerably across the range, suggesting that the motives of audiences differed from cinema to cinema. These observations fit comfortably with Richard Maltby’s depiction of the relationship between American audiences and Hollywood, in which he argues: ‘Rather than Hollywood maintaining a view of the audience as an undifferentiated mass, the industry sought to provide a range of products that would appeal to different fractions of the audience, and to include a set of ingredients that, between them, would appeal to the entire range of different audience fractions’ (Maltby, 1999: 25).
Knowledge of the history of film consumer research and its extensiveness has recently been considerably augmented (Bakker, 2008; Schwarzkopf, 2009). What this article does is show how such research may be used to interrogate applicable historical datasets, and in so doing contribute to a more nuanced understanding of film audiences. It further demonstrates that the statistical distribution of revenues, and their temporal flow, are important sources of information for researchers of consumer behaviour. Finally, it maintains that these two combined to provide a powerful spotlight on those supply arrangements that emerge to best satisfy demand and maximize revenue for the distributor and exhibitor.
Background
Thus, when faced with choices between new products and services, the properties of which are uncertain, how do individuals behave? The literature that has developed from the seminal work of Banerjee (1992) and Bikhchandani, et al. (1992) suggests that when many consumers simultaneously face the same uncertainty in decision making, involving a common set of choices, a social dimension to individual behaviour can be detected. Commonly labelled as social learning, the theory proposes that individuals not only draw upon their personal experience, but also learn from one another, and the extent to which this learning takes place influences the pace at which knowledge of the product or service diffuses.
In a recent article, Moretti (2011) suggests that because of the positive multiplier effect it can have on sales, social learning is of great potential significance to firms. Rather than seeking experimental data to investigate this, Moretti draws upon weekly film industry data to chart the diffusion of revenues generated by individual films over the period 1982–2000. One of his tests concerns the extent to which films that meet his criteria for being surprisingly successful or unsuccessful during the first week of their theatrical release continue to be similarly successful, or otherwise, during the remaining period of their release. Other tests involve the strength of priors, the extent of consumer use of social networks and the pace of knowledge updating over time.
As Moretti maintains, the film industry is an ideal environment in which to identify and measure the extent to which social learning takes place. It is an environment in which new differentiated products that consumers have no direct experience of are continuously released into the theatrical market and then, for the most part, removed from it shortly after. This rapid life and death process gives consumers little time in which to decide in favour of watching particular films at the movies before they are gone. In his study, Moretti found that the rate of social learning declined over time, making the early weeks particularly important in determining the diffusion process. De Vany and Lee (2001) found that social learning took a number of weeks to determine the probable course of film revenues, thus identifying consumer behaviour as social learning rather than mere herding.
Morretti, and De Vany and Lee, both draw upon an industry standard dataset of North American market aggregates that was collected from exhibitors by EDI/Nielsen. Typically, contemporary consumers in urban settings choose from an array of films programmed at particular multiplex cinemas comprising multiple screens. These cinemas maximize revenues by adjusting programmes in response to the strength of demand – highly popular films have their runs extended, and are screened in larger auditoria; films that prove less popular, once screened, are quickly withdrawn.
Although going to the movies is an important leisure activity for consumers today, in terms of expenditure it ranks equally with other uses of paid-for leisure time such as the legitimate theatre and opera (combined), and spectator sports, implying that there are many equally attractive substitute entertainment activities for consumers to choose between (US Census Bureau, 2007). Thus, we can assume that consumers make conscious decisions to go to the cinema in preference to other activities and once there, for the most part, choose films they would most like to see – they seek to maximize their expected utility.
In contrast, the dataset that forms the basis of this article is qualitatively different from that used by Moretti and others to analyse the present-day film industry. It comprises micro-data drawn from specific cinemas located in the city of Philadelphia during the mid-1930s – a period when, in the words one historian, cinema was ‘the essential social habit of the age… [which] slaughtered all competitors’ (Taylor 1965: 313), capturing four-fifths of total entertainment expenditure in the United States (US Census Bureau, 1975: ch. H, ser. 883–4). In the middle years of the decade there were approximately 15,000 cinemas operating in the USA, with most films receiving between 2000 and 10,000 bookings (Motion Picture Almanac, 1938). Cinemas, organized into runs and zones by time and space, were supplied through 31 territorial exchanges, one of which was based in Philadelphia. Outside the 450 or so first-run cinemas in cities with over 100,000 inhabitants in which weekly (or longer) change, single-bill programmes dominated, an exhibitor required 208 films per annum to service a double bill, twice weekly change programming policy. The industry’s trade association calculated that annually this system of distribution involved over 500,000 individual contracts governing 11 million individual film shipments. The logistics of this operation were staggering, leading a contemporary statistician to refer to the industrial organization of the film industry as ‘one of the sociological wonders of the century’ (Rowson, 1936: 71).
As suggested in the opening paragraphs, a concern of this article is the behaviour of film audiences. In particular it sets out to show how market research – then in its infancy – can be applied to the descriptive statistics that characterize filmgoing at every one of the 22 cinemas in the sample, indicating strongly that different cinemas served different purposes for different sets of consumers, each with different expectations. Further, it is possible to speculate that certain parts of the audience for films were discriminating in their filmgoing practice, and that they were sufficiently numerous to make all the difference in terms of a film’s performance at the box office. Finally, the prospect is entertained that discriminating consumers took risks, implying that the disconfirmation of audience expectations was commonplace (Sedgwick and Pokorny, 2010).
Data source and initial findings
From the documents housed in the Warner Bros. Archive at the University of Southern California, weekly billing sheets belonging to the Stanley-Warner chain of cinemas in the Philadelphia exchange have been uncovered for the years 1935 and 1936 (Gomery, 1992). Never previously accessed, these weekly billing sheets provide micro-data of an unparalleled nature about the choices made by audiences (daily box-office takings) and the manner in which film distribution responded to this information (the scheduling of movies for screening at various cinemas). The billing sheets also provide details of the rental payments paid to distributors by cinema owners for the rights to screen their films.
With a population of just under 2 million, Philadelphia was the third largest city in the USA at the time. The film trade journals list 749 cinemas supplied by the exchange, of which just under a quarter (183) belonged to the affiliated circuits of the Hollywood majors – MGM, Paramount, RKO, 20th Century Fox and Warner Bros. (Motion Picture Almanac, 1938). With 122 of these, 91 of which were located in the city of Philadelphia, Warner Bros was the dominant exhibitor in the exchange.
Based on a sample of 22 of the 91 Warner Bros. cinemas located in the city, this article reports on the data generated by 2350 separate screenings of 343 films over the 33-week period from week ending 16 November 1935 to 28 June 1936: a figure that is equal to more-or-less all films released by the major Hollywood studios at the time, from which the Stanley-Warner chain derived the great majority of their films, and just under half the total number of films released onto the North American market (Finler, 1988).
There are some surprising initial findings: first, while many cinemas in the sample ran multiple weekly change programmes, none of them practised double-bill programming, which was the dominant industry practice at the time (Balio, 1993); second, many lower order cinemas changed their programme three or more times each week; third, subsequent bookings in lower order cinemas did not follow the standard run–clearance pattern, but rather revealed one of continuous circulation up to the moment of theatrical extinction; and, fourth, the number of distinct bookings received by films is far less unequally distributed than are the box-office revenues generated by them. A fifth observation confirms an earlier finding, which is that although the sample cinemas were owned by Warner Bros., the films they screened were extensively supplied by rival studios: vertical integration thus did not preclude the screening of films of rival producers/distributors, of course for a price (Sedgwick and Pokorny, 2005; King, 1986).
Attendances, audience-types and prices
Official and alternative attendance and box-office statistics, USA, 1929–39
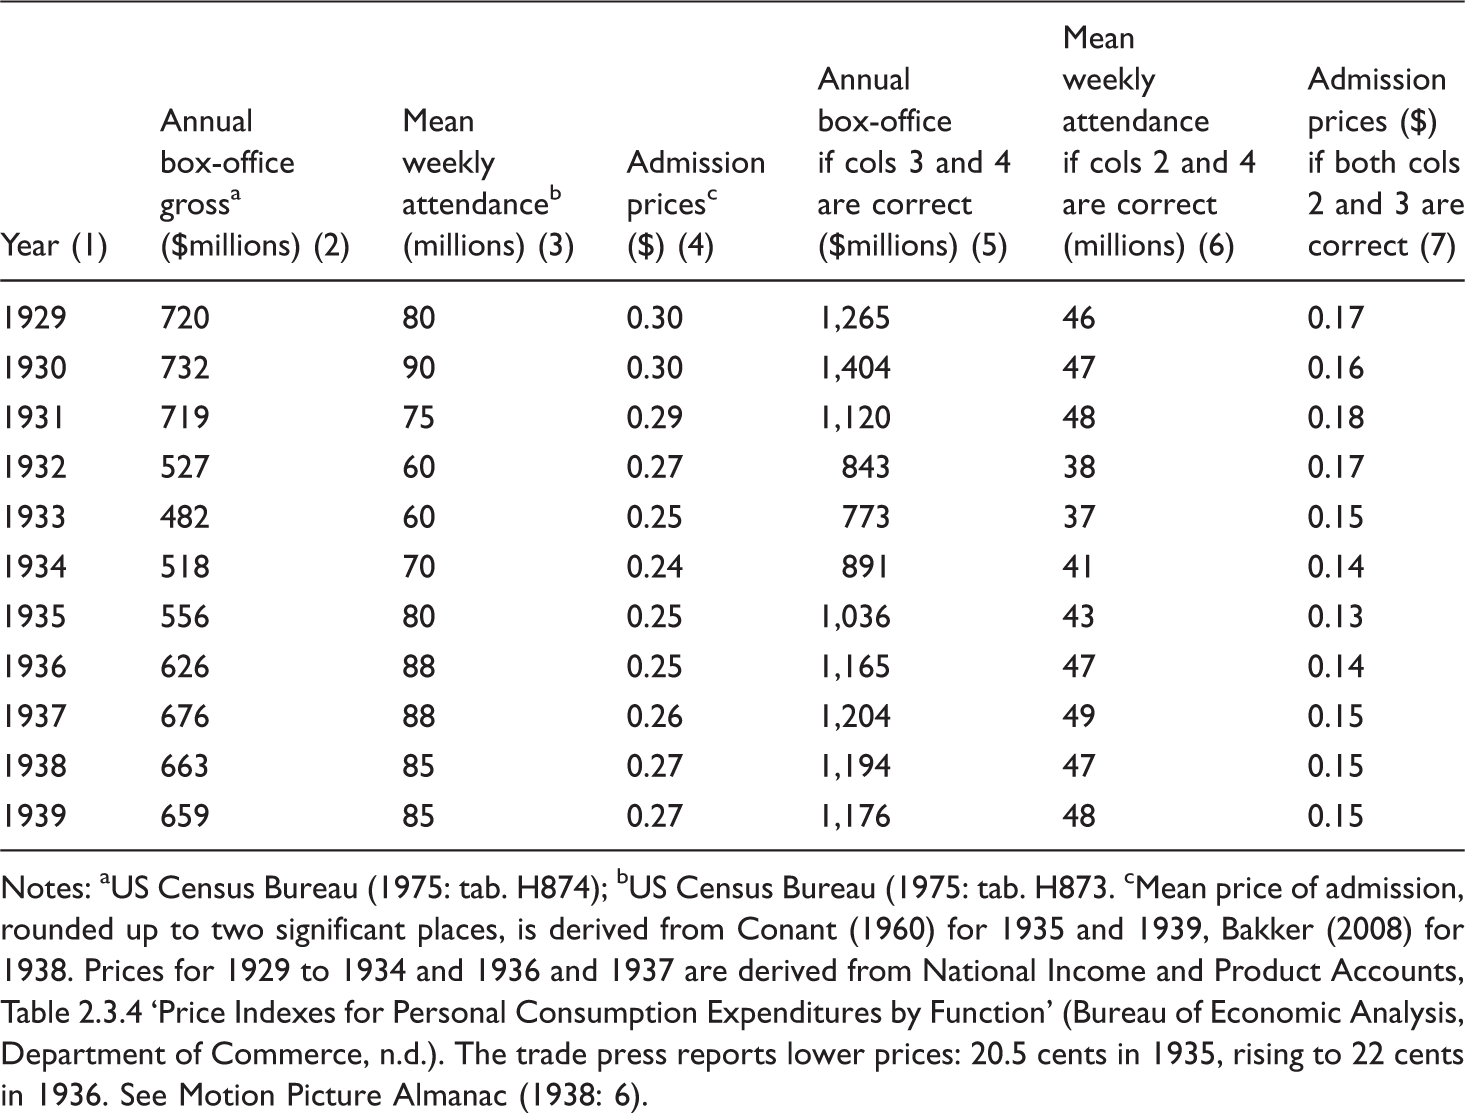
Notes: aUS Census Bureau (1975: tab. H874); bUS Census Bureau (1975: tab. H873. cMean price of admission, rounded up to two significant places, is derived from Conant (1960) for 1935 and 1939, Bakker (2008) for 1938. Prices for 1929 to 1934 and 1936 and 1937 are derived from National Income and Product Accounts, Table 2.3.4 ‘Price Indexes for Personal Consumption Expenditures by Function’ (Bureau of Economic Analysis, Department of Commerce, n.d.). The trade press reports lower prices: 20.5 cents in 1935, rising to 22 cents in 1936. See Motion Picture Almanac (1938: 6).
In the absence of admission prices for most of the cinemas in the city, the 1935 national average admission price of 25 cents ($0.249), found in Table 1, has been used to estimate the aggregate attendances of the sample of 22 Philadelphia cinemas over the 33 weeks beginning week ending 16 November 1935. The results are presented in Figure 1. With a mean weekly audience size of 355,362, the series peaks during the week that contained New Year 1936 at 523,330.
Aggregate weekly attendances of the 22 Philadelphia cinemas that make up the sample, from week ending 16 November 1935 to 27 June 1936.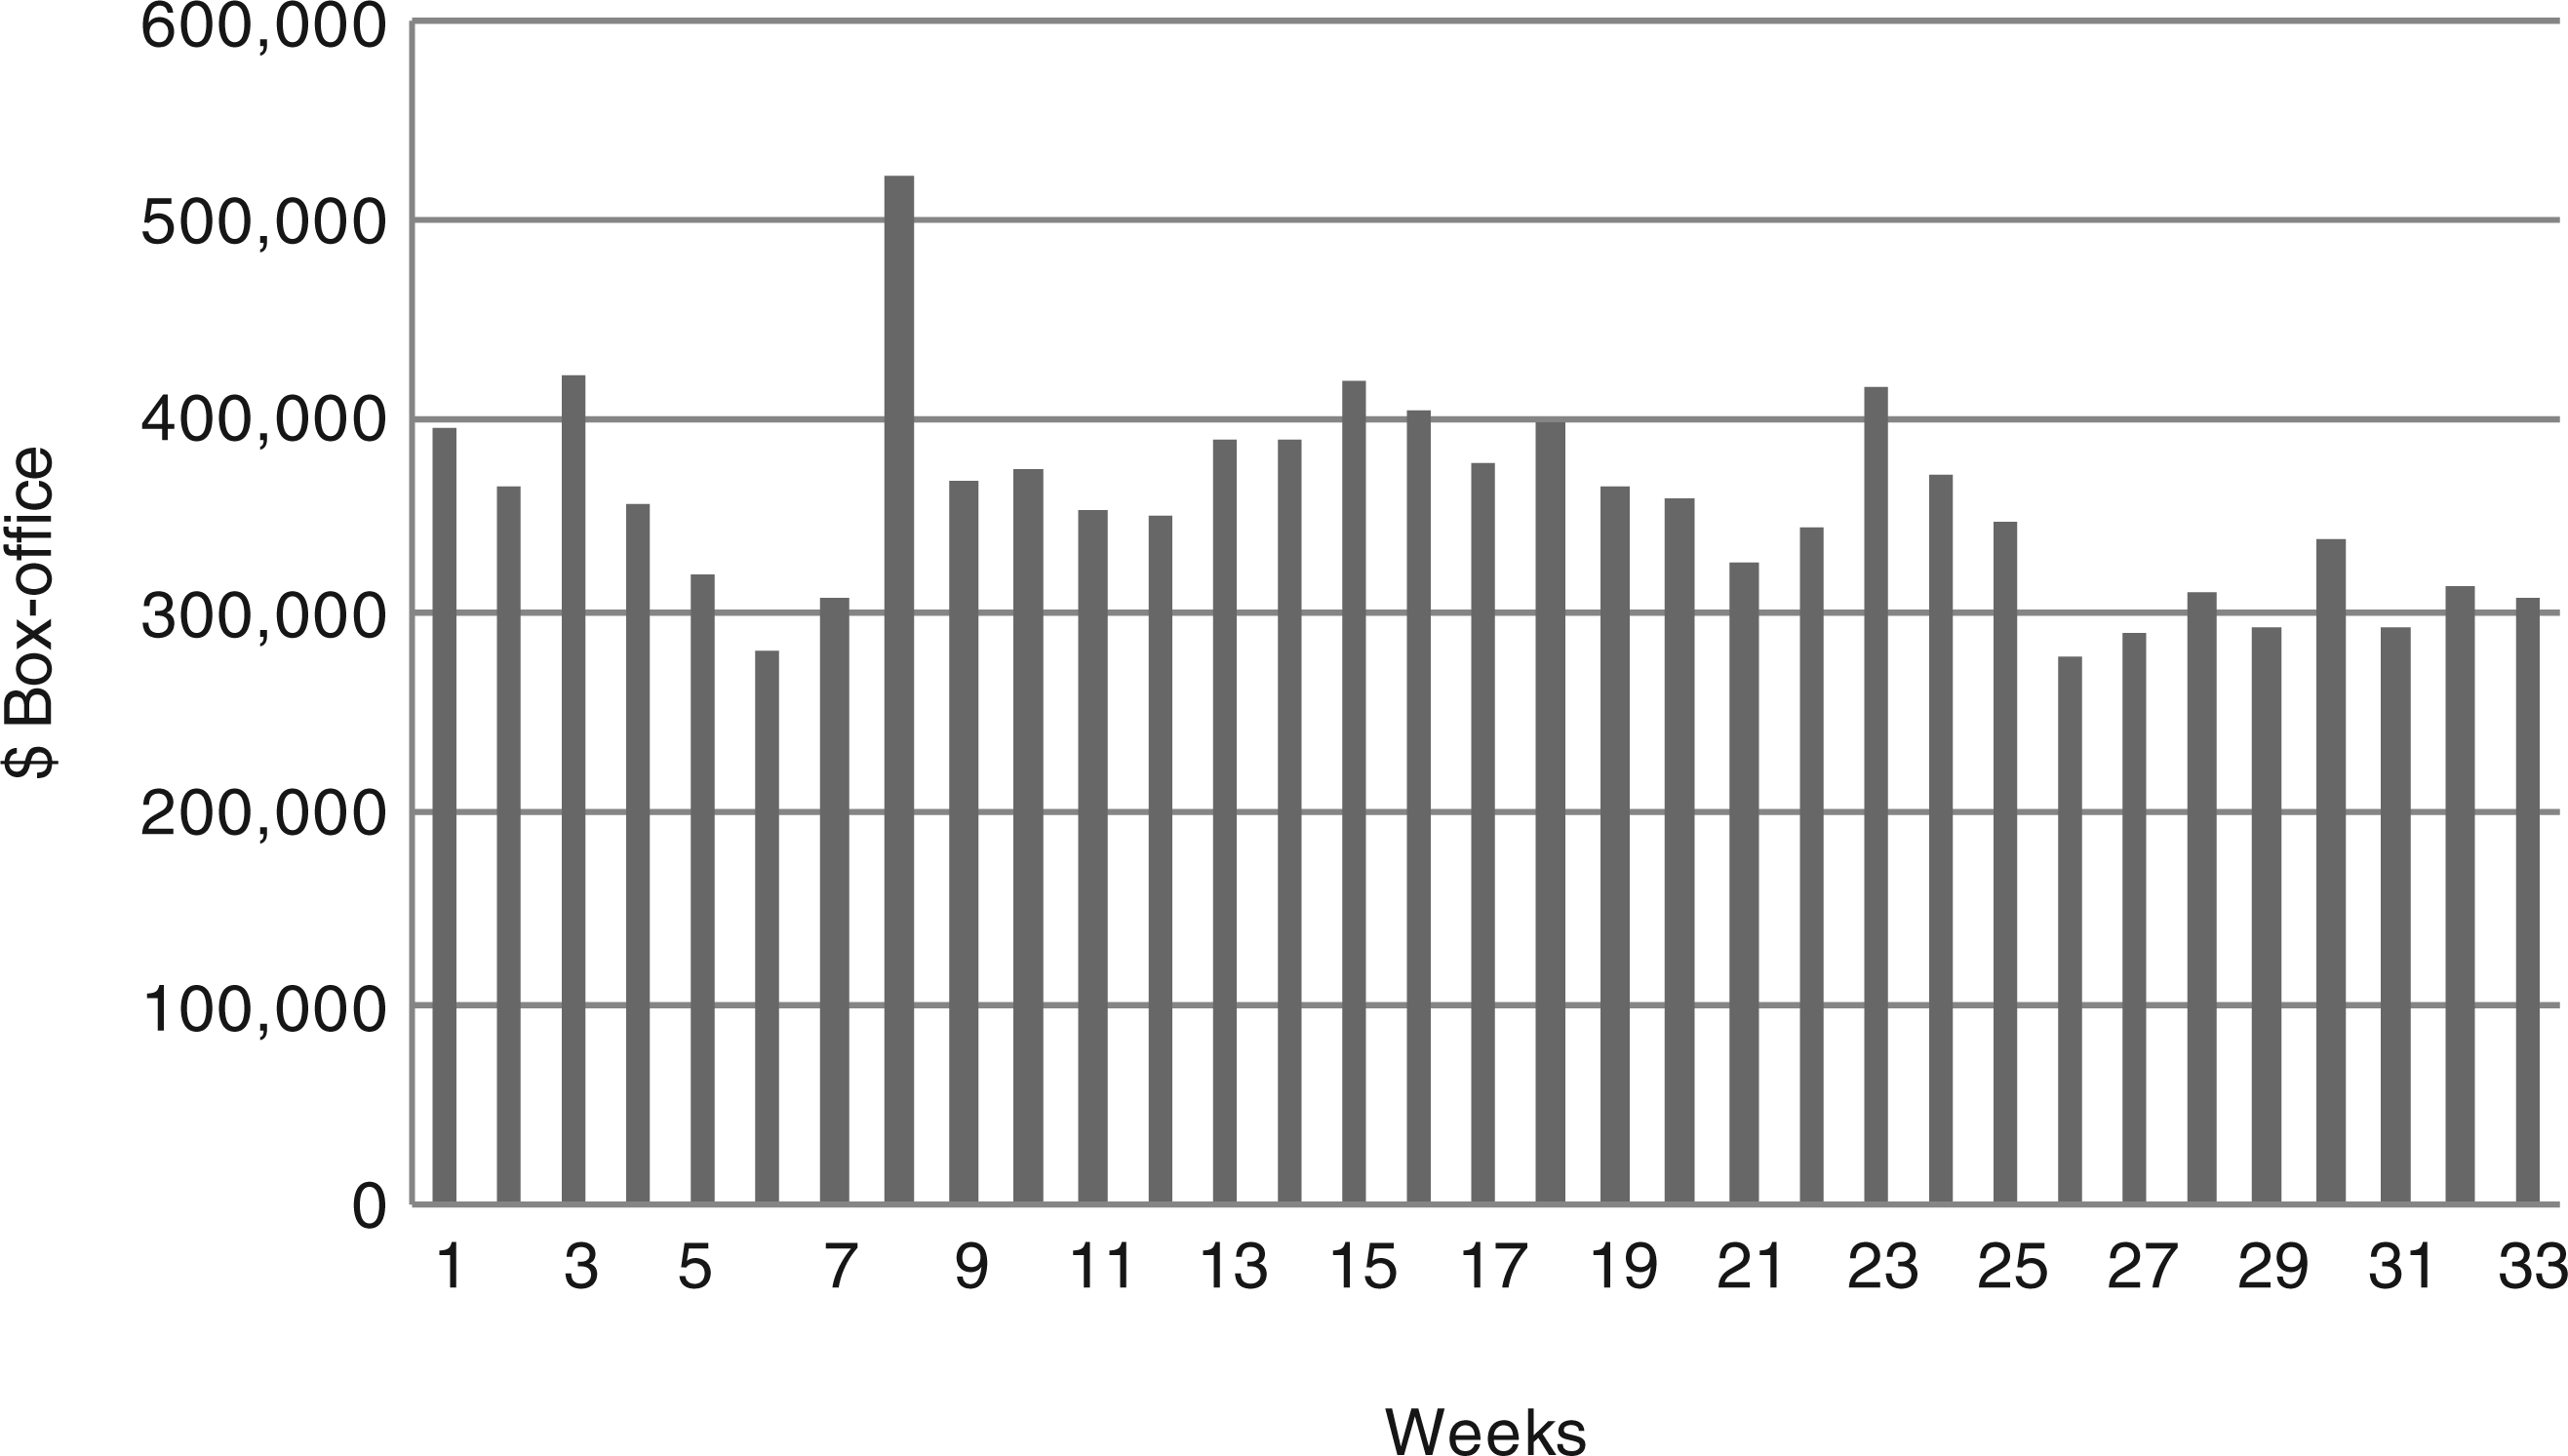
Although we cannot know who these filmgoers were, 1941 and 1943 survey data suggest that three types of film consumer can be identified (Handel, 1950: 100, 153):
Non-selective filmgoers – filmgoers who do not discriminate between films. A 1941 study of New Yorkers comprising 508 interviews conducted by the Motion Picture Research Bureau suggests that 49 percent of audiences were non-discriminating. Such filmgoers were presumably relatively diverse with regard to their motivations for film consumption, including those who consumed films on a purely habitual basis, those attracted by the ambience of the filmgoing experience rather than the particular film being shown, and those who attended the cinema with companions who chose the film to be viewed. It would therefore seem reasonable to assume that a common characteristic of such filmgoers is that they were relatively immune to the quality signals that film advertising attempted to convey. Selective filmgoers – the same 1941 study suggests that 36 percent of interviewees selected the show. A 1943 study of 2700 filmgoers attending 10 different cinemas in the New York metropolitan region indicated that social class was an important determinant of the extent to which filmgoers discriminated between films and followed recommendations. Filmgoers who follow personal recommendations. The 1941 study suggests that 12 percent of audiences went on personal recommendation – 3 percent could not be accounted for by these three categories.
Furthermore, the 1941 study found that on average women attended 3.75 times a week and men 3.70 times a week. It also found that of those who watched films (22.6 percent did not), 25 percent went once or twice per month, 40 percent went three to five times a month, 23 percent went six to nine times a month, and 12 percent went 10 times or more a month.
Thus, for half the audience, it would appear that a preference for filmgoing per se was being exercised, rather than a preference for a specific film. Of course, if this behaviour had been inclusive of all filmgoers, the distribution of film revenues would have been flat – all films would have generated roughly the same revenue. That this was certainly not the case is a testament to the significance of the choices made by the other half of the audience.
Audience behaviour
Characteristics of the 22 cinemas in the sample cinema set, from week ending 16 November 1935 to 27 June 1936
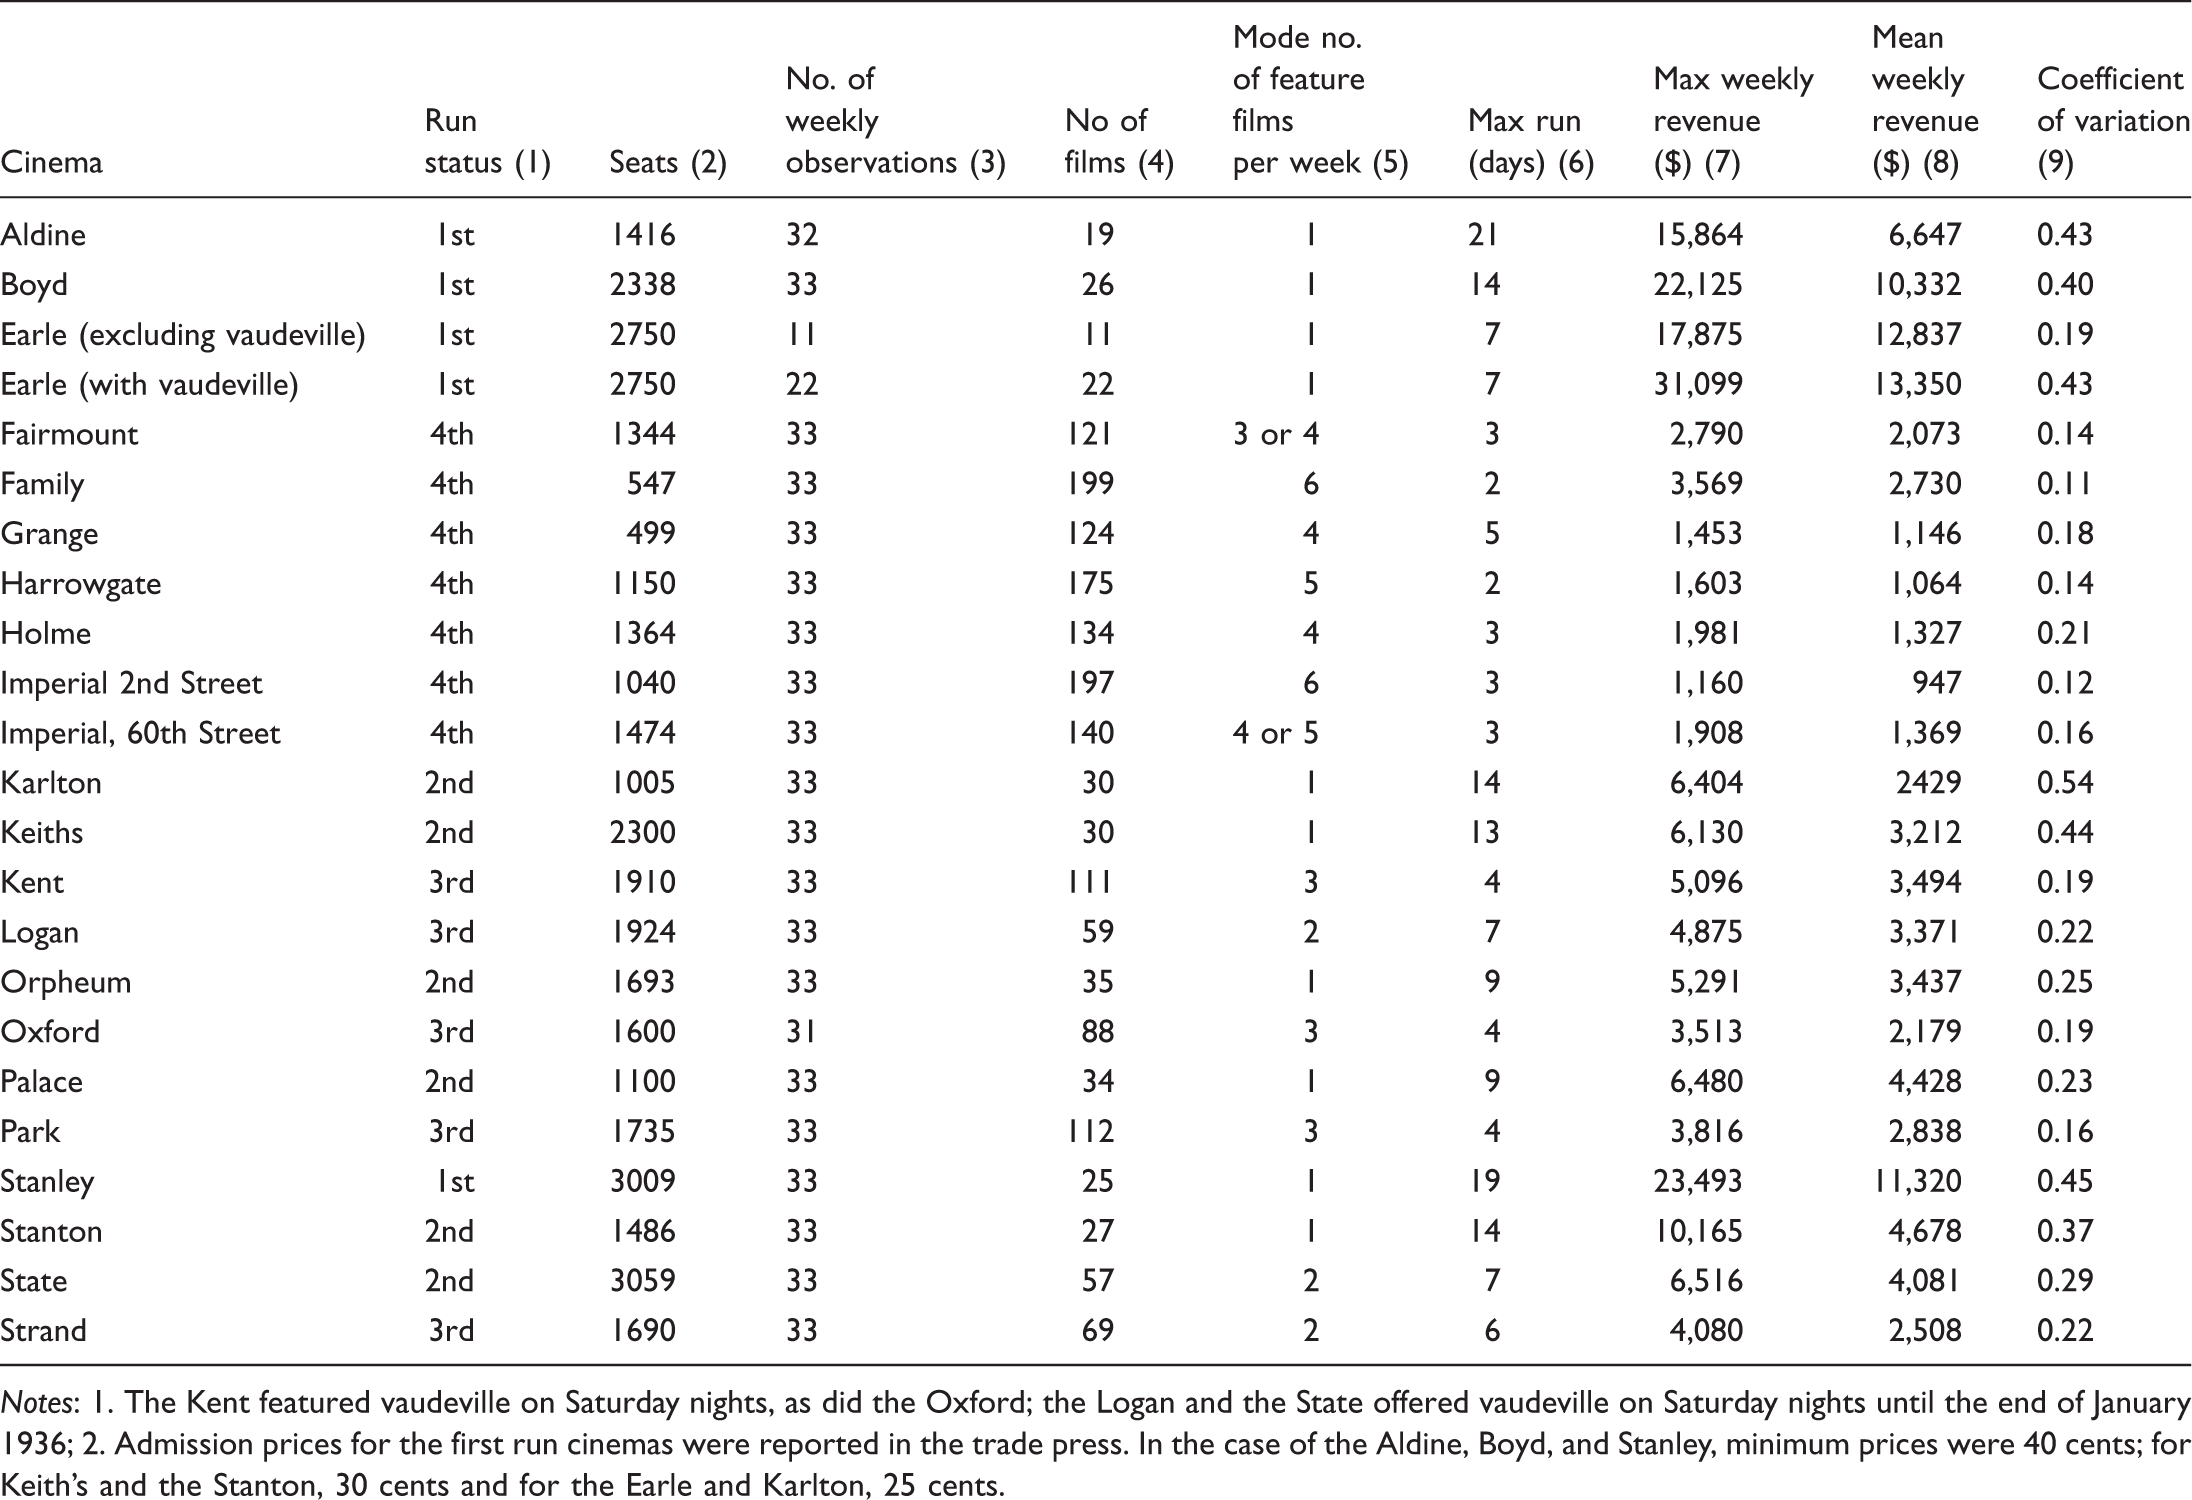
Notes: 1. The Kent featured vaudeville on Saturday nights, as did the Oxford; the Logan and the State offered vaudeville on Saturday nights until the end of January 1936; 2. Admission prices for the first run cinemas were reported in the trade press. In the case of the Aldine, Boyd, and Stanley, minimum prices were 40 cents; for Keith’s and the Stanton, 30 cents and for the Earle and Karlton, 25 cents.
One of the most notable aspects of Table 2 is that the first-run cinemas experienced a much greater variance in film revenues, when measured by the coefficient of variation, than lower order cinemas did. These differences in variance suggest that different types of cinema served different audiences. The plausibility of this conjecture is further supported by the number of films screened by the cinemas in the sample. During the 33-week period, this figure ranges from the 198 films that were shown at the Family – more or less a daily change in programme schedule – to the 19 films that were seen at the Aldine, and 25, 26 and 27 films respectively at the Stanley, Boyd and Stanton cinemas, where, in all four cases, the most popular films were held over for a second week, or occasionally longer. The Pearson moment correlation coefficient between the number of films screened and the coefficient of variation is −0.82, suggesting that large swings of variance in box-office revenue were experienced by the upper order cinemas that screened comparatively few films, but did so at the start of their release, while small swings of variance characterize those lower order cinemas that screened multiple programmes during the course of each week. Given that films originally screened in one of the upper order cinemas were later programmed in lower order cinemas, this evidence suggests consumers who attended upper order cinemas exhibited a time preference to see films at earlier stages of their distribution and were willing to pay a premium for this in the form of higher admission prices. In addition we could interpret such consumers as taking on greater risks in film consumption, given the limited information available about newly released films at this early stage of the release cycle. Conversely, we could interpret consumers attending lower order cinemas as being exposed to less risk in film consumption, given the greater information about each film to which they will have access at this later stage of the release cycle. Of course, a substantial if not overwhelming proportion of lower order cinema attendees will also be too poor to attend upper order cinemas. However, given that virtually all films shown in upper order cinemas were eventually released in lower order cinemas, consumers at lower order cinemas were certainly not restricted in the choices that they could make. Indeed, given that many films exhibited at lower order cinemas had not been released previously – typically relatively low budget films – lower order cinemagoers experienced wider choices than consumers who only attended upper order cinemas.
Given that we would define discriminating film consumers as those who reach their film consumption decisions on the basis of the perceived relative merits of the films available to them, there is no a priori reason to expect that the incidence of such consumers differed between the run order of cinema at which consumption took place – all that we might conclude is that lower order cinema consumers had access to more extensive information than consumers at earlier stages in the release cycle. Concerning this point, both De Vany and Lee (2001) and Moretti (2011) distinguish between public and private signals received by filmgoers, with public signals emanating from the studios/distributors handling the publicity surrounding the release of films onto the market, while private signals reflect the response of idiosyncratic filmgoers to messages received from the social networks to which they belong. Discriminating filmgoers can thus be perceived as subjective entities attempting to make sense of not altogether reliable information from producers, from peers, and from their own past history, about a product that ex ante they cannot properly imagine. This depiction of the consumer thus rejects the notion of expectation objectivity in consumption – that is, the signals received by a consumer are not a certain indicator of quality, and quality doesn’t exist independently of the consumer.
Temporal patterns in the box-office
What do we make of the non-discriminating consumer and the statistic that at least half of filmgoers were more attracted to the cinema than the film being screened there? While such behaviour may be rare among filmgoers today, given that a film choice must be made on arrival at a multi-screen cinema venue, perhaps the medium of television provides a contemporary example of non-discriminating consumption – audiences that watch a particular channel irrespective of what is on, or flick between channels in the hope of a programme capturing their attention.
Drawn from the exhibition records of the 10 most popular films over the period listed in the Appendix, Table 3 provides evidence for this distinction between discriminating and non-discriminating filmgoers described in the previous section, and illustrated in Figure 2. Values in the table represent the weekly box-office revenue generated at each cinema at which the film was screened, organized chronologically, expressed as a proportion of the mean weekly revenue of that cinema. Where a film was not screened for a full week at a particular cinema, this is taken to reflect the reduction of consumer interest in the film – for this reason the mean weekly box-office of that cinema is still used as the standard by which to judge the revenue actually generated for the part-week screening. When upon a film’s release debut (the first week) the initial value is high (well above 1.0), this suggests that discriminating audiences were attracted by strong public signals. If the value remains above 1.0 during subsequent weeks, follower consumers are perceived to receive strong private (word-of-mouth signals) that reinforce the public signal. The fact that the proportions fall over time indicates that as the interest of discriminating and follower audiences decline, the impact of non-discriminating audiences on box-office revenue becomes increasingly dominant, causing the line graphs in Figure 2, which represent the hits of the day, to converge as they slope downwards from left to right.
Booking history of the Top and Bottom ranking films in Philadelphia expressed as a proportion of the mean weekly revenue of the cinema at which it was being screened, September 1935 to August 1936.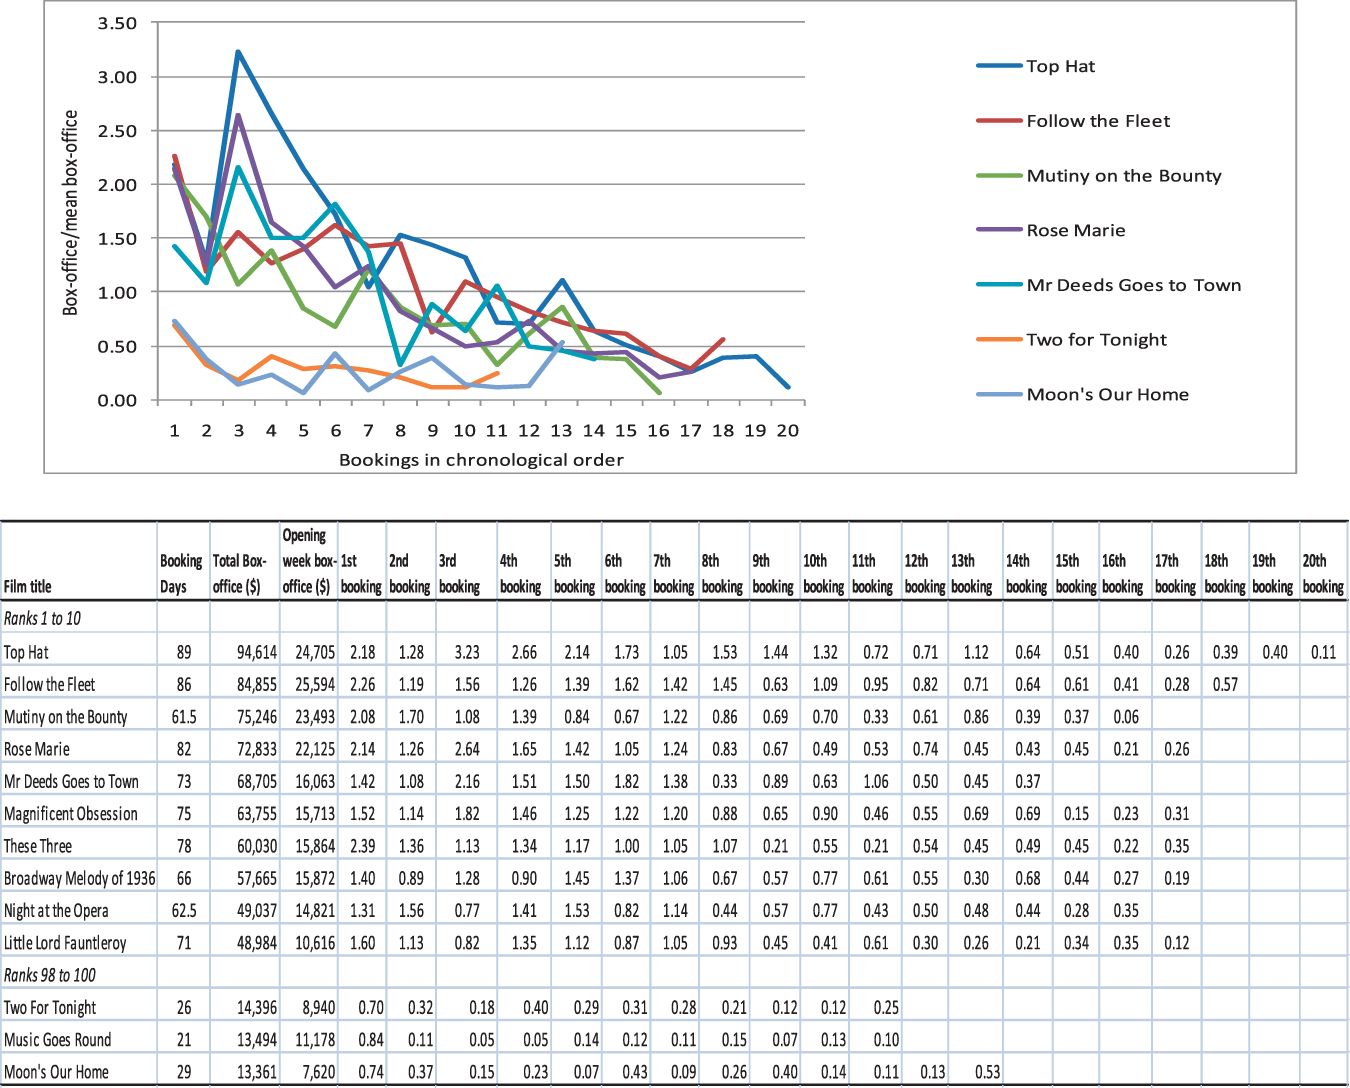
The lower section of Table 3 lists three films, each of which received bookings of more than 20 days, and were ranked 98 to 100. Each of the films received a week’s booking in one of Philadelphia’s first-run cinemas, although the second listed of the three – Music Goes Round – supported a vaudeville show at the Earle that cost $7,340 to stage, some 65 percent of the box-office take. In all three cases the proportional values are well below 1, suggesting that films in this part of the rank revenue distribution were not particularly attractive to selective audiences and generated little in the way of favourable word of mouth, represented by their flat trajectory in Figure 2. The function of such films and those ranked below them was to provide cinema owners with film product that could be screened one, two or three days before being replaced.
Further insights into the distinction between discriminating and non-discriminating filmgoers can be derived from an analysis of the manner in which the Hollywood star system impacted upon consumer choice. The major film studios clearly developed and deployed stars as a means of distinguishing their film outputs from those of their competitors, thereby providing a device for marketing their outputs to consumers. It would therefore seem reasonable to assume that consumers who responded to these ‘star signals’ can be defined, to some degree, as discriminating.
We can explore this issue via the use of an additional dataset – the films produced by MGM, RKO and Warner Bros. This dataset is drawn directly from the studios’ own accounting ledgers and therefore contains data on film domestic and foreign revenues, production costs, profits and cast details. 1 Of the 343 films in the Philadelphia dataset, 121 were distributed by MGM, RKO and Warner Bros., and hence we have constructed a dataset for these 121 films that contains both the Philadelphia box-office data and the broader accounting and cast data from the studio ledgers.
In order to proceed to an analysis of the impact of star power on consumer choice we first require a definition of a star. The approach we take here is a relatively simple one. The MGM, RKO and Warner Bros. dataset contains all the films distributed by these studios over the period 1929 to 1942, a total of 1857 films. However, as the Philadelphia dataset is derived from films distributed up to 1936, we will only consider films distributed up to this period, a total of 1021 films. Our definition of a star will be based on the frequency of an actor’s appearance in these films, as either the first or second named actor in the cast list. In particular, we will define an actor as a star if that actor has appeared, as first or second named actor, in at least 15 films up to 1936. We will also use as a second definition of a star those actors appearing in at least 10 films up to this period. On the basis of these definitions, 52 of the 121 films (43.0 percent) in the common dataset can be interpreted as films with stars, according to the 15 film criterion, and 65 of the 121 films (53.7 percent) can be interpreted as films with stars according to the 10 film criterion.
Regressions of Philadelphia Box-Office by Run Status of Cinemas
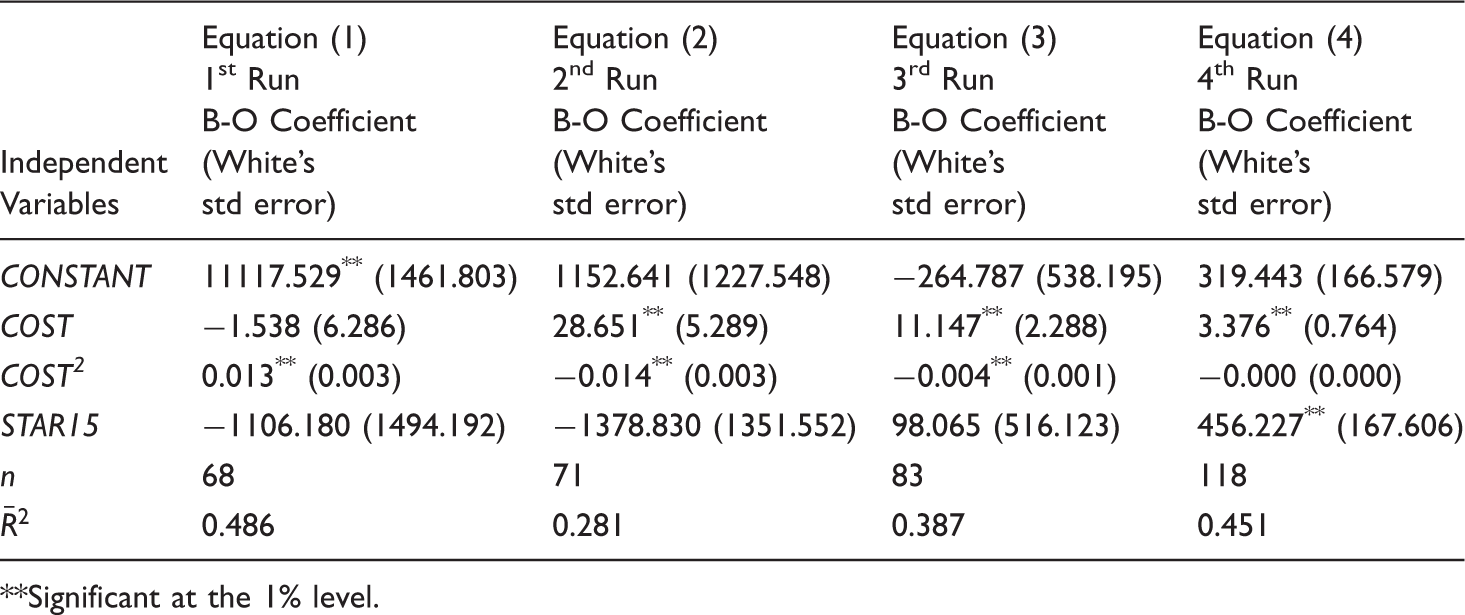
Significant at the 1% level.
From Table 4 we can note that ‘star power’ would appear to only have had an impact on box-office at fourth-run cinemas, given that the coefficient on STAR15 only achieves statistical significance in Equation (4). The same result occurred when we used the alternative definition of stardom (actors having appeared in at least 10 films up to 1936, STAR10 – results not shown here). Note also from the sample sizes associated with each regression in Table 4 (penultimate row) that increasing numbers of films were distributed, in moving from first- to fourth-run cinemas, with virtually all the films in the sample being released at fourth-run cinemas. 3 This is clearly a function of the different objectives at each point of the release cycle – first-run cinemas extending the runs of films that are popular with audiences (and limiting the runs of those that aren’t) with fourth-run cinemas placing an emphasis on the rapid throughput of a large volume of films.
The finding that film consumers at fourth-run cinemas appeared to exhibit a preference for films with stars is presumably, in part, a function of consumers at fourth-run cinemas being able to exercise their choices over a wider range of films than at higher order cinemas. In fact, if we restrict the analysis to just the 67 films that were released at both first-run and fourth-run cinemas, then STAR15 is statistically significant at only the 10 percent level for fourth-run box-office and STAR10 is now not significant. We also need to recognize, as indicated above, that the specifications of the equations in Table 4 are very simplistic, and provide an incomplete context for a full evaluation of the influence of stars on box-office – that is, we should not interpret these equations as implying that stars have no influence on consumer choice at higher order cinemas. 4 However, what we can at least conclude is that while the frequent changes in cinema programmes at fourth-run cinemas allow habitual cinemagoers to indulge their habits, this does not necessarily mean that choices are not being made – that fourth-run cinemagoers are any less discriminating than higher order cinemagoers. Thus, while a given film may only be shown for just a number of days at a given fourth-run cinema, if this film proves popular with fourth-run cinemagoers it will be exhibited at a wide range of fourth-run cinemas. As a simple illustration of this point we can consider again films containing stars that were released at fourth-run cinemas. Those films conforming to STAR15 achieved an average of 8.85 days of bookings at fourth-run cinemas compared to 7.03 days for the remaining films, a difference that is statistically significant at the 5 percent level (for STAR10 the corresponding figures are 8.86 and 6.58, a difference that is significant at the 1 percent level).
Revenue distributions
Descriptive statistics of the distribution of box-office revenues
Figures 3(a), 3(b) and 3(c) illustrate the various characteristics of the box-office revenues generated by the 343 films in the dataset. The spikes evident in Figure 3(a) depict the ‘hit’ films of the period covered by the study. Thus, Top Hat has the tallest spike, located to the right of the chart, Follow the Fleet the next tallest, found towards the left-hand side, while the third tallest spike, that of Mutiny on the Bounty, is found near to the middle. The most interesting aspect of Figure 3(a) is its serrated nature. The fact that the tallest spikes are a comparatively rare phenomenon indicates that few films were universally enjoyed by audiences, which in turn suggests that discriminating audiences took risks when choosing between films and that disconfirmation was an ever present aspect of filmgoing.
Box-office revenue characteristics.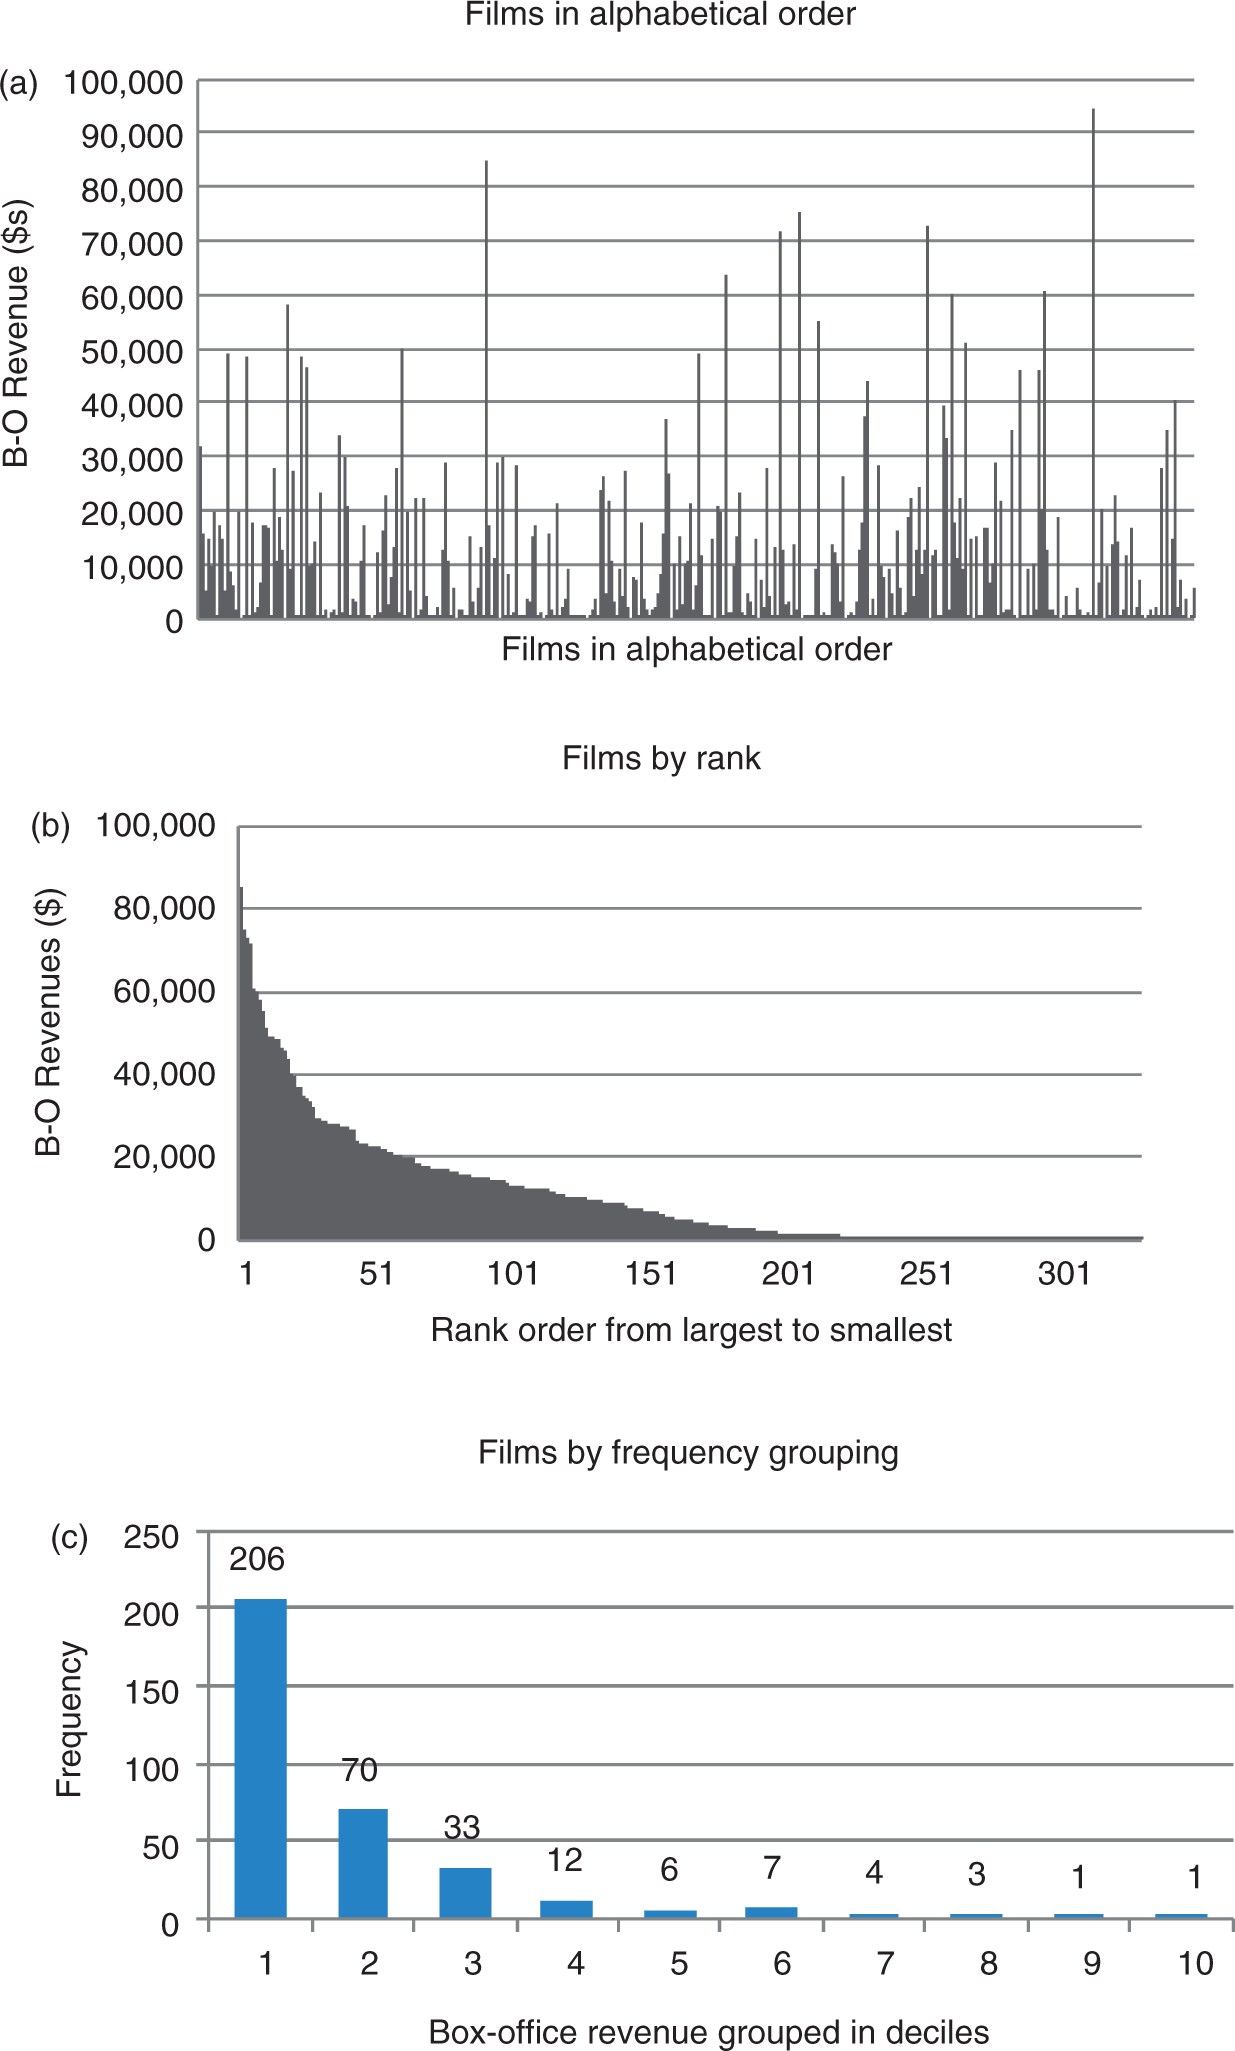
As shown in Table 5, half the films in the series earned less than $4746. These films provide a backdrop to the ‘hits’ of the day and should be regarded as typical of film production in general. Indeed, comparatively, ‘hit’ films resemble freak events, but of course they were made precisely for that eventuality, tending to cost a lot more to make and embodying substantial ‘star’ power.
Figure 3(b) depicts the same films organized on this occasion in rank order, from highest to lowest. A pattern is now clear – that the difference in revenue associated with rank gets smaller and smaller as the rank gets lower and lower. Indeed so steep is the decline initially that the film ranked 51st generates less than one quarter of the revenue of the top film, and from approximately rank 200 onwards the curve of the distribution becomes almost, but not quite, horizontal at revenue values near to zero.
Finally, in Figure 3(c) the box-office revenues earned by the 343 films are grouped into deciles, and the frequencies with which films fall into the various bands are shown. Thus 206 films fall into the first and lowest earning band, including, of course, the median film, while nine of the Top 10 films listed in the Appendix occupy the top four bands – these are the ‘hits’ of the day.
Clearly, the distribution of revenues is highly unequal. Between them they generate a Gini coefficient of 0.64, which, given that the range of the coefficient lies between zero and one, where one represents extreme inequality and zero perfect equality, suggests a markedly high degree of inequality. Undoubtedly, the extent of the inequality of film revenues is exaggerated by the selection of cinemas in the sample. The fact that the sample of 22 cinemas includes all first-run cinemas but not all subsequent-run cinemas indicates that insufficient weight is given to film earnings of the lower order cinemas. Since the revenues of these cinemas vary much less than their first-run counterparts it is probable that the relative earnings of those films widely screened in lower order cinemas, but which were not particularly successful in the first-run, would have been higher, thus moderating downwards the various indicators of inequality used here. However, these differences are unlikely to have been of major proportions, because the films that did well in the first run continued to be widely screened in the subsequent-run cinemas.
Conclusion
In this article, the relationship between different types of film consumer, the cinemas they attended and the choices they made has been examined. Market research carried out in the 1940s suggested that large sections of the audience were non-discriminating and chose the cinema in preference to the film that was being screened. While our analysis of the hierarchy of film distribution in Philadelphia in 1935–36 has not enabled us to quantify the extent to which non-discriminating film choices took place, it would appear that the influence of these non-discriminating consumers was limited in the sense that they did not prevent highly skewed film revenue distributions emerging, in which a small handful of high revenue generating films dominated the relatively large number of modestly performing films, reflecting clear choices made on the part of film consumers. Thus even if, as the market research of the 1940s implied, up to 50 percent of film consumers were non-discriminating, it would appear that the choices made by the remainder of the audience were sufficient to generate a clear distinction between ‘hit’ and ‘miss’ films.
Our finding that the relative variance in weekly earnings (as reflected in the coefficient of variation) declined with cinema status – the lower the run in the distribution cascade to which a cinema belonged, the lower the (relative) variance in its weekly earnings – might superficially imply that non-discriminatory consumption was more prevalent as we moved down the distribution chain. However, we argue that this is more likely to be a function of the nature of the distribution process at each point of the distribution cycle – first-run cinemas tending to exhibit films to the point at which a clear decline in revenues sets in, whereas the rapid movement of films from cinema to cinema at the fourth-run level would tend to result in relatively limited variation in weekly revenues at any given cinema. Indeed, we present some evidence to suggest discriminating behaviour on the part of fourth-run audiences in the sense that, compared to upper run audiences, their film choices were more likely to have been influenced by the presence of stars.
Thus we can interpret the movie business of the 1930s as being based on a system of supply adjusting rapidly to demand, and that the process occurred throughout the distribution chain. For this to be achieved, a highly adaptive system of distribution and exhibition was required – one that responded sensitively to the opportunities of making money for both sets of agents by pleasing customers. The risk side of this for both the agents on the supply side and the consumers was that consumers, in their quest for novelty, didn't know exactly what they wanted. Consequently, ‘hits’ were discovered by audiences as much as made by studios. But, in the process of discovering what they liked consumers regularly experienced disappointment, and this disconfirmation was reflected in disappointing returns for producers, distributors and exhibitors alike.
Although the system of distribution differs today from what it was in the 1930s, the principles underlying the business remain the same, in the sense that there is still a clear focus on fully exploiting the revenue and profit generating potential of the relatively small proportion of annual releases that achieve ‘hit’ status. However, we can also point to a number of clear differences between the two time periods, which derive from the approaches taken to dealing with risk, on both the consumption and production side. While the major studios/distributors continue to dominate aggregate annual box-office, today this is achieved via a relatively small number of highly budgeted films for which box-office revenues constitute only a relatively small proportion of total revenues, given the increasing importance of ancillary markets. Financing of films today is based on a much more sophisticated system whereby risk is shared and diversified across a range of investors. Film producers today engage much more directly with potential audiences in the development of their film outputs, and are much more adept at exploiting successful films via sequels and the development of film franchises.
The result for film consumers is that the film consumption environment today is a less risky one than it once was, given the more predictable nature of film outputs and the variety of media that are available for consuming film. By contrast the 1930s could be characterized as an environment in which both producers and consumers faced relatively high levels of risk, but an environment nonetheless that might be interpreted as a more vibrant and innovative one. Which of these contrasting environments is superior from the consumers’ perspective is, however, a purely subjective issue.
Footnotes
Acknowledgements
The authors would like to acknowledge the archive support provided by Sandra Joy Lee Aguilar and staff at the Warner Bros. Archive at the University of Southern California.
Notes
They research into the business and economic history of film and have edited jointly an anthology of papers on the subject (The Economic History of Film, Routledge, 2005), and published articles in Business History, Economic History Review (twice), Journal of Economic History, Explorations in Economic History, Journal of Cultural Economics, Cinema Journal and Journal of Transnational Cinema, as well as having contributed numerous book chapters.